FEASIBILITY PLANNING STUDY WISCONSIN CENTER [1] + CROSSROADS CONSULTING SERVICES FEASIBILITY PLANNING STUDY
|
|
|
- Anissa Lewis
- 5 years ago
- Views:
Transcription
![ER [1]](/docs-images/89/100110515/images/1-0.jpg)


1 ER [1]
![[2]](/docs-images/89/100110515/images/2-0.jpg)


2 [2]


3 HENRY B. GONZALEZ CONVENTION CENTER SAN ANTONIO TX - OPENED 2016 Populous is widely recognized in the industry as the thought leaders for convention and exhibition facility design. CONVENTION CENTER EXPERIENCE Albany Convention Center Site Studies, ALBANY, NY Harborside Convention Center & Hotel Study, FORT MYERS, FL Phoenix Convention Center Expansion & Renovation, PHOENIX, AZ Anaheim Convention Center Expansion, ANAHEIM, CA Henry B. Gonzalez Convention Center Expansion, SAN ANTONIO, TX Qatar National Convention Centre Extension, DOHA, QATAR ANAHEIM CONVENTION CENTER ANAHEIM CA - OPENED 2017 PHOENIX CONVENTION CENTER PHOENIX AZ - OPENED 2009 Augusta Civic Center District Plan, AUGUSTA, GA Bangalore Convention Centre, BANGALORE, INDIA Birmingham Convention Center Complex, BIRMINGHAM, AL Brown County Exhibition Center Expansion Study, GREEN BAY, WI Cleveland Convention Center Site Study, CLEVELAND, OH Dallas Fair Park Exhibition Space Feasibility Study, DALLAS, TX DLF International Exhibition & Convention Center, NEW DELHI, INDIA Dodge City Events Center Study, DODGE CITY, KS Doha Convention Center Design Competition, DOHA, QATAR Duluth Entertainment & Convention Center Expansion, DULUTH, MN Eastern Maine Events Center, BANGOR, ME Erie Civic Center Master Plan, ERIE, PA H.H. Dow Academy Conference Center, MIDLAND, MI Indiana Convention Center Expansion Study, INDIANAPOLIS, IN Iowa Events Center & Hy-Vee Hall, DES MOINES, IA Irving Convention Center Study, IRVING, TX Jacob K. Javits Convention Center Expansion Plan, NEW YORK, NY Jordan Valley Park Expo Center, SPRINGFIELD, MO Laredo Civic Center Study, LAREDO, TX Lexington Convention Center Study, LEXINGTON, KY Los Angeles Convention Center Expansion, LOS ANGELES, CA Miami Convention Center Study, MIAMI, FL Moscone Convention Center Renovation, SAN FRANCISCO, CA Muscat Convention Centre Design Competition, MUSCAT, OMAN Music City Center Expansion Study, NASHVILLE, TN Richard E. Berry Educational Support Center, HOUSTON, TX Sacramento Convention Center Conceptual Design, SACRAMENTO, CA San Antonio Facilities Development Study, SAN ANTONIO, TX San Jose McEnery Convention Center Expansion & Renovation, SAN JOSE, CA Spartanburg Multi-Purpose Center Study, SPARTANBURG, SC Sydney International Convention & Exhibition Centre, SYDNEY, AUSTRALIA Tampa Convention Center Expansion Planning, TAMPA, FL Tinley Park Convention Center Expansion, TINLEY PARK, IL UIC Forum, South Campus Mixed-Use Development, CHICAGO, IL Utah Valley Convention Center Expansion, PROVO, UT Fort Myers Convention Center, FORT MYERS, FL Fort Wayne Convention Center Expansion Study, GRAND WAYNE, IN National Exhibition Centre Design Concept, BIRMINGHAM, UK Newark Convention Center Study, NEWARK, NJ Fort Worth Convention Center Expansion, FORT WORTH, TEXAS Georgia World Congress Center Master Plan, ATLANTA, GA Ocean City Convention Center & Performing Arts, OCEAN CITY, MD Oklahoma City Convention Center, OKLAHOMA CITY, OK Grand River Center, DUBUQUE, IA Greenspoint Convention Center Study, Oklahoma City Convention Center Site Selection, OKLAHOMA CITY, OK HOUSTON, TX Peoria Civic Center Expansion, PEORIA, IL ICCC SYDNEY SYDNEY AUSTRALIA - OPENED 2016


4 THE IMAGINE THAT WORKSHOP + IDEA FOR FLEXIBLE INDOOR/ OUTDOOR MEETING SPACE AT IMAGINE THAT IN 2003 IMPLEMENTED AT THE PHOENIX CONVENTION CENTER IN 2009 Imagine That Workshop 2017 SAN ANTONIO, TEXAS + 25% The right blend of Imagine That attendees produces the next generation of innovative ideas for the convention and trade show industry. IDEA FOR A FLEXIBLE RIGGING GRID SYSTEM AT IMAGINE THAT IN 2003 IMPLEMENTED AT THE QATAR NATIONAL CONVENTION CENTRE IN % BUILDING OPERATORS 25% 25% CVB/SALES/BRANDING MEETING PLANNERS COLLABORATION? EXPLORATION CREATIVE IDEAS + DESIGNERS IDEA FOR MODULAR MEETING ROOMS AT IMAGINE THAT IN 2003 IMPLEMENTED AT ICC SYDNEY IN 2016 [4]
5 TRENDS IMAGINE THAT 2003 Enhance Security Showcase Technology Focus on Experience Transform the Machine Integrate with the City 2004 More Meeting Rooms More Services Vertical Integration Enhanced F & B Hotel Interaction Convention District Shorter Show Days How do you LEAVE TRENDS BEHIND? 2008 Labor Shortage Competition Sustainability Unique Experience Localization Crowd-sourcing Globalization Consumer to Creator Impatience Conversation 2011 Advanced Technology Environmental Thrift Flexibility Revenue Enhancement Functional Efficiency Smaller / Better Buildings Destination Design Community Integration Sports Capable De-com-modify Space Connect to Outdoors Customer Experience Spirit of Place Enhanced Food Service 2017 Informal Fixed Seating Meeting Space Variety Comfort Convenience Connections Destination Focus Outdoor Spaces Wellness and Wellbeing Projection Technology Understanding the Needs of A Multi-generation Customer Flexibility and Adaptability Emerging Technology Authenticity Vertically Stacked Buildings Natural Light and Views More Interesting Spaces Better Food Options with More Variety [5]


6 WHAT IS MULTI-PURPOSE? OPEN CONFIGURATION DEMISED CONFIGURATION BUILDING SECTION ANAHEIM CONVENTION CENTER MULTI-PURPOSE HALL [6]


7 PROCESSWORKSHOPS THE TEAM: KICK OFF WEB CALL IN PERSON BUILDING WALK THROUGH DESIGN CHARETTE WEB CALL DESIGN CHARETTE BOARD MEETING PRESENTATION START DESIGN / LAYOUT OPTIONS TIMELINE RESEARCH AND ANALYSIS DESIGN/PRICING [7]
8 PROCESS WORKSHOP QUESTIONS Operations What are your five biggest events each year? How does this facility interface with the adjacent Arena(s) and Miller Lite Theater? Are there any shared services? Have groups booked multiple facilities and if so how often? How do groups utilize hotel meeting space and what is your arrangement with the hotels? What are your three greatest assets? What do you think are your three greatest weakness? Has loading/marshaling ever been an issue? Can it be better? How is parking addressed? What percentage of attendees arrive by: Motor Coach Private vehicle Taxi / Uber Do they have specific accommodations? Drop offs? What spaces include rigging points? What is their spacing and capacities? How would you rate the way finding signage in the building? How would you rate your security infrastructure? Are there any features you feel are missing in the building? If you could change anything what would it be? Does power and infrastructure meet the requirements for all of the shows? How much storage do you have and where do you need more? How is the building served? Progression from loading dock, to freight elevator, to back of house corridor, to meeting room example. Food Service What is the highest number of meals prepared for a single seating? What are your three greatest assets? What do you think are your three greatest weakness? Are the food service areas configured to provide the highest efficiency? Is the size of the food service areas appropriate to handle the demand? Are there any features you feel are missing in the building? If you could change anything what would it be? How does the staff use the building? (i.e. locker rooms, staff entrances, etc.) Is there a portable solution being used? Potential Expansion Is maintaining the existing parking lot desired, needed, or expected? Is there capacity in the existing kitchen to accommodate any added program? Is a Multi Purpose Solution adequate to handle all three of the expanded program areas? Is the current distribution of meeting rooms making it difficult to host concurrent events? Are the current sizes and variety of meeting rooms adequate? Is contiguous exhibit hall space an absolute necessity? Is added flexibility and hosting capabilities desired in the pre-function space? Is elevated exterior space desired? District Development - Sales Is the current Wisconsin Center an accurate reflection of Milwaukee and its future? How do we see future development infilling the gaps over the coming years? What impact/relationship will the new Bucks Arena/District have on the Wisconsin Center? Is the current brand current with prospective trends? Has social media influenced the perception of the Wisconsin Center in a positive way? [8]


9 BUILDING PROGRAM EXISTING + EXPANSION EXISTING PROGRAM Exhibit Space: 188,695 SF Ballroom Space: 37,500 SF Meeting Space: 39,640 SF Total Existing: 265,800 SF MINIMUM EXPANSION RECOMMENDATION Exhibit Space: +112,000 SF Ballroom Space: +15,000-25,000 SF Meeting Space: +30,000-35,000 SF Total New: +157,000 SF - 172,000 SF TOTAL + EXPANSION Exhibit Space: 300,000 SF of contiguous exhibit hall space Ballroom Space: 52,500-62,500 SF of column free ballroom Space Meeting Space: 69,640-74,640 SF of state of the art meeting space Total Leasable: 422,800 SF - 437,800 SF Level 3 - Upper Level 2 - Mezzanine Level 1 - Ground [9]
10 OVERALL PROGRAM REVIEW Program: Existing GSF: Expansion GSF: Renovation 01 Traditional 02 Elevated 03 Multipurpose Level 3 - Upper Ex Hall 188,695 85, ,705 97,758 Balcony (Exterior) N/A 4,662 1,268 15,435 Prefunction 24,395 10,925 5,888 11,536 Back-of-House N/A 16,306 16,091 20,552 Loading Dock (Exterior) N/A 16,623 15,460 15,109 Level 3 - Total: 213, , , ,390 Level 2 - Mezz Meeting 19,820 22,612 15,392 0 Balcony (Exterior) N/A 0 3,694 2,020 Prefunction 29,704 25,698 13,842 3,831 Back-of-House N/A 27,410 24,811 18,725 Parking (Exterior) N/A 60,261 35,639 85,740 Level 2 - Total: 49, ,981 93, ,316 Level 1 - Ground Meeting 19,820 22,004 13,500 0 Multipurpose N/A ,932 Ballroom 37,500 15,353 34,320 0 Prefunction 56,015 36,627 27,898 17,129 Kitchen/Pantry N/A 4,344 9,824 13,096 Back-of-House N/A 20,508 32,155 25,845 Loading Dock (Exterior) N/A 0 7,956 7,701 Parking (Exterior) N/A 63,537 38,608 16,047 Level 1 - Total: 113, , , ,750 Elevated Bridge Over Kilbourn 3,965 3,965 3,965 Totals: Total Gross SF: 375, , , ,421 Total Conditioned SF: 290, , ,369 Total Leasable Program SF: 144, , ,690 Exhibit Hall 85, ,705 97,758 Ballroom 15,353 34,320 0 Meeting Room 44,616 28,892 0 Multi-Purpose Hall ,932 [10]


11 BUILDING PROGRAM DESIGN OPTIONS 01_TRADITIONAL 02_ELEVATED 03_MULTI-PURPOSE Exhall: Ballroom: Meeting Room: Total Net Program: 85,021 SF 15,353 SF 44,616 SF 144,990 SF Exhall: Ballroom: Meeting Room: Total Net Program: 123,705 SF 34,320 SF 28,892 SF 186,917 SF Exhall: MPS Hall: Meeting Room: Total Net Program: TOTAL GROSS AREA: 435,856 SF TOTAL GROSS AREA: 424,016 SF TOTAL GROSS AREA: 453,421 SF +Including Parking +Including Parking +Including Parking 97,758 SF 98,932 SF (80,000) SF 196,690 SF [11]


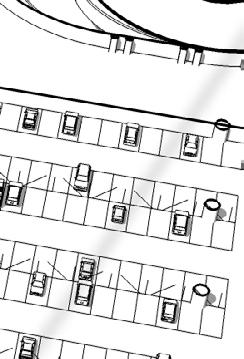
12 01_Traditional LEVEL 1 - GROUND PARKING N 6th S T LOADING T W KILBOURNE AVE SS WW ELL W W IS CO NS IN AV E KITCHEN [4,344 GSF] DROPOFF BALLROOM [15,353 GSF] MEETING [22,004 GSF] N 4th [12] ST WISCONSIN CENTER


13 01_Traditional LEVEL 2 - MEZZANINE B.O.H. BRIDGE CONNECTION N 6th S PARKING T W KILBOURNE AVE SS WW ELL W W IS CO NS IN AV E T DROPOFF MEETING [22,612 GSF] N 4th [13] ST WISCONSIN CENTER


14 01_Traditional LEVEL 3 - UPPER N 6th S T IN AV E LOADING DOCK IS CO NS EX HALL [185,000 GSF] W KILBOURNE AVE W W NEW EX HALL [85,021 GSF] N 4th [14] BALCONY ST WISCONSIN CENTER


15 01_Traditional SECTION EXISTING NEW NEW EX HALL [85,021 GSF] BALCONY W WELLS ST W KILBOURNE AVE BALLROOM [15,353 GSF] MEETING [44,616 GSF] [15]


16 02_Elevated LEVEL 1 - GROUND LOADING DOCK N 6th S T PARKING T W KILBOURNE AVE SS WW ELL W W IS CO NS IN AV E KITCHEN [9,824 GSF] DROPOFF BALLROOM [34,340 GSF] MEETING [13,500 GSF] N 4th [16] ST WISCONSIN CENTER


17 02_Elevated LEVEL 2 - MEZZANINE N 6th ST B.O.H. BRIDGE CONNECTION PARKING W WISCONSIN AVE W WELLS ST W KILBOURNE AVE MEETING [15,392 GSF] N 4th ST [17]


18 02_Elevated LEVEL 3 - UPPER N 6th S T IN AV E LOADING DOCK IS CO NS EX HALL [185,000 GSF] W KILBOURNE AVE W W NEW EX HALL [123,705 GSF] BALCONY N 4th [18] ST WISCONSIN CENTER

![HALL [123,705 GSF]](/docs-images/89/100110515/images/19-3.jpg "W WELLS ST W")

19 02_Elevated SECTION EXISTING NEW NEW EX HALL [123,705 GSF] W WELLS ST W KILBOURNE AVE BALLROOM [34,320 GSF] PARKING [19]


20 03_Multi-Purpose LEVEL 1 - GROUND N 6th S LOADING DOCK T KITCHEN [13,096 GSF] T W KILBOURNE AVE SS WW ELL W W IS CO NS IN AV E MULTIPURPOSE [98,932 GSF] DROPOFF N 4th [20] ST WISCONSIN CENTER

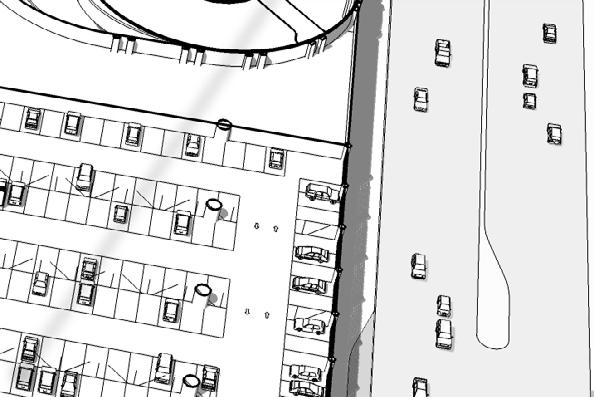

21 03_Multi-Purpose LEVEL 2 - MEZZANINE N 6th ST FROM I-43 B.O.H. BRIDGE CONNECTION TO I-43 W WISCONSIN AVE W WELLS ST W KILBOURNE AVE PARKING BALCONY N 4th ST [21]


22 03_Multi-Purpose LEVEL 3 - UPPER N 6th S T IN AV E LOADING DOCK IS CO NS EX HALL [185,000 GSF] W KILBOURNE AVE W W NEW EX HALL [97,758 GSF] N 4th [22] BALCONY ST WISCONSIN CENTER


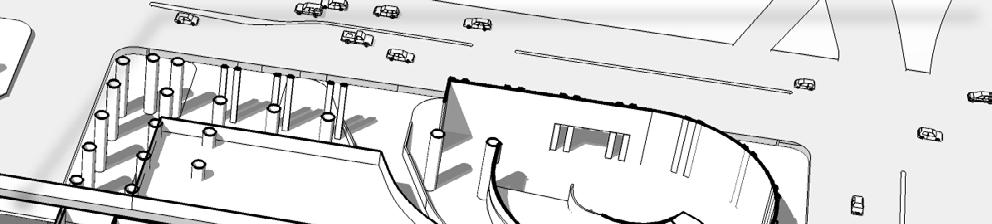
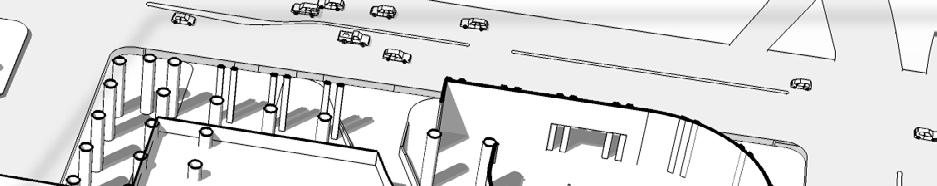
23 03_Multi-Purpose SECTION NEW EX HALL [97,758 GSF] EXISTING NEW BALCONY PARKING W WELLS ST W KILBOURNE AVE MULTIPURPOSE [98,932 GSF] [23]
24 COST ESTIMATE Program: Existing GSF: Expansion GSF: Renovation 01 Traditional 02 Elevated 03 Multipurpose Level 3 - Upper Ex Hall 188,695 85, ,705 97,758 Balcony (Exterior) N/A 4,662 1,268 15,435 Prefunction 24,395 10,925 5,888 11,536 Back-of-House N/A 16,306 16,091 20,552 Loading Dock (Exterior) N/A 16,623 15,460 15,109 Level 3 - Total: 213, , , ,390 Level 2 - Mezz Meeting 19,820 22,612 15,392 0 Balcony (Exterior) N/A 0 3,694 2,020 Prefunction 29,704 25,698 13,842 3,831 Back-of-House N/A 27,410 24,811 18,725 Parking (Exterior) N/A 60,261 35,639 85,740 Level 2 - Total: 49, ,981 93, ,316 Level 1 - Ground Meeting 19,820 22,004 13,500 0 Multipurpose N/A ,932 Ballroom 37,500 15,353 34,320 0 Prefunction 56,015 36,627 27,898 17,129 Kitchen/Pantry N/A 4,344 9,824 13,096 Back-of-House N/A 20,508 32,155 25,845 Loading Dock (Exterior) N/A 0 7,956 7,701 Parking (Exterior) N/A 63,537 38,608 16,047 Level 1 - Total: 113, , , ,750 Elevated Bridge Over Kilbourn 3,965 3,965 3,965 Totals: Total Gross SF: 375, , , ,421 Total Conditioned SF: 290, , ,369 ESTIMATED PROJECT COST $247 MILLION - $277 MILLION ESTIMATE INCLUDES: a. 30% for Project Soft Costs b. Expansion c. On Site Parking d. Existing Building Modernization e. Elevated Connection Over Kilbourn *Costs are escalated to Additional escalation should be added at 4% per year beyond Total Leasable Program SF: 144, , ,690 Exhibit Hall 85, ,705 97,758 Ballroom 15,353 34,320 0 Meeting Room 44,616 28,892 0 Multi-Purpose Hall ,932 [24]


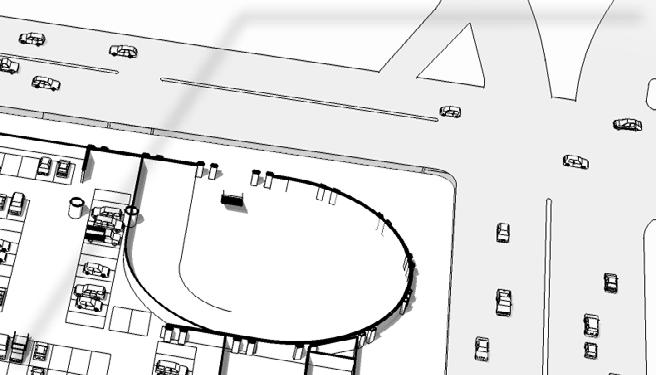
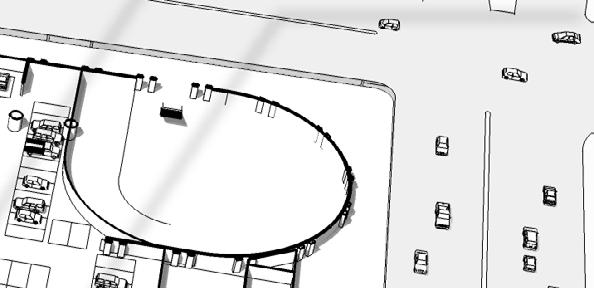
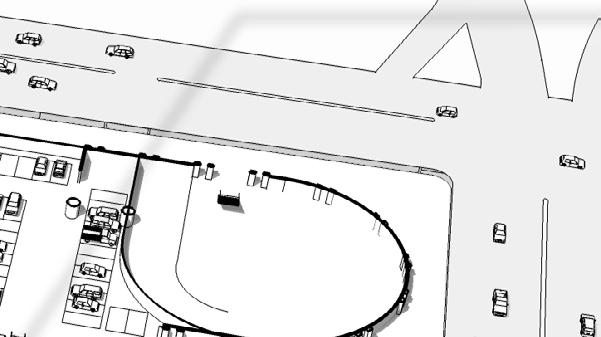
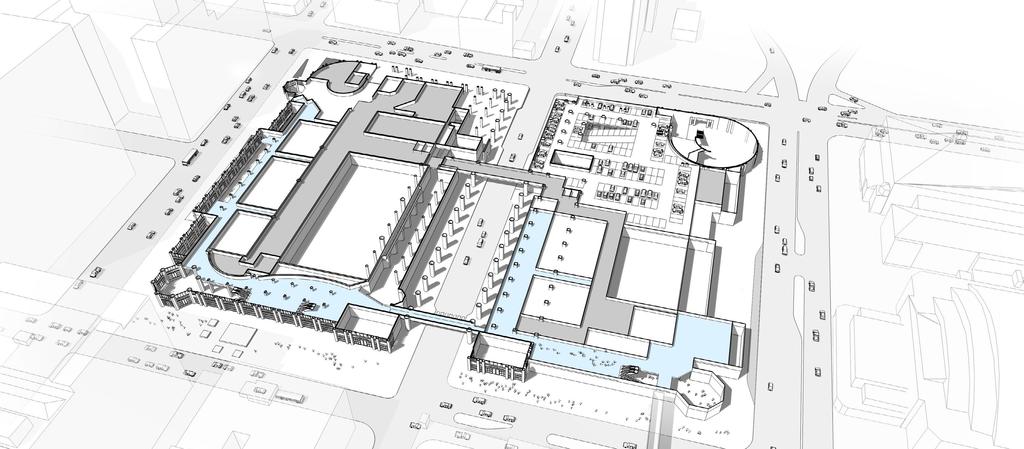
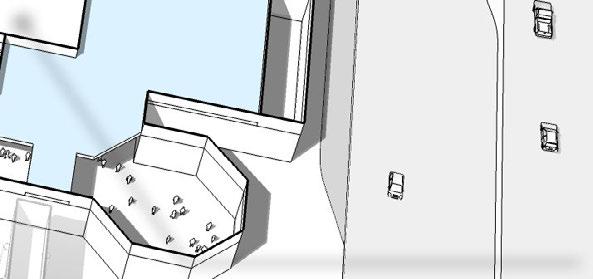
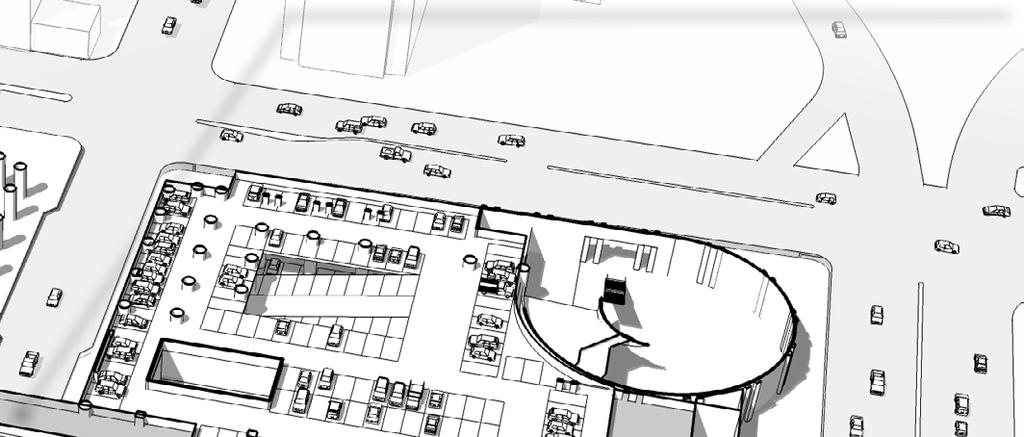
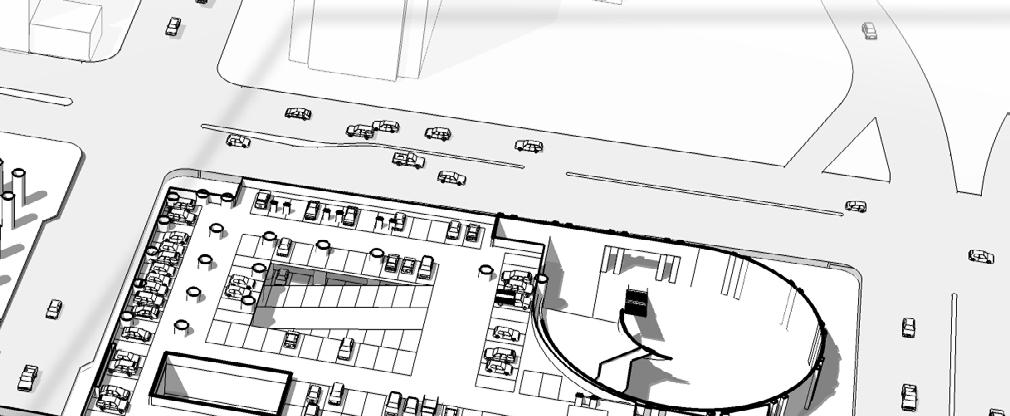
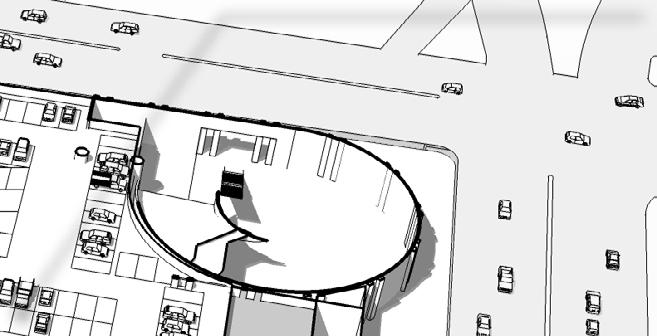
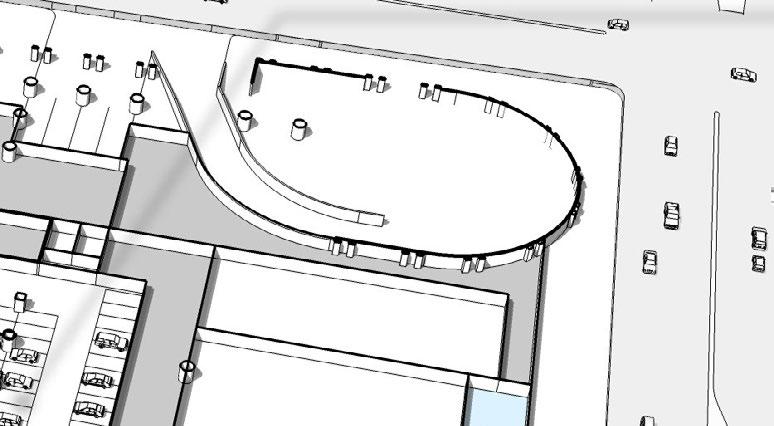
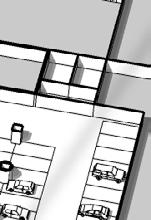
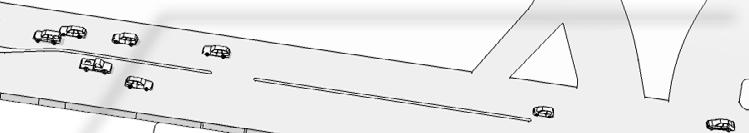
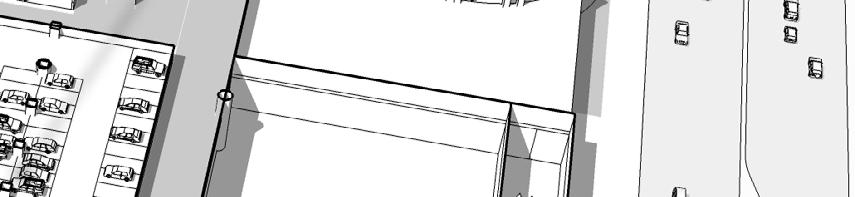
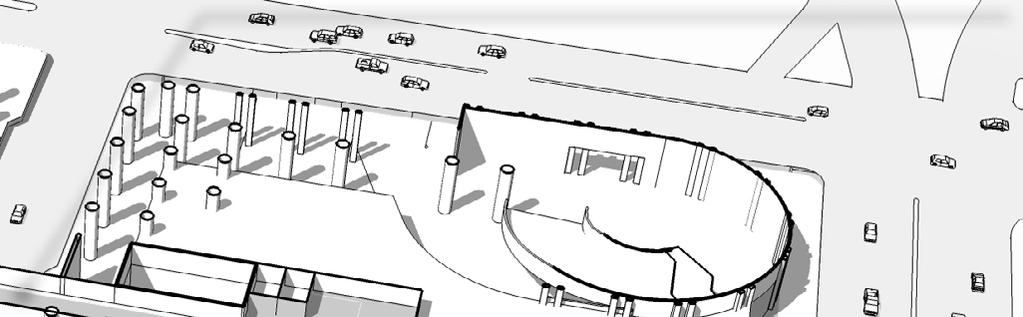
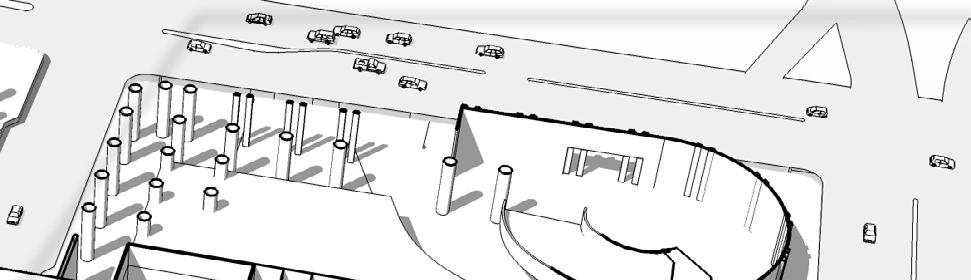
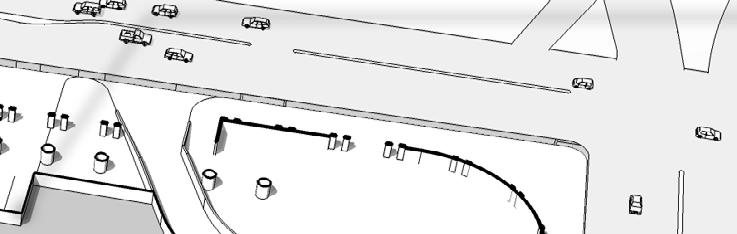
25 RENDERINGS FOR ARTISTIC PURPOSES ONLY [25] WISCONSIN CENTER


26 RENDERINGS FOR ARTISTIC PURPOSES ONLY [26] WISCONSIN CENTER


27 RENDERINGS FOR ARTISTIC PURPOSES ONLY [27] WISCONSIN CENTER


28 RENDERINGS FOR ARTISTIC PURPOSES ONLY [28]


29 RENDERINGS FOR ARTISTIC PURPOSES ONLY [29] WISCONSIN CENTER
Lower Income Journey to Work Market Share From American Community Survey
 Lower Income Journey to Work Market Share From American Community Survey 2006-2010 Table 1: Overall National Data Table 2: Car, Truck or Van Table 3: Transit Table 4: Metrics Table 1 Work Trip Market Share:
Rank Place State Native Hawaiian and Pacific Islander population (alone or in combination
 TABLE 2a: 100 Largest Places Ranked by Number of s (race alone or in *) Living in Hard-to- Census Rank Place State (alone or in 1 Honolulu (CDP) HI 64,196 11,130 17.3 2 New York City NY 14,981 8,211 54.8
Location, Location, Location. 19 th Annual NIC Conference NIC MAP Data & Analysis Service
 Location, Location, Location 19 th Annual NIC Conference NIC MAP Data & Analysis Service The Great Occupancy Decline 94% Occupancy Trends Majority Nursing Seniors Housing 93% 92% 91% 92.8% 91.0% 90% 89%
Census Affects Children in Poverty by Professors Donald Hernandez and Nancy Denton State University of New York, Albany
 Phone: (301) 457-9900 4700 Silver Hill Road, Suite 1250-3, Suitland, MD 20746 Fax: (301) 457-9901 Census Affects in Poverty by Professors Donald Hernandez and Nancy Denton State University of New York,
PUBLIC TRANSPORTATION INTRODUCTION
 PUBLIC TRANSPORTATION INTRODUCTION 1 OUTLINE Current Status and Recent Trends Significant Influences A Critical Assessment Arguments Supporting Public Transport Future Influences Ingredients for Future
Hector International Airport Fargo, North Dakota
 Hector International Airport Fargo, North Dakota Volume 073 Twelve Months Ended September 2007 January 2008 Airlines Serving Fargo Carried 831 Onboard Passengers Per Day for the Twelve Months Ended September
INDUSTRIAL REAL ESTATE INVESTMENT OPPORTUNITY GATEWAY BOULEVARD HEBRON, KENTUCKY
 INDUSTRIAL REAL ESTATE INVESTMENT OPPORTUNITY GATEWAY BOULEVARD HEBRON, KENTUCKY GROUNDBREAKING OPPORTUNITIES Dear Investors, Brokers and Developers, Corporex Companies is very pleased to present a Groundbreaking
FBI Drug Demand Reduction Coordinators
 FBI Drug Demand Reduction Coordinators Alabama 2121 Building, Room 1400 Birmingham, AL 35203 (205) 252 7705 One St. Louis Centre One St. Louis Street Mobile, AL 36602 (334) 438 3674 Alaska 222 West Seventh
 Snakes & Lattes is currently composed of three corporate owned and operated board game cafes in Toronto, ON. Over the last 7 years these have become renowned as Toronto's premiere board game cafe destinations.
Major Metropolitan Area Sales Tax Rates
 August 19, 2010 No. 239 FISCAL FACT Major Metropolitan Area Sales Tax Rates By Lawrence Summers Introduction General sales taxes levied by state, county and city governments in the United States vary greatly,
Norwegian's Free Airfare Promotion
 Norwegian's Free Airfare Promotion Start planning your next vacation with 200+ cruises to incredible destinations, including Alaska, Bahamas & Florida, Bermuda, Canada & New England, Caribbean, Mexican
District Match Data Availability
 District Match Data Availability National & State Data Location Available National Data Australia Parliament, Provincial and Territory Assemblies Canada Parliament, Provincial Legislative Assemblies New
Hector International Airport Fargo, North Dakota
 Hector International Airport Fargo, North Dakota Volume 072 Twelve Months Ended June 2007 November 2007 Airlines Serving Fargo Carried 830 Onboard Passengers Per Day for the Twelve Months Ended June 2007,
Population Estimates for U.S. Cities Report 1: Fastest Growing Cities Based on Numeric Increase,
 ulation s for U.S. Cities Report 1: Fastest Growing Cities Based on Numeric Increase, 2015-2015 1 Phoenix AZ 32,113 2.0 1,582,904 1,615,017 167,393 11.6 2 Los Angeles CA 27,173 0.7 3,949,149 3,976,322
INDIANA INTERSTATE AND INTRASTATE LOCAL REDUCED CITY-PAIR FARES
 The following section contains city-pair fares that are lower than walkup mileage-based fares. Although shown in only one direction, the fares in this section apply in both directions, unless otherwise
Non-stop Scheduled Passenger Service at Fargo as of October Top 20 Domestic O&D Passenger Markets at Fargo Twelve Months Ended June 2006
 0 5000 10000 15000 20000 25000 30000 35000 40000 45000 50000 Airport Traffic Quarterly Non-stop Scheduled Passenger Service at Fargo as of October 2006 Top 20 Domestic O&D Passenger Markets at Fargo Twelve
Metropolitan Votes and the 2012 U.S. Election: Population, GDP, Patents and Creative Class
 politan Votes and the 2012 U.S. Election: Population, GDP, Patents and Creative Class Author: Shawn Gilligan, Shawn.Gilligan@rotman.utoronto.ca Zara Matheson, Zara.Matheson@rotman.utoronto.ca Kevin Stolarick,
ILLINOIS INTERSTATE AND INTRASTATE LOCAL REDUCED CITY-PAIR FARES
 The following section contains city-pair fares that are lower than walkup mileage-based fares. Although shown in only one direction, the fares in this section apply in both directions, unless otherwise
Hector International Airport Fargo, North Dakota
 Hector International Airport Fargo, North Dakota Volume 081 Twelve Months Ended March 2008 July 2008 Airlines Serving Fargo Carried 838 Onboard Passengers Per Day for the Twelve Months Ended March 2008,
International Convention Badges
 Images may not be the actual size. (Reduced the image sizes to save white space in the catalog) Images provided by Lion Verle Malik Created 07/24/2015. 1923 1924 1925 7th Annual Convention June 26-29,
333 W. Campbell Road, Suite 440 Richardson, Texas Cruising for Charity with Randy Limbacher in Tahiti July 28, 2007
 333 W. Campbell Road, Suite 440 Richardson, Texas 75080 972.238.1998 800.952.1998 Cruising for Charity with Randy Limbacher in Tahiti July 28, 2007 Join me for this special annual event to raise money
International migration. Total net migration. Domestic migration
 Indicator Direction Comparables a. Net population migration b. Crime rate (city) c. Housing costs d. Cost-of-living index N.A. e. State & local tax intensity f. Performing arts groups g. Air quality index
A CORPORATE OR MEDICAL USER OPPORTUNITY WELL-LOCATED OFF THE PA TURNPIKE AM Drive. Quakertown, PA INVESTMENT SUMMARY. Page 1
 A CORPORATE OR MEDICAL USER OPPORTUNITY WELL-LOCATED OFF THE PA TURNPIKE 1900 AM Drive Quakertown, PA INVESTMENT SUMMARY Page 1 EXECUTIVE SUMMARY On behalf of ownership, Avison Young is pleased to offer
Dentrix Workshop Schedule
 Dentrix Workshop Schedule Dates & Locations for Spring 2019 Workshops Alabama Workshop Date(s) Time Birmingham, AL Birmingham, AL 6/6 9am-5pm $299 $259 5/16 New Horizons - Birmingham. 601 Beacon Parkway
Access Across America: Transit 2014
 Access Across America: Transit 2014 Final Report CTS 14-11 Prepared by: Andrew Owen David Levinson Accessibility Observatory Department of Civil, Environmental, and Geo- Engineering University of Minnesota
CONNECTICUT INTERSTATE AND INTRASTATE LOCAL REDUCED CITY-PAIR FARES
 PASSENGER TARIFF AND SALES MANUAL CONNECTICUT INTERSTATE AND INTRASTATE LOCAL REDUCED CITY-PAIR S The following section contains city-pair fares that are lower than walkup mileage-based fares. Although
Item 185 Storage-In-Transit First Ea. Add'l. Service
 Service Day Day 4 Birmingham, AL 19.62 0.68 2 8 Dothan, AL 15.08 0.48 2 12 Huntsville, AL 15.55 0.50 2 16 Mobile, AL 16.23 0.68 3 20 Montgomery, AL 16.23 0.68 3 22 State of Alaska 14.76 0.55 4 24 Flagstaff,
Higher Education in America s Metropolitan Areas A Statistical Profile
 Higher Education in America s Metropolitan Areas A Statistical Profile MSA Study No.2 Higher Education in America s Metropolitan Areas A Statistical Profile CONTENTS Why Metro Areas? 1 Executive Summary
Charleston, WV 18 Juneau, AK Peoria, IL Jefferson City,
 2004 Ranking Diocese Catholics Diocesan Seminarians 2004 Ratio (Catholics / Seminarians) 2003 Ranking 1 Lincoln, NE 89431 35 2555 2 2 Yakima, WA 68561 20 3428 5 3 Savannah, GA 75987 22 3454 13 4 Cheyenne,
Beta Radiation in the United States Following the Fukushima Disaster. by Bobby1
 Beta Radiation in the United States Following the Fukushima Disaster by Bobby1 This is a statistical study of beta radiation in the United States following the Fukushima nuclear disaster. Its purpose is
BLACK KNIGHT HPI REPORT
 CONTENTS 1 OVERVIEW 2 NATIONAL OVERVIEW 3 LARGEST STATES AND METROS 4 FEBRUARY S BIGGEST MOVERS 5 20 LARGEST STATES 6 40 LARGEST METROS 7 ADDITIONAL INFORMATION OVERVIEW Each month, the Data & Analytics
OB-GYN Workload & Potential Shortages: The Coming U.S. Women s Health Crisis
 OB-GYN Workload & Potential Shortages: The Coming U.S. Women s Health Crisis JULY 2017 Introduction Obstetricians and Gynecologists (OB-GYNs) are a critical part of the health care provider community.
Service Service Area Name
 Atlas Van Lines, Inc. Origin and Destination s Effective: 05/15/2018 Area Name 4 Birmingham, AL 6.99 8 Dothan, AL 4.80 12 Huntsville, AL 7.37 16 Mobile, AL 4.80 20 Montgomery, AL 7.37 22 State of Alaska
Southern Innkeepers 104 th Annual Meeting Lodging Overview. Jan D. Freitag Senior Vice President
 Southern Innkeepers 104 th Annual Meeting Lodging Overview Jan D. Freitag Senior Vice President 1 Agenda Total US Review Scales Segmentation Markets Pipeline Southern Innkeepers Hotels Performance 2012
1Q 2014 Greater Atlanta HBA Builder Developer Lender Council meeting Information presented by. Atlanta Job Growth
 1Q 2014 Greater Atlanta HBA Builder Developer Lender Council meeting 5-21-2014 Information presented by Eugene James, Regional Director ejames@metrostudy.com 404-510-1080 connect on LinkedIn Atlanta Job
OUR U.S. FULL SERVICE OFFICES:
 HOW TO NAME US AS YOUR REGISTERED AGENT Listing the correct name and address of your Registered Agent on filings is critically important. To make sure you have the most current address for COGENCY GLOBAL
Initial Locations of 2020 Area Census Offices
 1 of 6 Anchorage* AK At Large Birmingham* AL 007 Huntsville AL 005 Mobile AL 001 Fayetteville AR 003 Little Rock AR 002 Flagstaff AZ 001 Window Rock AZ 001 Maricopa (Central)* AZ 006 Maricopa (South) AZ
(See Note 1) Solar Energy Factor (SEF D ) Solar Fraction (SF D ) Estimated Energy Savings SYSTEM DETAILS
 Solar Energy Factor (SEF D ) Solar Fraction (SF D ) Estimated Energy Savings SYSTEM DETAILS") OG-300 ICC-SRCC TM CERTIFIED SOLAR SYSTEM # SYSTEM INFORMATION Pumped Internal Backup: Gas Tank Collector Type: Glazed Flat Plate Solar Tank Volume: 379 liter (100 gal) Collector Heat Transfer Fluid: GRAS
OG-300 ICC-SRCC TM CERTIFIED SOLAR SYSTEM # SYSTEM INFORMATION Pumped Internal Backup: Gas Tank Collector Type: Glazed Flat Plate Solar Tank Volume: 379 liter (100 gal) Collector Heat Transfer Fluid: GRAS
Passengers Boarded At The Top 50 U. S. Airports ( Updated April 2
 (Ranked By Passenger Enplanements in 2006) Airport Table 1-41: Passengers Boarded at the Top 50 U.S. Airportsa Atlanta, GA (Hartsfield-Jackson Atlanta International) Chicago, IL (Chicago O'Hare International)
The 182 Arts & Economic Prosperity IV Study Regions
 Group Arts ECONOMIC IMPACT OF SPENDING NATIONAL ESTIMATES OF ECONOMIC IMPACT $61.1 Billion $74.1 Billion $135.2 Billion 4.1 Million $86.7 Billion $6.7 Billion $9.6 Billion AK City and Borough of Juneau
Monthly Employment Watch: Milwaukee and the Nation's Largest Cities
 Monthly Employment Watch: Milwaukee and the Nation's Largest Cities A monthly report on employment trends in the nation s largest cities Prepared by: The University of Wisconsin-Milwaukee Center for Economic
The Returns to Single Family Rental Strategies
 The Returns to Single Family Rental Strategies Andrew Demers and Andrea L. Eisfeldt January 2014 Homeownership Rates 70.0% 65.0% 60.0% Home Ownership Rate 55.0% 50.0% 45.0% 40.0% 1890 1895 1900 1905 1910
ALN Apartment Data, Inc. (Continued on next page)
") AK - Anchorage 93.0% 90.9% -210-2.2% $1,035 $1,018-1.7% 93.0% 90.9% -210-2.2% $1,035 $1,018-1.7% AK - Misc. AK 90.3% 86.8% -350-3.8% $1,218 $1,245 2.3% 90.3% 86.8% -350-3.8% $1,218 $1,245 2.3% Alaska Average
AK - Anchorage 93.0% 90.9% -210-2.2% $1,035 $1,018-1.7% 93.0% 90.9% -210-2.2% $1,035 $1,018-1.7% AK - Misc. AK 90.3% 86.8% -350-3.8% $1,218 $1,245 2.3% 90.3% 86.8% -350-3.8% $1,218 $1,245 2.3% Alaska Average
Six Routes 31 STOPS. 31 Spectacular Events! AGENDA
 AGENDA 7:15 am - 10 am: Registration 10am - 12 noon: General Session 12 noon - 1:30 pm: Lunch Break 1:30 pm - 5 pm: Breakouts 5 pm - 6 pm: Closing Session Six Routes 31 STOPS 31 Spectacular Events! Route
MUSIC CITY CENTER, NASHVILLE KAY BAILEY HUTCHINSON CONVENTION CENTER, DALLAS ALBANY CAPITAL CENTER
 MUSIC CITY CENTER, NASHVILLE Metro Government Project Type Feasibility, Economic Impact, Tax Projections Years of Service 2009 2013 HVS provided feasibility and economic impact studies for the Music City
 RUSSIA OR CA WA AK NV CANADA ID UT AZ MT WY CO NM MEXICO HI ND SD NE KS TX MN OK CANADA IA WI LA IL MI IN OH WV VA FL ME VT NH MA NY CT NJ PA MO KY NC TN SC AR AL GA MS MD BAHAMAS CUBA RI DE 3 RUSSIA 1
Oct-17 Oct-18 bps %CHG Oct-17 Oct-18 %CHG Oct-17 Oct-18 bps %CHG Oct-17 Oct-18 %CHG
 AK - Anchorage 92.6% 89.9% -270-2.9% $1,023 $1,011-1.2% 92.6% 89.9% -270-2.9% $1,023 $1,011-1.2% AK - Misc. AK 89.9% 85.8% -410-4.6% $1,227 $1,230 0.2% 89.9% 85.8% -410-4.6% $1,227 $1,230 0.2% Alaska Average
The 156 Arts & Economic Prosperity III Study Regions
 Full-Time Resident Local NATIONAL ESTIMATES OF ECONOMIC IMPACT $63,053,399,000 $103,145,088,000 $166,198,487,000 5,695,361 $104,234,116,000 $7,936,383,000 $9,140,633,000 AK City of Homer A 5,364 $1,248,208
MARKETBEAT U.S. Industrial Snapshot Q4 2015
 MARKETBEAT U.S. Industrial Snapshot Q4 2015 U.S. INDUSTRIAL Employment Indicators Q4 14 Q4 15 Total Nonfarm Employment 140.2M 143.0M Industrial Employment 23.4M 23.6M Unemployment 5.7% 5.0% Market Indicators
GRND 3D 2D NXT GRND 3D 2D NXT GRND 3D 2D NXT AL
 750's 12 PACK SHIPMENTS Wine Shipping Rates 11/01/2018 6 PACK SHIPMENTS 4 PACK SHIPMENTS GRND 3D 2D NXT GRND 3D 2D NXT GRND 3D 2D NXT AL AK - - $156 - - - $114 - - - $94 - AZ $50 $99 $112 $141 $36 $70
World Class Airport For A World Class City
 World Class Airport For A World Class City Air Service Update December 2018 2018 Air Service Updates February 2018 Delta Air Lines Seattle new departure, seasonal, 2x weekly Delta Air Lines Boston new
House Price Appreciation by State Percent Change in House Prices Period Ended June 30, 2009
 House Price Appreciation by State Percent Change in House Prices (Estimates use FHFA s Seasonally-Adjusted Purchase-Only House Price Index) State Rank* 1-Yr. Qtr. 5-Yr. Since 1991Q1 North Dakota (ND) 1
JUSTIN TIMBERLAKE ANNOUNCES EUROPEAN & U.K. DATES AND NEW NORTH AMERICAN LEG TO PREVIOUSLY SOLD OUT THE MAN OF THE WOODS TOUR
 JUSTIN TIMBERLAKE ANNOUNCES EUROPEAN & U.K. DATES AND NEW NORTH AMERICAN LEG TO PREVIOUSLY SOLD OUT THE MAN OF THE WOODS TOUR Over 450,000 Tickets Already Sold in North America Alone With Second Shows
CIM & Associates 2479 Murfreesboro Road Nashville, TN Tel: Fax:
 Alabama AL Arkansas AR Arizona AZ California CA (Northern) CA (Southern) Paine & Murray, Inc. 13300 Violet Lane Euless, TX 76040 Tel: 817-868-9584 Fax: 817-545-1312 Email: bruce@painemurray.com Intrex
World Class Airport For A World Class City
 World Class Airport For A World Class City Air Service Update October 2017 2017 Air Service Updates February 2017 Cleveland new destination, 2x weekly Raleigh-Durham new destination, 2x weekly March 2017
San Francisco Travel Association Selling in a Seller s Market DMO Perspective. May 21, 2014
 San Francisco Travel Association Selling in a Seller s Market DMO Perspective May 21, 2014 Agenda Discussion Themes 1. Meetings Are Important 2. Market Meetings Pace 3. Occupancy & Rate 4. Booking Windows
The Economic Impact of Tourism in Missouri. Fiscal Year 2016 Summary December 2016
 The Economic Impact of Tourism in Missouri Fiscal Year 2016 Summary December 2016 Introduction and definitions This study measures the economic impact of tourism in Missouri in FY2016. Visitors included
ATLANTA HOUSING MARKET Fourth Quarter 2017 Presentation for HBA Builder Developer Lender Council. Expanded. Unemployment Rate (U 6) Official
 Official") Eugene James Senior Regional Director 404-510-1080 ejames@metrostudy.com connect on LinkedIn Mike Overley Business Development Director 770-380-0827 moverley@metrostudy.com To volunteer call 404 408 0716
Eugene James Senior Regional Director 404-510-1080 ejames@metrostudy.com connect on LinkedIn Mike Overley Business Development Director 770-380-0827 moverley@metrostudy.com To volunteer call 404 408 0716
U.S. Metropolitan Area Exports, 2015
 U.S. Metropolitan Area Exports, 2015 Jeffrey Hall Office of Trade and Economic Analysis Industry and Analysis Department of Commerce International Trade Administration September 2016 U.S. Metro Exports:
the linea bench series
 t h e l i n e a b e n c h s e r i e s the linea bench series The Linea Bench Series, designed by Barcelona-based Mario Ruiz, provides an alternative approach to conventional seating areas. While initially
The FMR history file contains the following fields, all for 2-bedroom FMRs. It is in EXCEL format for easy use with database or spreadsheet programs.
 The FMR history file contains the following fields, all for 2-bedroom FMRs. It is in EXCEL format for easy use with database or spreadsheet programs. GENERAL NOTES 1. There are no Fiscal Year 1984 FMRs
World Class Airport For A World Class City
 World Class Airport For A World Class City Air Service Update April 2018 2018 Air Service Updates February 2018 Seattle new departure, seasonal, 2x weekly Boston new departure, seasonal, 2x weekly March
NCCCO Certifications
 NCCCO Certifications NCCCO Mobile Crane Operator (CCOP-MC) The Preparatory Program will prepare experienced operators for their NCCCO Written & Practical Exams on Lattice Boom and/or Telescopic Boom Fixed
Per capita carbon emissions from transportation and residential energy use, 2005
 Per capita carbon emissions from transportation and residential energy use, 2005 Metropolitan Area Carbon Footprint Honolulu, HI 1 1.356 Los Angeles-Long Beach-Santa Ana, CA 2 1.413 Portland-Vancouver-Beaverton,
MARKETBEAT U.S. Office
 MARKETBEAT U.S. Office Q2 2017 U.S. OFFICE Employment Indicators Q2 16 Q2 17 Total Nonfarm Employment 143.9M 146.2M Office-using Employment 30.1M 31.8M Unemployment 4.9% 4.4% Source: BLS Market Indicators
Airport Code BTR Airport Code GGG. Departure Times Arrival Times Departure Times Arrival Times
 Baton Rouge, LA and Longview, TX Airport Code BTR Airport Code GGG Sun Country Airlines Ticket Counter - Next to United - Main Times Arrival Times Terminal. Times Arrival Times Main Terminal - One Ticket
NICHOLAS BROWN Vice President, Development (516)
") CONSTRUCTION CONTACTS SOUTHERN NORTHERN D-ATLANTIC LEE JOHNSON (704) 362-6149 lbjohnson@kimcorealty.com NICHOLAS BROWN (516) 869-7266 nbrown@kimcorealty.com PAT CHRISTIE (516) 869-7130 pchristie@kimcorealty.com
CONSTRUCTION CONTACTS SOUTHERN NORTHERN D-ATLANTIC LEE JOHNSON (704) 362-6149 lbjohnson@kimcorealty.com NICHOLAS BROWN (516) 869-7266 nbrown@kimcorealty.com PAT CHRISTIE (516) 869-7130 pchristie@kimcorealty.com
Hotel InduSTRy Overview
 Hotel InduSTRy Overview Chris Klauda, CHIA Director, Destination Research cklauda@str.com ESTO Webinar November 12, 2015 1 1. Visit www.hotelnewsnow.com 2. Create Free Login 3. Click on Data Presentations
Monthly Employment Watch: Milwaukee and the Nation's Largest Cities
 Monthly Employment Watch: Milwaukee and the Nation's Largest Cities A monthly report on employment trends in the nation s largest cities Prepared by: The University of Wisconsin-Milwaukee Center for Economic
Regional Training Events 12/5/2015 ALL EVENTS ON FRIDAY EVENING UNLESS OTHERWISE NOTED
 Regional Training Events 12/5/2015 ALL EVENTS ON FRIDAY EVENING UNLESS OTHERWISE NOTED Venue Atlanta, GA Bridgeport, CT Charlotte, NC Chicago, IL Columbus, OH Dallas, TX Location of Event Hilton Atlanta/Marietta
MAMA Risk Summary Data as of 2008 Q4
 MAMA Risk Summary Data as of 2008 Q4 Table of Contents Contents. 2 Largest 25 Metro Areas based on HMDA originations.. 3 Lowest Risk 25 Metro Areas 4 Highest Risk 25 Metro Areas... 5 Largest 25 States
EVENT CENTRE / ARENA COMPLEX
 EVENT CENTRE / ARENA COMPLEX BUSINESS CASE ANALYSIS PRESENTATION TO COUNCIL JANUARY 14, 2019 PART A: PROJECT RECAP PART B: DETAILED ASSESSMENT OF THE FACILITY OPTIONS PART C: COMPARING THE OPTIONS PART
True to life. True to us.
 True to life. True to us. Plan your EVENT at SpringfieldMo.org/Meetings Springfield, Just the Right Size As far as meeting-friendly cities go, Springfield has a lot to offer. With a population of 160,000,
Join us! Dare to imagine and take your business from great to outstanding!
 JAFRA Coming to a city near you! Join us! Dare to imagine and take your business from great to outstanding! Get the latest company news. Learn new & different ways to maximize your holiday sells. Discover
Mango Market Development Index
 Mango Market Development Index 2016-2017 Understanding the Market Index The Mango Market Development Index is designed to measure and compare mango volume sold at retail relative to population by region
U.S. Office Snapshot Q1 2016
 MARKETBEAT U.S. Office Snapshot Q1 2016 U.S. OFFICE Employment Indicators Q1 15 Q1 16 Total Nonfarm Employment 140.8M 143.5M Offi ce-using Employment 30.2M 31.0M Unemployment 5.6% 4.9% Source: BLS Market
Parking Rates & Policies Survey. December 2013
 METER OVERVIEW RATE & POLICY PRESENTATION SURVEY / 1 Parking Rates & Policies Survey December 2013 METER OVERVIEW RATE & POLICY PRESENTATION SURVEY / 2 Parking rates and policies survey The purpose of
Houston Economic Update. Presented by Patrick Jankowski Vice President, Research Greater Houston Partnership
 Houston Economic Update Presented by Patrick Jankowski Vice President, Research Greater Houston Partnership Houston Astros - Percent Regular Season Games Won Help from the bullpen this year Help from the
MARKETBEAT U.S. Office
 MARKETBEAT U.S. Office Q3 2017 U.S. OFFICE Employment Indicators Net Absorption/Rent 4-QTR TRAILING AVERAGE Q3 16 Q3 17 Total Nonfarm Employment 144.7M 146.6M Office-using Employment 31.3M 31.9M Unemployment
RANKING OF THE 100 MOST POPULOUS U.S. CITIES 12/7/ /31/2016
 OVERVIEW OF THE DATA The following information is based on incoming communication to the National Human Trafficking Hotline via phone, email, and online tip report from December 7, 2007 December 31, 2016
Hotel InduSTRy Overview What Lies Ahead
 University of Massachusetts Amherst ScholarWorks@UMass Amherst Tourism Travel and Research Association: Advancing Tourism Research Globally 2013 Marketing Outlook Forum - Outlook for 2014 Hotel InduSTRy
LEASING CONTACTS. Northern Region. Mid-Atlantic Region. Southern Region. Western Region
 Northern Region Mid-Atlantic Region JOSH WEINKRANZ, Northern Region (516) 869-7146 jweinkranz@kimcorealty.com DAVE SALVAGE Vice, Northern Region (617) 933-2821 dsalvage@kimcorealty.com TOM SIMMONS, Mid-Atlantic
2016 Air Service Updates
 Air Service Update May 2016 2016 Air Service Updates February 2016 Pittsburgh new destination, 2x weekly April 2016 Los Angeles new departure, 1x daily Atlanta new departure, 1x daily Jacksonville new
US Cities Over 100,000 Population in 1998 & 1990
 US Cities Over 100,000 Population in 1998 & 1990 Population Ranking Alphabetical Listing Population Change Ranking Percentage Population Change Ranking DEMOGRAPHIA An undertaking of Wendell Cox Consultancy
True to life. True to us.
 True to life. True to us. Plan your EVENT at SpringfieldMo.org/Meetings Springfield, Just the Right Size As far as meeting-friendly cities go, Springfield has a lot to offer. With a population of 160,000,
Impact of Hurricane Irma on US Metropolitan Areas
 Impact of Hurricane Irma on US Metropolitan Areas Puerto Ricans in mainland Prepared for: Jorge Restrepo, CEO 2017 EurekaFacts LLC September 29, 2017 Climate refugees from Puerto Rico in US metropolitan
MARKETBEAT U.S. Office
 MARKETBEAT U.S. Office Q4 2018 U.S. OFFICE Employment Indicators Market Indicators (Overall) Office: Net Absorption/Asking Rent 4Q TRAILING AVERAGE Office: Overall Vacancy Q4 17 Q4 18 Total Nonfarm Employment
Northeast Region. JOSH WEINKRANZ President, Northeast Region (516)
") LEASING CONTACTS Western Region ARMAND VASQUEZ, Western Region (916) 580-2534 avasquez@kimcorealty.com CARMEN DECKER Vice, Pacific Northwest Region (425) 373-3511 cdecker@kimcorealty.com JOHN WELTER Vice,
LEASING CONTACTS Western Region ARMAND VASQUEZ, Western Region (916) 580-2534 avasquez@kimcorealty.com CARMEN DECKER Vice, Pacific Northwest Region (425) 373-3511 cdecker@kimcorealty.com JOHN WELTER Vice,
Appendix A TRIP Urban Roads Report 2018
 Appendix A TRIP Urban Roads Report 2018 Pavement Conditions and Extra Vehicle Operating Costs for Urban Areas with Population of 500K or More Akron OH 49% 12% 14% 25% $837 Albany Schenectady Troy NY 15%
MARKETBEAT U.S. Office
 MARKETBEAT U.S. Office Q4 2016 U.S. OFFICE Employment Indicators Market Indicators (Overall) Q4 15 Q4 16 Vacancy Rate 13.5% 13.2% Net Absorption 20.5M 6.9M Under Construction 94.5M 100.2M Weighted Asking
2015 U.S. PLACE EQUITY INDEX RESONANCE REPORT
 2015 U.S. PLACE EQUITY INDEX RESONANCE REPORT RESONANCE CONSULTANCY CREATES DEVELOPMENT STRATEGIES, PLANS, POLICIES AND BRANDS THAT SHAPE THE FUTURE OF PLACES AROUND THE WORLD. INTRODUCTION All cities,
NATIONAL EXPRESS GROUP PLC AN OVERVIEW
 NATIONAL EXPRESS GROUP PLC AN OVERVIEW February 2005 3 A leading international public transport Group Carrying over one billion passengers a year 4 A BRIEF HISTORY 1973 - First National Express coach appeared
NATIONAL TOLL FACILITIES USAGE ANALYSIS RECORD-BREAKING YEAR FOR TOLL FACILITIES ACROSS THE U.S.
 NATIONAL TOLL FACILITIES USAGE ANALYSIS RECORD-BREAKING YEAR FOR TOLL FACILITIES ACROSS THE U.S. INTRODUCTION KEY FACTS FROM THE NATIONAL TOLL FACILITIES USAGE ANALYSIS 31 TOLL AUTHORITIES from across
World Class Airport For A World Class City
 World Class Airport For A World Class City Air Service Update April 2017 2017 Air Service Updates February 2017 Cleveland new destination, 2x weekly Raleigh-Durham new destination, 2x weekly March 2017
Floorplans & Specs. Index. West Building 100 Level West Building 200 Level West Building 300 Level
 Floorplans & Specs Index Page West Building Level... 2-3 West Building 200 Level... 5-6 West Building 300 Level... 7-8 North Building Level... 9-10 North Building 200 Level... 11-12 North Building 300
MARKETBEAT U.S. Industrial
 MARKETBEAT U.S. Industrial Q2 2018 U.S. INDUSTRIAL Employment Indicators Q2 17 Q2 18 Total Nonfarm Employment 146.3M 148.7M Industrial Employment 31.6M 32.5M Unemployment 4.3% 3.9% Source: BLS Market Indicators
INDUSTRY CALENDAR DATE EVENT LOCATION
 INDUSTRY CALENDAR DATE EVENT LOCATION OCTOBER, 2017 2-5 ANMTA Fall Meeting Scottsdale, AZ 3-4 KS Rural In Telec Coalition Fall Meeting Witchita, KS 5-6 MN Telecom Alliance Fall Meeting Broklyn Park, MN
MARKETBEAT U.S. Industrial
 MARKETBEAT U.S. Industrial Q4 2018 U.S. INDUSTRIAL Employment Indicators Market Indicators Net Absorption/Rent NNN 4-QTR TRAILING AVERAGE Overall Vacancy Q4 17 Q4 18 Total Nonfarm Employment 147.4M 149.9M
2016 Air Service Updates
 Air Service Update September 2016 2016 Air Service Updates February 2016 Pittsburgh new destination, 2x weekly April 2016 Los Angeles new departure, 1x daily Atlanta new departure, 1x daily Jacksonville
MARKETBEAT U.S. Office
 MARKETBEAT U.S. Office Q3 2018 U.S. OFFICE Employment Indicators Market Indicators (Overall) Office: Net Absorption/Asking Rent 4Q TRAILING AVERAGE Office: Overall Vacancy Q3 17 Q3 18 Total Nonfarm Employment