Rapid City Transit Development Plan. July Prepared for: Rapid City Growth Management Department
|
|
|
- Vivien Horton
- 5 years ago
- Views:
Transcription


1 Rapid City Transit Development Plan July 2008 Prepared for: Rapid City Growth Management Department
2 Rapid City Transit Development Plan Prepared for: Rapid City Growth Management Department Prepared by: SRF Consulting Group, Inc.
3 TABLE OF CONTENTS 1. INTRODUCTION COMMUNITY CHARACTERISTICS EXISTING TRANSIT SERVICES AND FACILITIES SYSTEM NEED ASSESSMENT SERVICE OPTIONS SYSTEM PERFORMANCE MEASURES RECOMMENDATIONS FINANCIAL PLAN LIST OF TABLES Table 2-1 Population Density... 7 Table 3-1 RapidRide Route Length & Running Times Table 3-2 RapidRide Complete Loop Times and Layovers Table 3-3 RapidRide Route Length & Running Times Table 3-4 Average Transfers Per Day Table 3-5 Top 10 Most Active Bus Stops Table 3-6 RTS Transit System Expense Trends, Table 3-7 RTS Transit System Expense Trends, Table 3-8 RTS Operating Statistics Trends, Table 3-9 RTS Operating Expenses, Table 3-10 RTS RapidRide Fare Revenue Trends, Table 3-11 RTS Dial-A-Ride Fare Revenue Trends, Table 3-12 RTS Revenue and Expense Summary, Table 3-13 RTS Current Active Fleet Table 5-1 Existing Service with 12 Weekday Service Hours per Route Table 5-2 Existing Service with 12 Weekday Service Hours per Route plus Limited Evening Service Table 5-3 Existing Service with 12 Weekday Service Hours per Route Table 5-4 plus Saturday Existing Service with 12 Weekday Service Hours per Route plus Limited Evening Service and Saturday Table 5-5 Revised Routes Weekday Service Table 5-6 Revised Routes with Evening Service Table 5-7 Revised Routes with Saturday Service Table 5-8 Revised Routes with Evening and Saturday Service Table 8-1 Capital Plan Table 8-2 Financial Plan Table 8-3 Total Local Assistance... 77
4 LIST OF FIGURES Figure 2-1 Location... 3 Figure 2-2 Study Area... 4 Figure 2-3 Population Growth... 5 Figure 2-4 Low Income Population... 6 Figure 2-5 Population Density... 8 Figure 2-6 Urban Growth Area... 9 Figure 2-7 Elderly Population Figure 2-8 Youth Population Figure 2-9 Major Travel Generators Figure 3-1 RapidRide/Transit System Fixed Routes Figure 3-2 System Expense Figure 3-3 System Revenues (Total Dollars) Figure 3-4 Route 1A Ridership Figure 3-5 Route 1B Ridership Figure 3-6 Route 2A Ridership Figure 3-7 Route 2B Ridership Figure 3-8 Route 3A Ridership Figure 3-9 Route 3B Ridership Figure 3-10 Route 4A Ridership Figure 3-11 Route 4B Ridership Figure 3-12 Route 5A Ridership Figure 3-13 Route 5B Ridership Figure 3-14 Annual Operating Expense per Capita Figure 3-15 Annual Passenger Trips per Capita Figure 3-16 Operating Expense per Vehicle Revenue Mile (RapidRide) Figure 3-17 Operating Expense per Vehicle Revenue Mile (Dial-A-Ride) Figure 3-18 Operating Expense per Vehicle Revenue Hour (RapidRide) Figure 3-19 Operating Expense per Vehicle Revenue Hour (Dial-A-Ride) Figure 3-20 Farebox Recovery (RapidRide) Figure 3-21 Farebox Recovery (Dial-A-Ride) Figure 3-22 Passenger Trips per Revenue Hour (RapidRide) Figure 3-23 Passenger Trips per Revenue Hour (Dial-A-Ride) Figure 3-24 Passenger Trips per Revenue Mile (RapidRide) Figure 3-25 Passenger Trips per Revenue Mile (Dial-A-Ride) Figure 3-26 Operating Expense per Passenger Trip (RapidRide) Figure 3-27 Operating Expense per Passenger Trip (Dial-A-Ride) Figure 3-28 Fare Revenue per Passenger Trip (RapidRide) Figure 3-29 Fare Revenue per Passenger Trip (Dial-A-Ride) Figure 5-1 Rapid Transit System Fixed Routes Figure 5-2 Proposed RapidRide Transit Routes Figure 5-3 Proposed A/B Transit Route Figure 5-4 Proposed C Transit Route Figure 5-5 Proposed D Transit Route Figure 5-6 Proposed E Transit Route Figure 5-7 Proposed F Transit Route Figure 5-8 Demand Response Zones... 69
5 1. INTRODUCTION The purpose of this report is to present the results of tasks completed as part of the 2009 to 2013 Rapid City Transit Development Plan. This document establishes the community s existing conditions in terms of demographic trends, growth trends, and current transit services and performance. It also presents a comprehensive route-by-route summary of RapidRide s current fixed-route system, and compares Rapid Transit System performance to a select group of peer city transit systems. The characteristics of the community and analysis of transit system performance is compared against a backdrop of needs identified by Rapid City transit stakeholders at a series of preliminary listening sessions held in March This report concludes with a series of recommended goals and performance standards for the Rapid Transit System, which were developed from the community input sessions as well as technical analysis of system performance. The cornerstone of the plan is a service plan containing recommendations for restructuring RTS services. The financial implications for both capital and operational changes to RTS are also presented in the final chapter of this report Page 1
6 2. COMMUNITY CHARACTERISTICS This chapter presents an overview of the region s geographic, economic and residential characteristics. This information helps define the potential markets for transit service within the community. AREA DESCRIPTION Rapid City is the second largest city in the state of South Dakota. It is located in the foothills of the Black Hills and is the county seat of Pennington County. The city serves as a regional center for a large geographic area including portions of Wyoming, Nebraska, North Dakota, Montana and South Dakota (see Figure 2-1). In Rapid City, the Rapid Transit System (RTS) serves the metropolitan area carrying more than 215,000 passenger trips annually on a total of five fixed routes, and demand response service is provided for those who need curb-to-curb transit service. Ridership on Dial-A-Ride in 2007 was almost 90,000 trips. The study area for the transit analysis is shown in Figure 2-2. DEMOGRAPHIC CHARACTERISTICS This section profiles the demographic and socio-economic characteristics of Rapid City. These factors influence the overall need for transit service in the community and are often indicators of potential use. Population Trends Since the 2000 Census, the population of Rapid City has grown almost 10 percent with (2006 estimates putting the population at 65,398. Future estimates suggest that the city s population will continue to grow steadily. The 2010 population is expected to reach 69,383 and estimates for 2025 project the population to reach 79,006 (see Figure 2-3). Rapid City experienced its fastest rate of growth between 1940 and 1960, which coincides with the opening of Ellsworth Air Force Base. From 1960 to 1980, population growth was relatively flat. Between 1980 and 1990, Rapid City experienced a significant growth spurt of 18.6 percent and between 1990 and 2000, the population grew by 9.3 percent. Page 2
7 +, 87 +, 191 Montana +, 2!"# 94 +, 85 +, 52 North Dakota Bismarck Fargo +, 75 +, 59 +, 10 +, 89!"# 90 +, 310 Billings +, 12 +, 212 +, 13!"# 29 J:\Maps\6331\mxd\fig2_1_Rapid_City_location.mxd +, 16 +, 26 +, 189 +, 287 Utah!"# 70 +, 40!"# 80 RAPID CITY, SOUTH DAKOTA AND VICINITY RAPID CITY TRANSIT DEVELOPMENT PLAN Casper Wyoming!"# 25 Fort Collins Colorado +, 30 Nebraska +, 183 +, 285 +, 24 Cheyenne Denver!"# 76 Rapid City +, 385 +, 138 +, 18 +, 20 +, 6 +, 34!"# 70 +, 36 Pierre +, 83!"# 90 +, 283!"# 80 +, 14 South Dakota +, 275 +, 281 +, 136 +, 81 Kansas Sioux Falls Sioux City Omaha Lincoln +, 77 Figure 2-1
8 Deadwood Ave QR 79 Haines Ave Ma l Dr Country Rd!"# 90!"# 90!"# 90 Seger Dr Dyess Ave Elk Vale Rd Country Rd 1416 Anamosa St Chicago St Sheridan Lake Rd Omaha St Jackson Blvd West Blvd!"# 190 5th St Lacrosse St +, 16 QR 44 Saint Patrick St Elk Vale Rd Elk Creek Rd Elm Ave QR 44 Cathedral Dr Texas St Parkview Dr Fairmont Blvd Minnesota St QR 16 QR 44 Radar Hill Rd J:\Maps\6331\mxd\fig2_2_Rapid_City_TDP_Studyarea.m xd QR 79 Legend Rapid City Municipal Boundary STUDY AREA RAPID CITY TRANSIT DEVELOPMENT PLAN Figure 2-2
9 Figure 2-3 Population Growth 80,000 70,000 60,000 50,000 Population 40,000 30,000 20,000 10, Year Current Employment According to the South Dakota Department of Labor, Labor Market Information Center, employment in Rapid City was 63,315 in The service sector represents the largest share of total non-farm employment in Rapid City at 40 percent. This is followed by governmental services at 17 percent and retail trades at 15 percent of total non-farm employment. Income Transit dependent populations often include those with low or fixed incomes because they have less ability to provide reliable transportation for all members of the household using a private transportation. The median household income for Rapid City in 2006 was $40,678, which is lower than the Pennington County median of $43,508, and lower than the median household income for the State of South Dakota ($42,791). Concentrations of lower income residents are located near downtown, in the central and eastern portions of the city (Figure 2-4). There are also clusters of lower-income households to the west of downtown along Jackson Boulevard and West Main Street. The current fixed route service operates extensively through these areas. Page 5
10 J:\M aps\6331\mxd\2_ 4_Rapid_City_Lo w_income_ Pop.mxd Legend Average Household Income by Block $20,000 or less $40,000 or less $60,000 or less $80,000 or less $100,000 or less Rapid City Municipal Boundary RAPID CITY LOW TO MODERATE INCOME POPULATION BY BLOCK RAPID CITY TRANSIT DEVELOPMENT PLAN Figure 2-4
11 Rapid City Land Area Growth Information on city land area growth and population density is presented in Table 2-1 based on information provided by the Rapid City Growth Management Department. Since 1970, the land area of the city has increased significantly. As a result, Rapid City has become a less densely populated city, a trend that is in line with many urbanized areas around the country. Figure 2-5 depicts current population densities. There are significant challenges for a transit system to provide quality service to a population that is spreading over a greater land area over time. Table 2-1 Population Density Year City Land Area (square miles) Population Population Density (persons/mi 2 ) ,310 1, ,399 1, ,836 2, ,492 1, ,523 1, ,607 1, ,383 1, , Future Growth Areas Growth continues to occur in the areas surrounding the city limits. The city s growth is constrained by an urban growth boundary that limits development through 2025 to a 123 square mile area around the city center. A Long-Term Annexation Plan has been prepared by the city describing the process by which developing areas will be annexed. (See Figure 2-6 for a depiction of the urban growth boundary and growth areas.) Senior and Youth Populations Transit-dependent populations often include senior citizens and youth. Some of the elderly may not be able to afford a car, may be physically unable to drive, or prefer not to drive. Youth typically have limited incomes and need to cope with age restrictions and competency testing before they may obtain a driver s license. This results in a percentage of youth who are mobility-limited and may consider transit as a valid transportation option. Of the 65,398 residents in Rapid City there are approximately 8,097 people aged 65 or older. This represents about 12 percent of the total population. There are approximately 16,500 people aged 17 and younger living in the city. This represents about 25 percent of the total population. Figure 2-7 presents the concentrations of the population aged 65 or older. Figure 2-8 presents the concentrations of the population aged 17 and younger. Some of the most significant concentrations of seniors are in the north central part of town (north of downtown and south of I-90), southeast section (south of Fairmont Boulevard, east of 5th Street), southwest section (Sheridan Lake Road and Jackson Boulevard areas), and west section (West Main Street, West Chicago Street area). Page 7
12 Deadwood Ave QR 79 Haines Ave Ma l Dr Country Rd!"# 90!"# 90!"# 90 Seger Dr Dyess Ave Elk Vale Rd Country Rd 1416 Anamosa St Chicago St Sheridan Lake Rd Omaha St Jackson Blvd West Blvd!"# 190 5th St Lacrosse St +, 16 QR 44 Saint Patrick St Elk Vale Rd Elk Creek Rd Elm Ave QR 44 Cathedral Dr Texas St Parkview Dr Fairmont Blvd Minnesota St QR 16 QR 44 Radar Hill Rd J:\Maps\6331\mxd\fig2_6_Rapid_City_Po p_density.mxd Legend Density QR 79 Fewer than 5 persons per acre 5.0 to 9.9 persons per acre 10 to 14.9 persons per acre More than 15 perons per acre Rapid City Municipal Boundary RAPID CITY POPULATION DENSITY BY TAZ RAPID CITY TRANSIT DEVELOPMENT PLAN Figure 2-5
13 !"# 90 QR 79 Haines Ave Mall Dr Country Rd Seger Dr Dyess Ave Elk Vale Rd Country Rd 1416 Deadwood Ave Chicago St Sheridan Lake Rd Omaha St West Blvd Anamosa St!"# 190!"# 90 5th St Lacrosse St +, 16 QR 44 Saint Patrick St Elk Creek Rd!"# 90 QR 44 Parkview Dr Elm Ave Minnesota St QR 16 QR 44 Radar Hill Rd J:\Maps\6331\mxd\fig2_6_Rapid_City_urbgr owth.mxd Legend Growth Area Rapid City Municipal Boundary RAPID CITY URBAN GROWTH AREA RAPID CITY TRANSIT DEVELOPMENT PLAN QR 79 Figure 2-6
14 Deadwood Ave QR 79 Haines Ave Ma l Dr Country Rd!"# 90!"# 90!"# 90 Seger Dr Dyess Ave Elk Vale Rd Country Rd 1416 Anamosa St Chicago St Sheridan Lake Rd Omaha St Jackson Blvd West Blvd!"# 190 5th St Lacrosse St +, 16 QR 44 Saint Patrick St Elk Vale Rd Elk Creek Rd Elm Ave QR 44 Cathedral Dr Texas St Parkview Dr Fairmont Blvd Minnesota St QR 16 QR 44 Radar Hill Rd J:\Maps\6331\mxd\fig2_7_Rapid_City_65+_Pop.mxd Legend Rapid City TAZ Boundaries Population Over 65 QR 79 < Over 200 Rapid City Municipal Boundary RAPID CITY 65+ POPULATION BY TAZ RAPID CITY TRANSIT DEVELOPMENT PLAN Figure 2-7
15 Deadwood Ave QR 79 Haines Ave Ma l Dr Country Rd!"# 90!"# 90!"# 90 Seger Dr Dyess Ave Elk Vale Rd Country Rd 1416 Anamosa St Chicago St Sheridan Lake Rd Omaha St Jackson Blvd West Blvd!"# 190 5th St Lacrosse St +, 16 QR 44 Saint Patrick St Elk Vale Rd Elk Creek Rd Elm Ave QR 44 Cathedral Dr Texas St Parkview Dr Fairmont Blvd Minnesota St QR 16 QR 44 Radar Hill Rd J:\Maps\6331\mxd\fig2_8_Rapid_City_17under_pop.mxd Legend Population 17 and Under QR 79 < Over 900 Rapid City Municipal Boundary RAPID CITY POPULATION 17 & UNDER BY BLOCK GROUP RAPID CITY TRANSIT DEVELOPMENT PLAN Figure 2-8
16 Disabled and Mobility Limited Populations Rapid City has about 10,000 disabled residents over 5 years old or about 18 percent of the population. This is slightly below both the statewide and national averages of 22 percent and 19 percent, respectively. A number of these individuals qualify for use of the demand-response service in the community. MAJOR TRIP GENERATORS In serving transit markets, important geographic points of interest typically include shopping centers, office and commerce concentrations, schools and learning institutions, health care facilities, and major employment centers. All of these generators should be considered when evaluating the adequacy of a region s transit service. Figure 2-9 shows some of the major trip generators in Rapid City. Major Employers The top employment locations outside of federal, state, and local government include the following: Rapid City Regional Hospital 2,700 Wal-Mart/Sam s Club 857 Sanmina 460 Green Tree 415 NEW Finance Corporation 410 Black Hills Workshop 380 ASI, Inc. 373 GE Money 330 Beverly Healthcare 298 School of Mines and Technology 298 BH Surgery Center 287 Menards 250 Merrillat Industries 216 GC Dacotah 163 Black Hills Gold by Coleman 156 J.C. Penney 150 Assurant Preneed 143 Mileage, Plus, Inc. 139 Lowes 125 Dakota Craft Inc. 123 Shopping and Retail Centers Major shopping and retail areas in Rapid City tend to be located along major transportation corridors and include the Rushmore Mall, the East Family Thrift Center, the Midland Shopping Center, Baken Park, and the city s central business district. Rapid City serves as the region s healthcare center. The sector employs over 8,000 people in the Black Hills area. Hospitals and health centers represent important destinations for the community. For this reason, it is of critical importance that these facilities are well served by the transit network. Major health care facilities in Rapid City are: Rapid City Regional Hospital Rapid City Regional West Center for Behavioral Health Rapid City Indian Hospital (Sioux San) Rapid City Community Health Center Black Hills Rehabilitation Center Page 12
17 J:\Maps\6331\mxd\fig2_9_Rapid_City_MajT ripg en.mxd Legend Major Trip Generators å Elementary School n High School C Health Facility!( Other (see map label) Rapid Transit System Fixed Routes Route1A Route1B Route2A Route2B Route3A Route3B QR 44 n QR 79 Black Hills Workshop MAJOR TRIP GENERATORS RAPID CITY TRANSIT DEVELOPMENT PLAN å!( Chicago St å Deadwood Ave National Guard!( Sheridan Lake Rd!"# 90 Shopping Center!(!( Family Thrift Center VA Clinic +, 16 West Blvd!"# 190 å Saint Patrick St å Civic Center!( n 5th St Cathedral Dr C C n å Haines Ave Rushmore Mall Hospital å Mall Dr!( Anamosa St Texas St å!( Parkview Dr QR 79 Elm Ave å!( å Lacrosse St Walmart!( Seger Dr School of Mines & Technology Minnesota St Fairmont Blvd Youth & Family Services!(!"# 90 QR 44 Vo Tech!( Dyess Ave Family Thrift Center Saint Patrick St Route4A Route4B Route5A Route5B Elk Vale Figure 2-9
18 Schools and Training Centers Schools and training centers are also important travel destinations, often with large transitdependent clientele. In addition to the elementary and high schools, Rapid City is the home of the South Dakota School of Mines and Technology, a four-year college specializing in engineering and related fields. National American University provides two-and four-year degrees in business. Western Dakota Technical Institute provides vocational training in areas such as drafting and computer technology, and the University of South Dakota s School of Nursing offers a training program for nursing students. Black Hills State University offers a variety of courses offered at four locations around Rapid City: Ellsworth Air Force Base, Western Dakota Technical Institute, Rapid City Regional Hospital Health Sciences Building, and the South Dakota School of Mines and Technology. Quality of Life Rapid City s reputation as one of the top tourist centers in the nation makes for a wide variety of leisure and recreational opportunities Five national parks in close proximity: Mount Rushmore, Badlands, Wind Cave, Jewel Cave, and Devil s Tower. 17 area golf courses plus tennis facilities in town. 14 mountain lakes, more than 300 miles of streams and reservoirs for water sports and fishing. Rapid City bike trail measuring 13.5 miles along Rapid Creek. Two area ski resorts. 400 miles of nature walks and hiking systems in the Black Hills. Diverse religious community, with more than 80 area churches representing various denominations and congregations of all sizes. 75 hotels/motels with 5,156 available sleeping rooms and six convention properties. Western South Dakota s largest shopping center, specialty shops, boutiques, and antique stores. Downtown Rapid City s business contains some 400 businesses. Rushmore Plaza Civic Center is a modern facility for conventions, entertainment and athletic events. Complete convention complex includes two arenas, 150,000 square feet of exhibit space, 1,774 seat theater, meeting rooms and catering facilities, conveniently located in downtown Rapid City. Page 14
19 3. EXISTING TRANSIT SERVICES AND FACILITIES This chapter presents an overview of the fixed route transit service and demand response service operated by Rapid Transit System (RTS). It presents data on the current fixed route system in terms of service levels, fare structure and ridership, as well as operating statistics and regional service coverage. The chapter also analyzes trends in the operating and financial data for all RTS services. These descriptions provide a baseline for understanding the current RTS from which further evaluations and recommendations can be made. RAPID CITY TRANSIT SERVICES RTS is responsible for providing safe, convenient and affordable local bus service within the city limits of Rapid City. RTS operates both fixed route service, RapidRide, and demand-response service, called Dial-A-Ride for those individuals that qualify under the Americans with Disabilities Act (ADA). The city has also recently begun operation of a seasonal trolley service. FIXED ROUTE SERVICE DESCRIPTION The RTS fixed-route system, known as RapidRide, consists of five routes that serve the north, south, and west parts of the community (see Figure 3-1). This service was initiated in 1992, well after the city s Dial-A-Ride service began (1982). Days & Hours of Operation RTS operates RapidRide Monday-Friday 6:25 a.m. through 5:55 p.m. RapidRide does not operate on weekends or holidays. Service Frequency Each of the RapidRide routes operates on 35-minute headway during regular weekday service utilizing an A and a B configuration. The two loops for each route differ by direction (clockwise or counter-clockwise) and are intended to improve safety for riders and provide better coverage by providing bus stops along both sides of the main street system. Slight modifications between A and B routing occur on all routes except Route 4. For each route, buses depart from the Milo Barber Transportation Center (MBTC), travel the loop route in one direction and arrive back at the MBTC 25 minutes later. The buses then have a 10-minute layover before they depart from the MBTC on the same route but in the opposite direction. The buses arrive back at the MBTC 25 minutes later, completing the trip. Thus, a full round trip, including both A and B loops takes 70 minutes. There are 10 round trips (A and B loops completed) daily on each route. Table 3-1 summarizes currently scheduled RapidRide service. Page 15
20 Figure 3-1 Page 16
21 Table 3-1 RapidRide Route Length & Running Times A Route B Route MBTC Layover Begin End Begin End MBTC Layover 6:25 a.m. 6:50 a.m. 10 minutes 7:00 a.m. 7:25 a.m. 10 minutes 7:35 a.m. 8:00 a.m. 10 minutes 8:10 a.m. 8:35 a.m. 10 minutes 8:45 a.m. 9:10 a.m. 10 minutes 9:20 a.m. 9:45 a.m. 10 minutes 9:55 a.m. 10:20 a.m. 10 minutes 10:30 a.m. 10:55 a.m. 10 minutes 11:05 a.m. 11:30 a.m. 10 minutes 11:40 a.m. 12:05 p.m. 10 minutes 12:15 p.m. 12:40 p.m. 10 minutes 12:50 p.m. 1:15 p.m. 10 minutes 1:25 p.m. 1:50 p.m. 10 minutes 2:00 p.m. 2:25 p.m. 10 minutes 2:35 p.m. 3:00 p.m. 10 minutes 3:10 p.m. 3:35 p.m. 10 minutes 3:45 p.m. 4:10 p.m. 10 minutes 4:20 p.m. 4:45 p.m. 10 minutes 4:55 p.m. 5:20 p.m. 10 minutes 5:30 p.m. 5:55 p.m. NA In February 2008, each of the RapidRide routes were surveyed in order to determine actual running times. The survey was conducted over a five-day period in February of Table 3-2 summarizes the results. Generally, the A.M. routes run slightly ahead of schedule and the P.M. routes slightly behind. Table 3-2 RapidRide Complete Loop Times and Layovers Route Running Time Layover AM PM AM PM 1A 22 min 26 min 13 min 9 min 1B 25 min 27 min 10 min 8 min 2A 29 min 31 min 6 min 4 min 2B 25 min 28 min 10 min 7 min 3A 25 min 29 min 10 min 6 min 3B 26 min 28 min 9 min 7 min 4A 26 min 27 min 9 min 8 min 4B 29 min 30 min 6 min 5 min 5A 24 min 25 min 11 min 10 min 5B 29 min 27 min 6 min 8 min AVERAGE 26 min 27.8 min 9 min 7.2 min Average Layover/Complete Route (35 min) 26% 20% Page 17
22 Route Length/Running Times For ease of transfer at the MBTC, all routes have 25-minute one-way running times (see Table 3-3). However, each of the four routes has a slightly different route length. Table 3-3 RapidRide Route Length & Running Times Route Route Length Scheduled Running Time Average Speed 1 A 6.6 miles 25 minutes 15.8 mph 1 B 7.1 miles 25 minutes 17 mph 2 A 7.6 miles 25 minutes 18.2 mph 2 B 7.1 miles 25 minutes 17 mph 3 A 8.5 miles 25 minutes 20.4 mph 3 B 8.6 miles 25 minutes 20.6 mph 4 A 8.7 miles 25 minutes 20.9 mph 4 B 9.5 miles 25 minutes 22.8 mph 5 A 6.2 miles 25 minutes 14.9 mph 5 B 6.7 miles 25 minutes 16.1 mph Source: City of Rapid City. Transfer Policies RapidRide allows transfers to another bus, but does not allow transfers for stopovers or return trips. All transfers must be made at the MBTC. Based on a six-day sample, approximately 17 percent of average daily ridership transfers use paper transfers. Additional transfers occur through passengers using their monthly passes to reboard another vehicle, although it is believed that this is a relatively modest number. The number of transfers between routes varies (see Table 3-4). The highest amount of transferring involves passengers from Routes 1 and 2 transferring to Route 3 to complete their trip. Table 3-4 Average Transfers per Day To Route: From Route: Page 18
23 Fare Structure RapidRide accepts cash fares and coupons for individual trips and sells unlimited ride monthly passes. The standard adult/student (5-59 yrs) fare is $1 per ride. The elderly, disabled and Medicare passengers ride for $0.50 per trip. Children (4 years and under) ride for free. Books of coupon (10 coupons) can be purchased (for convenience purposes), at rates of $10 for adult/student passengers and $5 for elderly, disabled and Medicare passengers. Monthly passes can be purchased, for potential savings (depending upon use), at rates of $25 for adults and $15 for students (K-12). DIAL-A-RIDE SERVICE DESCRIPTION This service operates as a curb-to-curb service for Americans with Disabilities (ADA) certified passengers. An individual with a disability must complete an application form and be approved prior to using this service. Upon determination and approval, riders receive a laminated card to document their eligibility. (No similar card system is currently in use for elderly and handicapped discount riders on RapidRide.) All individuals whose disabilities are so significant that they are unable to use regular, lift-equipped, fixed-route, bus service are approved for use of this service. Riders may schedule rides up to 14 days in advance of their trip, and a significant subscription service exists for recurring trips for Dial-A-Ride. A qualified rider must contact the dispatcher in order to schedule service. This is a shared ride service, and as such the length of a trip depends on the number of stops the bus will make for other passengers. However, every effort is made to ensure the shortest trip possible for the passenger. The City has a no-show policy that is in effect if a rider is more than five minutes late from the scheduled pick-up time. Dial-A-Ride on-time performance is judged by the vehicle arriving within 20 minutes of the scheduled pick-up time. This service is available Monday through Friday, 6:30 a.m. to 6:00 p.m., and Saturdays 8:00 a.m. to 7:00 p.m. Dial-A-Ride service is not available on major holidays. Currently all passenger scheduling and vehicle dispatching is done using trip scheduling software. ORGANIZATIONAL STRUCTURE RTS is operated as a service of the City of Rapid City. A transit manager oversees all activities and is supported by an operations coordinator, two route supervisors, a dispatcher and 29 drivers (17 full-time positions). A couple of temporary bus cleaners and a temporary receptionist round out the organization. Dispatchers and drivers are unionized municipal employees. All vehicle maintenance is sub-contracted out. The city is hoping to begin using city staff for some light maintenance in the near future. The Rapid Transit Advisory Board (RTAB) was established in 1991 to inform and advocate for various groups regarding transit and transportation related issues. The membership is drawn from the community and appointed by the Mayor to represent social service organizations, transit passengers, persons with disabilities, the elderly and private business. The board consists of seven members who serve three-year terms with a maximum of three consecutive terms. Page 19
24 FINANCIAL & OPERATING DATA System Expenses RTS s annual operating expenses have been increasing since 2003, climbing from $990,160 in 2003 to $1,585,624 in 2007 (see Figure 3-2). This is an average annual increase of approximately 12.6 percent. Annual capital costs held relatively steady at around $100,000 from 2003 to 2005 before increasing to well above $500,000 in 2006, and then to $1,919,236 in 2007 (see Figure 3-2). The sharp increase in capital spending in 2007 was due to the procurement of a new fleet storage facility. Figure 3-2 System Expense $2,500,000 $2,000,000 $1,500,000 $1,000,000 $500,000 $ Operating Expense Capital Expense System Revenues (By Source) Like most transit systems, the services operated by RTS rely heavily on a variety of funding sources to cover annual operating expenses. In addition to farebox revenue, RTS receives local, state, and federal assistance. Advertising is also a steady revenue source for RTS. Farebox revenue, in terms of total dollars, experienced an overall increase between 2003 and 2007, climbing from $215,469 in 2003 to $325,191 in 2007 (see Figure 3-3). Passenger fares as a percentage of total revenues have held fairly steady between 2003 and 2007 at 20 percent in 2003 to 21 percent in Local assistance, in terms of total dollars, experienced a substantial increase between 2003 and 2007, climbing from $351,171 in 2003 to $939,173 in 2007 (see Figure 3-3). As a percentage of total revenues, local funds remained constant at approximately 30 percent between 2003 and Page 20
25 State assistance, in terms of total dollars, remained constant at $28,425 between 2003 and State assistance, as a percentage of total revenues, exhibited a slight decrease between 2003 and 2007, falling from 3 percent in 2003 to 1 percent in Federal assistance experienced an overall increase between 2003 and 2007, climbing from $456,645 in 2003 to $2,212,071 in 2007 (see Figure 3-3). As a percentage of total revenues, federal assistance increased from 45 percent in 2003 to 63 percent in Figure 3-3 System Revenues (Total Dollars) $2,500,000 $2,000,000 $1,500,000 $1,000,000 $500,000 $ Fare Revenue Local Assistance Federal Assistance State Assistance System Performance (Fixed-Route Only) The ridership of RapidRide, the fixed route service of the RTS system, experienced an overall increase between 2003 and 2007, rising from 145,823 in 2003 to 217,617 in 2007, for an approximate average annual increase of 12 percent. The revenue miles of RapidRide have experienced an overall increase since 2003, rising from 143,915 in 2003 to 200,549 in 2007, for an overall gain of 39 percent. The revenue hours of RapidRide have experienced an overall increase since 2003, rising from 11,044 in 2003 to 15,562 in 2007, for an overall gain of 41 percent. Passenger Boarding Passenger boarding and alighting data collected from a sample survey conducted in February 2008 is portrayed in the following charts. The on and off activity for a full day s schedule is shown by route segments, with each segment about one-half mile in length. As all transit routes begin and end at the MBTC, the stops shown in the graphs that follow are the transit stops with the highest passenger boarding and alighting activity. Page 21
26 Route 1 Excluding the MBTC, the main origin and destination for riders on RapidRide Route 1A is the Rushmore Mall and nearby stops. This route shows steady ridership along most of its way, with a decrease at the stops near the end if the line. Figure Route 1A 13 On Off Barber Center Haines Ave to North Street Anamosa St to Maple Ave Haines Ave to Anamosa St Anamosa St to LaCrosse St LaCrosse St to Disk Dr Rushmore Mall Disk Dr to Haines Ave Anamosa St to West Blvd Haines Ave to Anamosa St Route Travels in this Direction Daily Segment Activity West Blvd to North St North St to 8th St Barber Center The main origin and destination for riders on RapidRide Route 1B is also the Rushmore Mall area. This route has reasonable ridership along most of its length. Figure Route 1B On Off Barber Center 8th St to Haines Ave Haines Ave to Anamosa St Haines Ave to Disk Dr Haines Ave through Lakota Rushmore Mall Mall to LaCrosse St Anamosa St to Maple St La Crosse St to Anamosa St Anamosa Ave to Haines Ave Route Travels in this Direction Daily Segm ent Activity Haines Ave to North St 5th St to Omaha St Barber Center Page 22
27 Route 2 On RapidRide Route 2A, the main origin and destination for riders is the Wal-Mart. This route has strong ridership along most of its length Figure 3-6 Route 2A On Off Barber Center St Joseph St to Maple St St Joseph to St Patrick Cambell St to Omaha St North St to La Crosse St La Crosse St to Walmart Anamosa St to Maple Ave Maple Ave to New York St Route Travels in this Direction Daily Segm ent Activity New York St to 5th St 5th St to Main St Barber Center The main origin and destination for riders on RapidRide Route 2B is the Wal-Mart. This route has reasonable ridership along most of its length. Figure 3-7 Route 2B On Off Barber Center New York St to East Blvd East Blvd to Milwakee St Milwakee St to Anamosa St Wal-Mart La Crosse St to North St North St to Cambell St Cambell St to Omaha St St Joseph St to East Blvd Cambell St to St Patrick St Route Travels in this Direction Daily Segm ent Activity St Joseph St Main St Barber Center Page 23
28 Route 3 Ridership on Route 3A is fairly evenly distributed the length of the route. Figure 3-8 Route 3A On Off Barber Center Mt Rusmore Rd to St Patrick St St. Patrick St to 5th St 5th St to Fairmont Blvd 5th St to Minnesota St Minnesota St to Elm St Elm St to Fairmont Blvd Elm Ave at St Patrick St St Patrick St to St Joseph St Route Travels in this Direction Daily Segm ent Activity St Joseph to East Blvd Main St to 6th St Barber Center Ridership peaks slightly throughout the middle of Route 3B, including the major medical facilities. Figure Route 3B On Off Barber Center St Joseph St to East Blvd St Joseph St to St Patrick St St Patrick St to Elm St Elm St to Fairmont Blvd Elm St to Minnesota St Minnesota St to 5th St 5th St to Fairmont Fairmont to Mt Rushmore Rd Route Travels in this Direction Daily Segment Activity Mt Rushmore Rd to St Patrick St Mt Rushmore Rd to St Joseph St Barber Center Page 24
29 Route 4 High points of passenger boarding and alighting activity on RapidRide Route 4A occur at the Black Hills Workshop and Training Center. Figure 3-10 Route 4A On Off Barber Center Main St to Jackson Blvd Jackson Blvd to Canyon Lk Dr Jackson Blvd to Sheridan Lake Rd Canyon Lk Dr to Soo San Dr Soo San Dr to Main St Main St to Sheridan Lk Rd St. Joseph St to Mt. Rushmore Rd Canyon Lk Dr adjacent to Mtn Vi.. Route Travels in this Direction Daily Segment Activity Barber Center The main origin for riders on RapidRide Route 4B is the Black Hills Workshop and Training Center. Ridership along this route is limited. Figure 3-11 Route 4B On Off Barber Center Main St to Mtn View Rd Canyon Lk Dr to Sheridan Lk Rd Main St to Soo San Dr Soo San Dr to Canyon Lk Dr Canyon Lk Drive to Jackson Blvd Jackson Blvd to Central Blvd Via Sheridan Lk Rd to Jackson... Jackson Blvd to Main St St Joseph St to Mt Rushmore Rd Barber Center Route Travels in this Direction Daily Segment Activity Page 25
30 Route 5 High points of passenger boarding and alighting activity on RapidRide Route 5A occur at transit stops located near retail shopping areas. Figure 3-12 Route 5A 18 8 On Off Barber Center West Blvd to North St West Blvd to Anamosa St Explorer St to Haines Ave Knollwood Dr to Maple Ave Maple Ave to Anamosa St Maple Ave to Adams Milwakee St to North St Waterloo St to Omaha St Route Travels in this Direction Daily Segment Activity Omaha St to East Blvd Main St to 6th St Barber Center High points of passenger boarding and alighting activity on RapidRide Route 5B occur at Star Village. Figure 3-13 Route 5B On Off Barber Center To 11th Street West Blvd to St Patrick St Mt Rushmore Rd at St Francis Mt Rushmore to Fairmont St Fairmont St to 5th St 5th St to St Patrick 5th St to East Blvd Route Travels in this Direction Daily Segm ent Activity East Blvd to Main St Main St to 6th St Barber Center Page 26
31 Based on this sample, the top 10 bus stops are identified in Table 3-5. Table 3-5 Top 10 Most Active Bus Stops Rank Route Segment On Off Total 1 2A La Crosse Street to Wal-Mart A Wal-Mart B 5th Street to East Boulevard A Rushmore Mall B North Street to La Crosse Street B St. Joseph Street to Maple Street B La Crosse Street to North Street A 5th Street to Fairmont B Elm Street to Minnesota Street B Soo San Drive to Canyon Lake Drive System Trends This section examines the operating and financial indicators of efficiency over a five-year time period, from FY 2003 to FY This historical evaluation is useful to identify trends in system performance, as well as determining the causes of performance fluctuations. Table 3-6 displays the total expenses for RTS for the years 2003 through During this fiveyear period, operating expenses have gone up at a moderate pace, whereas capital expenses have gone up dramatically, particularly in the last two years, due to the acquisition of a renovated storage facility. Table 3-6 RTS Expense Trends, Percent Change Operating Expense $990,160 $1,080,658 $1,236,122 $1,316,858 $1,585,624 60% Capital Expense $95,586 $102,522 $113,667 $537,020 $1,919, % Total $1,085,746 $1,183,180 $1,349,789 $1,853,878 $3,504, % Source: City of Rapid City Table 3-7 displays the total revenues for RTS for the years 2003 through During this five-year period, federal assistance increased by 351 percent, local assistance increased by 167 percent, and state assistance remained constant. Page 27
32 Table 3-7 RTS Revenue Trends, Percent Change Fare Revenue $215,469 $242,457 $251,726 $270,344 $325,191 51% Federal Assistance $490,681 $528,314 $612,994 $1,067,323 $2,212, % State Assistance $28,425 $28,425 $28,425 $28,425 $28,425 0% Local Assistance $351,171 $383,984 $456,645 $479,832 $939, % Total Expense $1,085,746 $1,183,180 $1,349,789 $1,853,878 $3,504, % Source: City of Rapid City Table 3-8 presents a summary of the core operating data for RTS transit services between 2003 and In total, the RTS system has expanded between 2003 and Revenue miles increased 45 percent from 2003 to 2007, indicating an increase in service during these five years. Correspondingly, passenger trips have increased by 43 percent during the same period, from 213,953 in 2003 to 306,620 in Fixed route passenger trips per mile have increased by 17 percent from 2003 to 2007 while Dial-A-Ride trips per mile have decreased by 19 percent. Table 3-8 RTS Operating Statistics Trends, TOTAL SYSTEM FIXED ROUTE DIAL-A- RIDE Percent Change Passengers 213, , , , ,620 43% Miles 317, , , , ,800 45% Trips/Mile % Percent Change Passengers 143, , , , ,540 51% Miles 164, , , , ,678 30% Trips/Mile % Percent Change Passengers 70,038 75,909 80,127 82,824 89,003 27% Miles 162, , , , ,635 56% Trips/Mile % Nearly 70 percent of RTS s operating expenses are associated with labor costs. The maintenance and operation (fuel and supplies) of the fleet represent approximately 18 percent of the annual operating costs (see Table 3-9). Page 28
33 Table 3-9 RTS Operating Expenses, 2007 Operating Expense Item Total Expense Percent of Total Personnel (salaries, wages, & fringe benefits) $1,078, % Professional Services $139, % Insurance $29, % Maintenance $101, % Fuel and Supplies $190, % Rentals $28, % Other 1 $17, % Total Expenses $1,585, % Source: City of Rapid City, 2007 Operation Statistics. Table 3-10 displays the core operating and revenue data for RTS Fixed Route transit service between 2003 and Farebox revenue has almost doubled, while ridership has increased by half over this period. Table 3-11 displays the core operating and revenue data for RTS Dial-A-Ride transit service between 2003 and Both ridership and farebox revenue have increased by approximately 25 percent over this period. Table 3-10 RTS RapidRide Fare Revenue Trends, Percent Change Passengers 143, , , , , % Fare Revenue $97,272 $105,621 $114,753 $122,818 $177, % Table 3-11 RTS Dial-A-Ride Fare Revenue Trends, Percent Change Passengers 70,038 75,909 80,127 82,824 89, % Fare Revenue $118,197 $136,837 $136,973 $147,526 $148, % 1 Includes advertising, travel, utilities, interdepartmental charges, and miscellaneous items. Page 29
34 Table 3-12 summarizes the revenues and expenses for RTS Dial-A-Ride services in Fixed route services account for the majority of passenger trips (71%) and over half of the total fare revenues (54%) for the RTS system. More than half of the operating expenses (55%) are incurred in the provision of Dial-A-Ride service, which accounts for less than 30 percent of the total passenger trips. Table 3-12 RTS Revenue and Expense Summary, 2007 RapidRide Dial-A-Ride Total System Passengers 217,617 89, ,620 Fare Revenues $177,015 $148,176 $325,191 Miles of Service 200, , ,184 Operating Expense $711,419 $874,205 $1,585,624 Source: City of Rapid City Facility Inventory This section describes the capital program for RTS s transit services. It presents an inventory of the current RTS vehicle fleet and primary operating facilities. Fleet Inventory Table 3-13 shows the characteristics of the current RTS vehicle fleet. There are a total of 26 vehicles in the RTS fleet, including 7 large buses (fixed route service), 2 trolleys, and 17 smaller buses (Dial-A-Ride service). Most of the fleet is less than five years old, and the average vehicle mileage is approximately 56,800. Table 3-13 RTS Current Active Fleet Make and Model Year Bus Number Seating Capacity Mileage RapidRide GMC - Glaval , or ,150 GMC - Glaval , or ,670 GMC - Glaval , or ,811 GMC - Glaval , or ,584 GMC - Glaval , or ,510 GMC - Glaval , or ,635 GMC - Glaval , or ,430 Ford Supreme 2007 CV1 - trolley ,061 Ford Supreme 2007 CV2 - trolley ,073 Page 30
35 Make and Model Year Bus Number Seating Capacity Mileage Dial-A-Ride Ford Starcraft ,871 Ford Starcraft ,776 Ford Starcraft ,788 Ford Starcraft ,953 Ford Starcraft ,525 Ford Starcraft ,781 Ford Starcraft ,450 Ford ,105 Ford ,174 Ford Starcraft ,534 Ford Starcraft ,957 Ford Starcraft ,045 Ford Starcraft ,498 GMC Glaval New GMC Glaval New GMC Glaval New GMC Glaval New Source: City of Rapid City. Other Facilities The center of the RTS passenger operations is the MBTC, which was built in The facility is the primary transfer point and hub for transit service in the City of Rapid City. The facility contains offices for the RTS management, supervisors, dispatching, and ticketing as well as other office space, a barbershop, and common area for passengers. In addition to RTS, Jefferson Lines operates nationwide intercity bus service out of the facility. In 2008, RTS was able to move all vehicles to a renovated storage facility located at 760 Centre Street. The facility is approximately 1.6 miles from the MBTC. It has adequate indoor climate controlled storage space for the entire fleet, bus washing capability and a general purpose maintenance bay. PEER REVIEW The performance of the RTS system was compared and contrasted with the performance of a group of selected transit systems from around the region. The intent of the analysis was to see how RTS performs relative to some comparable cities and transit systems operating in similar environments with similar characteristics. Each peer comparison employs a variety of performance indicators, including cost efficiency, productivity and measures of cost effectiveness. The peer group for this review consists of six systems that were selected based on a variety of factors, including population, system size, service area, and climate. Operating and financial data for this comparison were taken from the 2006 National Transit Database (NTD), (most recent period for all systems reporting). Page 31
36 The following peer review cities were chosen: Cheyenne, Wyoming Sioux Falls, South Dakota Grand Forks, North Dakota Bismarck, North Dakota Sioux City, Iowa Billings, Montana For each performance measure, with exception of operating expense per capita and passenger trips per capita, RTS s RapidRide and Dial-A-Ride services were compared to their respective peer system counterparts rather than as a system total. Community Impact RTS has a low system-wide operating cost per capita compared to its peers (see below) and is providing service at a relatively low cost for the population size that it is serving. Figure 3-14 Annual Operating Expense per Capita Sioux Falls Billings Average Grand Forks Sioux City Bismark Rapid City Cheyenne $0 $5 $10 $15 $20 $25 $30 $35 $40 $45 $50 Page 32
37 Conversely, RTS is serving a lower number of passengers per capita in comparison to its peers. Although RTS is doing a good job at keeping operating costs per capita low, the net result is that service use is also low as measured by annual passenger trips per capita. Figure 3-15 Annual Passenger Trips per Capita Sioux City Billings Sioux Falls Average Grand Forks Rapid City Bismark Cheyenne Financial Efficiency RTS s RapidRide cost per mile is lower than the peer average. Figure 3-16 Operating Expense per Vehicle Revenue Mile (Fixed Route) Sioux City Grand Forks Billings Sioux Falls Average Rapid City Bismark Cheyenne $0.00 $1.00 $2.00 $3.00 $4.00 $5.00 $6.00 Page 33
38 Dial-A-Ride cost per mile is also lower than the peer average. Figure 3-17 Operating Expense per Vehicle Revenue Mile (Demand Response) Billings Cheyenne Sioux Falls Rapid City Average Sioux City Bismark Grand Forks $0.00 $1.00 $2.00 $3.00 $4.00 $5.00 $6.00 RTS s RapidRide cost per hour is lower than the peer average. Figure 3-18 Operating Expense per Vehicle Revenue Hour (Fixed Route) Sioux City Billings Grand Forks Sioux Falls Average Rapid City Bismark Cheyenne $0.00 $10.00 $20.00 $30.00 $40.00 $50.00 $60.00 $70.00 $80.00 Page 34
39 RTS s Dial-A-Ride cost per hour is lower than the peer average. Figure 3-19 Operating Expense per Vehicle Revenue Hour (Demand Response) Cheyenne Billings Sioux Falls Average Rapid City Bismark Sioux City Grand Forks $0.00 $10.00 $20.00 $30.00 $40.00 $50.00 $60.00 $70.00 RapidRide has the highest farebox recovery rate of any of its peer fixed-route systems (see below). Figure 3-20 Farebox Recovery (Fixed Route) Rapid City Sioux City Sioux Falls Average Cheyenne Grand Forks Billings Bismark 0% 5% 10% 15% 20% 25% Page 35
40 RTS s Dial-A-Ride farebox recovery rate is higher than the peer average. Figure 3-21 Farebox Recovery (Demand Response) Sioux City Billings Bismark Rapid City Average Sioux Falls Cheyenne Grand Forks 0% 5% 10% 15% 20% 25% 30% 35% 40% 45% Service Effectiveness The total number of RapidRide trips per hour is lower than the peer average. Figure 3-22 Passenger Trips per Revenue Hour (Fixed Route) Sioux City Billings Sioux Falls Average Rapid City Grand Forks Cheyenne Bismark Page 36
41 Rapid City has the highest trips per hour of any of its peer demand response systems. Figure 3-23 Passenger Trips per Revenue Hour (Demand Response) Rapid City Billings Bismark Grand Forks Average Sioux Falls Sioux City Cheyenne The number of trips per mile generated by RapidRide is above the peer average. Figure 3-24 Passenger Trips per Revenue Mile (Fixed Route) Sioux City Sioux Falls Billings Rapid City Average Grand Forks Cheyenne Bismark Page 37
42 Rapid City has the highest trips per mile of any of its peer demand response systems. Figure 3-25 Passenger Trips per Revenue Mile (Demand Response) Rapid City Billings Sioux City Average Bismark Sioux Falls Grand Forks Cheyenne Cost Effectiveness Rapid City has the lowest cost per trip of any of its peer fixed route systems. Figure 3-26 Operating Expenses per Passenger Trip (Fixed Route) Bismark Grand Forks Average Billings Sioux Falls Cheyenne Sioux City Rapid City $0.00 $1.00 $2.00 $3.00 $4.00 $5.00 $6.00 $7.00 $8.00 Page 38
43 RTS s Dial-A-Ride cost per trip is lower than the peer average. Figure 3-27 Operating Expenses per Passenger Trip (Demand Response) Cheyenne Sioux Falls Billings Average Rapid City Sioux City Bismark Grand Forks $0.00 $5.00 $10.00 $15.00 $20.00 $25.00 $30.00 RapidRide revenue per trip is relatively high and above the peer group average. Figure 3-28 Fare Revenue per Passenger Trip (Fixed Route) Sioux City Rapid City Grand Forks Average Sioux Falls Cheyenne Bismark Billings $0.00 $0.10 $0.20 $0.30 $0.40 $0.50 $0.60 $0.70 $0.80 Page 39
44 RTS s Dial-A-Ride revenue per trip is relatively low and below the peer average. Figure 3-29 Fare Revenue per Passenger Trip (Demand Response) Billings Sioux City Sioux Falls Average Bismark Rapid City Cheyenne Grand Forks $0.00 $0.50 $1.00 $1.50 $2.00 $2.50 $3.00 $3.50 $4.00 $4.50 $5.00 Page 40
45 The following figure shows how the overall Rapid City system compares to the peer cities in terms of the percentage of local service cost and passengers that is related to the respective fixed route and demand response components. Most of the peer cities spend a greater proportion of their total system cost on fixed route service than Rapid City does SERVICE TRENDS City Operating Expense Passenger Trips Rapid City Sioux Falls Sioux City Billings Page 41
46 2006 SERVICE TRENDS City Operating Expense Passenger Trips Bismark Cheyenne Grand Forks Page 42
47 Peer Review Summary RTS s RapidRide and Dial-A-Ride services operate at a very low per capita cost; however, RapidRide generates a low number of per capita trips in comparison to its peers. The conclusion to be drawn is that RTS is a financially efficient system. However, the level of fixed route service provided may not be sufficient to generate the level of ridership found in other communities. Both RapidRide and Dial-A-Ride services score very high for financial efficiency when compared to other peer systems. For cost per mile, cost per hour and farebox recovery, both RapidRide and Dial-A-Ride services are above the peer average, and in some instances are either the best performing or second best performing system. RapidRide service scores about average on service effectiveness as measured by passenger trips per hour and per mile, while its Dial-A-Ride service scores very high as compared to the other peer systems. RapidRide service scores high for cost effectiveness when compared to other peer systems. For cost per trip and revenue per trip, RapidRide service is above the peer average and is the best and second best performing respectively. The peer review analysis indicates clearly that the RTS is very efficient in producing transit services as compared to its peers within the region. The utilization of RTS service as measured by passengers per mile and per hour of service produced is extremely high for Dial-A-Ride and runs about average for fixed route comparisons. What also comes forward in the review is that the amount of service available per capita is quite low compared to peers. In many instances, this is an indication that unmet needs for fixed route services probably exist in the community. Page 43
48 NATIONAL RIDERSHIP TRENDS In addition to the peer group analysis, a review of national transit ridership trends was conducted, using information from the 2006 National Transit Database (NTD). These findings are presented here. Small-urbanized transit systems (between 50,000 and 200,000 population), make up 41 percent of all agencies reporting to the NTD. Over the last 10 years, small decreases in the farebox recovery ratio have occurred in small-urbanized areas. This is consistent with Rapid City s experience. Small-urbanized areas had a rate of increase for subsidy per passenger greater than for large urbanized areas. Demand response accounts for a substantial portion of the service provided in small-urbanized areas. From 1997 to 2006, there was no substantial change in fare revenues in small urbanized areas. Small-urbanized areas are more dependent on operating subsides than large urbanized areas. Nationwide, fare revenues account for less than 19 percent of operating funds for small-urbanized areas. In general, there was a sharp increase in Federal capital assistance per passenger from In small-urbanized areas, fare revenues typically comprise 19 percent of funding sources, with local assistance accounting for 22 percent, state assistance for 20 percent, Federal assistance for 25 percent, and other assistance of 14 percent. The most startling difference between national trends and Rapid City is in state support, with Rapid City state assistance at less than 2 percent of total revenues in Fare revenues account for approximately 15 percent of RTS funding (consistent with national trends), with local assistance at 31 percent, and Federal assistance at 52 percent (both greater than national trends). Federal funds account for more than 70 percent of all capital invested in small urbanized areas. Page 44
49 FEDERAL AND STATE POLICIES RTS is influenced by several different federal and state programs and policies. RTS participates in and is compliant with these various programs in order to maintain access to funding streams and perform its functions as a public agency in a responsive, legal, and safe manner. FTA REGULATIONS AND AUDITS As part of requirements to qualify for receipt of federal transit funding assistance, RTS must annually comply with and sign off on a list of congressionally and administratively mandated certifications and assurances. Failure to do so may result in both funding suspension and personal disciplinary action against key management. There are currently 23 areas of program compliance that must be certified. There is at least one additional area, transportation coordination, which may be added to this list in the near term. The current areas are as follows: 1. Legal Capacity 2. Financial Capacity 3. Technical Capacity 4. Satisfactory Continuing Control 5. Maintenance 6. Procurement 7. Disadvantaged Business Enterprise 8. Buy America 9. Suspensions and Debarments 10. Lobbying 11. Planning and Program of Projects 12. Title VI Compliance 13. Public Comment Process for Fare and Service Changes 14. Half Fare Policy 15. Americans with Disabilities Act 16. Charter Bus Rules 17. School Bus Rules 18. National Transit Database Submissions 19. Safety and Security 20. Drug-Free Workplace 21. Drug and Alcohol Program 22. Equal Employment Opportunity 23. ITS Architecture The FTA has the legal right to audit the books and practices of any funding recipient, including primary and secondary beneficiaries, at any time by law. The FTA is also required by law to conduct a biennial review of the agency s drug and alcohol program, and perform a full certification audit every three years, known as the Triennial Review. Page 45
50 RTS has undergone two Triennial Reviews since the last TDP was adopted. The most recent Triennial Review was conducted in August RTS was found to have only four minor deficiencies, all of which were corrected to the satisfaction of FTA before the end of the year These almost all involved inclusion of full certification and assurance language in operating and procurement contracts, as well as a deficiency in policy language covering negative-dilute retest policy in the Drug and Alcohol program. This level of deficiency finding was exceptionally low in comparison with the average for Triennial Reviews, and speaks very well for the success of compliance efforts by the agency. National Transit Database submissions represent one of the certifications, and represent a significant workload and effort to collect and report both operating and financial data by transit, with both routine partial data submissions during the year, and a comprehensive annual submission due each spring. RTS must submit two reports, for both the fixed route system and the demand-response system. Delay in the submissions, or incomplete or inaccurate data can automatically result in a suspension of funding and the start of legal actions against representatives of the agency. Because of the high priority given to this data by the FTA, since it controls funding allocations in the formula funding programs, no extensions or exceptions are usually allowed. Because of Homeland Security issues, safety and security are currently a high priority with the FTA in their reviews. An additional initiative that currently has national prominence is Human Services Transit and Transportation Coordination, an effort to promote cooperation and shared efficiencies between government providers of transportation services. This is exemplified by the federal United We Ride program as well as parallel state programs mandated by an Executive Order and the USDOT. With RTS being the primary transit provider for both regular route service and demand response in the region, little coordination is possible or required in this instance. Page 46
51 4. SYSTEM NEED ASSESSMENT STAKEHOLDER INTERVIEWS Direct interviews were conducted with several stakeholders from the community to gain insight on how well current transit services are meeting community needs and if there are new areas that transit should try to serve. Interviews were conducted in person or over the phone during March 2008 The following individuals were interviewed: Mayor Alan Hanks Councilman Ron Weifenbach Councilman Lloyd LaCroix Ms Shelly Shock Ms. Ellen Sylliaasen Ms. Nadine Zeller Ms. Joy Rehfield Mr. Mike Kenton SUMMARY OF COMMENTS The mix of transit services seems to be doing a pretty good job in the community. Overall impression is the system looks professional and is well managed. There are several areas that should be evaluated for expanded route service: Rapid Valley (includes connections to schools) Deadwood Avenue Rushmore Crossing Cabelas area North Haines area Lower income housing developments on periphery of town Page 47
52 Some better connections should be evaluated to longer distance destinations including: Rapid City Regional Airport Ellsworth Air Force Base Current route structure emphasizes east side of town, perhaps need more service on the west side for better balance. Generally, OK with the concept of fixed-route service operating in key parts of the community but demand response service needs to be available across the entire community Some people have been asking for service to operate later in the evening and more on weekends. The transfer/wait time in downtown tends to get pretty long for customers A downtown promotion zone (free or reduced fare) might be a good idea. Stakeholders and customers could use more information on services available, consider more advertising on TV and in the newspapers. Most users probably can t afford much more (with regard to a possible fare increase) Equipment seems to be pretty good Could use more shelters in town Cost of monthly bus pass is good deal Need to over come perception problem (that service is for elderly, disabled or low-income in town) If we could improve on directness of travel to better compete with car travel, we might attract new riders. DRIVER S INPUT SESSION A meeting was held with drivers from the RTS to gather input on operational needs. The session was held on March 18, 2008 from 6:30 to 7:30 pm at the CSAC Building. 12 drivers attended the session. SUMMARY OF COMMENTS All bus routes should be top priority in the city for snow and ice control (plowing and sanding) A/B system of routes appears to be confusing to lots of riders as they are never quite sure which route is running; possibility that this detracts from the overall safety of the system as customers tend to cross streets at the last minute, sometimes mid block, to reach the bus. Page 48
53 There is inconsistent spacing of bus stops along routes leading to passenger complaints Need a line painted on the curb or some other type of marking to let driver s know where to line up to match the wheelchair loading area at the bus stops. Customers asking for fixed route service to: Deadwood Avenue West Main Stevens High School Western Dakota Vo-Tech Rapid Valley Shelters that are not longer used for routes should be removed to reduce customer confusion North Street/East Boulevard North Shelter northbound on 5th is too close to the intersection at the Hospital Shelter on west side should be down by the flashing light Lakota Homes pick up should be switched to B lap instead of A : to eliminate traffic crossing issue. Can another hub be identified so not all routes have to come downtown Impacts of blockages by trains are very significant on schedules Drivers should have procedural training/books for what to do in emergency situations example of an elderly customer medical situation given where the driver was unsure of proper response. Can day passes be sold for visitors Any possibility of adding a step to assist elderly getting on the vehicles. Can drivers have a list of bus stops to give to customers The trolley should be hubbed out of the downtown area and not the MBTC. More information on who can use the trolley should be available in town. Perhaps trolley ticket can come with a discount to other merchant services in town. COMMUNITY INPUT SESSION Two (2) public meetings were conducted to gather input on: 1. March 18, 2008: 12:00 pm to 2:00 pm 2. March 18, 2008: 3:00 pm to 5:00 pm Page 49
54 Both sessions were held at the CSAC Building. Thirty-seven (37) individuals attended and singed in to the meetings. Staff from the City and RTS also attended. Comment cards were available for those that wanted to provide written comments (attached). Each session began with an overview of the meeting. Background information on the available transit services in Rapid City was also presented. The primary discussion topic of each session was how well are current transit services meeting the needs of the community. From that general theme, many service and operations changes were discussed: Areas served in town Time service is available Cost to users Information about services Facilities and equipment Destinations in town that should have the highest degree of regular route service Many positive comments regarding current services were received. SUMMARY OF COMMENTS Service Coverage Expand routes to cover Sheridan Lake Road and the Sandstone Ridge residential area Need weekend service (fixed route and demand response) Provide Sunday service at least from 8:00 am to noon Need service later in the evening (to 8:00 pm or 9:00 pm) (fixed route and demand response) Provide evening service at a minimum on Fridays and Saturdays (fixed route and demand response) Provide route to Canyon Lake Senior Citizen Center Need an east-west route connector running fully across the community (Ellsworth Air Force Base to west city limits) Will need route service to new mall (Rushmore Crossing) Need route service to Rapid Valley (at least to call center locations) Will need route service extension to new residential developments soon to be annexed area (east side) Page 50
55 Need route service to Western Dakota Vocational Technical School Need route service to Department of Motor Vehicles A second transfer point is needed (perhaps the mall) Expand routes to serve Eagle Ridge residential area Expand routes to serve North Rapid (Haines) residential areas Need to coordinate bus schedules better with school schedules to provide better access to Central High School Establish better coordination between all transportation providers in town to provide better after school options for youth (Boys & Girls Clubs, YMCA) Need route service to Industrial Park area Need route service to Deadwood Avenue Need to add a stop to Route 1B along Anamosa at Holcomb (long distance between current stops) Look at options to provide some degree of 24/7 service coverage through use of a private provider like Bismarck uses Consider opening demand response service to general public during evening hours Request to keep stop at Elm/East St. Anne if restructuring routes Operations Some drivers not keeping to routes (#5) Route service users understand increases in operating costs and would generally support increase in fares Demand response service users are aware of operating cost increase but are concerned that many users might have a tough time if fares increased. Should allow demand response users to change trip reservations within 4 hours of scheduled trip time if urgent situation arises (like poor weather). Consider using travel trainers/transit ambassadors to work with new customers to reduce confusion/fear over using services. Can list of individual bus stops be placed on web site (or made available in other forms)? Can a yearly transit pass be sold City should be working more with developers to incorporate plans for transit early on in developments Page 51
56 Look at patterns of demand response users to see if some of those trips can be shifted to more economical fixed route service Transit service information packets should be available at locations across the city Key Destinations for Fixed Route Service The following locations were identified as places that should have the highest degree of fixed route service in the community: Downtown retail areas Library Post office Civic Center Hospitals and medical centers Department of Social Services Black Hills Workshop Senior centers Shopping centers (malls, neighborhood centers, and major stand-alone stores) Entertainment centers (restaurants, movie theaters) Page 52
57 5. SERVICE OPTIONS The current route structure and schedules have some several significant shortcomings. The 35-minute frequency is not a multiple that can easily be comprehended by customers. The A-B alternating route configurations are not exact mirror images of each other and are viewed as confusing by new and existing customers. The hubbed route configuration requires through riders to transfer downtown and endure on average an 8-minute layover at the MBTC. The pulsed schedule requires all buses to wait for each other before departing on the next scheduled trip. The TDP considered several options to reconfigure the fixed route portion of the service. The overall goal for the development of service options was to improve the travel time and level of convenience for the regular route system in order to improve services for current riders and attract more choice and general public riders. Before undertaking the evaluation of service options, several service planning strategies were developed to help guide that effort. SERVICE PLANNING STRATEGIES 1. Consolidate two or more high-ridership routes into a run-through configuration. Extended route would cover as much of the city as possible within the schedule allowance (example: Rushmore Mall to Medical Center) with one route, with two buses assigned to run in opposing directions. 2. Overlap routes in the community to enable route crossings or meets in other parts of city outside of downtown thereby maximizing the number of inter-route transfer points to ultimately shorten trips and improve travel options. 3. Reduce layover time to no more than 15 per cent of the operating schedule. Routes meeting at the MBTC should operate as much as possible as timed transfers. 4. Routes should be configured as bi-directional service, with minimized route deviations by directions or time of day. 5. Route coverage in core areas should result in three blocks or less walking distance to bus routes with service frequency of once per hour or better on the regular route. 6. Service headways should be multiples of 30 or 60 minutes to allow for repeating schedule offsets throughout the day. 7. Evaluate the costs and benefits of expanded service for evenings and weekends. 8. Consider using Dial-A-Ride for low-ridership route segments and service during fringe periods (i.e., evenings) with same-day or short-response calls. 9. Reduce reliance on using existing MBTC bus bays for all route connections as the current pull-in/back-out configuration hinders operations. During pull-outs, this movement requires buses to back up and to leave in sequence. The configuration also hinders use of wheelchair lifts and restricts accessibility. 10. Look for opportunities to serve emerging development areas in Rapid City. Page 53
58 The key analysis assumptions were as follows: An annual population growth rate of 1.5 percent for the city per estimate of 2030 population. This rate is used to estimate annual system ridership changes if no significant service changes are implemented. System costs will increase 5.9 percent from 2008 to 2009 based on recent budget proposals. Beyond that, costs are estimated to increase 4.0 percent each year through 2013 based on recent trends. A fare increase of 50 percent was assumed since no fare increase has been implemented in 16 years. Ridership may potentially decrease initially in response to any fare increase. A one-time drop of 5 percent was included to present the anticipated worst-case budget estimates. Fixed Route Alternative 1: Maintain Existing Routes Under this alternative, there would be no significant route or schedule changes. The case for maintaining the existing service can be made as the system has reversed the downward ridership trend from the early years of the decade and added a fifth route to the core service area. The route structure would be as shown on Figure 5-1. Figure 5-1 Page 54
59 The estimated costs to operate the fixed route and demand response services for the period 2009 through 2013 are shown in Table 5-1. The costs do not anticipate any service changes from current levels. The ridership estimates do anticipate continued growth in the system at the rate of growth of the community population but do account for a modest drop in the initial year following a suggested fare increase. The suggested fare increase allows the system farebox recovery level to climb from the anticipated 2008 level of 25 percent to 29 percent by 2011 if the modest growth in ridership is achieved. The cost to extend existing route service to evenings and weekends and to offer demand response was also evaluated. The costs were based on the following service scenarios: Weekday evening service offered initially two days per week (perhaps Wednesday and Friday) for three hours beyond the current close of service. Weekend service offered initially one day per week (most likely Saturday before Sunday) for a period of eight hours. The costs, ridership and revenue estimates for evening, weekend and combined service are presented in Tables 5-2 through 5-4. Table 5-1 Existing Service with 12 Weekday Service Hours per Route 2008 (est) Fixed Route Costs $629,551 $666,695 $693,362 $721,097 $749,941 $779,938 Demand Response Costs $984,693 $1,042,790 $1,084,501 $1,127,882 $1,172,997 $1,219,917 Total Costs $1,614,244 $1,709,484 $1,777,864 $1,848,978 $1,922,937 $1,999,855 Fixed Route Ridership 235, , , , , ,325 Demand Response Ridership 93,272 92,998 94,393 95,809 97,246 98,705 Total Ridership 329, , , , , ,029 Fixed Route Revenue $238,294 $275,113 $279,239 $283,428 $287,679 $291,994 Demand Response Revenue $172,236 $201,899 $204,927 $248,001 $251,721 $255,497 Total Revenue $410,530 $477,011 $484,167 $531,429 $539,401 $547,492 Net Cost $1,203,714 $1,232,473 $1,293,697 $1,317,549 $1,383,537 $1,452,363 Farebox Recovery 25% 28% 27% 29% 28% 27% Page 55
60 The cost estimate to operating limited evening service (two days per week, three hours per day) using the existing route structure is shown in Table 5-2: Table 5-2 Existing Service with 12 Weekday Service Hours per Route plus Limited Evening Service Fixed Route Costs $733,364 $762,699 $793,206 $824,935 $857,932 Demand Response Costs $1,147,069 $1,192,952 $1,240,670 $1,290,296 $1,341,908 Total Costs $1,880,433 $1,955,650 $2,033,876 $2,115,231 $2,199,840 Fixed Route Ridership 236, , , , ,139 Demand Response Ridership 97,183 98, , , ,146 Total Ridership 333, , , , ,286 Fixed Route Revenue $287,493 $291,805 $296,182 $300,625 $305,134 Demand Response Revenue $210,984 $214,149 $259,162 $263,049 $266,995 Total Revenue $498,477 $505,954 $555,344 $563,674 $572,129 Net Cost $1,381,956 $1,449,696 $1,478,533 $1,551,557 $1,627,712 Farebox Recovery 27% 26% 27% 27% 26% Net Cost Above Base Ridership Above Base Net Cost per New Rider $149,483 $155,999 $160,984 $168,021 $175,348 14,374 14,590 14,809 15,031 15,256 $10.40 $10.69 $10.87 $11.18 $11.49 Page 56
61 The cost estimate to operating limited evening service (two days per week, three hours per day) using the existing route structure is shown in Table 5-3: Table 5-3 Existing Service with 12 Weekday Service Hours per Route plus Saturday Fixed Route Costs $755,587 $785,811 $817,243 $849,933 $883,930 Demand Response Costs $1,181,829 $1,229,102 $1,278,266 $1,329,396 $1,382,572 Total Costs $1,937,416 $2,014,912 $2,095,509 $2,179,329 $2,266,502 Fixed Route Ridership 238, , , , ,822 Demand Response Ridership 97,834 99, , , ,837 Total Ridership 336, , , , ,659 Fixed Route Revenue $289,418 $293,760 $298,166 $302,639 $307,178 Demand Response Revenue $212,398 $215,584 $260,898 $264,811 $268,783 Total Revenue $501,816 $509,343 $559,064 $567,450 $575,961 Net Cost $1,435,600 $1,505,569 $1,536,445 $1,611,880 $1,690,541 Farebox Recovery 26% 25% 27% 26% 25% Net Cost Above Base $203,127 $211,872 $218,896 $228,343 $238,178 Ridership Above Base 16,610 16,859 17,112 17,369 17,630 Net Cost per New Rider $12.23 $12.57 $12.79 $13.15 $13.51 Page 57
62 The cost estimate to operating limited evening service (two days per week, three hours per day) using the existing route structure is shown in Table 5-4: Table 5-4 Existing Service with 12 Weekday Service Hours per Route plus Limited Evening plus Saturday Fixed Route Costs $822,257 $855,147 $889,353 $924,927 $961,924 Demand Response Costs $1,286,108 $1,337,552 $1,391,054 $1,446,696 $1,504,564 Total Costs $2,108,364 $2,192,699 $2,280,407 $2,371,623 $2,466,488 Fixed Route Ridership 248, , , , ,636 Demand Response Ridership 102, , , , ,279 Total Ridership 350, , , , ,915 Fixed Route Revenue $301,798 $306,325 $310,920 $315,584 $320,318 Demand Response Revenue $221,483 $224,805 $272,058 $276,138 $280,281 Total Revenue $523,281 $531,131 $582,978 $591,723 $600,598 Net Cost $1,585,083 $1,661,568 $1,697,429 $1,779,900 $1,865,889 Farebox Recovery 25% 24% 26% 25% 24% Net Cost Above Base Ridership Above Base Net Cost per New Rider $381,369 $429,095 $403,731 $462,351 $482,353 21,315 36,241 36,784 37,336 37,896 $17.89 $11.84 $10.98 $12.38 $12.73 Page 58
63 Fixed Route Alternative 2: Revise Existing Routes Under this alternative, there would be significant route and schedule changes implemented following the service planning strategies previously identified. A number of route configuration options were considered and tested in the field before selecting the following route structure for possible implementation. The proposed routes are shown in Figures 5-2 through 5-6. Figure 5-2 Page 59
64 Figure 5-3 Page 60
65 Figure 5-4 Page 61
66 Figure 5-5 Page 62
67 Figure 5-6 Page 63
68 Figure 5-7 Page 64
69 The cost to implement the revised route structure for weekday service along with the expected ridership and resulting revenues are shown in Table 5-5. The costs for weekday service are the same as would be expected to continue operating the existing routes but the ridership is expected to grow under the new route configuration because of reductions in customer travel times and increased number of daily bus trips resulting from the schedule modifications. Under this alternative, the system farebox recovery level is expected to be around the 30 percent level for all years of the TDP incorporating the proposed fare increase. Table 5-5 Revised Routes Weekday Service 2008 (est) Fixed Route Costs $629,551 $666,695 $693,362 $721,097 $749,941 $779,938 Demand Response Costs $984,693 $1,042,790 $1,084,501 $1,127,882 $1,172,997 $1,219,917 Total Costs $1,614,244 $1,709,484 $1,777,864 $1,848,978 $1,922,937 $1,999,855 Fixed Route Ridership 235, , , , , ,349 Demand Response Ridership 93,272 92,998 95,337 96,767 98,219 99,692 Total Ridership 329, , , , , ,041 Fixed Route Revenue $238,294 $308,097 $315,846 $320,584 $325,392 $330,273 Demand Response Revenue $172,236 $201,899 $206,977 $250,481 $254,239 $258,052 Total Revenue $410,530 $509,996 $522,823 $571,065 $579,631 $588,326 Net Cost $1,203,714 $1,199,488 $1,255,041 $1,277,913 $1,343,306 $1,411,529 Farebox Recovery 25% 30% 29% 31% 30% 29% Page 65
70 The cost and benefits of implementing limited evening and weekend service along with the proposed routes restructuring were also evaluated. The results are presented in Tables 5-6 through 5-8. Table 5-6 Revised Routes with Evening Service Fixed Route Costs $733,364 $762,699 $793,206 $824,935 $857,932 Demand Response Costs $1,147,069 $1,192,952 $1,240,670 $1,290,296 $1,341,908 Total Costs $1,880,433 $1,955,650 $2,033,876 $2,115,231 $2,199,840 Fixed Route Ridership 259, , , , ,335 Demand Response Ridership 97,183 99, , , ,178 Total Ridership 356, , , , ,513 Fixed Route Revenue $321,962 $330,059 $335,010 $340,035 $345,136 Demand Response Revenue $210,984 $216,291 $261,753 $265,679 $269,665 Total Revenue $532,946 $546,350 $596,763 $605,714 $614,800 Net Cost $1,347,487 $1,409,301 $1,437,113 $1,509,517 $1,585,040 Farebox Recovery 28% 28% 29% 29% 28% Net Cost Above Base $147,999 $154,259 $159,200 $166,210 $173,511 Ridership Above Base 15,366 15,752 15,989 16,228 16,472 Net Cost per New Rider $9.63 $9.79 $9.96 $10.24 $10.53 Rapid City Transit Development Plan
71 Table 5-7 Revised Routes with Saturday Service Fixed Route Costs $755,587 $785,811 $817,243 $849,933 $883,930 Demand Response Costs $1,181,829 $1,229,102 $1,278,266 $1,329,396 $1,382,572 Total Costs $1,937,416 $2,014,912 $2,095,509 $2,179,329 $2,266,502 Fixed Route Ridership 261, , , , ,200 Demand Response Ridership 97, , , , ,876 Total Ridership 359, , , , ,075 Fixed Route Revenue $324,118 $332,270 $337,254 $342,313 $347,447 Demand Response Revenue $212,398 $217,739 $263,506 $267,459 $271,471 Total Revenue $536,516 $550,009 $600,760 $609,772 $618,918 Net Cost $1,400,900 $1,464,903 $1,494,748 $1,569,557 $1,647,584 Farebox Recovery 28% 27% 29% 28% 27% Net Cost Above Base $201,411 $209,862 $216,835 $226,251 $236,054 Ridership Above Base 17,756 18,203 18,476 18,753 19,034 Net Cost per New Rider $11.34 $11.53 $11.74 $12.06 $12.40 Table 5-8 Revised Routes with Evening and Saturday Service Fixed Route Costs $822,257 $855,147 $889,353 $924,927 $961,924 Demand Response Costs $1,286,108 $1,337,552 $1,391,054 $1,446,696 $1,504,564 Total Costs $2,108,364 $2,192,699 $2,280,407 $2,371,623 $2,466,488 Fixed Route Ridership 272, , , , ,185 Demand Response Ridership 102, , , , ,362 Total Ridership 374, , , , ,547 Fixed Route Revenue $337,983 $346,483 $351,680 $356,955 $362,310 Demand Response Revenue $221,483 $227,053 $274,778 $278,900 $283,083 Total Revenue $559,466 $573,536 $626,458 $635,855 $645,393 Net Cost $1,548,898 $1,619,162 $1,653,948 $1,735,768 $1,821,095 Farebox Recovery 27% 26% 27% 27% 26% Net Cost Above Base $349,410 $364,121 $376,035 $392,461 $409,565 Ridership Above Base 33,122 33,955 34,464 34,981 35,506 Net Cost per New Rider $10.55 $10.72 $10.91 $11.22 $11.54 Rapid City Transit Development Plan
72 REVENUE ANALYSIS There has been no fare increase for the RTS in some 16 years. Since that time, the cost of operations has grown dramatically because of increased labor, fuel and maintenance costs. In recent times, operating costs have been significantly affected by rapidly rising fuel costs. In the first half of 2008, the cost of fuel for RTS increased over 50 percent from the previous year. Around the region, many systems have already adopted or are planning for fare increases to respond to the rapidly changing operating costs. As a result, the TDP considered options to increase the user fares across the system. After evaluating many options, the Fare Alternative 1 was developed for consideration. Fare Alternative 1 The alternative incorporates several significant changes for RTS. First, a $0.50 increase in the single ride fixed route fare is suggested. That results in an increase of $0.25 in the senior fare. The fixed route monthly pass is suggested to increase by $5.00 for both adults and students. For Dial-A-Ride, it is suggested that an increase be implemented that will result in the base fare being twice the fixed route base fare for the majority of users but that increase should be phased in along with the adoption of a zone system for Dial-A-Ride. The zone system is suggested to recognize that the cost of serving trips on the far edges of the community are very costly to provide and that users should be expected to pay a part of that additional cost. The definition of the zones is suggested to follow the ADA guidance for providing Dial-A-Ride service in that Zone 1 is suggested to be all areas in the community within 3/4-mile of the fixed route system. Zone 2 would then be all areas outside of 3/4-mile of the fixed route system out to the edges of the community. Exceptions could be made for key activity generators right along the boundaries if there is a need. Over 85 percent of the city population is within Zone 1 so the impacts are limited to a modest group. The shape of the zone structure is shown in Figure 5-7. Rapid City Transit Development Plan
73 Figure 5-8 To ease the impact of the fare increase and the zone system for Dial-A-Ride, it is suggested that the increase be phased in with the Zone 1 fare at $2.50 for 2009 and 2010 and then increase to twice the fixed route rate at $3.00 by The Zone 2 fare would be $0.50 more during each period. Another suggested modification is to offer an unlimited ride pass for Dial-A-Ride users as a means of convenience for regular users. It is recommended that the monthly rate be set at $90.00 and that would be accepted for Zone 1 and Zone 2 trips. Rapid City Transit Development Plan
74 6. SYSTEM PERFORMANCE MEASURES Performance measures are a routine, repeatable, and meaningful way to gauge the performance of the bus system and to allow the regular examination of performance trends. The following suggested measures reflect industry practice to gauge comparative travel performance, reliability and customer satisfaction. SERVICE PERFORMANCE MEASURES RapidRide: A. Subsidy per trip: Net cost of operations divided by ridership 1. System level: identify trends and perform peer group comparison 2. By route: comparable efficiency between routes B. Boardings per hour. Number of all boardings per revenue hour. 1. System level by month and year 2. Route level by month and year C. Total ridership (unlinked trips) 1. System-level trends by month and year 2. By individual route by month and year D. Schedule Adherence 1. Percentage of on-time trip starts 2. Percentage of on-time, late and early, on route. Measured by regular observation of supervisors, at randomly selected stops and times (ahead-of-schedule or hot running to be prohibited) E. Travel time record elapsed travel time between 6 pairs of representative O-D s within the City, including at least two transfer options (linked trips): 1. Reported beginning-to-end travel time and trends 2. Comparable travel time by Dial-A-Ride 3. Comparable travel time by car F. Road Failures and mechanical breakdowns by buses in service target of one per month or less. G. Number of Customer Complaints trend Rapid City Transit Development Plan
75 Dial-A-Ride: A. Subsidy per trip: 1. System level: identify trends 2. Compare to fixed route and peers B. Boarding per hour 1. System level, by month and year, including illustration of trends C. Total ridership 1. System level, by month and year, including trends D. Road Failures should be two per month or less. E. Number of customer complaints numbers and trend F. Percentage of no-shows 1. System level, by month and year, including trends While these measures are simple to maintain and use, staff directly involved in monitoring local transit performance should also avail themselves of the public records produced annually for the Federal Transit Administration s National Transit Database (NTD). These standardized reports are required of all public transit systems of all sizes and types throughout the United States and are the basis for distributing Federal Formula Funds (Program 5307) for annual capital and operating assistance. The statistics are particularly useful in looking at peer systems for comparisons and to equalize trends and measures across transition periods and system reconfigurations. The possible fixed route redesign could impact the Rapid City NTD reports in the coming years. Consolidating two of the loop routes into a single cross-city route would undoubtedly improve customer service and travel times by reducing the number of transfers. However, since ridership is counted by unlinked trips per federal standards (each segment of a trip using a transfer gets counted separately), this would reduce reported ridership even though the same number of people are traveling over the same number of miles. The NTD statistics will recognize the increase in passenger miles traveled per trip that result from the reduced trip count, and federal funding should be essentially unchanged. Rapid City Transit Development Plan
76 7. RECOMMENDATIONS Based on the review of current system performance and the assessment of community needs, the following recommendations are made for the Rapid City Transit Development Plan. SERVICE 1. Implement fixed routes in accordance with Route Alternative 2 by the end of first quarter Extend fixed-route service day, which is currently 6:30 am - 6:00 pm, to 6:30 am - 6:30 pm FARES 1. Modify RapidRide, single-ride fare structure in accordance with Fare Alternative 1 by January 1, Modify Dial-A-Ride single-ride fare structure in accordance with Fare Alternative 1 including graduated implementation of zone fare structure by January 1, Establish Zone 1 boundary as outside edge of 3/4 mile from fixed routes. Zone 2 boundary is the edge of the community. 3. Modify RapidRide monthly pass fare structure for adults and students in accordance with Fare Alternative 1 by January 1, Implement Dial-A-Ride monthly pass fare structure in accordance with Fare Alternative 1 by January 1, Sell one-day all you can ride passes targeted at visitors. OPERATIONS 1. Implement a pilot program to evaluate use of City staff to handle light vehicle maintenance activities. If successful, add up to 1.5 FTE for maintenance staffing. 2. Modify current staffing arrangement for daily bus cleaning to improve performance. If possible, add up to 1.0 FTE for cleaning at the storage facility or contract out for service. 3. Separate call-taker/dispatch functions from customer service functions by adding 1.0 FTE for customer service and general administrative needs for the system. 4. Set policy to standardize fixed route bus stops at eight per mile. 5. Provide route schedule and map information at all bus stops. 6. Build ADA wheelchair loading pads at all stops with shelters (minimum) and benches (desirable). Rapid City Transit Development Plan
77 7. Evaluate connections to local sidewalks, work with city to extend or connect sidewalks to bust stops where appropriate and not prohibitive in cost. 8. Review current city ordinance on placement of benches to clarify positioning, if needed. 9. Print pocket schedules for customer information for all routes and distribute at MBTC, onboard busses and at distribution outlets throughout the community as can be arranged. 10. Expand general marketing and advertising activities for RTS to reflect the need to inform customers of system information on an on-going basis. Annual budge expenditures in the 2 to 3 percent range of total operating costs are desirable. 11. Establish an extra board of available drivers for daily substitution by utilizing a rotating on-call procedure. 12. Ensure MBTC is open during all hours of fixed route operations. 13. Modify bus bays at MBTC to eliminate pull-in/back-out maneuver to improve safety and speed up operations. 14. Establish eastside and southside stops and canopies/shelters at MBTC for run through routes. 15. Expand deployment of on-board surveillance cameras to entire fleet to improve system security. 16. Upgrade fareboxes to handle new fare media (magnetic cards) to speed boarding and reduce revenue-handling costs. 17. Replace use of punch cards with magnetic card media. 18. Promote monthly passes through employers, with possible employer-paid discounts to support employee use. 19. Eliminate on-vehicle sales of monthly passes and punch cards to eliminate drivers from handling revenue. In conjunction with this, sell monthly cards through customer service outlets and mail order. 20. Expand deployment of automate vehicle location (AVL) technology to entire fleet to allow monitoring of operations and improving overall passenger and driver safety. 21. Implement next bus arrival information system at key fixed route bus stops with shelters utilizing AVL information. Consider testing concept at key locations as first step. 22. Modify website to reflect any new route schedule or fare information. 23. Advertise availability of information on in-town after hours services through 211 information line. Rapid City Transit Development Plan
78 24. Conduct regular (once per month) driver route checks on Dial-A-Ride services to ensure directness of service meets expectations. 25. Expand utilization of Dial-A-Ride scheduling software data reports. This may require training sessions on use of software tools. 26. Review Dial-A-Ride client certifications to ensure compliance with current eligibility standards. 27. Promote shifting some Dial-A-Ride trips to the regular route system where appropriate through promotion of lower fares and flexibility (possible rides the MBTC without advanced reservations or incentive.) 28. Conduct annual public/customer open house session to identify on-going needs and present overview of upcoming annual program and budget. 29. Revise route-naming conventions to incorporate more local identity. Ideas to connect more to the local area including using historical names such as presidents or explorers or natural environment features. 30. Move administrative staff and dispatch services to same facility as fleet to improve operations. Maintain customer service and street supervision activities at MBTC. 31. Work directly with city planning staff to identify transit service and operations needs related to new developments in town, as plans are still early in review. 32. Fixed routes should be identified as high priority for snow and ice removal activities. 33. Drivers should remain on their vehicles until all passenger transfers are completed during stops at MBTC. 34. City Public Works and transit staff should confer early on potential street closures that affect bus operations to allow reasonable time to plan detours and advise customers and driver. 35. Use transit ambassadors to help promote use and understanding of system components including routes and schedules, and use of regular routes in place of Dial-A-Ride. Rapid City Transit Development Plan
79 Additional Service Options to Consider for Implementation as Opportunities Become Available 1. Implement downtown shuttle concept using spare fleet or trolley on a trial basis following modification of fixed route system. Potential trial period from 11:00 a.m. to 1:00 p.m., Monday through Friday along main downtown corridors such as Main Street and St. Joe. Incorporate low price fare for the downtown shuttle as an introductory service concept. 2. Implement expanded weekday RapidRide and Dial-A-Ride service on a trial basis. Consider starting service two-days per week from 6:30 p.m. to 9:30 p.m. to gauge utilization patterns. 3. Implement Saturday fixed route service on a trial basis. Consider operation of service from 9:00 a.m. to 6:00 p.m., and adjusting Dial-A-Ride service to match those service hours. 4. Implement Park and Ride service concept on a trial basis to connect outlying parking area to activity center. Possible connections would relate to employment locations or local special events. 5. Implement long-distance service connection to Ellsworth Air Force Base or Rapid Valley Call Centers on a trial basis to provide connections to Rapid City. Rapid City Transit Development Plan
80 8. FINANCIAL PLAN This section of the TDP presents a comprehensive picture of anticipated cots and revenues associated with all of RTS s operations over the five year planning horizon. Current budget figures are the basis for future projections outlined below. Future operating cost projections are based on the number of service miles anticipated to result from proposed RapidRide route changes. The five-year capital plan is shown in Table 8-1. Assumptions used in developing the financial plan (presented in Table 8-2) are discussed below: An inflationary factor of our percent per year, consistent with recent trends. RTS ridership is anticipated to increase by 1.5 percent per year consistent with forecast rates of Rapid City population growth. User fares will change for RTS services. RapidRide fares will increase to $1.50 and Dial-A-Ride will use a zone-fare system. Dial-A-Ride fares will increase to $2.50 in Zone 1 until 2011 when those fares increase to $3.00. Dial-A-Ride fares will be $3.00 in Zone 2 until 2011 when those fares increase to $3.50. The anticipated local share of costs by year is presented in Table 8-3 as a summary of local fiscal impacts resulting from TDP implementation. Table 8-1 Capital Plan CAPITAL COST Replacement Vehicles for ADA Service $420,000 $200,000 $410,000 $210,000 $440,000 Trolley Purchase $135, Total Capital Cost $555,000 $200,000 $410,000 $210,000 $440,000 REVENUE FTA Capital Assistance $460,650 $166,000 $340,000 $174,300 $365,200 Local Funds $94,350 $34,000 $69,700 $35,700 $74,800 $555,000 $200,000 $410,000 $210,000 $440,000 Rapid City Transit Development Plan
81 Table 8-2 Financial Plan CAPITAL COST Operating Cost $1,709,484 $1,797,864 $1,848,978 $1,922,987 $1,999,855 Capital Projects $555,000 $205,000 $410,000 $210,000 $440,000 Total System Cost $2,264,484 $1,977,864 $2,258,978 $2,132,937 $2,439,855 REVENUE Federal Capital Assistance $460,650 $166,000 $340,300 $174,300 $365,200 Federal Operating Assistance $732,473 $750,062 $572,564 $795,741 $819,612 SD State Assistance Passenger Fares $509,996 $522,823 $571,065 $ $588,326 Local Capital Assistance $94,350 $34,000 $69,700 $35,700 $74,800 Local Operating Assistance $467,015 $504,979 $505,349 $547,565 $591,917 $2,264,484 $1,977,864 $2,258,978 $2,132,937 $2,439,855 Table 8-3 Total Local Assistance Capital Assistance $94,350 $34,000 $69,700 $35,700 $74,800 Operating Assistance $467,015 $504,979 $505,349 $547,565 $591,917 $561,365 $538,979 $575,049 $583,265 $666,717 Rapid City Transit Development Plan
82 Rapid City Transit Development Plan Prepared for: Rapid City Growth Management Department Prepared by: SRF Consulting Group, Inc.
83
84 TABLE OF CONTENTS 1. INTRODUCTION COMMUNITY CHARACTERISTICS EXISTING TRANSIT SERVICES AND FACILITIES SYSTEM NEED ASSESSMENT SERVICE OPTIONS SYSTEM PERFORMANCE MEASURES RECOMMENDATIONS FINANCIAL PLAN LIST OF TABLES Table 2-1 Population Density... 7 Table 3-1 RapidRide Route Length & Running Times Table 3-2 RapidRide Complete Loop Times and Layovers Table 3-3 RapidRide Route Length & Running Times Table 3-4 Average Transfers Per Day Table 3-5 Top 10 Most Active Bus Stops Table 3-6 RTS Transit System Expense Trends, Table 3-7 RTS Transit System Expense Trends, Table 3-8 RTS Operating Statistics Trends, Table 3-9 RTS Operating Expenses, Table 3-10 RTS RapidRide Fare Revenue Trends, Table 3-11 RTS Dial-A-Ride Fare Revenue Trends, Table 3-12 RTS Revenue and Expense Summary, Table 3-13 RTS Current Active Fleet Table 5-1 Existing Service with 12 Weekday Service Hours per Route Table 5-2 Existing Service with 12 Weekday Service Hours per Route plus Limited Evening Service Table 5-3 Existing Service with 12 Weekday Service Hours per Route Table 5-4 plus Saturday Existing Service with 12 Weekday Service Hours per Route plus Limited Evening Service and Saturday Table 5-5 Revised Routes Weekday Service Table 5-6 Revised Routes with Evening Service Table 5-7 Revised Routes with Saturday Service Table 5-8 Revised Routes with Evening and Saturday Service Table 8-1 Capital Plan Table 8-2 Financial Plan Table 8-3 Total Local Assistance... 77
85 LIST OF FIGURES Figure 2-1 Location... 3 Figure 2-2 Study Area... 4 Figure 2-3 Population Growth... 5 Figure 2-4 Low Income Population... 6 Figure 2-5 Population Density... 8 Figure 2-6 Urban Growth Area... 9 Figure 2-7 Elderly Population Figure 2-8 Youth Population Figure 2-9 Major Travel Generators Figure 3-1 RapidRide/Transit System Fixed Routes Figure 3-2 System Expense Figure 3-3 System Revenues (Total Dollars) Figure 3-4 Route 1A Ridership Figure 3-5 Route 1B Ridership Figure 3-6 Route 2A Ridership Figure 3-7 Route 2B Ridership Figure 3-8 Route 3A Ridership Figure 3-9 Route 3B Ridership Figure 3-10 Route 4A Ridership Figure 3-11 Route 4B Ridership Figure 3-12 Route 5A Ridership Figure 3-13 Route 5B Ridership Figure 3-14 Annual Operating Expense per Capita Figure 3-15 Annual Passenger Trips per Capita Figure 3-16 Operating Expense per Vehicle Revenue Mile (RapidRide) Figure 3-17 Operating Expense per Vehicle Revenue Mile (Dial-A-Ride) Figure 3-18 Operating Expense per Vehicle Revenue Hour (RapidRide) Figure 3-19 Operating Expense per Vehicle Revenue Hour (Dial-A-Ride) Figure 3-20 Farebox Recovery (RapidRide) Figure 3-21 Farebox Recovery (Dial-A-Ride) Figure 3-22 Passenger Trips per Revenue Hour (RapidRide) Figure 3-23 Passenger Trips per Revenue Hour (Dial-A-Ride) Figure 3-24 Passenger Trips per Revenue Mile (RapidRide) Figure 3-25 Passenger Trips per Revenue Mile (Dial-A-Ride) Figure 3-26 Operating Expense per Passenger Trip (RapidRide) Figure 3-27 Operating Expense per Passenger Trip (Dial-A-Ride) Figure 3-28 Fare Revenue per Passenger Trip (RapidRide) Figure 3-29 Fare Revenue per Passenger Trip (Dial-A-Ride) Figure 5-1 Rapid Transit System Fixed Routes Figure 5-2 Proposed RapidRide Transit Routes Figure 5-3 Proposed A/B Transit Route Figure 5-4 Proposed C Transit Route Figure 5-5 Proposed D Transit Route Figure 5-6 Proposed E Transit Route Figure 5-7 Proposed F Transit Route Figure 5-8 Demand Response Zones... 69
86 1. INTRODUCTION The purpose of this report is to present the results of tasks completed as part of the 2009 to 2013 Rapid City Transit Development Plan. This document establishes the community s existing conditions in terms of demographic trends, growth trends, and current transit services and performance. It also presents a comprehensive route-by-route summary of RapidRide s current fixed-route system, and compares Rapid Transit System performance to a select group of peer city transit systems. The characteristics of the community and analysis of transit system performance is compared against a backdrop of needs identified by Rapid City transit stakeholders at a series of preliminary listening sessions held in March This report concludes with a series of recommended goals and performance standards for the Rapid Transit System, which were developed from the community input sessions as well as technical analysis of system performance. The cornerstone of the plan is a service plan containing recommendations for restructuring RTS services. The financial implications for both capital and operational changes to RTS are also presented in the final chapter of this report Page 1
87 2. COMMUNITY CHARACTERISTICS This chapter presents an overview of the region s geographic, economic and residential characteristics. This information helps define the potential markets for transit service within the community. AREA DESCRIPTION Rapid City is the second largest city in the state of South Dakota. It is located in the foothills of the Black Hills and is the county seat of Pennington County. The city serves as a regional center for a large geographic area including portions of Wyoming, Nebraska, North Dakota, Montana and South Dakota (see Figure 2-1). In Rapid City, the Rapid Transit System (RTS) serves the metropolitan area carrying more than 215,000 passenger trips annually on a total of five fixed routes, and demand response service is provided for those who need curb-to-curb transit service. Ridership on Dial-A-Ride in 2007 was almost 90,000 trips. The study area for the transit analysis is shown in Figure 2-2. DEMOGRAPHIC CHARACTERISTICS This section profiles the demographic and socio-economic characteristics of Rapid City. These factors influence the overall need for transit service in the community and are often indicators of potential use. Population Trends Since the 2000 Census, the population of Rapid City has grown almost 10 percent with (2006 estimates putting the population at 65,398. Future estimates suggest that the city s population will continue to grow steadily. The 2010 population is expected to reach 69,383 and estimates for 2025 project the population to reach 79,006 (see Figure 2-3). Rapid City experienced its fastest rate of growth between 1940 and 1960, which coincides with the opening of Ellsworth Air Force Base. From 1960 to 1980, population growth was relatively flat. Between 1980 and 1990, Rapid City experienced a significant growth spurt of 18.6 percent and between 1990 and 2000, the population grew by 9.3 percent. Page 2

88 +, 87 +, 191 Montana +, 2!"# 94 +, 85 +, 52 North Dakota Bismarck Fargo +, 75 +, 59 +, 10 +, 89!"# 90 +, 310 Billings +, 12 +, 212 +, 13!"# 29 J:\Maps\6331\mxd\fig2_1_Rapid_City_location.mxd +, 16 +, 26 +, 189 +, 287 Utah!"# 70 +, 40!"# 80 RAPID CITY, SOUTH DAKOTA AND VICINITY RAPID CITY TRANSIT DEVELOPMENT PLAN Casper Wyoming!"# 25 Fort Collins Colorado +, 30 Nebraska +, 183 +, 285 +, 24 Cheyenne Denver!"# 76 Rapid City +, 385 +, 138 +, 18 +, 20 +, 6 +, 34!"# 70 +, 36 Pierre +, 83!"# 90 +, 283!"# 80 +, 14 South Dakota +, 275 +, 281 +, 136 +, 81 Kansas Sioux Falls Sioux City Omaha Lincoln +, 77 Figure 2-1
89 Deadwood Ave QR 79 Haines Ave Ma l Dr Country Rd!"# 90!"# 90!"# 90 Seger Dr Dyess Ave Elk Vale Rd Country Rd 1416 Anamosa St Chicago St Sheridan Lake Rd Omaha St Jackson Blvd West Blvd!"# 190 5th St Lacrosse St +, 16 QR 44 Saint Patrick St Elk Vale Rd Elk Creek Rd Elm Ave QR 44 Cathedral Dr Texas St Parkview Dr Fairmont Blvd Minnesota St QR 16 QR 44 Radar Hill Rd J:\Maps\6331\mxd\fig2_2_Rapid_City_TDP_Studyarea.m xd QR 79 Legend Rapid City Municipal Boundary STUDY AREA RAPID CITY TRANSIT DEVELOPMENT PLAN Figure 2-2
90 Figure 2-3 Population Growth 80,000 70,000 60,000 50,000 Population 40,000 30,000 20,000 10, Year Current Employment According to the South Dakota Department of Labor, Labor Market Information Center, employment in Rapid City was 63,315 in The service sector represents the largest share of total non-farm employment in Rapid City at 40 percent. This is followed by governmental services at 17 percent and retail trades at 15 percent of total non-farm employment. Income Transit dependent populations often include those with low or fixed incomes because they have less ability to provide reliable transportation for all members of the household using a private transportation. The median household income for Rapid City in 2006 was $40,678, which is lower than the Pennington County median of $43,508, and lower than the median household income for the State of South Dakota ($42,791). Concentrations of lower income residents are located near downtown, in the central and eastern portions of the city (Figure 2-4). There are also clusters of lower-income households to the west of downtown along Jackson Boulevard and West Main Street. The current fixed route service operates extensively through these areas. Page 5
91 J:\M aps\6331\mxd\2_ 4_Rapid_City_Lo w_income_ Pop.mxd Legend Average Household Income by Block $20,000 or less $40,000 or less $60,000 or less $80,000 or less $100,000 or less Rapid City Municipal Boundary RAPID CITY LOW TO MODERATE INCOME POPULATION BY BLOCK RAPID CITY TRANSIT DEVELOPMENT PLAN Figure 2-4
92 Rapid City Land Area Growth Information on city land area growth and population density is presented in Table 2-1 based on information provided by the Rapid City Growth Management Department. Since 1970, the land area of the city has increased significantly. As a result, Rapid City has become a less densely populated city, a trend that is in line with many urbanized areas around the country. Figure 2-5 depicts current population densities. There are significant challenges for a transit system to provide quality service to a population that is spreading over a greater land area over time. Table 2-1 Population Density Year City Land Area (square miles) Population Population Density (persons/mi 2 ) ,310 1, ,399 1, ,836 2, ,492 1, ,523 1, ,607 1, ,383 1, , Future Growth Areas Growth continues to occur in the areas surrounding the city limits. The city s growth is constrained by an urban growth boundary that limits development through 2025 to a 123 square mile area around the city center. A Long-Term Annexation Plan has been prepared by the city describing the process by which developing areas will be annexed. (See Figure 2-6 for a depiction of the urban growth boundary and growth areas.) Senior and Youth Populations Transit-dependent populations often include senior citizens and youth. Some of the elderly may not be able to afford a car, may be physically unable to drive, or prefer not to drive. Youth typically have limited incomes and need to cope with age restrictions and competency testing before they may obtain a driver s license. This results in a percentage of youth who are mobility-limited and may consider transit as a valid transportation option. Of the 65,398 residents in Rapid City there are approximately 8,097 people aged 65 or older. This represents about 12 percent of the total population. There are approximately 16,500 people aged 17 and younger living in the city. This represents about 25 percent of the total population. Figure 2-7 presents the concentrations of the population aged 65 or older. Figure 2-8 presents the concentrations of the population aged 17 and younger. Some of the most significant concentrations of seniors are in the north central part of town (north of downtown and south of I-90), southeast section (south of Fairmont Boulevard, east of 5th Street), southwest section (Sheridan Lake Road and Jackson Boulevard areas), and west section (West Main Street, West Chicago Street area). Page 7
93 Deadwood Ave QR 79 Haines Ave Ma l Dr Country Rd!"# 90!"# 90!"# 90 Seger Dr Dyess Ave Elk Vale Rd Country Rd 1416 Anamosa St Chicago St Sheridan Lake Rd Omaha St Jackson Blvd West Blvd!"# 190 5th St Lacrosse St +, 16 QR 44 Saint Patrick St Elk Vale Rd Elk Creek Rd Elm Ave QR 44 Cathedral Dr Texas St Parkview Dr Fairmont Blvd Minnesota St QR 16 QR 44 Radar Hill Rd J:\Maps\6331\mxd\fig2_6_Rapid_City_Po p_density.mxd Legend Density QR 79 Fewer than 5 persons per acre 5.0 to 9.9 persons per acre 10 to 14.9 persons per acre More than 15 perons per acre Rapid City Municipal Boundary RAPID CITY POPULATION DENSITY BY TAZ RAPID CITY TRANSIT DEVELOPMENT PLAN Figure 2-5
94 !"# 90 QR 79 Haines Ave Mall Dr Country Rd Seger Dr Dyess Ave Elk Vale Rd Country Rd 1416 Deadwood Ave Chicago St Sheridan Lake Rd Omaha St West Blvd Anamosa St!"# 190!"# 90 5th St Lacrosse St +, 16 QR 44 Saint Patrick St Elk Creek Rd!"# 90 QR 44 Parkview Dr Elm Ave Minnesota St QR 16 QR 44 Radar Hill Rd J:\Maps\6331\mxd\fig2_6_Rapid_City_urbgr owth.mxd Legend Growth Area Rapid City Municipal Boundary RAPID CITY URBAN GROWTH AREA RAPID CITY TRANSIT DEVELOPMENT PLAN QR 79 Figure 2-6
95 Deadwood Ave QR 79 Haines Ave Ma l Dr Country Rd!"# 90!"# 90!"# 90 Seger Dr Dyess Ave Elk Vale Rd Country Rd 1416 Anamosa St Chicago St Sheridan Lake Rd Omaha St Jackson Blvd West Blvd!"# 190 5th St Lacrosse St +, 16 QR 44 Saint Patrick St Elk Vale Rd Elk Creek Rd Elm Ave QR 44 Cathedral Dr Texas St Parkview Dr Fairmont Blvd Minnesota St QR 16 QR 44 Radar Hill Rd J:\Maps\6331\mxd\fig2_7_Rapid_City_65+_Pop.mxd Legend Rapid City TAZ Boundaries Population Over 65 QR 79 < Over 200 Rapid City Municipal Boundary RAPID CITY 65+ POPULATION BY TAZ RAPID CITY TRANSIT DEVELOPMENT PLAN Figure 2-7
96 Deadwood Ave QR 79 Haines Ave Ma l Dr Country Rd!"# 90!"# 90!"# 90 Seger Dr Dyess Ave Elk Vale Rd Country Rd 1416 Anamosa St Chicago St Sheridan Lake Rd Omaha St Jackson Blvd West Blvd!"# 190 5th St Lacrosse St +, 16 QR 44 Saint Patrick St Elk Vale Rd Elk Creek Rd Elm Ave QR 44 Cathedral Dr Texas St Parkview Dr Fairmont Blvd Minnesota St QR 16 QR 44 Radar Hill Rd J:\Maps\6331\mxd\fig2_8_Rapid_City_17under_pop.mxd Legend Population 17 and Under QR 79 < Over 900 Rapid City Municipal Boundary RAPID CITY POPULATION 17 & UNDER BY BLOCK GROUP RAPID CITY TRANSIT DEVELOPMENT PLAN Figure 2-8
97 Disabled and Mobility Limited Populations Rapid City has about 10,000 disabled residents over 5 years old or about 18 percent of the population. This is slightly below both the statewide and national averages of 22 percent and 19 percent, respectively. A number of these individuals qualify for use of the demand-response service in the community. MAJOR TRIP GENERATORS In serving transit markets, important geographic points of interest typically include shopping centers, office and commerce concentrations, schools and learning institutions, health care facilities, and major employment centers. All of these generators should be considered when evaluating the adequacy of a region s transit service. Figure 2-9 shows some of the major trip generators in Rapid City. Major Employers The top employment locations outside of federal, state, and local government include the following: Rapid City Regional Hospital 2,700 Wal-Mart/Sam s Club 857 Sanmina 460 Green Tree 415 NEW Finance Corporation 410 Black Hills Workshop 380 ASI, Inc. 373 GE Money 330 Beverly Healthcare 298 School of Mines and Technology 298 BH Surgery Center 287 Menards 250 Merrillat Industries 216 GC Dacotah 163 Black Hills Gold by Coleman 156 J.C. Penney 150 Assurant Preneed 143 Mileage, Plus, Inc. 139 Lowes 125 Dakota Craft Inc. 123 Shopping and Retail Centers Major shopping and retail areas in Rapid City tend to be located along major transportation corridors and include the Rushmore Mall, the East Family Thrift Center, the Midland Shopping Center, Baken Park, and the city s central business district. Rapid City serves as the region s healthcare center. The sector employs over 8,000 people in the Black Hills area. Hospitals and health centers represent important destinations for the community. For this reason, it is of critical importance that these facilities are well served by the transit network. Major health care facilities in Rapid City are: Rapid City Regional Hospital Rapid City Regional West Center for Behavioral Health Rapid City Indian Hospital (Sioux San) Rapid City Community Health Center Black Hills Rehabilitation Center Page 12
98 J:\Maps\6331\mxd\fig2_9_Rapid_City_MajT ripg en.mxd Legend Major Trip Generators å Elementary School n High School C Health Facility!( Other (see map label) Rapid Transit System Fixed Routes Route1A Route1B Route2A Route2B Route3A Route3B QR 44 n QR 79 Black Hills Workshop MAJOR TRIP GENERATORS RAPID CITY TRANSIT DEVELOPMENT PLAN å!( Chicago St å Deadwood Ave National Guard!( Sheridan Lake Rd!"# 90 Shopping Center!(!( Family Thrift Center VA Clinic +, 16 West Blvd!"# 190 å Saint Patrick St å Civic Center!( n 5th St Cathedral Dr C C n å Haines Ave Rushmore Mall Hospital å Mall Dr!( Anamosa St Texas St å!( Parkview Dr QR 79 Elm Ave å!( å Lacrosse St Walmart!( Seger Dr School of Mines & Technology Minnesota St Fairmont Blvd Youth & Family Services!(!"# 90 QR 44 Vo Tech!( Dyess Ave Family Thrift Center Saint Patrick St Route4A Route4B Route5A Route5B Elk Vale Figure 2-9
99 Schools and Training Centers Schools and training centers are also important travel destinations, often with large transitdependent clientele. In addition to the elementary and high schools, Rapid City is the home of the South Dakota School of Mines and Technology, a four-year college specializing in engineering and related fields. National American University provides two-and four-year degrees in business. Western Dakota Technical Institute provides vocational training in areas such as drafting and computer technology, and the University of South Dakota s School of Nursing offers a training program for nursing students. Black Hills State University offers a variety of courses offered at four locations around Rapid City: Ellsworth Air Force Base, Western Dakota Technical Institute, Rapid City Regional Hospital Health Sciences Building, and the South Dakota School of Mines and Technology. Quality of Life Rapid City s reputation as one of the top tourist centers in the nation makes for a wide variety of leisure and recreational opportunities Five national parks in close proximity: Mount Rushmore, Badlands, Wind Cave, Jewel Cave, and Devil s Tower. 17 area golf courses plus tennis facilities in town. 14 mountain lakes, more than 300 miles of streams and reservoirs for water sports and fishing. Rapid City bike trail measuring 13.5 miles along Rapid Creek. Two area ski resorts. 400 miles of nature walks and hiking systems in the Black Hills. Diverse religious community, with more than 80 area churches representing various denominations and congregations of all sizes. 75 hotels/motels with 5,156 available sleeping rooms and six convention properties. Western South Dakota s largest shopping center, specialty shops, boutiques, and antique stores. Downtown Rapid City s business contains some 400 businesses. Rushmore Plaza Civic Center is a modern facility for conventions, entertainment and athletic events. Complete convention complex includes two arenas, 150,000 square feet of exhibit space, 1,774 seat theater, meeting rooms and catering facilities, conveniently located in downtown Rapid City. Page 14
100 3. EXISTING TRANSIT SERVICES AND FACILITIES This chapter presents an overview of the fixed route transit service and demand response service operated by Rapid Transit System (RTS). It presents data on the current fixed route system in terms of service levels, fare structure and ridership, as well as operating statistics and regional service coverage. The chapter also analyzes trends in the operating and financial data for all RTS services. These descriptions provide a baseline for understanding the current RTS from which further evaluations and recommendations can be made. RAPID CITY TRANSIT SERVICES RTS is responsible for providing safe, convenient and affordable local bus service within the city limits of Rapid City. RTS operates both fixed route service, RapidRide, and demand-response service, called Dial-A-Ride for those individuals that qualify under the Americans with Disabilities Act (ADA). The city has also recently begun operation of a seasonal trolley service. FIXED ROUTE SERVICE DESCRIPTION The RTS fixed-route system, known as RapidRide, consists of five routes that serve the north, south, and west parts of the community (see Figure 3-1). This service was initiated in 1992, well after the city s Dial-A-Ride service began (1982). Days & Hours of Operation RTS operates RapidRide Monday-Friday 6:25 a.m. through 5:55 p.m. RapidRide does not operate on weekends or holidays. Service Frequency Each of the RapidRide routes operates on 35-minute headway during regular weekday service utilizing an A and a B configuration. The two loops for each route differ by direction (clockwise or counter-clockwise) and are intended to improve safety for riders and provide better coverage by providing bus stops along both sides of the main street system. Slight modifications between A and B routing occur on all routes except Route 4. For each route, buses depart from the Milo Barber Transportation Center (MBTC), travel the loop route in one direction and arrive back at the MBTC 25 minutes later. The buses then have a 10-minute layover before they depart from the MBTC on the same route but in the opposite direction. The buses arrive back at the MBTC 25 minutes later, completing the trip. Thus, a full round trip, including both A and B loops takes 70 minutes. There are 10 round trips (A and B loops completed) daily on each route. Table 3-1 summarizes currently scheduled RapidRide service. Page 15
101 Figure 3-1 Page 16
102 Table 3-1 RapidRide Route Length & Running Times A Route B Route MBTC Layover Begin End Begin End MBTC Layover 6:25 a.m. 6:50 a.m. 10 minutes 7:00 a.m. 7:25 a.m. 10 minutes 7:35 a.m. 8:00 a.m. 10 minutes 8:10 a.m. 8:35 a.m. 10 minutes 8:45 a.m. 9:10 a.m. 10 minutes 9:20 a.m. 9:45 a.m. 10 minutes 9:55 a.m. 10:20 a.m. 10 minutes 10:30 a.m. 10:55 a.m. 10 minutes 11:05 a.m. 11:30 a.m. 10 minutes 11:40 a.m. 12:05 p.m. 10 minutes 12:15 p.m. 12:40 p.m. 10 minutes 12:50 p.m. 1:15 p.m. 10 minutes 1:25 p.m. 1:50 p.m. 10 minutes 2:00 p.m. 2:25 p.m. 10 minutes 2:35 p.m. 3:00 p.m. 10 minutes 3:10 p.m. 3:35 p.m. 10 minutes 3:45 p.m. 4:10 p.m. 10 minutes 4:20 p.m. 4:45 p.m. 10 minutes 4:55 p.m. 5:20 p.m. 10 minutes 5:30 p.m. 5:55 p.m. NA In February 2008, each of the RapidRide routes were surveyed in order to determine actual running times. The survey was conducted over a five-day period in February of Table 3-2 summarizes the results. Generally, the A.M. routes run slightly ahead of schedule and the P.M. routes slightly behind. Table 3-2 RapidRide Complete Loop Times and Layovers Route Running Time Layover AM PM AM PM 1A 22 min 26 min 13 min 9 min 1B 25 min 27 min 10 min 8 min 2A 29 min 31 min 6 min 4 min 2B 25 min 28 min 10 min 7 min 3A 25 min 29 min 10 min 6 min 3B 26 min 28 min 9 min 7 min 4A 26 min 27 min 9 min 8 min 4B 29 min 30 min 6 min 5 min 5A 24 min 25 min 11 min 10 min 5B 29 min 27 min 6 min 8 min AVERAGE 26 min 27.8 min 9 min 7.2 min Average Layover/Complete Route (35 min) 26% 20% Page 17
103 Route Length/Running Times For ease of transfer at the MBTC, all routes have 25-minute one-way running times (see Table 3-3). However, each of the four routes has a slightly different route length. Table 3-3 RapidRide Route Length & Running Times Route Route Length Scheduled Running Time Average Speed 1 A 6.6 miles 25 minutes 15.8 mph 1 B 7.1 miles 25 minutes 17 mph 2 A 7.6 miles 25 minutes 18.2 mph 2 B 7.1 miles 25 minutes 17 mph 3 A 8.5 miles 25 minutes 20.4 mph 3 B 8.6 miles 25 minutes 20.6 mph 4 A 8.7 miles 25 minutes 20.9 mph 4 B 9.5 miles 25 minutes 22.8 mph 5 A 6.2 miles 25 minutes 14.9 mph 5 B 6.7 miles 25 minutes 16.1 mph Source: City of Rapid City. Transfer Policies RapidRide allows transfers to another bus, but does not allow transfers for stopovers or return trips. All transfers must be made at the MBTC. Based on a six-day sample, approximately 17 percent of average daily ridership transfers use paper transfers. Additional transfers occur through passengers using their monthly passes to reboard another vehicle, although it is believed that this is a relatively modest number. The number of transfers between routes varies (see Table 3-4). The highest amount of transferring involves passengers from Routes 1 and 2 transferring to Route 3 to complete their trip. Table 3-4 Average Transfers per Day To Route: From Route: Page 18
104 Fare Structure RapidRide accepts cash fares and coupons for individual trips and sells unlimited ride monthly passes. The standard adult/student (5-59 yrs) fare is $1 per ride. The elderly, disabled and Medicare passengers ride for $0.50 per trip. Children (4 years and under) ride for free. Books of coupon (10 coupons) can be purchased (for convenience purposes), at rates of $10 for adult/student passengers and $5 for elderly, disabled and Medicare passengers. Monthly passes can be purchased, for potential savings (depending upon use), at rates of $25 for adults and $15 for students (K-12). DIAL-A-RIDE SERVICE DESCRIPTION This service operates as a curb-to-curb service for Americans with Disabilities (ADA) certified passengers. An individual with a disability must complete an application form and be approved prior to using this service. Upon determination and approval, riders receive a laminated card to document their eligibility. (No similar card system is currently in use for elderly and handicapped discount riders on RapidRide.) All individuals whose disabilities are so significant that they are unable to use regular, lift-equipped, fixed-route, bus service are approved for use of this service. Riders may schedule rides up to 14 days in advance of their trip, and a significant subscription service exists for recurring trips for Dial-A-Ride. A qualified rider must contact the dispatcher in order to schedule service. This is a shared ride service, and as such the length of a trip depends on the number of stops the bus will make for other passengers. However, every effort is made to ensure the shortest trip possible for the passenger. The City has a no-show policy that is in effect if a rider is more than five minutes late from the scheduled pick-up time. Dial-A-Ride on-time performance is judged by the vehicle arriving within 20 minutes of the scheduled pick-up time. This service is available Monday through Friday, 6:30 a.m. to 6:00 p.m., and Saturdays 8:00 a.m. to 7:00 p.m. Dial-A-Ride service is not available on major holidays. Currently all passenger scheduling and vehicle dispatching is done using trip scheduling software. ORGANIZATIONAL STRUCTURE RTS is operated as a service of the City of Rapid City. A transit manager oversees all activities and is supported by an operations coordinator, two route supervisors, a dispatcher and 29 drivers (17 full-time positions). A couple of temporary bus cleaners and a temporary receptionist round out the organization. Dispatchers and drivers are unionized municipal employees. All vehicle maintenance is sub-contracted out. The city is hoping to begin using city staff for some light maintenance in the near future. The Rapid Transit Advisory Board (RTAB) was established in 1991 to inform and advocate for various groups regarding transit and transportation related issues. The membership is drawn from the community and appointed by the Mayor to represent social service organizations, transit passengers, persons with disabilities, the elderly and private business. The board consists of seven members who serve three-year terms with a maximum of three consecutive terms. Page 19
105 FINANCIAL & OPERATING DATA System Expenses RTS s annual operating expenses have been increasing since 2003, climbing from $990,160 in 2003 to $1,585,624 in 2007 (see Figure 3-2). This is an average annual increase of approximately 12.6 percent. Annual capital costs held relatively steady at around $100,000 from 2003 to 2005 before increasing to well above $500,000 in 2006, and then to $1,919,236 in 2007 (see Figure 3-2). The sharp increase in capital spending in 2007 was due to the procurement of a new fleet storage facility. Figure 3-2 System Expense $2,500,000 $2,000,000 $1,500,000 $1,000,000 $500,000 $ Operating Expense Capital Expense System Revenues (By Source) Like most transit systems, the services operated by RTS rely heavily on a variety of funding sources to cover annual operating expenses. In addition to farebox revenue, RTS receives local, state, and federal assistance. Advertising is also a steady revenue source for RTS. Farebox revenue, in terms of total dollars, experienced an overall increase between 2003 and 2007, climbing from $215,469 in 2003 to $325,191 in 2007 (see Figure 3-3). Passenger fares as a percentage of total revenues have held fairly steady between 2003 and 2007 at 20 percent in 2003 to 21 percent in Local assistance, in terms of total dollars, experienced a substantial increase between 2003 and 2007, climbing from $351,171 in 2003 to $939,173 in 2007 (see Figure 3-3). As a percentage of total revenues, local funds remained constant at approximately 30 percent between 2003 and Page 20
106 State assistance, in terms of total dollars, remained constant at $28,425 between 2003 and State assistance, as a percentage of total revenues, exhibited a slight decrease between 2003 and 2007, falling from 3 percent in 2003 to 1 percent in Federal assistance experienced an overall increase between 2003 and 2007, climbing from $456,645 in 2003 to $2,212,071 in 2007 (see Figure 3-3). As a percentage of total revenues, federal assistance increased from 45 percent in 2003 to 63 percent in Figure 3-3 System Revenues (Total Dollars) $2,500,000 $2,000,000 $1,500,000 $1,000,000 $500,000 $ Fare Revenue Local Assistance Federal Assistance State Assistance System Performance (Fixed-Route Only) The ridership of RapidRide, the fixed route service of the RTS system, experienced an overall increase between 2003 and 2007, rising from 145,823 in 2003 to 217,617 in 2007, for an approximate average annual increase of 12 percent. The revenue miles of RapidRide have experienced an overall increase since 2003, rising from 143,915 in 2003 to 200,549 in 2007, for an overall gain of 39 percent. The revenue hours of RapidRide have experienced an overall increase since 2003, rising from 11,044 in 2003 to 15,562 in 2007, for an overall gain of 41 percent. Passenger Boarding Passenger boarding and alighting data collected from a sample survey conducted in February 2008 is portrayed in the following charts. The on and off activity for a full day s schedule is shown by route segments, with each segment about one-half mile in length. As all transit routes begin and end at the MBTC, the stops shown in the graphs that follow are the transit stops with the highest passenger boarding and alighting activity. Page 21
107 Route 1 Excluding the MBTC, the main origin and destination for riders on RapidRide Route 1A is the Rushmore Mall and nearby stops. This route shows steady ridership along most of its way, with a decrease at the stops near the end if the line. Figure Route 1A 13 On Off Barber Center Haines Ave to North Street Anamosa St to Maple Ave Haines Ave to Anamosa St Anamosa St to LaCrosse St LaCrosse St to Disk Dr Rushmore Mall Disk Dr to Haines Ave Anamosa St to West Blvd Haines Ave to Anamosa St Route Travels in this Direction Daily Segment Activity West Blvd to North St North St to 8th St Barber Center The main origin and destination for riders on RapidRide Route 1B is also the Rushmore Mall area. This route has reasonable ridership along most of its length. Figure Route 1B On Off Barber Center 8th St to Haines Ave Haines Ave to Anamosa St Haines Ave to Disk Dr Haines Ave through Lakota Rushmore Mall Mall to LaCrosse St Anamosa St to Maple St La Crosse St to Anamosa St Anamosa Ave to Haines Ave Route Travels in this Direction Daily Segm ent Activity Haines Ave to North St 5th St to Omaha St Barber Center Page 22
108 Route 2 On RapidRide Route 2A, the main origin and destination for riders is the Wal-Mart. This route has strong ridership along most of its length Figure 3-6 Route 2A On Off Barber Center St Joseph St to Maple St St Joseph to St Patrick Cambell St to Omaha St North St to La Crosse St La Crosse St to Walmart Anamosa St to Maple Ave Maple Ave to New York St Route Travels in this Direction Daily Segm ent Activity New York St to 5th St 5th St to Main St Barber Center The main origin and destination for riders on RapidRide Route 2B is the Wal-Mart. This route has reasonable ridership along most of its length. Figure 3-7 Route 2B On Off Barber Center New York St to East Blvd East Blvd to Milwakee St Milwakee St to Anamosa St Wal-Mart La Crosse St to North St North St to Cambell St Cambell St to Omaha St St Joseph St to East Blvd Cambell St to St Patrick St Route Travels in this Direction Daily Segm ent Activity St Joseph St Main St Barber Center Page 23
109 Route 3 Ridership on Route 3A is fairly evenly distributed the length of the route. Figure 3-8 Route 3A On Off Barber Center Mt Rusmore Rd to St Patrick St St. Patrick St to 5th St 5th St to Fairmont Blvd 5th St to Minnesota St Minnesota St to Elm St Elm St to Fairmont Blvd Elm Ave at St Patrick St St Patrick St to St Joseph St Route Travels in this Direction Daily Segm ent Activity St Joseph to East Blvd Main St to 6th St Barber Center Ridership peaks slightly throughout the middle of Route 3B, including the major medical facilities. Figure Route 3B On Off Barber Center St Joseph St to East Blvd St Joseph St to St Patrick St St Patrick St to Elm St Elm St to Fairmont Blvd Elm St to Minnesota St Minnesota St to 5th St 5th St to Fairmont Fairmont to Mt Rushmore Rd Route Travels in this Direction Daily Segment Activity Mt Rushmore Rd to St Patrick St Mt Rushmore Rd to St Joseph St Barber Center Page 24
110 Route 4 High points of passenger boarding and alighting activity on RapidRide Route 4A occur at the Black Hills Workshop and Training Center. Figure 3-10 Route 4A On Off Barber Center Main St to Jackson Blvd Jackson Blvd to Canyon Lk Dr Jackson Blvd to Sheridan Lake Rd Canyon Lk Dr to Soo San Dr Soo San Dr to Main St Main St to Sheridan Lk Rd St. Joseph St to Mt. Rushmore Rd Canyon Lk Dr adjacent to Mtn Vi.. Route Travels in this Direction Daily Segment Activity Barber Center The main origin for riders on RapidRide Route 4B is the Black Hills Workshop and Training Center. Ridership along this route is limited. Figure 3-11 Route 4B On Off Barber Center Main St to Mtn View Rd Canyon Lk Dr to Sheridan Lk Rd Main St to Soo San Dr Soo San Dr to Canyon Lk Dr Canyon Lk Drive to Jackson Blvd Jackson Blvd to Central Blvd Via Sheridan Lk Rd to Jackson... Jackson Blvd to Main St St Joseph St to Mt Rushmore Rd Barber Center Route Travels in this Direction Daily Segment Activity Page 25
111 Route 5 High points of passenger boarding and alighting activity on RapidRide Route 5A occur at transit stops located near retail shopping areas. Figure 3-12 Route 5A 18 8 On Off Barber Center West Blvd to North St West Blvd to Anamosa St Explorer St to Haines Ave Knollwood Dr to Maple Ave Maple Ave to Anamosa St Maple Ave to Adams Milwakee St to North St Waterloo St to Omaha St Route Travels in this Direction Daily Segment Activity Omaha St to East Blvd Main St to 6th St Barber Center High points of passenger boarding and alighting activity on RapidRide Route 5B occur at Star Village. Figure 3-13 Route 5B On Off Barber Center To 11th Street West Blvd to St Patrick St Mt Rushmore Rd at St Francis Mt Rushmore to Fairmont St Fairmont St to 5th St 5th St to St Patrick 5th St to East Blvd Route Travels in this Direction Daily Segm ent Activity East Blvd to Main St Main St to 6th St Barber Center Page 26
112 Based on this sample, the top 10 bus stops are identified in Table 3-5. Table 3-5 Top 10 Most Active Bus Stops Rank Route Segment On Off Total 1 2A La Crosse Street to Wal-Mart A Wal-Mart B 5th Street to East Boulevard A Rushmore Mall B North Street to La Crosse Street B St. Joseph Street to Maple Street B La Crosse Street to North Street A 5th Street to Fairmont B Elm Street to Minnesota Street B Soo San Drive to Canyon Lake Drive System Trends This section examines the operating and financial indicators of efficiency over a five-year time period, from FY 2003 to FY This historical evaluation is useful to identify trends in system performance, as well as determining the causes of performance fluctuations. Table 3-6 displays the total expenses for RTS for the years 2003 through During this fiveyear period, operating expenses have gone up at a moderate pace, whereas capital expenses have gone up dramatically, particularly in the last two years, due to the acquisition of a renovated storage facility. Table 3-6 RTS Expense Trends, Percent Change Operating Expense $990,160 $1,080,658 $1,236,122 $1,316,858 $1,585,624 60% Capital Expense $95,586 $102,522 $113,667 $537,020 $1,919, % Total $1,085,746 $1,183,180 $1,349,789 $1,853,878 $3,504, % Source: City of Rapid City Table 3-7 displays the total revenues for RTS for the years 2003 through During this five-year period, federal assistance increased by 351 percent, local assistance increased by 167 percent, and state assistance remained constant. Page 27
113 Table 3-7 RTS Revenue Trends, Percent Change Fare Revenue $215,469 $242,457 $251,726 $270,344 $325,191 51% Federal Assistance $490,681 $528,314 $612,994 $1,067,323 $2,212, % State Assistance $28,425 $28,425 $28,425 $28,425 $28,425 0% Local Assistance $351,171 $383,984 $456,645 $479,832 $939, % Total Expense $1,085,746 $1,183,180 $1,349,789 $1,853,878 $3,504, % Source: City of Rapid City Table 3-8 presents a summary of the core operating data for RTS transit services between 2003 and In total, the RTS system has expanded between 2003 and Revenue miles increased 45 percent from 2003 to 2007, indicating an increase in service during these five years. Correspondingly, passenger trips have increased by 43 percent during the same period, from 213,953 in 2003 to 306,620 in Fixed route passenger trips per mile have increased by 17 percent from 2003 to 2007 while Dial-A-Ride trips per mile have decreased by 19 percent. Table 3-8 RTS Operating Statistics Trends, TOTAL SYSTEM FIXED ROUTE DIAL-A- RIDE Percent Change Passengers 213, , , , ,620 43% Miles 317, , , , ,800 45% Trips/Mile % Percent Change Passengers 143, , , , ,540 51% Miles 164, , , , ,678 30% Trips/Mile % Percent Change Passengers 70,038 75,909 80,127 82,824 89,003 27% Miles 162, , , , ,635 56% Trips/Mile % Nearly 70 percent of RTS s operating expenses are associated with labor costs. The maintenance and operation (fuel and supplies) of the fleet represent approximately 18 percent of the annual operating costs (see Table 3-9). Page 28
114 Table 3-9 RTS Operating Expenses, 2007 Operating Expense Item Total Expense Percent of Total Personnel (salaries, wages, & fringe benefits) $1,078, % Professional Services $139, % Insurance $29, % Maintenance $101, % Fuel and Supplies $190, % Rentals $28, % Other 1 $17, % Total Expenses $1,585, % Source: City of Rapid City, 2007 Operation Statistics. Table 3-10 displays the core operating and revenue data for RTS Fixed Route transit service between 2003 and Farebox revenue has almost doubled, while ridership has increased by half over this period. Table 3-11 displays the core operating and revenue data for RTS Dial-A-Ride transit service between 2003 and Both ridership and farebox revenue have increased by approximately 25 percent over this period. Table 3-10 RTS RapidRide Fare Revenue Trends, Percent Change Passengers 143, , , , , % Fare Revenue $97,272 $105,621 $114,753 $122,818 $177, % Table 3-11 RTS Dial-A-Ride Fare Revenue Trends, Percent Change Passengers 70,038 75,909 80,127 82,824 89, % Fare Revenue $118,197 $136,837 $136,973 $147,526 $148, % 1 Includes advertising, travel, utilities, interdepartmental charges, and miscellaneous items. Page 29
115 Table 3-12 summarizes the revenues and expenses for RTS Dial-A-Ride services in Fixed route services account for the majority of passenger trips (71%) and over half of the total fare revenues (54%) for the RTS system. More than half of the operating expenses (55%) are incurred in the provision of Dial-A-Ride service, which accounts for less than 30 percent of the total passenger trips. Table 3-12 RTS Revenue and Expense Summary, 2007 RapidRide Dial-A-Ride Total System Passengers 217,617 89, ,620 Fare Revenues $177,015 $148,176 $325,191 Miles of Service 200, , ,184 Operating Expense $711,419 $874,205 $1,585,624 Source: City of Rapid City Facility Inventory This section describes the capital program for RTS s transit services. It presents an inventory of the current RTS vehicle fleet and primary operating facilities. Fleet Inventory Table 3-13 shows the characteristics of the current RTS vehicle fleet. There are a total of 26 vehicles in the RTS fleet, including 7 large buses (fixed route service), 2 trolleys, and 17 smaller buses (Dial-A-Ride service). Most of the fleet is less than five years old, and the average vehicle mileage is approximately 56,800. Table 3-13 RTS Current Active Fleet Make and Model Year Bus Number Seating Capacity Mileage RapidRide GMC - Glaval , or ,150 GMC - Glaval , or ,670 GMC - Glaval , or ,811 GMC - Glaval , or ,584 GMC - Glaval , or ,510 GMC - Glaval , or ,635 GMC - Glaval , or ,430 Ford Supreme 2007 CV1 - trolley ,061 Ford Supreme 2007 CV2 - trolley ,073 Page 30
116 Make and Model Year Bus Number Seating Capacity Mileage Dial-A-Ride Ford Starcraft ,871 Ford Starcraft ,776 Ford Starcraft ,788 Ford Starcraft ,953 Ford Starcraft ,525 Ford Starcraft ,781 Ford Starcraft ,450 Ford ,105 Ford ,174 Ford Starcraft ,534 Ford Starcraft ,957 Ford Starcraft ,045 Ford Starcraft ,498 GMC Glaval New GMC Glaval New GMC Glaval New GMC Glaval New Source: City of Rapid City. Other Facilities The center of the RTS passenger operations is the MBTC, which was built in The facility is the primary transfer point and hub for transit service in the City of Rapid City. The facility contains offices for the RTS management, supervisors, dispatching, and ticketing as well as other office space, a barbershop, and common area for passengers. In addition to RTS, Jefferson Lines operates nationwide intercity bus service out of the facility. In 2008, RTS was able to move all vehicles to a renovated storage facility located at 760 Centre Street. The facility is approximately 1.6 miles from the MBTC. It has adequate indoor climate controlled storage space for the entire fleet, bus washing capability and a general purpose maintenance bay. PEER REVIEW The performance of the RTS system was compared and contrasted with the performance of a group of selected transit systems from around the region. The intent of the analysis was to see how RTS performs relative to some comparable cities and transit systems operating in similar environments with similar characteristics. Each peer comparison employs a variety of performance indicators, including cost efficiency, productivity and measures of cost effectiveness. The peer group for this review consists of six systems that were selected based on a variety of factors, including population, system size, service area, and climate. Operating and financial data for this comparison were taken from the 2006 National Transit Database (NTD), (most recent period for all systems reporting). Page 31
117 The following peer review cities were chosen: Cheyenne, Wyoming Sioux Falls, South Dakota Grand Forks, North Dakota Bismarck, North Dakota Sioux City, Iowa Billings, Montana For each performance measure, with exception of operating expense per capita and passenger trips per capita, RTS s RapidRide and Dial-A-Ride services were compared to their respective peer system counterparts rather than as a system total. Community Impact RTS has a low system-wide operating cost per capita compared to its peers (see below) and is providing service at a relatively low cost for the population size that it is serving. Figure 3-14 Annual Operating Expense per Capita Sioux Falls Billings Average Grand Forks Sioux City Bismark Rapid City Cheyenne $0 $5 $10 $15 $20 $25 $30 $35 $40 $45 $50 Page 32
118 Conversely, RTS is serving a lower number of passengers per capita in comparison to its peers. Although RTS is doing a good job at keeping operating costs per capita low, the net result is that service use is also low as measured by annual passenger trips per capita. Figure 3-15 Annual Passenger Trips per Capita Sioux City Billings Sioux Falls Average Grand Forks Rapid City Bismark Cheyenne Financial Efficiency RTS s RapidRide cost per mile is lower than the peer average. Figure 3-16 Operating Expense per Vehicle Revenue Mile (Fixed Route) Sioux City Grand Forks Billings Sioux Falls Average Rapid City Bismark Cheyenne $0.00 $1.00 $2.00 $3.00 $4.00 $5.00 $6.00 Page 33
119 Dial-A-Ride cost per mile is also lower than the peer average. Figure 3-17 Operating Expense per Vehicle Revenue Mile (Demand Response) Billings Cheyenne Sioux Falls Rapid City Average Sioux City Bismark Grand Forks $0.00 $1.00 $2.00 $3.00 $4.00 $5.00 $6.00 RTS s RapidRide cost per hour is lower than the peer average. Figure 3-18 Operating Expense per Vehicle Revenue Hour (Fixed Route) Sioux City Billings Grand Forks Sioux Falls Average Rapid City Bismark Cheyenne $0.00 $10.00 $20.00 $30.00 $40.00 $50.00 $60.00 $70.00 $80.00 Page 34
120 RTS s Dial-A-Ride cost per hour is lower than the peer average. Figure 3-19 Operating Expense per Vehicle Revenue Hour (Demand Response) Cheyenne Billings Sioux Falls Average Rapid City Bismark Sioux City Grand Forks $0.00 $10.00 $20.00 $30.00 $40.00 $50.00 $60.00 $70.00 RapidRide has the highest farebox recovery rate of any of its peer fixed-route systems (see below). Figure 3-20 Farebox Recovery (Fixed Route) Rapid City Sioux City Sioux Falls Average Cheyenne Grand Forks Billings Bismark 0% 5% 10% 15% 20% 25% Page 35
121 RTS s Dial-A-Ride farebox recovery rate is higher than the peer average. Figure 3-21 Farebox Recovery (Demand Response) Sioux City Billings Bismark Rapid City Average Sioux Falls Cheyenne Grand Forks 0% 5% 10% 15% 20% 25% 30% 35% 40% 45% Service Effectiveness The total number of RapidRide trips per hour is lower than the peer average. Figure 3-22 Passenger Trips per Revenue Hour (Fixed Route) Sioux City Billings Sioux Falls Average Rapid City Grand Forks Cheyenne Bismark Page 36
122 Rapid City has the highest trips per hour of any of its peer demand response systems. Figure 3-23 Passenger Trips per Revenue Hour (Demand Response) Rapid City Billings Bismark Grand Forks Average Sioux Falls Sioux City Cheyenne The number of trips per mile generated by RapidRide is above the peer average. Figure 3-24 Passenger Trips per Revenue Mile (Fixed Route) Sioux City Sioux Falls Billings Rapid City Average Grand Forks Cheyenne Bismark Page 37
123 Rapid City has the highest trips per mile of any of its peer demand response systems. Figure 3-25 Passenger Trips per Revenue Mile (Demand Response) Rapid City Billings Sioux City Average Bismark Sioux Falls Grand Forks Cheyenne Cost Effectiveness Rapid City has the lowest cost per trip of any of its peer fixed route systems. Figure 3-26 Operating Expenses per Passenger Trip (Fixed Route) Bismark Grand Forks Average Billings Sioux Falls Cheyenne Sioux City Rapid City $0.00 $1.00 $2.00 $3.00 $4.00 $5.00 $6.00 $7.00 $8.00 Page 38
124 RTS s Dial-A-Ride cost per trip is lower than the peer average. Figure 3-27 Operating Expenses per Passenger Trip (Demand Response) Cheyenne Sioux Falls Billings Average Rapid City Sioux City Bismark Grand Forks $0.00 $5.00 $10.00 $15.00 $20.00 $25.00 $30.00 RapidRide revenue per trip is relatively high and above the peer group average. Figure 3-28 Fare Revenue per Passenger Trip (Fixed Route) Sioux City Rapid City Grand Forks Average Sioux Falls Cheyenne Bismark Billings $0.00 $0.10 $0.20 $0.30 $0.40 $0.50 $0.60 $0.70 $0.80 Page 39
125 RTS s Dial-A-Ride revenue per trip is relatively low and below the peer average. Figure 3-29 Fare Revenue per Passenger Trip (Demand Response) Billings Sioux City Sioux Falls Average Bismark Rapid City Cheyenne Grand Forks $0.00 $0.50 $1.00 $1.50 $2.00 $2.50 $3.00 $3.50 $4.00 $4.50 $5.00 Page 40
126 The following figure shows how the overall Rapid City system compares to the peer cities in terms of the percentage of local service cost and passengers that is related to the respective fixed route and demand response components. Most of the peer cities spend a greater proportion of their total system cost on fixed route service than Rapid City does SERVICE TRENDS City Operating Expense Passenger Trips Rapid City Sioux Falls Sioux City Billings Page 41


127 2006 SERVICE TRENDS City Operating Expense Passenger Trips Bismark Cheyenne Grand Forks Page 42
128 Peer Review Summary RTS s RapidRide and Dial-A-Ride services operate at a very low per capita cost; however, RapidRide generates a low number of per capita trips in comparison to its peers. The conclusion to be drawn is that RTS is a financially efficient system. However, the level of fixed route service provided may not be sufficient to generate the level of ridership found in other communities. Both RapidRide and Dial-A-Ride services score very high for financial efficiency when compared to other peer systems. For cost per mile, cost per hour and farebox recovery, both RapidRide and Dial-A-Ride services are above the peer average, and in some instances are either the best performing or second best performing system. RapidRide service scores about average on service effectiveness as measured by passenger trips per hour and per mile, while its Dial-A-Ride service scores very high as compared to the other peer systems. RapidRide service scores high for cost effectiveness when compared to other peer systems. For cost per trip and revenue per trip, RapidRide service is above the peer average and is the best and second best performing respectively. The peer review analysis indicates clearly that the RTS is very efficient in producing transit services as compared to its peers within the region. The utilization of RTS service as measured by passengers per mile and per hour of service produced is extremely high for Dial-A-Ride and runs about average for fixed route comparisons. What also comes forward in the review is that the amount of service available per capita is quite low compared to peers. In many instances, this is an indication that unmet needs for fixed route services probably exist in the community. Page 43
129 NATIONAL RIDERSHIP TRENDS In addition to the peer group analysis, a review of national transit ridership trends was conducted, using information from the 2006 National Transit Database (NTD). These findings are presented here. Small-urbanized transit systems (between 50,000 and 200,000 population), make up 41 percent of all agencies reporting to the NTD. Over the last 10 years, small decreases in the farebox recovery ratio have occurred in small-urbanized areas. This is consistent with Rapid City s experience. Small-urbanized areas had a rate of increase for subsidy per passenger greater than for large urbanized areas. Demand response accounts for a substantial portion of the service provided in small-urbanized areas. From 1997 to 2006, there was no substantial change in fare revenues in small urbanized areas. Small-urbanized areas are more dependent on operating subsides than large urbanized areas. Nationwide, fare revenues account for less than 19 percent of operating funds for small-urbanized areas. In general, there was a sharp increase in Federal capital assistance per passenger from In small-urbanized areas, fare revenues typically comprise 19 percent of funding sources, with local assistance accounting for 22 percent, state assistance for 20 percent, Federal assistance for 25 percent, and other assistance of 14 percent. The most startling difference between national trends and Rapid City is in state support, with Rapid City state assistance at less than 2 percent of total revenues in Fare revenues account for approximately 15 percent of RTS funding (consistent with national trends), with local assistance at 31 percent, and Federal assistance at 52 percent (both greater than national trends). Federal funds account for more than 70 percent of all capital invested in small urbanized areas. Page 44
130 FEDERAL AND STATE POLICIES RTS is influenced by several different federal and state programs and policies. RTS participates in and is compliant with these various programs in order to maintain access to funding streams and perform its functions as a public agency in a responsive, legal, and safe manner. FTA REGULATIONS AND AUDITS As part of requirements to qualify for receipt of federal transit funding assistance, RTS must annually comply with and sign off on a list of congressionally and administratively mandated certifications and assurances. Failure to do so may result in both funding suspension and personal disciplinary action against key management. There are currently 23 areas of program compliance that must be certified. There is at least one additional area, transportation coordination, which may be added to this list in the near term. The current areas are as follows: 1. Legal Capacity 2. Financial Capacity 3. Technical Capacity 4. Satisfactory Continuing Control 5. Maintenance 6. Procurement 7. Disadvantaged Business Enterprise 8. Buy America 9. Suspensions and Debarments 10. Lobbying 11. Planning and Program of Projects 12. Title VI Compliance 13. Public Comment Process for Fare and Service Changes 14. Half Fare Policy 15. Americans with Disabilities Act 16. Charter Bus Rules 17. School Bus Rules 18. National Transit Database Submissions 19. Safety and Security 20. Drug-Free Workplace 21. Drug and Alcohol Program 22. Equal Employment Opportunity 23. ITS Architecture The FTA has the legal right to audit the books and practices of any funding recipient, including primary and secondary beneficiaries, at any time by law. The FTA is also required by law to conduct a biennial review of the agency s drug and alcohol program, and perform a full certification audit every three years, known as the Triennial Review. Page 45
131 RTS has undergone two Triennial Reviews since the last TDP was adopted. The most recent Triennial Review was conducted in August RTS was found to have only four minor deficiencies, all of which were corrected to the satisfaction of FTA before the end of the year These almost all involved inclusion of full certification and assurance language in operating and procurement contracts, as well as a deficiency in policy language covering negative-dilute retest policy in the Drug and Alcohol program. This level of deficiency finding was exceptionally low in comparison with the average for Triennial Reviews, and speaks very well for the success of compliance efforts by the agency. National Transit Database submissions represent one of the certifications, and represent a significant workload and effort to collect and report both operating and financial data by transit, with both routine partial data submissions during the year, and a comprehensive annual submission due each spring. RTS must submit two reports, for both the fixed route system and the demand-response system. Delay in the submissions, or incomplete or inaccurate data can automatically result in a suspension of funding and the start of legal actions against representatives of the agency. Because of the high priority given to this data by the FTA, since it controls funding allocations in the formula funding programs, no extensions or exceptions are usually allowed. Because of Homeland Security issues, safety and security are currently a high priority with the FTA in their reviews. An additional initiative that currently has national prominence is Human Services Transit and Transportation Coordination, an effort to promote cooperation and shared efficiencies between government providers of transportation services. This is exemplified by the federal United We Ride program as well as parallel state programs mandated by an Executive Order and the USDOT. With RTS being the primary transit provider for both regular route service and demand response in the region, little coordination is possible or required in this instance. Page 46
132 4. SYSTEM NEED ASSESSMENT STAKEHOLDER INTERVIEWS Direct interviews were conducted with several stakeholders from the community to gain insight on how well current transit services are meeting community needs and if there are new areas that transit should try to serve. Interviews were conducted in person or over the phone during March 2008 The following individuals were interviewed: Mayor Alan Hanks Councilman Ron Weifenbach Councilman Lloyd LaCroix Ms Shelly Shock Ms. Ellen Sylliaasen Ms. Nadine Zeller Ms. Joy Rehfield Mr. Mike Kenton SUMMARY OF COMMENTS The mix of transit services seems to be doing a pretty good job in the community. Overall impression is the system looks professional and is well managed. There are several areas that should be evaluated for expanded route service: Rapid Valley (includes connections to schools) Deadwood Avenue Rushmore Crossing Cabelas area North Haines area Lower income housing developments on periphery of town Page 47
133 Some better connections should be evaluated to longer distance destinations including: Rapid City Regional Airport Ellsworth Air Force Base Current route structure emphasizes east side of town, perhaps need more service on the west side for better balance. Generally, OK with the concept of fixed-route service operating in key parts of the community but demand response service needs to be available across the entire community Some people have been asking for service to operate later in the evening and more on weekends. The transfer/wait time in downtown tends to get pretty long for customers A downtown promotion zone (free or reduced fare) might be a good idea. Stakeholders and customers could use more information on services available, consider more advertising on TV and in the newspapers. Most users probably can t afford much more (with regard to a possible fare increase) Equipment seems to be pretty good Could use more shelters in town Cost of monthly bus pass is good deal Need to over come perception problem (that service is for elderly, disabled or low-income in town) If we could improve on directness of travel to better compete with car travel, we might attract new riders. DRIVER S INPUT SESSION A meeting was held with drivers from the RTS to gather input on operational needs. The session was held on March 18, 2008 from 6:30 to 7:30 pm at the CSAC Building. 12 drivers attended the session. SUMMARY OF COMMENTS All bus routes should be top priority in the city for snow and ice control (plowing and sanding) A/B system of routes appears to be confusing to lots of riders as they are never quite sure which route is running; possibility that this detracts from the overall safety of the system as customers tend to cross streets at the last minute, sometimes mid block, to reach the bus. Page 48
134 There is inconsistent spacing of bus stops along routes leading to passenger complaints Need a line painted on the curb or some other type of marking to let driver s know where to line up to match the wheelchair loading area at the bus stops. Customers asking for fixed route service to: Deadwood Avenue West Main Stevens High School Western Dakota Vo-Tech Rapid Valley Shelters that are not longer used for routes should be removed to reduce customer confusion North Street/East Boulevard North Shelter northbound on 5th is too close to the intersection at the Hospital Shelter on west side should be down by the flashing light Lakota Homes pick up should be switched to B lap instead of A : to eliminate traffic crossing issue. Can another hub be identified so not all routes have to come downtown Impacts of blockages by trains are very significant on schedules Drivers should have procedural training/books for what to do in emergency situations example of an elderly customer medical situation given where the driver was unsure of proper response. Can day passes be sold for visitors Any possibility of adding a step to assist elderly getting on the vehicles. Can drivers have a list of bus stops to give to customers The trolley should be hubbed out of the downtown area and not the MBTC. More information on who can use the trolley should be available in town. Perhaps trolley ticket can come with a discount to other merchant services in town. COMMUNITY INPUT SESSION Two (2) public meetings were conducted to gather input on: 1. March 18, 2008: 12:00 pm to 2:00 pm 2. March 18, 2008: 3:00 pm to 5:00 pm Page 49
135 Both sessions were held at the CSAC Building. Thirty-seven (37) individuals attended and singed in to the meetings. Staff from the City and RTS also attended. Comment cards were available for those that wanted to provide written comments (attached). Each session began with an overview of the meeting. Background information on the available transit services in Rapid City was also presented. The primary discussion topic of each session was how well are current transit services meeting the needs of the community. From that general theme, many service and operations changes were discussed: Areas served in town Time service is available Cost to users Information about services Facilities and equipment Destinations in town that should have the highest degree of regular route service Many positive comments regarding current services were received. SUMMARY OF COMMENTS Service Coverage Expand routes to cover Sheridan Lake Road and the Sandstone Ridge residential area Need weekend service (fixed route and demand response) Provide Sunday service at least from 8:00 am to noon Need service later in the evening (to 8:00 pm or 9:00 pm) (fixed route and demand response) Provide evening service at a minimum on Fridays and Saturdays (fixed route and demand response) Provide route to Canyon Lake Senior Citizen Center Need an east-west route connector running fully across the community (Ellsworth Air Force Base to west city limits) Will need route service to new mall (Rushmore Crossing) Need route service to Rapid Valley (at least to call center locations) Will need route service extension to new residential developments soon to be annexed area (east side) Page 50
136 Need route service to Western Dakota Vocational Technical School Need route service to Department of Motor Vehicles A second transfer point is needed (perhaps the mall) Expand routes to serve Eagle Ridge residential area Expand routes to serve North Rapid (Haines) residential areas Need to coordinate bus schedules better with school schedules to provide better access to Central High School Establish better coordination between all transportation providers in town to provide better after school options for youth (Boys & Girls Clubs, YMCA) Need route service to Industrial Park area Need route service to Deadwood Avenue Need to add a stop to Route 1B along Anamosa at Holcomb (long distance between current stops) Look at options to provide some degree of 24/7 service coverage through use of a private provider like Bismarck uses Consider opening demand response service to general public during evening hours Request to keep stop at Elm/East St. Anne if restructuring routes Operations Some drivers not keeping to routes (#5) Route service users understand increases in operating costs and would generally support increase in fares Demand response service users are aware of operating cost increase but are concerned that many users might have a tough time if fares increased. Should allow demand response users to change trip reservations within 4 hours of scheduled trip time if urgent situation arises (like poor weather). Consider using travel trainers/transit ambassadors to work with new customers to reduce confusion/fear over using services. Can list of individual bus stops be placed on web site (or made available in other forms)? Can a yearly transit pass be sold City should be working more with developers to incorporate plans for transit early on in developments Page 51
137 Look at patterns of demand response users to see if some of those trips can be shifted to more economical fixed route service Transit service information packets should be available at locations across the city Key Destinations for Fixed Route Service The following locations were identified as places that should have the highest degree of fixed route service in the community: Downtown retail areas Library Post office Civic Center Hospitals and medical centers Department of Social Services Black Hills Workshop Senior centers Shopping centers (malls, neighborhood centers, and major stand-alone stores) Entertainment centers (restaurants, movie theaters) Page 52
138 5. SERVICE OPTIONS The current route structure and schedules have some several significant shortcomings. The 35-minute frequency is not a multiple that can easily be comprehended by customers. The A-B alternating route configurations are not exact mirror images of each other and are viewed as confusing by new and existing customers. The hubbed route configuration requires through riders to transfer downtown and endure on average an 8-minute layover at the MBTC. The pulsed schedule requires all buses to wait for each other before departing on the next scheduled trip. The TDP considered several options to reconfigure the fixed route portion of the service. The overall goal for the development of service options was to improve the travel time and level of convenience for the regular route system in order to improve services for current riders and attract more choice and general public riders. Before undertaking the evaluation of service options, several service planning strategies were developed to help guide that effort. SERVICE PLANNING STRATEGIES 1. Consolidate two or more high-ridership routes into a run-through configuration. Extended route would cover as much of the city as possible within the schedule allowance (example: Rushmore Mall to Medical Center) with one route, with two buses assigned to run in opposing directions. 2. Overlap routes in the community to enable route crossings or meets in other parts of city outside of downtown thereby maximizing the number of inter-route transfer points to ultimately shorten trips and improve travel options. 3. Reduce layover time to no more than 15 per cent of the operating schedule. Routes meeting at the MBTC should operate as much as possible as timed transfers. 4. Routes should be configured as bi-directional service, with minimized route deviations by directions or time of day. 5. Route coverage in core areas should result in three blocks or less walking distance to bus routes with service frequency of once per hour or better on the regular route. 6. Service headways should be multiples of 30 or 60 minutes to allow for repeating schedule offsets throughout the day. 7. Evaluate the costs and benefits of expanded service for evenings and weekends. 8. Consider using Dial-A-Ride for low-ridership route segments and service during fringe periods (i.e., evenings) with same-day or short-response calls. 9. Reduce reliance on using existing MBTC bus bays for all route connections as the current pull-in/back-out configuration hinders operations. During pull-outs, this movement requires buses to back up and to leave in sequence. The configuration also hinders use of wheelchair lifts and restricts accessibility. 10. Look for opportunities to serve emerging development areas in Rapid City. Page 53
139 The key analysis assumptions were as follows: An annual population growth rate of 1.5 percent for the city per estimate of 2030 population. This rate is used to estimate annual system ridership changes if no significant service changes are implemented. System costs will increase 5.9 percent from 2008 to 2009 based on recent budget proposals. Beyond that, costs are estimated to increase 4.0 percent each year through 2013 based on recent trends. A fare increase of 50 percent was assumed since no fare increase has been implemented in 16 years. Ridership may potentially decrease initially in response to any fare increase. A one-time drop of 5 percent was included to present the anticipated worst-case budget estimates. Fixed Route Alternative 1: Maintain Existing Routes Under this alternative, there would be no significant route or schedule changes. The case for maintaining the existing service can be made as the system has reversed the downward ridership trend from the early years of the decade and added a fifth route to the core service area. The route structure would be as shown on Figure 5-1. Figure 5-1 Page 54
140 The estimated costs to operate the fixed route and demand response services for the period 2009 through 2013 are shown in Table 5-1. The costs do not anticipate any service changes from current levels. The ridership estimates do anticipate continued growth in the system at the rate of growth of the community population but do account for a modest drop in the initial year following a suggested fare increase. The suggested fare increase allows the system farebox recovery level to climb from the anticipated 2008 level of 25 percent to 29 percent by 2011 if the modest growth in ridership is achieved. The cost to extend existing route service to evenings and weekends and to offer demand response was also evaluated. The costs were based on the following service scenarios: Weekday evening service offered initially two days per week (perhaps Wednesday and Friday) for three hours beyond the current close of service. Weekend service offered initially one day per week (most likely Saturday before Sunday) for a period of eight hours. The costs, ridership and revenue estimates for evening, weekend and combined service are presented in Tables 5-2 through 5-4. Table 5-1 Existing Service with 12 Weekday Service Hours per Route 2008 (est) Fixed Route Costs $629,551 $666,695 $693,362 $721,097 $749,941 $779,938 Demand Response Costs $984,693 $1,042,790 $1,084,501 $1,127,882 $1,172,997 $1,219,917 Total Costs $1,614,244 $1,709,484 $1,777,864 $1,848,978 $1,922,937 $1,999,855 Fixed Route Ridership 235, , , , , ,325 Demand Response Ridership 93,272 92,998 94,393 95,809 97,246 98,705 Total Ridership 329, , , , , ,029 Fixed Route Revenue $238,294 $275,113 $279,239 $283,428 $287,679 $291,994 Demand Response Revenue $172,236 $201,899 $204,927 $248,001 $251,721 $255,497 Total Revenue $410,530 $477,011 $484,167 $531,429 $539,401 $547,492 Net Cost $1,203,714 $1,232,473 $1,293,697 $1,317,549 $1,383,537 $1,452,363 Farebox Recovery 25% 28% 27% 29% 28% 27% Page 55
141 The cost estimate to operating limited evening service (two days per week, three hours per day) using the existing route structure is shown in Table 5-2: Table 5-2 Existing Service with 12 Weekday Service Hours per Route plus Limited Evening Service Fixed Route Costs $733,364 $762,699 $793,206 $824,935 $857,932 Demand Response Costs $1,147,069 $1,192,952 $1,240,670 $1,290,296 $1,341,908 Total Costs $1,880,433 $1,955,650 $2,033,876 $2,115,231 $2,199,840 Fixed Route Ridership 236, , , , ,139 Demand Response Ridership 97,183 98, , , ,146 Total Ridership 333, , , , ,286 Fixed Route Revenue $287,493 $291,805 $296,182 $300,625 $305,134 Demand Response Revenue $210,984 $214,149 $259,162 $263,049 $266,995 Total Revenue $498,477 $505,954 $555,344 $563,674 $572,129 Net Cost $1,381,956 $1,449,696 $1,478,533 $1,551,557 $1,627,712 Farebox Recovery 27% 26% 27% 27% 26% Net Cost Above Base Ridership Above Base Net Cost per New Rider $149,483 $155,999 $160,984 $168,021 $175,348 14,374 14,590 14,809 15,031 15,256 $10.40 $10.69 $10.87 $11.18 $11.49 Page 56
142 The cost estimate to operating limited evening service (two days per week, three hours per day) using the existing route structure is shown in Table 5-3: Table 5-3 Existing Service with 12 Weekday Service Hours per Route plus Saturday Fixed Route Costs $755,587 $785,811 $817,243 $849,933 $883,930 Demand Response Costs $1,181,829 $1,229,102 $1,278,266 $1,329,396 $1,382,572 Total Costs $1,937,416 $2,014,912 $2,095,509 $2,179,329 $2,266,502 Fixed Route Ridership 238, , , , ,822 Demand Response Ridership 97,834 99, , , ,837 Total Ridership 336, , , , ,659 Fixed Route Revenue $289,418 $293,760 $298,166 $302,639 $307,178 Demand Response Revenue $212,398 $215,584 $260,898 $264,811 $268,783 Total Revenue $501,816 $509,343 $559,064 $567,450 $575,961 Net Cost $1,435,600 $1,505,569 $1,536,445 $1,611,880 $1,690,541 Farebox Recovery 26% 25% 27% 26% 25% Net Cost Above Base $203,127 $211,872 $218,896 $228,343 $238,178 Ridership Above Base 16,610 16,859 17,112 17,369 17,630 Net Cost per New Rider $12.23 $12.57 $12.79 $13.15 $13.51 Page 57
143 The cost estimate to operating limited evening service (two days per week, three hours per day) using the existing route structure is shown in Table 5-4: Table 5-4 Existing Service with 12 Weekday Service Hours per Route plus Limited Evening plus Saturday Fixed Route Costs $822,257 $855,147 $889,353 $924,927 $961,924 Demand Response Costs $1,286,108 $1,337,552 $1,391,054 $1,446,696 $1,504,564 Total Costs $2,108,364 $2,192,699 $2,280,407 $2,371,623 $2,466,488 Fixed Route Ridership 248, , , , ,636 Demand Response Ridership 102, , , , ,279 Total Ridership 350, , , , ,915 Fixed Route Revenue $301,798 $306,325 $310,920 $315,584 $320,318 Demand Response Revenue $221,483 $224,805 $272,058 $276,138 $280,281 Total Revenue $523,281 $531,131 $582,978 $591,723 $600,598 Net Cost $1,585,083 $1,661,568 $1,697,429 $1,779,900 $1,865,889 Farebox Recovery 25% 24% 26% 25% 24% Net Cost Above Base Ridership Above Base Net Cost per New Rider $381,369 $429,095 $403,731 $462,351 $482,353 21,315 36,241 36,784 37,336 37,896 $17.89 $11.84 $10.98 $12.38 $12.73 Page 58
144 Fixed Route Alternative 2: Revise Existing Routes Under this alternative, there would be significant route and schedule changes implemented following the service planning strategies previously identified. A number of route configuration options were considered and tested in the field before selecting the following route structure for possible implementation. The proposed routes are shown in Figures 5-2 through 5-6. Figure 5-2 Page 59


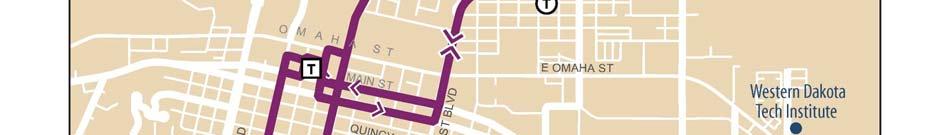
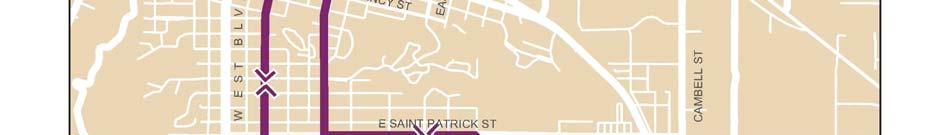
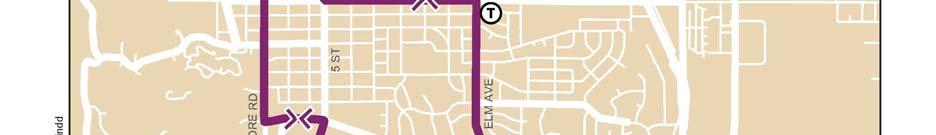
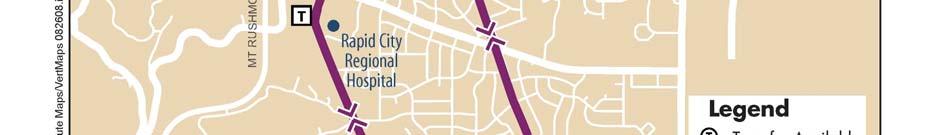
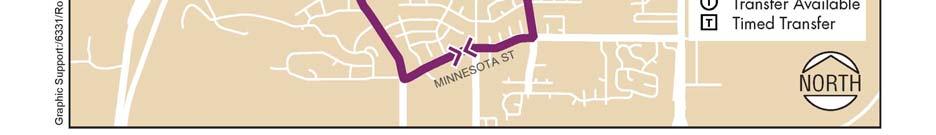
145 Figure 5-3 Page 60
146 Figure 5-4 Page 61

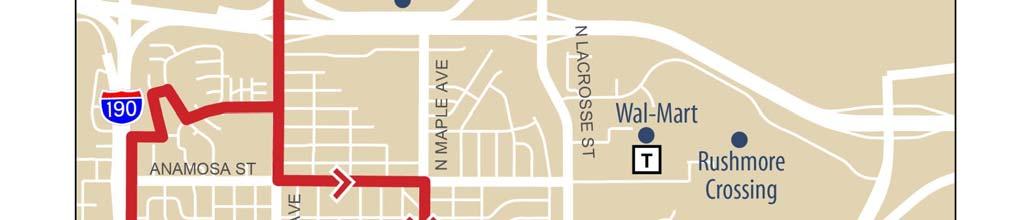
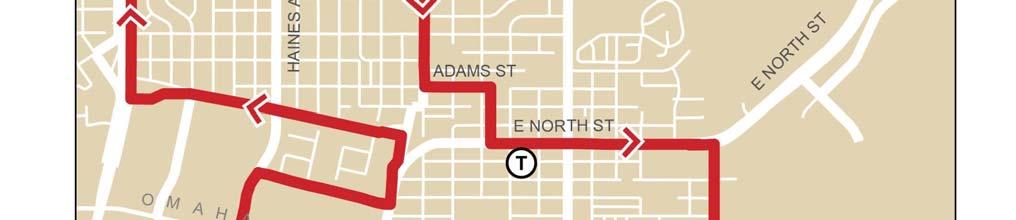
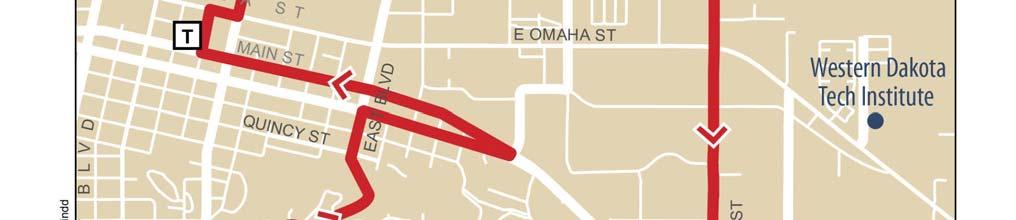
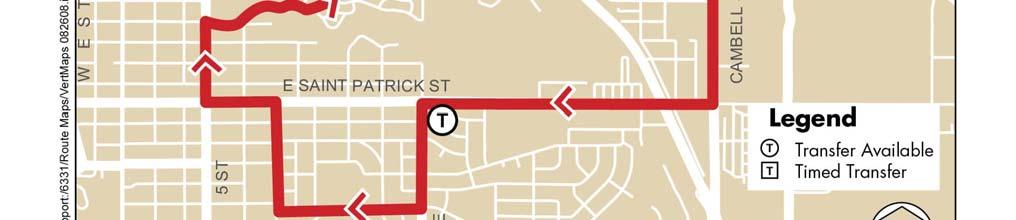
147 Figure 5-5 Page 62
148 Figure 5-6 Page 63
149 Figure 5-7 Page 64
150 The cost to implement the revised route structure for weekday service along with the expected ridership and resulting revenues are shown in Table 5-5. The costs for weekday service are the same as would be expected to continue operating the existing routes but the ridership is expected to grow under the new route configuration because of reductions in customer travel times and increased number of daily bus trips resulting from the schedule modifications. Under this alternative, the system farebox recovery level is expected to be around the 30 percent level for all years of the TDP incorporating the proposed fare increase. Table 5-5 Revised Routes Weekday Service 2008 (est) Fixed Route Costs $629,551 $666,695 $693,362 $721,097 $749,941 $779,938 Demand Response Costs $984,693 $1,042,790 $1,084,501 $1,127,882 $1,172,997 $1,219,917 Total Costs $1,614,244 $1,709,484 $1,777,864 $1,848,978 $1,922,937 $1,999,855 Fixed Route Ridership 235, , , , , ,349 Demand Response Ridership 93,272 92,998 95,337 96,767 98,219 99,692 Total Ridership 329, , , , , ,041 Fixed Route Revenue $238,294 $308,097 $315,846 $320,584 $325,392 $330,273 Demand Response Revenue $172,236 $201,899 $206,977 $250,481 $254,239 $258,052 Total Revenue $410,530 $509,996 $522,823 $571,065 $579,631 $588,326 Net Cost $1,203,714 $1,199,488 $1,255,041 $1,277,913 $1,343,306 $1,411,529 Farebox Recovery 25% 30% 29% 31% 30% 29% Page 65
151 The cost and benefits of implementing limited evening and weekend service along with the proposed routes restructuring were also evaluated. The results are presented in Tables 5-6 through 5-8. Table 5-6 Revised Routes with Evening Service Fixed Route Costs $733,364 $762,699 $793,206 $824,935 $857,932 Demand Response Costs $1,147,069 $1,192,952 $1,240,670 $1,290,296 $1,341,908 Total Costs $1,880,433 $1,955,650 $2,033,876 $2,115,231 $2,199,840 Fixed Route Ridership 259, , , , ,335 Demand Response Ridership 97,183 99, , , ,178 Total Ridership 356, , , , ,513 Fixed Route Revenue $321,962 $330,059 $335,010 $340,035 $345,136 Demand Response Revenue $210,984 $216,291 $261,753 $265,679 $269,665 Total Revenue $532,946 $546,350 $596,763 $605,714 $614,800 Net Cost $1,347,487 $1,409,301 $1,437,113 $1,509,517 $1,585,040 Farebox Recovery 28% 28% 29% 29% 28% Net Cost Above Base $147,999 $154,259 $159,200 $166,210 $173,511 Ridership Above Base 15,366 15,752 15,989 16,228 16,472 Net Cost per New Rider $9.63 $9.79 $9.96 $10.24 $10.53 Rapid City Transit Development Plan
152 Table 5-7 Revised Routes with Saturday Service Fixed Route Costs $755,587 $785,811 $817,243 $849,933 $883,930 Demand Response Costs $1,181,829 $1,229,102 $1,278,266 $1,329,396 $1,382,572 Total Costs $1,937,416 $2,014,912 $2,095,509 $2,179,329 $2,266,502 Fixed Route Ridership 261, , , , ,200 Demand Response Ridership 97, , , , ,876 Total Ridership 359, , , , ,075 Fixed Route Revenue $324,118 $332,270 $337,254 $342,313 $347,447 Demand Response Revenue $212,398 $217,739 $263,506 $267,459 $271,471 Total Revenue $536,516 $550,009 $600,760 $609,772 $618,918 Net Cost $1,400,900 $1,464,903 $1,494,748 $1,569,557 $1,647,584 Farebox Recovery 28% 27% 29% 28% 27% Net Cost Above Base $201,411 $209,862 $216,835 $226,251 $236,054 Ridership Above Base 17,756 18,203 18,476 18,753 19,034 Net Cost per New Rider $11.34 $11.53 $11.74 $12.06 $12.40 Table 5-8 Revised Routes with Evening and Saturday Service Fixed Route Costs $822,257 $855,147 $889,353 $924,927 $961,924 Demand Response Costs $1,286,108 $1,337,552 $1,391,054 $1,446,696 $1,504,564 Total Costs $2,108,364 $2,192,699 $2,280,407 $2,371,623 $2,466,488 Fixed Route Ridership 272, , , , ,185 Demand Response Ridership 102, , , , ,362 Total Ridership 374, , , , ,547 Fixed Route Revenue $337,983 $346,483 $351,680 $356,955 $362,310 Demand Response Revenue $221,483 $227,053 $274,778 $278,900 $283,083 Total Revenue $559,466 $573,536 $626,458 $635,855 $645,393 Net Cost $1,548,898 $1,619,162 $1,653,948 $1,735,768 $1,821,095 Farebox Recovery 27% 26% 27% 27% 26% Net Cost Above Base $349,410 $364,121 $376,035 $392,461 $409,565 Ridership Above Base 33,122 33,955 34,464 34,981 35,506 Net Cost per New Rider $10.55 $10.72 $10.91 $11.22 $11.54 Rapid City Transit Development Plan
153 REVENUE ANALYSIS There has been no fare increase for the RTS in some 16 years. Since that time, the cost of operations has grown dramatically because of increased labor, fuel and maintenance costs. In recent times, operating costs have been significantly affected by rapidly rising fuel costs. In the first half of 2008, the cost of fuel for RTS increased over 50 percent from the previous year. Around the region, many systems have already adopted or are planning for fare increases to respond to the rapidly changing operating costs. As a result, the TDP considered options to increase the user fares across the system. After evaluating many options, the Fare Alternative 1 was developed for consideration. Fare Alternative 1 The alternative incorporates several significant changes for RTS. First, a $0.50 increase in the single ride fixed route fare is suggested. That results in an increase of $0.25 in the senior fare. The fixed route monthly pass is suggested to increase by $5.00 for both adults and students. For Dial-A-Ride, it is suggested that an increase be implemented that will result in the base fare being twice the fixed route base fare for the majority of users but that increase should be phased in along with the adoption of a zone system for Dial-A-Ride. The zone system is suggested to recognize that the cost of serving trips on the far edges of the community are very costly to provide and that users should be expected to pay a part of that additional cost. The definition of the zones is suggested to follow the ADA guidance for providing Dial-A-Ride service in that Zone 1 is suggested to be all areas in the community within 3/4-mile of the fixed route system. Zone 2 would then be all areas outside of 3/4-mile of the fixed route system out to the edges of the community. Exceptions could be made for key activity generators right along the boundaries if there is a need. Over 85 percent of the city population is within Zone 1 so the impacts are limited to a modest group. The shape of the zone structure is shown in Figure 5-7. Rapid City Transit Development Plan

154 Figure 5-8 To ease the impact of the fare increase and the zone system for Dial-A-Ride, it is suggested that the increase be phased in with the Zone 1 fare at $2.50 for 2009 and 2010 and then increase to twice the fixed route rate at $3.00 by The Zone 2 fare would be $0.50 more during each period. Another suggested modification is to offer an unlimited ride pass for Dial-A-Ride users as a means of convenience for regular users. It is recommended that the monthly rate be set at $90.00 and that would be accepted for Zone 1 and Zone 2 trips. Rapid City Transit Development Plan
Existing Services, Ridership, and Standards Report. June 2018
 Existing Services, Ridership, and Standards Report June 2018 Prepared for: Prepared by: Contents Overview of Existing Conditions... 1 Fixed Route Service... 1 Mobility Bus... 34 Market Analysis... 41 Identification/Description
Bristol Virginia Transit
 Bristol Virginia Transit 1 Transit Overview Bristol Virginia Transit (BVT) is a Federally Funded and certified urban area transit system. BVT began operation in its current form in 1982. In Fiscal Year
APPENDIX B COMMUTER BUS FAREBOX POLICY PEER REVIEW
 APPENDIX B COMMUTER BUS FAREBOX POLICY PEER REVIEW APPENDIX B COMMUTER BUS FAREBOX POLICY PEER REVIEW The following pages are excerpts from a DRAFT-version Fare Analysis report conducted by Nelson\Nygaard
Chapter 3. Burke & Company
 Chapter 3 Burke & Company 3. WRTA RIDERSHIP AND RIDERSHIP TRENDS 3.1 Service Overview The Worcester Regional Transit Authority (WRTA) provides transit service to over half a million people. The service
Executive Summary. Introduction. Community Assessment
 Executive Summary Introduction The Red Rose Transit Authority (RRTA) Transit Development Plan provides an evaluation of existing RRTA fixed route services, with the outcome being practical recommendations
APPENDIX B. Arlington Transit Peer Review Technical Memorandum
 APPENDIX B Arlington Transit Peer Review Technical Memorandum Arlington County Appendix B December 2010 Table of Contents 1.0 OVERVIEW OF PEER ANALYSIS PROCESS... 2 1.1 National Transit Database...2 1.2
Date: 11/6/15. Total Passengers
 Total San Diego Metropolitan Transit System POLICY 42 PERFORMANCE MONITORING REPORT Page 1 of 6 OBJECTIVE Develop a Customer-Focused and Competitive System The following measures of productivity and service
Att. A, AI 46, 11/9/17
 Total s San Diego Metropolitan Transit System POLICY 42 PERFORMANCE MONITORING REPORT Page 1 of 6 Date: 11/8/17 OBJECTIVE Develop a Customer-Focused and Competitive System The following measures of productivity
Fixed-Route Operational and Financial Review
 Chapter II CHAPTER II Fixed-Route Operational and Financial Review Chapter II presents an overview of route operations and financial information for KeyLine Transit. This information will be used to develop
City of Murfreesboro. Transit Service and Management Alternatives
 City of Murfreesboro Transit Service and Management Alternatives May, 2005 Table of Contents 1. Introduction... 1 2. Transit Needs... 2 2.1 Demographics...2 2.2 Existing Transit Services...2 2.3 Focus
CHAPTER 2 COUNTY PROFILE
 COUNTY PROFILE CHAPTER 2: COUNTY PROFILE This chapter provides a profile of Amador County, California, in the planning context of parks and recreation services. This profile includes a description of the
JATA Market Research Study Passenger Survey Results
 JATA Market Research Study Passenger Survey Results Prepared for the Jackson Area Transportation Authority (JATA) April, 2015 3131 South Dixie Hwy. Suite 545 Dayton, OH 45439 937.299.5007 www.rlsandassoc.com
PUBLIC TRANSIT IN KENOSHA, RACINE, AND MILWAUKEE COUNTIES
 PUBLIC TRANSIT IN KENOSHA, RACINE, AND MILWAUKEE COUNTIES #118404v1 Regional Transit Authority June 19, 2006 1 Presentation Overview Existing Public Transit Transit System Peer Comparison Recent Transit
1 DEMAND RESPONSE OVERVIEW
 1 DEMAND RESPONSE OVERVIEW Forty-nine transit agencies in Ohio operate demand response service, not including demand response services operated as part of the transit service provided in conjunction with
Airport Planning Area
 PLANNING AREA POLICIES l AIRPORT Airport Planning Area LOCATION AND CONTEXT The Airport Planning Area ( Airport area ) is a key part of Boise s economy and transportation network; it features a multi-purpose
October REGIONAL ROUTE PERFORMANCE ANALYSIS
 October 2018 2017 REGIONAL ROUTE PERFORMANCE ANALYSIS The Council s mission is to foster efficient and economic growth for a prosperous metropolitan region Metropolitan Council Members Alene Tchourumoff
RACINE COUNTY PUBLIC TRANSIT PLAN:
 RACINE COUNTY PUBLIC TRANSIT PLAN: 2013-2017 Recommended Transit Service Improvement Plan NEWSLETTER 3 SEPTEMBER 2013 This newsletter describes the final recommended public transit plan for the City of
Transportation Development Plan Janesville Transit System
 Transportation Development Plan Janesville Transit System Final Report Prepared for City of Janesville Janesville Transit System Janesville Metropolitan Planning Organization Prepared by Urbitran Associates,
COUNCIL AGENDA REPORT
 COUNCIL AGENDA REPORT Meeting Date: 6 June 2016 Subject: Boards Routed Through: 2017 Airdrie Transit s Community Services Advisory Board Date: 9 May 2016 Issue: Council is being asked to endorse the 2017
Public Transit Services on NH 120 Claremont - Lebanon
 Public Transit Services on NH 120 Claremont - Lebanon Overview of Preferred Alternative April 12, 2011 Presentation Overview Study Goals Quick Review Methodology and Approach Key Findings Results of Public
METROPOLITAN EVANSVILLE TRANSIT SYSTEM Part I: Comprehensive Operations Analysis Overview July 9 th, 2015 Public Information Meeting
 METROPOLITAN EVANSVILLE TRANSIT SYSTEM Part I: Comprehensive Operations Analysis Overview July 9 th, 2015 Public Information Meeting AGENDA 5:30 5:40 Open House 5:40 6:30 Presentation Comprehensive Operations
Like many transit service providers, the Port Authority of Allegheny County (Port Authority) uses a set of service level guidelines to determine
 uses a set of service level guidelines to determine") Transit service consists of two fundamental elements: frequency (how often service operates) and service span (how long service runs during the day). Combined, these two factors measure how much service
Transit service consists of two fundamental elements: frequency (how often service operates) and service span (how long service runs during the day). Combined, these two factors measure how much service
Title VI Service Equity Analysis
 Pierce Transit Title VI Service Equity Analysis Pursuant to FTA Circular 4702.1B September 2013 Service Change February 2013 Page intentionally left blank PIERCE TRANSIT TITLE VI SERVICE EQUITY ANALYSIS
ECONOMIC PROFILE PARK CITY & SUMMIT COUNTY, UTAH
 ECONOMIC PROFILE PARK CITY & SUMMIT COUNTY, UTAH Prepared by the Park City Chamber of Commerce & Visitors Bureau PO Box 1630, Park City, UT 84060 1.800.453.1360 Economic Profile Packet Sections 1. Introduction
SAN LUIS OBISPO TRANSIT + SAN LUIS OBISPO RTA JOINT SHORT RANGE TRANSIT PLANS: SERVICE STRATEGIES. Presented by: Gordon Shaw, PE, AICP; Principal
 SAN LUIS OBISPO TRANSIT + SAN LUIS OBISPO RTA JOINT SHORT RANGE TRANSIT PLANS: SERVICE STRATEGIES Presented by: Gordon Shaw, PE, AICP; Principal Project Status Review of existing services and setting complete
SAMTRANS TITLE VI STANDARDS AND POLICIES
 SAMTRANS TITLE VI STANDARDS AND POLICIES Adopted March 13, 2013 Federal Title VI requirements of the Civil Rights Act of 1964 were recently updated by the Federal Transit Administration (FTA) and now require
Prior to reviewing the various performances of Red Apple Transit, it is important to point out some key terminology, including:
 CHAPTER IV INTRODUCTION Chapter IV presents an overview of operations and financial information for Red Apple Transit. Information on the current system ridership is also presented. This information was
St. Johns County Transit Development Plan Update
 St. Johns County Transit Development Plan Update 2012-2021 Demographic Information Population 190,000 people in 2010 51% increase from 2000 Employment 64% over age 16 in labor force St. Augustine, Ponte
COLT RECOMMENDED BUSINESS PLAN
 COLT RECOMMENDED BUSINESS PLAN 2008 INTRODUCTION The past decade has been one of change in Lebanon County and this situation is expected to continue in the future. This has included growth in population,
Rides Mass Transit District. Jackson County Mass Transit District. FY 2020 Program of Projects (POP) Carbondale UZA
 Carbondale UZA") Rides Mass Transit District Jackson County Mass Transit District FY 2020 Program of Projects (POP) Carbondale UZA General Rides Mass Transit District (RMTD) is the public transportation provider for the
Rides Mass Transit District Jackson County Mass Transit District FY 2020 Program of Projects (POP) Carbondale UZA General Rides Mass Transit District (RMTD) is the public transportation provider for the
Interstate 90 and Mercer Island Mobility Study APRIL Commissioned by. Prepared by
 Interstate 90 and Mercer Island Mobility Study APRIL 2017 Commissioned by Prepared by Interstate 90 and Mercer Island Mobility Study Commissioned by: Sound Transit Prepared by: April 2017 Contents Section
Mount Pleasant (42, 43) and Connecticut Avenue (L1, L2) Lines Service Evaluation Study Open House Welcome! wmata.com/bus
 and Connecticut Avenue (L1, L2) Lines Service Evaluation Study Open House Welcome! wmata.com/bus") Mount Pleasant (42, 43) and Connecticut Avenue (L1, L2) Lines Service Evaluation Study Open House Welcome! Study Overview and Timeline Phase 1: Collect and Analyze Data Project Kickoff, September 2017
Mount Pleasant (42, 43) and Connecticut Avenue (L1, L2) Lines Service Evaluation Study Open House Welcome! Study Overview and Timeline Phase 1: Collect and Analyze Data Project Kickoff, September 2017
3. Proposed Midwest Regional Rail System
 3. Proposed Midwest Regional Rail System 3.1 Introduction The proposed Midwest Regional Rail System (MWRRS) will operate in nine states, encompass approximately 3,000 route miles and operate on eight corridors.
2 YORK REGION TRANSIT MOBILITY PLUS 2004 SYSTEM PERFORMANCE REVIEW
 2 YORK REGION TRANSIT MOBILITY PLUS 2004 SYSTEM PERFORMANCE REVIEW The Joint Transit Committee and Rapid Transit Public/Private Partnership Steering Committee recommends the adoption of the recommendation
Establishes a fare structure for Tacoma Link light rail, to be implemented in September 2014.
 RESOLUTION NO. R2013-24 Establish a Fare Structure and Fare Level for Tacoma Link MEETING: DATE: TYPE OF ACTION: STAFF CONTACT: PHONE: Board 09/26/2013 Final Action Ric Ilgenfritz, Executive Director,
Chapter 1 Introduction
 Chapter 1 Introduction Purpose of the Report This report provides a Strategic Transit Master Plan for public transportation on behalf of the Metropolitan Transit Authority (MTA) and the Nashville Metropolitan
DISTRICT EXPRESS LANES ANNUAL REPORT FISCAL YEAR 2017 JULY 1, 2016 JUNE 30, FloridaExpressLanes.com
 DISTRICT EXPRESS LANES ANNUAL REPORT FISCAL YEAR 2017 JULY 1, 2016 JUNE 30, 2017 FloridaExpressLanes.com This page intentionally left blank. TABLE OF CONTENTS List of Figures... ii List of Tables.... ii
ARLINGTON COUNTY, VIRGINIA. County Board Agenda Item Meeting of February 22, 2014
 ARLINGTON COUNTY, VIRGINIA County Board Agenda Item Meeting of February 22, 2014 DATE: January 23, 2014 SUBJECT: Request to authorize advertisement of a public hearing to consider an ordinance amending
(This page intentionally left blank.)
") Executive Summary (This page intentionally left blank.) Executive Summary INTRODUCTION The Cache Valley Transit District (CVTD) contracted with the team of Transportation Consultants, Inc. () and Fehr
Executive Summary (This page intentionally left blank.) Executive Summary INTRODUCTION The Cache Valley Transit District (CVTD) contracted with the team of Transportation Consultants, Inc. () and Fehr
Minutes of the Third Meeting THE WASHINGTON COUNTY TRANSIT DEVELOPMENT PLAN ADVISORY COMMITTEE
 Minutes of the Third Meeting THE WASHINGTON COUNTY TRANSIT DEVELOPMENT PLAN ADVISORY COMMITTEE Date: May 8, 2013 Time: 9:30 a.m. Place: Conference Room 249 Washington Highway Department 900 Lang Street
Mobile Farebox Repair Program: Setting Standards & Maximizing Regained Revenue
 Mobile Farebox Repair Program: Setting Standards & Maximizing Regained Revenue Michael J. Walk, Chief Performance Officer Larry Jackson, Directory of Treasury Maryland Transit Administration March 2012
FORECASTING FUTURE ACTIVITY
 EXECUTIVE SUMMARY The Eagle County Regional Airport (EGE) is known as a gateway into the heart of the Colorado Rocky Mountains, providing access to some of the nation s top ski resort towns (Vail, Beaver
Word Count: 3,565 Number of Tables: 4 Number of Figures: 6 Number of Photographs: 0. Word Limit: 7,500 Tables/Figures Word Count = 2,250
 Katherine F. Turnbull, Ken Buckeye, Nick Thompson 1 Corresponding Author Katherine F. Turnbull Executive Associate Director Texas Transportation Institute Texas A&M University System 3135 TAMU College
New System. New Routes. New Way. May 20, 2014
 Route Optimization I N I T I A T I V E New System. New Routes. New Way. May 20, 2014 1 Welcome Blueprint for Transportation Excellence (BTE) 20 year strategic plan Blueprint 2020 JTA s five-year plan for
FY Year End Performance Report
 Overall Ridership Big Blue Bus carried 18,748,869 passengers in FY2014-2015, a 0.3% reduction from the year prior. This negligible reduction in ridership represents the beginnings of a reversal from a
Development of SH119 BRT Route Pattern Alternatives for Tier 2 - Service Level and BRT Route Pattern Alternatives
 Development of SH119 BRT Route Pattern Alternatives for Tier 2 - Service Level and BRT Route Pattern Alternatives June 1, 2018 Development of SH119 BRT Route Pattern Alternatives for Tier 2 - Service Level
NORTHERN NAPA VALLEY TRANSIT STUDY
 NORTHERN NAPA VALLEY TRANSIT STUDY Draft Final Recommendations Report Submitted by: June 5, 2007 TABLE OF CONTENTS Executive Summary... i ES-1 Project Objectives and Approach... i ES-2 Current Service
Title VI Service Equity Analysis
 Pierce Transit Title VI Service Equity Analysis Pursuant to FTA Circular 4702.1B NE Tacoma Service May 2016 Pierce Transit Transit Development Dept. PIERCE TRANSIT TITLE VI SERVICE EQUITY ANALYSIS TABLE
METRO FLEET FUNDING HUMAN RESOURCES
 2018 FACT SHEET METRO FLEET METRO s overall revenue-producing fleet totals 235 vehicles: 144 large buses and 91 smaller paratransit buses. Some passenger vehicles are equipped with a hydraulic lift to
PREFACE. Service frequency; Hours of service; Service coverage; Passenger loading; Reliability, and Transit vs. auto travel time.
 PREFACE The Florida Department of Transportation (FDOT) has embarked upon a statewide evaluation of transit system performance. The outcome of this evaluation is a benchmark of transit performance that
INDIAN RIVER COUNTY METROPOLITAN PLANNING ORGANIZATION th Street, Vero Beach, Florida, 32960
 Indian River County Transit Development Plan 2014 Annual Update Prepared By: INDIAN RIVER COUNTY METROPOLITAN PLANNING ORGANIZATION 1801 27th Street, Vero Beach, Florida, 32960 Tel (772)226 1672, Fax (772)
Juneau Household Waterfront Opinion Survey
 Juneau Household Waterfront Opinion Survey Prepared for: City and Borough of Juneau Prepared by: April 13, 2004 TABLE OF CONTENTS Executive Summary...1 Introduction and Methodology...6 Survey Results...7
Public Meeting. December 19 th, 2018
 Public Meeting December 19 th, 2018 AGENDA Welcome Market Analysis Existing Services Peer Evaluation Outreach Summary Recommendations Discussion Next Steps MARKET ANALYSIS 3 Demographics 50% of population
Chapter 4. Ridecheck and Passenger Survey
 Chapter 4. Ridecheck and Passenger Survey YOLOBUS operates a mix of local, intercity, commute and rural routes. Because there are limited roadways that intercity and rural routes can operate on, stop by
2012 Boundary Counts October 5, 2011 Skyward Data Populations Within Boundaries October 5, 2011
 STUDENT ACHIEVEMENT ATTENDANCE BOUNDARY CHANGE BACKGROUND INFORMATION: As a result of closing Dakota Middle School at the end of the current school year and opening East Middle School, it is necessary
Airport Profile. St. Pete Clearwater International BY THE NUMBERS 818, ,754 $ Enplanements. Passengers. Average Fare. U.S.
 Airport Profile St. Pete Clearwater International St. Pete-Clearwater International Airport (PIE) is located in Pinellas County, Florida about nine miles north of downwn St. Petersburg, seven miles southeast
A COMPARISON OF THE MILWAUKEE METROPOLITAN AREA TO ITS PEERS
 KRY/WJS/EDL #222377 (PDF: #223479) 1/30/15 PRELIMINARY DRAFT Memorandum Report A COMPARISON OF THE MILWAUKEE METROPOLITAN AREA TO ITS PEERS EXECUTIVE SUMMARY This memorandum report provides a statistical
Regional Fare Change Overview. Nick Eull Senior Manager of Revenue Operations Metro Transit
 Regional Fare Change Overview Nick Eull Senior Manager of Revenue Operations Metro Transit Committee of the Whole April 5 th, 2017 Today s Presentation Fare change goals and considerations Public engagement
CHAPTER FIVE PROSPECTS FOR FUTURE ECONOMIC DEVELOPMENT
 CHAPTER FIVE PROSPECTS FOR FUTURE ECONOMIC DEVELOPMENT 5.1 GENERAL The recommended type and location of future land uses in Alpine should, in part, consider potential opportunities for future economic
HOW TO IMPROVE HIGH-FREQUENCY BUS SERVICE RELIABILITY THROUGH SCHEDULING
 HOW TO IMPROVE HIGH-FREQUENCY BUS SERVICE RELIABILITY THROUGH SCHEDULING Ms. Grace Fattouche Abstract This paper outlines a scheduling process for improving high-frequency bus service reliability based
Transit Peer Comparison
 Transit Peer Comparison October 2016 Based on data from the National Transit Database, US Department of Transportation and the US Census Peer Transit Communities, FY2014 Community County Population Source:
TRANSPORTATION SERVICE Actual
 PERFORMANCE REPORT-THIRD QUARTER VISION TO DELIVER REGIONAL MULTI-MODAL TRANSPORTATION SERVICES AND INFRASTRUCTURE IMPROVEMENTS THAT SIGNIFICANTLY AND CONTINUALLY INCREASE TRANSIT MARKET SHARE. MISSION
Albany Area Metropolitan Planning Organization RTP Project Management Team
 DRAFT MEMORANDUM #5 DATE: September 1, 2015 TO: FROM: Albany Area Metropolitan Planning Organization RTP Project Management Team Scott Chapman Nelson\Nygaard Paul Leitman Nelson\Nygaard SUBJECT: Albany
STEP ALTERNATIVES RANKING TABLE
 ALTERNATIVES RANKING TABLE Priority Ranking 0 = Lowest Priority 1 2 3 4 5 = Highest Priority Abbreviations TD = Transportation Disadvantaged PWD = People with Disabilities I. Existing Enhancements Increase
List of Figures... 4 List of Maps... 6 Introduction... 7 Data Sources... 8
 SERVICE EVALUATION APRIL 2014 Table of Contents List of Figures... 4 List of Maps... 6 Introduction... 7 Data Sources... 8 Service Overview and Service Fundamentals System Overview... 9 Service Area...
EL PASO COUNTY REGIONAL TRANSIT INSTITUTIONAL OPTIONS ASSESSMENT STUDY
 EL PASO COUNTY REGIONAL TRANSIT INSTITUTIONAL OPTIONS ASSESSMENT STUDY Sponsored by: El Paso County Funding Support: Texas Department of Transportation Technical Assistance to the County: Texas A&M Transportation
PTN-128 Reporting Manual Data Collection and Performance Reporting
 2016 PTN-128 Reporting Manual Data Collection and Performance Reporting Sponsored by the Texas Department of Transportation Table of Contents PTN-128 WHAT, WHY AND WHO... 6 What is the PTN-128... 13 Why
METROBUS SERVICE GUIDELINES
 METROBUS SERVICE GUIDELINES In the late 1990's when stabilization of bus service was accomplished between WMATA and the local jurisdictional bus systems, the need for service planning processes and procedures
Quarterly Report Transit Bureau, Local Transit Operations. First Quarter, Fiscal Year 2015 (July 2014 September 2014) ART & STAR
 ART & STAR") Quarterly Report Transit Bureau, Local Transit Operations First Quarter, Fiscal Year 2015 (July 2014 September 2014) ART & STAR A Arlington Transit ART 1) Introduction The purpose of ART is to provide
Quarterly Report Transit Bureau, Local Transit Operations First Quarter, Fiscal Year 2015 (July 2014 September 2014) ART & STAR A Arlington Transit ART 1) Introduction The purpose of ART is to provide
CHAPTER 5: Operations Plan
 CHAPTER 5: Operations Plan Report Prepared by: Contents 5 OPERATIONS PLAN... 5-1 5.1 Proposed Service Changes... 5-2 5.1.1 Fiscal Year 2017... 5-2 5.1.2 Fiscal Year 2018... 5-6 5.1.3 Fiscal Year 2019...
ECONOMIC PROFILE. Tourism
 ECONOMIC PROFILE Tourism Park City & Summit County Utah Prepared by Park City Chamber of Commerce Convention & Visitors Bureau P.O. Box 1630 ~ Park City, UT 84060-1630 800.453.1360 ~ 435.649.6100 ~ fax
Table of Contents. TRANSIT DEVELOPMENT PLAN UPDATE i
 Table of Contents Chapter 1. Introduction... 1 Chapter 2. Financial Review... 3 2.1 Operating Costs... 3 2.2 Capital Costs... 3 2.3 Revenues... 4 2.4 Overall Funding Implications... 4 Chapter 3. Service
Why we re here: For educational purposes only
 Transportation 2050 Why we re here: For educational purposes only Transportation 2050 Bus Elements PUBLIC TRANSIT DEPARTMENT City of Phoenix Citizens Committee on the Future of Phoenix Transportation (CCFPT)
Business Growth (as of mid 2002)
") Page 1 of 6 Planning FHWA > HEP > Planning > Econ Dev < Previous Contents Next > Business Growth (as of mid 2002) Data from two business directories was used to analyze the change in the number of businesses
Page 1 of 6 Planning FHWA > HEP > Planning > Econ Dev < Previous Contents Next > Business Growth (as of mid 2002) Data from two business directories was used to analyze the change in the number of businesses
Evaluating Lodging Opportunities
 Evaluating Lodging Opportunities This section explores market opportunities for new lodging accommodations in the downtown area. It will help you understand travel and visitation trends, existing competition,
Washington Metropolitan Area Transit Authority Services Utilization Study
 Washington Metropolitan Area Transit Authority Services Utilization Study Maryland House Bill 300 Table of Contents Page 2 Executive Summary Slide 3 Notes Slide 4 Metro Systemwide Fact Sheet Slide 5 How
Presentation to the Southeast Corridor High-Performance Transit Alternative Study Public Forum. Overview of MTA. presented by
 Presentation to the Southeast Corridor High-Performance Transit Alternative Study Public Forum Overview of MTA presented by Marian Ott, MTA Board Chair, Planning and Marketing Committee SEPTEMBER 2004
Peer Performance Measurement February 2019 Prepared by the Division of Planning & Market Development
 2017 Regional Peer Review Peer Performance Measurement February 2019 Prepared by the Division of Planning & Market Development CONTENTS EXECUTIVE SUMMARY... 3 SNAPSHOT... 5 PEER SELECTION... 6 NOTES/METHODOLOGY...
SAMTRANS SERVICE PLAN
 Agenda Overview Part I: Key Findings Market Assessment Service Evaluation Part II: Service Development Framework Metrics Criteria Part III: Next Steps SAMTRANS SERVICE PLAN Preliminary Analysis and Criteria
All Door Boarding Title VI Service Fare Analysis. Appendix P.3
 All Door Boarding Title VI Service Fare Analysis Appendix P.3 Metro Board Report Los Angeles County Metropolitan Transportation Authority One Gateway Plaza 3rd Floor Board Room Los Angeles,
RTA ScoreCard December 2009
 Background and Context RTA ScoreCard December 2009 Chapter 25 of the Acts of 2009 modernized the transportation systems of the Commonwealth and created the new MassDOT. Section 6 of this law established
2018 Service Changes Ada County
 2018 Service Changes Ada County System Benefits 15 minute headways on State Street during peak hours o 30 minutes on Saturdays 30 minute headways on Emerald all day on weekdays More frequent and direct
Sale Price: $650,000. Arlyn Dyce Broker Associate
 RETAIL FOR SALE 2223 Jackson Boulevard, Rapid City, SD 57702 STATE ST Updated April 2018 MOU BU MOUNTAIN VIEW RD Sale Price: $650,000 Highlights Rare opportunity for one of the best, most visible corners
Transit System Performance Update
 Clause 5 in Report No. 4 of Committee of the Whole was adopted, without amendment, by the Council of The Regional Municipality of York at its meeting held on March 29, 2018. 5 2017 Transit System Performance
Board of Directors Information Summary
 Regional Public Transportation Authority 302 N. First Avenue, Suite 700, Phoenix, Arizona 85003 602-262-7433, Fax 602-495-0411 Board of Directors Information Summary Agenda Item #6 Date July 11, 2008 Subject
WESTERN EL DORADO COUNTY SHORT AND LONG-RANGE TRANSIT PLAN Executive Summary
 WESTERN EL DORADO COUNTY SHORT AND LONG-RANGE TRANSIT PLAN Executive Summary Prepared for the El Dorado County Transportation Commission Prepared by The El Dorado County Transportation Commission (EDCTC)
CARSON CITY TRANSIT DEVELOPMENT PLAN
 CARSON CITY TRANSIT DEVELOPMENT PLAN FOR FY 2014 2018 Prepared by: Carson Area Metropolitan Planning Organization Table of Contents Chapter 1 Introduction... 1 Chapter 2 Existing System... 2 History and
San Antonio Market Overview. 1 st 2 nd Quarter 2015
 San Antonio Market Overview 1 st 2 nd Quarter 2015 San Antonio, Texas Attributes of San Antonio Why San Antonio? The seventh most populated city in the United States of America and the second most populated
ADDISON COUNTY TRANSIT STUDY
 Prepared for Addison County Regional Planning Commission By Addison County Transit Resources Final Report June 2006 Prepared for Addison County Regional Planning Commission Addison County Transit Resources
OFFERING MEMORANDUM East Arapahoe Road, Greenwood Village, CO. JEFF HALLBERG PRINCIPAL
 SENIOR VICE PRESIDENT / EXECUTIVE SUMMARY Shane and Company is located in Greenwood Village, CO just south of Downtown Denver. The City of Greenwood Village is a located in Arapahoe County, Colorado, United
September 2014 Prepared by the Department of Finance & Performance Management Sub-Regional Report PERFORMANCE MEASURES
 September 2014 Prepared by the Department of Finance & Performance Management 2013 Sub-Regional Report PERFORMANCE MEASURES REGIONAL PERFORMANCE MEASURES RTA staff has undertaken the development of a performance
An outdoor waterpark is a facility offering three or more waterslides and other aquatic facilities.
 Methodology for Feasibility Studies for Waterparks By David J. Sangree, MAI, CPA, ISHC Before a developer or an organization considers constructing a new indoor or outdoor waterpark at a resort or standalone,
Economic Impacts of Campgrounds in New York State
 Economic Impacts of Campgrounds in New York State June 2017 Report Submitted to: Executive Summary Executive Summary New York State is home to approximately 350 privately owned campgrounds with 30,000
SRTA Year End Fixed Route Ridership Analysis: FY 2018
 SRTA Year End Fixed Route Ridership Analysis: FY 2018 2018 Contents Introduction... 1 A. Key Terms Used in this Report... 1 Key Findings... 2 A. Ridership... 2 B. Fare Payment... 4 Performance Analysis
Presentation Outline
 Presentation Outline Overview of Planning Process Initial Service and Fare Considerations RTC RIDE Fixed-route RTC ACCESS Paratransit Fares Next Steps Regional Transportation Commission, Washoe County
FY Transit Needs Assessment. Ventura County Transportation Commission
 FY 18-19 Transit Needs Assessment Ventura County Transportation Commission Contents List of Figures and Appendices.. 2 Appendices... 1 Chapter 1: Introduction What is the Ventura County Transportation
SUB-REGIONAL PERFORMANCE MEASURES
 SUB-REGIONAL PERFORMANCE MEASURES 29 REPORT Overall regional performance is a function of five major areas: Service Coverage - monitors both how much service is available to people in the region (in terms
2015 Independence Day Travel Overview U.S. Intercity Bus Industry
 2015 Independence Day Travel Overview U.S. Intercity Bus Industry Chaddick Institute for Metropolitan Development, DePaul University June 25, 2015 This Intercity Bus Briefing summarizes the Chaddick Institute
Saginaw Charter Township Master Plan
 Saginaw Charter Township Master Plan Overview of Draft & Public Hearing August 20, 2014 230 South Washington Avenue Saginaw Michigan 48607 (989) 754-4717 www.spicergroup.com Saginaw Charter Township Master
Contents EXECUTIVE SUMMARY... 7 Report Timeframe & Data... 7 Study Organization... 7 Data Analysis... 7 Public Involvement... 7 Recommendations... 8 I
 Page 1 Contents EXECUTIVE SUMMARY... 7 Report Timeframe & Data... 7 Study Organization... 7 Data Analysis... 7 Public Involvement... 7 Recommendations... 8 INTRODUCTION TO PASADENA TRANSIT AND PASADENA