UNIVERSITÉ DE MONTRÉAL CHARACTERISATION OF INTERCITY BUS TRAVEL DEMAND IN QUEBEC TINGTING ZHANG DÉPARTEMENT DES GÉNIES CIVIL, GÉOLOGIQUE ET DES MINES
|
|
|
- Jemimah Watkins
- 6 years ago
- Views:
Transcription
1 UNIVERSITÉ DE MONTRÉAL CHARACTERISATION OF INTERCITY BUS TRAVEL DEMAND IN QUEBEC TINGTING ZHANG DÉPARTEMENT DES GÉNIES CIVIL, GÉOLOGIQUE ET DES MINES ÉCOLE POLYTECHNIQUE DE MONTRÉAL MÉMOIRE PRÉSENTÉ EN VUE DE L OBTENTION DU DIPLÔME DE MAÎTRISE ÈS SCIENCES APPLIQUÉES (GÉNIE CIVIL) JUIN 2017 Tingting Zhang, 2017.
2 UNIVERSITÉ DE MONTRÉAL ÉCOLE POLYTECHNIQUE DE MONTRÉAL Ce mémoire intitulé : CHARACTERISATION OF INTERCITY BUS TRAVEL DEMAND IN QUEBEC présenté par : ZHANG Tingting en vue de l obtention du diplôme de : Maîtrise ès sciences appliquées a été dûment accepté par le jury d examen constitué de : M. CHAPLEAU Robert, Ph. D., président Mme MORENCY Catherine, Ph. D., membre et directrice de recherche M. FAROOQ Bilal, Ph. D., membre et codirecteur de recherche M. TRÉPANIER Martin, Ph. D., membre
3 iii DEDICATION Measurement alone does not yield good data, it requires rigour. Data alone is not information, it requires interpretation. Information alone is not knowledge, it requires context. Knowledge alone does not yield results, it requires action. Hall Kassoff
4 iv ACKNOWLEDGEMENTS I would like to express my sincere gratitude to my supervisor Catherine Morency and co-supervisor Bilal Farooq who have guided me through the project and helped with both criticism and inspiration. It has been an honor to be their student. I appreciate all of their time, guidance, advice, and invertible suggestions they contributed throughout this research project. I am especially grateful to my colleagues and friends Anae Sobhani, Kinan Bahbouh, Hamzeh Alizadeh, Nicolas Pele, Jerome Laviolette, Gabriel Lefebvre-Ropars, Philippe Gaudette, Jean- Simon Bourdeau, and all the others in my office. Each has given me valuable suggestions and technical assistance during our discussions. Furthermore, I am very thankful for the Quebec Bus Carriers Federation and six private bus carriers: Breton, Galland, Intercar, Maheux, Keolis, and Transdev who are partners in this research project. They made this research possible by providing the necessary information and data. Finally, I would like to thank my family for their great support and continuous encourage. I owe the greatest thanks to my loving husband and our dear child, they are the greatest joy in my life.
5 v RÉSUMÉ Les autocars interurbains jouent un rôle essentiel pour les déplacements interurbains dans le domaine du transport public. En effet, les autocars offrent plusieurs avantages. Tout d abord, ils sont potentiellement flexibles au niveau de l établissement des horaires de service. Ensuite, ils peuvent être opérés à l aide d une infrastructure nécessitant des investissements relativement modestes comparativement aux modes par rail et aériens, tout en tenant compte de la grande couverture spatiale offerte. Le transport par autocars au Québec est opéré par des entreprises privées qui doivent évidemment rentabiliser leurs opérations. Le service de transport par autocars est apparu dans les années 1920 comme un complément au service ferroviaire. Un système de permis fédéral en termes d accès au marché, de prix et de sécurité a été mis en place dans les années 1930 et ces régulations existent encore à ce jour. Cette industrie s est grandement développée entre les années 1940 et 1980, en raison des restrictions d essence au cours de la deuxième guerre mondiale, de la reprise économique et de l emploi après la guerre, ainsi que de la forte croissance démographique due à un pic de natalité communément appelé «baby-boom». Or, depuis les années 1980, l industrie démontre une baisse de l achalandage liée à une réduction de la demande. Celle-ci s explique notamment par l exode rural, les régimes économiques rigoureux, la concurrence exercée par les autres modes de transport traditionnels comme le train, l avion et la voiture privée, mais aussi par celle exercée par de nouveaux modes de transport tel que le covoiturage. Le modèle d inter-financement, selon lequel les routes non rentables sont financées partiellement par les routes plus rentables, reste limité. Les opérateurs entendent agir du côté de solutions diverses, notamment avec la mise en place du service d autobus nolisé ou du service de livraison des colis. Ils répondent également à l offre des modes concurrentiels avec la promotion de tarifs et de nouveaux systèmes de réservation en ligne. Pourtant, il existe très peu de recherche dans ce secteur au Québec ou même au Canada malgré les défis importants qu il représente. La recherche présentée dans ce mémoire comporte deux objectifs principaux. Le premier vise à élaborer des indicateurs appropriés pouvant être utilisés pour évaluer la performance des réseaux interurbains selon deux points de vue : celui de l opérateur et celui du voyageur. L autre objectif est de mieux comprendre les comportements d utilisation du système par les voyageurs. Le premier point abordé consiste en une revue de littérature visant à clarifier les notions de déplacements urbains et interurbains. Il n y a que deux catégories de territoires en Amérique du
6 vi Nord : les zones urbaines et les zones rurales. Les banlieues sont des zones qui se situent à l extérieur des centres-villes mais à une distance raisonnable du lieu de travail. Ainsi, les zones de banlieue appartiennent à des zones urbaines. Actuellement, certaines zones rurales ou régions éloignées sont desservies par des autocars interurbains. Ces services ne sont généralement pas rentables et sont subventionnés par d autres lignes profitables. Ensuite, les caractéristiques de ces deux types de déplacement sont comparées en termes de motif de déplacement, de fréquence de déplacement et de système billettique selon les études précédentes. Les résultats obtenus dans la recension des écrits révèlent que les voyages urbains servent principalement pour les activités de subsistance telles que le travail et les études, alors que les voyages interurbains sont réalisés principalement pour les motifs loisirs et les affaires. Une grande proportion (38%) de personnes n utilise pas le service interurbain alors que seulement 12% de la population est immobile. La fréquence des déplacements interurbains est également plus faible que celle des déplacements urbains (4-9 voyages/année contre 2-4 voyages/jour). D autre part, le prix du billet et l élasticité du prix sont plus élevés pour les déplacements interurbains. On recommande aux passagers d autocars interurbains de réserver leurs billets en avance et de faire des modifications ou d annuler selon les conditions associées aux billets. Par ailleurs, les différentes composantes du temps de voyage (temps d accès, temps d attente, temps dans le véhicule et temps de transfert) ne sont pas prises en considération de la même façon pour ces deux types de déplacement, l importance du temps d accès diminuant avec une distance plus longue. De plus, il est primordial de générer un temps de transfert approprié plutôt que de simplement chercher à le minimiser. La procédure de sélection des indicateurs de performance est aussi illustrée : identification des intervenants associés (la réglementation assurée par le système de permis, les opérateurs ainsi que les passagers dans l industrie de transport interurbain par autocars), définition des objectifs par catégories, collecte des données, élaboration d un traitement des données, calcul des divers indicateurs et analyse des résultats. Les données de vente pour les voyages interurbains ont plusieurs avantages par rapport aux données de carte à puce collectées dans le contexte urbain : les informations sur l origine et la destination des voyages sont disponibles, il existe peu de données suspectes et les billets personnalisés sont non-transférables. Pourtant, les études sur les voyages interurbains basées sur les données de ventes sont assez peu comparées aux nombreuses études menées en zones urbaines avec les données de cartes à puce. Certaines de ces expériences peuvent être appliquées aux déplacements interurbains, incluant notamment l extraction du voyage complet à partir des
7 vii segments de voyage, l identification de la station de transfert, la mesure de la performance du réseau et l analyse des comportements de voyage des passagers. Deux sources principales de données sont utilisées dans cette recherche : la base de données sur les ventes de billets en avril 2016 fournie par l opérateur Keolis et le fichier GTFS (General Transit Feed Specification) décrivant l offre de service à l échelle provinciale développée dans un travail précédent. Divers concepts et catégories de déplacement sont décrits. La méthodologie employée est divisée en deux étapes : le développement des outils de traitement de données et le calcul des divers indicateurs de performance tant pour l opérateur que pour le client. Un outil est utilisé pour générer le tableau de matrice Origine-Destination (O-D) et le profil de charge. Un autre outil aide à identifier les segments de voyage et les voyages complets à partir de la base de données des ventes. Ces deux outils permettent ainsi d obtenir différents types de déplacement. Les indicateurs de mesure de performance sont sélectionnés en tenant compte de la relation avec la demande, des perspectives de l opérateur et du passager, et de la disponibilité des données. Six indicateurs basés sur les segments de voyages ont été appliqués au niveau des arrêts, des liens, des lignes et du système entier pour mesurer la performance d un réseau actuel du point de vue des opérateurs. Ces six indicateurs sont : l achalandage, les passagers-kilomètres, le rapport entre le nombre de véhicules maximal et le nombre de véhicules minimal, le nombre de voyageurs transportés par véhicule-heure, le nombre de passagers par véhicule et le taux d occupation. Trois indicateurs basés sur les voyages complets sont utilisés pour mesurer le réseau actuel du point de vue des passagers. Ces trois indicateurs incluent le temps de voyage, le pourcentage de trajets nécessitant des correspondances et le temps de correspondance. Les profils spatio-temporels des comportements des passagers sont illustrés pour différents types de voyages basés sur le nombre de transferts (voyages directs, voyages avec un seul transfert et voyages avec transferts multiples) ou sur le type de trajet (voyages aller simple, voyages aller-retour avec nuitée et voyages aller-retour sans nuitée). La caractérisation du territoire et du service est illustrée quant à la variabilité des nombres de montées quotidiennes. La demande de déplacements interurbains présente une forte variation temporelle durant la semaine qui peut être divisée en trois catégories : les jours de pointe comprennent les vendredis et les dimanches, les jours hors pointe incluent le reste de la semaine et les jours fériés. Une demande plus élevée a été observée pendant les jours fériés (plus du double) et les jours de pointe (50% de plus) comparés aux jours hors-pointe. Des variations spatiales sont aussi visibles entre les réseaux régionaux qui relient des villes de différentes tailles et les réseaux
8 viii de base qui relient des villes de taille similaire. La plupart des passagers se rendent dans les grandes villes, alors qu il y a beaucoup moins de déplacements entre les petites villes. Ainsi, une différence significative des embarquements existe entre les stations terminales et les stations intermédiaires pour les lignes qui appartiennent au réseau régional. Au contraire, les passagers sont plus dispersés entre chaque station intermédiaire sur les lignes qui font partie du réseau de base. En évaluant l analyse au niveau de l arrêt, on constate que la demande de déplacement interurbain actuelle est principalement localisée dans les grandes villes du Québec (Montréal, Québec (Centre- Ville), Québec (Sainte-Foy), Québec (Université de Laval) et Rimouski). Les dix plus grandes villes génèrent au total 78% des offres, mais partagent 92% de la totalité des demandes. Grande- Vallée, Mont-Louis, Matapédia et Montréal (métro Radisson) sont les arrêts les moins efficaces avec moins d un passager par départ à la fois pour les jours de pointe et les jours hors pointe. Le nombre de débarquements à Longueuil est égal à 10% du nombre total de débarquements à Montréal en jours de pointe alors qu il est 2 fois plus élevé en jours hors-pointe. Ce changement de proportion implique que les destinations finales des passagers sont probablement différentes. En comparant les volumes de passagers avec la population des villes, on constate que les services d'autobus interurbains sont plus attrayants pour les villes situées dans le nord du Québec avec une faible population, comme Carleton, Rivière-du-Loup et Rimouski. A l inverse, les services d'autobus interurbains sont moins attrayants pour les villes localisées près de Montréal et de Québec, telles que Laval, Repentigny et Lévis. Les liens et les lignes qui desservent les grandes villes ont en général un niveau de performance plus élevé que celles qui desservent les petites villes en termes de nombre de passagers et d occupation. La ligne Express Montréal Québec représente ainsi 60% de l achalandage du réseau Keolis. Le plus grand nombre d embarquements est observé à 15h00 pour aller de Montréal à Québec et à 12H30 pour le trajet retour (de Québec à Montréal). Une grande proportion de ces passagers part de ou se destine à Rimouski, ce qui leur oblige une correspondance à Québec. Il existe une différence significative d achalandage sur les deux portions de la ligne Montréal Trois Rivières Québec et la ligne Québec Rivière-du-Loup Rimouski, mais l occupation de la ligne Montréal Trois Rivières Québec est plus faible même si ces deux lignes ont des achalandages similaires. Deux raisons peuvent expliquer cette différence. La première est que les passagers ne font typiquement pas le trajet complet Montréal-Québec sur la ligne Montréal Trois Rivières Québec parce que la ligne Express Montréal Québec est plus rapide pour relier ces deux points.
9 ix Ceux qui l empruntent se destinent ou embarquent à un point intermédiaire. La deuxième est qu il n y a pas le même nombre de départs sur les deux portions Québec Rivières-du-Loup et Rivièresdu-Loup Rimouski. Au niveau des passagers, 85% des voyages interurbains sont réalisés par des lignes directes avec une durée moyenne de déplacement de 2,7 heures et 14% des voyageurs ont une durée moyenne de déplacement de 5,9 heures avec un seul transfert. Le temps de transfert moyen est de 33 minutes pour les voyages avec un seul transfert et de 91 minutes pour les voyages avec plus d un transfert. Seulement 1% des passagers ont plus d un transfert à effectuer et leur temps de voyage augmente avec le nombre de transferts. Les lignes de désirs (O-D) démontrent que les corridors ayant une forte demande sont l aéroport de Montréal Montréal Québec Rivières-du-Loup Rimouski corridor, Québec Chicoutimi, Montréal Trois-Rivières et Montréal Drummondville. Montréal, Québec (Sainte-Foy), Rimouski et Québec (Centre-Ville) sont les quatre stations les plus importantes qui représentent 90,6% des passagers de transfert au total. Les proportions de déplacements aller simple, aller-retour avec nuitée et sans nuitée sont respectivement de 62%, 32% et 6%. Les voyages aller simple et aller-retour avec nuitée présentent des comportements similaires. La seule différence est que le plus grand nombre d embarquements quotidien est observé le vendredi pour les déplacements aller simple alors qu il est le dimanche pour les déplacements allerretour avec nuitée. Les voyages aller-retour sans nuitée ont des comportements différents. Les gens partent le matin et rentrent le soir tandis que les plus grands nombres d embarquements quotidiens sont observés du mercredi au vendredi. La plupart des passagers ont une heure de départ et une heure de retour plus tardives le samedi et le dimanche par rapport aux jours ouvrables. Le plus grand nombre de déplacements aller simple ou aller-retour avec nuitée a lieu pendant les fins de semaine avec une durée d activité de 1 à 2 jours, tandis que les déplacements aller-retour sans nuitée ont principalement lieu en semaine avec une durée d activité de 3 à 10 heures. À l aide des données de vente, il est aussi possible d obtenir d autres analyses sur les comportements des passagers. Par exemple, 87% des clients qui se sont inscrits sur le web ou à partir d un cellulaire ne réservent un billet qu une seule fois par mois et seulement 8% des clients réservent deux fois par mois. 91% des passagers interurbains ne réservent que pour une seule personne et 8% des passagers réservent pour un groupe de deux personnes. 21% des passagers ont modifié ou annulé leurs billets durant la tempête de neige contre 10% lors d une journée typique. 68% des voyageurs aller simple réservent leurs billets le même jour que leur départ. 67% des
10 x passagers réservent leurs billets avec un agent et 32% les réservent en ligne. Il n y a que 1% des passagers qui téléchargent l application mobile pour réserver leurs billets. Néanmoins, en utilisant le Web ou le cellulaire pour réserver, les utilisateurs ont une plus grande probabilité d abandonner ou de changer leurs réservations. Les résultats démontrent que l utilisation des données liées aux ventes de billets pour estimer la performance d un réseau et pour mieux comprendre les comportements des voyageurs est une approche pertinente pour fournir des informations utiles aux opérateurs. Les limites de cette recherche sont, d une part, l estimation des distances itinéraires avec les chemins les plus courts, ainsi que le calcul des temps de voyage et des temps de transfert avec les horaires d autocars qui peuvent être différents de la réalité. D autre part, le temps par défaut utilisé pour identifier les stations de transferts dans les voyages complets semble arbitraire. La conclusion souligne aussi des recommandations pour de futurs développements dans la planification et l opération des transports interurbains.
11 iii ABSTRACT Intercity bus services play a key role in Canadian intercity public transportation due to their potential flexibility in scheduling, large spatial coverage, and relatively low infrastructure investment compared to rail and air transportations. The intercity bus industry in Quebec is made up of private companies whose business models endeavor to maximize their profits. This industry, however, is in decline with an obvious and continuous demand reduction since the 1980s due to the rural exodus, competition from other modes, and strict economic regimes. To better cope with the competition arising from other modes, such as train, low-cost flights, and emerging services like carpooling, the operators are committed to service improvement. The objective of this research is twofold. The first objective aims at developing suitable indicators in terms of demand that can be used to evaluate the performance of intercity bus system in both operator s and passenger s perspectives. Another objective is to better understand the trip patterns made by intercity bus passengers. The literature review clarified the definitions of intercity travels, and compared intercity travels with urban travels. Studies on intercity travels with their sales database are quite limited compared to the numerous studies conducted in urban areas with smartcard database. In this study, some of these urban research experiences are applied to intercity travels, specifically includes passenger trip extraction from trip segments, transfer station identification, transit performance measurement, and passenger travel pattern analysis. The procedure of performance measurement and studies on different components of travel times are also discussed. Two main data sources are used: sales database at the time of April 2016 provided by the intercity carrier Keolis and General Transit Feed Specification (GTFS) that integrates the supply of six main carriers. A multi-step methodology in order to extract trips from trip segments of the intercity sales database is demonstrated. Performance measure indicators are selected considering demand relationship, operator s and passenger s perspectives, and data availability. Six indicators (ridership, passenger kilometers, peak-to-base ratio, productivity, passenger load, and demand to capacity ratio) are implemented at respectively stop, link, line, and system level to measure the performance of intercity bus network from operator s perspective based on trip segments. Three indicators (total scheduled travel time, the percentage of trips requiring transfers, and scheduled
12 iv transfer time) are implemented to measure the performance of the network from the passenger s perspective based on passenger trips. Other spatial-temporal patterns of passenger travel are illustrated for both transfer-based trips (direct trips, trips with one transfer, and trips with multitransfers) and journey type based trips (one-way trips, multi-day round-trips, and same-day roundtrips). Results show that intercity travels of Keolis passengers have high temporal variations over one week. Three types of days can be derived: peak days (Fridays and Sundays), off-peak days (the rest of the week), and holidays or event days. The average daily ridership is 50% higher on peak days and more than doubled on holidays compared to off-peak days. The intercity travel demand by bus is mainly between large cities in Quebec. The ten most frequently served cities occupy 78% of total supply but share 92% of the total demand. There is a significant ridership difference between the two sections of Line Montreal Trois-Rivières Quebec and Line Quebec Rivière-du-Loup Rimouski. The volume to capacity ratio of Line Montréal Trois Rivières Québec is lower than Line Québec Rivière-du-Loup Rimouski even though these two lines have similar ridership. Two reasons can explain this difference. The first is that passengers generally do not take the whole journey from Montreal to Quebec with Line Montréal Trois Rivières Québec because the Express Line Montreal Quebec is faster. The second is that the number of departures are different for the two sections of Line Québec Rivière-du-Loup Rimouski. 85% of intercity travel trips are realized by direct services with an average of 2.7 hours of travel time. About 14% of intercity bus passengers have one transfer with an average of 5.9 hours of travel time and 33 minutes of scheduled transfer time. The proportions of one-way trips, multi-day round-trips, and same-day round-trips are 62%, 32%, and 6% respectfully. One-way trips and multi-day round-trips have similar patterns, which is totally different from same-day round-trip patterns. 41% of one-way trips and 44% of multi-day round-trips are taken on peak days. 60% of multi-day round-trip passengers stay 1-3 days at their destinations, of which the highest proportion leave on Fridays. 84% of the same-day round-trip passengers stay for 3-10 hours at their destinations, of which the highest proportion leave on weekdays. 87% of the registered clients only order once within one month, and 91% of intercity bus passengers buy tickets for a single person. The obtained results confirm that the use of sales database to estimate intercity bus performance measures and to better understand their passenger trip patterns can provide useful information to operators.
13 v TABLE OF CONTENTS DEDICATION... III ACKNOWLEDGEMENTS... IV RÉSUMÉ... V ABSTRACT... III TABLE OF CONTENTS... V LIST OF TABLES... IX LIST OF FIGURES... X LIST OF SYMBOLS AND ABBREVIATIONS... XIV CHAPTER 1 INTRODUCTION History of intercity bus in Quebec Problem statement General research context Research objective Dissertation organization... 6 CHAPTER 2 LITERATURE REVIEW Intra-city vs Inter-city bus systems Definition of intra-city and inter-city travels Intra-city trips and Inter-city trips Intra-city bus and Inter-city bus Intercity bus performance measures Performance measures for different components of the transport system Methodology of performance measures Demand related indicators... 27
14 vi 2.3 Components of travel time Access and egress Waiting In-vehicle Transfer Concluding remarks CHAPTER 3 METHODOLOGY Flow diagram Source of data General description of datasets Description of Keolis sales database Dataset used Definition Trip related definitions Transfer related definitions Data processing Performance measure indicators CHAPTER 4 PERFORMANCE MEASURES: OPERATOR S PERSPECTIVE The intercity bus network of Keolis Spatial-temporal fluctuations of the service use Temporal fluctuations Spatial fluctuations Remarks Intercity bus system performance measure... 69
15 vii System performance measure report Stop level performance measures Link level performance measures Line level performance measures The analysis of the main Express Montreal - Quebec corridor Highlights of performance measures from operator s perspective CHAPTER 5 PERFORMANCE MEASURES: PASSENGER S PERSPECTIVE Intercity bus system passenger measure General passenger performance measure report Passenger travel time Passenger O-D desire lines Passenger transfer Passenger trip patterns Journey type based trip division Departure time Duration of stay Total travel time Other service use patterns related to sales database Frequency of orders Accompaniment Weather effects Cost Order Highlights of performance measures from passenger s perspective
16 viii CHAPTER 6 CONCLUSION Summary Contribution Limit Perspective BIBLIOGRAPHY
17 ix LIST OF TABLES Table 2.1: Definitions of the components of transport system in both general context and intercity travel context Table 2.2: Output measure categories for peer comparison (TCRP Report 141, 2010) Table 2.3: Categories of performance measurement and potential source of data (TCRP Report 88, 2003; TCQSM, 2012) Table 2.4: Categories of intercity travel demand based on the menu of TCRP Report 88 (2003) and TCRP Report 141 (2010) Table 2.5: Intercity travel demand related indicators chosen based on the menu of TCRP Report 88 performance measures from operator s perspective Table 2.6: Intercity travel demand related indicators chosen based on the menu of TCRP Report 88 Passenger measures Table 2.7: Intercity travel demand related indicators chosen based on the menu of TCRP Report 88 Supply measures Table 3.1: Classification of fields in the sales database Table 3.2: The number of records and data completeness in sales database Table 3.3: Key facts of dataset adopted for performance measures Table 3.4: Intercity travel by bus performance measure indicators Table 4.1: Trip segment-based performance measure report for April 2016 and Easter Monday. 70 Table 4.2: Cities with the highest and the least number of boardings and alightings per departure in descending/ascending order Table 4.3: Cities with the highest and the least number of boardings and alightings/city population Table 4.4: Performance measure report for Line 48 Montreal Quebec Table 5.1: Trip-based passenger measure indicator report
18 x LIST OF FIGURES Figure 1.1: Master thesis structure... 7 Figure 2.1: Conceptual map of the intra-city travel and inter-city travel... 9 Figure 2.2: Linkage of the categories with different perspectives (TCRP Report 88, 2003) Figure 3.1: Diagram of methodology Figure 3.2: Conceptual map of the GTFS (Google developers, 2016; Barbier, 2016) Figure 3.3: Conceptual map of the definitions related to passenger travel Figure 3.4: Conceptual map of a trip segment Figure 3.5: Conceptual map of a trip Figure 3.6: Conceptual map of transfer based trip divisions Figure 3.7: Conceptual map of journey type based trip division Figure 3.8: Transfer related concepts Figure 3.9: Data processing procedure to identify a trip and a trip with transfer Figure 3.10: Data processing procedure to identify different types of trips Figure 3.11: Procedure of performance measures in operator s perspective Figure 3.12: Standardized cluster colors used in legend Figure 4.1: The nodes and links of the network operated by Keolis in April Figure 4.2: The lines of the network operated by Keolis Figure 4.3: Box plot and statistics of daily number of passengers over a week Figure 4.4: Weekly trend of average daily number of boardings Figure 4.5: Average daily number of passengers over time and stations for Line Figure 4.6: Average daily number of passengers over time and stations for Line Figure 4.7: Average daily number of passengers over time for Line Figure 4.8: Daily number of departures provided by Keolis in April
19 xi Figure 4.9: Daily number of boardings - peak days (Station Name (Number of boardings)) Figure 4.10: Daily number of alightings - peak days (Station Name (Number of alightings)) Figure 4.11: Daily number of boardings - off-peak days (Station Name (Number of boardings)) 73 Figure 4.12: Daily number of alightings - off-peak days (Station Name (Number of alightings)) 73 Figure 4.13: Daily number of boardings Easter Monday (Station Name (Number of boardings)) Figure 4.14: Daily number of alightings Easter Monday (Station Name (Number of alightings)) Figure 4.15: Daily number of stop boardings and alightings per departure peak days Figure 4.16: Daily number of stop boardings and alightings per departure off-peak days Figure 4.17: Daily number of stop boardings and alightings per departure Easter Monday Figure 4.18: Number of boardings and alightings/city population peak days Figure 4.19: Daily link departures Figure 4.20: Daily link ridership peak days Figure 4.21: Daily link ridership off-peak days Figure 4.22: Daily link ridership Easter Monday Figure 4.23: Volume to capacity ratio by link peak days Figure 4.24: Volume to capacity ratio by link off-peak days Figure 4.25: Volume to capacity ratio by link Easter Monday Figure 4.26: Proportion of passenger boardings on peak days, off-peak days, and Easter Monday Figure 4.27: Overall comparison of demand and supply and volume to capacity ratio by line Figure 4.28: Daily productivity by line Figure 4.29: Daily maximum passenger load per departure and the corresponding departure time... 90
20 xii Figure 4.30: Average daily number of passengers over time for Line Figure 4.31: Synthesis of passenger boardings by the time of day (hour) Montreal Quebec Figure 4.32: Synthesis of passenger boardings by the time of day (hour) Quebec Montreal Figure 4.33: Synthesis of vehicles by the time of day (hour) Montreal Quebec Figure 4.34: Synthesis of vehicles by the time of day (hour) Quebec Montreal Figure 4.35: Synthesis of V/C ratio by the time of day (hour) Montreal Quebec Figure 4.36: Synthesis of V/C ratio by the time of day (hour) Quebec Montreal Figure 5.1: Proportion of different number of transfers Figure 5.2: Distribution of total travel time Figure 5.3: Average total travel time and scheduled transfer time for different number of transfers Figure 5.4: Daily passenger OD desire lines direct trips Figure 5.5: Daily passenger OD desire lines trips with one transfer Figure 5.6: Passenger OD desire lines Multi-transfers Figure 5.7: Number of transfer passengers and the average scheduled transfer time (Station Name (Number of transfer passengers) Scheduled transfer time) Figure 5.8: Distribution of scheduled transfer time at main transfer stations Figure 5.9: Distribution of scheduled transfer time by departure time of connecting bus Figure 5.10: Distribution of transfer passengers and expired ticket rates over time Figure 5.11: Expired ticket rates at transfer stations Figure 5.12: Proportion of passengers with different types of trips Figure 5.13: Distribution of departure time over week for one-way trips Figure 5.14: Distribution of departure time over week for multi-day round-trips Figure 5.15: Distribution of departure time over week for same-day round-trips Figure 5.16: Distribution of stay duration for multi-day round-trip passengers
21 xiii Figure 5.17: Distribution of stay duration for same-day round-trip passengers Figure 5.18: Distribution of the departure day for different stay durations multi-day round-trips Figure 5.19: Distribution of the departure day for different stay durations same-day round-trips Figure 5.20: Distribution of total travel time one-way trips Figure 5.21: Distribution of total travel time multi-day round-trips Figure 5.22: Distribution of total travel time same-day round-trips Figure 5.23: Distribution of total travel time over stay duration multi-day round-trips Figure 5.24: Distribution of total travel time over stay duration same-day round-trips Figure 5.25: Number of orders per month in April Figure 5.26: Accompaniment Figure 5.27: Daily ticket modify and refund rate Figure 5.28: Proportion of fare revenue Figure 5.29: Average cost per passenger per kilometer Figure 5.30: Average fare paid over time Figure 5.31: Average fare and number of reservations in advance one-way trips Figure 5.32: Average fare and number of reservations in advance round-trips Figure 5.33: Distribution of the method of reserving the ticket Figure 5.34: Average days in advance to reserve the ticket
22 xiv LIST OF SYMBOLS AND ABBREVIATIONS DRU GAS GTFS GRI LEV MTL MTR No. PT QUE RMK RDL TRI UL VIC Drummondville Gaspé General Transit Feed Specification Grande-Rivière Lévis Montreal Montreal Trudeau Airport Number Public Transportation Quebec City Rimouski Rivière-du-Loup Trois-Rivières University Laval Victoriaville Road with two directions Road direction from one place to another
23 1 CHAPTER 1 INTRODUCTION Intercity buses are generally considered as environmentally friendly and safe means of public transport compared to other intercity travel modes (Woldeamanuel, 2012; Fraser, 2002). The intercity bus plays a key role in Canadian intercity transportation, especially for some disadvantaged population segments (Fraser, 2002). In Canada, thousands of cities of all sizes are served by bus, but only hundreds of medium to large cities are served by trains, and dozens of major cities are served by airlines (Fraser, 2002). In Quebec, specifically, the intercity bus network consists of 222 bus stations (Bus Carriers Federation, 2017), while only a little more than 20 cities are served by rail (Via Rail Canada, 2017). This is different from the current situation in most countries of Western Europe, where railways dominate the market share (statistics from Eurostat, 2016). Compared to trains and airplanes, intercity buses can run on existing public roads, they are potentially more flexible in scheduling, they ensure a greater spatial coverage, and their infrastructure investments are generally far less. This transportation mode has been in decline in Quebec and Canada since the 1980s (Blais, 1996) from 46 million trips in 1970 to 14 million trips by 2001 (Fraser, 2002). The most important reason is due to the popularity of personal cars which account for 90% of all intercity travels (Fraser, 2002). Other factors include the phenomenon of the rural exodus (Blais, 1996), government regulations (Fraser, 2002), and the increasing competition of emerging carpooling services (Blais, 1996). The decrease in demand leads to service reductions. This creates a negative feedback loop. 1.1 History of intercity bus in Quebec The intercity bus industry appeared in the 1920s in Quebec. A federal permit system in terms of market access, price rate, and security was introduced in the 1930s in Canada to control vicious competitions between operators at that time (Fraser, 2002). In Quebec, the government agency Commission des transports du Québec (CTQ) regulates intercity bus operators by delivering the intercity bus permits (Commission des transports du Québec, 2017). However, it was not possible to clearly identify when this permit system was established in Quebec using the available documents. This industry was highly developed in the 1940s due to petrol restrictions in civil use during the second world war, and the increasing travel demand brought by economic and employment recovery after the war (Blais, 1996). Between 1950 and 1980, the emergence and wide
24 2 dissemination of cars generated a significant competition for buses. Due to the strong demographic at that time, however, buses had no trouble growing their businesses (Blais, 1996). After 1980, a change in terms of supply and demand took place. The number of intercity bus passengers in Quebec declined, especially those in the core regional network (Blais, 1996). A reduction in supply occurred, many local short routes were either phased out or completely closed due to the phenomenon of rural exodus. Parts of the population were left with no alternative means of public transport to reach major local centers (Blais, 1996). At the same time, express routes linking the major Quebec cities became more and more important (Blais, 1996). Intercity buses, the most used transportation mode for long-distance travel after cars, have been experiencing very difficult times since the early 2000s (Vecteur 5, 2011). The reasons are diverse. First, the demand decreases as explained above; second, the increasing popularity of carpooling services (La Presse, 2012); then, the current federal and provincial legislative and regulatory regimes; and finally, the government subsidies to modal competitors (Council of Ministers, 2010). Current regimes require the intercity bus operators to finance the loss-incurring routes by more profitable ones (cross-subsidy model) and do not timely approve modifying service levels (Council of Ministers, 2010). These regimes are often controversial and are considered as a key factor that leads to the mismatch between the current services and the market conditions (Council of Ministers, 2010). The possibility of cross-subsidization has become much smaller for intercity bus companies over time (La Presse, 2014). The for-profit private intercity bus companies then turned to other solutions. One solution is to provide chartered transportation services (bus booked by some group) or package transportation services (package shipping with current intercity passenger bus service) to balance their budgets. Another solution is to improve their service and to maintain and attract customers, especially for high-traffic routes. For example, the Bus Carriers Federation, who merged more than 180 private companies that own buses, had made efforts to modernise their information system (schedule, fare, and itineraries) for user experience improvement, such as the website EspaceBus and the intercity bus route management system (système ordiné de gestion des trajets d autobus interurbains) (Chapleau et al., 1999). An integrated schedule and fare system was used for users better planning their travel times and minimizing their transportation costs. This service however no longer exists since September 2014, as a monthly website content update is too burdensome with the special data format (Barbier, 2016). Each carrier also tried to improve the service in their own way. The largest intercity bus operator in Quebec, Keolis for example,
25 3 implemented new technologies such as online reservation system, free Wi-Fi, and electric and USB outlets. Keolis also published the schedules and fares of all their itineraries with Google Maps, which allowed for the integration with the urban public transport system (Keolis, 2013). The intercity bus industry is experiencing a dramatic change in recent years. Some companies demanded the authorization of cutting unprofitable local service lines. For example, in 2014, Keolis obtained the authorization from the Quebec Transport Commission (CTQ) to end its service for dozens of municipalities across the Quebec (Le Devoir, 2014). Keolis decided to trim their services, cutting out many stops on regional routes and focusing on the Quebec City - Montreal corridor, to avoid shutting down altogether (CBC News, 2015). Thus, some students, workers, and tourists previously depending on bus services in rural or remote areas were highly affected (Montreal Gazette, 2014). These population segments had been forced to find alternatives or to reduce or even cancel their travels. In 2016, a financial subsidy plan from the Minister of Transport Quebec for intercity carriers allowed for the reduced services of Keolis to still be maintained (Le Pharillon, 2016; Le Journal de Québec, 2016; Le Droit, 2016). Following this, a series of measures were carried out to improve their services, such as stop additions and cancellations, schedule changing, fare reductions through variable price rates, launching their own online booking system accessible by both web browsers and mobile phones (Le Journal de Québec, 2016; L avantage, 2016; Radio-Canada, 2016). There is still a lack of collaboration between the carriers in Quebec however. Each carrier supports its own website to describe its service features, and only Keolis has integrated its network with Google Maps (Keolis, 2013). Reservations for a trip with transfer between different carriers are possible by agents but still not yet available online. 1.2 Problem statement There is little research on intercity bus sector in Quebec or even in Canada compared to urban transport studies. In urban transport study area, many studies with automatic fare collection (AFC) systems have been conducted (Pelletier et al., 2011; Agard et al., 2006; Bagchi and White, 2005; Chapleau and Chu, 2007; Chu et al., 2009; Trépanier et al., 2009; Trépanier and Morency, 2010). However, the sales database of intercity travel is not widely used since operational data are usually owned by private companies (Miller, 2004). There are both similarities and differences between the urban transit AFC systems and the intercity bus sales database. Both datasets can be used to
26 4 estimate future demand origin-destination (OD) trip matrices, evaluate transit performance, analyze demand distributions, etc. Urban transit AFC systems have a large amount of travels every day, and the passengers can randomly choose their origins, destinations, and departure times. However, intercity travel passengers have a lower quantity and travel frequency. Intercity bus passengers are suggested to reserve their places in advance (Keolis, 2016), and to apply for ticket modification or cancellation based on the associated conditions. This situation motivates the present study in which the intercity bus sales dataset is used to assess the performance of the network in terms of demand from both operator s and passenger s perspectives and to analyze passenger s trip patterns. The envisaged research problems include: What indicators best measure the service performance for operators? Performance measure indicators can describe network performance in a quantitative way. One of the key challenges is selecting which characteristics to measure, such as how much is the service used? Are stops located appropriately? How well does each line perform? What are the travel characteristics of passengers by intercity bus? Attracting and retaining passengers is a crucial task for privately owned intercity bus carriers. It is important to understand the clientele as the more we know what they want, the easier it will be to cater for more customers. Passenger characteristics include: Where do they travel the most? When do they prefer traveling? How long do they want to stay at their destinations? How long do they travel? How many trips are served directly by the current intercity bus networks without transfers? Where do they transfer, and how long do they wait at the transfer stations? How to improve the intercity bus service based on the performance measurement and trip pattern analysis? Intercity bus carriers are striving to grow their business by providing a convenient, secure, attractive, and comfortable transport system. A variety of elements goes into making a better customer experience. This research suggests how to improve the service based on performance measurement and passenger trip pattern analysis.
27 5 1.3 General research context This study is a part of a larger research project aiming at providing a) a better understanding of informational and methodological difficulties faced by the intercity bus industry, and b) to develop an integrated knowledge of supply and demand for the intercity bus network. This project is carried out in collaboration with the Bus Carriers Federation and some major carriers in Quebec (Keolis, Maheux, Galand Laurentides Ltée, Autobus Breton, Intercar Inc and Transdev Quebec). Barbier (2016) made efforts to characterize the intercity bus supply in a previous work under the same project. The work of Barbier (2016) contributed to developing an integrated dataset which includes intercity bus General Transit Feed Specification (GTFS, which defines a common format for public transportation schedules and associated geographic information), number of bus departures, mileage, the variability of the service by time and space, and the degree of accessibility. This thesis focuses on characterizing intercity bus travel demand in terms of operator performance measures and the passenger trip pattern analysis. One source of data is the intercity bus supply developed by Barbier (2016) mentioned above. Another source of data is the sales database provided by intercity bus carriers. A set of indicators considering both operator s and passenger s perspectives are proposed to assess the performance of intercity bus network. The trip patterns of passengers are also reviewed to better understand their potential needs. 1.4 Research objective The first objective of this research is to define the most suitable indicators in terms of demand that can be used to evaluate the performance of intercity bus systems from the operator's perspective. The second objective is to better understand the travel patterns of the intercity bus passengers based on the sales database, which provides the clearest indication of their preferences. These objectives can be achieved by the following steps: 1. Propose a set of relevant indicators based on the primary components of an intercity travel system (network and passengers) to evaluate its performance from both operator s and passenger s perspectives;
28 6 2. Develop a method to derive trip segments and complete passenger trips from the sales database; 3. Present a procedure to measure the performance with a set of indicators; 4. Analyze the temporal and spatial variability of intercity travel demand by bus; 5. Illustrate passenger s trip patterns. 1.5 Dissertation organization According to the objectives, this master s thesis is composed of an introduction, four chapters, and a brief conclusion. The rest of this dissertation is organized as follows, as illustrated in Figure 1.1: Chapter 2 reviews the existing literature to develop a knowledge base on intercity travel demand analysis. Three key aspects are addressed, namely the comparison between urban travel and intercity travel, a review of transit performance measurement with indicators, and a review of the different components of travel time. Chapter 3 presents the methodology for performance analysis of the intercity bus system from both the operator s and passenger s perspectives. The results of operator-based measures obtained with trip segments are presented in Chapter 4. The results of passenger-based measures obtained with trips and the passenger trip patterns are illustrated in Chapter 5. Summary, contributions, and limits of this research are discussed in Chapter 6. Possible directions for further research are also proposed.

29 Figure 1.1: Master thesis structure 7
30 8 CHAPTER 2 LITERATURE REVIEW This literature review focuses on the aspects of performance measurement and passenger trip pattern characterization dealt with in many practical experiments and research related to the sector of the urban area to intercity travel. First, an overview of comparison between intra-city (traveling within an urban area) and inter-city transport (traveling between cities) systems are presented. Then, different procedures and indicators used in urban transit performance measurement are explained, and their applications to intercity bus system are discussed. Finally, travel time, which is one of the most important factors that affect passenger s trip patterns, as well as some existing techniques for transfer evaluation and optimization, are discussed. 2.1 Intra-city vs Inter-city bus systems This section extends the definitions of intercity travel (also called long-distance travel) presented in the previous research of Guillemette (2015) and Barbier (2016). Some concepts and notions related to intra-city and inter-city public transit systems are presented and then discussed Definition of intra-city and inter-city travels According to the Merriam-Webster Dictionary, a city is an inhabited place of greater size, population, or importance than a town or village, and the term urban is characteristic of a city. As defined by the census bureau of the U.S., rural is any population, housing, or territory not in an urban area (United States Census Bureau, 2017). Thus, there is no difference between city and urban, and urban areas and rural areas are the only two territory categories in North America. The classification of urban and rural areas is generally based on the census population size and density (Statistics Canada, 2011; United States Census Bureau, 2017). The definitions of these terms change from one country to another as their population sizes are different. Even for one country, these definitions change over time due to population size variation. In Canada, areas having a population of at least 1, 000 and a density of 400 or more people per square kilometers are defined as urban areas (Statistics Canada, 2011). To better classify all the communities that meet these minimum definition requirements, Statistics Canada further subdivided urban areas as small population centers (1,000-29,999), medium population centers (30,000-99,999), and large urban population centers (more than 100,000) (Statistics Canada, 2011).
.")
31 9 The word suburban is frequently used, but there is no official definition for it. There are many dimensions that can be considered to define the suburbs. For example, based on location, density, and newness, suburbs are defined as more recently developed parts of an urban or metropolitan area, outside the core or historical city area (Harris, 2010). Based on geography, suburbs are areas between the city center and the rural areas (Harris, 2010). Apart from definitions based on physical features, there are also some functional definitions for suburbs. Suburbs are locations within commuting distance of a core city considering transportation (Clapson, 2003) and are mainly residential developments with segregated uses considering activities (Forsyth, 2012). Thus, suburbs are outside the core city but within a commuting distance of an urban area. By these definitions, communities (or municipals) that meet the requirements of urban areas would take charge of the transportation within the core city and suburban areas, known as intra-city travel or urban travel, while traveling between different communities belongs to inter-city travel. However, the responsibility of transportation for rural areas and border areas is not defined (as illustrated in Figure 2.1). Currently, the intercity bus is one of the major collective modes for these rural areas in North America (Yang, 2013; Fraser, 2002). These itineraries are generally crosssubsidized by profitable lines and need government subsidy (Fraser, 2002). The advantage of these services is to keep rural routes alive, but it makes the fares of profitable routes higher than necessary and less competitive (Fraser, 2002). Figure 2.1: Conceptual map of the intra-city travel and inter-city travel
32 10 There are three primary criteria to distinguish inter-city travel from intra-city travel: travel distance, travel time, and space boundary (Guillemette, 2015; Barbier, 2016). Travel distance is the most frequently used way used in the household travel surveys to distinguish these two types of travel. Most travel surveys take the shortest route distance regardless of circulation conditions. The minimum distance varies from one country to another as national territory areas are different. For example, the long-distance travel is defined as trips longer than 80.5 km (50 miles) for the National Household Travel Survey (NHTS) conducted in the U.S. on 2006 and 2011, 50 km in Austria, 80 km in France, and 24 km (15 miles) in Great Britain (Van de Velde, 2009; Christensen, 2015; Barbier, 2016). Travel time is another criterion, but it is less used. One reason is that travel time is barely measured during the surveys, another reason is because time changes facing different route conditions and using different travel modes. Some surveys use night stay to distinguish between inter-city travel and intra-city travel (Statistics Canada, 2011). The Micro Census of Mobility and Transport conducted in Switzerland in 2010 considered trips longer than 3 hours without night stays and travels with night stays as long-distance travels (Federal Statistical Office, 2016). Space boundary can also be used as a criterion. As its name implies, an intercity travel generally crosses administrative borders. The inter-city travel can be defined as the travel between two or more urban areas rather than travel within a given urban region (Miller, 2004). The definition of intercity travel adopted in this research complies with the previous research of Guillemette (2015) and Barbier (2016) under the same project, which is: travel out of the urban area with a crow fly distance of longer than 80 km. The definition of intercity travel by bus is: bus service that opens to all public who take intercity travel with fixed itineraries and schedules Intra-city trips and Inter-city trips There are some distinct differences between intra-city and inter-city passenger trips. They are compared based on travel purpose, frequency, and mode choice. Studies point out that intra-city trips are mainly taken for livelihood activities such as employment, education, shopping, and regular leisure activities, while inter-city trips are mainly conducted for leisure, business, or personal affairs. The results of NHTS (2011) show that 45% of daily intra-city trips are taken for shopping and errands, 27% for social and recreational activities (e.g. visiting a
33 11 friend), and 15% for commuting (Bureau of Transportation Statistics, 2017). Origin-Destination Survey conducted in Montreal (2013) concludes that about half of trips taken during peak hours in the morning are for the commuting purpose and 28% for study purpose (Agence Métropolitaine de Transport, 2017). For inter-city trips, 56% are taken for pleasure (e.g. vacations, sightseeing trips, visiting friends or relatives, outdoor recreation), 16% for business, and 13% for commuting to work (Bureau of Transportation Statistics, 2017). Other surveys also point out that for intercity travel by bus or rail, visiting friends and family members is the most common trip purpose, followed by business (Clarkston et al., 2005; Grengs et al., 2009; Kack et al., 2011; McGuckin, 2015). Inter-city travels have lower travel incidence and frequency compared to intra-city travels. According to McGuckin s analysis of NHTS (2011), only 12% of individuals do not leave the house on an average day while 38% of people do not make long-distance travels in an average year (McGuckin, 2015). For intra-city travels, surveys show that Americans take 4 trips/person/day with an average travel distance of 64 km (40 miles) (Bureau of Transportation Statistics, 2017), Montrealers take 2.3 trips/person/day (Agence Métropolitaine de Transport, 2017). For inter-city travels, Americans take about 9 trips/person/year with median distances of 3,328 km (2,068) miles by air, 462 km (287 miles) by bus, 312 km (194 miles) by car, and 309 km (192 miles) by train (Bureau of Transportation Statistics, 2017). The results of European surveys also confirm that intercity travels occur infrequently. The KITE survey conducted in Portugal, Switzerland, and Czech Republic between reported 8-9 long-distance trips/person/year (Kuhnimhof, 2009). The MID Mobility Diary conducted in Germany in 2002 reported 5 long-distance trips/person/year (Kuhnimhof, 2009). The Switzerland MC mobility diary conducted in 2005 reported between 4-5 long-distance trips/person/year (Kuhnimhof, 2009; Frei et al., 2010). At longer distances, the trip frequency decreases. It drops to less than 1 trip/person/year for distances longer than 300 km in the KITE survey for domestic long-distance travels (Kuhnimhof, 2009; Frei et al., 2010). For mode choice, travel cost and travel time are the key attributes for all mode choice modeling regardless of intra-city or inter-city travels (Garvill et al., 2003; Wardman 2004; Bhat and Sardesai, 2006; Fosgerau, 2006; Bhat et al., 2007). However, the considerations of these two attributes are different. For intra-city travels, passengers consider the entire journey from the origin to the destination, while for inter-city travels, the long in-vehicle segment is of most important consideration (Agarwal, 2006). For example, the ease of access and egress to or from the metro or bus station is an important factor that affects passenger s choice for intra-city travels. However,
34 12 passengers generally do not make a choice between traveling by plane or train based on how easy it is to get to the airport or train station, but on the total cost and the total travel time from one city to another (Agarwal, 2006). With longer travel distance, the impact of the access and egress stage will be less important (Krygsman et al., 2003). As for travel cost, both ticket price and price elasticity are higher for inter-city travels than intra-city travels (Agarwal, 2006). Passengers are more likely to avoid inter-city travels than intra-city travels due to their different travel purposes (Agarwal, 2006) Intra-city bus and Inter-city bus The public transport modes for core cities, suburban, and intercity travels are all concerned with buses. Keeping in mind the differences between intra-city and inter-city travels, the bus systems for are also different, both in vehicle characteristics and other operations. The vehicles used for intra-city and inter-city travels are different. For intra-city travels, the vehicles used are known as urban buses, but in inter-city travel areas, they are generally called coaches (Prentice and Tremblay, 2002). Their design characteristics and speed limit are totally different but will not be discussed in depth in this study. An obvious difference between intra-city buses and inter-city buses is the number of available seats and their allocation within the vehicle. Inter-city bus systems use the coach with a standard number of seats of approximately 54 or 56 (Prentice and Tremblay, 2002) and the maximum capacity of the coach is the same as the number of seats without standing area. However, the capacity of an urban bus is superior because there exists a standing area. For example, the bus capacity used and published in Minneapolis is 132 for hybrid-electric buses, 169 for articulated buses, and 547 for diesel buses (Metro transit serving the Minneapolis, 2017). The reservation and payment methods are also different. For intra-city travel by bus, there is no reservation system and passengers can randomly decide whenever to leave and wherever to go. For inter-city travel by bus, passengers are suggested reserving their tickets either online or from ticket agents in advance. They need to disembark at the destination printed on their tickets. Intra-city travel passengers have more fare options depending on different travel frequencies (e.g. one-way ticket, multi-day pass, monthly pass, etc.) (Societé de Transport de Montréal, 2017), while intercity travel passengers have only two options (one-way ticket or round tickets) (Keolis, 2017).
35 13 The socio-demographic characteristics are slightly different for intra-city travel and inter-city travel passengers. The findings of several surveys point out that inter-city bus passengers are more likely to be female, age less than 24 or more than 65, single, have low income (including persons released from incarceration, college students, and military personnel), and travel alone (Bureau of Transportation Statistics, 2017; Grengs et al., 2009; Clarkston et al., 2005; McGuckin, 2015). However, intra-city passengers are more likely to be years old (Ponrohono, 2015; Neff and Pham, 2007). Finally, there are also differences in service areas and subsidies. As mentioned before, sometimes the borders among suburban, rural, and inter-city travels are not clear, especially for those remote areas with low population densities. Intercity buses and paratransit (special services with reservations for disabled persons) are commonly used modes of transportation from rural areas to urban areas (Yang, 2013). In Canada, current intercity bus routes have four categories: the most profitable (highest density), profitable (medium density), marginal (low density), and unprofitable (lowest density) (Fraser, 2002). Most routes (57%) are operated for low density areas but only account for 22% of the total intercity bus trips (Fraser, 2002). There are currently no federal subsidies to inter-city buses apart from a few small provincial subsidies in Quebec (Fraser, 2002). Large provincial and municipal subsidies, however, are given to urban transit operations throughout Canada (Fraser, 2002). 2.2 Intercity bus performance measures An intercity bus system, like other modes of public transit, can be evaluated by quantitative and qualitative elements referred to as indicators (Cascetta and Cartenì, 2014; Government of Canada, 2010). Quantifiable measures using performance indicators are of interest to the operator staff responsible for performing self-reviews, peer comparisons, and the management of the activities of the companies (Transit Cooperative Research Program (TCRP) Report 88 (A Guidebook for Developing a Transit Performance-Measurement System), 2003; Canadian Transport Agency, 2010). This section introduces the process of developing indicator-based quantifiable performance measures commonly used in urban transit areas, based on which to identify the relevant indicators that can be used for analyzing the current intercity travel demand by bus in Quebec.
36 Performance measures for different components of the transport system There are four essential components in a transportation system: network, infrastructure, mode and flow (Rodrigue et al. 2016). A network is a combination of nodes, links, and lines. In general, the infrastructure of public transport systems includes routes, terminals, stops and maintenance facilities. The mode represents the mobile elements of a transport system, and the flow can be expressed by the vehicle flux or passenger flux in passenger transport (Rodrigue et al. 2016). The definitions of these components and units are, first, presented in a general context according to different references, and then specific definitions are given to adapt to intercity travel by bus. The detailed definitions of the components, as well as their units, are listed in Table 2.1. Table 2.1: Definitions of the components of transport system in both general context and intercity travel context Component and its elements Definition in general context Definition adapted to intercity travel by bus Example Refer ence Network Node Network refers to a system of linked locations representing the functional and spatial organization of transportation. "Any location that has access to a transportation network." (a) Link "Physical transport infrastructures that A direct line representing a set of roads that enable to connect two nodes." (a) connect two adjacent nodes. "A sequence of nodes and links Corridor or line supporting modal flows of passengers or freight." (a) One fixed-route with a sequence of nodes and links supporting intercity bus flows of passengers. Infrastructure Fixed elements of transportation that Fixed elements that physically support the physically support transport modes. regular services of intercity bus. "A route is a single link between two Route nodes that are part of a larger network A fixed single tangible road between two that can refer to tangible routes such as nodes where intercity bus circulates. roads and rails, or less tangible routes such as air and sea corridors." (a) Any location where passengers and A designed place with specific facilities and Terminal freight either originate, terminate, or is equipments where a bus originates or handled in the transportation process. terminates its scheduled route. A place where passengers can board or A place along a bus route that provides the Stop disembark from a scheduled transport accessibility to intercity bus services and mode, usually identified by a sign. where passengers can board or disembark. It A place with fixed equipments to maintain Maintenance typical operations of the intercity bus facility system. A system of linked cities representing the functional and spatial organization of the intercity bus system. Any location that has access to intercity buses. Here the location can be one city, or a specific stop if several stops are available in one city. A bus network served by Keolis Montreal, Longueuil, etc. Montreal- Longueuil Quebec- Rimouski Express Line Montreal- Quebec Montreal Central Station Longueuil Ticket agent in store a a a a a a a a b
37 15 Table 2.1: Definitions of the components of transport system in both general context and intercity travel context (continued) Component and its elements Definition in general context Definition adapted to intercity travel by bus Example Refer ence Mode Vehicle characteristics Right-of-way Operational aspects Vehicle Flow Vehicles that support the mobility of passengers or freight. The amount of traffic (people, freight or information) that circulates over the network with origins, destinations and possibly intermediary locations. "A motor vehicle used to transport persons" (d) Intercity buses used to move passengers in a regular basis. Characteristics related to the intercity bus in service, like energy type, design (capacity, onboard equipments etc.) and performance (speed, acceleration etc.) The type of easement granted or reserved on road for intercity buses. It can be expressed by technology (bus lane) or road alignment Baggage holds, curtains, onboard wifi Public lane shared with car Operating type, operating regime, etc. Express/local b The amount of traffic (vehicles or passengers) transported orientationally between two nodes. Intercity bus that travels between two nodes with certain frequencies based on defined A rider who has paid a fare on a carrier A rider who has paid for a ticket to travel Passenger in the business of transporting people for with intercity buses. compensation. Reference: (a) Rodrigue et al., 2016; (b) Vuchic, 2007; (c) Black s Law Dictionary, 2017 (d) Texas Transportation Code, 2016; (e) USLegal Dictionary, a b b &c a d e Methodology of performance measures A performance measurement process is not just a mix of indicators. Performance indicators should reflect the objectives of different stakeholders, and it is also important to have the resources in place (National Cooperative Highway Research Program (NCHRP) Report 446, 2000; NCHRP Report 708, 2011; TCRP Report 88, 2003; Florida Department of Transportation, 2014). Several steps are necessary to ensure that all principal aspects are well addressed. TCRP Report 88 proposed an eight-step process for transit agencies of any size implementing or updating a performance measurement program. These steps are, in order: 1. Define goals and objectives; 2. Generate management support; 3. Identify internal users, stakeholders, and constraints;
38 16 4. Select performance measures and develop consensus; 5. Test and implement the program; 6. Monitor and report performance; 7. Integrate results into agency decision-making; and 8. Review and update the program. (TCRP Report 88, 2003) These steps are widely used in various performance measure frameworks, although their execution order may change. For example, the key steps of performance measurement in the framework proposed by Canadian Transport Agency (2010) are 1. Develop a basic results chain; 2. Identify and select performance indicators; 3. Set performance targets or benchmarks; 4. Draft a performance measurement plan; 5. Capture and analyze the performance information; 6. Interpret the findings and task corrective action as necessary; and 7. Communicate the results (Canadian Transport Agency, 2010). The basic aspects, such as defining goals, selecting performance measure indicators, testing performance measures, and then reporting the results and integrating them into operation, are all considered in these two frameworks. The difference is that the latter one does not emphasize the different stakeholders. In practice, all these steps can eventually be simplified to three main stages: determining goals and objectives, data collection, and establishing a framework and developing candidate performance measures (Felsburg and Ullevig, 2012). In the following, some key issues related to the development process are further discussed: Identify internal users, stakeholders, and constraints; Define goals and objectives by categories; Data collection; Establish indicators and develop performance measures; Data analysis using performance measurement tool. The reason why identifying stakeholders comes first before defining goals and objectives is due to the fact that for different stakeholders, their goals are different.
39 Different perspectives of performance measures The choice of performance measure indicators depends significantly upon perspectives. There are mainly three perspectives according to different stakeholders: transit agencies (including transport infrastructure owners and operators), passengers, and community (government at all levels in most cases) (Eboli and Mazzulla, 2010; TCRP Report 88, 2003). Additionally, the Vehicle/Driver can also be considered as a stakeholder (TCRP Report 88, 2003), although it is usually considered as part of the transit agency's perspective (Eboli and Mazzulla, 2010). The differences of these perspectives are discussed below. For transit agencies, the effectiveness and efficiency related to organizational performance are central considerations. This applies especially to the benefit-oriented privately owned intercity companies who must attain specific profit margins. This pushes them to increase revenue by providing a better level of service to maintain and attract more passengers (TCRP Report 88, 2003). Passengers are the customers of transit services, and their perceptions are directly reflected by the service use. Two methods are frequently used to identify the factors that affect the quality of service according to Transit Capacity and Quality of Service Manual (TCQSM): passenger satisfaction surveys and SP/RP surveys (observing/asking people's reaction facing actual or hypothetical choices in different circumstances) (TCQSM, 2012). Availability (frequency, service span, and access), comfort, and convenience (passenger load, reliability, and travel time) are the most important aspects that measure the quality of service for fixed-route transit (TCQSM, 2012). According to TCRP Report 88, factors that influence the perceptions of passengers include spatial availability, temporal availability, information availability, capacity availability, service delivery, travel time, safety/security, and maintenance (TCRP Report 88, 2003). A community generally tries to balance the needs of both agencies and community residents. Communities expect that a public transit service can provide transportation for disadvantaged groups, reduce congestion and air pollution, and create employment opportunities. However, these expectations must be balanced with the perception of transit agencies who need to efficiently and effectively operate the transit system to eliminate the concerns associated with the amount of taxes paid (TCRP Report 88, 2003). The perspective of the vehicle/driver aims at analyzing the interactions between automobiles and buses in mixed traffic operations. Increases in traffic congestion may result in service delays, and
40 18 transit priority actions may influence the car drivers. In this context, all vehicles are treated equally regardless of the number of passengers in vehicles (TCRP Report 88, 2003). The stakeholders of intra-city bus and inter-city bus are different. For intra-city travel, all the four aforementioned stakeholders exist. Urban public transport is generally public owned, and there exists a community (generally the municipal government in Canada) that represents all their residents. There are also different transit agencies that either govern or strategically plan the mobility of a whole region (e.g. Ministry of transport in Quebec) or operates one or more modes of transport in a territory (e.g. Société de Transport de Montréal) (Ministry of transport in Quebec, 2017; Société de Transport de Montréal, 2017). The conflicts between buses and private cars (vehicle/driver) are significant, especially in core cities. However, for inter-city travels, there exist only regulations at provincial and federal levels (in Canada and U.S.). These regulations have two aspects: safety and economic (Fraser, 2002). For example, the cross-subsidization mentioned earlier is a tight economical regulation. Moreover, intercity buses have no significant conflict in sharing the road on highways. Thus, intercity travel by bus, under regulations, involve only operators who maintain the services and passengers who take the buses Types of measures There are mainly four types of measures: individual measures, ratios, indexes, and levels of service (TCRP Report 88, 2003; OHIO Department of Transportation, 2016). Individual measures, such as ridership and frequency, are easy to calculate and can be measured directly (TCRP Report 88, 2003; OHIO Department of Transportation, 2016). Ratios, such as the cost per vehicle mile or passenger per seat mile, are relatively easy to calculate and are developed by dividing one individual measure by another (TCRP Report 88, 2003; OHIO Department of Transportation, 2016). Indexes are created to simplify the complex measures by combining results of other performance measures in an equation to get a single output measure or 1-5 scale is often used for the ease of presentation (TCRP Report 88, 2003; OHIO Department of Transportation, 2016). Level of service (LOS) grades assign A to F (highest to lowest) scores for a particular measure, which are specially developed to measure the quality of service based on users perceptions (TCRP Report 88, 2003; OHIO Department of Transportation, 2016).
41 Performance measurement categories As mentioned above, defining goals and objectives is the first step to develop a performance measure framework after making clear stakeholders. These goals can be grouped into categories with different indicators under each category. The categories and the indicators reported by different agencies can vary a lot depending on their goals. The methods used to obtain these categories are also different. The simplest way is to consider output measures and resource measures. With this approach, efficiency (productivity) indicators are used to measure the output, while consumption rates and utilization indicators are used to measure how resources are used (Vuchic, 2007). In practice, transit agencies sometimes classify the measures based on operational measures and financial measures. These two types of measures are generally reported separately (Florida Department of Transportation, 2014). Indicators related to services, vehicles, employees, and effectiveness are chosen for operational measures, while expenses/revenue and efficiency are selected for financial measures (Florida Department of Transportation, 2014). In private industry, performance measures are often classified into 3 categories by further considering customer satisfactory: system monitoring (e.g. number of complaints, accidents per mile), revenue and cost measures (e.g. percent of revenue from fare box, cost per rider/mile/trip), and customer satisfaction/loyalty (e.g. level of customer satisfactory, possibility of customers recommend service or continue to repurchase or use service) (TCRP Report 88, 2003). Another way is to distinguish these indicators by types of measures mentioned above. For example, Thompson (2001) classified the indicators into 3 main categories according to different types of measures: general performance indicators, effectiveness measures, and efficiency measures. General performance indicators are based on individual measures that can be directly obtained (e.g. vehicle-miles, vehicle-hours, and total operating expenses), effectiveness measures and efficiency measures are both ratio measures. The meanings of efficiency and effectiveness are sometimes confused. Indeed, efficiency devotes to maximizing output with less input (resources) (Carvalho & Syguiy, 2015). Examples include cost efficiency (e.g. operating expense per capita, operating expense per passenger-mile, and operating expense per revenue hour), vehicle utilization (e.g. revenue miles per vehicle mile, revenue hours per vehicle, and revenue miles per vehicle mile), labour productivity (e.g. revenue hours per employee and passenger trips per employee), energy
42 20 utilization (e.g. vehicle miles per gallon), and fare (e.g. average fare per passenger) (Florida Department of Transportation, 2014). Whereas, effectiveness measures indicate how useful the service is (Florida Department of Transportation, 2014) by only evaluating the output regardless of input (resource). Examples of effectiveness measures include service supply (e.g. vehicle miles per capita), service consumption (e.g. passenger trips per capita, passenger trips per mile, and average trip length), quality of service (e.g. number of incidents, average age of fleet, and revenue miles between failures), and availability (e.g. revenue miles per route miles and route miles per square mile of service area) (Florida Department of Transportation, 2014). Based on the classification of efficiency and effectiveness, the project of Strategies for Public Transport in Cities (SPUTNIC) funded by European Commission distinguished the cost and the service of transit agencies by proposing four categories: cost efficiency indicators, cost effectiveness indicators, service effectiveness indicators, and service quality indicators. These four groups address four corresponding concerns: how many resources were expended per unit of public transportation service, how much consumption revenue was received per unit of resource expended, how much public transportation service was consumed (or revenue received), at an established price, in relation to the amount of service available, and does the delivery of public transportation service meet or exceed customer expectations (SPUTNIC, 2002). These categories can still be further refined by different departments within a company, e.g., financial state, operation, vehicle management, customer service, human resource, etc. For example, Carter and Lomax (1992) structured the indicators as seven categories to compare different agencies: cost efficiency, cost effectiveness, service utilization, vehicle utilization, quality of service, labor productivity, and accessibility. By integrating the sustainability dimension expected by the community and the expectation of the passengers, these categories can be enlarged. Shen et al. (2011) listed a series of performance indicators used by transportation plans, policies, and research all over the world, and counted their frequency of use. These indicators are grouped into 9 classes based on their goals: demand and context, affordability and accessibility, mobility, economic development, quality of life, operational efficiency, environmental and resource conservation, safety, and infrastructure condition and performance.
43 21 TCRP Report 88 selected the best practices across the US for collecting and analyzing performance measures at transit agencies. Both traditional and non-traditional performance indicators are listed and combined with a step-by-step process for users to develop a performance measurement program. According to TCRP Report 88 (2003), there are 10 categories, eight of which are primary measures and two others are secondary measures (paratransit and comfort). Each category can be subdivided into one or more performance measurement goals. Menus from which performance measures can be selected are available. Each category represents one or several perspectives. The linkage between different categories and perspectives is shown in Figure 2.2.
 TCRP Report 88 proposed a methodology to develop a")

44 22 Note: Categories in dark green are primary measures and in light green are secondary measures Figure 2.2: Linkage of the categories with different perspectives (TCRP Report 88, 2003) TCRP Report 88 proposed a methodology to develop a performance measure program that can help improving transit agency s effectiveness and efficiency using qualitative and quantitative indicators. After completing the performance measure program, TCRP Report 141 (A Methodology for Performance Measurement and Peer Comparison in the Public Transportation
45 23 Industry) defines a method for transit agencies to evaluate their effectiveness and efficiency by peer comparison and benchmarking. This report completes TCRP Report 88. It points out that establishing a peer group is the vital part of the benchmarking process, and size, goals, and resources available should be considered when selecting performance measures. However, each performance goal is unique for a specific transit agency. TCRP Report 141 proposed five groups of descriptive measures to find the comparable transit agencies, they are: urban area characteristics (e.g. urban area size, population, employment, etc.), transit service characteristics (e.g. service area size, annual vehicle miles operated, annual revenue hours, etc.), transit agency characteristics (e.g. organization type, number of employee, etc.), delivered service quality (e.g. revenue miles per capita, revenue miles per urban area square meters, etc.), and transit investment (e.g. average fleet age, local revenue, etc.) (TCRP Report 141, 2010). The indicators are grouped into nine categories to compare the outcome achieved by the transit agency with certain inputs (Table 2.2). Table 2.2: Output measure categories for peer comparison (TCRP Report 141, 2010) Category Description Example of indicators This category evaluates the agency s Operating cost per revenue Cost-efficiency ability to maximize outputs within the hour constraints of inputs. Cost-effectiveness Productivity Service utilization Resource utilization Labor administration Maintenance administration Perceived service quality Safety and security This category compares the service cost with service outcomes. This category evaluates the number of passengers served by the unit of service (time, distance, vehicle, or employee) This category measures the service utilization by passengers This category measures the resource (vehicle, employee, consumables, etc.) utilization by transit agency This category assesses the transit agency s human resource management This category measures the transit agency s vehicle and infrastructure maintenance This category assesses the quality of service perceived by passengers This category measures safety and security elements (e.g. accidents, crimes) that can impact the passengers perceptions of transit agency Operating cost per boarding Boardings per revenue hour Boardings per revenue mile Annual boardings Annual passenger miles Average trip length Vehicle miles per gallon of fuel consumed Percent of labor hours that are overtime Vehicle (car) miles between failures On-time performance Waiting time Collisions per 1,000 miles
46 24 The category classification by TCRP Report 88 is more macroscopic to cover as many stakeholders as possible. Compared to TCRP Report 88, TCRP Report 141 pay more attention to the specific outcomes that the transit agencies probably concern the most. For example, TCRP Report 141 detailed the category Economic of TCRP Report 88 by efficiency (cost-efficiency), effectiveness (cost-effectiveness and productivity), and utilization (service utilization and resource utilization). However, TCRP Report 141 does not mention the impact of community on transit agency Data collection In public transit, sources of data for transit agencies to establish performance measures can be classified into three groups: in-house data, data from other agencies (e.g. partner transit operators, planning organizations), and data collected with extra efforts of agencies (e.g. taking surveys). The ease of getting these sources of data can vary considerably. In-house data is the easiest source of data to get because it only requires good record keeping. Examples of in-house data include schedule data, fleet data, financial data, records of maintenance, employees, complaints, accident, and incident, etc. (TCRP Report 88, 2003). Collecting data from other agencies needs collaborations, although sometimes the data are already available as an open source. Examples include demographic data, traffic data, etc. (TCRP Report 88). Many planning organizations or corporations can also provide useful data. The most significant example is the dataset derived from geographic information systems (GIS) software maintained by many planning organizations (TCRP Report 88, 2003). Data collected with the extra effort of agencies can be subdivided into three groups based on data collection methods: automated data collection, semi-automated data collection, and manual data collection. Examples of automated data collection include automatic vehicle location, automatic passenger counters, electronic fare boxes, etc. Examples of manual data collection include customer satisfaction surveys, safety reviews, and passenger environment surveys. Manual data collection can require increased labour efforts from bus operators, traffic checkers or filed supervisors. (TCRP Report 88, 2003). Data collected with the extra effort of agencies can be subdivided into three groups based on data collection methods: automated data collection, semi-automated data collection, and manual data collection. Examples of automated data collection include automatic vehicle location, automatic
47 25 passenger counters, electronic fare boxes, etc. Examples of manual data collection include customer satisfaction surveys, safety reviews, and passenger environment surveys. Manual data collection can require increased labour efforts from bus operators, traffic checkers or filed supervisors. (TCRP Report 88, 2003). Combining the categories listed above, the sources of data needed are shown in Table 2.3. Table 2.3: Categories of performance measurement and potential source of data (TCRP Report 88, 2003; TCQSM, 2012) Categories 1. Availability 2.Service delivery Potential source of data or origin of data Basic schedule like public transit timetables Route data like system maps GIS software Records of agency Extensive manual or automated data collection Customer satisfaction survey Passenger environment survey Metropolitan planning organization City planning department 3. Community GIS software Regional transportation planning model Automatic vehicle location equipment 4. Travel time Field data collection Data generated by the regional transportation planning model Customer satisfaction survey 5. Safety and security Records of agency 6. Maintenance and construction Records of agency 7. Economic Records of agency Records of agency 8. Capacity Extensive manual or automated data collection Metropolitan planning organization 9. Paratransit City planning department Records of agency Customer satisfaction survey 10. Comfort Passenger environment survey It is worth noting that performance measures conducted using database obtained from fare boxes (automated data collection), also known as smart card data in urban areas, is a feature used in this thesis. Smart cards are increasingly used in urban transit area all over the world. Generally, the smart card datasets provide continuous information, temporal-spatial information, mode and service information, cardholder information, and purchase information (Bagchi et al., 2003; Trépanier et al., 2009). These datasets can be used to improve transport strategic planning and
48 26 operation management. Previous studies can be classified into 3 groups: trip identification, operation analysis, and passenger travel pattern analysis. For trip identification, smart card data are used to estimate destinations for entry-only transit systems (Chan, 2007; Trépanier et al., 2007; Nassir et al., 2015). Smart card data are also applied to extract passenger trips, identify transfer stations (Bagchi and White, 2005; Chu et Chapleau, 2008; Hoffman et al., 2009; Chu, 2015), and detect passenger activities (Nassir et al., 2015; Nishiuchi, 2015). Chapleau and Chu (2007) also presented different types of suspect data appeared in the smart card dataset. At operational level, smart card data can be used for ridership prediction (Van et al., 2015), vehicle reliability measurement (Uniman et al., 2010), and urban transit performance measurement (Morency et al., 2007; Trépanier et al., 2009) by describing both transport demand (passengerkilometers, passenger-hours, average trip length, etc.) and supply (vehicle-kilometers, vehiclehours, commercial speed, etc.). Smart card data can also help understanding travel behaviors. Agard et al. (2006) clustered users with similar trip habits and travel behaviors with k-means algorithm. By using these datasets, trip rates, bus-to-bus interchanges, and turnover rates can also be computed automatically (Bagchi and White, 2005). Intercity bus sales database, similar to the urban fare collection system, can also be used to assist operators to manage their daily operations with experiences obtained from the urban analysis. These two datasets have both similarities and differences. Both smart card and intercity bus sales databases can provide spatial information. Some distancebased fare collection systems record both passenger s boardings and alightings, although a quite amount of fare collection systems in North America only record passenger s boardings (e.g. Montreal, New York, etc.). Thus, it is necessary to estimate origins and destinations for smart card data using detection algorithms and to confirm the collected information with complementary passenger surveys. Whereas origin-destination information is already available in intercity bus sales database, and this dataset little suspect data. Both of these two databases can provide longitudinal information on passenger trip patterns in terms of trip frequency, complete trips, transfer stations, and transfer times. An urban fare collection system can continuously record passenger travels by smart card ID. However, only
49 27 passengers who possess smart cards can be detected. Passengers with paper magnetic tickets cannot be traced. Whereas, intercity bus sales database records passenger reservation by an account ID and hence, only reservations made via web will be continuously recorded. Passengers who buy tickets from agents or drivers cannot be followed. Both of these two databases provide temporal information. Urban smart card data report passenger s boardings (by bus) in real-time, while intercity sales database reports passenger s ticket reservations in real-time. Thus, intercity bus sales databases cannot be used to measure bus traveling delay, but it can be used to better plan vehicle organization with prior knowledge of travel demand. Moreover, intercity bus sales databases can provide some supplementary information related to passenger travels, which is not available in urban fare collection systems. For example, intercity bus sales databases can tell passenger accompaniments by detecting how many trips are reserved together. This information is impossible to get from smart card data because one card can only be used by one person at one time. Finally, Intercity bus sales databases can follow passenger s trip planning process by providing different status (e.g. modify, refund) of ticket reservations Demand related indicators The procedure of performance measure indicator selection in this study respects three subjects: relation to demand, perspectives considering both intercity bus operators and passengers, and data availability. As for relation to demand, indicators that are related to system networks and flows are considered. Network reflects the interaction between supply and demand, and flow represents the demand. Indicators that only relate to supply, such as infrastructure and mode, are not considered. Other resource measure relates to supply, such as operation costs, workforce, facilities, and energy, are not reported either. Both operator s and passenger s perspectives are essential. Perspectives of the community and vehicle/driver are not considered. Measures would become obsolete if the data are not available or too difficult to collect, thus data collection is limited to intercity bus operators that collaborated to this study and online sources. The potential performance measures refer mainly to TCRP Report 88 (2003) and TCRP Report 141 (2010). They are grouped into 7 categories. All the categories are classified into four groups:
50 28 demand, supply, demand and/or supply, and other, as listed in Table 2.4. There are several potential measures under each category. Each measure can be represented by an individual indicator or a group of indicators. Indicators or indicator groups related to the demand are in green color. Table 2.4: Categories of intercity travel demand based on the menu of TCRP Report 88 (2003) and TCRP Report 141 (2010) (Note: Only the goals in green that are related to demand or interaction between supply and demand are finally reported, the others are either supply or unrelated subjects.) Categories Service availability Perceived service quality Community impact Potential measure descriptions To know where and when transit service is provided To know how well customers get access to information of service To know the capacity constraints on availability To know how well service is provided as scheduled To know how reliable vehicles are Potential measures related to subjects Spatial and temporal availability Information availability Examples of indicators Route coverage, service hours, revenue hours, frequency Percentage of calls held excessively long Subject Supply Supply Capacity availability Vehicle capacity, person capacity Supply Service reliability Vehicle reliability On-time performance (fixedroute), missed trips Scheduled miles per minute of delay, road calls due to vehicle break down To know how reliable Equipment reliability Subway elevator reliability non-vehicle equipment is Supply The quality of customer contacts with agency staff Passenger comfort while using transit in different stages of travel Customer satisfaction with the service provided To know how easily destinations can be reached by transit Ways that transit affects a community The impact of transit on the environment Customer interaction Complaint rate Passenger comfort Customer satisfaction/loyalty Mobility Outcomes Environmental impact Percent of stops with shelters and benches, travel time, transit-auto travel time, transit-auto travel speed ratio, route directness, climate control systems Overall customer satisfaction Supply Supply Other Demand or Supply Other Trip generation, service coverage Supply Community economic impact, employment impact Noise impact Other Other
51 29 Table 2.4: Categories of intercity travel demand based on the menu of TCRP Report 88 (2003) and TCRP Report 141 (2010) (continued) Safety and security Maintenance administration Labor administration Economic To decrease vehicle and Vehicle and property Accident rate, number of fires property damage damage Other To decrease potential Percent of buses exceeding speed Accident potential Other accidents limit To increase workplace Employee work days lost to Workplace safety safety injury Other To increase passenger security Passenger security Crime rate Other Vehicle and facility To know how well an maintenance Fleet cleaning Other agency maintains its Preventive Number of defects reported by vehicles and facilities maintenance operators Other and its impacts on the Ability to respond to Spare ratio overall passenger vehicle breakdowns Other perceived service quality Effects of construction on passengers Customer impact index Other An array of measures that are used to daily employee management or labor negotiations To know how well the transit services and resources are utilized To know how well the services are provided To know how well the demand is met, given existing resources Administrative employee Vehicle operator Maintenance staff Utilization Efficiency Effectiveness Employee relation, cost of staff type/operating costs, percent of labor hours that are overtime Ridership, passenger-miles traveled, human resource utilization, energy consumption, volume to capacity ratio Other Other Other Demand and Supply Cost efficiency, service miles per Demand revenue miles, peak to base ratio, and population served per vehicles in Supply maximum service Cost effectiveness, productivity (passengers per vehicle hour), passenger miles traveled per hour, passengers per mile Demand and Supply Based on these categories, indicators chosen for intercity bus performance measurement are shown in Table 2.5 and Table 2.6. Indicators relate to supply, but are indispensable for analyzing the interaction between supply and demand, are also used (Table 2.7). These indicators are classified into 3 groups: operator measures, passenger measures, and supply measures. The operator measures are key factors that influence the determination of supply provided by intercity bus operators. The passenger measures are chosen in order to assess the convenience of current service for intercity bus customers, which significantly influences customer satisfaction levels.
52 Table 2.5: Intercity travel demand related indicators chosen based on the menu of TCRP Report 88 performance measures from operator s perspective 30 Group Indicator Definition Description Operational measures Ridership Passengerkilometers traveled Peak-to-base ratio Productivity Passenger load Volume (Demand) to capacity ratio (V/C ratio) "The number of passengers transported" (a) "The total of all passenger journeys, measured in kilometers, made in a period" (a) "The proportion of additional vehicles required for peak service, compared to base service" (a) "Total passengers divided by total revenue or service hours" (a) "The number of people on board a transit vehicle" (a) "Percentage of capacity that is being utilized" (a) Data elements needed The number of This indicator measures the number of individuals individuals boarding and/or alighting at a stop, boarding and/or along a link, route, or the system as a whole. Here alighting at a stop, the ridership measures the trip segments, where route; all boardings are counted, including transfers. The ridership varies according to the time of day. Schedule This indicator measures the total distance traveled by passengers, influenced by both the number of passengers and the distance they traveled. This indicator provides an indication of the number of additional vehicles required to serve peak periods, compared to the off-peak period. The lower the ratio, the higher the ability to use vehicles is. Productivity is the ratio of total passengers transported divided by total revenue or service hours provided during a given period. It impacts on service cost. Productivity ratio is higher when revenue hours are used as revenue hours excludes vehicle hours in which revenue is not provided. Number of passengers at the maximum or average load point. Peak period and directional effect are considered. This indicator typically reflects the percentage of person capacity being used. Directional imbalances in demand at different times exist. Number of individuals boarding and their trip length Scope Formula Unit Refer ence Stop; Link; Route; System System Number of vehicles used in peak period System and off-peak service Number of individual boardings; Schedule Passenger counts Passenger volumes; Vehicle capacities; Vehicle occupancies; Geometric Reference: (a) TCRP Report 88 (2003); (b) Urban Bus Toolkit (2016); (c) Vuchic (2007); (d) TCQSM (2012). Route; System Stop; Route Stop; Link; Route Number of trip segments * trip segment network distance or network distance of link * link ridership Maximum vehicles used in peakperiod/vehicles used on off-peak period Ridership/ vehicle revenue hours prs/ vehh Passengerkilometers traveled/seat kilometers traveled prs prskm prs a,c a,b a a b % a
53 31 Table 2.6: Intercity travel demand related indicators chosen based on the menu of TCRP Report 88 Passenger measures Group Indicator Definition Description Passenger measures Travel time Transitauto travel time Maximum number of transfers Percent of trips requiring transfers Transfer time "Average duration of a passenger trip from origin to destination or over a specified link" (a) "A comparative measure of transit and auto travel times " (a) "Service design measure reflecting transit service convenience" (a) "Measure of transit service convenience" (a) "Delay incurred or perceived when transferring between transit vehicles" (a) This indicator measures how long it takes to make a trip by transit. This measure can be averaged for both specific routes or corridors and for a system. The transit will be more competitive for a trip if the transit travel time is shorter compared to the automobile. This indicator can be applied with either an average door-todoor time or only in-vehicle time. The expression can be a ratio or an absolute difference. Passengers generally prefer one-seat ride. For circuit design purpose, transit will be more convenient with less number of transfers between the desired origin and destination. Data elements needed Transit travel time by route or route segment; Schedule data Schedule data; Local transportation planning dataset Desired origins and destinations, Number of transfers Desired origins and destinations, Number of transfers, Number of complete trips Schedule data Scope Formula Unit Route, system Route, System Route, System System Stop, System Reference: (a) TCRP Report 88 (2003); (b) Urban Bus Toolkit (2016); (c) Vuchic (2007); (d) TCQSM (2012). Transit travel time/auto travel time Number of trips requiring transfers / total number of trips hrs Refer ence a a,d a % a min a,b
54 32 Table 2.7: Intercity travel demand related indicators chosen based on the menu of TCRP Report 88 Supply measures Group Indicator Definition Description Useful supply attributes Revenue hours "The number of seats on a transit vehicle, multiplied by the number of distance the vehicle travels in revenue service" (a) The number of transit vehicle hours when vehicles are in service with revenues This indicator is a planning-level capacity availability measure. It estimates the capacity offered by the system. This indicator measures the total hours when vehicles are generating revenues (transporting passengers). Deadhead hours (layovers and traveling in revenue service without passengers) are not included. Data elements needed Number of seats provided on transit vehicles, number of distance traveled by each vehicle in revenue service Reference: (a) TCRP Report 88 (2003); (b) Urban Bus Toolkit (2016); (c) Vuchic (2007); (d) TCQSM (2012). Scope Formula Unit System Vehicle capacity *distanc e Seat capacity (Seatkilometers) spskm Refer ence a,d Schedule System hrs a,d
55 Components of travel time Travel time is a core aspect of the level of service provided by a transport system. Travel time is found to be the strongest predictor of mode choice (Cervero, 2002; Ackerman & Gross, 2003; Grotenhuis et al., 2007). Major investment decisions in the transportation sector depend on the estimation of social impacts as a function of travel time. Travel time savings are the single most important component in the measured transport benefits/disbenefits of most schemes and policies (SACTRA, 1999). Frank et al. (2008) show that urban forms at residential and employment locations, travel time and monetary cost are the major predictors of travel choice. Muller and Furth (2009) point out that the modal split of transit is correlated with the transit-auto travel time ratio, the frequency of the operation, and the number of transfers. The door to door transit travel time can be divided into two parts: access time and station-to-station time (Stratton et al.,2013). These two components can be separated more precisely into different travel phases: access time to the origin station, wait time for transit, in-vehicle time, transfer time, and egress time to the destination from the transit (TCQSM, 2012; TCRP Report 88, 2003). Some studies consider the travel time as the in-vehicle time and out-of-vehicle time (Bhat, 1995; Larrain et al., 2010; Chapman et al., 2007). However, time can be perceived both objectively and subjectively. The objective time relates to the time that clocks measure, and the subjective time relates to the sense of time by passengers. Numerous studies showed that different types of passengers often perceive the time differently under different circumstances (Fan et al., 2016; Lagune-Reutler et al., 2016). For urban public transport, the wait time at stations during a trip with transfers are often perceived longer than they actually are (Cheng & Tsai, 2014, Hagen et al., 2007, Chapman et al., 2007, Fan et al., 2016; Lagune-Reutler et al., 2016). Even though recent advances in mobile device technology are enhancing opportunities for more productive use of travel time (Lyons and Urry, 2005), the time a passenger spends on waiting for their vehicle of choice is still considered as a critical element. There are different types of waiting time due to the varying causes for it. For instance, passengers wait when they arrive at the station earlier than the departure time, they may wait an unexpected time due to bus delays, they may also wait between transfers if connections are not properly scheduled, or planned connections are missed. The perceptions of waiting time are highly
56 34 subjective. Mode, availability of schedule information, and stop amenities are examples of factors that possibly influence the perceptions (Fan et al., 2016; Hagen et al., 2007). There are a variety of approaches for evaluating both the objective time and subjective time in different phases during the travel. These phases of travel time are discussed below Access and egress It is recognized that facilitating access to public transport stations can potentially increase transit use (Brons et al., 2009; Transport Canada, 2011; The city of Edmonton, 2016). The subjects related to access include the mode of access, the distance of access, station design, ticketing facilities, etc. Taking surveys is a popular way to get access time, but accurate estimates of access are often in short supply (Krygsman et al., 2003). Givoni & Rietveld (2007) analyzed the access to railway stations in the Netherlands based on the Dutch Railways (NS) customer satisfaction survey carried out during a single week (Monday to Friday). The research related mode choice and the effect of passengers perception of access conditions to the overall traveling satisfaction. They concluded that walking, bicycles and public transport are mostly used to access to or egress from railway stations. They also found that the station facility quality influences the general travel perceptions. However, the time spent for access by different modes was not reported. Krygsman et al. (2003) tried to analyze the absolute access and egress travel time, the relationship between the access/egress time and the total travel time (also called interconnectivity ratio), and the factors that may influence it. The research is based on an extensive two-day travel and activity diary survey. Results show that access time can be estimated by a non-linear function of common transportation variables (mode, transfers, line-vehicle time, etc.). Results also support a conclusion that the out-of-vehicle time may increase when the in-vehicle time increases because the importance of out-of-vehicle time decreases with longer trip distances Waiting In urban public transport area, the wait time of a passenger could be considered to be half of the interval of the line based on the assumption that passengers arrive in a randomly uniform distribution. This assumes that if the service is frequent, passengers do not bother to consult the
57 35 schedule (Luethi, 2007). This is not the case for intercity travels due to its relatively long headway and fixed schedules. Indeed, intercity travel passengers do consult schedules, and their arrival is clustered around the departure time. There will always be a margin for safety time (arriving at the station a bit earlier than the departure time) (Luethi, 2007). Both railway operators and intercity bus operators recommend their customers to be at the station at least 30 minutes prior to their scheduled departure time (Via Rail Canada, 2007; Bus Carriers Federation, 2007). The real time of waiting can be obtained by field surveys or video record. Ferris et al. (2010) used an online survey to evaluate the effect of providing real-time arrival information for bus riders. Results indicat that real-time arrival information strongly increases the overall satisfaction of public transport, decreases waiting time, increases transit using frequencies, and improves both passengers physical and mental feelings. Fan et al. (2016) compared the waiting time reported by a passenger survey at different types of transit stations, and collected the data with recorded video equipment. They found that stop amenities (benches, shelters and real-time departure information signs) erase the wait time perception. Watkins et al., (2011) used both a self-report survey and field observation to analyze the effect of a real-time bus countdown information by website, telephone, text-messaging, and smart-phone application. This study found that the perceived wait time is greater than the measured time for riders without real-time information, but similar for riders using real-time information. The average wait time is shorter for real-time information users than traditional arrival information users. The introduction of mobile phone real-time information reduces both perceived and actual wait times In-vehicle Timetables are the simplest way to estimate the in-vehicle time. Although carriers continuously work on improving on-time performance of public transport services, many factors contribute to the service advancement or delay. For instance, bad weather or heavy road conditions could affect the speed. Other sources of variability (number of passenger boardings/alightings, ticket showing method, number of buses at the terminal, etc.) may influence the time that a vehicle stops at each station. Low density of vehicles on the road and low passenger boardings/alightings at night may result in the advancement of vehicle arrivals. Automatic fare collection systems and GPS recording
58 36 equipment are often used to obtain more exact in-vehicle time (Jang, 2010; Fuse et al., 2010; Ban et al., 2009) Transfer Transfers are necessary for the public transport system. It is economically infeasible to have direct connections between all destination points within a public transport system (Guo and Wilson, 2011). Transfers allow passengers to travel along an enlarged service area on the transport network. However, they do interrupt the travel experience by elongated waiting times. Sometimes physical transfer from one vehicle to another makes the public transport less competitive compared to personal automobiles which provides a door-to-door service (Guo & Wilson, 2011; Poorjafari et al., 2016). If passengers encounter bad weather, carry heavy luggage, or have physical barriers like roads and stairs during their trip, their travel experience will be significantly affected (Poorjafari et al., 2016). The inconvenience brought by transfer waits, and their evaluation and optimization are reviewed. Transfer time can be analyzed by the scheduled transfer time, actual waiting time, or perceived waiting time. The scheduled waiting time can be calculated based on a timetable, while the actual and perceived waiting time should be measured with extra observations or field surveys. Transfer rules within one mode or several modes are quite different over the world. In some areas, transfers are unrestricted during a specified limited time on all modes of urban transit. For example, some cities allow transfers between buses and metros or light rail transit on a single fare, on any line in any direction, and valid for defined hours (e.g. Durham, Edmonton, and Vancouver). Some cities allow completing the trip within certain hours but not allow a return trip or transfer on the same route (e.g. Montreal). For distance fare-based areas or large-scale cities, transfer conditions can be complicated by limiting the number of transfers and the duration of activity at the transfer points (e.g. Singapore). In some cities, passengers pay each time they board transit but with certain reductions in case of transfers within a defined period (e.g. Shanghai). In some cities, no transfer policy is applied, and people have to pay each time they board (e.g. Beijing). Methods of identifying the transfers are different depending on the different ticket checking ways and transfer rules mentioned above. In some cities, passengers only have to tap the ticket once they board on the vehicle. In this case, special algorithms are necessary to estimate travel time, transfer station, and trip destinations (Munizaga et Palma, 2012; Zeng et al., 2014; He et al., 2015; Trépanier & Chapleau, 2006; Trépanier et al., 2007). Sometimes the passengers have to tap at both boarding
59 37 and alighting stations. In this case, trip segments are robustly recorded, and transfer data collected from the automatic fare collection system can then be used to locate the critical transfer points and to analyze the transfer pattern (Jang, 2010). Intercity bus transfers are both similar and different with urban transit transfers. For intercity travel by bus, the passengers pay upfront for each trip segment but can benefit from some discounts in case of transfers. However, ticket price is not only influenced by the distance, but by the advance purchase as well. As a result, the price is not a suitable way to separate the round-trip and trip with transfer. Round-trips or transfers could be identified by the location chain or the time period because travel times and activity times are generally longer for intercity travels than urban travels Corresponding inconvenience As discussed earlier, the perception of transfers is usually considered negative. TCRP Report 88 suggests that in urban transport areas, each minute of transfer time equals 1.5 to 3 minutes of invehicle time or each transfer adds the equivalent of 15 minutes to a trip. The estimates of these transfer penalty parameters may change depending on different contexts: mode, travel distance, socio-demographic characteristics, travel purpose, and the necessity of vehicle change, etc. (Vrtic and Axhausen, 2002; Bovy & Hoogendoorn-Lanser, 2005; Nielsen and Frederiksen, 2006). Transfer time and its impact on passengers are different for intercity travels as their minimum connection times are much longer. The minimum connection time varies considerably based on the market, transfer station, and user needs (Leff, 2015). Air Canada, for example, sets a sample published minimum connection time for different terminal stations based on different flight types (Regular or Rouge or Express flights) and destinations (within Canadian destinations, US destinations, or international destinations) (Air Canada, 2017). The minimum connection time can vary from 15 minutes for a small terminal station (e.g. Moncton) between 2 express flights to 80 minutes for international connections. In most cases, passengers need a longer time to make the transfer, especially for those who take heavy luggage, go through a large busy transfer station, or expect to take a snack. The railway and intercity bus reservation systems generally automatically adjust for minimum connection times. There are four types of passengers at each transfer station (Goverde, 1998; Vansteenwegen and Oudheusden, 2007): departing passengers who start their trips from the transfer station, through passengers who remain in the same vehicle at the transfer station, transfer passengers who make
60 38 connections from a feeder vehicle to a connecting vehicle, and arriving passengers who end their trips at the transfer station. The effects of transfer wait on different types of passengers vary. The transfer wait is generally considered to have less effect on departing passengers or arriving passengers than for transfer passengers and through passengers. A tightly scheduled connection increases the chance of missing a connection, which will cause a more important waiting cost for transfer passengers (Vansteenwegen and Oudheusden, 2007). For railway timetable practice, connection buffer time (or recovery time), which compensates for small arrival delays of the feeder train, is usually inserted into the schedule to lower the chance of missing the connections (Goverde, 1998; Goverde, 1999; Davenport, 2014). Buffer times, however, will keep waiting through passengers when the vehicle is on time (Goverde, 1999; Vansteenwegen and Oudheusden, 2007) Evaluation and optimization of transfer waits based on timetable Similar to the transit system itself, the evaluation of transfers can focus on different attributes from various stakeholder s perspectives. For example, Chapman et al. (2007) categories the attributes based on three perspectives, which are: 1) passengers: access, connection reliability, information delivery, amenities, safety, and security; 2) transit agencies: fiscal, institutional and coordination, passenger processing; 3) neighborhoods: community image, joint development and partnerships, safety and security, environmental impacts, local economy and employment, and physical and social impacts on neighboring land uses. There are many ways to improve transfers. Muller et Furth (2009) found that improving punctuality rates of arrivals and departures by general operational control can increase the reliability of the transfer. They also proposed to hold the connecting vehicles just until connections are made to prevent unnecessary passenger delays due to failed transfers. Other ways could also decrease the perception of transfer wait, such as constructing an efficient multimodal terminal hub, increasing service frequency, and providing real-time service status (Horowitz & Thompson, 1994; Muller et Furth, 2009; Mahmoud et al., 2015). However, all these methods require significant investments in infrastructures and facilities. Modifying timetables and synchronizing between different routes is an effective way to decrease the scheduled waiting time with limited resources (Horowitz & Thompson, 1994; Hsu, 2010).
61 39 Some methods are proposed to synchronize timetables. The purpose of synchronization is to determine how long the connecting vehicle should wait when the feeder vehicle is late (Vansteenwegen and Oudheusden, 2007). Many studies have sought to develop models and mathematical formulations to generate timetables with maximal synchronization (Caimi et al., 2016). Their principals are presented and they can be further developed to improve the transfers for intercity travel by bus. Jansen et al. (2002) proposed a mathematical optimization model by minimizing the weighted sum of transfer waiting times. The weights are obtained by multiplying passenger transfer patterns with the value of time depending on the type of passenger. Daduna and Voss (1995) introduced a model aimed at minimizing the sum of all waiting times weighted by the number of transfer passengers. Ceder and Tal (1999) proposed to maximize the number of simultaneous vehicle arrivals at the transfer points. Vansteenwegen and Oudheusden (2006) came up with a function allowing for the minimization of waiting cost in terms of running time supplements, different types of waiting times, and late arrivals. However, Fleurent et al. (2004) pointed out that generating transfers that are close to ideal waiting times for certain places, routes and directions at certain times may be more important than minimizing the overall waiting time in improving the overall transfer perception. 2.4 Concluding remarks In light of the review of relevant existing literature, it is understood that there is an obvious difference between urban travels and intercity travels. First, travel characteristics are different. A higher proportion of intercity travels is taken for leisure purpose, followed by business purpose, while the intercity travel incidence and travel frequency are much lower than urban travels. Second, the importance of access and egress time is less significant for intercity travels. Finally, generating an appropriately scheduled transfer time and providing better services at transfer location are more important for intercity travels, while optimizing urban transfer connections can be realized by minimizing transfer time. The procedures to set up a performance measure framework using indicators, and to analyze passenger trip patterns with fare-related datasets in urban transit practice can also be used in intercity travel area. Nevertheless, the indicators used in urban transit performance measurement have to be adequately adapted to the study of intercity travels by considering both intercity bus operator s and passenger s perspectives.
62 40 CHAPTER 3 METHODOLOGY This chapter is dedicated to the presentation of the methodology used in this thesis to characterize the intercity travel demand by bus in Quebec. First, a flow diagram that forms the basis of the proposed methodology employed in this thesis is presented. Then, three main elements in this flow diagram, namely the source of data, data processing, and performance measures, are detailed. Finally, the methods to visualize the results are discussed. 3.1 Flow diagram Performance measurement and passenger trip pattern analysis is a process involving data collection, data processing, data characterization, and analysis, etc. For intercity travel by bus, passengers are suggested to reserve their places in advance (Keolis, 2017; Bus Carriers Federation, 2017). The information on the tickets for intercity travel is not the same as for urban transit. A ticket used for intercity bus travel is personalized with a determined origin-destination (OD) and time of departure. Passengers need to apply for modifications or refunds in case of changing departure date, time, or OD based on the conditions associated with the tickets. Consequently, an intercity bus sales database can provide accurate passenger travel information. By combining this information with intercity bus supply, we can both evaluate the performance of the network at different levels and understand passenger s trip patterns. This procedure is illustrated by a flow diagram shown in Figure 3.1.

63 41 Figure 3.1: Diagram of methodology Details about each element in this structure are presented in the following sections. 3.2 Source of data General description of datasets There are mainly two sources of data in this study: operational data coming from a major intercity bus operator in Quebec, Keolis, and associated geographic information in the General Transit Feed Specification (GTFS) format developed by Barbier (2016). Sales database is an ideal source of data for analysis based on both operator s and passenger s perspectives. It is a good barometer of operators state of business, and it provides the clearest indication of customer preferences by showing what they have chosen to buy or not to buy. The main source of data in this study used is the sales database provided by Keolis. In this dataset, all the tickets sold by Keolis from the end of January until the middle of May in 2016 are recorded, including the network operated by Keolis and by other operators in Quebec who did not participate in this research. Details of this dataset are presented in the following section.
, the green color shows that the field is required (the field column must be included in this file, and a value must be provided for each")
64 42 Another source of data used is the GTFS developed by Barbier (2016). A conceptual map of a GTFS file is shown in Figure 3.2. The yellow color shows that the dataset is unique (the field contains a value that maps to a single distinct entity within the column), the green color shows that the field is required (the field column must be included in this file, and a value must be provided for each record), and the grey color shows that the field is optional (the field column may be omitted from the file). This file is mainly used to construct the network in terms of nodes, links, and lines. Figure 3.2: Conceptual map of the GTFS (Google developers, 2016; Barbier, 2016) The timetable developed by Barbier (2016) integrated bus arrival/departure times at each stop and the sequence of all the stops for every route operated by the six partners based on the schedules available before June When comparing the timetable with the sales database, however, the internal code used for each route, the name of the stop, and the departure times are not always the same. The timetable is verified and synchronized in accordance with the sales database, and includes all the intercity bus carriers that have appeared in the sales database of Keolis Description of Keolis sales database The sales database is an excel file with 17 fields. These fields could be classified into 4 groups. The name of each field as well as their most plausible definitions are shown in Table 3.1.
65 43 Table 3.1: Classification of fields in the sales database Field name Description ID Identity with exclusive number. ClientId ID created when a customer creates an account. This allows customers to get access to the account as a client. OrderId ID created for a confirmed request of a ticket. PassengerId ID created to identify the customer who takes the intercity bus. BoardingPassId ID to identify the ticket that authorizes a passenger to board a bus. Individual movement of one person in one bus from the Trip segment origin stop to the destination stop identified by the boarding pass ticket. The internal operational code that identifies the carrier, Sch road number, and departure time. Even and uneven numbers represent different directions. Date and time when a passenger departs for each trip DepartureDatetime segment. dbo_boardingpasses_originstopname Boarding stop of one trip segment printed on ticket. dbo_boardingpasses_destinationstopname Alighting stop of one trip segment printed on ticket. Trip A complete movement one person makes. dbo_orders_originstopname The origin stop that a passenger orders. dbo_orders_destinationstopname The destination stop that a passenger orders. Other service use pattern Characteristics of trip patterns related to passenger. Create Date The date and time when the order is created. Status The status of the ticket in terms of use. How passengers buy the ticket (by agent, web, or mobile Origin phone). PassengerType The type of passenger by age group. Trip Type The journey type (round-trip or one-way trip). BoardingpassFare The price the passenger payed for each ticket. AgencyName The name of the ticket processing agent. There are 4 types of ID in the database: Client ID, Order ID, Passenger ID and BoardingPass ID. For a complete reservation and travel process, one user first registers as a client (if he does not have an account yet) to create a Client ID. Then, the user can make one or more orders based on his/her needs. Order ID is generated for each request (each ticket order). The order can be taken for one person only, or for several individuals, for the client who has registered, or for other members of his/her family. The Passenger ID is created for each passenger who will take the trip. According to the regulations of Keolis, tickets are not transferable to other individuals (Keolis, 2017). Thus, each passenger has an exclusive Passenger ID. The passenger can complete a direct trip with only one bus, or a non-direct trip with more than one buses. Therefore, each boarding needs an eligible ticket with an exclusive BoardingPass ID.
66 44 Fields grouped into trip contain the order origin and destination planned by one passenger during the booking process. The reservation system always proposes available itineraries and departures based on the order origin and destination. However, the order origin and order destination cannot be directly used to obtain the complete trip. There are two reasons for this. The most important reason is that the origin and destination will appear the same for a round-trip. The other one is that for a passenger who complete the trip with more than one ticket, the order origin and destination will repeat several times in the database. The method of identifying the trip will be introduced later in this chapter. The rest of the fields are classified as Other service use pattern. They contain information on order creation, ticket use status, ticket order method, passenger type by age, journey type, the price of a ticket, and the name of processing agent. There are 10 different types of ticket status, which are classified into three groups based on payment and ticket utilization status. Notwithstanding the origin of the ticket, sold by internet or by agent, the process of reservation is similar. Users start by searching a tentative travel plan. They determine the place they would like to go and the date they would like to travel, compare the price and seat availability, and then confirm the order and pay. They either take, modify, or cancel the trip after the order is approved. During this process, there are three time periods: ticket not yet paid, ticket paid and used, ticket paid but modified or canceled. Annulé, Decliné, En attente, and Incomplet are all statuses that indicate orders are created, but the payment is not yet done. Modifié, Réémis, Remboursé are statuses that indicate the tickets are paid for but are modified or canceled by the users and that these tickets will never be used. Utilisé is a clear status that the tickets have been used. The status Approuvé means that the ticket is paid for and is waiting for further processing, either to be used or canceled or modified. Particularly for tickets of other intercity bus operators but sold by Keolis. Since no further evidence can confirm the status of the approved tickets in the actual database, trip segments marked as Approved are supposed to be realized. Tickets marked as expire are also paid. According to Keolis website, if passengers miss their departures, their tickets expire at the time of departure and no modification is possibly passed this time (Keolis, 2017). The ticket marked as Expire means that it will be out of use as passengers have missed their departure. However, by combining expired tickets with used and approved tickets, we can find the complete trips planned by passengers. This status will be discussed in the transfer part in Chapter 5 as passengers may miss their connections.
67 45 In the database, there are 325,265 records. The dataset is extracted in late May 2016 with complete records from February through April The time period, the percentage of approved or used tickets, and the percentage of tickets used in the service of Keolis are shown in Table 3.2. Table 3.2: The number of records and data completeness in sales database Year Month All No. ticket records No. Used/Approved/Expire tickets by all carriers No. Used/Approved tickets by all carriers No. Used/Approved Tickets by Keolis Completeness % 82% 75% Incomplete % 77% 70% Complete % 78% 71% Complete % 79% 72% Complete % 76% 70% Incomplete % 72% 70% Incomplete % 68% 65% Incomplete % 83% 78% Incomplete % 78% 67% Incomplete % 66% 60% Incomplete % 60% 57% Incomplete % 65% 60% Incomplete Total % 78% 71% By analyzing the dataset and the reference files provided by Keolis, it is observed that there was a service change on February 14 th, Some stops are no longer served and some departure times have changed. For example, Terrebonne is no longer served. Timetable changes happened to nearly all the lines, except for Montreal Airport-Montreal. From February to April 2016, there was a public holiday in March, which is Easter Monday on March 28 th, The week from March 7 th to 13 th 2016 was reported as Winter session break for all students in Quebec. The particularity on these days will be illustrated in Chapter Dataset used All the Used/Approved tickets from February to April 2016 are used for temporal demand fluctuation analysis. Only Used/Approved tickets by Keolis on March 28 th and April 2016 are used for performance measures, and Used/Approved/Expired tickets in April 2016 are used for passenger trip pattern analysis. This is because longer time periods contain timetable change, stop change, and holiday effect; it will affect the accuracy of the results. The data of Easter Monday on March 28 th, 2016 is analyzed separately for performance measures in order to compare the differences between the holidays and typical days.
68 46 Some key facts of this dataset are shown in Table 3.3. The daily revenue hours are the highest on peak days (Fridays and Sundays) because some services are only available on these days (e.g., Montreal - University Laval). The daily revenue hours are a little higher on off-peak days than on holidays because some services are only available Mondays through Fridays, while these services are not available on holidays (e.g., service to Montreal Metro Radisson and the service at 5:30 in the morning from Quebec to Montreal). Table 3.3: Key facts of dataset adopted for performance measures Group Indicator Peak days Off-peak days Holidays Unit All numbers are on a daily basis Days of observation day Node 36 Supply Demand Link 72 Line 7 Daily revenue hours hrs Number of ticket records 3,230 2,071 5,311 ticket Approved or used tickets 2,565 1,622 4,155 ticket Tickets on Keolis network 2,300 1,487 3,687 ticket Ratio of tickets by Keolis 89.67% 91.66% 88.74% % Number of passengers 1,845 1,107 3,338 prs Keolis sells tickets of its own company and eleven other intercity bus companies, which allow transfers within the whole network. More than 8% of the tickets are sold this way. In the given dataset, passengers have taken trips with lines of Keolis, Breton, Galland, Intercar, Maheux, Limocar (Transdev), MartimeBus, Autobus A1, and Autobus La Quebecoise. 3.3 Definition Trip related definitions There are some key terms related to passenger travel by intercity bus for which a clear definition is important. The conceptual map of these definitions is shown in Figure 3.3.

69 47 Figure 3.3: Conceptual map of the definitions related to passenger travel Time phases: There are five different time phases for an intercity travel by bus: access time from the initial origin to the boarding stop, wait time at the boarding stop, in-vehicle time, transfer wait at the transfer station, and egress time from the alighting stop to the destination (see Figure 3.4). Trip segment: In a general context, the number of trip segments is equal to the number of times passengers board public transportation vehicles (American Public Transportation Association, 2016). Trip segments are also called boardings. As explained by the American Public Transportation Association, to calculate the number of trip segments, passengers are counted each time they board vehicles no matter how many vehicles they use to travel from their origin to their destination and regardless of whether they pay a fare, use a pass or transfer, ride for free, or pay in some other way (American Public Transportation Association, 2016). In the context of intercity travel, a trip segment can be defined as an itinerary segment a person travels with one bus from a boarding stop to an alighting stop (as shown in Figure 3.4).


70 48 Figure 3.4: Conceptual map of a trip segment Trip/Passenger trip: A trip is the complete ride from an origin to a destination, no matter how many transfers between buses it takes to complete the trip (Edmonton Transit Service, 2016). Intercity trip relates to the complete ride by a passenger from the origin city to the destination city, no matter how many transfers between intercity buses it takes to complete the trip (Figure 3.5) (National Household Travel Survey, 2006). Trips can be classified as a direct trips or non-direct trips based on the transfers. Trips can also be classified as one-way trips or round-trips based on the types of journey. Figure 3.5: Conceptual map of a trip
. Non-direct trip: A non-direct trip is the opposition of direct trip. It refers to a trip involving an intermediate stop (Figure 3.5). It can be further sub-divided to trip with transfer and two trips with an intermediate destination (Figure 3.")

. Round-trip: In the context of intercity travel, a passenger traveling from an origin city to a destination city and returning to the same origin city with the same line is considered as a")
71 49 Direct trip: In the context of intercity travel, a direct trip refers to a trip that carries a single departure number and that one passenger can use to get to the destination without a change of bus line (Figure 3.5). Non-direct trip: A non-direct trip is the opposition of direct trip. It refers to a trip involving an intermediate stop (Figure 3.5). It can be further sub-divided to trip with transfer and two trips with an intermediate destination (Figure 3.6). If passengers have an activity near the intermediate stop, it is considered as an intermediate destination. If passengers just spend time waiting for the connecting bus at the intermediate stop, it is considered as a transfer. Figure 3.6: Conceptual map of transfer based trip divisions One-way trip: A one-way trip for intercity travel by bus is: a person travels from one origin city to a destination city without returning (Figure 3.7). Round-trip: In the context of intercity travel, a passenger traveling from an origin city to a destination city and returning to the same origin city with the same line is considered as a round-trip. Same-day round-trip: If the departure times of both ways are in the same day without staying overnight for intercity travel, it is considered as a same-day round-trip (Figure 3.7). Thus, the bus departures at night on the following day (until 3:00 a.m. the last bus) will also be considered as the same day. Multi-day round-trip: Opposite to same-day round-trip, a round-trip with night stay at the destination city is considered as a multi-day round-trip (Figure 3.7).


72 50 Figure 3.7: Conceptual map of journey type based trip division All the measures from the operator s perspective are based on trip segments while all the passenger measures are based on trips. Finally, the passenger trip patterns are analyzed for both one-way trips and round-trips Transfer related definitions The actual and scheduled transfer times may be different. There is very little research on intercity buses. The practices and definitions frequently used for railways are introduced here. As shown in Chapter 2, there are four types of passengers who may be influenced by transfers. Departing passengers who start their trips from the transfer station; through passengers who remain in the same vehicle at the transfer station; transferring passengers who transfer from a feeder vehicle to a connecting vehicle; and arriving passengers who end their trip at the transfer station. The duration of scheduled transfer times has a lower effect on departing passengers and arriving passengers than on through passengers and transfer passengers. In most cases, only transfer passengers are considered during a transfer process.
73 51 Definitions related to transfers are illustrated in Figure 3.8, and the descriptions are given below. Both the feeder vehicle and connecting vehicle have a planned arrival and departure times. Ideal running time is the standard time it takes for a specific vehicle to travel from one station to another under ideal circumstances (Vansteenwegen and Oudheusden, 2007). Real running time is the actual time that a vehicle takes to travel from one station to another (Vansteenwegen and Oudheusden, 2007). The bus can be both in advance or delayed compared to ideal running time. Delay is the difference between the real running time and the ideal running time (Vansteenwegen and Oudheusden, 2007). Buffer time (or recovery time) is the extra time for small arrival delays of the feeder vehicle (Vansteenwegen and Oudheusden, 2007). The aim of it is to assure a certain connection considering the small disturbances and non-ideal circumstances (Vansteenwegen and Oudheusden, 2007). It increases the chance that the vehicle arrives on time and is usually inserted into the schedule to lower the chance of missing a connection (Goverde, 1998; Goverde, 1999; Davenport, 2014; Vansteenwegen and Oudheusden, 2007). A trade-off that should be considered is that a large buffer time decreases the possibility of missing the connecting vehicle, while it increases the inconvenient wait for both through passengers and transfer passengers who do not miss their connections (Muller et Furth, 2009). Minimum connection time: In the context of air travel, the minimum connection time refers to for a smooth connection between flights, it's important to give yourself adequate time between the arrival of your first flight and the departure of your next. This time between flights is known as your minimum connection time, and it s needed to allow for security checks and any terminal changes. (Air Canada, 2017). For intercity travel by bus, the minimum connection time is the minimum amount of time needed to assure a smooth connection between the feeder and connecting buses. Exchange time is the time that one transfer passenger spends going from the feeder vehicle alighting stop to the connecting vehicle boarding stop of the (Muller et Furth, 2009). The exchange time depends on the layout of interchange and should account for the time
 is the difference between the timetable connecting vehicle departure time and the timetable feeder vehicle arrival time (T 1 2 = D2 A1, shown in Figure 3.")
.")
74 52 required to collect information about the connecting vehicle location and departure time, check or buy the ticket, and walk to the location (Muller et Furth, 2009). The scheduled transfer time (T 1 2 ) is the difference between the timetable connecting vehicle departure time and the timetable feeder vehicle arrival time (T 1 2 = D2 A1, shown in Figure 3.8) (Muller et Furth, 2009). Transfer wait for transfer passengers is the time that transfer passengers spend waiting from arriving at the connecting vehicle platform to the connecting vehicle departure (Muller et Furth, 2009). Transfer wait for through passengers is the amount of time that through passengers spend waiting from arriving of the feeder vehicle to the departure of the same feeder vehicle (D1- A1) (Muller et Furth, 2009). Figure 3.8: Transfer related concepts (Muller et Furth, 2009; Vansteenwegen and Oudheusden, 2007) A tightly scheduled connection will increase the chance of missing a connection. This causes the largest waiting cost for transfer passengers. Scheduled connections that are too long make transfer
75 53 passengers wait a long time. Thus, each transfer station needs a minimum and a maximum scheduled transfer time to assure the connection and to avoid long waiting. The objective of transfer analysis is not to minimize overall waiting time, but to generate transfers that are as close as possible to an ideal scheduled transfer time (Fleurent et al., 2004). The ideal scheduled transfer time, however, is influenced by many factors, such as the layout of interchange, time of day, and passenger needs. For example, 5-10 minutes may be enough for a transfer between metro and bus, but at least 1-2 hours are recommended for the transfer of a flight. 3.4 Data processing A trip segment can be directly obtained from the sales database. Basic information related to a trip segment include the departure time, origin stop name, and destination stop name. The procedure of processing trip segments is as follows: 1. Origin and destination of trip segments OD matrix table for each line in two directions; 2. OD matrix table by line Number of boardings, Number of alightings, and passenger load for each line. Files are prepared for different levels of analysis: node, link, line, and system. In urban transit area, the ridership is usually reported respectively for weekdays (Mondays to Fridays), Saturdays, and Sundays in a monthly ridership report. Peak hours in the morning and the afternoon are also reported in a daily ridership report (Edmonton Transit Service, 2016; Chicago Transit Authority, 2016; Metro Texas, 2016). However, for intercity travels, the service frequency is far less and hence, the daily peak and off-peak periods are less well acknowledged. For intercity travels, peak days include Fridays and Sundays, and off-peak days include the rest of the week. Thus, in this study, performance measures are reported respectively for peak days, off-peak days, and holidays (Easter Monday). Another step of the data processing is to distinguish the subdivisions of trips. PassengerID allows classifying all the trip segments made by a passenger. However, several trip segments can be combined into a non-direct trip with transfer, two trips with intermediate destination, or a round-
.")
76 54 trip. It is important to define the logic to identify the origin station, destination station, and transfer station. The procedure to convert trip segments to trips is shown in Figure 3.9. Figure 3.9: Data processing procedure to identify a trip and a trip with transfer The first step is to combine the sales database and the complete schedule into one database (see Figure 3.9). The sales database contains information relating to PassengerID, passenger departure date and time, departure station, and arrival station. The corresponding scheduled arrival time can be found in the complete schedule. These trip segments are identified by PassengerID and ordered by the departure date and time. The second step is to verify whether the connecting bus departure station is the same as the feeder bus arrival station. This step aims at excluding the cases that passengers change cities with other modes of transport. The third step is to separate the non-direct trips and the round-trips made by one passenger. In a round-trip, the passenger will go back to the origin station. However, for an intermediate station, the destination of the connecting bus will be different from the origin station of the feeder bus. This
77 55 is due to the fact that the current system only allows two stations to be chosen as the origin and destination of a round-trip. Multi-city reservation is beyond the scope of the present research. The final step is to check whether the connecting station between two lines is a transfer station or an intermediate destination. Two scenarios can be used to identify them. The first scenario is to verify whether passengers have taken the following bus. The method is to compare the itinerary taken by passengers and the itinerary proposed by a route calculator. This scenario is the most accurate one as the ticket reservation system always proposes the best itinerary with the minimum transfer time available. However, the available GTFS only contains schedules of 6 operators, and there are still some inconsistences between the GTFS and sales database, which does not yet allow an itinerary calculation for all the scale of Quebec for now. Another scenario is to choose a default wait time at the connecting station. If passengers wait longer than that time, it will be an intermediate destination. The value of 10 hours is initially arbitrarily chosen as the default time. This default time considers both the case where passengers must wait for one night if there is no night bus to complete their trips, and the case where passengers have planned activities at the city where the connecting station is located. Results show that the maximum transfer time exist is 325 minutes, the origin station and destination station appear the same for longer than 375 minutes transfer time. Thus, the value of 6 hours is finally chosen as default time. The output of this procedure creates two separate files related to all the passenger trips: one file contains the temporal and spatial information of complete trips and the other one contains the name of the transfer station and the corresponding scheduled transfer time (Figure 3.9). These two files are used as follows: 1. The file containing passenger trips origins and destinations of passenger trips OD matrix table of all the passengers on the network of intercity bus in Quebec OD desire lines for all the passengers on the network; 2. The file containing passenger trips the origin stations and total travel times The distribution of travel times at the system level; 3. The file containing the transfer station and scheduled transfer time temporal and spatial distributions of transfer stations and corresponding transfer times. Based on different journey types, trips can initially be divided into one-way trips or round-trips. These types can be directly found in the sales database. Round-trips can be divided into same-day

78 56 round-trips and multiday round-trips. If both trips are taken within the same date, they are sameday round-trips. However, trips whose departures are later than midnight but before the last departure at 3:00 a.m. are checked and considered as same-day round-trips. Otherwise, they are considered as multi-day round-trips. All the passengers doing at least one trip in April are searched in all the databases available to capture the other part of round-trips in March and May (boundaries of April). There are still some trips marked as round-trips but they appeared only once in the database. These trips are considered as part of incomplete round-trips (shown in Figure 3.10). Figure 3.10: Data processing procedure to identify different types of trips 3.5 Performance measure indicators As stated in Chapter 2, choosing a set of performance measure indicators must reflect the goals of the study. The factors considered during the selection process are: relation to demand, operator s and passenger s perspectives, and data availability. The objective of this performance measurement is to know how the service is being used and passenger travel patterns.
79 57 The indicators are described in the context of intercity travel. The formula for computation and the purpose of measure are shown in Table 3.4. Table 3.4: Intercity travel by bus performance measure indicators Group Indicator Description Formula Unit Purpose of measure This indicator measures Ridership tells us how the number of passengers importantly each stop, at a stop, along a link or a link, or line is used, line, or throughout the which reflects how system. Here the ridership much benefit the Ridership measures the trip service provides to the prs segments, where all passengers. However, boardings are counted, this is a direct measure including transfers. The without considering ridership varies at the number of inservice different time (TCRP hours operated Report 88). on each route. Performance measure indicators from operator s perspective Passengerkilometers traveled prskm Peak-tobase ratio Productivity This indicator measures the total distance traveled by passengers, influenced by both the number of passengers and the distance they traveled (TCRP Report 88). This indicator measures the proportion between the number of vehicles in peak service and in offpeak services. Lower ratio indicates a higher ability of operator using vehicles continuously throughout one day. This ratio is always higher than 1 (TCRP Report 88). Productivity is the ratio of total passengers transported divided by total revenue or service hours provided during a given period (TCRP Report 88). Number of trip segments * trip segment network distance Maximum vehicles used in peakperiod / vehicles used on off-peak period Ridership / vehicle revenue hours prs/ vehh This indicator measures the usage of intercity bus system. It allows comparisons between different modes, especially with competitive mode. Comparing the maximum number of buses used on peak days and the minimum number of buses used on off-peak days. This indicator can help operators better plan their continuous vehicle utilization. Productivity impacts the service cost. Here, revenue hours are used since layover times 1 are not available. 1 Layover time is the scheduled time spent at a route s terminal between consecutive trips by a single bus (King County, 2017).
80 58 Table 3.4: Intercity travel by bus performance measure indicators (continued) Group Indicator Description Formula Unit Purpose of measure This indicator is often used to evaluate the This indicator measures crowdedness of a bus the number of passengers in urban context in on board at the passenger's Passenger maximum or average load prs perspective. This load point. Peak period and factor shows how directional effect exist much the vehicle seats (TCRP Report 88). are used in average load or maximum load. Performanc e measure indicators from operator s perspective Performance measure indicators from passenger s perspective Volume to capacity ratio (V/C ratio) Travel time Percent of trips requiring transfers Transfer time This indicator measures the percentage of capacity that is being utilized (TCRP Report 88). This indicator measures the average duration of a passenger trip from origin station to destination station (TCRP Report 88). For route design purpose, transit will be more convenient with less number of transfers between the desired origin and destination since passengers would prefer one-seat ride (TCRP Report 88). An appropriate transfer time allows passengers to take a rest, ensures the transfer between vehicles and avoids missing the connection due to service delays (Fleurent et al., 2004). Passenger kilometer s/seatkilometer s Number of linked trips requiring transfers / total number of linked trips % hrs % min This indicator focuses on the interaction between supply and demand. It reflects the percentage of vehicle capacity being utilized. The travel time of a trip is a key factor that determines the attractiveness of the intercity bus. This measure indicates how well the intercity bus network satisfies the travel demand of passengers. This measure is an important part of evaluating transfer quality.

81 59 The operator measures are developed at different levels as illustrated in Figure Figure 3.11: Procedure of performance measures in operator s perspective All the calculations assume that there is one bus per departure apart from the specific analysis for Express Montreal Quebec corridor. Thus, the results will be higher in some high demand conditions since an additional bus may need to be added to welcome all passengers. All the distances mentioned above are road distances. The results are shown in Chapter 4. Indicators related to passenger measures are all arithmetic averaged by the number of passengers involved within one month (April 2016). The results are shown in Chapter 5.
82 60 The results are presented by recapitulative tables with key statistical data, graphics, and geometric map projections. The box plot, also called box and whisker diagram, can display the distribution of data based on the five-number summary: minimum, first quartile, median, third quartile, and maximum. All the descriptive statistical data are grouped into 6 clusters based on these 5-summary data. The standardized colors used in the legend of each cluster, as well as the meanings of each summary data, are shown in Figure Figure 3.12: Standardized cluster colors used in legend

83 61 CHAPTER 4 PERFORMANCE MEASURES: OPERATOR S PERSPECTIVE In this chapter, indicators presented in Chapter 3 are applied to evaluate the performance measures of intercity travel by bus from the operator s perspective. A spatial-temporal fluctuation of the demand is illustrated, and the demand characteristics of the most important corridor in Quebec, Montreal-Quebec corridor, are presented. 4.1 The intercity bus network of Keolis As stated in Chapter 2, a network is composed of nodes, links, and lines. As of April 2016, the network of Keolis is composed of 36 stops and 72 links when directions are considered. The network analyzed in this study is shown in Figure 4.1. The geometry coordinates of each stop and link are based on the GTFS file developed by Barbier (2016). Figure 4.1: The nodes and links of the network operated by Keolis in April 2016 As of April 2016, the network is composed of 7 lines. These lines and their codes are shown in Figure 4.2. In operational practice, some stops are not always served in each run.


84 62 Figure 4.2: The lines of the network operated by Keolis The services provided have very few fluctuations over one week. The only extra services are two departures per day for both directions of Montreal and University Laval on Fridays and Sundays. The departure at 5:00 from Quebec to Montreal is only available from Mondays to Fridays, and the extra stop of Metro Radisson is only available at 9:05 in the morning from Mondays to Fridays. Therefore, their effects on the total network supply fluctuation over one week are negligible. Generally speaking, most departures need only one bus. Sometimes extra buses are added for certain departures with high demand, particularly for the Montreal -Quebec corridor. This will be explained later in section Spatial-temporal fluctuations of the service use Temporal fluctuations As stated in Chapter 3, all the Used/Approved tickets from February to April 2016 are used for temporal demand fluctuation analysis and data in April 2016 are used for performance measures. Figure 4.3 shows the box plot of the daily number of boardings over a week from February to April The points in the figure indicate the distribution of the data. Associate key statistics include

85 63 the maximum, minimum, average, and proportion of daily boardings throughout the week. Color scales from red to green are applied to highlight numbers from high to low in the table. Mon. Tues. Wed. Thurs. Fri. Sat. Sun. Maximum Mean Minimum Proportion over week 14% 11% 11% 14% 19% 12% 18% Figure 4.3: Box plot and statistics of daily number of passengers over a week It is shown that the highest average daily number of boardings is on Fridays and Sundays (19% and 18% of total number of weekly boardings respectively), followed by Thursdays, Mondays, and Saturdays. The days with the least daily average number of boardings are on Tuesdays and Wednesdays. However, the maximum number of boardings in the dataset (outlier) is found on Monday, more specifically on Easter Monday (March 28 th, 2016) with 3687 passengers per day. Fridays and Sundays have the highest number of boardings compared to the rest of days. This is probably because passengers who travel to spend their weekends somewhere else depart on Fridays and return on Sundays. Mondays and Thursdays also have a higher number of passengers compared to Tuesdays, Wednesdays, and Saturdays. This is reasonable because some passengers may take the intercity buses to work on Mondays, and some passengers may start their weekends earlier on
86 Daily number of boardings 64 Thursdays. Tuesdays and Wednesdays have the least number of boardings because these days are in the middle of the week and fewer leisure activities are taken on these days. The outliers with the highest number of boardings are found on holidays, such as the Good Friday (March 25 th, 2016) and Easter Monday (March 28 th, 2016). Passengers have a longer weekend during the holidays, and they leave on Friday and go back on Monday. The weekly trend of the number of boardings and the holidays or event effects are shown in Figure Daily number of boardings over time Feb 8-Feb 15-Feb 22-Feb 29-Feb 7-Mar 14-Mar 21-Mar 28-Mar 4-Apr 11-Apr 18-Apr 25-Apr Date Off-peak days Peak days Holidays or event days Weekly Trend Trend-holidays or event days Linear (Off-peak days) Linear (Peak days) Figure 4.4: Weekly trend of average daily number of boardings From February 1 st to April 30 th, 2016, there was only one holiday in Quebec, which is Easter Monday on March 28 th. As shown in Figure 4.4, the highest number of boardings is observed on this day. The Thursday and Friday of this week (March 24 th and 25 th ) also have a higher number of boardings compared to the other Thursdays and Fridays. Passengers seem to leave for their holidays on Thursdays and Fridays, but they all come back on Easter Monday. This explains why an extremely high number of passengers is observed on Easter Monday. Another period with a high number of boardings is during the week from February 26 th to March 6 th, The number of boardings throughout this week is higher than on typical days. This may be due to the school break in Quebec Spatial fluctuations Intercity travel also exhibits spatial fluctuations. The 7 lines operated by Keolis can be grouped into 3 categories: lines between larger cities and smaller cities, lines between cities with similar sizes, and the other lines (e.g., between Montreal Trudeau airport and Montreal).
87 DAILY NUMBER OF PASSENGERS IN BOTH DIRECTIONS 65 Line 10 (Montreal - Victoriaville), Line 60 (Rimouski Grande-Rivière), and Line 68 (Rimouski - Gaspé) are the lines between larger cities and smaller cities (Figure 4.5 as an example). These lines are generally considered as part of the regional network (Blais, 1996). Figure 4.5 (a) shows the average daily number of passengers on each stop over time of the week in two directions. Figure 4.5 (b) is the average daily number of boardings and the load profile over each station along the line. 30 Average daily number of passengers over time Monday Tuesday Wednesday Thursday Friday Saturday Sunday Line 60 Rimouski - Grande-Rivière Line 60 Grande-Rivière - Rimouski (a) Figure 4.5: Average daily number of passengers over time and stations for Line 60
 For these lines, the highest number of boardings is observed from the terminal stations of large")
88 66 (b) Figure 4.5: Average daily number of passengers over time and stations for Line 60 (one departure per day) For these lines, the highest number of boardings is observed from the terminal stations of large cities while few boardings are observed on intermediate stations. For the direction to large cities, the number of boardings is relatively more dispersive at every intermediate station. The highest load point is always near the terminal station of large cities. This phenomenon displays that there is very few personal exchanges between small cities. The number of boardings is relatively high for both directions on Fridays, Saturdays, Sundays, and Mondays than the rest of the week. Two kinds of travel may explain this phenomenon: people living in small cities go back home on Fridays and leave for work or study on Sundays or Mondays; people may also go to large cities for entertainment or for shopping during the weekend on Saturdays or Sundays. Line 64 (Rimouski-Quebec/Montreal), Line 41 (Montreal - Trois-Rivières - Quebec), and Line 48 (Montreal-Quebec) are examples of traveling between cities of similar sizes (Figure 4.6 as an example).
89 Daily number of boardings in both directions Average daily number of boardings over time Monday Tuesday Wednesday Thursday Friday Saturday Sunday Line 41 Montreal - Trois-Rivères - Quebec Line 41 Quebec - Trois-Rivières - Montreal (a) (b) Figure 4.6: Average daily number of passengers over time and stations for Line 41
90 Daily number of boardings in both directions 68 These lines are part of the basic network (Blais, 1996). For these lines, apart from the high number of boardings from the terminal stations, the number of boardings from the intermediate stations are also considerable (Figure 4.6 (b)). The load profile is similar for both directions. People living in cities along these lines go to either one of the large cities. The number of boardings is high on both directions on Fridays and Sundays, and there is a very similar travel pattern on Friday afternoons and Sunday afternoons in the opposite directions (Figure 4.6 (a)). This is probably because people who go to large cities during the weekend leave on Friday afternoons after work and then go back home on Sunday afternoons. Line 49 is categorized as an other line and its distribution over time is presented in Figure Daily number of boardings over time Monday Tuesday Wednesday Thursday Friday Saturday Sunday Line 49 Montreal - Montreal Trudeau Airport Line 49 Montreal Trudeau Airport - Montreal Figure 4.7: Average daily number of passengers over time for Line 49 This line is only available for passengers who come to Montreal by intercity bus and then transfer to the airport. The travel demand relies heavily on the flight schedules. There is relatively stable demand throughout the week. It is observed that the average number of boardings in the afternoon is higher than in the morning for the direction Montreal to Montreal Trudeau Airport throughout one week. This is because most passengers taking intercity buses arrive at Montreal in the early afternoon. The number of passengers leaving Montreal on Mondays is slightly higher than the rest
91 69 of the days. This may be because passengers for business mostly leave at the beginning of the week. The number of passengers arriving in Montreal is relatively dispersed throughout the daytime, and a higher number of boardings is observed in the morning around 11:00 and in the evening around 20: Remarks Unlike the supply, which is a relatively constant service for all types of days apart from extra buses used in certain runs, the results of this section show that the demand is highly variable. Regarding intercity travel, days can be divided into three types: holidays, peak days, and off-peak days. During holidays or event days, there is an extremely high number of passengers. Fridays and Sundays can be classified as peak days, and off-peak days include the rest of the week. Among these off-peak days, Mondays and Thursdays have a slightly higher number of boardings. The only line that connects Montreal Trudeau Airport and Montreal city center does not have significant trends over time as this service is only a trip segment of passengers who take intercity travels, and their demand depends largely on flight schedules. Lines that belong to regional networks and basic networks have different patterns of boardings. For regional networks, a significant difference of boardings is found between the terminal stations and intermediate stations. Most passengers travel to large cities, while there are much less travels between the small cities. For basic networks, passengers travel more during the weekends, and the boardings are more dispersed among every intermediate station. 4.3 Intercity bus system performance measure System performance measure report Results of performance measure indicators estimated at the system level in April 2016 and on Easter Monday are shown in Table 4.1.
92 70 Table 4.1: Trip segment-based performance measure report for April 2016 and Easter Monday Indicator Peak days Off-peak days Easter Monday Unit Note: All the number is on daily basis Ridership Prs Passenger-kilometers traveled 529, , ,243 prs-km Peak to base ratio 1.41 Productivity prs/veh-h Passenger load prs/veh Volume to capacity ratio (V/C ratio) Compared to off-peak days, the ridership on peak days is about 50% higher, and on Easter Monday it is more than doubled. There is not too much difference for the average distances that passengers traveled on the three types of days (230 km on peak days, 233 km on off-peak days, and 240 km on Easter Monday). The peak to base ratio compares the number of buses used on Easter Monday and the minimum number of buses used on the off-peak days in April (April 6 th, 2016). The calculation assumes 56 seats per bus and does not consider the circular use of vehicles between different departures or routes. The result shows that the number of buses used on the day with the highest demand is 40% higher than the day with lowest demand. As defined in Chapter 3, productivity is the number of passengers transported per revenue hour. Here the revenue hours consider the total amount of time when vehicles are in service. This indicator is a measurement that impacts the service cost. Both passenger load and volume to capacity ratio at the system, link, and line levels assume one bus per departure. The results may be a little higher than the realities since sometimes extra buses are necessary for certain departures with high demand. The additional buses used are specifically detected for Montreal-Quebec corridor in section 4.4. As there is very little research on intercity travels, no immediate target values are available for comparison. TCRP Report 88 suggests some example target values, but these values are obtained from urban travels. A productivity standard obtained by TCRP Report 88 for a fixed-route bus service is 13.0 passengers per hour (TCRP Report 88, 2003). TCRP Report 88 pointed out that 11 to 20 passengers per hour is the minimum acceptable standard for a mixed demand responsive and fixed-route system according to 37 of the 86 surveyed agencies. Nevertheless, the values vary


. The number of boardings/alightings is presented respectively for these two groups (Figure 4.9 to Figure 4.14).")
93 71 substantially by transit system and mode considered: 54.9 (Chicago Transit Authority bus), 27.8 (New Jersey Transit bus), (Boston MBTA rail) (TCRP Report 88, 2003) Stop level performance measures There are mainly three indicators at the stop level: the number of boardings, the number of alightings, and the number of boardings and alightings per departure. All these indicators are calculated for peak days, off-peak days, and Easter Monday respectively. First, the number of departures at each station is shown in Figure 4.8. The cities included in this investigation are classified into two groups: frequently served areas with more than 10 departures per stop, and less frequently served areas with less than 10 departures per stop (including 10). The number of boardings/alightings is presented respectively for these two groups (Figure 4.9 to Figure 4.14). The number of boardings and alightings per departure is illustrated in Figures 4.15 to Figure Finally, the stop volumes are compared with city population sizes to measure the intercity bus service attractivity (Figure 4.18). Figure 4.8: Daily number of departures provided by Keolis in April 2016 As shown in Figure 4.8, there are four stops with the highest number of departures per day: Montreal, Longueuil, Quebec (Sainte-Foy), and Quebec (Center-ville). There are also six stations with a relatively high number of departures: Montreal Trudeau Airport, Drummondville, Trois-


94 72 Rivières, Lévis, Rivière-du-Loup, and Rimouski. These ten cities account for 78.5% of all the departures on peak days, and 79.9% on off-peak days. There are some stops served less than 2 departures per day. Berthierville is only served in the morning and the evening, and Metro Radisson is only served in the morning in the direction to Montreal arriving from Quebec. Figure 4.9 to Figure 4.14 show the number of boardings and alightings on peak days, off-peak days, and on Easter Monday respectively. Cities with more than 10 departures per day are underlined. Figure 4.9: Daily number of boardings - peak days (Station Name (Number of boardings)) Figure 4.10: Daily number of alightings - peak days (Station Name (Number of alightings))


95 73 Figure 4.11: Daily number of boardings - off-peak days (Station Name (Number of boardings)) Figure 4.12: Daily number of alightings - off-peak days (Station Name (Number of alightings))


 have the highest number of boardings and alightings.")


96 74 Figure 4.13: Daily number of boardings Easter Monday (Station Name (Number of boardings)) Figure 4.14: Daily number of alightings Easter Monday (Station Name (Number of alightings)) On peak days, Montreal, Quebec (Sainte-Foy), and Quebec (Center-Ville) have the highest number of boardings and alightings. These three stations account for about 71% of the total number of boardings and alightings throughout all the network of Keolis. The number of boardings on Easter Monday in all frequently served cities is much higher than typical days. For example, the number of boardings is almost doubled in most cities (nearly all frequently served cities except for Montreal and Montreal Trudeau Airport). The number of alightings in Montreal is two times higher than
97 75 during peak days. This indicates that a lot of passengers in other cities return to Montreal on Easter Monday after their holidays. On off-peak days, the four stations in the two largest cities in Quebec account for about 76% of the total number of boardings and alightings. The proportion of boardings and alightings becomes less important in Montreal (from 37% to 25%) and higher in Longueuil on off-peak days (from 3.5% to 15%). The number of alightings at Longueuil on off-peak days is 5.3 times higher than peak days. A possible explanation for this phenomenon is that on peak days, people may travel for leisure purposes and hence, the city center is most likely their destination. On off-peak days, people may travel more for business/work purposes, and they can transfer to other modes (metro for example) more easily to arrive at their final destinations. Unlike Montreal and Longueuil, the number of boardings/alightings at both stations of Quebec (Sainte-Foy, Center-Ville) are similar. The less served areas also have a lower number of boardings or alightings (maximum 38 per day) except for the University Laval station. For all the stops, there is a higher number of boardings on Easter Monday. Significantly higher numbers of boardings on peak days than off-peak days are observed in cities along the Montreal-Quebec-Rimouski corridor. In the north of Quebec however, only a slightly higher number of boardings on peak days is observed. The number of boardings at University Laval is the highest compared to the rest of cities, even though the service is only available on Fridays and Sundays. There are no significant differences between boardings and alightings. However, there are some exceptions: on off-peak days, there is a higher number of alightings than boardings at the stop Saint-Hyacinthe, and there is a much higher number of boardings than alightings in Victoriaville on Easter Monday. The exception of Saint-Hyacinthe is due to the schedule, as there is only one departure to Montreal in the morning, while 5 departures are scheduled in the afternoon and the evening. However, fewer passengers go to other places in the afternoon on off-peak days. The case for Victoria is probably due to a lot of people going back to Montreal after their holidays to prepare the work on the next day. Figures 4.15 to Figure 4.17 show the stop boardings and alightings per departure. The number of boardings and alightings are counted together. The highest number of stop boardings and alightings per departure is listed in Table 4.2.


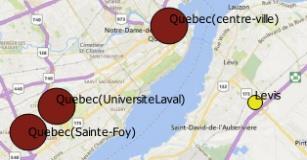
98 76 Figure 4.15: Daily number of stop boardings and alightings per departure peak days Figure 4.16: Daily number of stop boardings and alightings per departure off-peak days

, Quebec (Sainte-Foy), Quebec (Sainte-Foy), Quebec (Center-Ville), Quebec (University Laval), Quebec")
 Grande-Vallée, Montreal Radisson), Matapédia, (Metro Montreal Radisson), Grande-Vallée, Matapédia, (Metro Grande-Vallée")
99 77 Figure 4.17: Daily number of stop boardings and alightings per departure Easter Monday Table 4.2: Cities with the highest and the least number of boardings and alightings per departure in descending/ascending order Peak days Off-peak days Easter Monday The highest (14+ boardings and alightings per departure) Trois-Rivières, Montreal, Rimouski, Longueuil, Trois-Rivières, Rimouski, Rimouski, Trois-Rivières, Montreal, Quebec (Sainte-Foy), Quebec (Sainte-Foy), Quebec (Sainte-Foy), Quebec (Center-Ville), Quebec (University Laval), Quebec (Center-Ville) Montreal, Quebec (Center-Ville) Victoriaville, Rivière-du-Loup, Gaspé, Laval The least (less than 1 on peak and off-peak days and less than 2 on Easter Monday) Grande-Vallée, Montreal Radisson), Matapédia, (Metro Montreal Radisson), Grande-Vallée, Matapédia, (Metro Grande-Vallée Mont-Louis Saint-Jean-Port-Joli, Mont-Joli, Mont-Louis, Trois-Pistoles


100 78 The results indicate that intercity travels are mainly between the cities of large and medium population sizes. Overall, the stations with the highest number of boardings and alightings also have a higher level of efficiency regarding the number of boardings and alightings per departure. Trois-Rivières and Rimouski, along with the main stations in Montreal and Quebec, are the most efficient stations. Longueuil is more efficient than Montreal on off-peak days because its number of alightings is higher on off-peak days, as shown before. Grande-Vallée is the least efficient stop even on Easter Monday. The least efficient stops are generally located in the north of Quebec with 1 departure per day per direction. Some exceptions include Montreal (Metro Radisson), Trois-Pistoles, and Saint-Jean-Port-Joli. Montreal (Metro Radisson) is only served once in the direction of Montreal. Trois-Pistoles and Saint-Jean-Port-Joli are less efficient because compared to their supply (more than 2 departures per day per direction), their demand is low. Figure 4.18 shows the stop number of boardings and alightings compared to the city population on peak days. The cities with the highest and least number of boardings and alightings compared to the city population are listed in Table 4.3. Figure 4.18: Number of boardings and alightings/city population peak days
101 79 Table 4.3: Cities with the highest and the least number of boardings and alightings/city population Peak days Off-peak days Easter Monday The 5 highest number of Carleton, Carleton, Carleton, boardings and Rivière-du-Loup, Rimouski, Rimouski, alightings/city Rimouski, Pointe-à-la-Croix, Rivière-au-Renard, population La Pocatière, Rivière-du-Loup, Rivière-du-Loup, Quebec City Rivière-au-Renard La Pocatière The 5 least number of Laval, Laval, Matapédia, boardings and Lévis, Repentigny, Laval, alightings/city Repentigny, Lévis, Lévis, population Saint-Hyacinthe, Victoriaville, Repentigny, Gaspé Mont-Joli Saint-Hyacinthe When considering the population size of each city, results show that intercity bus services are more attractive for cities located in the north of Quebec. For these cities, their population sizes are relatively low, and intercity buses are the only public mode to go to larger cities. Intercity bus services are less attractive for cities that locate near Montreal and Quebec City, such as Laval, Repentigny, and Lévis. This is because traveling between these cities belong to suburban travels with the express suburban services available while long-distance travel demand in these cities is relatively low Link level performance measures Two indicators are discussed at the link level: the ridership and volume to capacity ratio. These two indicators are calculated for peak days, off-peak days and Easter Monday respectively. Figure 4.19 shows the daily number of vehicles that passes through different links.
 corridor.")

102 80 Figure 4.19: Daily link departures There are 10 links frequently served, with more than 18 departures per day. All these links are along the Montreal - Quebec (Center-Ville) corridor. The next highly served corridor is Montreal - Montreal Trudeau Airport line with 8 departures per day. The rest of the links generally have 6 departures per day. Figure 4.20 to Figure 4.22 show the daily link ridership on peak days, off-peak days and Easter Monday.


103 81 Figure 4.20: Daily link ridership peak days Figure 4.21: Daily link ridership off-peak days
 - Quebec (Center-Ville)) corridor")
, because a significantly higher ridership is witnessed for the less frequently served links on Easter Monday.")
104 82 Figure 4.22: Daily link ridership Easter Monday These results show that the Montreal - Quebec (Montreal - Longueuil - Saint-Hyacinthe - Drummondville - Quebec (Sainte-Foy) - Quebec (Center-Ville)) corridor has the highest ridership in two directions. These links account for about 66% of the total link ridership throughout the whole network on both peak days and off-peak days. This proportion is slightly lower on Easter Monday (64%), because a significantly higher ridership is witnessed for the less frequently served links on Easter Monday. The Quebec - Rivière-du-Loup - Rimouski and Montreal - Trois-Rivières - Quebec corridors have the highest demand after the Montreal - Quebec corridor. Actually, they belong to the basic network of Quebec. There is a significant difference of link ridership between the two sections of Line 41 Montreal - Trois-Rivières - Quebec and Line 64 Montreal - Rivièredu-Loup - Rimouski. The sections of Montreal - Trois-Rivières and Quebec - Rivière-du-Loup have higher ridership than the other portions of these two lines on both peak days and off-peak days. This will be discussed along with the analysis of volume to capacity ratio. The volume to capacity ratios of all the links are presented from Figure 4.23 to Figure 4.25.


105 83 Figure 4.23: Volume to capacity ratio by link peak days Figure 4.24: Volume to capacity ratio by link off-peak days

 and Quebec (Center-Ville) is much lower, with about 0.25 on peak days and less than 0.")
106 84 Figure 4.25: Volume to capacity ratio by link Easter Monday The link with the highest V/C ratio is from University Laval to Quebec (Sainte-Foy) on peak days, with a proportion of There are only two departures per day on Fridays and Sundays, but the students traveling to Montreal are numerous. The Montreal - Quebec corridor has a higher V/C ratio on peak days than off-peak days. This is reasonable as their supply is almost the same, but the ridership is much less on off-peak days. Compared to the other links along the Montreal Quebec corridor, the V/C ratio between Quebec (Sainte-Foy) and Quebec (Center-Ville) is much lower, with about 0.25 on peak days and less than 0.20 on off-peak days. Even on Easter Monday, it is less than This may be due to an important number of boardings and alightings at Quebec (Sainte-Foy) station. The links with the lowest V/C ratio are located in the north of Quebec (all the links between Paspebiac and Grande-Rivière, and Sainte-Anne-des-Monts and Gaspé). This is not surprising as the ridership in these cities is also the lowest. Links Montreal Trudeau Airport Montreal, Trois-Rivières Quebec (Sainte-Foy), and Victoriaville Drummondville also have lower V/C ratios. This is due to the high frequency of buses along these links. On Easter Monday, all the links have a V/C ratio higher than Exceptions include links Grande-Rivière Paspebiac, Drummondville Victoriaville, and Montreal Montreal Trudeau Airport.

107 85 As mentioned before, there are obvious link ridership differences between the two sections along Line 41 Montreal - Trois-Rivières - Quebec and Line 64 Montreal - Rivière-du-Loup - Rimouski. As for the supply, there is no difference between the two sections for Line 41, and 1 in 4 departures only serve section Quebec - Rivière-du-Loup for Line 64. Comparing the link V/C ratios, it is noticed that both ridership and V/C ratio are lower for the Trois-Rivières - Quebec section. Thanks to the differentiated services of Line 64, there is no significant difference on link V/C ratios between these two sections. This implies that providing a differentiated service for these two lines may improve the overall V/C ratios. However, a differentiated service may force some users to do a transfer, which may affect the overall ridership Line level performance measures Figure 4.26 shows the proportion of passenger boardings for 7 lines operated by Keolis on different types of days. Proportion of ridership - Peak days Line 64 MTL/QUE-RMK 12% Line 41 MTL-TRI-QUE 14% Line 49 MTL-MTR 4% Line 48 MTL-QUE 61% Other 13% Line 60 RMK-GRI 2% Line 68 GAS-RMK 1% Line 10 MTL-VIC 6% Line 48 MTL-QUE Line 64 MTL/QUE-RMK Line 41 MTL-TRI-QUE Line 10 MTL-VIC Line 60 RMK-GRI Line 49 MTL-MTR Line 68 GAS-RMK (a) Figure 4.26: Proportion of passenger boardings on peak days, off-peak days, and Easter Monday
 Proportion of ridership - Easter Monday Line 64 MTL/QUE-RMK 15% Line 41")
 Figure 4.")

108 86 Proportion of ridership - Off-peak days Line 64 MTL/QUE-RMK 13% Line 41 MTL-TRI-QUE 12% Line 49 MTL-MTR 7% Line 48 MTL-QUE 60% Other 15% Line 60 RMK-GRI 2% Line 68 GAS-RMK 2% Line 10 MTL-VIC 4% Line 48 MTL-QUE Line 64 MTL/QUE-RMK Line 41 MTL-TRI-QUE Line 10 MTL-VIC Line 60 RMK-GRI Line 49 MTL-MTR Line 68 GAS-RMK (b) Proportion of ridership - Easter Monday Line 64 MTL/QUE-RMK 15% Line 41 MTL-TRI-QUE 13% Other 13% Line 60 RMK-GRI 2% Line 49 MTL-MTR 3% Line 68 GAS-RMK 2% Line 48 MTL-QUE 59% Line 10 MTL-VIC 6% Line 48 MTL-QUE Line 64 MTL/QUE-RMK Line 41 MTL-TRI-QUE Line 10 MTL-VIC Line 60 RMK-GRI Line 49 MTL-MTR Line 68 GAS-RMK (c) Figure 4.26: Proportion of passenger boardings on peak days, off-peak days, and Easter Monday The Line 48 Express Montreal - Quebec accounts for about 60% of the total ridership of Keolis intercity bus network. Other lines with high ridership include Line 41 Montreal - Trois-Rivières - Quebec and Line 64 Montreal - Quebec - Rimouski. The lines that serve the north of Quebec, Line 60 and Line 68, have the least ridership. These two lines benefit from cross-subsidies, they are unprofitable and are financed by the most profitable Line 48. All the seven lines can be grouped into 4 categories based on their ridership proportion similarities: Line 48 (the only express line with the highest ridership), Line 64 and Line 41, Line 60 and Line 68, and Line 10 and Line 49. Figure 4.27 shows the overall comparison of demand (ridership), supply (seats available), and the V/C ratio by line. The supply is calculated by multiplying the number of seats per vehicle and the
109 87 total number of departures per line. All the departures are assumed to have only one bus in service. For certain departures on Easter Monday or peak days, however, the capacity of one bus can not satisfy the demand. However, the departures that need extra buses are not always the same. The demand is calculated by accumulating all the number of boardings along one line. The line V/C ratio is weighted by the distance of each route. It is calculated by dividing the total passengerkilometers traveled and the total seats-kilometers operated. Overall comparison of demand and supply by line Volume to capacity ratio by line OEXP48 Express MTL-QUE OEXP48 Express QUE-MTL OEXP41 MTL-TRI-QUE OEXP41 QUE-TRI-MTL OEXP64 MTL/QUE-RMK OEXP64 RMK-MTL/QUE OEXP10 MTL-DRU-VIC OEXP10 VIC-DRU-MTL OEXP49 MTL-MTR OEXP49 MTR-MTL OEXP60 RMK-GRI OEXP60 GRI-RMK OEXP68 RMK-GAS OEXP68 GAS-RMK OEXP48 Express MTL-QUE OEXP48 Express QUE-MTL OEXP41 MTL-TRI-QUE OEXP41 QUE-TRI-MTL OEXP64 MTL/QUE-RMK OEXP64 RMK-MTL/QUE OEXP10 MTL-DRU-VIC OEXP10 VIC-DRU-MTL OEXP49 MTL-MTR OEXP49 MTR-MTL OEXP60 RMK-GRI OEXP60 GRI-RMK OEXP68 RMK-GAS OEXP68 GAS-RMK Daily number of boardings - peak days Daily number of boardings - Easter Monday Seats available- off peak days Daily number of boardings - off peak days Seats available - peak days Seats available- Easter Monday V/C ratio by line - peak days V/C ratio by line - Easter Monday Linear (Average V/C ratio-off peak day) V/C ratio by line - off peak days Linear (Average V/C ratio - Easter Monday) Linear (Average V/C ratio-peak days) Figure 4.27: Overall comparison of demand and supply and volume to capacity ratio by line The supply is almost the same for all types of days and in both directions. Some exceptions exist. The supply of Line 10 Victoriaville Montreal on Easter Monday is slightly lower than on ordinary days. This is because of the non-availability of the last departure at 21:50 on Easter Monday. Line 48 has a higher level of service on peak days because two extra departures between University Laval and Montreal are only available on Friday afternoons and Sunday afternoons. Lines with different supply on two directions include Line 41, Line 48, and Line 49. Line 41 and Line 49 have both one departure less per day for the direction to Montreal. Line 48 has one departure less on Saturdays and Sundays for direction Quebec Montreal. Unlike services in urban areas, some differentiated services exist for Line 10, Line 48, Line 41, and Line 64. These differentiated services include intermediate stop change and terminal station change. All these four lines have intermediate stop change, which means that the cities served for each departure changes within one day. For example, there are 17 departures per day for Line 48 from Montreal to Quebec,
110 88 Longueuil is served 11 times, and Drummondville is only served 2 times; 4 departures are taken without intermediate stop between Montreal and Quebec (Sainte-Foy). Line 10 and Line 64 have terminal station change. For example, 4 out of 6 departures terminate at Drummondville for Line 10 from Montreal to Victoriaville. The advantage of these differentiated services is that more cities can be served, and passengers would not have extreme long travel time due to the stop at each station. For all lines except for Line 49, the number of boardings and the V/C ratio are always higher on peak days than on off-peak days and are the highest on Easter Monday. As stated before, Line 49 is only accessible for passengers who come to Montreal and then transfer to Montreal Trudeau Airport, their demand has no obvious temporal pattern. On Easter Monday, the total demand of Line 48 Quebec Montreal and Line 64 Rimouski Quebec Montreal is higher than the supply supposing only one bus per departure. As seen for stop level and link level analysis, an extremely high number of alightings is found at the Montreal station because passengers come back to Montreal after their holidays, thus nearly all the lines heading to Montreal have higher V/C ratios. Line 48 has the highest ridership and V/C ratio, with more than 0.74 on peak days and more than 0.45 on off-peak days. On Easter Monday, the V/C ratio is more than 0.90 and exceeded 1.00 for the direction Quebec Montreal. This is because additional vehicles are necessary to satisfy the extremely high demand on this line, but 1 bus per departure is assumed for calculation. The additional buses are detected later in section 4.4. Line 64 and Line 41 have similar levels of ridership. In the direction of Montreal, Line 41 has a slightly higher number of boardings (162 to 123) but the same number of departures and V/C ratio (33%) than on peak days. On off-peak days, these two lines have the same ridership (88) but the V/C ratio is lower for Line 41. Two reasons may explain these differences. One is that the passengers travel a proportionally longer distance on Line 64 in the direction of Montreal. Indeed, for Line 64 in the direction of Quebec or Montreal, most passengers board at the terminal station Rimouski and then get off the bus at either Quebec or Montreal station. However, for Line 41, it is less possible that passengers travel the whole journey from Quebec to Montreal since the express Line 48 between these two cities is faster. As seen before, the number of passengers who travel between Quebec and Trois-Rivières is significantly less than those who travel between Trois-
111 89 Rivières and Montreal. Besides, the supply also contributes to their differences since there is differentiated services for two sections of Line 64, whilst services of Line 41 are always the same. Line 49 Airport-Montreal has the lowest V/C ratio on peak days and an equivalent V/C ratio on off-peak days (around 0.12). This is because compared to its frequent supply, the ridership is quite low. Line 10 is similar to Line 49. Even though the supply is slightly lower than Line 49, the difference between the demand and the supply is significant on both peak days and off-peak days. Its V/C ratio is the lowest compared to all the other lines on off-peak days, with only about 9%. Line 60 (Grande-Rivière -Rimouski) and Line 68 (Rimouski-Gaspé) have the lowest supply and demand. They both provide services in the north of Quebec with only one departure per day. Their differences on two directions and different types of days are less significant than the other lines. Line 68 is slightly less used compared to Line 60 in two directions on both peak and off-peak days. Figure 4.28 shows the daily productivity of each line. This is calculated by dividing the daily ridership and the total revenue hours of each line. OEXP48 Express MTL-QUE OEXP48 Express QUE-MTL OEXP41 MTL-TRI-QUE OEXP41 QUE-TRI-MTL OEXP64 MTL/QUE-RMK OEXP64 RMK-MTL/QUE OEXP10 MTL-DRU-VIC OEXP10 VIC-DRU-MTL OEXP49 MTL-MTR OEXP49 MTR-MTL OEXP60 RMK-GRI OEXP60 GRI-RMK OEXP68 RMK-GAS OEXP68 GAS-RMK Daily productivity by line Passengers per revenue hour (prs/veh-h) - peak days Passengers per revenue hour (prs/veh-h) - off peak days Passengers per revenue hour (prs/veh-h) - Easter Monday Linear (Average passengers per revenue hour (prs/veh-h) - Easter Monday) Linear (Average passengers per revenue hour (prs/veh-h) - off peak days) Linear (Average passengers per revenue hour (prs/veh-h) - peak days) Figure 4.28: Daily productivity by line
112 90 The average productivity on Easter Monday, peak days and off-peak days are respectively 10, 6, and 5 passengers/hour. The standard deviation on these three types of days is respectively 6, 3 and 4. The standard deviation is the highest on Easter Monday, this is because for some lines the ridership is extremely high compared to peak days (e.g. Line 48, Line 10, Line 64 and Line 41 in the direction of Montreal), but for some lines, it does not change much (e.g. Line 10 in the direction of Victoriaville and Line 49). The lines with high productivity regardless of the time period are Line 49 from Montreal to Montreal Trudeau Airport and Express Line 48 Montreal - Quebec. The Line 49 on off-peak days has exceeded the average level of 188%. The high productivity of this line is because of its short travel time compared to other intercity travel lines. For Line 48 Montreal - Quebec, due to the high ridership, productivity is also high. The least productive lines include Line 64 and Line 68. This is because Line 64 has a rather long distance and thus a quite long travel time, while Line 68 has very low ridership. The weighted average passenger load is equivalent to the V/C ratio multiplied by the number of seats per bus, which is not presented here since its form will be like the one of V/C ratio. Figure 4.29 shows the daily maximum passenger load per departure and the corresponding departure time on peak days, off-peak days, and Easter Monday. The number of vehicles is highlighted by the dark line, which assumes that the number of seats per bus is 56. OEXP48 Express MTL-QUE OEXP48 Express QUE-MTL OEXP41 MTL-TRI-QUE OEXP41 QUE-TRI-MTL OEXP64 MTL/QUE-RMK OEXP64 RMK-MTL/QUE OEXP10 MTL-DRU-VIC OEXP10 VIC-DRU-MTL OEXP49 MTL-MTR OEXP49 MTR-MTL OEXP60 RMK-GRI OEXP60 GRI-RMK OEXP68 RMK-GAS OEXP68 GAS-RMK Daily maximum passenger load per departure Daily max. passenger boarding per departure by line - peak days Daily max. passenger boarding per departure by line- off peak days Daily max. passenger boarding per departure by line - Easter Monday Linear (Daily avg. max. passenger boarding per departure - Easter Monday) Linear (Daily avg. max. passenger boarding per departure - off peak days) Linear (Daily avg. max. passenger boarding per departure - peak days) Departure time of maximum load Line Peak Off peak Holiday OEXP48 Express MTL-QUE 15:00 15:00 15:00 OEXP48 Express QUE-MTL 15:30 12:30 12:30 OEXP41 MTL-TRI-QUE 16:00 13:00 16:00 OEXP41 QUE-TRI-MTL 16:30 16:30 12:30 OEXP64 MTL/QUE-RMK 17:30 12:45 12:45 OEXP64 RMK-MTL/QUE 8:00 8:00 8:00 OEXP10 MTL-DRU-VIC 17:30 17:30 17:30 OEXP10 VIC-DRU-MTL 8:20 8:20 8:20 OEXP49 MTL-MTR 13:30 15:45 15:45 OEXP49 MTR-MTL 11:00 15:00 20:30 OEXP60 RMK-GRI 6:15 6:15 6:15 OEXP60 GRI-RMK 6:15 6:15 6:15 OEXP68 RMK-GAS 6:15 6:15 6:15 OEXP68 GAS-RMK 7:00 7:00 7:00 Note: Green-morning; Blue-afternoon; Gray: evening Figure 4.29: Daily maximum passenger load per departure and the corresponding departure time
113 91 The lines whose maximum load exceed the capacity of one bus on both peak days and off-peak days is Line 48 in both directions and Line 64 in the direction of Rimouski. On Easter Monday, the departure with the maximum passenger load for Line 48 needs three buses in the direction of Quebec and 5 buses in the direction of Montreal. Some lines only need additional buses on peak days, such as Line 41 in both directions and Line 64 in the direction of Montreal/Quebec. For some lines and some directions, the maximum load point is less than half of the seats available even on peak days, such as Line 68 in both directions, Line 60 in the direction of Grande-Rivière, and Line 10 heading to Montreal. For travel between Montreal and Quebec (Line 48 and Line 41), the highest demand is always observed at noon or in the afternoon. This is probably because the business trip passengers usually arrange their work in the morning and then go back in the afternoon, while entertainment trip passengers either start or end their activity at this time on weekends. Line 10 and Line 64 are similar in terms of maximum load time, as passengers leave early in the morning to go to the large cities and then go back in the afternoon or the evening after their activities have concluded. Passengers of Line 60 and Line 68 leave in the morning without any other choice as there is only one bus per day. 4.4 The analysis of the main Express Montreal - Quebec corridor Line 48 Express Montreal-Quebec is the most used line for intercity travel in Quebec. Ridership on this line accounts for more than 60% of the total ridership in April It is important to analyze when, where, and how people use the service of this express line. Considering the additional vehicles used, the performance measure indicators are specifically calculated for Line 48 (Table 4.4). Table 4.4: Performance measure report for Line 48 Montreal Quebec Indicator Peak days Off-peak days Easter Monday Unit Note: All the number is on daily basis Ridership Prs Passenger-kilometers traveled 327, , ,353 prs-km Peak to base ratio 1.94 Productivity prs/veh-h Passenger load prs/veh Volume to capacity ratio (V/C ratio)
114 Daily number of boardings in both directions 92 Compared to the system performance measure, the productivity, average passenger load, and V/C ratio is higher on both peak days and off-peak days. However, due to the additional vehicles used, the productivity does not improve on Easter Monday. The difference between V/C ratios on peak days and off-peak days is less significant for Line 48 than the system level. This result implies that for the other lines, a differentiated service on peak days and off-peak days may improve the service. Figure 4.30 shows the average daily number of boardings over time for Line Daily number of boardings over time Monday Tuesday Wednesday Thursday Friday Saturday Sunday OEXP48 MTL-QUE OEXP48 QUE-MTL Figure 4.30: Average daily number of passengers over time for Line 48 By looking at Figure 4.30, we clearly see that there is a high demand on Fridays and Sundays in both directions. Also, the distribution is symmetrical in the two directions. There is always one departure on off-peak days and several departures on peak days with a higher number of boardings compared to the rest of the departures. This will be discussed later in this section. There are 5 stations along this express line: Montreal Longueuil Drummondville Quebec (Sainte-Foy) Quebec (Center-Ville). However, Drummondville is only served three times over one day, in the morning, in the evening, and at midnight. The number of boardings at this station only accounts for about 1% of this line s total ridership. Travels between different stations in one city is not authorized (Montreal to Longueuil or Sainte-Foy to Quebec City for example) to avoid
115 93 the competition with urban public transport. Consequently, Montreal and Longueuil are considered together and Sainte-Foy and Quebec City are considered together since the distance between these different stations in the same city is negligible compared to the long distance of the whole line. University Laval is only served on Friday and Sunday afternoons, and this service is only accessible for students. Therefore, it is not considered for this part. Line 48 has 17 departures per day for both directions, with almost one departure per hour. Based on Keolis operational practice, departures before 12:00 are considered as morning departures, departures between 12:00 and 17:00 are considered as afternoon departures, and the rest are evening departures (Keolis, 2017). By cumulating statistics for all passengers, we can obtain the number of boardings per departure over time in both directions (Figure 4.31 and Figure 4.32). The columns refer to the 30 days of observation on April 2016 plus on Easter Monday, and the different rows refer to the 17 departure times of the day. Each cell contains the number of boardings for that given day for a departure time. The proportion of each departure, average passenger load, maximum passenger load, and minimum passenger load on peak days and off-peak days are shown in the right part of Figure 4.30 and Figure These figures allow the observation of the demand patterns of the line at different levels of aggregation.
116 94 MTL-QUE Week Mon Fri Sat Sun Mon Tue Wed Thu Fri Sat Sun Mon Tue Wed Thu Fri Sat Sun Mon Tue Wed Thu Fri Sat Sun Mon Tue Wed Thu Fri Sat % of Daily Total Avg. Max. Min. Date H Peak Off Peak Off Peak Off Peak Off Time 06: % 4.7% : % 3.0% : % 7.8% : % 6.8% : % 7.0% : % 7.0% : % 6.6% : % 5.6% : % 5.0% : % 11.9% : % 6.4% : % 5.9% : % 6.6% : % 5.9% : % 3.1% : % 4.3% :00 23: % 2.5% Total % 100% Average Figure 4.31: Synthesis of passenger boardings by the time of day (hour) Montreal Quebec QUE-MTL Week Mon Fri Sat Sun Mon Tue Wed Thu Fri Sat Sun Mon Tue Wed Thu Fri Sat Sun Mon Tue Wed Thu Fri Sat Sun Mon Tue Wed Thu Fri Sat % of Daily Total Avg. Max. Min. Date H Peak Off Peak Off Peak Off Peak Off Time 05: % 4.2% : % 5.0% : % 5.7% : % 7.5% : % 7.2% : % 5.6% : % 5.6% : % 12.6% : % 6.1% : % 5.8% : % 6.5% : % 6.5% : % 6.7% : % 3.6% : % 5.5% :30 21: % 4.0% : % 2.8% Total % 100% Avg Figure 4.32: Synthesis of passenger boardings by the time of day (hour) Quebec Montreal
117 95 In general, we observe a slightly higher demand from Montreal to Quebec than from Quebec to Montreal with a higher average number of boardings per departure per day (31 to 28). On peak days, a higher proportion of passengers travels from Montreal to Quebec in the afternoon and evening than in the morning (37.6% and 34.6% compared to 27.8%). However, on off-peak days, passengers travel more in the morning and afternoon than in the evening (36.3% and 35.5% compared to 28.2%). This situation is even more significant for the Quebec to Montreal direction. 46% of passengers travel in the afternoon on peak days, and 39.9% of passengers travel in the morning on off-peak days. This implies that the passengers may travel more often on weekends for leisure in the afternoon while for business in the morning. The highest demand during one day is 15:00 in the direction of Quebec and 12:30 in the direction of Montreal. The number of boardings at these departures account for about 12% of total passenger boardings, and this proportion is slightly higher on peak days than off-peak days. The average load, maximum load, and minimum load at these two departures are always the highest during one day whenever on peak days or off-peak days. The next highest proportion of boardings in the direction of Montreal is at 17:00 and 18:00 on peak days, and at 8:00 on off-peak days. For the reverse direction, it is at 15:30, 16:30 and 17:30 on peak days, and at 8:30 and 9:30 on off-peak days. This is easy to understand since these times are generally ideal to either start or to end the activities. The departures with the lowest number of boardings can be observed in the early morning or late evening. The second departure at 7:00 and the last departure at 23:00 from Montreal to Quebec have the lowest average number of boardings, and the minimum passenger load for this direction is also seen on these departures. The minimum passenger load for the whole line is found on offpeak days in the direction of Montreal, with only one passenger onboard. The second and the third least proportion of boardings are found at 6:30 and 7:30 on peak days, and at 18:30 and 21:00 on off-peak days in the direction of Montreal. If we consider the capacity of the bus with 56 seats and look at the number of buses needed, we can see the demand more clearly. Figure 4.33 and Figure 4.34 illustrate the number of buses used for each departure over different days. The number of extra buses used and their proportion compared to the number of days in April 2016 are shown at the right of figures. The circular use of buses is not considered.
118 96 MTL-QUE Week Mon Fri Sat Sun Mon Tue Wed Thu Fri Sat Sun Mon Tue Wed Thu Fri Sat Sun Mon Tue Wed Thu Fri Sat Sun Mon Tue Wed Thu Fri Sat Total extra Date H Peak Off Peak Off Time 06: : : : : % 11: : : % 14: : % 57% 16: : % 18: % 19: : : :00 23: Total Extra % extra bus Figure 4.33: Synthesis of vehicles by the time of day (hour) Montreal Quebec QUE-MTL Week Mon Fri Sat Sun Mon Tue Wed Thu Fri Sat Sun Mon Tue Wed Thu Fri Sat Sun Mon Tue Wed Thu Fri Sat Sun Mon Tue Wed Thu Fri Sat Date H Peak Off Peak Off Time 05: : : : : : : : % 38% 13: : : % 16: % 17: % 5% 18: : :30 21: : Total Extra Total extra % extra bus Figure 4.34: Synthesis of vehicles by the time of day (hour) Quebec Montreal On peak days, an extra bus is always necessary for the departures at 15:00 from Montreal to Quebec and at 12:30 from Quebec to Montreal since the demand is the highest for these departures. On offpeak days, there are more than 50% chances that an extra bus is needed at 15:00 and this chance is about one-third for the reverse direction. There is still a high chance to use an extra bus for the departures at 17:00 and 18:00 in the direction of Quebec and for the departures at 15:30, 16:30 and 17:00 on peak days. No extra bus is needed on off-peak days apart from the highest demand time just mentioned above except for one particular case (17:30 on April 28 th, 2016). More departures need extra buses on Easter Monday especially for those in the direction of Montreal in the afternoon.
119 97 Nearly all the departures between 11:30 to 19:30 have at least one extra bus. From Montreal to Quebec, a maximum of 4 extra buses are used while this number is 3 for the reverse direction. However, on Easter Monday, 5 extra buses are used in the direction of Quebec and 14 in the direction of Montreal, which nearly amounts to the number of buses in service on off-peak days. The V/C ratios over time are presented in Figure 4.35 and Figure 4.36.
120 98 MTL-QUE Week Mon Fri Sat Sun Mon Tue Wed Thu Fri Sat Sun Mon Tue Wed Thu Fri Sat Sun Mon Tue Wed Thu Fri Sat Sun Mon Tue Wed Thu Fri Sat Avg. Max. Min. Date H Peak Off Peak Off Peak Off Time 06:00 52% 82% 38% 25% 36% 39% 32% 50% 52% 41% 36% 41% 34% 43% 38% 27% 46% 29% 27% 29% 27% 46% 70% 63% 34% 41% 30% 46% 43% 79% 45% 48% 40% 82% 63% 25% 27% 07:00 27% 21% 23% 13% 21% 20% 13% 25% 29% 34% 34% 32% 18% 14% 27% 30% 39% 14% 23% 14% 27% 25% 32% 46% 9% 30% 23% 29% 34% 34% 9% 24% 25% 34% 46% 9% 9% 08:00 86% 38% 39% 20% 45% 30% 39% 63% 55% 50% 55% 68% 46% 71% 64% 68% 71% 43% 86% 80% 39% 89% 36% 91% 52% 89% 84% 73% 77% 59% 86% 47% 66% 68% 91% 20% 30% 09:00 66% 46% 64% 29% 48% 46% 46% 34% 61% 43% 54% 59% 73% 73% 82% 66% 70% 57% 64% 39% 50% 41% 52% 64% 50% 70% 52% 48% 75% 54% 55% 52% 57% 66% 82% 29% 34% 10:00 65% 84% 64% 64% 54% 23% 54% 25% 100% 73% 75% 63% 59% 46% 80% 68% 63% 80% 84% 36% 41% 52% 56% 70% 57% 84% 43% 59% 89% 70% 73% 71% 59% 100% 89% 56% 23% 11:00 83% 82% 61% 73% 64% 38% 55% 43% 63% 66% 80% 55% 29% 46% 63% 77% 86% 79% 80% 41% 52% 36% 84% 79% 63% 71% 61% 57% 75% 61% 68% 73% 58% 84% 86% 61% 29% 12:00 71% 82% 43% 73% 54% 57% 29% 59% 88% 48% 82% 39% 46% 54% 63% 86% 75% 34% 54% 39% 59% 64% 88% 71% 77% 30% 41% 82% 89% 88% 61% 77% 55% 88% 89% 34% 29% 13:00 95% 88% 48% 52% 50% 41% 39% 36% 84% 32% 46% 61% 36% 41% 75% 53% 45% 73% 57% 38% 36% 61% 88% 66% 57% 34% 34% 41% 80% 80% 36% 67% 47% 88% 80% 46% 32% 14:00 75% 88% 23% 61% 45% 27% 41% 46% 80% 45% 70% 61% 27% 45% 64% 86% 38% 70% 38% 32% 30% 48% 86% 38% 66% 34% 45% 54% 57% 71% 54% 75% 42% 88% 64% 61% 23% 15:00 74% 70% 84% 88% 84% 60% 51% 77% 71% 84% 85% 88% 61% 77% 63% 65% 50% 71% 82% 56% 63% 68% 79% 80% 81% 52% 51% 51% 64% 60% 52% 74% 63% 88% 88% 60% 50% 16:00 57% 57% 30% 55% 45% 71% 41% 68% 80% 50% 79% 50% 71% 38% 77% 80% 38% 59% 30% 82% 64% 66% 86% 39% 55% 41% 54% 84% 55% 88% 39% 71% 54% 88% 84% 55% 30% 17:00 71% 88% 25% 75% 46% 45% 52% 71% 88% 38% 95% 36% 84% 45% 73% 51% 38% 53% 34% 68% 55% 68% 74% 32% 54% 23% 50% 79% 45% 71% 29% 69% 49% 95% 84% 51% 23% 18:00 84% 86% 39% 86% 36% 55% 38% 66% 54% 41% 59% 59% 50% 39% 95% 61% 29% 77% 45% 61% 84% 84% 65% 29% 71% 38% 82% 80% 75% 75% 32% 68% 55% 86% 95% 54% 29% 19:00 89% 88% 64% 57% 38% 43% 30% 71% 70% 21% 64% 41% 52% 48% 63% 63% 25% 80% 52% 34% 75% 75% 77% 43% 84% 54% 48% 48% 66% 88% 45% 74% 49% 88% 75% 57% 21% 20:00 93% 46% 29% 43% 34% 29% 34% 29% 64% 32% 32% 20% 23% 32% 27% 68% 23% 36% 23% 18% 29% 29% 34% 25% 48% 21% 14% 32% 25% 45% 20% 46% 26% 68% 34% 32% 14% 21:30 68% 52% 27% 39% 16% 34% 36% 82% 55% 38% 50% 21% 36% 23% 30% 61% 39% 38% 29% 36% 38% 46% 54% 36% 34% 38% 38% 39% 43% 46% 30% 48% 36% 61% 82% 34% 16% 22:00 23:00 38% 36% 14% 36% 13% 16% 20% 25% 21% 32% 20% 21% 20% 27% 29% 23% 16% 36% 13% 25% 20% 27% 25% 20% 36% 21% 23% 13% 18% 29% 23% 29% 21% 36% 32% 20% 13% Average 70% 67% 42% 54% 43% 41% 39% 51% 66% 45% 61% 48% 46% 45% 60% 60% 46% 55% 48% 44% 47% 55% 65% 52% 56% 46% 46% 54% 60% 65% 45% 61% 48% 67% 60% 54% 39% Figure 4.35: Synthesis of V/C ratio by the time of day (hour) Montreal Quebec QUE-MTL Week Mon Fri Sat Sun Mon Tue Wed Thu Fri Sat Sun Mon Tue Wed Thu Fri Sat Sun Mon Tue Wed Thu Fri Sat Sun Mon Tue Wed Thu Fri Sat Date H Peak Off Peak Off Peak Off Time 05:30 21% 30% 43% 18% 23% 38% 45% 36% 29% 34% 48% 43% 36% 25% 38% 39% 38% 36% 23% 30% 36% 39% 39% 33% 45% 48% 30% 18% 06:30 36% 30% 14% 20% 48% 38% 52% 45% 36% 21% 11% 45% 48% 50% 43% 25% 18% 11% 55% 27% 30% 68% 55% 23% 16% 27% 25% 45% 57% 23% 25% 25% 38% 55% 68% 11% 14% 07:30 36% 38% 45% 11% 52% 29% 45% 34% 25% 46% 7% 52% 52% 32% 32% 52% 39% 13% 46% 27% 57% 41% 32% 48% 23% 41% 52% 43% 38% 63% 66% 29% 44% 63% 66% 7% 27% 08:30 89% 89% 73% 39% 50% 23% 43% 38% 64% 75% 30% 43% 39% 52% 86% 46% 70% 23% 57% 38% 64% 66% 64% 91% 32% 45% 45% 77% 73% 84% 57% 53% 57% 89% 91% 23% 23% 09:30 82% 48% 52% 55% 75% 25% 57% 61% 73% 36% 55% 70% 45% 38% 64% 68% 41% 71% 73% 52% 32% 57% 63% 63% 70% 79% 77% 29% 55% 68% 71% 63% 55% 73% 79% 48% 25% 10:30 89% 57% 34% 39% 68% 29% 21% 32% 34% 59% 23% 52% 45% 59% 57% 48% 52% 64% 63% 16% 20% 32% 46% 41% 34% 34% 27% 50% 34% 75% 70% 47% 43% 75% 70% 23% 16% 11:30 75% 70% 27% 68% 70% 30% 39% 63% 39% 30% 36% 50% 36% 46% 46% 61% 30% 59% 30% 30% 34% 57% 45% 36% 54% 75% 50% 32% 39% 88% 41% 58% 43% 88% 75% 36% 27% 12:30 81% 76% 54% 72% 54% 66% 98% 78% 73% 82% 65% 60% 84% 75% 54% 70% 68% 72% 59% 82% 82% 96% 75% 68% 55% 63% 80% 54% 71% 78% 96% 71% 70% 78% 98% 55% 54% 13:30 67% 75% 45% 80% 61% 38% 38% 79% 64% 34% 70% 63% 27% 29% 55% 61% 55% 66% 30% 29% 39% 43% 61% 29% 70% 77% 43% 43% 57% 63% 63% 68% 46% 80% 79% 61% 27% 14:30 79% 88% 23% 46% 43% 46% 34% 59% 54% 32% 80% 43% 43% 71% 52% 75% 29% 82% 48% 52% 48% 63% 66% 23% 73% 48% 52% 34% 50% 82% 41% 72% 44% 88% 71% 46% 23% 15:30 80% 71% 48% 93% 45% 43% 52% 64% 91% 45% 71% 23% 32% 64% 29% 82% 73% 66% 27% 52% 50% 52% 91% 71% 85% 38% 52% 38% 84% 86% 61% 80% 50% 93% 84% 66% 23% 16:30 93% 53% 23% 80% 45% 38% 30% 66% 71% 25% 55% 34% 61% 48% 79% 70% 25% 100% 70% 70% 43% 79% 70% 30% 84% 61% 54% 41% 68% 60% 50% 68% 49% 100% 79% 53% 23% 17:30 97% 75% 50% 77% 25% 39% 34% 79% 75% 36% 66% 41% 46% 77% 68% 51% 34% 72% 38% 29% 38% 63% 88% 29% 54% 77% 64% 50% 65% 71% 32% 67% 49% 88% 79% 51% 25% 18:30 80% 63% 23% 71% 21% 25% 32% 23% 64% 16% 61% 21% 23% 43% 36% 57% 32% 91% 25% 25% 30% 30% 54% 32% 46% 43% 30% 27% 14% 68% 23% 64% 27% 91% 43% 46% 14% 19:30 67% 48% 61% 59% 39% 32% 52% 39% 64% 11% 73% 27% 46% 48% 55% 61% 52% 75% 38% 23% 45% 61% 48% 50% 77% 38% 39% 55% 46% 66% 25% 63% 42% 77% 61% 48% 11% 20:30 21:00 89% 34% 14% 45% 20% 25% 29% 36% 38% 16% 46% 23% 23% 27% 29% 50% 25% 55% 34% 41% 14% 50% 30% 48% 70% 32% 50% 18% 45% 48% 45% 46% 31% 70% 50% 30% 14% 22:30 46% 13% 18% 25% 9% 11% 27% 11% 18% 21% 18% 25% 11% 29% 21% 20% 38% 30% 14% 2% 36% 25% 18% 23% 23% 25% 21% 30% 39% 27% 20% 21% 22% 30% 39% 13% 2% Average 74% 57% 38% 56% 46% 33% 41% 51% 56% 37% 51% 43% 41% 48% 50% 56% 43% 61% 45% 36% 41% 54% 57% 44% 56% 50% 46% 42% 53% 64% 49% 57% 44% 64% 54% 51% 33% Avg. Max. Min. Figure 4.36: Synthesis of V/C ratio by the time of day (hour) Quebec Montreal
121 99 Considering the number of buses used, the V/C ratio has a less regular pattern compared to the number of boardings. The departures with the highest number of boardings do not always have the highest V/C ratios. In general, the average V/C ratio is lower on off-peak days compared to peak days (48% to 61% from Montreal to Quebec and 44% to 57% from Quebec to Montreal). The V/C ratio is also slightly lower for the direction Quebec to Montreal compared to the reverse direction (57% to 61% on peak days and 44% to 48% on off-peak days in average). However, some departures in the morning have a higher V/C ratio on off-peak days. The departures at 8:00 and 9:00 from Montreal to Quebec and the departures at 6:30, 7:30, and 8:30 from Quebec to Montreal have a significantly higher average/maximum/minimum V/C ratio on off-peak days than peak days. Passengers may take these morning buses for work or business purpose on off-peak days. On peak days, starting from 10:00 until 19:00, there is always a significant higher V/C ratio in the direction of Quebec, with an average of more than 67% per departure. The maximum load on these departures is always more than 84%. For the reverse direction, a significantly higher average V/C ratio is observed from 12:30 to 19:30. The maximum V/C ratios are more than 77%. This is because the number of boardings on these departures are important. The average V/C ratio is the lowest at 7:00 on peak days and at 23:00 on off-peak days from Montreal to Quebec. The minimum V/C ratio for this direction also appeared at these departures, with only 9%. For the reverse direction, the departure at 22:30 has the lowest average V/C ratio on both peak days and off-peak days. The minimum V/C ratio is observed for the departure of 7:30 on peak days and at 22:30 on off-peak days, with respectively 7% and 2%, which is also the lowest one for the whole line. 4.5 Highlights of performance measures from operator s perspective Here are some key results obtained from performance measures of Keolis network at system, stop, link, and line levels based on the dataset of April 2016 and March 28 th, Intercity bus supply does not change too much over one week apart from some additional buses used for certain departs, however, intercity bus travel presents high temporal variations. Days can be derived as holidays, peak days, and off-peak days. Off-peak days include Monday-Thursday and Saturday, with an average ridership of 1,487 and an average of 346,000 passenger-kilometers per day. Peak days occur on Fridays and Sundays, the
122 100 ridership on these days is 50% higher than off-peak days. The highest daily number of boardings is observed on Easter Monday, which is 2.5 times that of off-peak days. Intercity travel exists mainly between large cities. The number of departures in the 10 most frequently served cities accounts for more than 78% of all the departures, but shares more than 92% of total ridership on all types of days. Montreal, Quebec (Center-Ville), Quebec (Sainte-Foy), Quebec (University Laval), Rimouski have a high level of stop boardings and alightings per departure on peak days, while Longueuil has the highest number of boardings/alightings per departure on off-peak days. Grande-Vallée has the lowest number of boardings and alightings per departure even on holidays. Grande-Vallée, Mont-Louis, Matapédia and Montreal (Metro Radisson) have less than 1 passenger per departure on both peak days and off-peak days. Intercity bus services are more attractive for cities located in the north of Quebec with low population sizes, such as Carleton, Rivière-du-Loup, and Rimouski, and are less attractive specially for cities that locate near Montreal and Quebec City, such as Laval, Repentigny, and Lévis. The links and lines that serve large cities generally have a higher level of performance than the lines and links of smaller cities in terms of ridership and volume to capacity ratio. The Montreal-Quebec Express Line occupies about 60% of total ridership on all types of days. The highest number of boardings is observed at 15:00 from Montreal to Quebec and at 12:30 from Quebec to Montreal. The undifferentiated services and proportionally shorter passenger travel distance between Montreal - Trois-Rivières and Trois-Rivières - Quebec for Line 41 result in a significant ridership and volume to capacity ratio link differences. There is also a ridership difference between Quebec - Rivière-du-Loup and Rivière-du- Loup - Quebec, but the link volume to capacity ratio is better balanced thanks to its differentiated services. The Line 49 Montreal - Montreal Trudeau Airport has the highest productivity on typical days thanks to its short trip duration. Line 48 Express Montreal - Quebec has a high productivity especially on holidays thanks to its high number of boardings.
123 101 CHAPTER 5 PERFORMANCE MEASURES: PASSENGER S PERSPECTIVE In this chapter, indicators are applied to evaluate the performance of intercity bus travel from passenger s perspective. These indicators are presented based on the functional unit of a passenger trip. Travel patterns are analyzed for different types of trips based on the number of transfers and various types of journey. The results presented here are for all passengers who buy tickets from Keolis, both for those taking the network of Keolis and other intercity bus companies in Quebec. 5.1 Intercity bus system passenger measure General passenger performance measure report Travel time, the percentage of trips requiring transfer, and scheduled transfer time are key indicators for intercity bus system performance measure from passenger s perspective. Values of these indicators can be found in Table 5.1. Travel time here is the station-to-station time based on the schedule and sales dataset. Complementary surveys or estimations would be necessary to assess access and egress times. Table 5.1: Trip-based passenger measure indicator report Indicator Results Note: All the number is an arithmetic mean value of monthly database Travel Time Type Direct trip 1 transfer 2 or more transfers Average 2.7 hours 5.9 hours 11.8 hours Minimum 18 min 1 h 25 min 4 h 15 min Maximum 8 h 55 min 15 h 35 min 23 h 30 min Percentage of trips requiring transfer Average Scheduled Transfer Time Type 14.80% 1 transfer 2 or more transfers Average 33 min 91 min Minimum 0 min for through passengers and 5 min for transfer passengers 5 min Maximum 325 min 290 min
124 102 We can see from Table 5.1 that the average travel time is 2.7 hours for a direct trip and 5.9 hours for a trip with one transfer. As the number of transfers increases, the average, minimum, and maximum travel times all become longer. Almost 85% of trips can be realized by a direct service, and the average total scheduled transfer time is about 33 minutes for one transfer and 91 minutes for more than one transfer. For direct trips, the minimum travel time is 18 minutes from Chandler to Grande-Rivière, and the maximum travel time is 8 hours 55 minutes from Rivière-du-Loup to Moncton. For trips with one transfer, the minimum travel time is 1 hour 25 minutes from Longueuil to Waterloo by transferring at the Bromont (Autoparc74) station, and the maximum travel time is 15 hours 35 minutes from Rimouski to Val-d Or by transferring at the Montreal station. The minimum travel time for multitransfers is 4 hours 15 minutes from Montreal Trudeau Airport to Lévis with 2 transfers at Montreal and Quebec (Sainte-Foy), and the maximum travel time is 23 hours 30 minutes from Chandler to Val-d Or with three transfers. The maximum number of transfers is 4, and there is only one passenger taking this trip. The minimum scheduled transfer time is 0 for through passengers, such as Quebec to Montreal Trudeau Airport with a transfer at Montreal. The minimum scheduled transfer time is 5 minutes for transfer passengers going from Quebec City to Roberval, Dolbeau, and Chambord. The minimum scheduled transfer time within the network of Keolis is 10 minutes. The longest transfer time is 325 minutes from Montreal to Hébertville. The longest transfer time within the network of Keolis is 210 minutes from Amqui to Saint-Hyacinthe Passenger travel time As defined in chapter 3, trips can be divided into direct trips and non-direct trips. According to the time spent at intermediate stations, non-direct trips can be further divided into trips with transfers and trips with intermediate destinations. Trips with transfers account for 98% and trips with intermediate destinations only shares 2% of total trips. The proportion of trips with different number of transfers is presented in Figure 5.1.

125 103 Figure 5.1: Proportion of different number of transfers Most passengers prefer a direct trip. We can see from Figure 5.1 that nearly 85% of passengers choose to take a direct trip while about 14% of passengers take their trips with one transfer. Less than 1% of passengers take a trip with more than 2 transfers. These results may underestimate the real number of transfers because the results only consider those who buy their tickets together for their whole trips. Passengers who buy their tickets separately cannot be identified. Currently, the variable price rates are only available for the Montreal-Quebec corridor. Passengers who travel with a transfer between this corridor and another route still have a fixed price. This price may be higher than the combination of two separate tickets. For example, passengers who go from Rimouski to Montreal may order two tickets separately under two different PassengerID because it might be a little cheaper (87.65 $ before tax for a flexible ticket versus 85.2 $ before tax in combination with the minimum price for Quebec Montreal corridor departures on May 17 th, 2017 searched on April 9 th, 2017). Travel time varies for these different types of trips. Figure 5.2 shows the distribution of total scheduled travel time for direct trips and trips with transfer respectively.
126 Number of passengers (monthly) Number of passengers (monthly) Number of passengers (monthly) 104 Distribution of total travel time - direct trips Distribution of total travel time - trips with transfer % % % % % % % % % % 0 (0-1] (1-2] (2-3] (3-4] (4-5] (5-6] (6-7] (7-8] (8-9] Duration of travel (hours) 0% 0 (0-1] (1-2] (2-3] (3-4] (4-5] (5-6] (6-7] (7-8] (8-9] (9-10] (10+) Duration of travel (hours) 0% Distribution of total travel time - trips with transfer (zoom) 5% 4% 3% 2% 1% 0 (0-1] (1-2] (2-3] (3-4] (4-5] (5-6] (6-7] (7-8] (8-9] (9-10] (10+) Duration of travel (hours) 0% Figure 5.2: Distribution of total travel time For a direct trip, the most common travel time is between 2-3 hours (44%), followed by a trip duration of 3-4 hours (21%) and 1-2 hours (15%). These trips account for a total proportion of 93%. Trips with a duration of less than 1 hour and more than 4 hours are uncommon at about 7 % in total. Some trips are taken within 1 hour by direct services, but their proportion is also very limited (1.9%). The minimum time spent for a trip with transfer is 1 hour 25 minutes, and the proportion of trips with transfer realized in less than 2 hours is only 0.05%. Destinations of less than one hour are often served by urban public transportations. To avoid the competition between intercity bus with urban public transport, trips between very near locations like from Quebec City to Lévis and from Montreal to Longueuil are not allowed for intercity buses. Intercity buses are mostly used for trips between 1 to 4 hours. Trips of more than 4 hours are very tiring for passengers by bus, and hence, very few passengers take them even if a direct service exists. The distribution of total travel time for trips with transfer is a little different with direct trips. The most common travel duration is between 3-4 hours for trips with transfer. This is not surprising since the transfer time and extra in-vehicle time should be added to the total travel time compared to a direct trip. There are few trips taken with more than 8 hours by intercity bus, regardless of number of transfers.

127 105 The travel time and scheduled transfer time vary based on the number of transfers, as seen in Figure 5.3. Figure 5.3: Average total travel time and scheduled transfer time for different number of transfers As shown in Figure 5.3, with a higher number of transfers, both the total travel time and scheduled transfer time increase. The proportion of transfer time over total travel time grows with a higher number of transfers. The scheduled transfer time occupies about 6% of total travel time for trips with one transfer. This proportion is more significant with a higher number of transfers. The transfer time occupies more than 7% of the total travel time for trips with multi-transfers, particularly for trips with 4 transfers where this proportion is more than 14 %. This is because the frequency of intercity buses is relatively low, and with more than two transfers, it will be more difficult to coordinate between departures. Especially for travels that go overnight, the transfer time will increase substantially. The growth rate of in-vehicle time also varies for the different number of transfers. The average in-vehicle time for trips with one transfer is 2.65 hours longer than direct trips. This in-vehicle time is longer with higher number of transfers (9.65 hours for two transfers and hours for three transfers). However, there is not too much difference between the in-vehicle time of trips with three transfers and four transfers. This implies that only a short-distance trip is added Passenger O-D desire lines The complete passenger trip origins and destinations (OD) can be obtained from the sales database. The Keolis passenger OD desire lines in April 2016 are presented in Figure 5.4, Figure 5.5, and Figure 5.6. They are grouped by direct trips, trips with one transfer, and trips with multi-transfers.

128 106 Direct trips (a) Direct trips (b) Figure 5.4: Daily passenger OD desire lines direct trips


129 107 Direct trips (c) Direct trips (d) Figure 5.4: Daily passenger OD desire lines direct trips We can clearly see that the corridors with the highest demand by direct bus are Montreal - Quebec, Quebec - Chicoutimi, Montreal - Rivière-du-Loup - Rimouski, Montreal - Trois-Rivières, and Montreal Saint-George. An average of more than 36 trips is taken along these corridors every day. These trips account for 51% of the total direct trips, among which, trips from Montreal and Longueuil to Quebec represent 28% of all the direct trips. This proves again that the demand is primarily between large cities. The proportion of the other direct trips along these main corridors varies from 2% to 4% respectively. The travel time along these corridors changes from 2 h 30 min from Quebec to Chicoutimi to 6 h 35 min from Montreal to Rimouski. The pattern of these trips without transfer is radially dispersed from Quebec City.
 Trips")
 Trips (c)")


130 108 Trips with one transfer (a) Trips with one transfer (b) Trips with one transfer (c) Figure 5.5: Daily passenger OD desire lines trips with one transfer
131 109 The highest percentage of trips with one transfer is from Quebec (Sainte-Foy) to Montreal Trudeau Airport, and from Montreal to respectively Rimouski, Chicoutimi, and Rivière-du-Loup that need transfer at Quebec City. Their proportion is about 31% of the total trips with one transfer. Moreover, more destination options are observed compared to direct trips. Trips with multi-transfers (a) Trips with multi-transfers (b)
. A relatively high demand is from Montreal to respectively Chibougamau, Sept-Îles, Saint- John, and Halifax.")

132 110 Trips with multi-transfers (c) Figure 5.6: Passenger OD desire lines Multi-transfers There is no significant demand for trips with more than 1 transfer (less than 2 trips per day). This is normal considering their low percentage in the total travel demand (less than 1%). A relatively high demand is from Montreal to respectively Chibougamau, Sept-Îles, Saint- John, and Halifax. They make up 26% of all trips with multi-transfers. All these destinations need a transfer from Quebec (Sainte-Foy), and then from respectively Chicoutimi and Rivière-du-Loup. The demand is mainly at the east of Quebec, and no significant demand is observed in the west of Quebec. We must recall that all analysis only relies on the dataset of one carrier, so it is not possible to analyze the full intercity demand Passenger transfer The intercity bus network is a spoke-hub distribution network, i.e. the system of connections is organized like the spokes and hub of a wheel, and all the lines are connecting a node to a larger central distribution center (Casey, 2016). Transfer stations play the role of hubs, but their importance is different based on the number of transfer passengers.

 that share 4.7%.")
133 111 Figure 5.7: Number of transfer passengers and the average scheduled transfer time (Station Name (Number of transfer passengers) Scheduled transfer time) Figure 5.7 shows the number of transfer passengers and the average scheduled transfer time at each station. Montreal, Quebec (Sainte-Foy), Rimouski, and Quebec (Center-Ville) are the four hubs with the highest number of transfer passengers and account for 90.6% of the total transfer passengers. Montreal station itself shares 41.1%, and two stations in Quebec share 31.6%, followed by the two stations Rivière-du-Loup and Hauterive (Mingan) that share 4.7%. The rest of all the other transfer stations represent 4.7% of all the number of transfer passengers. Montreal and Quebec are the most important two hubs with more than 8 destination options, and Rimouski is the only path for eastern habitants to come to the capital of Quebec Province. Therefore, it is normal that their number of transfer passengers has the highest proportion. Rivière-du-Loup is the transfer point to go to the New Brunswick province, and the trips generally take a rather long time (generally more than 6 hours by bus). Thus, their demand is lower. The average scheduled transfer times for these stations vary a lot, from 5 minutes to several hours. The average transfer time is also indicated in Figure 5.7 and the distribution of scheduled transfer time for the six main transfer stations is presented in Figure 5.8. As stated before, an intercity transfer needs a minimum transfer time and an appropriate transfer time. The values of these times vary based on circumstances. Generally, a transfer less than 15 minutes is only enough for changing from one bus to another. A transfer between 15 minutes to 30 minutes might be sufficient for passengers to change buses and go to the washroom or buy a snack. A transfer between 30 minutes

134 112 to 60 minutes allows passengers to rest on the nearby benches or walk around the boarding station. A transfer between 1 hour and 2 hours allow passengers to take a meal in the restaurant near the stations. A transfer for longer than 2 hours is long enough to arrange some short activities like going shopping in the boutiques. In Figure 5.8, the transfer time is grouped into 5 categories, and their proportions over total transfer passengers are also illustrated. Transfer Quebec Quebec Rivieredu-Loup Hauterive time in min Montreal (Saint-Foy) Rimouski (Centre-ville) (Mingan) [0-14] 52% 24% 0% 0% 27% 0% (14-30] 45% 11% 0% 63% 7% 100% (30-60] 2% 50% 0% 27% 0% 0% (60-120] 1% 9% 100% 6% 64% 0% (120+) 0% 6% 0% 4% 1% 0% Figure 5.8: Distribution of scheduled transfer time at main transfer stations As shown in Figure 5.8, at Montreal station, 97% of transfer times are within 30 minutes, of which 52% are less than 15 minutes, and 45% are between 15 and 30 minutes. Among the transfers of less than 15 minutes, 24% of transfer passengers come from or go to the Montreal Trudeau Airport. Thus, about 28% of passengers transfer at Montreal might have a very tight transfer time. Only 3%
135 113 of passengers have a transfer time of more than 30 minutes. Montreal is the most important transfer hub in Quebec with the highest number of transfer possibilities and transfer passengers. Thus, it is probably designed for a very efficient transfer with as low as possible transfer times. Quebec (Sainte-Foy) and Quebec (Center-Ville) have an equivalent importance with regards to transfers since almost all the operators that arrive at or leave from Quebec City will pass by these two stations. 61% of scheduled transfer times are between 15 minutes and 60 minutes at Quebec (Sainte-Foy), among which 50% of transfers are realized between 20 minutes and 45 minutes. It seems that the scheduled transfers are better arranged at Quebec (Center-Ville) where 90% of transfers are between 15 minutes and 60 minutes. There are no transfers less than 15 minutes, and only 10% of transfers are more than 1 hour. However, transfers are more often made at Quebec (Sainte-Foy). The number of transfer passengers at Quebec (Sainte-Foy) are more than 2 times higher than at Quebec (Center-Ville). This is probably because it avoids a detour at Quebec (Center-Ville). In Chapter 4, a big difference between the V/C ratio is observed between the link Drummondville - Quebec (Sainte-Foy) and Quebec (Sainte-Foy) - Quebec (Center-Ville). The number of boardings and alightings is almost the same for Quebec (Sainte-Foy) and Quebec (Center-Ville), this can also be explained by the fact that a lot of passengers transfer at Quebec (Sainte-Foy). All the transfers at Rimouski are between 1 to 2 hours and of which 99% are between 65 minutes and 75 minutes. The scheduled transfer time at Rivière-du-Loup is either very tight at about 10 or 15 minutes (27%), or very long at about 75 minutes (64%). The scheduled transfer time at Hauterive (Mingan) is relatively concentrate on minutes. These three cities locate in the northeast of Quebec, and the lines coming to or leaving from these three cities take for more than 2 hours, thus transfer times are arranged longer. Scheduled transfer time also changes at different times of the day. Figure 5.9 illustrates the distribution of scheduled transfer time and the number of transfer passengers by departure time of connecting bus at the main transfer stations.

136 114 Figure 5.9: Distribution of scheduled transfer time by departure time of connecting bus Passengers have to wait longer time at night and in the early morning than during the day in average. This may be due to the low frequency of intercity bus services. In Montreal, transfer passengers are mainly distributed from 12:00 to 19:00. The scheduled transfer time is generally less than 20 minutes during this period. As discussed earlier, this period has the highest demand along the Montreal-Quebec corridor. Of all the stations, the highest number of transfer passengers is observed at Quebec (Sainte-Foy) at about 13:00-14:00 (839 passengers per month), which occupies 48% of the daily transfer passengers: half of them coming from Montreal and heading to Rivière-du-Loup, and the other half of them taking the reverse direction. Most of them have 40 minutes or 45 minutes transfer time. This transfer time is reasonable since these two trip segments both take more than 2 hours. As stated before, the highest demand of line Quebec Montreal appears at 12:30, when the bus of this departure arrives at Quebec (Sainte-Foy) at 13:00. Thus, half of these transfer passengers contribute to the high demand of Quebec to Montreal at this time. Another half of these transfer passengers come from Montreal with the departure of 10:00. This also partially explains why a sudden change
137 115 of demand on peak days is observed at 10:00 from Montreal to Quebec. Another peak of transfer passengers at Quebec (Sainte-Foy) is between 18:00-19:00. 75% of these transfer passengers take the Express Montreal-Quebec at 15:00 and then transfer to the line with the destination to Rimouski. At Rimouski, the highest numbers of transfer passengers are observed at about 6:00-7:00 and 13:00-14:00 (718 and 720 passengers per month respectively). These passengers mainly transfer between Montreal/Quebec and the east of Rimouski. There is only one departure in the morning per day for the cities in the east of Rimouski. Half of these passengers take the bus in the morning and then transfer to Montreal/Quebec at 13:45. Another half of them taking the reverse direction leave in the evening and then transfer at 6:15. Their scheduled transfer time is about minutes. There are fewer transfer passengers at Rivière-du-Loup and Hauterive. The departure at 4:30 and 16:45 at Rivière-du-Loup has respectively 123 and 135 transfer passengers per month, which account for respectively 57% and 80% of their total transfer passengers. The departure of 4:30 at Rivière-du-Loup is a representative example of maximizing the number of simultaneous arrivals of vehicles at the transfer points. 57% of the passengers who come from or go to Rimouski, Montreal/Quebec, and Moncton can fully transfer with a scheduled transfer time of 70 or 75 minutes. Hauterive has two main transfer times: passengers who go from Quebec to Sept-Îles transfer at 16:45 with a transfer time of 20 minutes, and at 12:05 for the reverse direction with a transfer time of 25 minutes. The number of passengers from Quebec to Sept-Îles is 4 times higher than those taking the reverse direction. One reason for this difference is probably because the passengers coming to Quebec may buy their tickets from the local agents of Intercar since this line is operated by Intercar rather than Keolis. Compared to the other stations mentioned above, where main transfers are realized around several departures, transfer passenger flow is dispersed among many departures at Montreal and Quebec (Center-Ville) stations. This can be explained by the structure of current intercity bus network. Montreal and Quebec (Center-Ville) are the main transfer hubs with many lines operated by different intercity bus carriers. Thus, passengers have more destination and departure choices. Compared to these two hubs, the rest of stations have fewer destination options with only 2 or 3 lines.
138 Percentage of transfer passengers Percentage of expired tickets 116 The frequency of intercity bus services is relatively low. If passengers miss a transfer while the connecting bus is leaving, the ticket will expire and be void if it is of passenger s responsibility. Thus, missing a connection will cause both time and economic loss. The distribution of expired ticket rates over time and space are presented respectively in Figure 5.10 and Figure Distribution of transfer passengers and expired ticket rates over time 25.0% 22.5% 20.0% 50% 45% 40% 17.5% 15.0% 12.5% 10.0% 7.5% 5.0% 2.5% 0.0% 01:00 03:00 04:00 05:00 06:00 07:00 08:00 09:00 10:00 11:00 12:00 13:00 14:00 15:00 16:00 17:00 18:00 19:00 20:00 21:00 22:00 23:00 Time of day 35% 30% 25% 20% 15% 10% 5% 0% Figure 5.10: Distribution of transfer passengers and expired ticket rates over time From Figure 5.10, we can see that most transfers are made between noon and 18:00, during which high transfer expire rates are observed at 15:00 and 17:00. The expired ticket rates are generally higher for transfers in the evening and early morning than during the day time. This is probably because the number of transfer passengers is very low and the number of expired tickets will have a more significant influence. A very high percentage of passengers miss their trips at 3:00, which is more than 50%, this will be discussed along with the analysis of Figure 5.11.


139 117 Figure 5.11: Expired ticket rates at transfer stations By examining the expired ticket rates at each station, we can see that among the frequent transfer stations, Montreal has the highest expired ticket rate, and Quebec (Center-Ville) has the lowest rate of 0.6%. Quebec (Sainte-Foy) and Rimouski have modest expired ticket rates at about 4%. Other transfer stations do not have any transfer expired tickets. This result is partly because of the scheduled transfer times. For example, at Montreal, many tight transfer times are observed, if the bus delays, passengers may not have enough time to transfer. Moreover, no show for part of the trip segment is also significant. For example, stations with the highest expired ticket rates are Lévis and Drummondville, at 55.4% and 19.2% respectfully, but their transfer passengers only account for about 1% of the total number. The highest expired ticket rate happens at 3:00 at the Lévis station. This is because of passenger s voluntary no show. The intercity bus from Rimouski to Quebec and Montreal arrives at Lévis at about 3:00 according to the schedule. There is also an express urban bus leaving from Lévis to Quebec at respectively 2:30 and 3:00. The high proportion of expired tickets may because passengers take the express bus to Quebec City as more intermediate stations are available along this express bus. Thus, they voluntarily give up using the last ticket since the distance is short and they do not pay extra for this trip segment. This implies that for intercity bus passengers, it is also important to well coordinate their schedules with urban public transport to facilitate their transfer to their final destinations. Intercity bus service has the lower frequency and longer travel distance compared to urban transport. Thus, the impact of transfer wait is quite different. There can be three different scheduled
140 118 transfer times. For a connection with long scheduled transfer time (more than 1 hour for example), passengers will probably be annoyed to wait. Another one is a tight transfer with which passengers run the risk of missing the connection (5-10 minutes for example). This will increase immensely both the real and perceived wait time. The third one is an appropriate transfer wait which allows passengers taking a rest during the long journey. It may bring positive effects to transfer passengers (20 minutes for example). However, it is impossible that the scheduled transfer time could satisfy everyone with different departures and destinations. There are always some priorities for those important transfer hubs with the highest number of transfer passengers. As pointed out before, Montreal, Quebec (Sainte-Foy), Rimouski, Quebec (Center-Ville), Rivière-du-Loup, and Hauterive are the six most important transfer hubs with the highest number of transfers. Two departures at Quebec (Sainte-Foy) and Rimouski have the highest transfer passengers, and the transfers are more distributed in Montreal and Quebec (Center-Ville). To find an appropriate transfer time for these main hubs and main departures, and to make the scheduled transfer time as near as possible to these appropriate transfer times may improve the overall transfer conditions. 5.2 Passenger trip patterns Journey type based trip division As defined in Chapter 3, based on different journey types, trips can be divided as one-way trips and round-trips. According to the number of nights spent at the destinations, round-trips can be further divided as same-day round-trips and multi-day round-trips. Multi-day round-trip passengers stay at their destinations for at least one night, and same-day round-trip passengers go back to their original cities without staying overnight. Their proportion is shown in Figure 5.12.

141 119 Figure 5.12: Proportion of passengers with different types of trips As seen in Figure 5.12, the percentage of one-way trips, multi-day round-trips, and same-day round-trips is respectively 62%, 32%, and 6%. Comparisons of these three types of trips are presented by three aspects: departure time, duration of stay at destinations, and total travel time Departure time Figure 5.13, Figure 5.14, and Figure 5.15 show the hourly number of passengers by departure time over different times of day and the average daily number of passengers over one week for one-way trips, multi-day round-trips, and same-day round-trips.

142 HOURLY NUMBER OF PASSENGERS TOTAL DAILY NUMBER OF PASSENGERS HOURLY NUMBER OF PASSENGERS TOTAL DAILY NUMBER OF PASSENGERS 120 Distribution of passenger departure time - one-way trips Monday Tuesday Wednesday Thursday Friday Saturday Sunday WEEK AND TIME Hourly number of passengers Daily total number of passengers Figure 5.13: Distribution of departure time over week for one-way trips Distribution of passenger departure time - multi-day round-trips Monday Tuesday Wednesday Thursday Friday Saturday Sunday WEEK AND TIME Hourly number of passengers Daily total number of passengers Figure 5.14: Distribution of departure time over week for multi-day round-trips
143 HOURLY NUMBER OF PASSENGERS TOTAL DAILY NUMBER OF PASSENGERS 121 Distribution of passenger departure time - same-day round-trips Monday Tuesday Wednesday Thursday Friday Saturday Sunday WEEK AND TIME Hourly number of passengers Daily total number of passengers Figure 5.15: Distribution of departure time over week for same-day round-trips The distribution of departure times for one-way trips and multi-day round-trips are similar. For these two types, both the highest hourly demand and daily demand are on Fridays and Sundays during the week. On Thursdays, Fridays, and Sundays, the demand is relatively higher in the afternoon, while on Mondays and Saturdays, the demand is higher in the morning. On Tuesdays and Wednesdays, the demand is more evenly distributed from 8:00 to 18:00. The only difference between them is that the highest hourly and daily number of boardings is observed on Fridays for one-way trips while on Sundays for round-trips. This may be because passengers leave on Thursdays, Fridays or even Saturdays, but they all return on Sundays since it is the end of the week. However, for one-way trip passengers, they tend to leave at the end of weekdays. Same-day round-trip passengers are quite different in both daily number of passengers and hourly distribution. During one week, their highest number of boardings is observed from Wednesdays to Fridays, while this number on Sundays is the least. During one day from Mondays to Fridays, their departure time is concentrated in the morning between 6:00-10:00 and in the afternoon from 16:00 to 19:00. On Saturdays and Sundays, both departure and return times are later. Peak hours are witnessed from 7:00 to 10:00 on Saturdays and 8:00 to 11:00 on Sundays in the morning, while in the afternoon are from 18:00-22:00 on Saturdays and from 16:00-22:00 on Sundays. The different daily distributions of same-day round-trip passengers and multi-day round-trip passengers imply
144 122 that the purposes of travel for them might be different. There might be a higher proportion of business trips for same-day round-trip passengers while more leisure or family visit trips for multiday round-trip passengers. The different hourly distributions are easy to understand. Most sameday round-trip passengers leave in the morning and go back in the afternoon. The highest departure and return time of round-trip passengers vary over different days of one week because they have more activity time choices. These results can also explain the temporal fluctuation seen in Chapter 4. The number of boardings is the highest on Fridays because there is a higher proportion of one-way trips than round-trips, and the day with the highest number of trips is on Fridays for one-way trips Duration of stay The duration of stay is analyzed for multi-day round-trips and same-day round-trips since the activity times of one-way trip passengers are unknown. Both trips can be captured for same-day round-trips. Some trips are recorded as round-trips, but only one of the trips can be found in the database (incomplete round-trips), their proportion is about 19%. For these incomplete round-trips, the exact duration is unknown. There are two possible reasons for these incomplete round-trips. The first one is that one part is taken at the boundary of the database, which means that the other part is not recorded in the current database. The other one is due to the combination of two roundtrips together. For example, if four tickets allowing for two round-trips are used respectively in January, April, April, and May, the two tickets in April will appear as incomplete round-trips, since they are not bought together even though there is a duration of stay within these two times. The distribution of stay duration respectively for multi-day round-trips and same-day round-trips are shown in Figure 5.16 and Figure There are stays less than 24 hours for multi-day roundtrip passengers because trips leaving in the evening and coming back in the following day is considered as multi-day round-trips since there is a night stay.
145 Daily number of passengers Daily number of passengers Distribution of stay duration - multi-day round-trips (0-12 h] (12-24 h] (1-2 d] (2-3 d] (3-4 d] (4-5 d] (5-6 d] (6-7 d] (7-14 d] (14-21 d](21-28 d] (1m+) Stay duration in hours (or days or months) 45% 40% 35% 30% 25% 20% 15% 10% 5% 0% Figure 5.16: Distribution of stay duration for multi-day round-trip passengers Distribution of stay duration - same-day round-trips (0-1] (1-2] (2-3] (3-4] (4-5] (5-6] (6-7] (7-8] (8-9] (9-10] (10-11](11-12](12-13](13-14](16-17](17-18](18-19] Stay duration in hours 20% 18% 16% 14% 12% 10% 8% 6% 4% 2% 0% Figure 5.17: Distribution of stay duration for same-day round-trip passengers The stay duration for multi-day round-trip passengers starts decreasing from the 1-2 days stay. Stays less than 12 hours make up less than 1% because few passengers travel in the evening. The stay duration of 1-2 days represents 40% of total multi-day round-trips, followed by 2-3 days (20%) and hours (14%). The stay duration within one week occupies 91% of total multi-day roundtrip passengers. The number of passengers who stay for longer than 4 days is relatively low, at less than 5%. It is also likely that passengers staying for longer durations would take separate tickets. The stay duration of same-day round-trip passengers has a skewed normal distribution centralized around the 4-9 hours stay. The number of passengers within this stay duration shares 69% in total.
146 Daily number of passengers Daily number of passengers 124 The highest number of same-day round-trip passengers stay for about 6-7 hours (18%), followed by 5-6 hours (16%), 8-9 hours (14%), and 7-8 hours (12%). Figure 5.18 and Figure 5.19 illustrate the departure day of different stay durations for multi-day round-trip passengers and same-day round-trip passengers. 350 Distribution of the departure day for different stay durations - multi-day round-trips (0-12 h] (12-24 h] (1-2 d] (2-3 d] (3-4 d] (4-5 d] (5-6 d] (6-7 d] (7-14 d] (14-21 d] (21-28 d] (1m+) Stay duration in hours (days or months) Monday Tuesday Wednesday Thursday Friday Saturday Sunday 70 Distribution of the departure day for different stay durations - multi-day round-trips (Zoom) (0-12 h] (12-24 h] (1-2 d] (2-3 d] (3-4 d] (4-5 d] (5-6 d] (6-7 d] (7-14 d] (14-21 d] (21-28 d] (1m+) Monday Tuesday Wednesday Thursday Friday Saturday Sunday Figure 5.18: Distribution of the departure day for different stay durations multi-day round-trips
147 Daily number of passengers 125 Distribution of the departure day for different stay durations - same-day round-trips (0-3h] (3-7h] (7-10h] (10h+) Stay duration in hours Monday Tuesday Wednesday Thursday Friday Saturday Sunday Figure 5.19: Distribution of the departure day for different stay durations same-day round-trips For multi-day round-trip passengers, an important proportion of passengers with 1-2 days or 2-3 days activity duration leave on Fridays, which account for respectively 43% and 37% of the total weekly passengers. This is followed by passengers leaving on Saturdays (16%) with a 2-3 days stay duration and on Thursdays (18%) with a 2-3 days stay duration. This indicates that the highest proportion of multi-day round-trip passengers spend the weekend at their destinations. Passengers who stay for 3-4 days usually leave on Thursdays, which is not surprising since they might have a longer weekend. Passengers who stay for longer than 4 days until 2 weeks at their destinations either tend to leave on Mondays and go back at the end of weekdays or leave in the middle of the week and go back on Sundays. Passengers who stay for longer than 2 weeks mostly leave on Mondays, which is normal since Monday is the beginning of a week. For same-day round-trips, the highest number of passengers who stay for 3-7 hours mainly take their trips on weekdays. Passengers who have a longer stay duration mainly take their trips from Thursday to Saturday. It is probable that most same-day round-trip passengers stay from Monday to Friday primarily for work or study purposes, and those who stay on weekends may travel for personal or leisure purposes. It is reasonable that passengers stay for a longer time on weekends than weekdays because a later return time in the evening is observed earlier in this section Total travel time The distributions of the total travel time for one-way trips, multi-day round-trips, and same-day round-trips are presented in Figure 5.20, Figure 5.21, and Figure 5.22 respectfully. The total
148 Daily number of passengers Daily number of passengers 126 number of passengers is shown in the left column, and their proportion is shown in the right column. The travel time of a round-trip is the total time of the two portions. Distribution of total travel time - one-way trips [0-1] (1-2] (2-3] (3-4] (4-5] (5-6] (6-7] (7-8] (8-9] (9-10] (10+) total travel time in hours 100% 90% 80% 70% 60% 50% 40% 30% 20% 10% 0% Figure 5.20: Distribution of total travel time one-way trips Distribution of total travel time - multi-day round-trips (0-1] (1-2] (2-3] (3-4] (4-5] (5-6] (6-7] (7-8] (8-9] (9-10] (10+) total travel time in hours 100% 90% 80% 70% 60% 50% 40% 30% 20% 10% 0% Figure 5.21: Distribution of total travel time multi-day round-trips
149 Daily number of passengers Distribution of total travel time - same-day round-trips (0-1] (1-2] (2-3] (3-4] (4-5] (5-6] (6-7] (7-8] (8-9] (9-10] (10+) total travel time in hours 100% 90% 80% 70% 60% 50% 40% 30% 20% 10% 0% Figure 5.22: Distribution of total travel time same-day round-trips For one-way trips, the highest proportion of passengers takes a trip of 2-3 hours (44%), followed by 3-4 hours (24%) and 1-2 hours (15%). This distribution is similar to the travel time distribution for direct trips, for which the three highest travel time proportions are 2-3 hours (44%), 3-4 hours (20%), and 1-2 hours (15%). The proportions of these 3 types of passengers are similar because 62% of the total travels are made on one-way trips. The proportion of 3-4 hours one-way trips is also high since the highest number of trips with transfers are made with 3-4 hours. The highest number of passengers have a total travel time of 5-7 hours. They share 61% of the total number of multi-day round-trip passengers. There is not too much difference between travels with 5-6 hours (30%) and 6-7 hours (31%). Similar to multi-day round-trips, a total travel time of 5-7 hours has the highest ratio for same-day round-trips (69%). The difference is that for same-day round-trip passengers, the total travel time within 5-6 hours is significantly higher than that within 6-7 hours (40% compared to 29%). Moreover, a significant proportion of passengers travel for more than 7 hours (15%). However, almost no same-day round-trips are made with a total travel time longer than 7 hours (2%). This is not surprising as it would be very tiring for passengers make a very long-time round-trip in one day. The average total travel times over different stay durations are also compared between multi-day round-trip passengers and same-day round-trip passengers as shown in Figure 5.23 and Figure 5.24.
150 Average total travel time Average total travel time in hours 128 Average total travel time over stay duration - multi-day round-trips (0-12 h] (12-24 h] (1-2 d] (2-3 d] (3-4 d] (4-5 d] (5-6 d] (6-7 d] (7-14 d] (14-21 d](21-28 d] (1m+) Stay duration Figure 5.23: Distribution of total travel time over stay duration multi-day round-trips Average total travel time over stay duration - same-day round-trips (0-3h] (3-7h] (7-10h] (10h+) Stay duration Figure 5.24: Distribution of total travel time over stay duration same-day round-trips The average total travel time admits a normal distribution. The lowest total travel time corresponds to passengers who have stayed for hours and 1-2 days. The longer the duration of stay, the longer the total travel time, and the related standard deviation is larger. The longest travel time is taken for a stay of 6-7 days. The total travel time and the related standard deviation start to decrease for stays of more than 1 week. This implies that passengers prefer traveling shorter distances if they do not plan to stay for a long duration. It is not worth spending a long-time traveling for just a short time stay. However, the total travel time does not increase for all stays. For stays more than 1 week, the average travel time decreases. The average travel time for passengers who stay for less
151 129 than 12 hours is not the lowest, probably due to night travel. In fact, some transfer passengers may wait longer at night as explained before. The average total travel time and the related standard deviation of same-day round-trips do not change significantly. The total travel time and the standard deviation are the lowest compared to multi-day round-trips, from 3 to 7 hours. This is reasonable because no matter how long the stay is at the destination, a too long travel time makes it difficult to complete the travel and the activity within one day. 5.3 Other service use patterns related to sales database The sales database contains information on passenger trip patterns, including travel time, origindestination, and duration of stay. Some other service use patterns can also be obtained from the non-trip related fields in the sales database, such as frequency of orders, accompaniment, cost, and order method. In this section, these patterns are presented at the system level to better understand the intercity bus passengers trip patterns Frequency of orders In the sales database, one order authorizes one or more passengers traveling together. The number of distinct OrderIDs under each exclusive ClientID reflects the client s level of buying activities. Note that this is not the travel frequency because it is uncertain whether this client buys tickets for himself/herself or the others. However, it can reflect passenger travel frequency in an indirect way. Here only the clients who buy their tickets by web or mobile phones are counted because those who buy their tickets directly from the agents are considered as new clients each time they purchase their tickets. In the present investigation, the order frequency is calculated successively for the whole network and the Quebec Montreal - Montreal Trudeau Airport corridor. The results are shown in Figure 5.25.
152 130 Number of orders per month - Network Number of orders per month - QUE-MTR 87% 13% 8% 3% 2% 83% 17% 10% 4% 3% Figure 5.25: Number of orders per month in April 2016 For the whole intercity network, one order per month dominates the intercity travel frequency at 87%. Only 13% of registered clients order more than once per month. This confirms that the frequency of intercity travel by bus is quite low. For the Quebec-Montreal-Montreal Trudeau Airport corridor, the proportion of passengers who order more than once per month is 4% higher. This implies a more frequently travel demand between the two largest cities in Quebec. Some orders reserved by companies may also contribute to this difference. Indeed, the administration department of a company may frequently order for their employees Accompaniment According to the frequently asked questions published on Keolis website (Keolis, 2017), each ticket is personalized and is only reserved to the passenger identified on it. Thus, it is possible to know how many passengers travel together by looking at how many distinct PassengerIDs are under the same Order ID. This is only for the case that a single person buys all the tickets for others. The result might underestimate those who travel together but order separately, especially between friends. The results of the accompaniments for the network and the Quebec - Montreal - Montreal Trudeau Airport corridor are shown in Figure 5.26.
. For the Quebec-Montreal-Montreal Trudeau Airport corridor, the proportion of 2-people groups is slightly higher at 10%.")
153 131 Figure 5.26: Accompaniment As shown in Figure 5.26, at the system level, 91% of the intercity bus passengers order only for one person while 8% travel by groups of 2 persons in April Very few passengers travel by groups of 3 persons or more (only 1% in total). For the Quebec-Montreal-Montreal Trudeau Airport corridor, the proportion of 2-people groups is slightly higher at 10%. Accordingly, passengers traveling alone decrease by 2%. As illustrated before, many passengers travel between Quebec and Montreal for the weekends. Thus, it is normal that a higher proportion of passengers travel with someone else. One of the limitations of these results is that all the calculations are based on the tickets orders. Thus, one person may pay for all the passengers traveling together. However, this event is often linked to family travels, or business travels paid directly by companies. This result might underestimate those who travel together but make their orders separately, especially between friends Weather effects The weather can significantly affect travels. Unlike urban travels where passengers buy or validate the tickets just before their departures, intercity travel passengers are recommended to reserve their tickets in advance. Thus, passengers cannot fully predict the weather. Figure 5.27 shows the rate of modified and refunded ticket rates from February 2016 to April 2016.
154 132 Figure 5.27: Daily ticket modify and refund rate It can be seen from Figure 5.27 that there is a significantly high proportion of tickets modified and refunded on March 2 nd, The ticket change rate is about 19% compared to the average modify rate of 9%, and the ticket refund rate is about 2.6% compared to an average of 0.9%. A significant weather impact that affects intercity travel was the snow in Quebec on that day. There was the heaviest snow storm of the year with more than 30 centimeters in some regions of Quebec on this date (Government of Canada, 2017). Some highways were closed due to the snow storm, and some lines operated by Keolis were canceled. Therefore, a high proportion of tickets has been modified or refunded Cost 91.2% of the total fare revenue come from Keolis operated network since Keolis also sells tickets for lines operated by its partner carriers. Among all the lines operated by Keolis, 3 lines accounted for 92% of the total fare revenue. The most profitable line, Express Montreal-Quebec, owns 67% of the total fare revenue (see Figure 5.28).

155 133 OEXP64 MTL/QUE-RMK 15% Proportion of fare revenue OEXP41 MTL-TRI-QUE 10% OEXP49 MTL-MTR 2% Other 8% OEXP60 RMK-GRI 2% OEXP68 GAS-RMK 1% OEXP48 MTL-QUE 67% OEXP10 MTL-VIC 3% OEXP48 MTL-QUE OEXP64 MTL/QUE-RMK OEXP41 MTL-TRI-QUE OEXP10 MTL-VIC OEXP60 RMK-GRI OEXP49 MTL-MTR OEXP68 GAS-RMK Figure 5.28: Proportion of fare revenue The proportion of ridership is relatively similar to the share of fare revenues, as it could have been expected. However, there are some slight differences. Line 48 Montreal-Quebec and Line 64 have a slightly higher proportion of fare revenue (more than 3%), while Lines 10, 49, and 41 have a slightly lower proportion of fare revenue (about 3%) compared to their share of ridership. The price of intercity travel is generally distance-based since the distances traveled change substantially from one trip to another. Figure 5.29 shows the average price paid per passengerkilometer. The values are calculated by the total fare revenue of each line divided by the total passenger-kilometers traveled in both directions.
156 Operational lines in both directions 134 Average cost per passenger per kilometer OEXP48 MTL-U Laval OEXP48 U Laval-MTL OEXP48 Express MTL-QUE OEXP48 Express QUE-MTL OEXP41 MTL-TRI-QUE OEXP41 QUE-TRI-MTL OEXP64 MTL/QUE-RMK OEXP64 RMK-MTL/QUE OEXP10 MTL-DRU-VIC OEXP10 VIC-DRU-MTL OEXP49 MTL-MTR OEXP49 MTR-MTL OEXP60 RMK-GRI OEXP60 GRI-RMK OEXP68 RMK-GAS OEXP68 GAS-RMK Average price per passenger-km - peak days Average price per passenger-km - off peak days $ Linear (Network average price per passenger-km - off peak days) Linear (Network average price per passenger-km - peak days) Figure 5.29: Average cost per passenger per kilometer The average network price per passenger-kilometer is $ 0.15, regardless of peak days or off-peak days. Both directions show almost identical pricing. Line 64 Montreal Quebec - Rimouski, Line 60 Rimouski - Grande-Rivière, and Line 68 Rimouski - Gaspé have a price per kilometer close to the average value. Line 49 Montreal - Montreal Trudeau Airport has the lowest price per kilometer at about $ , which is almost 60% of the average price. This may be because this line is only an extension of Line 48, and every passenger on board must take another line to access this extra service. Line 41 Montreal - Trois-Rivières - Quebec and Line 10 Montreal - Victoriaville have the highest prices, with respectively $ 0.18 and $ 0.19 per kilometer. The Line 48 Express Montreal - Quebec has a slight price difference between peak days and off-peak days. The lower price per kilometer on peak days is probably due to a higher ridership to attract more passengers and balance the loads between days. There is an extra service on peak days for students, who can benefit from a reduced price for about $ per kilometer. As stated in Chapter 1, Keolis offers variable price rates for the Montreal -Quebec corridor. Thus, for this corridor, apart from the distance-based price, other factors may also affect the final price that a passenger pays, such as journey type, passenger type, reservation in advance, and time of departure over one day. There are 4 types of passengers who can benefit from different levels of
157 Average price in dollars 135 price reductions: senior persons (60+), students, children (0-4), and children (5-12). Note that as the passenger type is not completely recorded in the database, a comprehensive analysis of this factor is not possible. Hence, this study mainly focuses on how the journey type, the reservation in advance, and the time of departure over one day affect the average price. The special services of University Laval are not included either. Figure 5.30 shows the average fare paid along Line 48 Express Montreal-Quebec for different travel times in both directions. Figure 5.31 and Figure 5.32 show the relationship among the average fare paid, the number of passengers, and the reservation days in advance. They are separately analyzed for one-way trips and round-trips Average price paid over time Monday Tuesday Wednesday Thursday Friday Saturday Sunday OEXP48 MTL-QUE OEXP48 QUE-MTL Figure 5.30: Average fare paid over time As seen in Figure 5.30, the fare variability is less significant than the ridership. The average fares on Fridays, Saturdays, and Sundays are slightly lower than for the rest of days. This may be because Keolis proposes a lower price on weekends to attract more passengers. Within one day, there are three time periods with a higher average ticket price: in the early morning before 7:00, in the early afternoon between 13:00 and 15:00, and in the evening between 18:00-19:00. This is probably linked to the lower elasticity of the passengers traveling during these three time periods. As discussed in the previous chapters, it is observed that many same-day round-trip passengers and the passengers who spend their weekends at the destinations travel at these time periods. The fare variability is not totally in accordance with the ridership of this line presented in Chapter 4. For example, the highest demand time periods are at 15:00 from Montreal to Quebec and at 12:30 from Quebec to Montreal. However, the price is not significantly high in these periods. This is probably due to the integrate fixed price proposed by Keolis since these transfer passengers take a longer distance with the same network. There is a clear price difference between the two directions. From
158 Average price in dollars Daily number of reservations Average price in dollars Daily number of reservations 136 Quebec to Montreal, higher average prices are observed in the morning, while for the reverse direction the average price in the morning is generally lower Price and reservation in advance - one-way trips d 1 d 2 d 3 d [4-7 d] (7-14 d] (14-30 d] (1-2 m] (2-3 m] (3-6 m] (6 m+) Price No. of reservations Reservation advance days 0 Figure 5.31: Average fare and number of reservations in advance one-way trips Price and reservation in advance - round-trips d 1 d 2 d 3 d [4-7 d] (7-14 d] (14-30 d] (1-2 m] (2-3 m] (3-6 m] (6 m+) Price No. of reservations Reservation advance days Figure 5.32: Average fare and number of reservations in advance round-trips We can see from Figure 5.31 and Figure 5.32 that the average price of a round-trip ticket is not much lower than the one-way tickets on typical days. This is probably due to the 20% reduction is only applicable to the typical full price tickets. There might be a lot of discount tickets bought without an extra reduction. As for the variations of reservations in advance, higher average prices are paid when orders are taken within 3 days in advance (about $45 within 3 days compared to about $35). Average low prices are found when the passengers make reservations between 3 days until 3 months in advance

159 137 for one-way trips and between 4 days and 2 months in advance for round-trips. A relatively higher average price is observed for round-trip tickets with reservations advanced for more than 2 months. This could probably be explained by the fact that passengers without a definite return date take a later date and then make modifications when necessary. These tickets are bought at the full price in order to get the flexibility in modification or refunding. Finally, even though passengers are recommended to reserve their tickets earlier to benefit a lower price, many passengers still reserve their tickets at the same day of departure (68% for one-way trip passengers and 28% for round-trip passengers) Order The sales database also contains information on the method of order (by the web, agent, or mobile phone) and the order status. The statistics of the practices with which passengers order and maintain their tickets are shown in Figure Figure 5.33: Distribution of the method of reserving the ticket As shown in Figure 5.33, 67% of the orders are taken by agents and 32% by the web. Only 1% are taken by mobile phone. This indicates that buying the ticket directly from the agents is still the most used method, and the online purchasing of tickets is becoming more common. Only a small proportion of passengers use their mobile phones to reserve the tickets. This might because
HOLA SAFETY RING PLAN
 FRENCH VERSION ON PAGE 3 HOLA SAFETY RING PLAN PRICE: $50.00 per person EFFECTIVE FEBRUARY 01, 2019 The Hola Safety Ring Plan allows you to cancel your trip with a refund up to 3 days before departure
Développement d Application & interface Web-BDD
 Développement d Application & interface Web-BDD - Final Internship Defense - Master2 Computer Sciences Dpt. Mathematics & Computer Sciences Univeristy of La Réunion 23 juin 2015 1 / 25 Toward the university
GUIDE D INSTALLATION PVC CELLULAIRE
 GUIDE D INSTALLATION PVC CELLULAIRE 7 5 3 4 1 2 6 8 NOTES IMPORTANTES Travailler toujours de gauche à droite, de bas en haut. Utiliser des vis en acier inoxidable #8 x 1.5 (3,8 cm) à tous les 16 /40,64
Dangerous Goods Handling and Règlement sur la manutention et le transport
 THE DANGEROUS GOODS HANDLING AND TRANSPORTATION ACT (C.C.S.M. c. D12) LOI SUR LA MANUTENTION ET LE TRANSPORT DES MARCHANDISES DANGEREUSES (c. D12 de la C.P.L.M.) Dangerous Goods Handling and Règlement
A structuring public transport project for Cape Town Inner City
 A structuring public transport project for Cape Town Inner City Dave EADIE Transport, Roads & Storm Water Directorate / City of Cape Town South Africa Pierre LABORDE Thales Engineering & Consulting France
Baku, Azerbaijan November th, 2011
 Baku, Azerbaijan November 22-25 th, 2011 Overview of the presentation: Structure of the IRTS 2008 Main concepts IRTS 2008: brief presentation of contents of chapters 1-9 Summarizing 2 1 Chapter 1 and Chapter
PREFACE. Service frequency; Hours of service; Service coverage; Passenger loading; Reliability, and Transit vs. auto travel time.
 PREFACE The Florida Department of Transportation (FDOT) has embarked upon a statewide evaluation of transit system performance. The outcome of this evaluation is a benchmark of transit performance that
SCADE for AIRBUS critical avionics systems
 SCADE Users Conference October 2009 Presented by Jean-Charles DALBIN Airbus Operations SAS SCADE for AIRBUS critical avionics systems Scade Users Conference 2009 Agenda Airbus Context SCADE use Automatic
SAMTRANS TITLE VI STANDARDS AND POLICIES
 SAMTRANS TITLE VI STANDARDS AND POLICIES Adopted March 13, 2013 Federal Title VI requirements of the Civil Rights Act of 1964 were recently updated by the Federal Transit Administration (FTA) and now require
1. Configurez votre Stick Up Cam Wired dans l application Ring.
 Stick Up Cam Wired 1. Configurez votre Stick Up Cam Wired dans l application Ring. Téléchargez l application Ring. L application vous guide dans la configuration et l utilisation de votre Stick Up Cam
Roll Up 28. Ref A. DE Anleitung FR Notice ES Manual PT Instruções PL Instrukcja RU Руководство CS Návod
 Roll Up 28 WT Ref. 5122117A DE Anleitung FR Notice ES Manual PT Instruções PL Instrukcja RU Руководство CS Návod Copyright 2013 Somfy SAS. All rights reserved - V1-02/2013 1 Sommaire 1. Informations préalables
HOUSEHOLD TRAVEL SURVEY
 HOUSEHOLD TRAVEL SURVEY Household Travel Survey i TABLE OF CONTENTS Page 1.0 INTRODUCTION... 1 2.0 SUMMARY OF TRAVEL... 2 2.1 All-Day Travel Patterns... 2 2.1.1 Automobile Availability... 2 2.1.2 Trip
Effects of the Nile damming on Alexandria coastal waters Effets du barrage du Nil sur la qualité des eaux côtières d Alexandrie
 Effects of the Nile damming on Alexandria coastal waters Effets du barrage du Nil sur la qualité des eaux côtières d Alexandrie Mohamed A. Said and Ahmed A. Radwan National Institute of Oceanography &
MODAIR. Measure and development of intermodality at AIRport
 MODAIR Measure and development of intermodality at AIRport M3SYSTEM ANA ENAC GISMEDIA Eurocontrol CARE INO II programme Airports are, by nature, interchange nodes, with connections at least to the road
GLOBAL BUSINESS COMMUNICATION (FRENCH)
") VOCATIONAL WJEC Level 1 / Level 2 Vocational Award in GLOBAL BUSINESS COMMUNICATION (FRENCH) REGULATED BY OFQUAL DESIGNATED BY QUALIFICATIONS WALES SAMPLE ASSESSMENT MATERIALS - EXTERNAL Teaching from
VOCATIONAL WJEC Level 1 / Level 2 Vocational Award in GLOBAL BUSINESS COMMUNICATION (FRENCH) REGULATED BY OFQUAL DESIGNATED BY QUALIFICATIONS WALES SAMPLE ASSESSMENT MATERIALS - EXTERNAL Teaching from
HOW TO IMPROVE HIGH-FREQUENCY BUS SERVICE RELIABILITY THROUGH SCHEDULING
 HOW TO IMPROVE HIGH-FREQUENCY BUS SERVICE RELIABILITY THROUGH SCHEDULING Ms. Grace Fattouche Abstract This paper outlines a scheduling process for improving high-frequency bus service reliability based
SOMMAIRE WORK IN SAS MODE BORDEAUX OR ST NAZAIRE CAN TAKE 3 TABLES OF 4 AGENTS ONE LEADER PER TABLE 10. BOOK A CAR 1.
 CONCUR USER GUIDE 1 SOMMAIRE 1. PROFILE UPDATE 2. AIR TICKET BOOKING 3. AIR TICKET BOOKING SUSCRIBER FARES SEARCH 3 TABLES OF 4 AGENTS 4. AIR TICKET BOOKING WITH APPROVAL 5. TRAIN TICKET BOOKING BY PRICE
Thermographie, pourquoi l utiliser?
 Thermographie, pourquoi l utiliser? Manny Alsaid FLIR Systems Jacques Wagner MultiPro Plus = 3,600 Thermomètre IR Thermometre IR La zone de mesure Distance au cible Ce quoi l infrarouge? Voir la réalité
METROBUS SERVICE GUIDELINES
 METROBUS SERVICE GUIDELINES In the late 1990's when stabilization of bus service was accomplished between WMATA and the local jurisdictional bus systems, the need for service planning processes and procedures
1.0 BACKGROUND NEW VETERANS CHARTER EVALUATION OBJECTIVES STUDY APPROACH EVALUATION LIMITATIONS... 7
 New Veterans Charter Evaluation Plan TABLE CONTENTS Page 1.0 BACKGROUND... 1 2.0 NEW VETERANS CHARTER EVALUATION OBJECTIVES... 2 3.0 STUDY APPROACH... 3 4.0 EVALUATION LIMITATIONS... 7 5.0 FUTURE PROJECTS...
APPENDIX B COMMUTER BUS FAREBOX POLICY PEER REVIEW
 APPENDIX B COMMUTER BUS FAREBOX POLICY PEER REVIEW APPENDIX B COMMUTER BUS FAREBOX POLICY PEER REVIEW The following pages are excerpts from a DRAFT-version Fare Analysis report conducted by Nelson\Nygaard
Hydrological role of avalanches in the Caucasus. M. Ch. Zalikhanov
 now and Ice-ymposium-eiges et Glaces (Proceedings of the Moscow ymposium, August 1971; Actes du Colloque de Moscou, août 1971): IAH-AIH Publ. o. 104, 1975. Hydrological role of avalanches in the Caucasus
This leaf is green Are you? Yes. Forum d été Supply Chain Magazine 2015 «Green Supply Chain» Jeudi 9 juillet p. 1
 This leaf is green Are you? Yes Forum d été Supply Chain Magazine 2015 «Green Supply Chain» Jeudi 9 juillet 2015! p. 1 Réduire l empreinte carbone des activités transport et logistique de la supply chain
WELCOME TO ALL OUR VOLVO S AMATEURS FRIENDS
 WELCOME TO ALL OUR VOLVO S AMATEURS FRIENDS For the first time since its creation, this 9th IVM will take place in France. Through this opportunity the Volvo Club of France who is getting settling this
LA Metro Rapid - Considerations in Identifying BRT Corridors. Martha Butler LACMTA, Transportation Planning Manager Los Angeles, California
 LA Metro Rapid - Considerations in Identifying BRT Corridors Martha Butler LACMTA, Transportation Planning Manager Los Angeles, California LA Metro Transportation planner/coordinator, designer, builder
DRAFT Service Implementation Plan
 2017 Service Implementation Plan October 2016 SECTION NAME 2017 Service Implementation Plan October 2016 2017 SERVICE IMPLEMENTATION PLAN TABLE OF CONTENTS Table of Contents... I List of Tables... III
Tourism Satellite Accounts : The Demand Perspective Concepts and Definitions Tourism Expenditure and Tourism Consumption
 Tourism Satellite Accounts : The Demand Perspective Concepts and Definitions Tourism Expenditure and Tourism Consumption Demi Kotsovos Satellite Accounts and Special Studies National Economic Accounts
The Nation Municipality Municipalité de La Nation. Budget 2007 Presented on May 7th Présenté le 7 mai
 The Nation ity ité de La Nation Budget 27 Presented on May 7th Présenté le 7 mai Budget Process /Procédure de la planification budgétaire Request to all heads of department to submit their budget for Dec
REVIEW OF THE STATE EXECUTIVE AIRCRAFT POOL
 STATE OF FLORIDA Report No. 95-05 James L. Carpenter Interim Director Office of Program Policy Analysis And Government Accountability September 14, 1995 REVIEW OF THE STATE EXECUTIVE AIRCRAFT POOL PURPOSE
Index. TerraPorte 7600 & accessable
 TerraPorte 7600 & accessable Out-Swing / Ouverture Extérieure Thermally broken frame with superior air / water performance. Rain screen design and multi-point locking ideal for residential and condominium
Dr. Dimitris P. Drakoulis THE REGIONAL ORGANIZATION OF THE EASTERN ROMAN EMPIRE IN THE EARLY BYZANTINE PERIOD (4TH-6TH CENTURY A.D.
 Dr. Dimitris P. Drakoulis THE REGIONAL ORGANIZATION OF THE EASTERN ROMAN EMPIRE IN THE EARLY BYZANTINE PERIOD (4TH-6TH CENTURY A.D.) ENGLISH SUMMARY The purpose of this doctoral dissertation is to contribute
0000 NAME: P.C.: L7C1J6 CONTACT: If necessary, please update above information - Si nécessaire, veuillez mettre à jour les renseignements ci-dessus
 Building and demolition folders Monthly Report Permis de construction et de démolition Rapport mensuel 1 0000 NAME: The Corporation of the Town of Caledon STATUS: T ADDRESS: CITY: 6311 Old Church Road
5 Rail demand in Western Sydney
 5 Rail demand in Western Sydney About this chapter To better understand where new or enhanced rail services are needed, this chapter presents an overview of the existing and future demand on the rail network
MONACO GRAND PRIX MAY 23TH TO 26TH 2019
 Columbus Monte-Carlo is a true one-off, part of the fabric of vibrant Monaco, with the location, views, and cool, relaxed sophistication to match. Reception open 4H. Conciergerie. Onsite parking with porter/valet
Index. RainBlade 1970
 Interior glazed, full rainscreen design with bull nose profile Vitrer de l'intérieur avec écran pare pluie et profilé avec un nez Index Primary components Composantes principales Thermal Simulation chart
BANQUE DE DONNEES MINIERES DU GROUPE DES ETATS ACP
 BANQUE DE DONNEES MINIERES DU GROUPE DES ETATS ACP 4 de la base de données Toutes les informations sont stockées dans une base de données et peuvent être mises à jour. Le présent site Internet n est pas
Airport Monopoly and Regulation: Practice and Reform in China Jianwei Huang1, a
 2nd International Conference on Economics, Management Engineering and Education Technology (ICEMEET 2016) Airport Monopoly and Regulation: Practice and Reform in China Jianwei Huang1, a 1 Shanghai University
Measure 67: Intermodality for people First page:
 Measure 67: Intermodality for people First page: Policy package: 5: Intermodal package Measure 69: Intermodality for people: the principle of subsidiarity notwithstanding, priority should be given in the
ARRIVAL CHARACTERISTICS OF PASSENGERS INTENDING TO USE PUBLIC TRANSPORT
 ARRIVAL CHARACTERISTICS OF PASSENGERS INTENDING TO USE PUBLIC TRANSPORT Tiffany Lester, Darren Walton Opus International Consultants, Central Laboratories, Lower Hutt, New Zealand ABSTRACT A public transport
SUSTAIN: A Framework for Sustainable Aviation
 SUSTAIN: A Framework for Sustainable Aviation Ted Elliff Research Area Manager, Society, Environment & Economy 1 SEMANTICS (1) The Oxford English Dictionary defines sustainable as follows: sustainable
2015 Independence Day Travel Overview U.S. Intercity Bus Industry
 2015 Independence Day Travel Overview U.S. Intercity Bus Industry Chaddick Institute for Metropolitan Development, DePaul University June 25, 2015 This Intercity Bus Briefing summarizes the Chaddick Institute
Recreational Services Plan. Gatineau Park. Phase 1: Planning Framework
 Recreational Services Plan Gatineau Park Phase 1: Planning Framework 1 Plan Planning in Gatineau Park Gatineau Park : an overview Trends Preliminary assessment Strategic framework 2 Unique natural and
GENE-AUTO Status of new Airbus case Studies
 GENEAUTO 9/29/2009 Presented by Jean-Charles DALBIN Airbus Operations SAS & Laurent DUFFAU Airbus Operations SAS GENE-AUTO Status of new Airbus case Studies Airbus Operation SAS - GENEAUTO Status on Airbus
Peer Performance Measurement February 2019 Prepared by the Division of Planning & Market Development
 2017 Regional Peer Review Peer Performance Measurement February 2019 Prepared by the Division of Planning & Market Development CONTENTS EXECUTIVE SUMMARY... 3 SNAPSHOT... 5 PEER SELECTION... 6 NOTES/METHODOLOGY...
Gold Coast. Rapid Transit. Chapter twelve Social impact. Chapter content
 Gold Coast Rapid Transit Chapter twelve Social impact Chapter content Social impact assessment process...235 Existing community profile...237 Consultation...238 Social impacts and mitigation strategies...239
TWENTY-SECOND MEETING OF THE ASIA/PACIFIC AIR NAVIGATION PLANNING AND IMPLEMENTATION REGIONAL GROUP (APANPIRG/22)
") INTERNATIONAL CIVIL AVIATION ORGANIZATION TWENTY-SECOND MEETING OF THE ASIA/PACIFIC AIR NAVIGATION PLANNING AND IMPLEMENTATION REGIONAL GROUP (APANPIRG/22) Bangkok, Thailand, 5-9 September 2011 Agenda
INTERNATIONAL CIVIL AVIATION ORGANIZATION TWENTY-SECOND MEETING OF THE ASIA/PACIFIC AIR NAVIGATION PLANNING AND IMPLEMENTATION REGIONAL GROUP (APANPIRG/22) Bangkok, Thailand, 5-9 September 2011 Agenda
The Role of Gauteng in South Africa s Backpacking Economy
 The Role of Gauteng in South Africa s Backpacking Economy Jonathan Brandon Mograbi Dissertation submitted to the Faculty of Science of the University of the Witwatersrand, Johannesburg, in fulfilment of
2 YORK REGION TRANSIT MOBILITY PLUS 2004 SYSTEM PERFORMANCE REVIEW
 2 YORK REGION TRANSIT MOBILITY PLUS 2004 SYSTEM PERFORMANCE REVIEW The Joint Transit Committee and Rapid Transit Public/Private Partnership Steering Committee recommends the adoption of the recommendation
Att. A, AI 46, 11/9/17
 Total s San Diego Metropolitan Transit System POLICY 42 PERFORMANCE MONITORING REPORT Page 1 of 6 Date: 11/8/17 OBJECTIVE Develop a Customer-Focused and Competitive System The following measures of productivity
MODAIR: Measure and development of intermodality at AIRport. INO WORKSHOP EEC, December 6 h 2005
 MODAIR: Measure and development of intermodality at AIRport INO WORKSHOP EEC, December 6 h 2005 What is intermodality? The use of different and coordinated modes of transports for one trip High Speed train
Introduction, Etat des lieux, Illustration clinique, Perspectives, Conclusion. 2 ème Colloque Francophone de Pratiques en TCC-Cynthia Acca (2018) 2
 2") Introduction, Etat des lieux, Illustration clinique, Perspectives, Conclusion. 2 Efficacité parfois limitée troubles anxieux. des TCC pour certains Certains troubles très invalidants (en terme d intensité
Introduction, Etat des lieux, Illustration clinique, Perspectives, Conclusion. 2 Efficacité parfois limitée troubles anxieux. des TCC pour certains Certains troubles très invalidants (en terme d intensité
Aviation Civil Aviation, Quarterly Operating and Financial Statistics, Canadian Air Carriers, Levels I and II
 Catalogue no. 51-004-X Vol. 49, no. 8. Aviation Civil Aviation, Quarterly Operating and Financial Statistics, Canadian Air Carriers, Levels I and II First Quarter 2015 to Fourth Quarter 2015. Highlights
Macro-economic data of Balneotherapy in Europe
 Macro-economic data of Balneotherapy in Europe Presentation by Joachim Lieber Secretary General of ESPA 08. November 2013, Enghien-les-Bains (F) Macro-economic data of Balneotherapy in Europe In a scientific
2017/ Q1 Performance Measures Report
 2017/2018 - Q1 Performance Measures Report Contents Ridership & Revenue... 1 Historical Revenue & Ridership... 1 Revenue Actual vs. Planned... 3 Mean Distance Between Failures... 5 Maintenance Cost Quarter
The Effect of an Efficient Public Transport System on Poverty: Lessons for Johannesburg from Bogotá Eugenia Mpofu
 The Effect of an Efficient Public Transport System on Poverty: Lessons for Johannesburg from Bogotá Eugenia Mpofu A research report submitted to the Faculty of Engineering and the Built Environment: University
Proof of Concept Study for a National Database of Air Passenger Survey Data
 NATIONAL CENTER OF EXCELLENCE FOR AVIATION OPERATIONS RESEARCH University of California at Berkeley Development of a National Database of Air Passenger Survey Data Research Report Proof of Concept Study
Analysis of Transit Fare Evasion in the Rose Quarter
 Analysis of Transit Fare Evasion in the Rose Quarter Shimon A. Israel James G. Strathman February 2002 Center for Urban Studies College of Urban and Public Affairs Portland State University Portland, OR
How much did the airline industry recover since September 11, 2001?
 Catalogue no. 51F0009XIE Research Paper How much did the airline industry recover since September 11, 2001? by Robert Masse Transportation Division Main Building, Room 1506, Ottawa, K1A 0T6 Telephone:
ESPACE DES ONG / NGO SPACE 39 e session de la Conférence générale / 39 th session of the General Conference
 ESPACE DES ONG / NGO SPACE 39 e session de la Conférence générale / 39 th session of the General Conference Programme provisoire des activités / Preliminary Programme of Activities (ce programme est sujet
Evaluating Lodging Opportunities
 Evaluating Lodging Opportunities This section explores market opportunities for new lodging accommodations in the downtown area. It will help you understand travel and visitation trends, existing competition,
Empirical Studies on Strategic Alli Title Airline Industry.
 Empirical Studies on Strategic Alli Title Airline Industry Author(s) JANGKRAJARNG, Varattaya Citation Issue 2011-10-31 Date Type Thesis or Dissertation Text Version publisher URL http://hdl.handle.net/10086/19405
RE: Draft AC , titled Determining the Classification of a Change to Type Design
 Aeronautical Repair Station Association 121 North Henry Street Alexandria, VA 22314-2903 T: 703 739 9543 F: 703 739 9488 arsa@arsa.org www.arsa.org Sent Via: E-mail: 9AWAAVSDraftAC2193@faa.gov Sarbhpreet
TransAction Overview. Introduction. Vision. NVTA Jurisdictions
 Introduction Vision NVTA Jurisdictions In the 21 st century, Northern Virginia will develop and sustain a multimodal transportation system that enhances quality of life and supports economic growth. Investments
SHIP MANAGEMENT SURVEY. January June 2018
 CENTRAL BANK OF CYPRUS EUROSYSTEM SHIP MANAGEMENT SURVEY January June 2018 INTRODUCTION The Ship Management Survey (SMS) is conducted by the Statistics Department of the Central Bank of Cyprus and concentrates
Public Transport funding in a crisis: A National Treasury perspective
 Public Transport funding in a crisis: A National Treasury perspective Presented by: Marissa Moore: Chief Director, Urban Development and Infrastructure Public Finance 28 February 2013 Overview Public transport
CURRENT SHORT-RANGE TRANSIT PLANNING PRACTICE. 1. SRTP -- Definition & Introduction 2. Measures and Standards
 CURRENT SHORT-RANGE TRANSIT PLANNING PRACTICE Outline 1. SRTP -- Definition & Introduction 2. Measures and Standards 3. Current Practice in SRTP & Critique 1 Public Transport Planning A. Long Range (>
Transit System Performance Update
 Clause 5 in Report No. 4 of Committee of the Whole was adopted, without amendment, by the Council of The Regional Municipality of York at its meeting held on March 29, 2018. 5 2017 Transit System Performance
THE WORLD IS YOURS. Formations linguistiques & interculturelles
 THE WORLD IS YOURS Formations linguistiques & interculturelles 11 langues, plus de 160 cultures et de nombreuses thématiques managériales dans nos centres tout confort, au cœur de l Europe Un apprentissage
UNIT TITLE: CONSTRUCT AND TICKET DOMESTIC AIRFARES
 UNIT TITLE: CONSTRUCT AND TICKET DOMESTIC AIRFARES NOMINAL HOURS: UNIT NUMBER: UNIT DESCRIPTOR: This unit deals with skills and knowledge required to construct itineraries, cost airfares and issue documentation
Air Carrier E-surance (ACE) Design of Insurance for Airline EC-261 Claims
 Design of Insurance for Airline EC-261 Claims") Air Carrier E-surance (ACE) Design of Insurance for Airline EC-261 Claims May 06, 2016 Tommy Hertz Chris Saleh Taylor Scholz Arushi Verma Outline Background Problem Statement Related Work and Methodology
Air Carrier E-surance (ACE) Design of Insurance for Airline EC-261 Claims May 06, 2016 Tommy Hertz Chris Saleh Taylor Scholz Arushi Verma Outline Background Problem Statement Related Work and Methodology
WHEN IS THE RIGHT TIME TO FLY? THE CASE OF SOUTHEAST ASIAN LOW- COST AIRLINES
 WHEN IS THE RIGHT TIME TO FLY? THE CASE OF SOUTHEAST ASIAN LOW- COST AIRLINES Chun Meng Tang, Abhishek Bhati, Tjong Budisantoso, Derrick Lee James Cook University Australia, Singapore Campus ABSTRACT This
Interactive x-via web analyses and simulation tool.
 Interactive x-via web analyses and simulation tool. Scope of services: - Intra-modal analyses and simulation of the European air passenger transport - Provision of a reference case of the year n-1. - Representative
Session 47 Risks at work/risques au travail
 Session 47 Risks at work/risques au travail 14h Introduction : Philippe Minard et Catherine Omnès Experts et expertises : Jacob Fogel, Martin Lengwiller Discussion Les organisations professionnelles :
Call to Book:
 Call to Book: 1-844-862-8466 The Birthday Vacation Sale - now extended! There s still a little time to get Birthday Sale savings on the sunny escape you ve been craving. Choose from 45 amazing vacation
1. Acting Deputy City Manager s report, Planning and Infrastructure, dated 23 June 2015 (ACS2015-PAI-INF-0003).
.") 6 COMITÉ DES TRANSPORTS 2. WEST TRANSITWAY EXTENSION AT GRADE CROSSING AT MOODIE DRIVE PROLONGEMENT DU TRANSITWAY OUEST PASSAGE À NIVEAU DE LA PROMENADE MOODIE COMMITTEE RECOMMENDATION That Council approve
6 COMITÉ DES TRANSPORTS 2. WEST TRANSITWAY EXTENSION AT GRADE CROSSING AT MOODIE DRIVE PROLONGEMENT DU TRANSITWAY OUEST PASSAGE À NIVEAU DE LA PROMENADE MOODIE COMMITTEE RECOMMENDATION That Council approve
The Economic Impact of Tourism in North Carolina. Tourism Satellite Account Calendar Year 2015
 The Economic Impact of Tourism in North Carolina Tourism Satellite Account Calendar Year 2015 Key results 2 Total tourism demand tallied $28.3 billion in 2015, expanding 3.6%. This marks another new high
ARRIVING SHIPS - TANKERS, TRAWLERS / ENTREE DE NAVIRES - BATEAUX-CITERNES, CHALUTIERS
 Table / Tableau 2.4.3 MARITIME TRANSPORT ARRIVING SHIPS - TANKERS, TRAWLERS / ENTREE DE NAVIRES - BATEAUX-CITERNES, CHALUTIERS Country / Pays Of which / Dont : Total number of ships / Nombre de navires
RAPPORT DE TEST DE / TEST REPPORT BY. 01-mars-12. BOYER Marc. Date MODELE / MODEL DIAMIR MARQUE / MANUFACTORY NERVURES
 RPPORT DE TEST DE / TEST REPPORT BY BOYER Marc Date 01-mars-12 MRQUE / MNUFCTORY NERVURES MODELE / MODEL DIMIR Procédure Poids min / min PTV 70 kg TILLE /SIZE S HRNIS SUP IR weight EVO XC2 TYPE abs VENTRLE
Fixed-Route Operational and Financial Review
 Chapter II CHAPTER II Fixed-Route Operational and Financial Review Chapter II presents an overview of route operations and financial information for KeyLine Transit. This information will be used to develop
5QC - The citizen at the heart of public quality Paris, October 2008
 Doc 2_names_cases_V05_general.doc 1 September 2008 5QC - The citizen at the heart of public quality Paris, 20-22 October 2008 A. Facilitators & national case presenters: overview, organisation of the session
ANA Traffic Growth Incentives Programme Terms and Conditions
 ANA Traffic Growth s Programme Terms and Conditions 1. Introduction The ANA Traffic Growth s Programme (hereinafter referred to as the Programme) aims to stimulate the growth of commercial air traffic
Organisation de Coopération et de Développement Économiques Organisation for Economic Co-operation and Development
 Non classifié/unclassified EXD/CSD/W(2017)13 EXD/CSD/W(2017)13 Non classifié/unclassified Organisation de Coopération et de Développement Économiques Organisation for Economic Co-operation and Development
Assessment of Travel Trends
 I - 2 0 E A S T T R A N S I T I N I T I A T I V E Assessment of Travel Trends Prepared for: Metropolitan Atlanta Rapid Transit Authority Prepared by: AECOM/JJG Joint Venture Atlanta, GA October 2011 General
Kroll Bond Rating Agency, Inc.
 Kroll Bond Rating Agency, Inc. U.S Airports Harvey Zachem Senior Director September 7, 2014 KBRA Airport Rating Methodology Kroll Bond Rating Agency (KBRA) published its General Airport Revenue Bond (GARB)
1. CANADA DAY 2012 PARKING LOT PARTIES IN THE BYWARD MARKET FÊTE DU CANADA 2012 CÉLÉBRATIONS TENUES DANS LE PARC DE STATIONNEMENT DU MARCHÉ BY
 1 COMITÉ DES TRANSPORTS 1. CANADA DAY 2012 PARKING LOT PARTIES IN THE BYWARD MARKET FÊTE DU CANADA 2012 CÉLÉBRATIONS TENUES DANS LE PARC DE STATIONNEMENT DU MARCHÉ BY COMMITTEE RECOMMENDATIONS That Council
Tourism Satellite Account Calendar Year 2010
 The Economic Impact of Tourism in Georgia Tourism Satellite Account Calendar Year 2010 Highlights The Georgia visitor economy rebounded in 2010, recovering 98% of the losses experienced during the recession
FINEST LINK WP2 Appendix 2. Passenger volume estimation
 FINEST LINK WP2 Appendix 2. Passenger volume estimation Content Objectives and approach 3 9 Present situation 10 14 Preliminary train operating concept and land use projections 15 17 Trip type analysis
Date: 11/6/15. Total Passengers
 Total San Diego Metropolitan Transit System POLICY 42 PERFORMANCE MONITORING REPORT Page 1 of 6 OBJECTIVE Develop a Customer-Focused and Competitive System The following measures of productivity and service
Federal Subsidies to Passenger Transportation December 2004
 U.S. Department of Transportation Bureau of Transportation Statistics Federal Subsidies to Passenger Transportation December 2004 Federal Subsidies to Passenger Transportation Executive Summary Recent
I lf:,jo ~ S-o 3S9~75"97. ARRETE NO. Z lOZ. BY-LAW NO. Z lOZ. A by-law amending Zoning By-Law Z of the Town of Shediac
 BY-LAW NO. Z-14-44-lOZ A by-law amending Zoning By-Law Z-14-44 of the Town of Shediac WHEREAS the Council of the Town of Shediac has determined that it is in the public interest to amend the Zoning By
A GEOGRAPHIC ANALYSIS OF OPTIMAL SIGNAGE LOCATION SELECTION IN SCENIC AREA
 A GEOGRAPHIC ANALYSIS OF OPTIMAL SIGNAGE LOCATION SELECTION IN SCENIC AREA Ling Ruan a,b,c, Ying Long a,b,c, Ling Zhang a,b,c, Xiao Ling Wu a,b,c a School of Geography Science, Nanjing Normal University,
9 me Atelier du Club Display. Bienvenue
 9 me Atelier du Club Display Bienvenue Ordre du jour global Matin: 10h00 12h30 Vue sur l Europe Campagne de Communication en France Après-midi: 14h00 16h30 Affichage de posters avant/après t Financement
Word Count: 3,565 Number of Tables: 4 Number of Figures: 6 Number of Photographs: 0. Word Limit: 7,500 Tables/Figures Word Count = 2,250
 Katherine F. Turnbull, Ken Buckeye, Nick Thompson 1 Corresponding Author Katherine F. Turnbull Executive Associate Director Texas Transportation Institute Texas A&M University System 3135 TAMU College
8 CROSS-BOUNDARY AGREEMENT WITH BRAMPTON TRANSIT
 8 CROSS-BOUNDARY AGREEMENT WITH BRAMPTON TRANSIT The Transportation Services Committee recommends the adoption of the recommendations contained in the following report dated May 27, 2010, from the Commissioner
Civil Aviation, Annual Operating and Financial Statistics, Canadian Air Carriers, Levels I to III
 Catalogue no. 51-004-X Vol. 49, no. 4. Aviation Civil Aviation, Annual Operating and Financial Statistics, Canadian Air Carriers, Levels I to III 2015. Highlights In 2015, Canadian Level I to III air carriers
Civil Aviation, Monthly Key Operating Statistics, Major Canadian Air Carriers
 Catalogue no. 51-004-X Vol. 43, no. 1. Aviation Civil Aviation, Monthly Key Operating Statistics, Major Canadian Air Carriers January to December 2010. Highlights For the 12-month period, January to December
Paris: Tuesday 10 & Wednesday 11 April 2018
 15 th IARO Workshop Paris: Tuesday 10 & Wednesday 11 April 2018 A Dedicated Workshop offering participants the opportunity to learn more about the CDG Express Project and to share best-practice trends
CRITICAL FACTORS FOR THE DEVELOPMENT OF AIRPORT CITIES. Mauro Peneda, Prof. Rosário Macário AIRDEV Seminar IST, 20 October 2011
 CRITICAL FACTORS FOR THE DEVELOPMENT OF AIRPORT CITIES Mauro Peneda, Prof. Rosário Macário AIRDEV Seminar IST, 20 October 2011 Introduction Airports are becoming new dynamic centres of economic activity.
Figure 1.1 St. John s Location. 2.0 Overview/Structure
 St. John s Region 1.0 Introduction Newfoundland and Labrador s most dominant service centre, St. John s (population = 100,645) is also the province s capital and largest community (Government of Newfoundland
Executive Summary. MASTER PLAN UPDATE Fort Collins-Loveland Municipal Airport
 Executive Summary MASTER PLAN UPDATE Fort Collins-Loveland Municipal Airport As a general aviation and commercial service airport, Fort Collins- Loveland Municipal Airport serves as an important niche