|
|
|
- Chastity Townsend
- 6 years ago
- Views:
Transcription


1 Hamburg, October 30 th,2017 Hamburg, April 19th, 2017
2 TABLE OF CONTENTS 1. Overall trends in European business aviation activity 2. Geographical distribution of flight activity 3. Trends in fleet size and activity, by aircraft type 4. Mission split, AOC flight hours, Charter pricing trends 5. Estimated Empty Leg activity and trends 6. Distribution of flight activity by sector length 7. Activity trends at busiest European airports 8. Activity by domestic/international and arrivals/departures 9. Activity trends on top European city pairs 10. Trends in utilisation per aircraft unit/type 11. Trends in aircraft activity by aircraft register 12. Flight activity by operator fleet size 13. Operational costs: handling, fuel, passenger fees 14. Estimated total revenues generated, passengers transported 2
3 1. OVERALL TRENDS IN BUSINESS AVIATION ACTIVITY 154,410 business aviation flight departures from Europe in Q1 2017, marking a 5.3% YOY growth in activity. This was the 4 th consecutive quarterly growth, and an acceleration on last 12 month trend. Departures +1,9% ,6% ,3% -0,7% ,3% ,3% -0,7% Quarter 1 Quarter 2 Quarter 3 Quarter 4 YTD

4 2. GEOGRAPHICAL DISTRIBUTION OF FLIGHT ACTIVITY (a) Three countries each had >20K departures in Q1, France, Germany & UK, these markets generating most of the Q1 growth. Central Europe saw strongest growth. Also significant bounce-back in flights from Russia and Turkey. TOTAL EUROPE +5,3% QUARTERLY COUNTRY TRENDS DEPARTURES Q France Germany UK Switzerland Italy Spain Norway Sweden Turkey Austria Russia Netherlands Belgium Finland Czech Republic Poland Denmark Ireland Greece Portugal Ukraine Slovakia 922 Serbia and Montenegro 907 Luxembourg 902 Canary Island 891 Cyprus Romania Hungary Croatia Malta Azerbaijan Bulgaria 458 Slovenia 414 Latvia Kazakhstan,Kyrgyzstan Georgia Belarus 290 Iceland 261 Lithuania 237 Estonia 183 Bosnia and Herzegovina 163 Armenia 160 Gibraltar Macedonia Albania Tajikistan,Turkmenistan,Uzbekistan Moldova 48 Total
5 2. GEOGRAPHICAL DISTRIBUTION OF FLIGHT ACTIVITY (b) AOC flight activity was up >10% in the busiest 4 countries, the UK the busiest in Q1. Private activity trends more mixed, up in Germany, well down in Italy. Busiest air ambulance market in Q1 was Sweden. DEPARTURES / DISTRIBUTION: Q1 / 2017 AOC Ambulance Private Government/Military Other Origin=Destination Flights AOC QUARTERLY TRENDS Private Other France 44% 52% 4% Germany 42% 53% 5% UK 56% 40% Switzerland Spain 60% 32% 8% Norway 91% 6% 3% Sweden 48% 20% 32% Turkey Austria Russia Netherlands 40% 46% 14% Belgium 51% 42% 7% Finland Czech Republic 59% 33% 8% Poland 36% Denmark 48% 31% Ireland Greece Portugal Slovakia Serbia and Montenegro Canary Island Cyprus 39% 31% Romania 41% Hungary 49% Italy 51% 20% 46% 42% 35% 23% % Ukraine 49% 34% 18% 49% Luxembourg 38% 51% 11% % 65% 50% 42% 48% 36% 46% 47% 48% 5% Croatia 43% 51% 21% 31% 14% 11% 21% 65% 13% 10% 17% % Malta 41% 47% 12% 586 9% 5% 6% % 40% 4% % 47% 39% 36% 5% 4% 10% 15% % % 28% 3% ,7% -31,7% -0,9% -4,3% -0,3% 97,4% 2,6% 10,2% -0,6% 15,7% 15,4% -1,3% 11,9% -4,4% 8,4% -10,1% 6,3% 7,6% 17,8% 15,1% -1,2% 12,5% 25,5% -3,0% 12,5% -22,2% 18,2% 26,4% 2,2% 14,7% 16,1% -17,0% 13,4% -8,6% 38,8% 14,7% 8,4% 11,9% 19,3% 23,7% 80,6% 4,5% 7,1% 11,1% 9,7% 34,8% 1,9% 8,4% 7,0% 7,4% 6,4% 3,4% 10,2% 7,9% 14,0% 11,1% 9,6% 0,8% 7,3% 5,8% 3,0% 50,8% -4,2% -8,0% -8,8% -15,4% -10,5% -23,6% -9,3% -25,3% -4,3% -9,3% -18,9% -6,3% -25,8% -22,3% -17,2% -42,4% -14,0% 5,0% 4,5% 12,9% 28,5% 34,6% 13,8% 25,6% 6,8% 17,0% 19,2% 0,0% 20,8% 33,3% Top 30 Other 5
6 2. GEOGRAPHICAL DISTRIBUTION OF FLIGHT ACTIVITY (c) Small Jet activity saw the most consistent growth in Q1, notably in the top 3 markets, Germany the busiest. Medium Jet activity declined from most countries. Spain & Germany also saw strong growth in Large Jet flights. DEPARTURES / DISTRIBUTION: Q1 / 2017 QUARTERLY TRENDS Large Jets Medium Jets Small Jets Propeller Aircraft Large Jets Medium Jets Small Jets Propeller Aircraft France Germany Greece Portugal Ukraine Slovakia 24,5% 10,4% 40,9% Serbia and Montenegro 10,3% 4,9% 70,3% Luxembourg 11,3% 9,4% 50,6% Canary Island Cyprus Romania 29,5% 31,1% 42,1% 15,7% 64,4% 17,6% 30,0% 31,2% Hungary 16,2% 16,2% 35,9% Croatia Malta 13,4% 22,6% 8,7% 34,6% 34,0% 18,2% UK 30,1% Switzerland Italy Norway 6,0% 3,1% 6,4% Sweden 12,3% 6,2% Denmark 19,5% 9,0% 45,0% 27,8% ,7% 22,0% 12,2% 10,1% 48,0% 11,4% 12,8% 27,9% 11,2% 21,5% 33,5% 35,4% 19,3% 30,9% 25,8% 59,7% 33,5% 46,9% 36,2% 19,9% 39,8% 25,0% 24,2% 28,7% 25,5% 31,7% 20,3% 10,5% 8,1% 53,8% 27,6% 39,9% 13,5% 22,2% 24,4% 7,7% 14,6% 4,3% 11,8% 4,0% Turkey 45,5% 26,9% 21,3% 6,3% Austria Russia 70,5% 19,9% 9,0% 0,6% Netherlands 21,1% 10,3% 36,4% 32,1% Belgium 23,5% 6,8% 42,3% 27,4% Finland Czech Republic Poland Ireland 18,9% 14,6% 13,2% 31,5% 28,3% Spain 26,5% 37,6% 11,7% 26,1% 16,9% 49,3% 27,7% 35,0% 12,8% 36,7% 13,6% 37,9% 84,5% 55,4% 16,4% 19,3% 35,4% 39,4% 23,3% 22,0% 14,8% 16,1% 16,3% ,1% -3,2% -4,5% -10,8% -6,3% -8,9% -6,4% -7,1% 97,4% 2,6% -20,0% 5,1% -3,7% 15,0% 6,3% -2,5% -21,1% 18,2% 16,6% -13,0% 17,6% -8,8% 2,9% 4,7% 11,7% -0,6% 0,3% -21,8% -26,7% 9,8% -7,7% 34,4% -12,6% 9,3% -0,5% 17,3% 20,7% 3,0% -3,8% -11,9% 16,3% -17,0% 29,4% -15,1% 20,0% -20,8% 12,1% -3,8% 70,8% 10,4% 0,8% 7,3% -0,4% -3,4% 26,6% 6,0% 1,9% -0,8% -0,8% 7,5% 12,6% -5,0% 14,8% 4,9% 20,3% -10,1% -2,3% 12,0% 17,9% 11,7% -2,4% 10,3% 11,1% 7,3% 9,5% -2,8% 33,7% -4,5% 7,8% -2,3% 15,2% -2,7% 16,9% 5,9% 26,0% 5,1% -16,7% 4,4% 22,9% 1,4% 9,0% -51,5% 34,6% -2,6% 7,0% 4,3% 23,7% -5,7% 10,2% 28,2% -12,4% 12,1% 0,3% 5,3% 5,0% 5,8% 3,0% 36,8% 7,7% 0,7% 16,8% 14,9% 25,8% 23,7% 5,8% 1,9% 41,9% 0,0% 8,6% 44,1% 21,7% 197,9% Top 30 Other 6
7 3. TRENDS IN FLEET SIZE AND ACTIVITY, BY AIRCRAFT TYPE (a) Small Jet flights, 34% of total activity, were up 9% in Q1, despite a slightly smaller YOY active fleet (declining 1%). Large Jet activity increase was mainly generated by a larger active fleet. 136 fewer active Props YOY, flights still +2%. DEPARTURES / DISTRIBUTION / TRENDS ACTIVE AIRCRAFT TAILSIGNS / TRENDS Departures Q % of total Quarterly Trend Active Aircraft Tailsigns Q Quarterly Trend [based on active aircraft] Additions [+/-] Large Jets ,5% 6,6% ,3% 125 Medium Jets ,5% 0,1% 634-2,6% -17 Small Jets ,8% 9,2% ,0% -12 Propeller Aircraft ,1% 1,9% ,8% -136 Total Departures Europe ,0% 5,3% ,6% -40 Business Jet 6,7% Props Business Jet 2,0% 96 Jets 71,9% 28,1% Props Propeller Aircraft 1,9% Jets 72,4% 27,6% Propeller Aircraft -6,8% -136 Total 5,3% Total -0,6% -40 Note: *an aircraft is active if it operates a flight during the Quarter 7
8 3. TRENDS IN FLEET SIZE AND ACTIVITY, BY AIRCRAFT TYPE (b) All but MSJ & Piston segments increased YOY activity, notably VLJ sectors, 6% of all flights, up by 20% in Q1, supported by a 13% growth in the active VLJ fleet. The active business jet fleet in Q1 was 96 units larger YOY. DEPARTURES / DISTRIBUTION / TRENDS ACTIVE AIRCRAFT TAILSIGNS / TRENDS Departures Q % of total Quarterly Trend Active Aircraft Tailsigns Q Quarterly Trend [based on active aircraft] Additions [+/-] Bizliner ,1% 12,0% ,3% 66 Ultra Long Range ,1% 9,6% ,6% 67 Heavy jet ,3% 1,3% ,6% -8 Super midsize jet ,2% 6,0% 357 1,4% 5 Midsize jet ,3% -6,0% 277-7,4% -22 Super Light jet ,4% 5,6% 240-4,0% -10 Light Jet ,4% 10,2% 591-3,1% -19 Entry Level jet ,5% 0,3% 167-2,9% -5 Very Light jet ,5% 20,3% ,0% 22 Turboprop ,9% 3,8% ,0% -40 Piston ,2% -7,6% ,4% -96 Total Departures Europe ,0% 5,3% ,6% -40 Business Jet 6,7% Business Jet 2,0% 96 71,9% 28,1% Propeller Aircraft 1,9% 72,4% 27,6% Propeller Aircraft -6,8% -136 Total 5,3% Total -0,6% -40 Business Jet Propeller Aircraft Business Jet Propeller Aircraft 8
9 4. MISSION SPLIT, AOC FLIGHT HOURS, INDICATIVE CHARTER PRICING TRENDS 47% of all flight hours in Q1 were AOC, HJ segment generating most activity. SMJ, LJ & VLJ activity grew >10% YOY, with MSJ, ELJ & Piston FH well down. Average pricing per hour slightly declined in Q1. FLIGHT HOURS / DISTRIBUTION/ TRENDS AVG. PRICING / TRENDS 100% Commercial AOC Flight Hours Q % of total Quarterly Trend Avg. Price / Hr Quarterly Trend Ultra Long Range ,7% 18,0% ,4% Heavy jet ,1% 10,2% ,2% 47,0% Super midsize jet ,4% 16,5% ,2% Midsize jet ,9% -5,5% ,8% Super Light jet ,6% 3,6% ,4% Light Jet ,6% 17,8% ,2% Entry Level jet ,9% 19,9% ,1% 46,1% Very Light jet ,5% 13,0% ,9% Turboprop ,8% 13,9% ,2% Piston ,4% -11,2% ,8% 1,8% 2,8% 2,4% Total Flight Hours Europe ,0% 11,2% Total Flight Hours Q AOC Business Jet 11,3% Private Ambulance 85,8% 14,2% Propeller Aircraft 10,7% Government/Military "Origin = Destination Flights" [e.g Training] Total 11,2% Note: Bizliners excluded AOC: Aircraft Operating Certificate; certified to provide Charter Business Jet Propeller Aircraft 9
10 5a. ESTIMATED EMPTY LEG [EL] ACTIVITY - DEPARTURES [BUSINESS JETS AOC ONLY] An estimated 58% of AOC sectors in Q1 were passenger-occupied, with the 22K empty legs concentrated around SLJ & LJ activity. YOY, the declining MSJ & ELJ activity was reflected in a drop in empty legs in these segments. BUSINESS JET DEPARTURES Q1 / 2017 EMPTY LEGS / DISTRIBUTION/ TRENDS 100% % Empty Legs: Departures Q % of total empty legs within segment Quarterly Trend Additions (+/-) Ultra Long Range ,7% 10,8% ,4% Heavy jet ,7% 2,3% 71 56,0% Super midsize jet ,1% 18,9% 296 Midsize jet ,6% -13,9% -296 Super Light jet ,2% 6,8% 246 Light Jet ,4% 17,0% ,6% 39,1% Entry Level jet ,8% 4,8% 46 Very Light jet ,6% 19,0% 315 1,5% 1,1% 2,2% Total Empty Legs Europe ,4% 8,6% Total Departures Q AOC activity AOC Private Ambulance Empty Pax occupied Government/Military "Origin = Destination Flights" [e.g Training] Note: Bizliner excluded 10
11 5b. ESTIMATED EMPTY LEG [EL] ACTIVITY - HOURS [BUSINESS JETS AOC ONLY] In terms of FH, the empty leg ratio was far lower, an estimated 16% of AOC FH in Q1. Small Jet segments has around 20% EL ratio, Large Jets closer to 10%. SMJ ELs showed a large YOY increase in Q1. BUSINESS JET HOURS Q1 / 2017 EMPTY LEGS / DISTRIBUTION/ TRENDS 100% % Empty Legs: Flight Hours Q % of total empty legs within segment Quarterly Trend Additions (+/-) 14,7% Ultra Long Range ,4% 9,3% 97 Heavy jet ,6% 2,6% 50 52,4% Super midsize jet ,3% 20,2% 196 Midsize jet ,4% -15,9% -211 Super Light jet ,7% 7,2% ,3% Light Jet ,2% 17,0% ,8% Entry Level jet ,1% 8,5% 48 Very Light jet ,1% 20,9% 220 1,7% 0,9% 2,3% Total Empty Legs Europe [hours] ,7% 8,8% Total Flight Hours Q AOC activity AOC Private Ambulance Government/Military "Origin = Destination Flights" [e.g Training] Empty Pax occupied Note: Bizliner excluded 11
12 6. DISTRIBUTION OF FLIGHT ACTIVITY BY SECTOR LENGTH 65% of all sectors flown in Q1 were max 1.5H, these increasing 5% YOY, the main impetus from Small Jets. 24% of all Large Jet flights were 1.H-3H, these growing 8% YOY. Biggest decline was -17% in MSJ 3H-6H sectors. DEPARTURES / DISTRIBUTION: Q1 / 2017 QUARTERLY TRENDS max. 1.5 h 1.5h to 3h 3h to 6h more than 6h Total Large Jets 48,8% 23,9% 16,0% 11,3% ,7% 7,7% 4,9% 6,7% 6,6% Medium Jets 59,9% 26,2% 13,1% 0,8% ,1% -2,3% 7,8% -16,9% 0,1% Small Jets 72,4% 23,6% 0,6% ,4% 9,7% 7,9% 10,2% 4,4% 9,2% Propeller Aircraft 75,0% 19,6% 4,0% 1,5% ,7% 4,6% 15,1% -4,1% 1,9% Total Departures Europe 65,4% 22,8% 8,0% 3,7% ,0% 5,6% 7,5% 4,5% 5,3% max. 1.5 h 1.5h to 3h 3h to 6h more than 6h 100% 12
13 7. ACTIVITY TRENDS AT BUSIEST EUROPEAN AIRPORTS (a) Le Bourget generated the largest number of departures in Q1, also adding most YOY growth. Zurich and Linate were the only top 10 airports to see any YOY decline. Activity at Vnukovo bounced back, +13% YOY in Q1. Departures Q Quarterly Trend LFPB,LE BOURGET LSGG,GENEVA EGGW,LUTON LSZH,ZURICH UUWW,VNUKOVO EGLF,FARNBOROUGH LFMN,NICE COTE D AZUR LIML,LINATE EDDM,MUNCHEN LOWW,VIENNA SCHWECHAT LIRA,CIAMPINO EDDB,SCHOENEFELD EGKB,BIGGIN HILL LEMD,BARAJAS EDDS,STUTTGART LFLB,AIX LES BAINS EGWU,NORTHOLT LKPR,VACLAV HAVEL EDDK,KOLN BONN LTBA,ATATURK EGSS,STANSTED EHAM,SCHIPHOL LSZB,BELP EBBR,BRUSSELS NATL LEBL,BARCELONA LOWI,INNSBRUCK INTERNATIONAL LOWS,SALZBURG - W.A. MOZART Top 30 LSGS,SION ,2% EDDL,DUSSELDORF 976 LFLY,BRON 910 7,7% 2,6% 3,8% -2,0% 12,7% 4,8% 10,0% -1,3% 7,9% 5,7% -4,9% 24,5% 10,1% 10,8% 6,8% 7,3% 7,4% 10,1% 17,7% 2,5% 31,9% 1,7% -5,1% 0,6% 2,6% 12,7% 5,4% 5,9% 65,8% 15,9% 0,7% Other European Airports Note: UUWW Vnukovo, is not shown, otherwise map would be distorted Piston Aircraft (frequently used for Training) are excluded in the analysis on this page. 13
14 7. ACTIVITY TRENDS AT BUSIEST EUROPEAN AIRPORTS (b) AOC activity was busiest by far at Le Bourget, growing 15% in Q1. Many of the other top 10 airports also had double digit AOC growth, +21% at Vnukovo. Private flights declined at most airports (noting Munich and Schoenefeld exceptions). DEPARTURES / DISTRIBUTION: Q1 / 2017 AOC Ambulance Private Government/Military Other Origin=Destination Flights AOC QUARTERLY TRENDS Private Other LFPB,LE BOURGET 57% 41% 2% LSGG,GENEVA 57% 41% 2% EGGW,LUTON 61% 37% 2% LSZH,ZURICH 51% 42% 6% UUWW,VNUKOVO 66% 34% 0% EGLF,FARNBOROUGH 62% 37% 1% LFMN,NICE COTE D AZUR 64% 34% 2% LIML,LINATE 58% 41% 2% EDDM,MUNCHEN 55% 41% 4% LOWW,VIENNA SCHWECHAT 65% 32% 3% LIRA,CIAMPINO 55% 24% 21% EDDB,SCHOENEFELD 52% 46% 2% EGKB,BIGGIN HILL 60% 38% 3% LEMD,BARAJAS 70% 29% 1% EDDS,STUTTGART 44% 51% 5% LFLB,AIX LES BAINS 66% 33% 1% EGWU,NORTHOLT 72% 27% 1% LKPR,VACLAV HAVEL 70% 28% 2% EDDK,KOLN BONN 63% 33% 4% LTBA,ATATURK 30% 64% 7% EGSS,STANSTED 33% 60% 7% EHAM,SCHIPHOL 61% 36% 3% LSZB,BELP 52% 38% 9% EBBR,BRUSSELS NATL 61% 34% 5% LEBL,BARCELONA 61% 34% 5% LOWI,INNSBRUCK INTERNATIONAL 67% 25% 8% LOWS,SALZBURG - W.A. MOZART 44% 54% 2% LSGS,SION 56% 42% 2% EDDL,DUSSELDORF 52% 45% 3% 976 LFLY,BRON 38% 61% 1% Top 30 34,2% -1,0% -38,9% -3,6% 65,8% Other 14,7% 12,1% 11,3% 5,1% 20,8% 17,6% 16,8% 3,9% 14,8% 7,6% 42,3% 21,4% 12,6% 0,0% 22,4% 15,0% 15,1% 31,8% 78,6% 6,9% 5,6% 5,3% 24,8% 5,3% 27,6% 18,9% 7,5% -0,9% -6,9% -6,0% -6,3% -11,0% -1,1% -1,5% -7,3% -17,7% -0,9% -14,1% -6,8% -16,6% -0,6% -13,5% -3,8% 0,3% 15,2% 11,5% 10,3% 16,8% 0,9% 2,5% 21,8% 0,5% 18,6% 7,1% 8,2% 11,5% 55,8% -22,8% -7,0% -21,3% -35,7% -11,4% -8,8% -4,3% -14,0% -15,3% -15,9% -28,8% -44,0% -15,9% -26,1% -9,7% -22,2% -17,8% -13,0% -41,5% -5,6% -33,8% -11,1% -33,1% -40,0% -5,3% 8,9% 19,4% 33,3% 40,0% 57,1% 14
15 7. ACTIVITY TRENDS AT BUSIEST EUROPEAN AIRPORTS (c) Small Jet activity had consistently strong growth across all top airports in Q1, +18% at Zurich, +23% from Schoenefeld. Medium Jet activity was well up from Farnborough, Nice, Vnukovo. Main growth in Large Jets was from Le Bourget. DEPARTURES / DISTRIBUTION: Q1 / 2017 QUARTERLY TRENDS Large Jets Medium Jets Small Jets Propeller Aircraft Heavy Jets Medium Jets Small Jets Propeller Aircraft LFPB,LE BOURGET 35,5% 12,6% 38,2% 13,6% LSGG,GENEVA 39,9% 15,2% 35,3% 9,7% EGGW,LUTON 54,8% 14,7% 28,4% 2,1% LSZH,ZURICH 41,5% 13,3% 34,6% 10,6% UUWW,VNUKOVO 74,8% 17,4% 7,6% 0,2% EGLF,FARNBOROUGH 49,3% 18,3% 23,4% 10,9% 9,0% LFMN,NICE COTE D AZUR 37,3% 18,4% 33,5% LIML,LINATE 35,1% 15,8% 40,7% 8,5% EDDM,MUNCHEN 35,4% 16,2% 36,2% 12,1% LOWW,VIENNA SCHWECHAT 30,1% 19,6% 45,4% 4,9% EDDS,STUTTGART 26,0% 6,7% 44,6% 22,7% LFLB,AIX LES BAINS 36,0% 19,3% 33,2% 11,5% EGWU,NORTHOLT 38,3% 22,5% 35,5% 3,8% LKPR,VACLAV HAVEL 24,4% 15,1% 44,5% 16,0% EDDK,KOLN BONN 25,3% 8,5% 54,2% 12,0% LEBL,BARCELONA 37,5% 16,4% 37,6% 8,5% LOWI,INNSBRUCK INTERNATIONAL 15,8% 24,8% 47,0% 12,4% LOWS,SALZBURG - W.A. MOZART 14,2% 10,9% 59,4% 15,5% LSGS,SION 21,4% 12,8% 45,6% 20,1% EDDL,DUSSELDORF 16,7% 14,8% 57,9% 10,7% 976 LFLY,BRON 11,9% 52,7% 29,0% 910 6,4% LIRA,CIAMPINO 43,3% 13,6% 26,8% 16,2% EDDB,SCHOENEFELD 28,3% 15,0% 48,5% 8,2% EGKB,BIGGIN HILL 23,7% 15,1% 45,7% 15,4% LEMD,BARAJAS 44,2% 13,9% 36,3% 5,6% LTBA,ATATURK 62,9% 23,9% 1,9% 11,3% EGSS,STANSTED 61,0% 9,0% 22,0% 7,9% EHAM,SCHIPHOL 31,9% 15,2% 43,5% 9,3% LSZB,BELP 29,0% 14,0% 35,1% 21,9% EBBR,BRUSSELS NATL 33,2% 9,1% 47,9% 9,8% ,0% 64,0% -1,1% -10,0% -2,9% -6,3% -6,3% -4,5% -9,7% -9,0% -10,4% 6,5% -2,0% -4,9% 1,4% -6,2% -6,7% 13,1% 3,3% -20,3% 7,1% 13,3% -0,9% -31,1% 31,8% 22,3% -7,4% 14,0% 15,5% 11,6% 0,6% -5,3% 8,1% -4,7% 18,5% -20,5% 21,8% -13,8% 1,1% -15,0% 20,0% -5,0% 2,1% -5,1% 24,1% 50,9% 20,0% -14,7% 12,4% 19,0% 11,4% 12,7% 42,8% 19,9% 15,4% 4,5% 30,1% -9,4% 88,7% 18,9% -15,2% 21,3% 21,7% 22,0% 11,5% 10,0% 17,0% -9,0% 18,0% -13,8% 6,9% 10,9% 12,9% 16,5% -8,2% 9,7% -0,5% 6,0% -9,1% 13,8% 23,4% -9,5% 19,9% -8,8% 5,6% 1,0% 14,4% -14,4% 23,5% 20,3% 15,4% 27,1% 11,6% 9,0% -18,1% 0,8% -27,3% 23,7% -2,3% 15,3% -13,5% 5,5% -14,0% 10,8% 11,6% -1,9% -16,5% 10,4% 6,2% 200,0% 10,3% 25,7% 3,9% 1,3% 7,4% 3,8% 7,8% 45,5% 103,0% 110,0% 120,0% 47,1% Top 30 Other 15
16 8. ACTIVITY BY DOMESTIC/INTERNATIONAL AND ARRIVALS/DEPARTURES Business aviation flights within Europe were up by 5.2% in Q1, and connected 40,272 unique airport pairs. Stronger growth in arrivals into Europe, 9,507 flights, up 7.1%. Similarly, flights departing Europe grew 6.3% YOY. -0,7% +5,2% ,4% +6,3% +1,6% +7,1% Europe Domestic [Departures]* Intl. Flights [Departures]** Intl. Flights [Arrivals]*** Q Q Q # of unique airport pairs served Europe domestic* Intl. Flights [Departures]** Intl. Flights [Arrivals]*** BizAv Airport pairs served Q Note: *) e.g. Geneva --> Paris Le Bourget **) e.g. London Luton --> New York Teterboro ***) e.g. Singapore Seletar --> Brussels 16
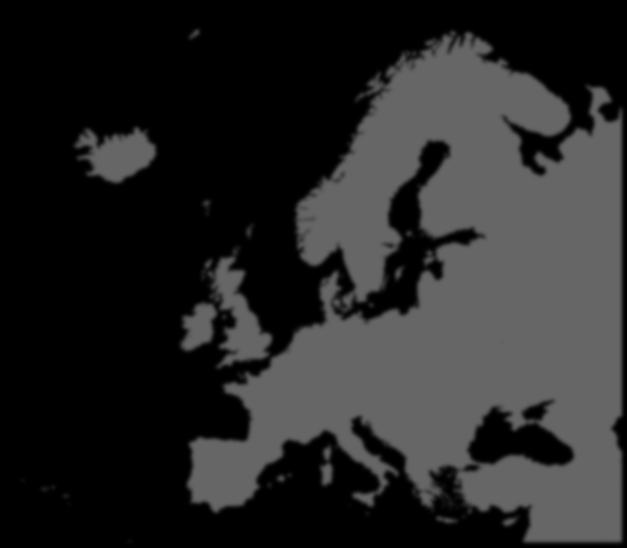
![9. TRENDS ON TOP EUROPEAN AIRPORT PAIRS [EUROPEAN DOMESTIC FLIGHTS ONLY] Busiest pair for intra-european activity was LFPB-LSGG, with 473 departures, growing 4.4%.](/docs-images/74/71444863/images/17-3.jpg "Notable decline in flights connecting LIML-LIRA, -29%. Stand-out gains from EGGW to LFPB & LSGG, also on LTBA-LTAC and from LFPB to LIML.")
17 9. TRENDS ON TOP EUROPEAN AIRPORT PAIRS [EUROPEAN DOMESTIC FLIGHTS ONLY] Busiest pair for intra-european activity was LFPB-LSGG, with 473 departures, growing 4.4%. Notable decline in flights connecting LIML-LIRA, -29%. Stand-out gains from EGGW to LFPB & LSGG, also on LTBA-LTAC and from LFPB to LIML. DEPARTURES / AIRPORT PAIR: Q LFPB-LSGG 473 LSGG-LFPB 470 LFMN-LFPB 184 LIML-LIRA 183 LIML-LFPB 177 EGGW-LFPB 176 LSGG-EGGW 175 LFPB-EGGW 173 LTBA-LTAC 172 EGGW-LSGG 170 LFPB-LFMN 170 ENTC-ENAT LFPB-LIML LIRA-LIML 167 EGLF-LFPB 159 LFPB-EGLF 155 LSGG-LFMN LTAC-LTBA LFMN-UUWW EGNL-EGGD 150 LFMN-LSGG 150 EGGD-EGNL 148 ESPA-ESUP 140 ESUP-ESPA UUWW-LFMN LFPB-LFLB 128 LSGG-EGLF 128 EFHK-EFJY LTFJ-LTAC EGLF-LSGG 124 LEBL-LEMD 123 EGNL-EGLF 122 EGLF-EGNL 122 LEMD-LEBL 121 LFPB-LSZH 118 LTAC-LTFJ 116 EFJY-EFHK 116 LFLB-UUWW 113 LFPB-LFBD 112 LSGG-LSZH 111 LFLB-LFPB 111 LSZH-LFPB 109 UUWW-EGGW 109 UUWW-LIME 108 LIME-UUWW 107 ENAT-ENTC 105 Top 50 5,3% 94,7% ENHF-ENTC 105 ENAT-ENHF 104 LOWW-LOWI 104 ENVA-ENAL 102 Other airport pairs -28,5% -30,1% -2,9% -0,7% -11,2% -11,4% -8,5% -11,1% -6,1% -10,5% -1,8% -5,6% Quarterly trend 4,4% 3,4% 35,1% 2,3% 27,7% 4,8% 29,3% 33,9% 5,6% 8,3% 27,3% 8,9% 6,2% 5,6% 12,7% 2,7% 4,5% 5,3% 19,6% 22,1% 18,7% 21,8% 7,0% 5,2% 13,1% 19,2% 10,5% 24,7% 17,7% 6,7% 4,8% 0,9% 31,7% 30,5% 18,0% 38,2% 18,2% 108,0% Note: Excluding Origin=Destination Flights 17
![9. TRENDS ON TOP EUROPEAN AIRPORT PAIRS [EUROPEAN DOMESTIC FLIGHTS ONLY] Measured by flight hours, connections with UUWW ranked highest for intra-european flights, with significant YOY growth on](/docs-images/74/71444863/images/18-4.jpg "LFLB-UUWW, UUWW-EDDK & UUWW-LIME. EGGW-LSGG was up >30% YOY.")
18 9. TRENDS ON TOP EUROPEAN AIRPORT PAIRS [EUROPEAN DOMESTIC FLIGHTS ONLY] Measured by flight hours, connections with UUWW ranked highest for intra-european flights, with significant YOY growth on LFLB-UUWW, UUWW-EDDK & UUWW-LIME. EGGW-LSGG was up >30% YOY. FLIGHT HOURS / AIRPORT PAIR: Q Europe domestic only LFMN-UUWW 484 UUWW-LFMN 445 LSGG-LFPB 412 LFPB-LSGG 394 UUWW-EGGW 377 LFLB-UUWW UUWW-LIME UUWW-LFLB LIME-UUWW UUWW-LSGG LSGG-UUWW EGLF-UUWW 271 UUWW-EDDK 267 EGGW-UUWW 261 LCLK-UUWW 253 UUWW-EGLF LSGG-EGGW UUWW-LFPB LFMN-LFPB UUWW-LCLK 234 EGGW-LSGG 228 EDDK-UUWW 224 UUWW-EDDM 223 LIML-LFPB 211 LFPB-LFMN 209 LFPB-UUWW 209 LCRA-EGVN 206 LSZH-UUWW 197 UUWW-LSZH LFPB-LIML ESCF-ESCF UUWW-EDJA EDDM-UUWW EGGW-LFMN EDJA-UUWW 171 LSGG-EGLF 168 UUWW-LOWW 163 UUWW-LIML 160 EGGW-LFPB 156 EGLF-LSGG 154 LOWW-UUWW 152 LFPB-EGGW 151 LFMN-EGGW 150 UUWW-LYBE 148 LIML-LIRA 147 LSZH-EGGW 146 LIRA-LIML 143 5,7% 94,3% EGGW-LSZH 131 EGVN-LCRA 129 EGNL-EGGD 128-9,7% -2,0% -3,3% -24,9% -23,7% -11,1% -6,8% -5,8% -28,6% -31,4% -0,9% -0,3% -7,3% -13,1% -11,7% -1,3% -2,0% -33,9% -8,8% Quarterly trend 2,9% 5,8% 20,8% 29,8% 35,4% 15,3% 32,8% 93,1% 80,4% 7,8% 28,3% 116,3% 34,6% 78,3% 81,7% 35,3% 4,8% 13,3% 28,3% 22,7% 43,0% 14,7% 35,7% 4,0% 10,0% 4,7% 26,1% 31,2% 27,8% 136,2% 136,2% Note: Excluding Origin=Destination Flights Top 50 Other CityPairs [Europe domestic] 18
19 10. TRENDS IN UTILISATION PER AIRCRAFT UNIT/TYPE [EUROPEAN DOMESTIC FLIGHTS ONLY] 5,919 individual tails were active in Europe in Q1 2017, with SLJ segment posting highest utilisation. The active VLJ & ULR fleet increased by most. Overall, aircraft utilisation grew 1.9%, up by most for Light Jet segment. HRS. PER AIRCRAFT / ACTIVE AIRCRAFT / TRENDS Avg. FH / Aircraft Unit [per Qtr.] Active Aircraft Q Quarterly Trend [Aircraft Activity] Quarterly Trend [Growth, in Aircraft units ] Bizliner 27, ,0% 15 Ultra Long Range 16, ,8% 49 Heavy jet 26, ,3% -1 Super midsize jet 41, ,6% 0 Midsize jet 46, ,5% -27 Super Light jet 77, ,4% -7 Light Jet 48, ,3% -22 Entry Level jet 37, ,0% -1 Very Light jet 48, ,4% 22 Turboprop 31, ,9% -42 Piston 10, ,2% -96 Europe domestic only Total Average 31, ,9%
20 11. TRENDS IN AIRCRAFT ACTIVITY BY REGISTER [EUROPEAN DOMESTIC FLIGHTS ONLY] The D register saw an additional 34 active units in Q1 2017, increasing the activity of this registered fleet by 9%. The UK register was also up. Both N and M registers had fewer active aircraft YOY. The active 9H fleet was up by 21 units. FLIGHTHOURS PER AIRCRAFT REGISTER / ACTIVE AIRCRAFT / TRENDS Flight Hours: Q % of total Europe Active Aircraft Q Quarterly Trend [Aircraft Activity] Quarterly Trend [Growth, in Aircraft units ] D-[Germany] ,0% 738 9,2% 34 CS-[Portugal] ,2% 116 9,7% -4 G-[United Kingdom] ,6% 301 8,2% 7 F-[France] ,5% 346 4,0% -1 OE-[Austria] ,1% 218 9,9% -5 N-[United States of America] ,1% ,8% -16 M- [Isle of Man] ,0% ,8% -31 9H-[Malta] ,9% ,2% 21 HB-[Switzerland] ,0% 204-4,5% 6 OK-[Czech Republic] ,0% 98 28,0% 13 TC-[Turkey] ,7% ,5% -1 LX-[Luxembourg] ,7% 78 2,8% -2 LN-[Norway] ,3% 33 6,1% -10 VQ-B [Bermuda] ,0% 59 23,4% -5 SE-[Sweden] ,0% 75-7,1% -6 I-[Italy] ,0% 144-3,9% -21 EC-[Spain] YU-[Serbia] ,9% 1,8% ,2% 24,3% -5 5 Europe domestic only OO-[Belgium] ,4% 19,6% 1,6% 66 13,9% 4 OY-[Denmark] ,4% 72-2,5% -9 Top 20 Other 20
21 12. AIRCRAFT ACTIVITY BY OPERATOR FLEET SIZE [EUROPEAN DOMESTIC FLIGHTS ONLY] Some decline in Q1 flight hour activity for the smallest fleets, 1-5 tails. These operators generated 59% of all activity. Substantial growth for the larger fleets, FH up 18% for 6-20 tail operators, and up 20% for the fleets >20 tails. OPERATOR SIZE / TRENDS / ACTIVE AIRCRAFT Flight hours Q % of total Europe Quarterly Trend [Aircraft Activity] Active Aircraft [in Operator category]: Q Flight Hours / Aircraft Unit: Q more than ,4% 20,4% ,3 6 to ,1% 18,4% ,0 2 to ,6% -8,5% ,2 1 aircraft only ,9% -1,8% ,6 Europe domestic only Total ,0% 5,3% ,1 Note: Bizliner and flights operated by Government / Military are excluded Page: 21
22 13. OPERATIONAL COSTS: HANDLING; FUEL; PAX TAX [EUROPEAN DOMESTIC FLIGHTS ONLY] Very Light Jets operated 5.9% of European flights in Q1, of which 72% were Citation Mustang sectors. This translates into an estimated 6.6M DOC, of which handling fees approx. 2.8M, and fuel burn of 2.4K tons. Q1-2017: MARKET VALUATION IN TERMS OF DIRECT OPERATIONAL COSTS FOCUS: CITATION MUSTANG OTHER KPIs 100% ,9% 100% % ,8% 66,7% ,1% ,2% 33,3% Total European domestic flights Q Total VLJ Total Operational Cost: Q [Citation Mustang] Total Handling Costs Operational at Airports Cost: Q Fuel Cost Other Airfield Costs Airfield Passenger Fees Passenger Taxes Charter Revenue [quoted] Passengers [Private+Charter] Fuel burn [in tons] Very Light Jet Other Citation Mustang Other VLJs AOC Private % of total 100,0% ,8% 29,9% 22,0% 3,8% 1,5% Europe domestic only Note: Operational costs do not include crew, personnel or aircraft maintenance Page: 22
23 14. TOTAL REVENUES GENERATED [EUROPEAN DOMESTIC FLIGHTS ONLY] Q1 business aviation aircraft activity in Europe generated an estimated 319M revenues, transporting round 400K passengers, generating a fuel burn of 70K tons. Q1-2017: MARKET VALUE IN TERMS OF ESTIMATED REVENUE, PASSENGERS, FUEL BURN Europe domestic only Estimated revenues Passenger transported Fuel burn [in tons] Note: methodology for estimated Charter Revenue is to isolate a) AOC Charter hours b) Occupied only c) Domestic Europe Page: 23
24 15. BUSINESS AVIATION VS AIRLINE OPERATION The 40,272 airport pairs connected by business aviation within Europe in Q1 compare to 7,208 linked by airlines. 9% of the airports linked by business aviation in Q1 were also connected by scheduled airlines. # of unique airport pairs served [Q1-2017] Europe domestic* Intl. Flights [Departures]** Intl. Flights [Arrivals]*** # of unique airport pairs served[q1-2017] BizAv-Airport Pairs served: Q Airline- Airport Pairs served : Q Europe domestic* Intl. Flights [Departures]** Intl. Flights [Arrivals]*** Airport Pairs [served by BizAv only] Overlap factor 10 9,0% 8,2% 7,6% 5 0 Note: *) e.g. Geneva --> Paris Le Bourget **) e.g. London Luton --> New York Teterboro ***) e.g. Singapore Seletar --> Brussels Airline [e.g. KLM, British Airways, Air France, EasyJet, Lufthansa, ] Overlap Factor [BizAv vs Airline Ops.] Page: 24
25 DEFINITIONS (1) ACTIVITY COVERAGE This report covers business aviation activity, corresponding to all non-scheduled flights operated under Instrument Flight Rules (IFR) which correspond to fixed-wing single- and multi-engine business aviation aircraft categories. Broadly these categories are defined as: Heavy Jets, Medium Jets, Light Jets, Props. These categories are also broken down into the following segments: Ultra-Long range jets, Heavy jets, Super midsize jets, Midsize jets, Superlight jets, Light jets, Entry level jets, Very light jets. Specific types of Airliner (Bizliner), Turboprop and Piston aircraft have also been included in the Report. The geographical coverage of this report corresponds to all such business aviation flights connecting to and from 46 countries in the European area (reference map page 4). This includes both flights within this area, and between this area and the rest of the world. The principal measurement of activity is flight departures from the defined geographic area, broken down into flights to destinations within the area ( domestic ) and flights to destinations in the rest of the world ( ROW ). Also arrivals into the European area from the rest of the world are featured. Overflights are excluded. Aircraft activity data is sourced from EUROCONTROL, Civil Aviation Authorities, National Business Aviation Associations. Aircraft performance data is sourced from Original Equipment Manufacturers. The report covers all types of Private (owner) and Commercial (AOC) flights, and also Other flights, including Air Ambulance/Medical, Government & Military, and Origin=Destination Flights, mainly Training, but also including Maintenance, Check and Demonstration flights. Airport handling fees, Airfield fees, Fuel costs, Passenger Taxes and Charter Fees are sourced from Stratajet. Aircraft Charter Price trends and Passenger loads are sourced from PrivateFly. Empty Legs are estimated by WINGX, based on flight pattern analysis, sector length, mission and aircraft type. All data analysis is carried out by WINGX through our proprietary activity tracking and data processing methodology. 25
26 DEFINITIONS (2) - AIRCRAFT TYPE COVERAGE 140 different aircraft types (EG Challenger 600 platform is one type; see over for detail) are covered in this report, including 19 types of Light Jet, 14 types of Heavy Jet. This fleet generated 154,510 departures in Q References pages 3, 8. Covered Aircraft Types Departures Q Bizliner Ultra Long Range Heavy jet Super midsize jet Midsize jet Super Light jet Light Jet Entry Level jet Very Light jet Turboprop Piston Total
27 DEFINITIONS (3) - AIRCRAFT TYPE COVERAGE Note: Aircraft set specified by EBAA as of September 2017, also added C55B, E35L, E550. E45X as they became available. 27


28 In collaboration with WINGX Advance, this report is provided solely to EBAA Members for information purposes only and no representation, warranties or other assurances, express or implied, are given as to the quality, accuracy, or completeness of the information contained in, or provided in connection with the report. Recipients of this report must determine for themselves whether any matters referred to are suitable for their purposes. Neither EBAA nor any of their affiliates, agents, partners, representatives, consultants or any other company, firm or organisation involved in producing this report, nor any of their successors or assign or any employees, officer or director of any of them shall have any liability with respect to the use or reliance on the report by any person, irrespective of any negligence, omission or default, on the part of the foregoing persons. Any reproduction or publication of this report, in whole or in part, is strictly forbidden without the written consent of the EBAA 28
 www.wingx-advance.com www.wingx-advance.com Hamburg, October 30 th,2015 Hamburg, January 12th, 2017 TABLE OF CONTENTS 1. Overall trends in European business aviation activity 2. Geographical distribution
BUSINESS AVIATION TRAFFIC TRACKER EUROPE. January 2018
 BUSINESS AVIATION TRAFFIC TRACKER EUROPE January 2018 EXECUTIVE SUMMARY January starts a 2018 with the continuation of traffic growth AMAC Insurance Subcommittee Meeting Milano, 1 st of February January
BUSINESS AVIATION TRAFFIC TRACKER EUROPE. April 2017
 BUSINESS AVIATION TRAFFIC TRACKER EUROPE April 2017 DEPARTURES, ARRIVALS, INTERNALS AND OVERFLIGHTS (DAIO) REPORT TOTAL FLIGHTS Business Aviation (Single European Sky Area) Month Previous Arrival Departure
BUSINESS AVIATION TRAFFIC TRACKER EUROPE. September 2018
 BUSINESS AVIATION TRAFFIC TRACKER EUROPE September 2018 EXECUTIVE SUMMARY September 2018 Back to Business With 66.133 flights, September 2018 marks a slight slow down (-0,7%) compared with September 2017
BUSINESS AVIATION TRAFFIC TRACKER EUROPE. June 2018
 BUSINESS AVIATION TRAFFIC TRACKER EUROPE June 2018 EXECUTIVE SUMMARY June 2018 traffic figures stable With in average 280 additional daily flights compared with May 2018, June 2018 marks the traditional
BUSINESS AVIATION TRAFFIC TRACKER EUROPE. May 2018
 BUSINESS AVIATION TRAFFIC TRACKER EUROPE May 2018 EXECUTIVE SUMMARY May 2018 traffic figures stable With in average 320 additional daily flights compared with April 2018, May 2018 marks the traditional
QUARTERLY INSIGHT EUROPE
 BUSINESS AVIATION QUARTERLY INSIGHT EUROPE Q1-2014 2013 by WINGXAdvance / Actionable Market Intelligence for Business Aviation exclusive edition for EBAA QUARTERLY INSIGHT EUROPE BUSINESS AVIATION This
CCBE LAWYERS STATISTICS 2016
 Austria 31/12/2015 6.057 1.242 Belgium (OBFG) How many s are 81-2 Bulgaria - 2 Croatia - 5 Czech Republic - 40 Germany - 1 Greece - 3 Hungary - 6 Italy - 1 Liechtenstein - 1 Lithuania - 2 The Netherlands
INSIGHT Issue: December 2016 Hamburg, January 11th, by WINGX Advance / Actionable Market Intelligence for Business Aviation
 www.wingx-advance.com AIRCRAFT ACTIVITY TRACKER INSIGHT Issue: December 2016 Hamburg, January 11th, 2017 2013 by WINGX Advance / Actionable Market Intelligence for Business Aviation Executive Summary:
assists in the development of airport capacity to meet growing demand supports the development of improved ground access to airports
 ATAG The Air Transport Action Group (ATAG) is a coalition of organisations from throughout the air transport industry, formed to press for economically beneficial aviation capacity improvements in an environmentally
December December 2013 BUSINESS AVIATION MONITOR. WINGX Advance is a proud member of: Source: Fotolia
 December 2013 December 2013 BUSINESS AVIATION MONITOR WINGX Advance is a proud member of: Source: Fotolia Year to Date analysis of departures With the slight growth in December, the overall decline in
TRAFFIC DEVELOPMENT POLICY 2018
 TRAFFIC DEVELOPMENT POLICY 2018 GUIDELINES Target The Traffic Development Policy aims at ATTRACTING INCREMENTAL TRAFFIC to our airport. The incentive system hereafter exposed is conceived to be a guideline
An overview of Tallinn tourism trends
 An overview of Tallinn tourism trends August 2015 The data is collected from Statistics Estonia, Tallinn Airport and Port of Tallinn. In August 2015, 179,338 stayed overnight in Tallinn s accommodation
EUROCONTROL Low-Cost Carrier Market Update
 EUROCONTROL Low-Cost Carrier Market Update June 2007 EUROCONTROL/STATFOR/Doc257 v1.0 12/09/07 EUROCONTROL Low-Cost Carrier Market Update June 2007 Summary: The market share of low-cost carriers in Europe
Connecting the Mediterranean with the rest of Europe WINGX Market Intelligence
 Connecting the Mediterranean with the rest of Europe WINGX Market Intelligence www.wingx-advance.com 2013 by WINGX Advance / Actionable Market Intelligence for Business Aviation BAM issue 9/13/2013 The
EUROCONTROL. Visit of the Transport Attachés. 10 April Frank Brenner. Director General EUROCONTROL
 EUROCONTROL Visit of the Transport Attachés 10 April 2015 Frank Brenner Director General EUROCONTROL One day s traffic EUROCONTROL - Visit of the Transport Attachés - 10 April 2015 2 ATM Today Air Transport
The explanations of other terms used throughout the tables are contained in the section on Definitions immediately following the tables.
 FOREWORD 1 CONTENT 1.1 UK Airports - Annual Statements of Movements, Passengers and Cargo is prepared by the Civil Aviation Authority with the co-operation of the United Kingdom airport operators. The
Valid effective from 01 August 2018 Amendments: Add additional cities permitted for Russia in Europe (RU) and excluded for Russia in Asia (XU)
 and excluded for Russia in Asia (XU)") Valid effective from 01 August 2018 Amendments: Add additional cities permitted for Russia in Europe (RU) and excluded for Russia in Asia (XU) OW VISIT EUROPE 1. Application/Fares and Expenses A. Application
Valid effective from 01 August 2018 Amendments: Add additional cities permitted for Russia in Europe (RU) and excluded for Russia in Asia (XU) OW VISIT EUROPE 1. Application/Fares and Expenses A. Application
ROMANIA. Table 1. FDI flows in the host economy, by geographical origin. (Millions of US dollars)
") Table 1. FDI flows in the host economy, by geographical origin World.... 2 196 6 435 6 485 11 333 9 928 13 910 4 843 2 939 2 522 2 746 Developed economies.... 1 521 5 361 6 309 11 445 9 136 13 422 4 812
Table 1. FDI flows in the host economy, by geographical origin World.... 2 196 6 435 6 485 11 333 9 928 13 910 4 843 2 939 2 522 2 746 Developed economies.... 1 521 5 361 6 309 11 445 9 136 13 422 4 812
SLOVAKIA. Table 1. FDI flows in the host economy, by geographical origin. (Millions of US dollars)
") Table 1. FDI flows in the host economy, by geographical origin World 1 271 4 095 1 060 1 058 714 4 693 3 267 4 692-6 1 769 3 491 2 825 Developed economies 1 204 4 050 1 036 1 113 485 4 265 1 001 5 084-881
Table 1. FDI flows in the host economy, by geographical origin World 1 271 4 095 1 060 1 058 714 4 693 3 267 4 692-6 1 769 3 491 2 825 Developed economies 1 204 4 050 1 036 1 113 485 4 265 1 001 5 084-881
Please find attached a copy of JAR-25 Amendment 20 dated December 2007.
 oint Aviation Authorities Postal Address: P.O. Box 3000 2130 KA Hoofddorp Visiting Address: Saturnusstraat 40-44 The Netherlands Tel.: 31 (0)23-5679790 Fax: 31 (0)23 5657731 www.jaa.nl January 2008 JAR-25
Unlocking Business Aviation s Potential in Switzerland
 Bern 30th June 2016 Unlocking Business Aviation s Potential in Switzerland National Forum Definition transcends a concept: tailor-made Business Aviation is : > on demand non scheduled > aircraft with 19
Please find attached a copy of JAR-66 Amendment 2 dated February 2007.
 oint Aviation Authorities Postal Address: P.O. Box 3000 2130 KA Hoofddorp Visiting Address: Saturnusstraat 50 The Netherlands Tel.: 31 (0)23-5679700 Fax: 31 (0)23-5621714 Our reference number: 01106evd
Table I. General questions
 UNECE 1 04/03/2003 Replies to the on visa s Table I. General questions The numbers in brackets correspond to question numbers of the Andorra Armenia Azerbaijan Belarus for drivers is In general, no visas
JAR-21: CERTIFICATION PROCEDURES FOR AIRCRAFT AND RELATED PRODUCTS AND PARTS. Please find attached a copy of JAR-21 Amendment 7 dated February 2007.
 oint Aviation Authorities Postal Address: P.O. Box 3000 2130 KA Hoofddorp Visiting Address: Saturnusstraat 50 The Netherlands Tel.: 31 (0)23-5679700 Fax: 31 (0)23-5621714 Our reference number: 00106evd
When is the business aviation upturn coming and what role does the Mediterranean market play?
 AEROSPACE INFORMATION REDEFINED When is the business aviation upturn coming and what role does the Mediterranean market play? Mediterranean Business Aviation 13 th September 2013 Daniel Hall Ascend Advisory
The economic impact of ATC strikes in Europe Key findings from our updated report for A4E
 pwc.com The economic impact of ATC strikes in Europe Key findings from our updated report for A4E Prepared for A4E Updates to our analysis since June 2016 Since releasing our Preliminary Findings in June
ELEVENTH AIR NAVIGATION CONFERENCE. Montreal, 22 September to 3 October 2003
 4/8/03 English, French, Russian and Spanish only * ELEVENTH AIR NAVIGATION CONFERENCE Montreal, 22 September to 3 October 2003 Agenda Item 3: 3.1 : Air traffic management (ATM) performance targets for
JAR-147: APPROVED MAINTENANCE TRAINING/EXAMINATIONS. Please find attached a copy of JAR-147 Amendment 3 dated February 2007.
 oint Aviation Authorities Postal Address: P.O. Box 3000 2130 KA Hoofddorp Visiting Address: Saturnusstraat 50 The Netherlands Tel.: 31 (0)23-5679700 Fax: 31 (0)23-5621714 Our reference number: 01406evd
Introduction. European Airspace Concept Workshops for PBN Implementation
 Introduction European Airspace Concept Workshops for PBN Implementation OBJECTIVES The objective of this workshop is to provide an overview of the development of a PBN Airspace Concept, To introduce the
JAR-23: NORMAL, UTILITY, AEROBATIC, AND COMMUTER CATEGORY AEROPLANES. Please find attached a copy of JAR-23 Amendment 3 dated February 2007.
 oint Aviation Authorities Postal Address: P.O. Box 3000 2130 KA Hoofddorp Visiting Address: Saturnusstraat 50 The Netherlands Tel.: 31 (0)23-5679700 Fax: 31 (0)23-5621714 Our reference number: 00306evd
CROATIA. Table 1. FDI flows in the host economy, by geographical origin. (Millions of US dollars)
") Table 1. FDI flows in the host economy, by geographical origin World 1 307 1 153 2 107 1 210 1 844 3 228 4 928 5 941 3 566 515 1 511 1 370 Developed economies 1 207 1 113 1 719 1 190 1 885 3 093 4 775
Table 1. FDI flows in the host economy, by geographical origin World 1 307 1 153 2 107 1 210 1 844 3 228 4 928 5 941 3 566 515 1 511 1 370 Developed economies 1 207 1 113 1 719 1 190 1 885 3 093 4 775
Legal and Institutional Aspects of ATM in Europe. Roderick D. van Dam Head of Legal Service EUROCONTROL
 Legal and Institutional Aspects of ATM in Europe Roderick D. van Dam Head of Legal Service EUROCONTROL EUROCONTROL: European Organisation for the Safety of Air Navigation Coordination and integration -
JAR-145: APPROVED MAINTENANCE ORGANISATIONS. Please find attached a copy of Amendment 6 to JAR-145, effective 1 November 2004.
 oint Aviation Authorities Postal Address: P.O. Box 3000 2130 KA Hoofddorp Visiting Address: Saturnusstraat 8-10 The Netherlands Tel.: 31 (0)23-5679700 Fax: 31 (0)23-5621714 Our reference number: 07/03-11
Wizz Air aims to increase market share with F17 capacity growth of 20% Q3 passenger growth of 20%, Load Factor of 88% (+2.3ppt)
") Q3 F17 FINANCIAL RESULTS 1 FEBRUARY 2017 BUSINESS HIGHLIGHTS Current market conditions favour ULCCs Wizz Air aims to increase market share with F17 capacity growth of 20% Q3 passenger growth of 20%, Load
Q3 F17 FINANCIAL RESULTS 1 FEBRUARY 2017 BUSINESS HIGHLIGHTS Current market conditions favour ULCCs Wizz Air aims to increase market share with F17 capacity growth of 20% Q3 passenger growth of 20%, Load
TRIPS OF BULGARIAN RESIDENTS ABROAD AND ARRIVALS OF VISITORS FROM ABROAD TO BULGARIA IN NOVEMBER 2018
 TRIPS OF BULGARIAN RESIDENTS ABROAD AND ARRIVALS OF VISITORS FROM ABROAD TO BULGARIA IN NOVEMBER 2018 In November 2018, the number of the trips of Bulgarian residents abroad was 426.3 thousand (Annex,
Filoxenia Conference Centre Level 0
 Filoxenia Conference Centre Level 0 Stair 3/Lift 2 First Aid Board of Governors Secretariat Stair 3 Stair 4 Stair 4 (to level 1 only at Level -1) Lift 2 CSO Team Office Zenon Kitievs A Zenon Kitievs B
FINLAND. Table 1. FDI flows in the host economy, by geographical origin. (Millions of US dollars)
") Table 1. FDI flows in the host economy, by geographical origin World 3 732 8 046 3 319 2 823 4 750 7 652 12 451-1 144 718 7 359 2 550 4 158 Developed economies 3 638 8 003 2 382 2 863 4 934 7 258 12 450-855
Table 1. FDI flows in the host economy, by geographical origin World 3 732 8 046 3 319 2 823 4 750 7 652 12 451-1 144 718 7 359 2 550 4 158 Developed economies 3 638 8 003 2 382 2 863 4 934 7 258 12 450-855
TRIPS OF BULGARIAN RESIDENTS ABROAD AND ARRIVALS OF VISITORS FROM ABROAD TO BULGARIA IN OCTOBER 2017
 TRIPS OF BULGARIAN RESIDENTS ABROAD AND ARRIVALS OF VISITORS FROM ABROAD TO BULGARIA IN OCTOBER 2017 In October 2017, the number of the trips of Bulgarian residents abroad was 439.0 thousand (Annex, Table
TRIPS OF BULGARIAN RESIDENTS ABROAD AND ARRIVALS OF VISITORS FROM ABROAD TO BULGARIA IN FEBRUARY 2018
 TRIPS OF BULGARIAN RESIDENTS ABROAD AND ARRIVALS OF VISITORS FROM ABROAD TO BULGARIA IN FEBRUARY 2018 In February 2018, the number of the trips of Bulgarian residents abroad was 379.5 thousand (Annex,
TRIPS OF BULGARIAN RESIDENTS ABROAD AND ARRIVALS OF VISITORS FROM ABROAD TO BULGARIA IN NOVEMBER 2017
 TRIPS OF BULGARIAN RESIDENTS ABROAD AND ARRIVALS OF VISITORS FROM ABROAD TO BULGARIA IN NOVEMBER 2017 In November 2017, the number of the trips of Bulgarian residents abroad was 417.6 thousand (Annex,
TRIPS OF BULGARIAN RESIDENTS ABROAD AND ARRIVALS OF VISITORS FROM ABROAD TO BULGARIA IN JANUARY 2018
 TRIPS OF BULGARIAN RESIDENTS ABROAD AND ARRIVALS OF VISITORS FROM ABROAD TO BULGARIA IN JANUARY 2018 In January 2018, the number of the trips of Bulgarian residents abroad was 387.6 thousand (Annex, Table
TRIPS OF BULGARIAN RESIDENTS IN ABROAD AND ARRIVALS OF VISITORS FROM ABROAD TO BULGARIA IN FEBRUARY 2011
 TRIPS OF BULGARIAN RESIDENTS IN ABROAD AND ARRIVALS OF VISITORS FROM ABROAD TO BULGARIA IN FEBRUARY 2011 In February 2011, the number of the trips of Bulgarian residents in abroad was 246.2 thousand or
EUROCONTROL Short- and Medium-Term Forecast of Service Units: February 2011 Update
 Summary: This document presents the forecast of total service units in Europe 1 for 2011-2015 prepared by EUROCONTROL\STATFOR (Statistics and Service of EUROCONTROL). This forecast aims principally to
O 2 Call Options Explained
 March 2013 www.nimans.net/networkservices Tel: 01937 847 500 O 2 Call Options Explained International & Roaming UK To Abroad (UK based calls) International Favourites DISE Only The International Favourites
Tourist arrivals and overnight stays in collective accommodation 1 July 2017 (p)
") Jul-16 Aug-16 Sep-16 Oct-16 Nov-16 Dec-16 Jan-17 Feb-17 Mar-17 Apr-17 May-17 Jun-17 Jul-17 MONTENEGRO STATISTICAL OFFICE R E L E A S E No: 158 Podgorica, 31 August 2017 When using the data please name
Jul-16 Aug-16 Sep-16 Oct-16 Nov-16 Dec-16 Jan-17 Feb-17 Mar-17 Apr-17 May-17 Jun-17 Jul-17 MONTENEGRO STATISTICAL OFFICE R E L E A S E No: 158 Podgorica, 31 August 2017 When using the data please name
International Operations: NATA 2012 Air Charter Summit
 International Operations: NATA 2012 Air Charter Summit Larry Williams Senior Trip Owner Charter Management Blue Team Universal Weather and Aviation, Inc. Agenda Session Objective Discuss current hot topics
PRICE GUIDE OAYLLYS-PRIOS
 PRICE GUIDE OAYLLYS-PRIOS Effective from 3rd April 2018 iompost.com Sending Mail to the Isle of Man, UK and Channel Islands Letters, Large Letters & Packets We aim to deliver local items within 1 working
irport atchment rea atabase
 irport atchment rea atabase Examples 539 Airports Four range sizes 50, 75, 100 and 150 km. Time series 00-015 30+ variables About ACAD The database contains catchment area information for 539 European
Summer Work Travel Season Program Dates by Country
 The program dates are windows of opportunity for program participation. Within this timeframe, students are still subject to their university's official academic break schedule. Even though the window
October 2013 compared with September 2013 Industrial production down by 1.1% in euro area Down by 0.7% in EU28
 10-2004 01-2005 04-2005 07-2005 10-2005 01-2006 04-2006 07-2006 10-2006 01-2007 04-2007 07-2007 10-2007 01-2008 04-2008 07-2008 10-2008 01-2009 04-2009 07-2009 10-2009 01-2010 04-2010 07-2010 10-2010 01-2011
Survey on arrivals and overnight stays of tourists, total 2017
 MONTENEGRO STATISTICAL OFFICE R E L E A S E No: 34/2 Podgorica, 1 June 2018 When using the data please name the source Survey on arrivals and overnight stays of tourists, total In Montenegro, in, tourist
European Organisation for the Safety of Air Navigation Central Route Charges Office (CRCO) Report on the Operation of the Route Charges System in 2016
 Report on the Operation of the Route Charges System in 2016") European Organisation for the Safety of Air Navigation Central Route Charges Office (CRCO) Report on the Operation of the Route Charges System in 2016 March 2017 TABLE OF CONTENTS EUROCONTROL CHARGING
European Organisation for the Safety of Air Navigation Central Route Charges Office (CRCO) Report on the Operation of the Route Charges System in 2016 March 2017 TABLE OF CONTENTS EUROCONTROL CHARGING
Independence Time Line
 Independence Time Line Place all highlighted dates on the time line. Identify each date with the country name and corresponding facts. Highlight the country name on the time line. Albania 28 November 1912
JOINT AUTHORITIES FOR RULEMAKING OF UNMANNED SYSTEMS. Mike Lissone Secretary General JARUS
 JOINT AUTHORITIES FOR RULEMAKING OF UNMANNED SYSTEMS Mike Lissone Secretary General JARUS 1 AGENDA General Presentation Ongoing activities JARUS Structure Recent key deliverables: SORA Way Forward 2 GENERAL:
Digital Advertising in Europe. Daniel Knapp
 Digital Advertising in Europe Daniel Knapp About the study Data for 27 countries in Europe Austria Belarus Belgium Bulgaria Czech Republic Croatia Denmark Finland France Germany Greece Hungary Ireland
Summer Work Travel Season Program Dates by Country
 Albania 1-Jul 30-Sep 3 Months Argentina 1-Dec 1-Apr 4 Months Armenia 1-Jun 31-Aug 3 Months Australia 15-Nov 8-Mar 3.5 Months Visa Waiver Country Austria 1-Jul 30-Sep 3 Months Visa Waiver Country Azerbaijan
Slide 1. Slide 2. Slide 3 FLY AMERICA / OPEN SKIES OBJECTIVES. Beth Kuhn, Assistant Director, Procurement Services
 Slide 1 FLY AMERICA / OPEN SKIES Research Administrator Conference April 9, 2014 Clayton Hall Slide 2 Beth Kuhn, Assistant Director, Procurement Services Cindy Panchisin, Sponsored Research Accountant,
Global Travel Trends 2005
 Preliminary World Travel Monitor Results from IPK international for the ITB Berlin Message, 03/10/06 Global Travel Trends 2005 Based on the new data from the 2005 World Travel Monitor, and as it does every
5.3. Cannabis: Wholesale and Street Prices and Purity Levels
 5. Prices: Cannabis 5.3. Cannabis: Wholesale and Street Prices and Purity Levels HERBAL CANNABIS Africa East Africa Ghana 51.0 39.2-62.7 1999 Kenya 0.2 0.1-0.3-2002 119.8-1996 Madagascar 1.3 1.1-1.4 100.0
FACTS & FIGURES ISE 2016
 FACTS & FIGURES ISE 2016 The first four-day Integrated Systems Europe exhibition was an unqualified success. In drawing over 65,000 registered attendees to interact with over 1,100 exhibitors it officially
Summer Work Travel Season Program Dates by Country
 The program dates are windows of opportunity for program participation. Within this timeframe, students are still subject to their university's official academic break schedule. Even though the window
1214th PLENARY MEETING OF THE COUNCIL
 Permanent Council Original: ENGLISH Chairmanship: Slovakia 1214th PLENARY MEETING OF THE COUNCIL 1. Date: Thursday, 31 January 2019 Opened: Suspended: Resumed: Closed: 10.05 a.m. 1.10 p.m. 3.10 p.m. 4.00
Report on the Operation of the Route Charges System in Central Route Charges Office (CRCO)
") European Organisation for the Safety of Air Navigation Central Route Charges Office (CRCO) Report on the Operation of the Route Charges System in 2010 March 2011 - 3 - TABLE OF CONTENTS TABLE OF CONTENTS...
European Organisation for the Safety of Air Navigation Central Route Charges Office (CRCO) Report on the Operation of the Route Charges System in 2010 March 2011 - 3 - TABLE OF CONTENTS TABLE OF CONTENTS...
% change vs. Dec ALL VISITS (000) 2,410 12% 7,550 5% 31,148 1% Spend ( million) 1,490 15% 4,370-1% 18,710 4%
 2,410 12% 7,550 5% 31,148 1% Spend ( million) 1,490 15% 4,370-1% 18,710 4%") HEADLINES FULL YEAR 2012 (PROVISIONAL) 1 Overall visits 31.148 million visits making 2012 the best year for inbound tourism since 2008 but not a record. 1% increase in visits on 2011 (30.798 visits) slightly
HEADLINES FULL YEAR 2012 (PROVISIONAL) 1 Overall visits 31.148 million visits making 2012 the best year for inbound tourism since 2008 but not a record. 1% increase in visits on 2011 (30.798 visits) slightly
Rules for reimbursement of expenses for delegates attending meetings
 16 March 2017 EMA/MB/144136/2017 Management Board meeting of 16 March 2017 Rules for reimbursement of expenses for delegates attending meetings With effect from 01 April 2017 THE MANAGEMENT BOARD HAVING
OFT 2008 Prel. Comp. UEFA Results and Standings
 OFT 2008 Prel. Comp. UEFA Results and Standings (as after matches on 23.06.2007) OFT > 2008 > Preliminary Round UEFA - Preliminary Round 12.04.2006 Malta - Georgia 1:2 (0:2) TA'QALI 18:00 12.04.2006 Liechtenstein
BALANCED AND FACT BASED. Rebalance the Palm Oil image in Europe Margot Logman, Secretary General EPOA
 BALANCED AND FACT BASED Rebalance the Palm Oil image in Europe Margot Logman, Secretary General EPOA 2 2 Rebalancing the Palm Oil image in Europe 3 3 Goal and commitment Goal The European Palm Oil Alliance
Cumulative Investments by Sector. Cumulative Investment by Country. Industry, Commerce & Agribusiness 18% Transport 30% Natural Resources 2%
 Cumulative Investments by Sector Cumulative Investment by Country Industry, Commerce & Agribusiness 18% Transport 30% Natural Resources 2% SERBIA 45% KOSOVO 2% MONTENEGRO 6% Financial Institutions 30%
INTERNATIONAL REGISTRY IN ORGAN DONATION and TRANSPLANTATION
 INTERNATIONAL REGISTRY IN ORGAN DONATION and TRANSPLANTATION www.irodat.org Final Numbers 2016 December 2017 Dear colleagues On behalf of all IRODaT staff, we are glad to present the 2016 final numbers
INTERNATIONAL REGISTRY IN ORGAN DONATION AND TRANSPLANTATION
 IRODAT INTERNATIONAL REGISTRY IN ORGAN DONATION AND TRANSPLANTATION WWW.IRODAT.ORG Maria Paula Gómez 1, Blanca Pérez 1, Martí Manyalich 1-2 1 Donation & Transplantation Institute, Barcelona 2 Hospital
March 2015 compared with February 2015 Volume of retail trade down by 0.8% in euro area Down by 0.6% in EU28
 03-2006 06-2006 09-2006 12-2006 03-2007 06-2007 09-2007 12-2007 03-2008 06-2008 09-2008 12-2008 03-2009 06-2009 09-2009 12-2009 03-2010 06-2010 09-2010 12-2010 03-2011 06-2011 09-2011 12-2011 03-2012 06-2012
7 th SESSION OF THE MEETING OF THE PARTIES December 2018, Durban, South Africa
 AGREEMENT ON THE CONSERVATION OF AFRICAN-EURASIAN MIGRATORY WATERBIRDS 7 th SESSION OF THE MEETING OF THE PARTIES 04-08 December 2018, Durban, South Africa Beyond 2020: Shaping flyway conservation for
GODINA XI SARAJEVO, BROJ 2 TOURISM STATISTICS. Tourism in BIH, February 2017
 number of nights GODINA XI SARAJEVO, 06.04.2017. BROJ 2 TOURISM STATISTICS Tourism in BIH, February 2017 In February 2017 tourists realised 56,042 tourist arrivals in Bosnia and Hercegovina which represent
WORLD PRESS FREEDOM INDEX 2012
 WORLD PRESS FREEDOM INDEX 2012 1 Finland -10,00 = - Norway -10,00 = 3 Estonia -9,00 - Netherlands -9,00 5 Austria -8,00 6 Iceland -7,00 - Luxembourg -7,00 8 Switzerland -6,20 9 Cape Verde -6,00 10 Canada
The World Pasta Industry in 2011
 The World Pasta Industry in 2011 Survey The World Pasta Industry in 2011 25 October 2012 1 Like every year, we have completed our Annual Survey on the World Pasta Industry. We would like to thank all the
WINGX. The Last 10 Years Change? Cyclical? Structural? Lost decade? 24th April Actionable Business Intelligence
 Actionable Business Intelligence The Last 10 Years Change? Cyclical? Structural? Lost decade? 24th April 2018 WWW.-ADVANCE.COM What s changed, What didn t? Just another cycle? Structural Change? Lost decade?
Travel Policy Fly America Act Compliance Presentation. Presented by: Travel Services
 Travel Policy Fly America Act Compliance Presentation Presented by: Travel Services Agenda Fly America Act Exceptions Open Skies Agreement Documentation Requirements Good News and Bad News CTP demo 3 Travel
Fly America and Open Skies. For Travel on Federal Sponsored Awards
 Fly America and Open Skies For Travel on Federal Sponsored Awards University and Sponsor Travel Policies Federal regulations require the customary standard commercial airfare (coach or equivalent), or
International Civil Aviation Organization WORLDWIDE AIR TRANSPORT CONFERENCE (ATCONF) SIXTH MEETING. Montréal, 18 to 22 March 2013
 SIXTH MEETING. Montréal, 18 to 22 March 2013") International Civil Aviation Organization ATConf/6-WP/52 15/2/13 WORKING PAPER WORLDWIDE AIR TRANSPORT CONFERENCE (ATCONF) SIXTH MEETING Montréal, 18 to 22 March 2013 Agenda Item 2: Examination of key
International Civil Aviation Organization ATConf/6-WP/52 15/2/13 WORKING PAPER WORLDWIDE AIR TRANSPORT CONFERENCE (ATCONF) SIXTH MEETING Montréal, 18 to 22 March 2013 Agenda Item 2: Examination of key
Travel Policy Fly America Act Compliance Presentation. Presented by: Travel Services
 Travel Policy Fly America Act Compliance Presentation Presented by: Travel Services Travel on Federal Funds Federal regulations require (coach or equivalent), the lowest commercial discount airfare to
Summer Work Travel 2019 Season Program Dates by Country For External Use - Updated 11/13/2018
 The program dates are windows of opportunity for program participation. Within this timeframe, students are still subject to their university's official academic break schedule. Even though the window
Call Type PAYU1 PAYU2 PAYU3 Out Of Bundle
 Jan-18 Mobile Tariff Information Headline Rates Call Type PAYU1 PAYU2 PAYU3 Out Of Bundle Calls to Own Mobiles 1p 1p 1p 1p Calls to Own Landlines 1p 1p 1p 1p Calls to UK Landlines (Starting 01, 02, 03)
Россия/Russia + Important roads of Europe 2013 FX
 1 Road coverage CD-ROM 1 CD-ROM 2 ~100 % detailed street Important road of Europe Important road 2 Sales arguments CD-ROM 1 provides updated navigation data with a coverage of ~100 % of important roads
Accounting Basis by Country
 Accounting Basis by Country Egypt Africa Northern Africa Morocco Africa Northern Africa Sudan Africa Northern Africa Western Sahara Africa Northern Africa Angola Africa Sub-Saharan Africa Benin Africa
MAIS3+ assessment: Current practices around Europe
 MAIS3+ assessment: Current practices around Europe Klaus Machata SafetyCube workshop, The Hague, 24 May 2016 Co-funded by the Horizon 2020 Framework Programme of the European Union 5/31/2016 Data collection
Understanding Business Visits
 Understanding Business Visits Foresight issue 153 VisitBritain Research 1 Contents Introduction Summary and Highlights Business Visits in Context UK Business visits and spend Averages Duration of stay
Financial Reporting Standards Adoption by Country
 Financial Reporting Standards Adoption by Country Egypt Africa Northern Africa Morocco Africa Northern Africa Sudan Africa Northern Africa Western Sahara Africa Northern Africa Angola Africa Sub-Saharan
Central Bank of Different Countries
 Country name Afghanistan Albania Algeria Argentina Armenia Aruba Australia Austria Azerbaijan Bahamas Bahrain Bangladesh Barbados Belarus Belgium Belize Benin Bermuda Bhutan Bolivia Bosnia Botswana Brazil
Next Release: 13 April Next Release: 13 April December
 43070 Next Release: 13 April 2018 Next Release: 13 April 2018 December Date of publication: 15 March 2018 TABLE OF CONTENTS Charts 1 Gross consumption of natural gas by OECD region 3 2 Indigenous production
Network Management, building on our experience of flow management and network planning.
 Network Management, building on our experience of flow management and network planning. Giovanni Lenti Head of Network Operation Services The European Organisation for the Safety of Air Navigation Air
IMD World Talent Report Factor 1 : Investment and Development
 THAILAND 2012 2013 2014 2015 2016 Overall Investment & Development Appeal Rank 2016 37 42 24 Readiness 49 of 61 Factor 1 : Investment and Development Total Public Expenditure on Education Percentage of
7 th SESSION OF THE MEETING OF THE PARTIES December 2018, Durban, South Africa
 AGREEMENT ON THE CONSERVATION OF AFRICAN-EURASIAN MIGRATORY WATERBIRDS 7 th SESSION OF THE MEETING OF THE PARTIES 04-08 December 2018, Durban, South Africa Beyond 2020: Shaping flyway conservation for
Common Market Organisation (CMO) Fruit and vegetables sector Evolution of EU prices of some F&V products
 Fruit and vegetables sector Evolution of EU prices of some F&V products") Common Market Organisation (CMO) Fruit and vegetables sector Evolution of EU prices of some F&V products Unit C.2. - Wine, spirits, horticultural products, specialised crops DG Agriculture and Rural Development
Common Market Organisation (CMO) Fruit and vegetables sector Evolution of EU prices of some F&V products Unit C.2. - Wine, spirits, horticultural products, specialised crops DG Agriculture and Rural Development
Child years Standard Rooms in US Dollars CHINA, JAPAN, KOREAN, HONGKONG, TAIWAN & ALL OTHER MARKETS
 ADAARAN CLUB RANNALHI *** (Valid Till : 31 Oct 18) Resort has exclusivity in the Italian, Russia and CIS Markets. Period Single Double Triple Child 2-11.99years Standard Rooms in US Dollars Infant 0-1.99years
LifeWatch, costing and funding. The LifeWatch e-infrastructure financial issues
 LifeWatch, costing and funding The LifeWatch e-infrastructure financial issues LIFEWATCH architecture providing infrastructure services to users User groups can create their own e- laboratories or e-services
2017 European Helicopter Market Update. Matthew Harman MRO Analyst Arlington, VA
 2017 European Helicopter Market Update Matthew Harman MRO Analyst Arlington, VA Agenda Key findings on Fleet & MRO over the next 10-years 1. Scope 2. Fleet current trends, deliveries & retirements 3. MRO
EU Report. Europe SEPTEMBER 2018
 H EU Report Europe SEEMR 2018 ANALYSIS OF HOTEL RULTS SEEMR 2018 An Indian summer for hotels Hospitality activity is good this Fall 2018, confirming the stability of all destinations since the beginning
Passenger growth of 17%, Load Factor higher at 91% Margin expansion (EBITDAR 41.9%, Net Profit 25.1%)
") H1 F17 FINANCIAL RESULTS 9 NOVEMBER 2016 BUSINESS HIGHLIGHTS Passenger growth of 17%, Load Factor higher at 91% #1 market position in CEE Margin expansion (EBITDAR 41.9%, Net Profit 25.1%) CASK ex-fuel
H1 F17 FINANCIAL RESULTS 9 NOVEMBER 2016 BUSINESS HIGHLIGHTS Passenger growth of 17%, Load Factor higher at 91% #1 market position in CEE Margin expansion (EBITDAR 41.9%, Net Profit 25.1%) CASK ex-fuel
ECAC/35-SD EUROPEAN CIVIL AVIATION CONFERENCE THIRTY-FIFTH SPECIAL PLENARY SESSION OF ECAC. (Paris, 18 May 2016) SUMMARY OF DISCUSSIONS
 SUMMARY OF DISCUSSIONS") those EUROPEAN CIVIL AVIATION CONFERENCE ECAC/35-SD 1 CONFERENCE EUROPÉENNE DE L AVIATION CIVILE THIRTY-FIFTH SPECIAL PLENARY SESSION OF ECAC (Paris, 18 May 2016) SUMMARY OF DISCUSSIONS Agenda item 1:
those EUROPEAN CIVIL AVIATION CONFERENCE ECAC/35-SD 1 CONFERENCE EUROPÉENNE DE L AVIATION CIVILE THIRTY-FIFTH SPECIAL PLENARY SESSION OF ECAC (Paris, 18 May 2016) SUMMARY OF DISCUSSIONS Agenda item 1: