IMPLEMENTATION OF INTELLIGENT TRASNPORTATION SYSTEM IN THE CITY OF AHMEDABAD, INDIA
|
|
|
- Katherine McCormick
- 5 years ago
- Views:
Transcription
1 ITS IN AHMEDABAD TRAFFIC IMPACT STUDY REPORT
2
3 TRAFFIC IMPACT STUDY FOR IMPLEMENTATION OF INTELLIGENT TRASNPORTATION SYSTEM IN THE CITY OF AHMEDABAD, INDIA June 2015 Prepared for: Zero Sum Ltd., Japan Prepared by: Radix Project Management Pvt. Ltd. Research Team: Harsh Doshi Yagnesh Dave Mo. Wasim Sayyed
4
5 Table of Contents 1. Introduction... 1 System Architecture... 4 Deployment Plan for ITS System... 8 Literature Review Pre-Implementation Surveys Existing Conditions Route Choice Survey User Perception Survey: Travel Time and Speed Analysis Knowledge Based Expert System Knowledge acquisition: Knowledge elucidation: Knowledge representation: Implementation: Post Implementation Surveys General Route Choice & User Satisfaction Survey User Satisfaction Survey: Travel Time and Speed Analysis Conclusions Faster Data Collection, Analysis & Reporting Higher Mobility Higher Reliability Cost Benefit Analysis Road User Response to the System Summary & Future Scope of Work... 64
6 List of Tables Table 1 Route Choice Survey Dates Table 2 Route Choice Survey Sample Size Table 3 Traffic Analysis Zones Table 4 Route Choice Survey Pattern at EIB Table 5 Route Choice Survey Result Summary at EIB Table 6 Route Choice Survey Pattern at EIB Table 7 Route Choice Survey Result Summary at EIB Table 8 Route Choice Survey Pattern at EIB Table 9 Route Choice Survey Result Summary at EIB Table 10 Route Choice Survey Pattern at EIB Table 11 Route Choice Survey Result Summary at EIB Table 12 Summary of Frequency of Trips at All EIB Locations Table 13 Summary of Purpose of Trips at All EIB Locations Table 14 Summary of Willingness to Use Alternate Route Survey at All EIB Locations Table 15 Summary of User Perception on Usefulness of ITS at All EIB Locations Table 16 Summary of Preferred Medium of Display at All EIB Locations Table 17 List of Routes for Travel Time and Speed Analysis Table 18 Summary of Average Speed and Travel Times (Pre-Implementation) Table 19 Knowledge Acquisition Duration Table 20 Summary of Traffic Parameters at Different Camera Locations Table 21 Governing Rules for Camera Sensors Table 22 Applicable Camera List for Alternate Routes at Each EIB Location Table 23 Route Choice Survey Dates (Post Implementation Stage) Table 24 Route Choice Survey Sample Size (Post Implementation) Table 25 Route Choice Survey Pattern at EIB-1 (Post Implementation) Table 26 Route Choice Survey Pattern at EIB-2 (Post Implementation) Table 27 Route Choice Survey Pattern at EIB-3 (Post Implementation) Table 28 Route Choice Survey Pattern at EIB-4 (Post Implementation) Table 29 Survey Result for Use of ATIS in taking Alternate Route Table 30 Survey Result for Satisfaction with ATIS System Table 31 List of Routes for Travel Time and Speed Analysis Table 32 Summary of Average Speed and Travel Times (Post-Implementation) Table 33 Summary of Traffic Parameters at Different Camera Locations Table 34 Comparison of Average Speed and Travel Times (Pre & Post Implementation Stages) Table 35 User Perception Survey Results from Pre-Implementation Stage Table 36 User Satisfaction Survey Results from Post-Implementation Stage Table 37 Willingness to use Survey Results from Pre-Implementation Stage Table 38 Use of ATIS to Select Alternate Route in Post Implementation Stage... 64
7 List of Figures Figure 1: ITS Implementation Area in the City of Ahmedabad... 3 Figure 2: Zoning Map for Origin Destination and Route Choice Survey... 22
8
9 1 1. Introduction Intelligent Transportation Systems (ITS) improves transportation safety and mobility and enhances productivity through the use of advanced communications technologies. ITS technologies enable data collection, derive logical conclusions ( intelligence ) from the collected data and disseminate the information timely to traffic controllers and road-users. Typically ITS integrates: Information Vehicles; & Infrastructure ITS can help in improving road safety, traffic operations, energy efficiency, environment and thus enhances economic productivity. Interest in ITS comes from the problems caused by traffic congestion, primarily on urban streets and arterials. With the availability of advanced data collection, simulation technologies as well as information processing and dissemination technologies, it became possible to optimize traffic operations without increasing the capacity of urban streets. Typically ITS is used to improve a performance measure without adding capacity to the transportation system. ITS applications are divided into 16 types of technology based systems by the United States Department of Transportation. These are grouped in to two categories: Categories Intelligent Infrastructure ITS Applications Arterial Management Freeway Management Transit Management Incident Management Emergency Management Traveler Information Information Management
10 2 Crash Prevention & Safety Electronic Payment & Pricing Roadway Operations & Maintenance Road Weather Management Commercial Vehicle Operations Intermodal Freight Intelligent Vehicles Driver Assistance Systems Collision Avoidance Systems Collision Notification Systems The development of ITS technologies in India is carried out by CDAC, Thiruvananthapuram (nodal agency, Department of Information Technology) in collaboration with IITs and IIMs. Currently work is being carried out on 8 sub-projects shown in the following table: Project Wireless Traffic Control System Likely End User Local Authorities & Law Enforcement Agencies Second Generation ATCS (Area Traffic Control System) Real Time Traffic Counting & Monitoring Local Authorities in Medium and Large Cities Traffic Planner/Engineers & Development Authorities Intelligent Parking Lot Management System Town Planners & Local Authorities Advanced Travelers Information System Intelligent Transit Trip Planner and Real-time Route Information Road Users & Traffic Planners/Engineers Road Users & Traffic Planners/Engineers

, by providing 14 traffic camera sensors and 4 variable message sign boards on 132 Ring Road.")
11 3 Red Light Violation Detection System Intelligent Traffic Congestion Management System using RFID Law Enforcement Agencies Traffic Planner/Engineers & Development Authorities Zero-Sum Ltd. Japan, who are an experienced wireless communication company of 10 years standing intend to implement a robust ITS system for the City of Ahmedabad. However before embarking upon a full fledge project it proposes to install ITS system on a Trial Basis in the City of Ahmedabad. The system includes provision of Advanced Traveler Information System (ATIS), by providing 14 traffic camera sensors and 4 variable message sign boards on 132 Ring Road. The site locations are shown in Figure 1. Figure 1: ITS Implementation Area in the City of Ahmedabad
12 4 An Advanced Traveler Information System (ATIS) implementation is intended to reduce the travel time and delays in a network by optimizing traffic flow on various links. For the evaluation of the ATIS implementation, a thorough impact analysis needs to be carried out. An impact analysis for an ATIS system is typically done by comparing various performance measures before and after implementation of the ATIS system. Such a study is typically carried out in following stages. Literature review Surveys, Pre and Post Implementations Analysis of Survey data Conclusion This section of the report (Pre-Implementation studies) identifies existing traffic conditions both in qualitative and quantitative terms to assess benefits of the proposed AITS system. The section starts with proposed system architecture and identification of performance measures which are monitored and compared in pre - & post implementation scenarios to assess the impact of ATIS system. System architecture is necessary to be defined prior to implementation to enable smooth coordination amongst various stake holders. System Architecture For the proposed project, wherein no additional capacity is being introduced in the road network, the idea is to optimize traffic flow along available alternate routes. The design of such systems is usually based on the performance measure which is to be optimized. Typically the following performance measures are used to evaluate performance of ITS: Improved & Faster Data Collection Greater Mobility Greater Reliability Road Safety Faster Information Dissemination
13 5 Reduction in Operations and Maintenance Cost Improvement in Air Quality etc. For the current project, the Consultants propose the following performance measures for ITS system Faster Data Collection, Analysis & Reporting Higher Mobility Greater Reliability Reduction in Travel Time for 132 Ring Road To implement the ITS application for the above-mentioned performance measures, an ITS architecture should be developed. ITS architecture means a framework for ensuring institutional agreements and technical integration for implementation of ITS applications or group of applications. Since a National ITS Architecture is not developed in India, the architecture presented in this section, is based on literature reviews and best management principles. Identification of Stakeholders It is important to identify stakeholders (other than Zero-Sum Ltd., Japan) as the architecture will represent how the ITS applications / systems that the stakeholders operate are linked with each other. The following stakeholders are identified for this project: Stakeholder Name Road Agencies Description Ahmedabad Municipal Corporation National Highway Authority of India R&B Department, Government of Gujarat Public Safety Agencies Ahmedabad City Traffic Police Emergency/Medical (108 Service)
14 6 Transit Operators Ahmedabad Municipal Transport Service Agency implementing proposed Metro Link State Motor Carrier Agencies Regional Transport Offices Operational Concept An operational concept identifies proposed ITS applications (from the 16 applications defined above) and future roles of each stakeholder in the operation of the ITS system. The following components are identified for implementation of ITS in Ahmedabad: ITS Application Data Management Description Applications that provide surveillance of the Network (traffic information), manages traffic and disseminates information to road users Arterial Management Systems that monitor Arterial traffic flow, provides strategies such as lane access control to improve the traffic flow etc. Also includes systems to provide information to road users Advanced Traveler Information System (ATIS) Systems that provide static and real-time transportation information to road users. The following table identifies ITS applications, stakeholders and their role/responsibilities:
15 7 ITS Application Stakeholder Role / Responsibility Data Management Traffic Police, AMC, Zero-Sum Collect data using road-side devices Process & Verify the collected data Information Dissemination Arterial Management Traffic Police, AMC, Zero-Sum Monitor Traffic Conditions Operate Traffic Operation Devices like Variable Message Signs (VMS), etc. Advanced Traveler Traffic Police, Information dissemination through Information System (ATIS) Zero-Sum devices like variable VMS etc. Further, all stakeholders are responsible to maintain ITS Inventory under their jurisdiction / operation. Application Development For development of various ITS applications, it is essential to define systems which provides an accessible and service-oriented perspective to the defined architecture. The systems can work in stand-alone mode or in combination with other applications to address project objectives of optimizing performance measures. These packages identify the components of the architecture that are to be implemented. Traffic Detection This includes a traffic management sub-system, from where communication is done with field detectors, and ancillary equipments. In the current deployment, the detectors proposed are traffic camera with mobile communication link to gather information on traffic flow and traffic characteristics. The data generated by these detectors is transferred to a cloud server and thereby to traffic management center. This helps traffic engineers/managers to monitor traffic and identify road conditions, unusual traffic flows, incidents and crashes and collect traffic counts for future planning.
16 8 Traffic Information Dissemination It provides road-users with information on traffic and weather conditions using Variable Message Signs, and in future through cellular data broadcasts (SMS) and internet webcasts. The information that can be disseminated is of wide range like: Dynamic Information: Traffic, Road & Weather Conditions; Work Zone advisory; incident advisory; emergency advisory etc. Static Information: Road Safety slogans; driver advisories etc. Deployment Plan for ITS System A draft deployment plan for ITS along 132 Ring Road in Ahmedabad is prepared based on the above architecture and permissions as obtained by Zero-Sum Ltd., from various stake holders of the project. The schematic layout of the map is shown in Figure 1. Prior to the finalization of deployment plan for ITS, a literature study was carried out to summarize experiences with implementation of similar ITS systems around the world. The following section highlights important lessons learnt from implementation of various ITS system components around the world: Literature Review Under this section, we have studied Data Management Case Study 1: Traffic Detectors along Freeways In Denmark, real-time traffic data are available for the motorway network around Copenhagen. Sensors have been placed over approximately 125 km of the Copenhagen motorway network, mostly in connection with exits and entries to the motorway. These detectors register the number of vehicles, the type of vehicle (lorry or car), and the speed at which the vehicle travels.
17 9 Benefits of System: On the basis of the data collected, the system is able to determine the traffic situation on a given section of motorway. Lessons Learnt: The study shows that data collection through detectors is being used on a certain expressway in Denmark and the system is successful in determining traffic situation a section of the expressway. Further, the study also highlights that detectors were placed at exits and entries to the motorway. However, a sound and accurate algorithm should be used to develop inferences from the collected data. Otherwise, a wrong inference may have adverse effects on the performance of the system. Case Study 2: Traffic Detectors The Washington State Department of Transportation, USA installed a traffic detection system to improve traffic flow and reduce delay at two busy junctions. The system consisted of traffic cameras mounted on existing traffic signal support structures as detectors. Traffic engineers were able to monitor traffic conditions and reduce signal delays by adjusting signal timing at each junction. Benefits of System: Identify or confirm the incidents and abnormal road conditions Useful information to road users. Lessons Learnt: Even though the application is not along an expressway, visual data of the road can help traffic engineers to draw logical inferences about traffic on the expressways to optimize a performance measure.
18 10 Case Study 3: Weather management (General Weather Information) In a Washington State Department of Transportation, USA general travelers were surveyed, 94 percent agreed or strongly agreed that weather information made travelers better prepared for their trips. More than half agreed the information helped them avoid travel delays. Lessons Learnt: Weather information system, if easily accessible, helps daily commuters to plan their trip to avoid inclement weather. Further, the system will be useful only if accurate hourly weather information is available. It may not be possible to deduce such information without the help of Meteorological department. Case Study 4: Weather management (Wind Detection) Oregon, USA: Automated wind warning systems were installed at two rural Oregon locations to alert motorists of high crosswind conditions. Message signs are located at each end of the corridor or bridge where motorists can decide to wait until the winds die down or to take a longer alternative route. The systems, which are similar, consist of a local wind gauge (anemometer) with continuous input to a flashing beacon on a static message sign. Communication to the warning signs is automated and is provided by using dialup phone service. The warning signs are activated when average wind speeds reach a predetermined threshold. The severity is automatically recorded. Once verified by staff at the transportation management center, a warning message is posted to the Oregon DOT Trip Check Web site. The signs are deactivated when the wind speed drops below the threshold.
19 11 Lessons Learnt: Weather information system, if easily accessible, helps commuters to plan their trip to avoid inclement weather or drive with access caution. Case Study 5: ATIS: Highway Advisory Radio In a Washington State Department of Transportation, USA sponsored survey of commercial vehicle operation companies, 57 percent of respondents said the availability of the new highway advisory radio (HAR) system made them somewhat or a lot safer. Of those interviewed during the post-deployment period, 56 percent indicated they tuned in to one or both of the HAR stations while traveling in the area, and 51 percent found the HAR messages useful. General travelers were also surveyed, and 94 percent agreed or strongly agreed that the website road weather information made travelers better prepared for their trips. More than half agreed the information helped them avoid travel delays. Benefits of System / Lessons Learnt: Useful information to road users. Case Study 6: ATIS: Webcasts Pennsylvania, USA: An Internet survey of users of traveler information websites in Philadelphia and Pittsburgh, Pennsylvania, found that 86% of users in Philadelphia and 68% of users in Pittsburgh had changed their original travel route for at least one of their trips based on information received. Benefits of System / Lessons Learnt: Useful information to road users.
20 12 Case Study 7: ATIS: Variable Message Signs Malaysia: The MRR1 freeway area in Kuala Lumpur studied the accuracy of VMS display travel time estimates, and driver response to display messages of varying lengths and formatting. Results show that usage of variable message signs reduces the average travel times during the duration of the incident until the clearing of the resulting congestion by a significant amount. Under the presence of VMS, there is a significant shift of people from higher travel times in case of incident to lower travel times. Lessons Learnt: VMS are most effective when there are alternate routes available to road users, otherwise the information may not be of much use to the road users. Traffic Management Case Study 1: Incident Management In the United States, The Vehicle Probe Project (VPP) has been providing data the member agencies since The agencies have recognized the benefits of VPP data to their respective departments of transportation, traffic management centers, and the public they serve. During a surprise snowstorm in October 2008, the New Jersey Department of Transportation (NJDOT) Traffic Operations Center was reviewing an accident on Interstate 80 (expressway) via a closed circuit television (CCTV) camera. The VPP monitoring site identified a second incident where CCTV coverage was not available that involved multiple jack-knifed tractor-trailers along I-80. The knowledge gained from the VPP about the second incident enabled responders to attend to the second incident by as much as an hour than what would be possible without the VPP. The expedited response to the second incident translated into an estimated $100,000 savings in user delay costs.
21 13 Lessons Learnt: A vehicle probe may simply be a patrol vehicle equipped with camera and transmission devices. Such vehicles may be very effective in sending realtime incident data to the traffic management center, thereby reducing the response time to incidents. Law Enforcement Case Study 1: Enforcement: Variable Message Signs Colorado, USA: The Rural ITS Toolbox noted a relatively low-tech approach that was used by Colorado DOT to address high speed trucks in mountainous terrain. Colorado DOT has many highways that run through the mountains and have high truck traffic. The Colorado DOT s experience reveals the following with regard to reducing truck speeds on dangerous curves. Consider using simple radar speed detection devices in combination with dynamic message signs (DMS). To convey to truck drivers their current speed and to warn them of impending curves ahead that cannot be safely negotiated at their current speed, use simple radar speed detection devices in combination with DMS. The relatively low-cost system has seen dramatic results. Speed studies conducted before and after the system was installed revealed a reduction in 85th percentile truck speed from 66 to 48 mi/h. Benefits of System: Pre-trip information, On-trip Driver information, Personal Information Services, Route Guidance and Navigation Variable message signs have greater impact on road safety avoiding incidents, traffic congestion etc.
22 14 Lessons Learnt: In India, education and enforcement are essential for proper utilization of the advisory information provided through VMS. A simple ITS application can be developed using different system components to address specific issues. For example, a speed indicator device and High Resolution CCTV Camera can be used to take pictures of over-speeding vehicles on expressway. Case Study 2: Enforcement: Speed Indicator Devices London, UK: Britain's M25 motorway, which circumnavigates London. On the most heavily-traveled 14-mile (23 km) section (junction 10 to 16) of the M25 variable speed limits combined with automated enforcement have been in force since Initial results indicated savings in journey times, smoother-flowing traffic, and a fall in the number of accidents, so the implementation was made permanent in Further trials on the M25 have been thus far proved inconclusive. Speed management is a key theme in London s Road Safety Plan 2001 (Transport for London, 2001). In 2006, a third of killed or seriously injured (KSI) casualties in London were caused by collisions where excessive or inappropriate speeds were recorded as contributing to the collision. Reducing vehicle speeds in London is therefore an important issue. The final 11 sites were then selected so that they were all 30mph sections of two-way single carriageway roads with no traffic calming, speed cameras, red light cameras, major junctions, sharp bends and no or few pedestrian crossings (any of these may influence drivers speed choice). In addition, Speed Indicator Devices (SIDs) have the potential for being an additional method for reducing excessive speeds. Benefits of System:
23 15 An overall speed reduction of 1.4mph was detected across all sites whilst the SIDs was operational. The reduction varied between sites from 0.6mph to 2.6mph. The proportions of drivers exceeding 30mph and 36mph (ACPO guidelines) were significantly reduced at all sites. It is estimated that the overall reduction in speed would lead to a 5.6% reduction in collisions occurring in the area whilst a SID was operational. Reducing vehicle speeds in London is therefore an important issue in road safety that could reduce the number of road casualties in London.
24 16
25 17 2. Pre-Implementation Surveys Existing Conditions Existing Roadway Network The road network in the city of Ahmedabad has many circular roads called the ring roads which are connected many radials. These radials carry traffic from different parts of the city towards the city center. A combination of these ring roads and radials gives road users multiple route options to reach their destinations. The river of Sabarmati runs from North to South and divides the city of Ahmedabad in to two parts viz. Eastern and Western part. The project road, i.e. 132 Ring Road is an important North-South arterial in the western part of the City of Ahmedabad. It originates near RTO circle and terminates at APMC junction on Ashram Road. It passes through Vadaj, Naranpura, Memnagar, Vastrapur, Satellite and Jivraj Park localities. Important Junctions along 132 Ring Road are RTO, Vadaj, AEC, Helmet Cross Road, IIM or Andhjan Cross Road, Keshavbaug Junction, Shivranjni Junction, Shyamal Junction, Jivraj Park Junction and APMC Junction. Existing Traffic Conditions Prior to the implementation of the ATIS system, it is essential to know existing traffic conditions. There are numerous traffic parameters which can be identified for the study, however as per the performance measures identified in the system architecture, the following traffic conditions needs to be assessed prior to the implementation of ATIS system: a. Origin and Destination of Traffic using 132 Ring Road b. Route taken to reach Destination Further, since the ATIS system is being implemented for the first time in the City of Ahmedabad, it is necessary to identify perception of road users towards such system. As the principle aim of ATIS is to optimize traffic in a network, a willingness survey was also conducted to assess if people will use alternate route to reduce their travel times.
26 18 Lastly, travel time study was carried out within the project influence area to estimate if there are any changes in the travel times after implementation of the ATIS system. The following sections summarizes survey results conducted to assess traffic pattern around 132 Ring Road. Route Choice Survey Finding a shortest route (in terms of distance and time) by taking into account all network features is a difficult task. The problem complexity increases when taking into account combination of transport modes available. There are many factors which influence choice of route, the principal ones being travel time and comfort. The principal aim of this research is to assess how awareness of alternative route affects travelers choice. To assess the feasibility of Advanced Traveler Information System (ATIS), it is essential to identify how many travelers are willing to take alternative routes in first place. Further, it should be noted that travelers can only choose routes of which they are aware of; hence the effectiveness of ATIS may be limited in case alternate routes are not known completely to the users. The Route Choice Survey is carried out to understand road user s route choice behavior and to collect information about their commute. The basic aims are to 1. To identify principle flow pattern of traffic around 132 Ring Road. 2. Develop a suitable display strategy for improving drivers route choice by providing information which is easy to understand 3. Develop base case parameters to assess if ATIS system affecting selection of road by road users to reach their destination A survey instrument was designed as shown in Appendix 1. The instrument has general questions related to their trip like origin, destination, route taken, frequency, and purpose of trip. Then the road users were explained how the ATIS system will work. The user was later asked questions on how they perceive the usefulness of ATIS will be in making an alternate route choice. Then the road users were shown two options for ATIS
27 19 display Written and Map. The purpose was to identify how their preferable option considering the amount of time available to them in processing the information shown to taking a decision for an alternate route. Route choice survey was done at all proposed Electronic Information Board locations. Appendix 2 shows some photographs taken during the survey. The survey was conduction at the following dates at each EIB location: Table 1 Route Choice Survey Dates Location Date of Survey EIB 1 23 rd September, 2014 EIB 2 24 th September, 2014 EIB 3 25 th September, 2014 EIB 4 26 th September, 2014 A large number of samples were taken at each location. However, the first step in the analysis is to purge samples with incomplete data and inaccurate data. The following table summarizes the sample size taken and sample size considered in the analysis. Table 2 Route Choice Survey Sample Size Location Samples Taken Samples Considered EIB EIB EIB EIB Outcome of Route Choice Survey: Origin Destination Survey Origin-Destination surveys have been conducted each EIB Location as a part of route choice survey to establish the traffic flow pattern around 132 Ring Road. The data collected has been analyzed to obtain the travel characteristics of the road users of
28 20 three categories two wheelers, three wheelers and four wheelers. The desired pattern of the road users has been established on the basis of the O-D survey data and the traffic zones formulated for the same. The survey data collected by random sampling includes interviewing of three categories of vehicles defined above. The drivers are interviewed for origin and destination, trip length, frequency and the route travelled etc. In addition the purpose of trip for passenger vehicles is also collected and analyzed. Zoning System The location of Origin and Destination zones has been determined in relation to each individual traffic survey station and the possibility of traffic diversion. The analysis of O- D data starts with coding of zones, i.e. categorizing the traffic with respect to its origin and destination. Each zone is designated with a unique code. These codes are termed as O-D Traffic analysis Zones (TAZ). In total, 23 zones were identified for the O-D survey analysis of the project road. The list of traffic analysis zones and respective codes are indicated in Table 3 and zoning map is enclosed at Figure 2. Table 3 Traffic Analysis Zones Zone Code Zone Name 1 Narol Aslali Ghodasar 2 Vejalpur, Juhapura 3 Sanand Viramgam, Ujala, Sarkhej, 4 Anandnagar 5 Iscon, Bopal, Ambli 6 Pakwan, Judges Bunglow, Sindhu Bhavan Road, Shilaj 7 Thaltej 8 Drive-in Road 9 Vastrapur, Vatrapur Lake 10 Mansi Cross Road 11 Andhjan Mandal
29 21 Zone Code Zone Name 12 Keshavbaug 13 Shivranjni 14 Shyamal Cross Road 15 Vejalpur Cross Road 16 APMC 17 Anjali, Paldi 18 Dharnidhar Cross Road 19 Manekbaug Cross Road 20 Nehrunagar Cross Road 21 Panjrapole 22 Towards Vijay Cross Road, University Area 23 Helment Cross Road
30 Figure 2: Zoning Map for Origin Destination and Route Choice Survey 22
31 23 EIB 1 Location at APMC Market Origin Destination Pattern The OD matrix at EIB-1 is shown in Appendix 3. From the survey it is clear that the majority of traffic at EIB-1(about 60%) originates from Zones 1, 2 and 3 and is bound towards Zone 17 (i.e. towards 120 Ring Road at Anjali Cross Road and further towards Paldi). The rest of the traffic takes a left turn on 132 ring road to reach other destinations. Of these about 11% of the traffic is destined towards Helmet Cross Road (Zone 23), which can be considered as through traffic for 132 Ring Road. Other major destination from APMC market is towards Zone 13 Shivranjni cross road (about 12.93%). It should be noted that since the majority of the traffic is bound towards Anjali Cross Road, there is a high probability of diverting this traffic on 132 Ring Road and then through an alternate route to its further destinations towards and beyond Paldi area. Route Choice Survey The Route Choice matrix at EIB-1 is shown in Appendix 4. It is apparent from the OD matrix at APMC junction that a majority of the traffic goes straight to Anjali Cross Road. In order to reduce the resulting congestion between APMC and Anjali, it is necessary to identify how many trips can be diverted to 132 Ring Road. The destination zones of interest in this case to analyze are from 18 to 23. Further, there will be some traffic which uses a part of 132 Ring Road to reach Anjali Cross Road. This traffic is actually aware of alternate route available to reach its nearest destination. Destination Zone Table 4 Route Choice Survey Pattern at EIB-1 % of Total Traffic % Using 132 Ring Road % Using 120 Ring Road Zone 23 (Helmet Circle) 11.00% 76.25% 23.75% Zone 22 (Vijay Cross Road) 2.20% 12.50% 87.50% Zone 20 (Nehrunagar Cross Road) 1.65% 50% 50%
32 24 Destination Zone % of Total % Using 132 % Using 120 Traffic Ring Road Ring Road Zone 19 (Manekbaug Cross Road) 0.83% 66.67% 33.33% Zone 17 (Anjali Cross Road) 60.25% 11.64% - Table 5 Route Choice Survey Result Summary at EIB-1 Destination Zone Traffic Already Using Traffic which may be Alternate Route diverted Zone 23 (Helmet Circle) 2.61% Zone 22 (Vijay Cross Road) 1.93% Zone 21 (Panjrapole Cross Road) Zone 20 (Nehrunagar Cross Road) 0.83% Zone 19 (Manekbaug Cross Road) 0.28% Zone 18 (Dharnidhar Cross Road) Zone 17 (Anjali Cross Road) 7.02% Total 7.02% 5.64% EIB 2 Location near Shyamal Junction Origin Destination Pattern The OD matrix at EIB-2 is shown in Appendix 5. From the survey it is clear that the majority of traffic at EIB-2(about 61.26%) originates from Zones 4 (Anandnagar). The traffic seems to be equally divided on all three directions with Zone 14, 17, 20 and 23 having more or less equal splits of destination share. The major destination routes are thus Nehrunagar, Manekbaug and Anjali Cross Roads. It should be noted that since the traffic is bound on three alternate routés from EIB-2, there is a high probability of diverting this traffic on an alternate route to its further destinations. For example, traffic bound towards Anjali Cross Road can use Manekbaug and traffic bound towards Nehrunagar can also use Manekbaug to reach their destination instead of using 132 Ring Road.
33 25 Route Choice Survey The Route Choice matrix at EIB-2 is shown in Appendix 6. It is apparent from the OD matrix at Shyamal junction that the traffic is equally bound towards Nehrunagar, Manekbaug and Anjali Cross Roads. Since the network flow seems to be balanced at this point, there is a high probability of diverting traffic on alternate routes in special conditions like traffic jams or accidents. In order to reduce the resulting congestion during special events, it is necessary to identify how many trips can be diverted on alternate roads. Table 6 Route Choice Survey Pattern at EIB-2 Destination Zone % of Total % Using 132 % Using 120 Traffic Ring Road Ring Road Zone 23 (Helmet Circle) 10.23% 93.62% 6.38% Zone 20 (Nehrunagar Road) 21.44% 51.78% 48.22% Zone 17 (Paldi Anjali Cross Road) 17.74% 41.10% 58.90% Zone 14(Nr. Shyamal Junction) 14.80% Trip Termination Zone Zone 1 (Narol, Aslali, Ghodasar) 7.73% 76.06% 23.94% Table 7 Route Choice Survey Result Summary at EIB-2 Destination Zone Traffic Already Using Traffic which may be Alternate Route diverted Zone 23 (Helmet Circle) 0.65% 9.90% Zone 20 (Nehrunagar Road) 9.25% 12.19% Zone 17 (Paldi Anjali Cross Road) 8.05% 9.68% Zone 1 (Narol, Aslali, Ghodasar) 0.44% 7.29% Total 18.39% 38.74%
34 26 EIB 3 Location near Shivranjani Junction The OD matrix at EIB-2 is shown in Appendix 7. From the survey it is clear that the majority of traffic at EIB-2(about 79.42%) originates from Zones 1,4,14, 15 and 16 (Shyamal). Majority of the trips terminate in Zone 13 i.e. around Shivranjni junction (about 35.64%), while a number of trips terminate in and beyond Zone 23 (17.67%). Route Choice Survey The Route Choice matrix at EIB-3 is shown in Appendix 8. It is apparent from the OD matrix at Shivranjni EIB Location that the traffic is equally bound towards Shivranjni, Helmet Cross Road and Nehrunagar zones. The only traffic that may be diverted is the trips terminating in Zone 23 and 20 which can use alternate routes from this location. In order to reduce the resulting congestion during special events, it is necessary to identify how many trips can be diverted on alternate roads. Table 8 Route Choice Survey Pattern at EIB-3 Destination Zone % of Total % Using 132 % Using 120 Traffic Ring Road Ring Road Zone 23 (Helmet Circle) 17.67% 84.66% 15.34% Zone 20 (Nehrunagar Road) 9.34% 17.20% 82.18% Zone 13 (Shivranjni) 35.64% Termination Zone Table 9 Route Choice Survey Result Summary at EIB-3 Destination Zone Traffic Already Using Traffic which may be Alternate Route diverted Zone 23 (Helmet Circle) 2.71% 14.96% Zone 20 (Nehrunagar Road) 1.61%% 7.73% Zone 13 (Shivranjni) Termination Zone Total 4.32% 38.74%
35 27 EIB 4 Location at Mansi Origin Destination Pattern The OD matrix at EIB-4 is shown in Appendix 9. From the survey it is clear that the majority of traffic at EIB-4(about 63.64%) originates from Zones 4 and next majority of traffic originates from Zone 7. Majority of this traffic is bound towards Zone 13 and 20 (about 34.72%) while about 26.08% traffic terminates in Zone 9 and 10. Further a healthy 6.11% traffic is bound towards zone 21 which also has a choice of alternate route at EIB 4. Route Choice Survey It is apparent from the OD matrix at Mansi junction that a majority of the traffic is bound towards Nehrunagar,Shivranjni and Panjrapole. In order to reduce the resulting congestion between Mansi and Keshavbaug, it is necessary to identify how many trips can be diverted away from 132 Ring Road. The destination zones of interest in this case to analyze are from 21, 13 and 20. Destination Zone Table 10 Route Choice Survey Pattern at EIB-4 % of Total Traffic % Using 132 Ring Road % Using Alternate Route Zone 21 (Panjrapole Circle) 6.11% 7.32% 92.68% Zone 20 (Nehrunagar Road) 14.46% 100% 0% Zone 13 (Shivranjni) 20.27% 100% 0% Table 11 Route Choice Survey Result Summary at EIB-4 Destination Zone Traffic Already Using Traffic which may be Alternate Route diverted Zone 21 (Panjrapole Circle) 5.51% 0.45% Zone 20 (Nehrunagar Road)
36 28 Destination Zone Traffic Already Using Traffic which may be Alternate Route diverted Zone 13 (Shivranjni) Total 5.51% 0.45% User Perception Survey: Along with the origin-destination and route choice survey, a user perception survey was also conducted to indentify how general road users perceive the ATIS system being installed. The perception survey captured the following aspects: a. Frequency of Trip b. Purpose of Trip c. Willingness to use alternate route d. Perception on usefulness of ATIS e. Medium preferred to display information on ATIS Frequency of Trips The users were asked What is the frequency of your trip. (Daily, Weekly or Monthly) at all four survey locations. Overwhelming majority of respondents answered that their frequency of trips is daily at all four EIB Locations. The following table summarizes respondent s frequency of trip: Table 12 Summary of Frequency of Trips at All EIB Locations Description APMC Shyamal Shivranjni Mansi Daily 69.97% 79.46% 89.07% 92.71% Weekly 26.86% 18.37% 8.73% 4.17% Monthly 3.17% 2.17% 2.21% 3.13% Purpose of Trips The users were asked What is the purpose of your trip. (Business, Educational, Recreational or others) at all four survey locations. Overwhelming majority of respondents answered that their purpose of trips is business related at all four EIB Locations. The following table summarizes respondent s purpose of trip:
37 29 Table 13 Summary of Purpose of Trips at All EIB Locations Description APMC Shyamal Shivranjni Mansi Business 86.68% 85.33% 90.87% 92.86% Education 4.40% 7.28% 4.91% 3.57% Miscellaneous 8.93% 5.11% 2.31% 0.74% Recreation 2.28% 1.91% 2.83% Willingness to Use Alternate Route The users were asked Will you follow any alternate route if it saves your time even though the alternate route may be a bit longer? at all four survey locations. Overwhelming majority of respondents answered that their purpose of trips is business related at all four EIB Locations. The following table summarizes respondent s purpose of trip: Table 14 Summary of Willingness to Use Alternate Route Survey at All EIB Locations Description APMC Shyamal Shivranjni Mansi Yes 93.52% 86.63% 88.16% 84.97% No 6.48% 13.37% 11.84% 15.03% Perception of ATIS The users were asked On a scale of 1 to 10, do you a think a system which provides traffic information on available alternate route help you to select alternate routes? (10 being most helpful and 1 being not at all helpful) at all four survey locations. Overwhelming majority of respondents answered that they will find the system useful (range 8-10). Table 15 Summary of User Perception on Usefulness of ITS at All EIB Locations Description APMC Shyamal Shivranjni Mansi <5 (Not Useful) 2.3% 3.2% 3.8% 1.9% % 21.6% 19.1% 13.5% 8-10 (Useful) 76.5% 75.2% 77.1% 84.5% Medium preferred to display information on ATIS The users were asked Which medium do you think is easier for you to process information on alternate route (map, text or both)?at all four survey locations.
38 30 Overwhelming majority of respondents answered that they prefer to read map at all four EIB Locations. The following table summarizes respondent s answers: Table 16 Summary of Preferred Medium of Display at All EIB Locations Description APMC Shyamal Shivranjni Mansi Map 80.22% 77.72% 75.63% 80.65% Written 19.78% 18.80% 21.87% 16.37% Both 0.00% 3.48% 2.51% 2.98% Travel Time and Speed Analysis The purpose of the travel time and speed study is to evaluate the quality of traffic movement along a route and to determine the locations, types and extents of traffic delays. The efficiency of flow is measured by travel and running speeds. In the actual study, total travel and running times are observed and then converted into speed measures. Before starting the test runs, major intersections or suitable control points were selected along the study route as reference/control locations. The project influence area was divided into seven (7) sections based on the traffic characteristics of the network. These seven sections are summarized below: Table 17 List of Routes for Travel Time and Speed Analysis Route 1 From Information Board 1 to Andhjan Cross Roads (132 Ring Road) Route 2 From Information Board 1 to APMC T-Junction to Anjali Cross Roads Route 3 From Information Board 2 to Jivraj Park Cross Roads to 120 Ring Road Route 4 From Information Board 2 to Manek Baug Cross Roads Route 5 From Jodhpur Cross Roads to Nehrunagar Circle Route 6 From Mansi Cross Roads to Keshav Baug T-Junction to Andhjan Cross Roads Route 7 From Mansi Cross Roads to Andhjan Cross Road (Via Camera 10) Route plans are shown in Appendix 11.
39 31 A test vehicle is driven along the study route in accordance with moving car technique, in which, a safe level of vehicular operation is maintained by observing proper following and passing distances and by changing speed at reasonable rates of acceleration and decelerations. Delay information is recorded when the traffic flow is stopped or greatly impeded. The duration of traffic delay is measured in units of time along with notations of the corresponding location, cause and frequency of delay to travel. The following table summarizes average speed and travel times on each of these routes during morning, afternoon and evening peak hours. Section-wise travel times and speed on each of these links are also summarized in Appendix 12. Table 18 Summary of Average Speed and Travel Times (Pre-Implementation) Morning Peak Afternoon Peak Evening Peak Route No. Travel Travel Travel Speed Speed Speed Time Time Time (kmph) (kmph) (kmph) (min) (min) (min)
40 32
41 33 3 Knowledge Based Expert System The knowledge based expert system is aimed to assess traffic scenario at any given time in the network by deriving logical inferences from traffic data available from the traffic camera sensors. This data can be used to finalize what information is to be provided to the road users based on the sensor outputs. The system is developed based in the following four steps: Knowledge acquisition: This step involves meeting with Traffic Police Department, review of any documents related to traffic flow available with the department as well as extrapolation of traffic data available from the traffic camera sensor. Traffic data was extrapolated from camera sensor between the following dates: Table 19 Knowledge Acquisition Duration Camera No. Location Data Analysis Period Nr. Anjali Cross Cam1 Roads Dec1 12:00 AM to Dec14 11:59 PM (14- Cam2 TV9 days) Cam3 Jivraj Road Cam4 Flyover Cam5 Manekbaug Data Unavailable Cam6 Shivranjni Cam7 Nehrunagar Cam8 Keshavbaug Cam9 IIM Dec1 12:00 AM to Dec14 11:59 PM (14- Cam10 Before IIM Flyover days) Cam11 VMS-1 Cam12 VMS-2 Cam13 VMS-3 Cam14 VMS-4
42 34 Knowledge elucidation: This step involves processing of expert knowledge to clarify different aspects of the input acquired from the experts and other sources. The knowledge in this study is categorized to develop simple general rules that are applicable to the ATIS system, performing under various traffic and network conditions. For example, if the sensor shows zero traffic, then either there is no traffic or a small incident which is blocking traffic on the link. The algorithm design to assess traffic conditions relies on average speed observed during 1-minute intervals. From the available raw data, speed density relations were plotted and regression lines were plotted to estimate free flow speed & Jam Density. The result is summarized in the following table: Table 20 Summary of Traffic Parameters at Different Camera Locations Camera Free Flow Jam Density Speed (y) Density (x) Location No. Speed (kmph) (vehicles/km) Equation Cam1 Nr. Anjali Cross Roads Speed = -0.1 x density Cam2 TV speed = x density Cam3 Jivraj Road speed = x density Cam4 Flyover speed = x density Cam5 Manekbaug Cam6 Nehrunagar speed = x density Cam7 Shivranjni speed = x density Cam8 Keshavbaug speed = x density Cam9 IIM speed = 0.21 x density Cam10 Before IIM Flyover speed = x density Cam11 VMS speed = x density Cam12 VMS speed = x density Cam13 VMS speed = x density Basic Speed Density Curves are summarized in Appendix 13. The above relationships will be used in deriving expert system parameters where speed will be used to assess traffic levels on different links. For example, if vehicles consistently log free flow speed
43 35 with lower values of density, then the traffic is under saturated. If vehicles consistently log lower speeds with density nearing jam density, then the traffic flow is saturated. Some basic speed characteristics during different time of day are summarized in Appendix 14. These are used to identify peak hours at each sensor location throughout the day. Knowledge representation: This step is the development of a rules or rule base using the expert knowledge obtained and processed previously. In this step, basic simple rules for individual EIB Locations are developed to assess traffic conditions. After thorough review of the available data, important attributes to be used in the classification process are identified. It appears that due to the heterogeneous nature of traffic, the speed-density curves do not show jam density. At certain locations, the slope of the curvatures is positive which gives a completely opposite to the standard speed density relations. With availability of more data, these curves may be improved to achieve greater similarity between actual and standard speed density curves. In absence of the standard speed-density curves, it is difficult to define saturation levels of the traffic. However, based on the available traffic data and research in India, the consultants propose the following parameters describing traffic conditions are selected as set of attributes: 1. Traffic Condition Traffic Condition Over Saturated Saturated Under Saturated Speed <20 kmph 20 to 30 kmph >30kmph 2. Time of Day 1. Peak Hour 2. Off Peak Hour 3. Special events 1. Traffic Jam at Intermediate Nodes 2. Road Diversions / Closure etc.
44 36 Since the traffic sensor camera is at fixed locations, there may be some events happening between two detectors which may trigger special traffic scenario. These have to be detected with the help of traffic police. For example, between VMS-1 and Camera -1, there may be traffic jam near Vasna Bus Stop. Since our camera is located right at Anjali cross road, we may not be able to detect the Jam at Vasna Bus Stop. As a result, the Anajali Cross Road is fed less traffic which may lead us to show fast traffic on link between VMS-1 and Camera-1 whereas the condition is actually opposite. The governing rules for camera sensors are summarized in the following table: Table 21 Governing Rules for Camera Sensors Rules Rule 1 Level of Saturation Time of Day Special Events Under Saturated Peak Hour Yes Rule 2 Saturated Peak Hour Yes Derivation Very Slow Moving Traffic Very Slow Moving Traffic Very Slow Moving Traffic Rule 3 Over Saturated Peak Hour Yes Under Rule 4 Saturated Peak Hour No Fast Moving Traffic Rule 5 Saturated Peak Hour No Slow Moving Traffic Very Slow Moving Rule 6 Over Saturated Peak Hour No Traffic Under Very Slow Moving Rule 7 Saturated Off Peak Hour Yes Traffic Very Slow Moving Rule 8 Saturated Off Peak Hour Yes Traffic Very Slow Moving Traffic Rule 9 Over Saturated Off Peak Hour Yes Under Rule 10 Saturated Off Peak Hour No Fast Moving Traffic Rule 11 Saturated Off Peak Hour No Slow Moving Traffic Rule 12 Over Saturated Off Peak Hour No Very Slow Moving Traffic
45 37 Implementation: This step involves the implementation of expert rules. In this case, the rule base is developed in the form of a database of rules that represent various factors related to the network and recommendations in the form of if then rules. As a first step, for each VMS location, applicable camera sensors are identified. Then the camera sensors are grouped together such that each group falls along one alternate route location. For example at VMS 1, Cam2 and Cam3 can be grouped together to identify traffic on alternate route. If any of Cam2 or Cam3 shows very slow traffic, it is advisable to use Route along Cam1 to reach the destination. VMS Location Table 22 Applicable Camera List for Alternate Routes at Each EIB Location Alt Route 1 Alt Route 2 Alt Route 3 Alt Route 4 VMS 1 Cam1 Cam 2, Cam3 VMS2 Cam4, Cam2, Cam1 VMS 3 Cam9, Cam8 Cam6 Cam4, Cam3 Cam 5 Cam 13, Cam 6 VMS 4 Cam7 Cam8, Cam9 Cam10 Based on the above table, if inference from any of the above camera is very slow traffic, it is advisable not to use that route. The projection on the LED may be changed accordingly.
46 38
47 39 4. Post Implementation Surveys General The City of Ahmedabad has envisioned the need to upgrade its infrastructure at a very sophisticated scale to meet the needs for economic growth. The Ahmedabad Municipal Corporation (AMC) along with Ahmedabad Traffic Police (ATP) is primarily responsible for maintaining traffic flow and safety on city roads by the way of construction of roads, maintenance of roads, construction of traffic signals and law enforcement. As a part of its modernization drive AMC entered in to an agreement with Zero Sum Ltd., Japan to provide state-of-art Advanced Traveler Information System (ATIS) on one of the city corridors on a trial basis. The objectives of the project are to understand the effectiveness Intelligent Transportation System Application in heterogeneous traffic conditions prevailing in Ahmedabad. Further, the study also aims to study viability of such project through innovative methods in public private partnership. As a part of the study, a pre-implementation traffic survey was conducted to identify existing traffic conditions. This section of the report summarizes post implementation study of traffic conditions by way of conducting different traffic surveys. The results of post implementation surveys are compared with pre-implementation surveys to assess any changes in the traffic conditions and subsequently the effectiveness of ATIS system. Route Choice & User Satisfaction Survey Survey Goals and Objectives The survey goal is to find Road User s Satisfaction levels with the ATIS system and thereby understanding the effectiveness of the ATIS system. The specific objectives of the survey are: Elicit view on user satisfaction with the current ITS system To highlight road user satisfaction, experience and suggestions on ATIS system To develop greater understanding of road users need and expectations
48 40 The study should provide inputs for further improvement of road network, its operation and management on the proposed road corridor To submit the finding of surveys to the client. Survey Locations The survey was done at all Electronic Information Board locations shown in Figure 1 at the following dates: Table 23 Route Choice Survey Dates (Post Implementation Stage) Location Date of Survey EIB 1 23 rd December, 2014 EIB 2 24 th December, 2014 EIB 3 25 th December, 2014 EIB 4 26 th December, 2014 A large number of samples were taken at each location. However, the first step in the analysis is to purge samples with incomplete data and inaccurate data. The following table summarizes the sample size taken and sample size considered in the analysis. Table 24 Route Choice Survey Sample Size (Post Implementation) Location Samples Taken Samples Considered EIB EIB EIB EIB A survey instrument shown in Appendix 15 was designed for the survey. Outcome of the Survey: Destination Route Followed Survey
49 41 Destination route followed surveys have been conducted each EIB Location as a part of user satisfaction survey to establish a pattern of route selection post implementation of ATIS. The data collected has been analyzed to obtain the travel characteristics of the road users. The desired pattern of the road users has been established on the basis of the traffic zones formulated within the influence area of the ATIS. The surveyed data collected by random sampling includes interviewing of three categories of vehicles defined above. The drivers are interviewed for destination, route followed, use of information board for route selection to reach their destination and satisfaction level with current information board. Further, the users gave a feedback of the system on their own which were also recorded. Zoning System The location of Destination zones has been determined in relation to each individual traffic survey station and the possibility of traffic diversion. The analysis of data starts with coding of zones, i.e. categorizing the traffic with respect to its origin and destination. Each zone is designated with a unique code. These codes are termed as Traffic analysis Zones (TAZ). In total, 23 zones were identified for the survey analysis of the project road. The list of traffic analysis zones and respective codes are indicated in Table 3 and zoning map is shown at Figure 2. The zoning system used in the post implementation survey was same as the one used in pre-implementation surveys. EIB 1 Location at APMC Market Route Choice Survey The Route Choice matrix at EIB-1 is shown in Appendix 16. It is apparent from the OD matrix presented in the pre-implementation report that at APMC junction that a majority of the traffic goes straight to Anjali Cross Road. In order to reduce the resulting congestion between APMC and Anjali, it is necessary to identify if any trips are using 132 Ring Road. The destination zones of interest in this case to analyze are from 18 to 23.
50 42 Further, there will be some traffic which uses a part of 132 Ring Road to reach Anjali Cross Road. This traffic is actually aware of alternate route available to reach its nearest destination. Table 25 Route Choice Survey Pattern at EIB-1 (Post Implementation) Destination Zone % Using % Using % of Total 132 Ring 120 Ring Traffic Road Road Zone 23 (Helmet Circle) 9.35% 91.47% 8.53% Zone 22 (Vijay Cross Road) 2.86% 22.38% 77.62% Zone 20 (Nehrunagar Cross 2.15% 41.86% 58.14% Road) Zone 19 (Manekbaug Cross 1.25% 59.20% 40.80% Road) Zone 17 (Anjali Cross Road) 62.50% 2.56% - EIB 2 Location near Shyamal Junction Route Choice Survey The Route Choice matrix at EIB-1 is shown in Appendix 17. It is apparent from the OD matrix at Shyamal junction presented in the pre-implementation report that the traffic is equally bound towards Nehrunagar, Manekbaug and Anjali Cross Roads. Since the network flow seems to be balanced at this point, there is a high probability of diverting traffic on alternate routes in special conditions like traffic jams or accidents. In order to reduce the resulting congestion during special events, it is necessary to identify how many trips can be diverted on alternate roads. Table 26 Route Choice Survey Pattern at EIB-2 (Post Implementation) % Using % Using % of Total Destination Zone 132 Ring 120 Ring Traffic Road Road Zone 23 (Helmet Circle) 8.62% 80.73% 19.26% Zone 20 (Nehrunagar Road) 25.72% 43.27% 56.73%
51 43 Destination Zone Zone 17 (Paldi Anjali Cross Road) Zone 14(Nr. Shyamal Junction) % of Total Traffic % Using 132 Ring Road % Using 120 Ring Road 15.32% 82.70% 17.30% 11.84% Termination Zone EIB 3 Location near Shivranjani Junction Route Choice Survey The Route Choice matrix at EIB-1 is shown in Appendix 18. It is apparent from the OD matrix at Shivranjni EIB Location presented in the pre-implementation report that the traffic is equally bound towards Shivranjni, Helmet Cross Road and Nehrunagar zones. The only traffic that may be diverted is the trips terminating in Zone 23 and 20 which can use alternate routes from this location. Table 27 Route Choice Survey Pattern at EIB-3 (Post Implementation) Destination Zone % of Total Traffic % Using Shorter Route % Using Alternate Route Zone 23 (Helmet Circle) 17.84% 100% 0% Zone 20 (Nehrunagar Road) 21.62% 98.80% 1.20% Zone 13 (Shivranjni) 19.36% Termination Zone Zone 21 (Panjrapole) 5.17% 27.08% 72.92% EIB 4 Location at Mansi Route Choice Survey The Route Choice matrix at EIB-1 is shown in Appendix 19. It is apparent from the OD matrix at Mansi junction presented in the pre-implementation report that a majority of the traffic is bound towards Nehrunagar, Shivranjni and Panjrapole. In order to reduce the resulting congestion between Mansi and Keshavbaug, it is necessary to identify how many trips are diverted away from 132 Ring Road. The destination zones of interest in this case to analyze are from 21, 13 and 20.
52 44 Table 28 Route Choice Survey Pattern at EIB-4 (Post Implementation) Destination Zone % Using % Using % of Total Shorter Alternate Traffic Route Route Zone 21 (Panjrapole Circle) 5.49% 31.03% 68.97% Zone 20 (Nehrunagar Road) 13.07% 100% 0% Zone 13 (Shivranjni) 18.18% 100% 0% User Satisfaction Survey: Along with the route choice survey, a user satisfaction survey was also conducted to indentify how general road users perceive the ATIS system being installed. The perception survey captured the following aspects: f. Whether road users are using information on VMS to take alternate route to reach destinations? g. Are they satisfied with the type of information being provided on the VMS? Use Information in Taking Alternate Route The users were asked Do you take alternate route based on the information on the above board to reach your destination? (Y/N) at all four survey locations. The following table summarizes respondent s frequency of trip: Table 29 Survey Result for Use of ATIS in taking Alternate Route Description APMC Shyamal Shivranjni Mansi Yes 15.3% 11.5% 7.3% 8.2% No 84.7% 88.5% 92.7% 91.8% Satisfaction with ATIS The users were asked On a scale of 1 to 10, Are you satisfied with the information shown on the board? (10 being most helpful and 1 being not at all helpful) at all four survey locations. Overwhelming majority of respondents answered that they will find the system useful (range 8-10).
53 45 Table 30 Survey Result for Satisfaction with ATIS System Description APMC Shyamal Shivranjni Mansi <5 (Not Useful) 2.8% 4.1% 3.5% 2.3% % 19.4% 15.3% 15.6% 8-10 (Useful) 73.8% 76.5% 81.2% 82.1% Travel Time and Speed Analysis The purpose of the travel time and speed study is to evaluate the quality of traffic movement along a route and to determine the locations, types and extents of traffic delays. The efficiency of flow is measured by travel and running speeds. In the actual study, total travel and running times are observed and then converted into speed measures. Before starting the test runs, major intersections or suitable control points were selected along the study route as reference/control locations. The project influence area was divided into seven (7) sections based on the traffic characteristics of the network. These seven sections are summarized below and shown in Appendix 11: Table 31 List of Routes for Travel Time and Speed Analysis Route 1 From Information Board 1 to Andhjan Cross Roads (132 Ring Road) Route 2 From Information Board 1 to APMC T-Junction to Anjali Cross Roads Route 3 From Information Board 2 to Jivraj Park Cross Roads to 120 Ring Road Route 4 From Information Board 2 to Manek Baug Cross Roads Route 5 From Jodhpur Cross Roads to Nehrunagar Circle Route 6 From Mansi Cross Roads to Keshav Baug T-Junction to Andhjan Cross Roads Route 7 From Mansi Cross Roads to Andhjan Cross Road (Via Camera 10) A test vehicle is driven along the study route in accordance with moving car technique, in which, a safe level of vehicular operation is maintained by observing proper following and passing distances and by changing speed at reasonable rates of acceleration and
54 46 decelerations. Delay information is recorded when the traffic flow is stopped or greatly impeded. The duration of traffic delay is measured in units of time along with notations of the corresponding location, cause and frequency of delay to travel. The following table summarizes average speed and travel times on each of these routes during morning, afternoon and evening peak hours. Section-wise travel times and speed on each of these links are also summarized in Appendix 20. Table 32 Summary of Average Speed and Travel Times (Post-Implementation) Morning Peak Afternoon Peak Evening Peak Route No. Travel Travel Travel Speed Speed Speed Time Time Time (kmph) (kmph) (kmph) (min) (min) (min)
55 47
56 48 4. Conclusions For the current project, the Consultants have proposed the following performance measures for ITS system in the pre-implementation report: Faster Data Collection, Analysis & Reporting Higher Mobility Greater Reliability The following sections summarize conclusions derived from pre-implementation and post implementation surveys carried out to assess the effectiveness of the ATIS system. Faster Data Collection, Analysis & Reporting a. This is probably the first time in the City of Ahmedabad that a system capable of capturing and analyzing traffic conditions has been successfully installed and is under implementation. b. The data available from the system will open doors to conduct systematic traffic research with focus on quantitative analysis supported by real-time data. c. It is observed that due to heterogeneity in the traffic, speed density relationships observed from the detector data are not similar to standard curves. With availability of more data in the future, the curve may be updated with more data points to achieve better results. d. The system is capable of collecting traffic parameters which has resulted in calculation of basic traffic parameters at camera locations. These are summarized below: Table 33 Summary of Traffic Parameters at Different Camera Locations Camera Free Flow Jam Density Speed (y) Density (x) Location No. Speed (kmph) (vehicles/km) Equation Cam1 Nr. Anjali Cross Roads Speed = -0.1 x density Cam2 TV speed = x density Cam3 Jivraj Road speed = x density Cam4 Flyover speed = x density
57 49 Camera Free Flow Jam Density Speed (y) Density (x) Location No. Speed (kmph) (vehicles/km) Equation Cam5 Manekbaug Cam6 Nehrunagar speed = x density Cam7 Shivranjni speed = x density Cam8 Keshavbaug speed = x density Cam9 IIM speed = 0.21 x density Cam10 Before IIM Flyover speed = x density Cam11 VMS speed = x density Cam12 VMS speed = x density Cam13 VMS speed = x density e. Additional data availability in the future can also be used to update knowledge based expert system on a regular basis to derive effective inferences on traffic conditions in the network. f. With availability of more data in the future, the above traffic related parameters can be fine-tuned and seasonal variations may be also be derived. Higher Mobility Average Speed and Travel Times The following table summarizes average speed and travel times obtained from preimplementation and post-implementation studies: Table 34 Comparison of Average Speed and Travel Times (Pre & Post Implementation Stages) Route No. Morning Peak Afternoon Peak Evening Peak Travel Travel Study Speed Time Speed Time Speed Travel Period (kmph) (min) (kmph) (min) (kmph) Time (min) Pre Post Diff Pre
58 50 Route No Morning Peak Afternoon Peak Evening Peak Travel Travel Study Speed Time Speed Time Speed Travel Period (kmph) (min) (kmph) (min) (kmph) Time (min) Post Diff Pre Post Diff Pre Post Diff Pre Post Diff Pre Post Diff Pre Post Diff Pre and Post implementation travel time study show either decrease or increase in the speed of vehicles along various routes. Even though inconclusive, certain links have shown variation in speed during different time of day implying dynamic distribution of traffic over the network. This may be linked to the implementation of the ATIS system. The primary arterial of 132 ring road (Route 1 in the above table) for which the system has been designed has shown increase in average speed and decrease in travel time after implementation of the ATIS system.
59 51 Higher Reliability No special events were observed or recorded during the study period, hence reliability of the ITS system under such circumstances could not be assessed. Traffic Distribution Traffic distribution or traffic flow optimization over the network is a measure of higher network reliability. Each EIB location has unique traffic and network characteristics associated with it. The following section summarizes effectiveness of ATIS system in distributing traffic across the network on alternate routes under varying traffic and Network Conditions: EIB 1: Near APMC Market Traffic Characteristics Network Characteristics Major traffic flow towards one zone Only one alternate route with reasonable length available to compete with route carrying major traffic Destination Zone Zone 23 (Helmet Circle) Zone 22 (Vijay Cross Road) Zone 20 (Nehrunagar Cross Road) Zone 19 (Manekbaug Cross Road) Pre-Implementation Survey Results % Using % Using 132 Ring 120 Ring Road Road Post-Implementation Survey Results % Using % Using 132 Ring 120 Ring Road Road % Traffic Rerouting with ATIS 76.25% 23.75% 91.47% 8.53% 0.16% 12.50% 87.50% 22.38% 77.62% 0.37% 50% 50% 41.86% 58.14% 0.07% 66.67% 33.33% 59.20% 40.80% 0.19%
60 52 Zone 17 (Anjali Cross Road) 11.64% % % Total 6.20% EIB 2: Near Shyamal Junction Traffic Characteristics More zones carrying considerable Traffic on either sides of the arterial (East and West) Network Characteristics Alternate route with equal distances available for selection Destination Zone Zone 23 (Helmet Circle) Zone 20 (Nehrunagar Road) Zone 17 (Paldi Anjali Cross Road) Pre-Implementation Survey Results % Using % Using 132 Ring 120 Ring Road Road Post-Implementation Survey Results % Using % Using 132 Ring 120 Ring Road Road % Traffic Rerouting with ATIS 93.62% 6.38% 80.73% 19.26% 2.62% 51.78% 48.22% 43.27% 56.73% 0.03% 41.10% 58.90% 82.70% 17.30% 5.38% Total 8.02% EIB 3: Near Shivranjni Junction Traffic Characteristics Major traffic flow towards one zone Network Characteristics Only one alternate route with more length available to compete with route
61 53 carrying major traffic Destination Zone Zone 23 (Helmet Circle) Zone 20 (Nehrunagar Road) Zone 17 (Paldi Anjali Cross Road) Pre-Implementation Survey Results % Using % Using 132 Ring 120 Ring Road Road Post-Implementation Survey Results % Using % Using Shorter Alternate Route Route 84.66% 15.34% 100% 0% 17.20% 82.18% 98.80% 1.20% % Traffic Rerouting with ATIS 2.88% 1.60% Termination Zone Termination Zone - Total 4.48% EIB 4: Near Mansi Junction Traffic Characteristics Lesser traffic flow towards one zone with available alternate route. Major traffic flows towards zone with no alternate route available. Network Characteristics Only one zone has alternate route with almost unequal length available to compete, but the zone attracts very few trips. Destination Zone Zone 21 (Panjrapole Circle) Pre-Implementation Survey Results % Using % Using 132 Ring 120 Ring Road Road Post-Implementation Survey Results % Using % Using Shorter Alternate Route Route 7.32% 92.68% 5.49% 31.03% % Traffic Rerouting with ATIS 1.26%
62 54 Zone 20 (Nehrunagar Road) Zone 13 (Shivranjni) 100% 0% 13.07% 100% 100% 0% 18.18% 100% - - Total 1.26% From the above tables, the following conclusions can be drawn: ATIS system is most effective when more alternate routes are available (like in case of EIB-2). ATIS system is also effective at locations where major traffic is bound towards routes facing chronic congestion. In case of EIB-3, Nehrunagar junction faces chronic congestion, while route choice survey has shown higher number of rerouting as a result of ATIS implementation. ATIS system is least effective when lesser number of zones attracts traffic through alternate route (EIB-4). Cost Benefit Analysis In order to determine the cost effectiveness of ATIS system a cost-benefit analysis was carried out from the pre-implementation and post-implementation survey results. This analysis is carried out for a period of thirty years. The cost benefit analysis presents benefit-cost ratio and net present value of the project. Of these three economic indicators, the Net Present Value and Benefit-Cost ratio are important. The Net Present Value is appropriate for comparing differential economic worth of projects while evaluating project alternatives that result in equal categorical benefits but unequal costs. All benefits and costs over an alternative's life cycle are discounted to the present, and the costs are subtracted from the benefits to yield a NPV. If benefits exceed costs, the NPV is positive and the project is worth pursuing. Net Present Value is given by the following equation:
63 55 Net Present Value, Where, C = Total Project Cost Tc = Construction period of the Project (assumed 1 year for project) T = Expected Life time of the project (assumed to be 1+29=30 for project) Bt = Monetary Value of Benefit (travel time savings) gt = growth rate in year t R = Fare Box Revenue (Advertisement Revenue) M = Annual Operating Cost. r = Interest Rate The NPV formula above has two important parts. First is the present value of cost while the second term is the present value of benefits. Here maintenance cost is considered as a negative benefit. The fair box revenue is from advertisement revenues which are not available to the research team. In such a case, sensitivity analysis is presented with ranging fare box revenue (22%, 25% and 30%) of the capital cost per year. The maintenance cost as provided to the Consultants is 20% of the capital cost per year. Benefit to cost ratio method is generally used when project funding is restricted. Benefit to cost ratio is obtained by placing present value of benefits in the numerator and
64 56 present value of cost in the denominator. The cost includes only construction cost as in net present value. Benefit to cost ratio is given by the following equation: Benefit to Cost Ratio, Cost of entire system implementation is shared by Zero-Sum Ltd. Japan to the research team. The cost of implementation for the study is considered as USD 1.0 million which is roughly INR 6.0cr. The next step is to consider benefits that calculated from the pre-implementation and post-implementation surveys. Main benefits are reduction in travel time and emissions. For benefit cost analysis, monetary value has to be assigned to these benefits. The monetary value for reduction in travel time depends on different state / area or one can use the average wage available in literature 1 in India. Benefit Travel Time Saving Monetary Value INR 75/Hour One important consideration while evaluating benefits is that during the project duration growth rate may vary. Hence to find reduction in travel time etc. new surveys shall be carried out for each year. Also travel demand is not constant throughout the day. However travel time savings obtained in peak and off-peak durations are averaged and considered in the analysis. Knowing the average travel time difference per day, one can estimate the total travel time saving for 365 days. 1 As per The 23rd Survey of Investment Related Costs in Asia and Oceania
65 57 standard value of growth rate suggested by IRC is 7.5%. Interest rate of 12% is considered for the study. Once all parameters are known net present value and benefit to cost return using above formulas.
66 58 Benefit Cost Analysis Step 1: Travel Time Difference in Pre-Implementation and Post-Implementation Scenario The following table summarizes travel time variation in pre-implementation and postimplementation scenario: Morning Peak Afternoon Peak Evening Peak Route No. Speed Travel Time (min) Speed Travel Time (min) Speed Travel Time (min) Step 2: Calculate number of vehicles at each Camera Location. The following table summarizes number of vehicles at each Camera Location: Camera Location Count Unit Cam Vehicles Per Day Cam Vehicles Per Day Cam Vehicles Per Day Cam Vehicles Per Day Cam Vehicles Per Day Cam Vehicles Per Day Cam Vehicles Per Day
67 59 Camera Location Count Unit Cam Vehicles Per Day Cam Vehicles Per Day Cam Vehicles Per Day Step 3: Calculation of Travel Time Difference for each Route In this step, average number of vehicles on each route is first calculated as an average number of vehicles passing through all camera locations along the route. Then this number is multiplied with average passenger per vehicle to total saving in travel time calculated from Step 1. The entire Step 3 is shown in the following Table: Travel Time Difference Route No. AM Peak Afternoo n Peak Evenin g Peak Total Chang e in Travel Time Per Day Camera Along Route Average Vehicles Per Day (Nos.) Averag e Passen ger per Vehicle (Nos.) Total Travel Saving Per Day (in min) CTS 2, CTS (11,281.00) CTS , CTS 3, CTS (86,133.96) CTS (24,400.00) CTS 6, CTS 7 CTS 8, CTS , , CTS , Total Travel Time Saving 42,345.04
68 60 Step 4: Calculation of Benefits and Cost Over project Life Duration Total Project Cost (Rs.) : 60,000, Construction Period (in Years) : 1 Year Expected Project Life : 30 (1+29) Years Total Travel Time Saving per Day (in minutes) : 42, Total Travel Time Saving in first year of implementation (in hrs) = (365*42, /60) : 257, Average Wage (monetary value of time) : 75 Rs/Hr Growth Rate : 7.5% Interest Rate : 12% Then, Net Present Value of Cost and Benefits for 22% fare box revenue are calculation based on the equations present above. The calculated vales are summarized in the following Table: Net Present Value of Cost Year 1 53,571, Net Present Value of Benefit (for Fair Box Revenue equal to 22% of Capital Cost per Year) Year 2 Year 3 Year 4 Year 5 Year 6 17,513, ,683, ,045, ,643, ,396,055.58
69 61 Net Present Value of Benefit (for Fair Box Revenue equal to 22% of Capital Cost per Year) Year 7 Year 8 Year 9 Year 10 Year 11 Year 12 Year 13 Year 14 Year 15 Year 16 Year 17 Year 18 Year 19 Year 20 Year 21 Year 22 Year 23 Year 24 Year 25 Year 26 Year 27 Year 28 Year 29 9,282, ,287, ,399, ,606, ,898, ,266, ,702, ,198, ,748, ,347, ,988, ,668, ,382, ,127, ,899, ,695, ,514, ,351, ,207, ,077, , , ,101.98
70 62 Net Present Value of Benefit (for Fair Box Revenue equal to 22% of Capital Cost per Year) Year , NPV of Benefit 148,208, Hence, Benefit-Cost-Ratio will be : 2.77 NPV of the Project : INR 94,637, /= Sensitivity Analysis for varying Fare Box Revenue Fair Box Revenue per Year as % of Capital Cost 22% 25% 28% BCR NPV Project 9.46 cr cr cr
71 63 Road User Response to the System User Perception Versus Satisfaction: User perception survey was carried out for the system prior to its implementation to assess if the ATIS system will benefit the users. The following was the perception on usefulness of the system in helping road users to select alternate route: Table 35 User Perception Survey Results from Pre-Implementation Stage Description APMC (EIB-I) Shyamal (EIB-II) Shivranjni (EIB-III) Mansi (EIB- IV) <5 (Not Useful) 2.3% 3.2% 3.8% 1.9% % 21.6% 19.1% 13.5% 8-10 (Useful) 76.5% 75.2% 77.1% 84.5% From the above table, about 78.32% people perceived that the system will help the users to select alternate route and save travel time. After implementation of the ATIS system, a user satisfaction survey was carried out to assess if the perception of road users was actually being met. The road users were asked if they are satisfied with the ATIS system. The following table summarizes the satisfaction levels: Table 36 User Satisfaction Survey Results from Post-Implementation Stage Description APMC Shyamal Shivranjni Mansi <5 (Not Useful) 2.8% 4.1% 3.5% 2.3% % 19.4% 15.3% 15.6% 8-10 (Useful) 73.8% 76.5% 81.2% 82.1% There is a higher level of satisfaction among the road users with the VMS system, with around 80% of the road user surveyed satisfied with its working. Hence it can be concluded that the ATIS system has met expectations of the road users.
72 64 Willingness to use vs. Actual usage Prior to implementation of the system, a survey to assess willingness to use alternate route based on information provided by the VMS was carried out. The following table summarizes the user responses in willingness to use alternate routes: Table 37 Willingness to use Survey Results from Pre-Implementation Stage Description APMC Shyamal Shivranjni Mansi Yes 93.52% 86.63% 88.16% 84.97% No 6.48% 13.37% 11.84% 15.03% After implementation of the system, the users were again asked if they are taking alternate routes or using the information provided on the VMS to select their routes. The following table summarizes the user responses in use of VMS data to select alternate routes: Table 38 Use of ATIS to Select Alternate Route in Post Implementation Stage Description APMC Shyamal Shivranjni Mansi Yes 15.3% 11.5% 7.3% 8.2% No 84.7% 88.5% 92.7% 91.8% From the above two tables, even though about 80% of users were willing to take alternate route based on data provided in the VMS, on an average 10.57% of the people actually use the information to select their route. The above average, may not match pre-implementation survey, but the average figure is quite significant as 10.57% and is in line with results of similar implementation across the world summarized in the Literature review. Summary & Future Scope of Work 1. Since ATIS utilizes the roadway capacity effectively by enabling dynamic distribution of traffic over network rather than increasing the roadway capacity,
73 65 benefits from these systems are very limited. This is evident from the changes in travel times and speed over the network. 2. Instead of Route based study of travel time and average speed, link & node based analysis should be carried out to actually assess if the diverted traffic is not using links already carrying more traffic. 3. Before implementing the next phase of ATIS, it is essential that the decision makers have a clear idea of how the system will work under their network conditions. More research is needed in this field to test the effectiveness of VMS on different types of network and traffic conditions. Documentation and availability of its performance on different network configuration will be of great use for decision makers. 4. The expert system developed here is an important tool where the effectiveness of the ATIS can be considerably increased if implemented and updated on a regular basis.
74 66 APPENDIX 1 TO 20
75 Appendix: 1 Origin and Destination Survey Form (Pre-Implementation Phase) Location:. Date: Weather: Survey Time: From: To:. Up Direction: Dn Direction:. Sr No. Type of Vehicle Origin Place Destination Place Route Followed Trips (D/W/M) Purpose of Trip Business Job Student Alternate Route followed (Y/N) Perception on Information Board AHMEDABAD MUNCIPAL CORPORATION PRE TRAFFIC STUDY FOR TRAIL ITS PROJECT IN AHMEDABAD ZERO SUM LTD JAPAN
76 Questions Asked: Column 3: Where are you coming from? Column 4: Where are you going to? Column 5:Which route will you take to reach your destination? (Desination to be replaced by place answered in column 4) Column 6: What is the frequency of your trip? (Daily, Weekly or Monthly) Column 7: What is the purpose of your trip? Column 8: Will you follow any alternate route if it saves your time even though the alternate route may be a bit longer? Column 9: On a scale of 1 to 10, do you a think a system which provides traffic information on available alternate route help you to select alternate routes? (10 being most helpful and 1 being not at all helpful) Column 10: Which medium do you think is easier for you to process information on alternate route (map or text)? AHMEDABAD MUNCIPAL CORPORATION PRE TRAFFIC STUDY FOR TRAIL ITS PROJECT IN AHMEDABAD ZERO SUM LTD JAPAN


77 Appendix 2: Survey Photographs (Dt Sept, 2014)
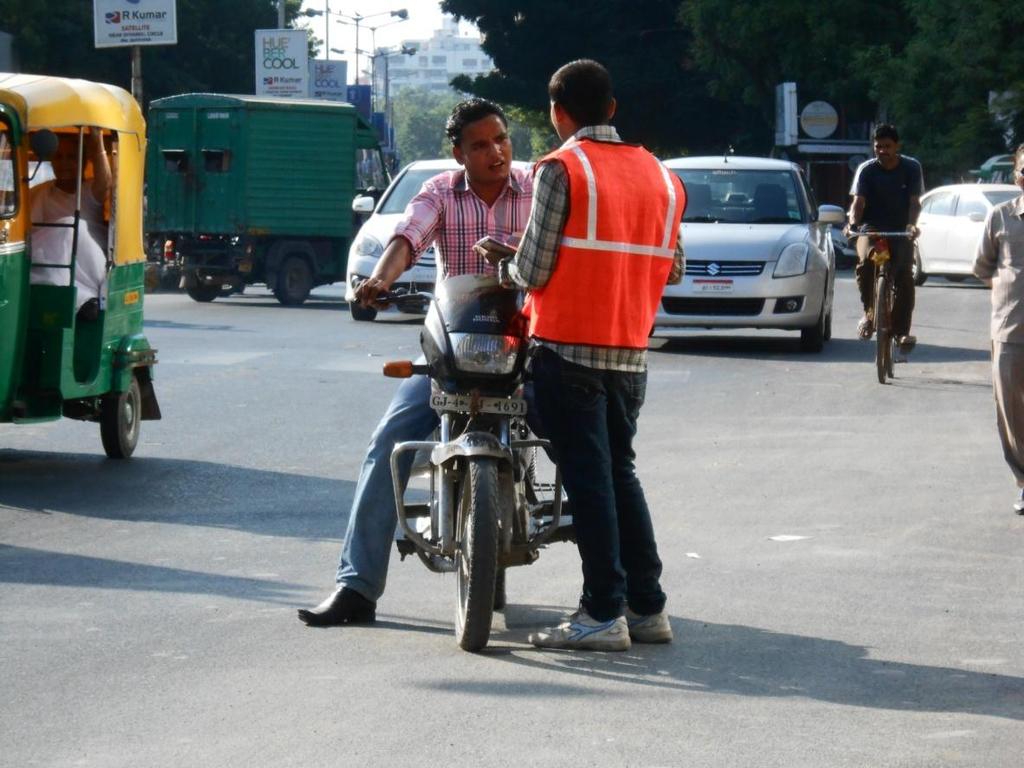
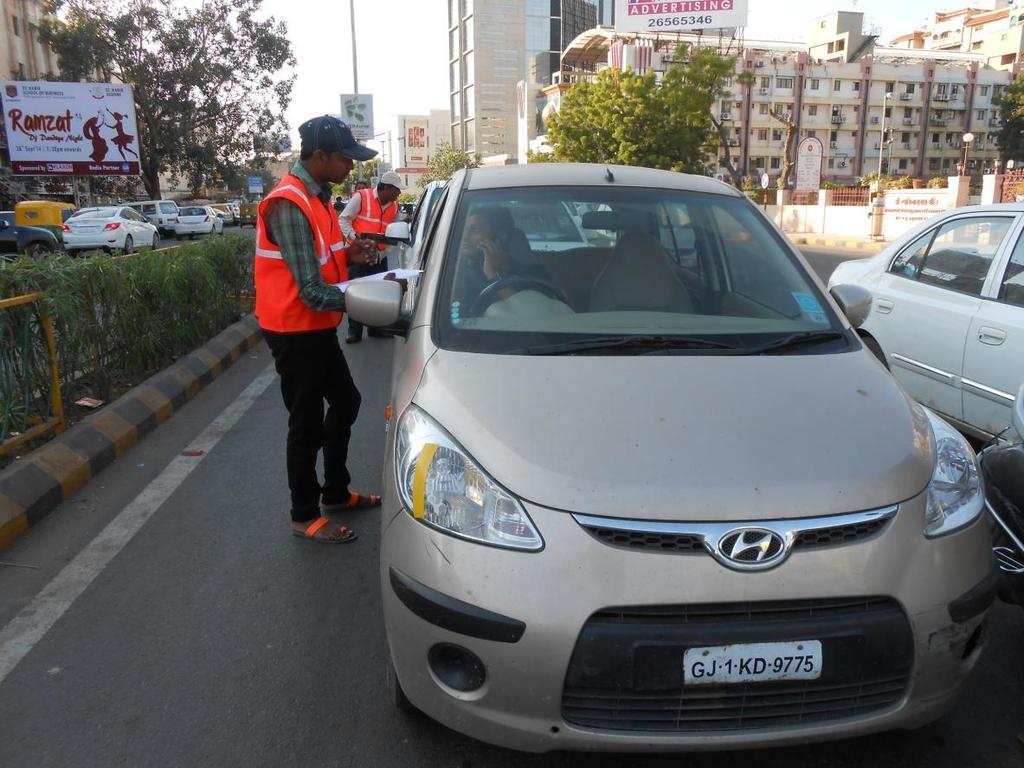
78

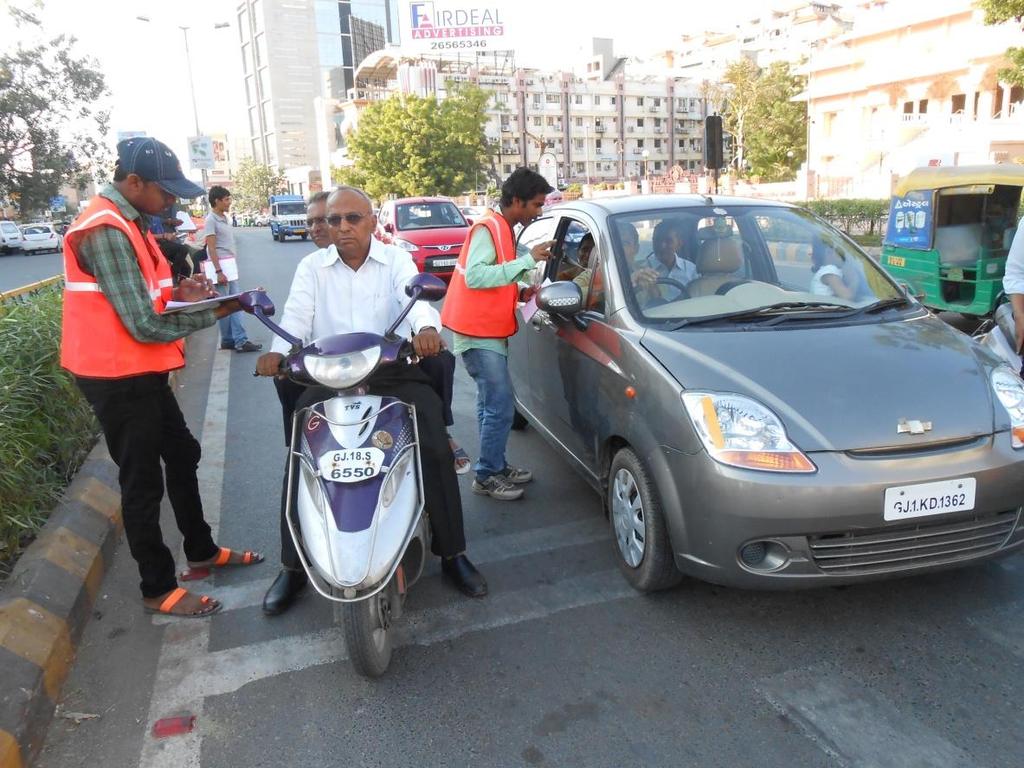
79
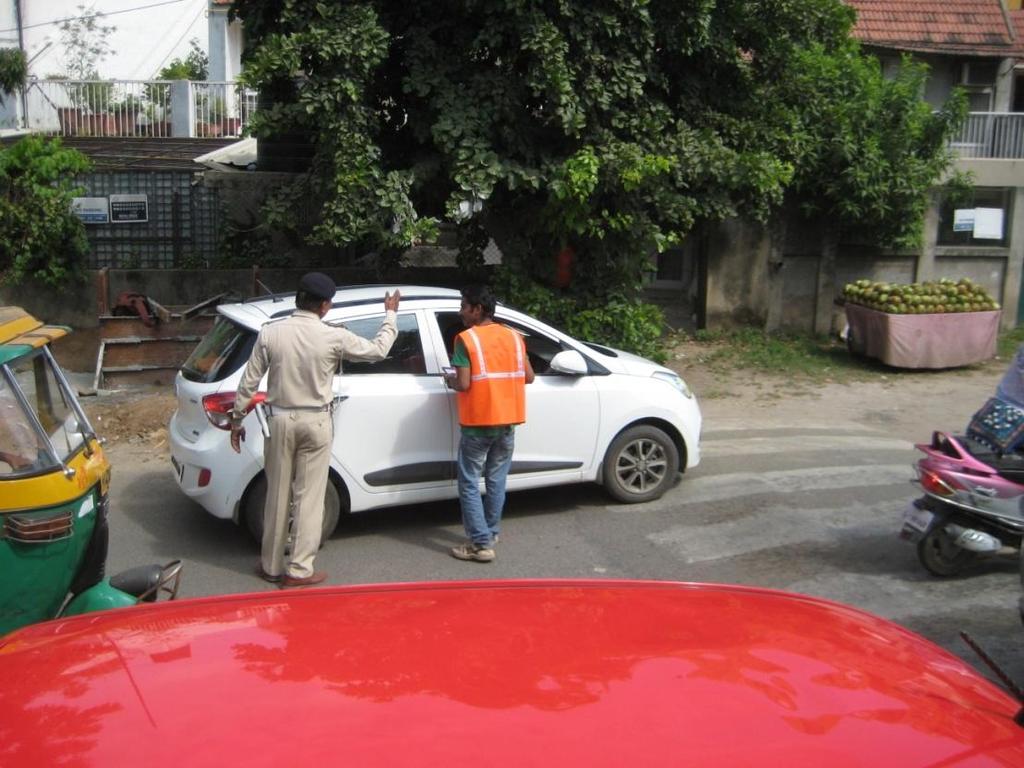
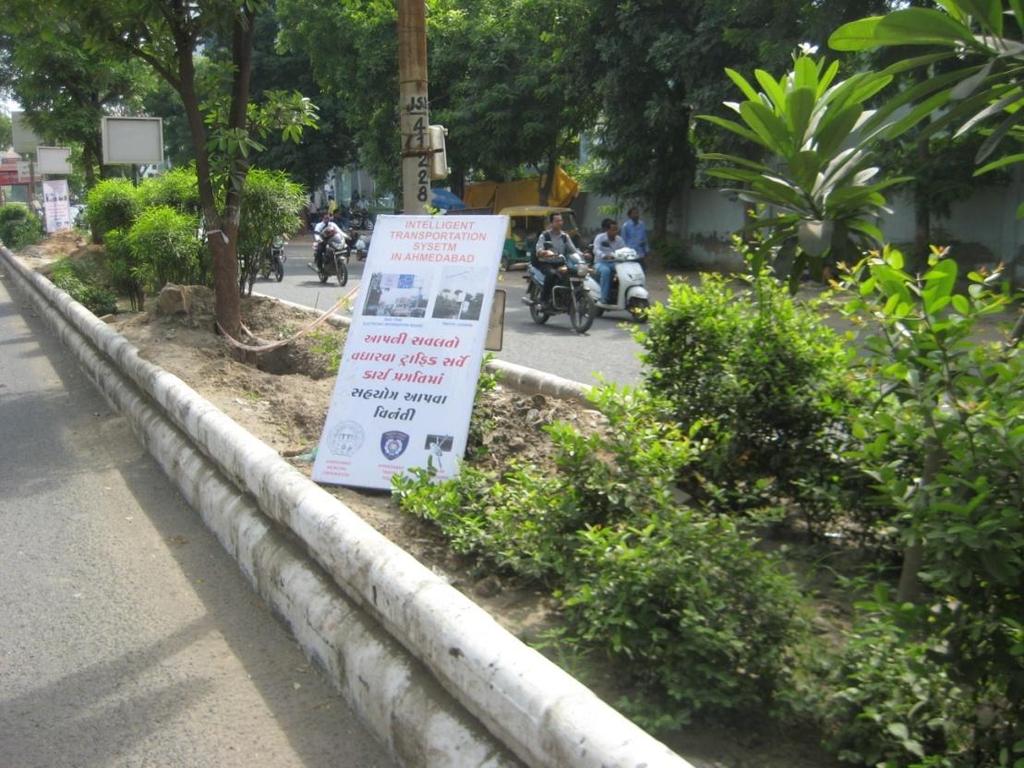
80
81 Origin Zone Appendix 3 : Origin Destination Matrix for Total All Near APMC Market (EIB-1) Location: Near APMC Market Chainage: EIB-1 Date: 23/9/2014 Destination Zones Grand Zones Total Grand Total
82 Destination Zone Appendix - 4 : Route Choice Matrix for All Vehicles Near APMC Market (EIB-1) Location: Near APMC Market Chainage: EIB-1 Date: 23/9/2014 Zones 1 2 Route Choice through Zone Grand Total Grand Total
83 Origin Zone Appendix - 5 : Origin Destination Matrix for All Vehicles Near Shyamal Cross Road (EIB-2) Location: Near Shyamal Road Chainage: EIB-2 Date: 24-Sep-2014 Zones 1 Destination Zone Grand Total Grand Total
84 Destination Zone Appendix - 6 : Route Choice Matrix for All Vehicles Near Shyamal Cross Road (EIB-2) Location: Near Shyamal Road Chainage: EIB-2 Date: 24-Sep-2014 Zones Route Choice through Zone Grand Total Grand Total
85 Origin Zone Appendix - 7 : Origin destination Matrix for All Vehicles Near Shivranjani Cross Road (EIB-3) Location: Near Shivranjani Cross Road Chainage: EIB-3 Date: 26-Sep-2014 Zones Destination Zone Grand Total Grand Total
86 Destination Zone Appendix - 8 : Route Choice Matrix for All Vehicles Near Shivranjni EIB (EIB-3) Location: Near Mansi Cross Road Chainage: EIB-3 Date: 26-Sep-2014 Zones Route Choice through Zone Grand Total Grand Total
87 Destination Zone Appendix - 9 : Route Choice Matrix for All Vehicles Near Mansi Cross Road (EIB-4) Location: Near Mansi Cross Road Chainage: EIB-4 Date: 26-Sep-2014 Zones Route Choice through Zone Grand Total Grand Total
88 Origin Zone Appendix - 10 : Origin Destination Matrix for All Vehicles Near Mansi Cross Road (EIB-4) Location: Near Mansi Cross Road Chainage: EIB-4 Date: 26-Sep-2014 Zones Destination Zone Grand Total #### Grand Total
89 APPENDIX 11 ROUTE MAPS FOR TRAVEL TIME STUDIES
90 132' RING ROAD INFORMATION BOARDS CAMERA SENSORS TRAVEL TIME STUDY ROUTE ANDHJAN CROSS ROADS MANSI CROSS ROADS JODHPUR CROSS ROADS KESHAVBAUG T-JUNCTION 120' RING ROAD PANJRAPOLE CROSS ROADS SHIVRANJNI CROSS ROADS NEHRUNAGAR CIRCLE MANEKBAUG CROSS ROADS SHYAMAL CROSS ROAD 120' RING ROAD JIVRAJ PARK CROSS ROAD ANJALI CIRCLE 132' RING ROAD APMC T-JUNCTION Route 1
91 132' RING ROAD INFORMATION BOARDS CAMERA SENSORS TRAVEL TIME STUDY ROUTE ANDHJAN CROSS ROADS MANSI CROSS ROADS JODHPUR CROSS ROADS KESHAVBAUG T-JUNCTION 120' RING ROAD PANJRAPOLE CROSS ROADS SHIVRANJNI CROSS ROADS NEHRUNAGAR CIRCLE MANEKBAUG CROSS ROADS SHYAMAL CROSS ROAD 120' RING ROAD JIVRAJ PARK CROSS ROAD ANJALI CIRCLE 132' RING ROAD APMC T-JUNCTION Route 2
92 132' RING ROAD INFORMATION BOARDS CAMERA SENSORS TRAVEL TIME STUDY ROUTE ANDHJAN CROSS ROADS MANSI CROSS ROADS JODHPUR CROSS ROADS KESHAVBAUG T-JUNCTION 120' RING ROAD PANJRAPOLE CROSS ROADS SHIVRANJNI CROSS ROADS NEHRUNAGAR CIRCLE MANEKBAUG CROSS ROADS SHYAMAL CROSS ROAD 120' RING ROAD JIVRAJ PARK CROSS ROAD ANJALI CIRCLE 132' RING ROAD APMC T-JUNCTION Route 3
93 132' RING ROAD INFORMATION BOARDS CAMERA SENSORS TRAVEL TIME STUDY ROUTE ANDHJAN CROSS ROADS MANSI CROSS ROADS JODHPUR CROSS ROADS KESHAVBAUG T-JUNCTION 120' RING ROAD PANJRAPOLE CROSS ROADS SHIVRANJNI CROSS ROADS NEHRUNAGAR CIRCLE MANEKBAUG CROSS ROADS SHYAMAL CROSS ROAD 120' RING ROAD JIVRAJ PARK CROSS ROAD ANJALI CIRCLE 132' RING ROAD APMC T-JUNCTION Route 4
94 132' RING ROAD INFORMATION BOARDS CAMERA SENSORS TRAVEL TIME STUDY ROUTE ANDHJAN CROSS ROADS MANSI CROSS ROADS JODHPUR CROSS ROADS KESHAVBAUG T-JUNCTION 120' RING ROAD PANJRAPOLE CROSS ROADS SHIVRANJNI CROSS ROADS NEHRUNAGAR CIRCLE MANEKBAUG CROSS ROADS SHYAMAL CROSS ROAD 120' RING ROAD JIVRAJ PARK CROSS ROAD ANJALI CIRCLE 132' RING ROAD APMC T-JUNCTION Route 5
95 132' RING ROAD INFORMATION BOARDS CAMERA SENSORS TRAVEL TIME STUDY ROUTE ANDHJAN CROSS ROADS MANSI CROSS ROADS JODHPUR CROSS ROADS KESHAVBAUG T-JUNCTION 120' RING ROAD PANJRAPOLE CROSS ROADS SHIVRANJNI CROSS ROADS NEHRUNAGAR CIRCLE MANEKBAUG CROSS ROADS SHYAMAL CROSS ROAD 120' RING ROAD JIVRAJ PARK CROSS ROAD ANJALI CIRCLE 132' RING ROAD APMC T-JUNCTION Route 6
96 132' RING ROAD INFORMATION BOARDS CAMERA SENSORS TRAVEL TIME STUDY ROUTE ANDHJAN CROSS ROADS MANSI CROSS ROADS JODHPUR CROSS ROADS KESHAVBAUG T-JUNCTION 120' RING ROAD PANJRAPOLE CROSS ROADS SHIVRANJNI CROSS ROADS NEHRUNAGAR CIRCLE MANEKBAUG CROSS ROADS SHYAMAL CROSS ROAD 120' RING ROAD JIVRAJ PARK CROSS ROAD ANJALI CIRCLE 132' RING ROAD APMC T-JUNCTION Route 7
97 Morning Peak Appendix 12 Section Route 1: Travel Time and Speed Study (Pre-Implementation Stage) Distance (m) Travel Time (min) Speed (km/hr) Average Trip Speed (km/hr) Avg. Speed (km/hr) Date: 30th September APMC to Vejalpur 1, Vejalpur to Shyamal Shyamal to Shivranjni 1, Shivranjni to Keshavbaug Keshavbaug to Andhjan APMC to Vejalpur 1, Vejalpur to Shyamal Shyamal to Shivranjni 1, Shivranjni to Keshavbaug Keshavbaug to Andhjan APMC to Vejalpur 1, Vejalpur to Shyamal Shyamal to Shivranjni 1, Shivranjni to Keshavbaug Keshavbaug to Andhjan APMC to Vejalpur 1, Vejalpur to Shyamal Shyamal to Shivranjni 1, Shivranjni to Keshavbaug Keshavbaug to Andhjan APMC to Vejalpur 1, Vejalpur to Shyamal Shyamal to Shivranjni 1, Shivranjni to Keshavbaug Keshavbaug to Andhjan Average Avg. Trip Travel Travel Time (min) Time (min) APMC to Vejalpur 1, Vejalpur to Shyamal Shyamal to Shivranjni 1, Shivranjni to Keshavbaug Keshavbaug to Andhjan APMC to Vejalpur 1, Vejalpur to Shyamal Shyamal to Shivranjni 1, Shivranjni to Keshavbaug Keshavbaug to Andhjan APMC to Vejalpur 1, Vejalpur to Shyamal Shyamal to Shivranjni 1,
98 Afternoon Peak Appendix 12 Section Route 1: Travel Time and Speed Study (Pre-Implementation Stage) Distance (m) Travel Time (min) Speed (km/hr) Average Trip Speed (km/hr) Avg. Speed (km/hr) Date: 30th September Shivranjni to Keshavbaug Keshavbaug to Andhjan APMC to Vejalpur 1, Vejalpur to Shyamal Shyamal to Shivranjni 1, Shivranjni to Keshavbaug Keshavbaug to Andhjan APMC to Vejalpur 1, Vejalpur to Shyamal Shyamal to Shivranjni 1, Shivranjni to Keshavbaug Keshavbaug to Andhjan APMC to Vejalpur 1, Vejalpur to Shyamal Shyamal to Shivranjni 1, Shivranjni to Keshavbaug Keshavbaug to Andhjan APMC to Vejalpur 1, Vejalpur to Shyamal Shyamal to Shivranjni 1, Shivranjni to Keshavbaug Keshavbaug to Andhjan Average Avg. Trip Travel Travel Time (min) Time (min) APMC to Vejalpur 1, Vejalpur to Shyamal Shyamal to Shivranjni 1, Shivranjni to Keshavbaug Keshavbaug to Andhjan APMC to Vejalpur 1, Vejalpur to Shyamal Shyamal to Shivranjni 1, Shivranjni to Keshavbaug Keshavbaug to Andhjan APMC to Vejalpur 1, Vejalpur to Shyamal Shyamal to Shivranjni 1, Shivranjni to Keshavbaug Keshavbaug to Andhjan
99 Evening Peak Appendix 12 Section Route 1: Travel Time and Speed Study (Pre-Implementation Stage) Distance (m) Travel Time (min) Speed (km/hr) Average Trip Speed (km/hr) Avg. Speed (km/hr) Date: 30th September APMC to Vejalpur 1, Vejalpur to Shyamal Shyamal to Shivranjni 1, Shivranjni to Keshavbaug Keshavbaug to Andhjan APMC to Vejalpur 1, Vejalpur to Shyamal Shyamal to Shivranjni 1, Shivranjni to Keshavbaug Keshavbaug to Andhjan APMC to Vejalpur 1, Vejalpur to Shyamal Shyamal to Shivranjni 1, Shivranjni to Keshavbaug Keshavbaug to Andhjan APMC to Vejalpur 1, Vejalpur to Shyamal Shyamal to Shivranjni 1, Shivranjni to Keshavbaug Keshavbaug to Andhjan Average Avg. Trip Travel Travel Time (min) Time (min) APMC to Vejalpur 1, Vejalpur to Shyamal Shyamal to Shivranjni 1, Shivranjni to Keshavbaug Keshavbaug to Andhjan
100 Morning Peak Appendix 12 Route 2: Travel Time and Speed Study (Pre-Implementation Stage) Section Distance (m) Travel Time (min) Speed (km/hr) APMC to Vasna 1, Vasna to Anjali APMC to Vasna 1, Vasna to Anjali APMC to Vasna 1, Vasna to Anjali APMC to Vasna 1, Vasna to Anjali Date: 30th September Average Avg. Trip Avg. Travel Speed Speed Time (km/hr) (km/hr) (min) APMC to Vasna 1, Vasna to Anjali APMC to Vasna 1, Vasna to Anjali APMC to Vasna 1, Vasna to Anjali APMC to Vasna 1, Vasna to Anjali APMC to Vasna 1, Vasna to Anjali APMC to Vasna 1, Vasna to Anjali APMC to Vasna 1, Vasna to Anjali APMC to Vasna 1, Vasna to Anjali APMC to Vasna 1, Vasna to Anjali APMC to Vasna 1, Vasna to Anjali APMC to Vasna 1,
101 Evening Peak Afternoon Peak Appendix 12 Route 2: Travel Time and Speed Study (Pre-Implementation Stage) Section Distance (m) Travel Time (min) Speed (km/hr) Vasna to Anjali Date: 30th September Average Avg. Trip Avg. Travel Speed Speed Time (km/hr) (km/hr) (min) APMC to Vasna 1, Vasna to Anjali APMC to Vasna 1, Vasna to Anjali APMC to Vasna 1, Vasna to Anjali APMC to Vasna 1, Vasna to Anjali APMC to Vasna 1, Vasna to Anjali APMC to Vasna 1, Vasna to Anjali APMC to Vasna 1, Vasna to Anjali APMC to Vasna 1, Vasna to Anjali APMC to Vasna 1, Vasna to Anjali APMC to Vasna 1, Vasna to Anjali APMC to Vasna 1, Vasna to Anjali APMC to Vasna 1, Vasna to Anjali APMC to Vasna 1, Vasna to Anjali APMC to Vasna 1, Vasna to Anjali
102 Appendix 12 Route 2: Travel Time and Speed Study (Pre-Implementation Stage) Section Distance (m) Travel Time (min) Speed (km/hr) Date: 30th September Average Avg. Trip Avg. Travel Speed Speed Time (km/hr) (km/hr) (min) APMC to Vasna 1, Vasna to Anjali APMC to Vasna 1, Vasna to Anjali APMC to Vasna 1, Vasna to Anjali
103 Appendix 12 Route 3: Travel Time and Speed Study (Pre-Implementation Stage) Morning Section Distance (m) Travel Time (min) Speed (km/hr) EIB 2 to Shyamal Shyamal to Vejalpur Vejalpur to Jivraj 1, Jivraj to Dharnidhar Date: 30th September Average Avg. Trip Avg. Travel Speed Speed Time (km/hr) (km/hr) (min) EIB 2 to Shyamal Shyamal to Vejalpur Vejalpur to Jivraj 1, Jivraj to Dharnidhar EIB 2 to Shyamal Shyamal to Vejalpur Vejalpur to Jivraj 1, Jivraj to Dharnidhar Evening EIB 2 to Shyamal Shyamal to Vejalpur Vejalpur to Jivraj 1, Jivraj to Dharnidhar EIB 2 to Shyamal Shyamal to Vejalpur Vejalpur to Jivraj 1, Jivraj to Dharnidhar EIB 2 to Shyamal Shyamal to Vejalpur Vejalpur to Jivraj 1, Jivraj to Dharnidhar EIB 2 to Shyamal Shyamal to Vejalpur Vejalpur to Jivraj 1, Jivraj to Dharnidhar EIB 2 to Shyamal Shyamal to Vejalpur Vejalpur to Jivraj 1, Jivraj to Dharnidhar EIB 2 to Shyamal Shyamal to Vejalpur Vejalpur to Jivraj 1, Jivraj to Dharnidhar EIB 2 to Shyamal Shyamal to Vejalpur Vejalpur to Jivraj 1, Jivraj to Dharnidhar Afternoon EIB 2 to Shyamal Shyamal to Vejalpur Vejalpur to Jivraj
104 Appendix 12 Route 3: Travel Time and Speed Study (Pre-Implementation Stage) Section Distance (m) Travel Time (min) Speed (km/hr) Jivraj to Dharnidhar EIB 2 to Shyamal Shyamal to Vejalpur Vejalpur to Jivraj Jivraj to Dharnidhar EIB 2 to Shyamal Shyamal to Vejalpur Vejalpur to Jivraj Jivraj to Dharnidhar EIB 2 to Shyamal Shyamal to Vejalpur Vejalpur to Jivraj Jivraj to Dharnidhar EIB 2 to Shyamal Shyamal to Vejalpur Vejalpur to Jivraj Jivraj to Dharnidhar EIB 2 to Shyamal Shyamal to Vejalpur Vejalpur to Jivraj Jivraj to Dharnidhar EIB 2 to Shyamal Shyamal to Vejalpur Vejalpur to Jivraj Jivraj to Dharnidhar EIB 2 to Shyamal Shyamal to Vejalpur Vejalpur to Jivraj Jivraj to Dharnidhar EIB 2 to Shyamal Shyamal to Vejalpur Vejalpur to Jivraj Jivraj to Dharnidhar Date: 30th September Average Avg. Trip Avg. Travel Speed Speed Time (km/hr) (km/hr) (min) EIB 2 to Shyamal Shyamal to Vejalpur Vejalpur to Jivraj Jivraj to Dharnidhar EIB 2 to Shyamal Shyamal to Vejalpur Vejalpur to Jivraj Jivraj to Dharnidhar EIB 2 to Shyamal Shyamal to Vejalpur
105 Appendix 12 Route 3: Travel Time and Speed Study (Pre-Implementation Stage) Section Distance (m) Travel Time (min) Speed (km/hr) Vejalpur to Jivraj Jivraj to Dharnidhar EIB 2 to Shyamal Shyamal to Vejalpur Vejalpur to Jivraj Jivraj to Dharnidhar EIB 2 to Shyamal Shyamal to Vejalpur Vejalpur to Jivraj Jivraj to Dharnidhar EIB 2 to Shyamal Shyamal to Vejalpur Vejalpur to Jivraj Jivraj to Dharnidhar EIB 2 to Shyamal Shyamal to Vejalpur Vejalpur to Jivraj Jivraj to Dharnidhar EIB 2 to Shyamal Shyamal to Vejalpur Vejalpur to Jivraj Jivraj to Dharnidhar EIB 2 to Shyamal Shyamal to Vejalpur Vejalpur to Jivraj Jivraj to Dharnidhar EIB 2 to Shyamal Shyamal to Vejalpur Vejalpur to Jivraj Jivraj to Dharnidhar Date: 30th September Average Avg. Trip Avg. Travel Speed Speed Time (km/hr) (km/hr) (min) EIB 2 to Shyamal Shyamal to Vejalpur Vejalpur to Jivraj Jivraj to Dharnidhar
106 Appendix 12 Section Route 4: Travel Time and Speed Study (Pre-Implementation Stage) Distance (m) Travel Time (min) Speed (km/hr) Date: 30th September Average Trip Speed (km/hr) Morning Shyamal to Manekbaug soc 1, Manekbaug soc to Manekbaug cross road Shyamal to Manekbaug soc 1, Manekbaug soc to Manekbaug cross road Shyamal to Manekbaug soc 1, Manekbaug soc to Manekbaug cross road Shyamal to Manekbaug soc 1, Manekbaug soc to Manekbaug cross road Shyamal to Manekbaug soc 1, Manekbaug soc to Manekbaug cross road Shyamal to Manekbaug soc 1, Manekbaug soc to Manekbaug cross road Shyamal to Manekbaug soc 1, Manekbaug soc to Manekbaug cross road Avg. Speed (km/hr) Avg. Travel Time (min) Shyamal to Manekbaug soc 1, Manekbaug soc to Manekbaug cross road Afternoon Shyamal to Manekbaug soc 1, Manekbaug soc to Manekbaug cross road Shyamal to Manekbaug soc 1, Manekbaug soc to Manekbaug cross road Shyamal to Manekbaug soc 1, Manekbaug soc to Manekbaug cross road Shyamal to Manekbaug soc 1, Manekbaug soc to Manekbaug cross road Shyamal to Manekbaug soc 1, Manekbaug soc to Manekbaug cross road , Shyamal to Manekbaug soc Manekbaug soc to Manekbaug cross road Shyamal to Manekbaug soc 1, Manekbaug soc to Manekbaug cross road
107 Appendix 12 Section Route 4: Travel Time and Speed Study (Pre-Implementation Stage) Distance (m) Travel Time (min) Speed (km/hr) Date: 30th September Average Trip Speed (km/hr) Avg. Speed (km/hr) Avg. Travel Time (min) Shyamal to Manekbaug soc 1, Manekbaug soc to Manekbaug cross road Evening Shyamal to Manekbaug soc 1, Manekbaug soc to Manekbaug cross road Shyamal to Manekbaug soc 1, Manekbaug soc to Manekbaug cross road Shyamal to Manekbaug soc 1, Manekbaug soc to Manekbaug cross road Shyamal to Manekbaug soc 1, Manekbaug soc to Manekbaug cross road Shyamal to Manekbaug soc 1, Manekbaug soc to Manekbaug cross road , Shyamal to Manekbaug soc Manekbaug soc to Manekbaug cross road Shyamal to Manekbaug soc 1, Manekbaug soc to Manekbaug cross road Shyamal to Manekbaug soc 1, Manekbaug soc to Manekbaug cross road
108 Appendix 12 Route 5: Travel Time and Speed Study (Pre-Implementation Stage) Morning Section Distance (m) Travel Time (min) Speed (km/hr) Jodhpur to Shivranjni Shivranjni to Nehrunagar 1, Date: 30th September Average Avg. Trip Avg. Travel Speed Speed Time (km/hr) (km/hr) (min) Afternoon Jodhpur to Shivranjni Shivranjni to Nehrunagar 1, Jodhpur to Shivranjni Shivranjni to Nehrunagar 1, Jodhpur to Shivranjni Shivranjni to Nehrunagar 1, Jodhpur to Shivranjni Shivranjni to Nehrunagar 1, Jodhpur to Shivranjni Shivranjni to Nehrunagar 1, Jodhpur to Shivranjni Shivranjni to Nehrunagar 1, Jodhpur to Shivranjni Shivranjni to Nehrunagar 1, Jodhpur to Shivranjni Shivranjni to Nehrunagar 1, Jodhpur to Shivranjni Shivranjni to Nehrunagar 1, Jodhpur to Shivranjni Shivranjni to Nehrunagar 1, Jodhpur to Shivranjni Shivranjni to Nehrunagar 1, Jodhpur to Shivranjni Shivranjni to Nehrunagar 1, Jodhpur to Shivranjni Shivranjni to Nehrunagar 1, Jodhpur to Shivranjni
109 Appendix 12 Route 5: Travel Time and Speed Study (Pre-Implementation Stage) Evening Section Distance (m) Travel Time (min) Speed (km/hr) Date: 30th September Average Avg. Trip Avg. Travel Speed Speed Time (km/hr) (km/hr) (min) Shivranjni to Nehrunagar 1, Jodhpur to Shivranjni Shivranjni to Nehrunagar 1, Jodhpur to Shivranjni Shivranjni to Nehrunagar 1, Jodhpur to Shivranjni Shivranjni to Nehrunagar 1, Jodhpur to Shivranjni Shivranjni to Nehrunagar 1, Jodhpur to Shivranjni Shivranjni to Nehrunagar 1, Jodhpur to Shivranjni Shivranjni to Nehrunagar 1, Jodhpur to Shivranjni Shivranjni to Nehrunagar 1, Jodhpur to Shivranjni Shivranjni to Nehrunagar 1,
110 Appendix 12 Route 6: Travel Time and Speed Study (Pre-Implementation Stage) Morning Section Distance (m) Travel Time (min) Speed (km/hr) Mansi to Keshavbaug Keshavbaug to Andhjan Date: 30th September Average Avg. Trip Avg. Travel Speed Speed Time (km/hr) (km/hr) (min) Mansi to Keshavbaug Keshavbaug to Andhjan Mansi to Keshavbaug Keshavbaug to Andhjan Mansi to Keshavbaug Keshavbaug to Andhjan Mansi to Keshavbaug Keshavbaug to Andhjan Mansi to Keshavbaug Keshavbaug to Andhjan Mansi to Keshavbaug Keshavbaug to Andhjan Mansi to Keshavbaug Keshavbaug to Andhjan Mansi to Keshavbaug Keshavbaug to Andhjan Mansi to Keshavbaug Keshavbaug to Andhjan Mansi to Keshavbaug Keshavbaug to Andhjan Afternoon Mansi to Keshavbaug Keshavbaug to Andhjan Mansi to Keshavbaug Keshavbaug to Andhjan Mansi to Keshavbaug Keshavbaug to Andhjan Mansi to Keshavbaug
111 Appendix 12 Route 6: Travel Time and Speed Study (Pre-Implementation Stage) Section Distance (m) Travel Time (min) Speed (km/hr) Keshavbaug to Andhjan Mansi to Keshavbaug Keshavbaug to Andhjan Mansi to Keshavbaug Keshavbaug to Andhjan Mansi to Keshavbaug Keshavbaug to Andhjan Mansi to Keshavbaug Keshavbaug to Andhjan Mansi to Keshavbaug Keshavbaug to Andhjan Mansi to Keshavbaug Keshavbaug to Andhjan Mansi to Keshavbaug Keshavbaug to Andhjan Mansi to Keshavbaug Keshavbaug to Andhjan Mansi to Keshavbaug Keshavbaug to Andhjan Mansi to Keshavbaug Keshavbaug to Andhjan Mansi to Keshavbaug Keshavbaug to Andhjan Date: 30th September Average Avg. Trip Avg. Travel Speed Speed Time (km/hr) (km/hr) (min) Evening Mansi to Keshavbaug Keshavbaug to Andhjan Mansi to Keshavbaug Keshavbaug to Andhjan Mansi to Keshavbaug Keshavbaug to Andhjan
112 Appendix 12 Route 6: Travel Time and Speed Study (Pre-Implementation Stage) Section Distance (m) Travel Time (min) Speed (km/hr) Mansi to Keshavbaug Keshavbaug to Andhjan Mansi to Keshavbaug Keshavbaug to Andhjan Mansi to Keshavbaug Keshavbaug to Andhjan Mansi to Keshavbaug Keshavbaug to Andhjan Mansi to Keshavbaug Keshavbaug to Andhjan Mansi to Keshavbaug Keshavbaug to Andhjan Mansi to Keshavbaug Keshavbaug to Andhjan Mansi to Keshavbaug Keshavbaug to Andhjan Mansi to Keshavbaug Keshavbaug to Andhjan Mansi to Keshavbaug Keshavbaug to Andhjan Mansi to Keshavbaug Keshavbaug to Andhjan Date: 30th September Average Avg. Trip Avg. Travel Speed Speed Time (km/hr) (km/hr) (min) Mansi to Keshavbaug Keshavbaug to Andhjan
113 Appendix 12 Route 7: Travel Time and Speed Study (Pre-Implementation Stage) Morning Section Distance (m) (m) Travel Time (min) Speed (km/hr) Average Trip Speed (km/hr) EIB 4 to Mansi Mansi to Vastrapur Vastrapur to Iim Date: 30th September Avg. Speed (km/hr) Avg. Travel Time (min) EIB 4 to Mansi Mansi to Vastrapur Vastrapur to Iim EIB 4 to Mansi Mansi to Vastrapur Vastrapur to Iim EIB 4 to Mansi Mansi to Vastrapur Vastrapur to Iim EIB 4 to Mansi Mansi to Vastrapur Vastrapur to Iim EIB 4 to Mansi Mansi to Vastrapur Vastrapur to Iim EIB 4 to Mansi Mansi to Vastrapur Vastrapur to Iim EIB 4 to Mansi Mansi to Vastrapur Vastrapur to Iim EIB 4 to Mansi Mansi to Vastrapur Vastrapur to Iim Afternoon EIB 4 to Mansi Mansi to Vastrapur Vastrapur to Iim EIB 4 to Mansi Mansi to Vastrapur Vastrapur to Iim EIB 4 to Mansi Mansi to Vastrapur Vastrapur to Iim
114 Appendix 12 Section Route 7: Travel Time and Speed Study (Pre-Implementation Stage) Distance (m) (m) Travel Time (min) Speed (km/hr) Average Trip Speed (km/hr) EIB 4 to Mansi Mansi to Vastrapur Vastrapur to Iim EIB 4 to Mansi Mansi to Vastrapur Vastrapur to Iim EIB 4 to Mansi Mansi to Vastrapur Vastrapur to Iim EIB 4 to Mansi Mansi to Vastrapur Vastrapur to Iim EIB 4 to Mansi Mansi to Vastrapur Vastrapur to Iim EIB 4 to Mansi Mansi to Vastrapur Vastrapur to Iim EIB 4 to Mansi Mansi to Vastrapur Vastrapur to Iim EIB 4 to Mansi Mansi to Vastrapur Vastrapur to Iim Date: 30th September Avg. Speed (km/hr) Avg. Travel Time (min) Evening EIB 4 to Mansi Mansi to Vastrapur Vastrapur to Iim EIB 4 to Mansi Mansi to Vastrapur Vastrapur to Iim EIB 4 to Mansi Mansi to Vastrapur Vastrapur to Iim EIB 4 to Mansi Mansi to Vastrapur Vastrapur to Iim EIB 4 to Mansi
115 Appendix 12 Section Route 7: Travel Time and Speed Study (Pre-Implementation Stage) Distance (m) (m) Travel Time (min) Speed (km/hr) Average Trip Speed (km/hr) Mansi to Vastrapur Vastrapur to Iim EIB 4 to Mansi Mansi to Vastrapur Vastrapur to Iim EIB 4 to Mansi Mansi to Vastrapur Vastrapur to Iim Date: 30th September Avg. Speed (km/hr) Avg. Travel Time (min) EIB 4 to Mansi Mansi to Vastrapur Vastrapur to Iim
116 APPENDIX 13 SPEED DENSITY RELATIONSHIP CURVES
117 CTS 1
118 CTS 2
119 CTS 3
120 CTS 4
121 CTS 6
122 CTS 7
123 CTS 8
124 CTS 9
125 CTS 10
126 CTS 11
127 CTS 12
128 CTS 13
129 APPENDIX 14 SPEED VS. TIME OF DAY GRAPHS
130 11/24 00:00 11/24 04:00 11/24 08:00 11/24 12:00 11/24 16:00 11/24 20:00 11/25 00:00 11/25 04:00 11/25 08:00 11/25 12:00 11/25 16:00 11/25 20:00 11/26 00:00 11/26 04:00 11/26 08:00 11/26 12:00 11/26 16:00 11/26 20:00 11/27 00:00 11/27 04:00 11/27 08:00 11/27 12:00 11/27 16:00 11/27 20:00 11/28 00:00 11/28 04:00 11/28 08:00 11/28 12:00 11/28 16:00 11/28 20:00 11/29 00:00 11/29 04:00 11/29 08:00 11/29 12:00 11/29 16:00 11/29 20:00 11/30 00:00 11/30 04:00 11/30 08:00 11/30 12:00 11/30 16:00 11/30 20:00 CTS 1 100% 90% 80% 70% 60% 50% 40% 30% 20% 10% 0% 75km~ 70km~ 65km~ 60km~ 55km~ 50km~ 45km~ 40km~ 35km~ 30km~ 25km~ 20km~ 15km~ 10km~ 5km~ 0km~
131 11/24 00:00 11/24 04:00 11/24 08:00 11/24 12:00 11/24 16:00 11/24 20:00 11/25 00:00 11/25 04:00 11/25 08:00 11/25 12:00 11/25 16:00 11/25 20:00 11/26 00:00 11/26 04:00 11/26 08:00 11/26 12:00 11/26 16:00 11/26 20:00 11/27 00:00 11/27 04:00 11/27 08:00 11/27 12:00 11/27 16:00 11/27 20:00 11/28 00:00 11/28 04:00 11/28 08:00 11/28 12:00 11/28 16:00 11/28 20:00 11/29 00:00 11/29 04:00 11/29 08:00 11/29 12:00 11/29 16:00 11/29 20:00 11/30 00:00 11/30 04:00 11/30 08:00 11/30 12:00 11/30 16:00 11/30 20:00 CTS 2 100% 90% 80% 70% 60% 50% 40% 30% 20% 10% 0% 75km~ 70km~ 65km~ 60km~ 55km~ 50km~ 45km~ 40km~ 35km~ 30km~ 25km~ 20km~ 15km~ 10km~ 5km~ 0km~
132 11/24 00:00 11/24 04:00 11/24 08:00 11/24 12:00 11/24 16:00 11/24 20:00 11/25 00:00 11/25 04:00 11/25 08:00 11/25 12:00 11/25 16:00 11/25 20:00 11/26 00:00 11/26 04:00 11/26 08:00 11/26 12:00 11/26 16:00 11/26 20:00 11/27 00:00 11/27 04:00 11/27 08:00 11/27 12:00 11/27 16:00 11/27 20:00 11/28 00:00 11/28 04:00 11/28 08:00 11/28 12:00 11/28 16:00 11/28 20:00 11/29 00:00 11/29 04:00 11/29 08:00 11/29 12:00 11/29 16:00 11/29 20:00 11/30 00:00 11/30 04:00 11/30 08:00 11/30 12:00 11/30 16:00 11/30 20:00 CTS 3 100% 90% 80% 70% 60% 50% 40% 30% 20% 10% 0% 75km~ 70km~ 65km~ 60km~ 55km~ 50km~ 45km~ 40km~ 35km~ 30km~ 25km~ 20km~ 15km~ 10km~ 5km~ 0km~
133 11/24 00:00 11/24 04:00 11/24 08:00 11/24 12:00 11/24 16:00 11/24 20:00 11/25 00:00 11/25 04:00 11/25 08:00 11/25 12:00 11/25 16:00 11/25 20:00 11/26 00:00 11/26 04:00 11/26 08:00 11/26 12:00 11/26 16:00 11/26 20:00 11/27 00:00 11/27 04:00 11/27 08:00 11/27 12:00 11/27 16:00 11/27 20:00 11/28 00:00 11/28 04:00 11/28 08:00 11/28 12:00 11/28 16:00 11/28 20:00 11/29 00:00 11/29 04:00 11/29 08:00 11/29 12:00 11/29 16:00 11/29 20:00 11/30 00:00 11/30 04:00 11/30 08:00 11/30 12:00 11/30 16:00 11/30 20:00 CTS 4 100% 90% 80% 70% 60% 50% 40% 30% 20% 10% 0% 75km~ 70km~ 65km~ 60km~ 55km~ 50km~ 45km~ 40km~ 35km~ 30km~ 25km~ 20km~ 15km~ 10km~ 5km~ 0km~
134 11/24 00:00 11/24 04:00 11/24 08:00 11/24 12:00 11/24 16:00 11/24 20:00 11/25 00:00 11/25 04:00 11/25 08:00 11/25 12:00 11/25 16:00 11/25 20:00 11/26 00:00 11/26 04:00 11/26 08:00 11/26 12:00 11/26 16:00 11/26 20:00 11/27 00:00 11/27 04:00 11/27 08:00 11/27 12:00 11/27 16:00 11/27 20:00 11/28 00:00 11/28 04:00 11/28 08:00 11/28 12:00 11/28 16:00 11/28 20:00 11/29 00:00 11/29 04:00 11/29 08:00 11/29 12:00 11/29 16:00 11/29 20:00 11/30 00:00 11/30 04:00 11/30 08:00 11/30 12:00 11/30 16:00 11/30 20:00 CTS 6 100% 90% 80% 70% 60% 50% 40% 30% 20% 10% 0% 75km~ 70km~ 65km~ 60km~ 55km~ 50km~ 45km~ 40km~ 35km~ 30km~ 25km~ 20km~ 15km~ 10km~ 5km~ 0km~
135 11/24 00:00 11/24 04:00 11/24 08:00 11/24 12:00 11/24 16:00 11/24 20:00 11/25 00:00 11/25 04:00 11/25 08:00 11/25 12:00 11/25 16:00 11/25 20:00 11/26 00:00 11/26 04:00 11/26 08:00 11/26 12:00 11/26 16:00 11/26 20:00 11/27 00:00 11/27 04:00 11/27 08:00 11/27 12:00 11/27 16:00 11/27 20:00 11/28 00:00 11/28 04:00 11/28 08:00 11/28 12:00 11/28 16:00 11/28 20:00 11/29 00:00 11/29 04:00 11/29 08:00 11/29 12:00 11/29 16:00 11/29 20:00 11/30 00:00 11/30 04:00 11/30 08:00 11/30 12:00 11/30 16:00 11/30 20:00 CTS 7 100% 90% 80% 70% 60% 50% 40% 30% 20% 10% 0% 75km~ 70km~ 65km~ 60km~ 55km~ 50km~ 45km~ 40km~ 35km~ 30km~ 25km~ 20km~ 15km~ 10km~ 5km~ 0km~
136 11/24 00:00 11/24 04:00 11/24 08:00 11/24 12:00 11/24 16:00 11/24 20:00 11/25 00:00 11/25 04:00 11/25 08:00 11/25 12:00 11/25 16:00 11/25 20:00 11/26 00:00 11/26 04:00 11/26 08:00 11/26 12:00 11/26 16:00 11/26 20:00 11/27 00:00 11/27 04:00 11/27 08:00 11/27 12:00 11/27 16:00 11/27 20:00 11/28 00:00 11/28 04:00 11/28 08:00 11/28 12:00 11/28 16:00 11/28 20:00 11/29 00:00 11/29 04:00 11/29 08:00 11/29 12:00 11/29 16:00 11/29 20:00 11/30 00:00 11/30 04:00 11/30 08:00 11/30 12:00 11/30 16:00 11/30 20:00 CTS 8 100% 90% 80% 70% 60% 50% 40% 30% 20% 10% 0% 75km~ 70km~ 65km~ 60km~ 55km~ 50km~ 45km~ 40km~ 35km~ 30km~ 25km~ 20km~ 15km~ 10km~ 5km~ 0km~
137 11/24 00:00 11/24 04:00 11/24 08:00 11/24 12:00 11/24 16:00 11/24 20:00 11/25 00:00 11/25 04:00 11/25 08:00 11/25 12:00 11/25 16:00 11/25 20:00 11/26 00:00 11/26 04:00 11/26 08:00 11/26 12:00 11/26 16:00 11/26 20:00 11/27 00:00 11/27 04:00 11/27 08:00 11/27 12:00 11/27 16:00 11/27 20:00 11/28 00:00 11/28 04:00 11/28 08:00 11/28 12:00 11/28 16:00 11/28 20:00 11/29 00:00 11/29 04:00 11/29 08:00 11/29 12:00 11/29 16:00 11/29 20:00 11/30 00:00 11/30 04:00 11/30 08:00 11/30 12:00 11/30 16:00 11/30 20:00 CTS 9 100% 90% 80% 70% 60% 50% 40% 30% 20% 10% 0% 75km~ 70km~ 65km~ 60km~ 55km~ 50km~ 45km~ 40km~ 35km~ 30km~ 25km~ 20km~ 15km~ 10km~ 5km~ 0km~
138 11/24 00:00 11/24 04:00 11/24 08:00 11/24 12:00 11/24 16:00 11/24 20:00 11/25 00:00 11/25 04:00 11/25 08:00 11/25 12:00 11/25 16:00 11/25 20:00 11/26 00:00 11/26 04:00 11/26 08:00 11/26 12:00 11/26 16:00 11/26 20:00 11/27 00:00 11/27 04:00 11/27 08:00 11/27 12:00 11/27 16:00 11/27 20:00 11/28 00:00 11/28 04:00 11/28 08:00 11/28 12:00 11/28 16:00 11/28 20:00 11/29 00:00 11/29 04:00 11/29 08:00 11/29 12:00 11/29 16:00 11/29 20:00 11/30 00:00 11/30 04:00 11/30 08:00 11/30 12:00 11/30 16:00 11/30 20:00 CTS % 90% 80% 70% 60% 50% 40% 30% 20% 10% 0% 75km~ 70km~ 65km~ 60km~ 55km~ 50km~ 45km~ 40km~ 35km~ 30km~ 25km~ 20km~ 15km~ 10km~ 5km~ 0km~
139 11/24 00:00 11/24 04:00 11/24 08:00 11/24 12:00 11/24 16:00 11/24 20:00 11/25 00:00 11/25 04:00 11/25 08:00 11/25 12:00 11/25 16:00 11/25 20:00 11/26 00:00 11/26 04:00 11/26 08:00 11/26 12:00 11/26 16:00 11/26 20:00 11/27 00:00 11/27 04:00 11/27 08:00 11/27 12:00 11/27 16:00 11/27 20:00 11/28 00:00 11/28 04:00 11/28 08:00 11/28 12:00 11/28 16:00 11/28 20:00 11/29 00:00 11/29 04:00 11/29 08:00 11/29 12:00 11/29 16:00 11/29 20:00 11/30 00:00 11/30 04:00 11/30 08:00 11/30 12:00 11/30 16:00 11/30 20:00 CTS % 90% 80% 70% 60% 50% 40% 30% 20% 10% 0% 75km~ 70km~ 65km~ 60km~ 55km~ 50km~ 45km~ 40km~ 35km~ 30km~ 25km~ 20km~ 15km~ 10km~ 5km~ 0km~
140 11/24 00:00 11/24 04:00 11/24 08:00 11/24 12:00 11/24 16:00 11/24 20:00 11/25 00:00 11/25 04:00 11/25 08:00 11/25 12:00 11/25 16:00 11/25 20:00 11/26 00:00 11/26 04:00 11/26 08:00 11/26 12:00 11/26 16:00 11/26 20:00 11/27 00:00 11/27 04:00 11/27 08:00 11/27 12:00 11/27 16:00 11/27 20:00 11/28 00:00 11/28 04:00 11/28 08:00 11/28 12:00 11/28 16:00 11/28 20:00 11/29 00:00 11/29 04:00 11/29 08:00 11/29 12:00 11/29 16:00 11/29 20:00 11/30 00:00 11/30 04:00 11/30 08:00 11/30 12:00 11/30 16:00 11/30 20:00 CTS % 90% 80% 70% 60% 50% 40% 30% 20% 10% 0% 75km~ 70km~ 65km~ 60km~ 55km~ 50km~ 45km~ 40km~ 35km~ 30km~ 25km~ 20km~ 15km~ 10km~ 5km~ 0km~
141 11/24 00:00 11/24 04:00 11/24 08:00 11/24 12:00 11/24 16:00 11/24 20:00 11/25 00:00 11/25 04:00 11/25 08:00 11/25 12:00 11/25 16:00 11/25 20:00 11/26 00:00 11/26 04:00 11/26 08:00 11/26 12:00 11/26 16:00 11/26 20:00 11/27 00:00 11/27 04:00 11/27 08:00 11/27 12:00 11/27 16:00 11/27 20:00 11/28 00:00 11/28 04:00 11/28 08:00 11/28 12:00 11/28 16:00 11/28 20:00 11/29 00:00 11/29 04:00 11/29 08:00 11/29 12:00 11/29 16:00 11/29 20:00 11/30 00:00 11/30 04:00 11/30 08:00 11/30 12:00 11/30 16:00 11/30 20:00 CTS % 90% 80% 70% 60% 50% 40% 30% 20% 10% 0% 75km~ 70km~ 65km~ 60km~ 55km~ 50km~ 45km~ 40km~ 35km~ 30km~ 25km~ 20km~ 15km~ 10km~ 5km~ 0km~
142 Appendix 15 Origin and Destination Survey Form (Post Implementation) Location:. Date: Weather: Survey Time: From: To:. Up Direction: Dn Direction:. Sr No. Type of Vehicle Destination Place Route Followed Do you take alternate route based on the information on the above board to reach your destination? (Y/N) Are you satisfied with the information shown on the board? AHMEDABAD MUNCIPAL CORPORATION PRE TRAFFIC STUDY FOR TRAIL ITS PROJECT IN AHMEDABAD ZERO SUM LTD JAPAN
143 Questions Asked: Column 3: Where are you going to? Column 4: Which route will you take to reach your destination? Column 5: Do you take alternate route based on the information on the above board to reach your destination? (Y/N) Column 6: On a scale of 1 to 10, Are you satisfied with the information shown on the board? (10 being most helpful and 1 being not at all helpful) AHMEDABAD MUNCIPAL CORPORATION PRE TRAFFIC STUDY FOR TRAIL ITS PROJECT IN AHMEDABAD ZERO SUM LTD JAPAN
144 Destination Zone Appendix - 16 : Route Choice Matrix for All Vehicles Near APMC Market (EIB-1) Post Implementation Phase Location: Near APMC Market Chainage: EIB-1 Date: 23rd December, 2014 (in % of Total Trips) Route Choice through Zone Grand Zones Total Grand Total
145 Destination Zone Post Implementation Phase Appendix - 17 : Route Choice Matrix for All Vehicles Near Shyamal Cross Road Location: Near Shyamal Road Chainage: EIB-2 Date: 24th December, 2014 (in % of Total Trips) Grand Route Choice through Zone Zones Total Grand Total
146 Destination Zone Post Implementation Phase Appendix - 18 : Route Choice Matrix for All Vehicles Near Shivranjni Road Location: Near Shivranjni Road Chainage: EIB-3 Date: 25th December, 2014 (in % of Total Trips) Grand Route Choice through Zone Zones Total Grand Total
147 Destination Zone Post Implementation Phase Appendix -19 : Route Choice Matrix for All Vehicles Near Mansi Cross Road Location: Near Mansi Cross Road Chainage: EIB-4 Date: 26th December, 2014 (in % of Total Trips) Grand Route Choice through Zone Zones Total Grand Total
148 Appendix 20 Route 1: Travel Time and Speed Study (Post-Implementation Stage) Date: 30th December, 2014 Morning Section Distance (m) Travel Time (min) Speed (km/hr) APMC to Vejalpur Vejalpur to Shyamal Shyamal to Shivranjni Shivranjni to Keshavbaug Keshavbaug to Andhjan APMC to Vejalpur Vejalpur to Shyamal Shyamal to Shivranjni Shivranjni to Keshavbaug Keshavbaug to Andhjan Avg. Speed (km/hr) Avg. Travel Time (min) APMC to Vejalpur Vejalpur to Shyamal Shyamal to Shivranjni Shivranjni to Keshavbaug Keshavbaug to Andhjan APMC to Vejalpur Vejalpur to Shyamal Shyamal to Shivranjni Shivranjni to Keshavbaug Keshavbaug to Andhjan APMC to Vejalpur Vejalpur to Shyamal Shyamal to Shivranjni Shivranjni to Keshavbaug Keshavbaug to Andhjan APMC to Vejalpur Vejalpur to Shyamal Shyamal to Shivranjni Shivranjni to Keshavbaug Keshavbaug to Andhjan Afternoon APMC to Vejalpur Vejalpur to Shyamal Shyamal to Shivranjni Shivranjni to Keshavbaug Keshavbaug to Andhjan
149 Appendix 20 Route 1: Travel Time and Speed Study (Post-Implementation Stage) Date: 30th December, 2014 Section Distance (m) Travel Time (min) Speed (km/hr) APMC to Vejalpur Vejalpur to Shyamal Shyamal to Shivranjni Shivranjni to Keshavbaug Keshavbaug to Andhjan Avg. Speed (km/hr) Avg. Travel Time (min) APMC to Vejalpur Vejalpur to Shyamal Shyamal to Shivranjni Shivranjni to Keshavbaug Keshavbaug to Andhjan APMC to Vejalpur Vejalpur to Shyamal Shyamal to Shivranjni Shivranjni to Keshavbaug Keshavbaug to Andhjan APMC to Vejalpur Vejalpur to Shyamal Shyamal to Shivranjni Shivranjni to Keshavbaug Keshavbaug to Andhjan APMC to Vejalpur Vejalpur to Shyamal Shyamal to Shivranjni Shivranjni to Keshavbaug Keshavbaug to Andhjan APMC to Vejalpur Vejalpur to Shyamal Shyamal to Shivranjni Shivranjni to Keshavbaug Keshavbaug to Andhjan APMC to Vejalpur Vejalpur to Shyamal Shyamal to Shivranjni Shivranjni to Keshavbaug Keshavbaug to Andhjan APMC to Vejalpur
150 Appendix 20 Route 1: Travel Time and Speed Study (Post-Implementation Stage) Date: 30th December, 2014 Evening Section Distance (m) Travel Time (min) Speed (km/hr) Avg. Speed (km/hr) Avg. Travel Time (min) Vejalpur to Shyamal Shyamal to Shivranjni Shivranjni to Keshavbaug Keshavbaug to Andhjan APMC to Vejalpur Vejalpur to Shyamal Shyamal to Shivranjni Shivranjni to Keshavbaug Keshavbaug to Andhjan APMC to Vejalpur Vejalpur to Shyamal Shyamal to Shivranjni Shivranjni to Keshavbaug Keshavbaug to Andhjan APMC to Vejalpur Vejalpur to Shyamal Shyamal to Shivranjni Shivranjni to Keshavbaug Keshavbaug to Andhjan APMC to Vejalpur Vejalpur to Shyamal Shyamal to Shivranjni Shivranjni to Keshavbaug Keshavbaug to Andhjan APMC to Vejalpur Vejalpur to Shyamal Shyamal to Shivranjni Shivranjni to Keshavbaug Keshavbaug to Andhjan APMC to Vejalpur Vejalpur to Shyamal Shyamal to Shivranjni Shivranjni to Keshavbaug Keshavbaug to Andhjan
151 Appendix 20 Morning Route 2: Travel Time and Speed Study (Post-Implementation Stage) Date: 30th December, 2014 Average Avg. Travel Distance Speed Trip Avg. Travel Section Time (m) (km/hr) Speed Speed Time (min) (km/hr) (km/hr) (min) APMC to Vasna Vasna to Anjali APMC to Vasna Vasna to Anjali APMC to Vasna Vasna to Anjali APMC to Vasna Vasna to Anjali APMC to Vasna Vasna to Anjali APMC to Vasna Vasna to Anjali APMC to Vasna Vasna to Anjali APMC to Vasna Vasna to Anjali APMC to Vasna Vasna to Anjali Afternoon APMC to Vasna Vasna to Anjali APMC to Vasna Vasna to Anjali APMC to Vasna Vasna to Anjali APMC to Vasna Vasna to Anjali APMC to Vasna
152 Appendix 20 Route 2: Travel Time and Speed Study (Post-Implementation Stage) Date: 30th December, 2014 Average Avg. Travel Distance Speed Trip Avg. Travel Section Time (m) (km/hr) Speed Speed Time (min) (km/hr) (km/hr) (min) Vasna to Anjali APMC to Vasna Vasna to Anjali APMC to Vasna Vasna to Anjali APMC to Vasna Vasna to Anjali APMC to Vasna Vasna to Anjali APMC to Vasna Vasna to Anjali APMC to Vasna Vasna to Anjali APMC to Vasna Vasna to Anjali APMC to Vasna Vasna to Anjali APMC to Vasna Vasna to Anjali APMC to Vasna Vasna to Anjali APMC to Vasna Vasna to Anjali APMC to Vasna Vasna to Anjali Evening APMC to Vasna Vasna to Anjali APMC to Vasna Vasna to Anjali
153 Appendix 20 Route 2: Travel Time and Speed Study (Post-Implementation Stage) Date: 30th December, 2014 Average Avg. Travel Distance Speed Trip Avg. Travel Section Time (m) (km/hr) Speed Speed Time (min) (km/hr) (km/hr) (min) APMC to Vasna Vasna to Anjali APMC to Vasna Vasna to Anjali APMC to Vasna Vasna to Anjali APMC to Vasna Vasna to Anjali APMC to Vasna Vasna to Anjali APMC to Vasna Vasna to Anjali APMC to Vasna Vasna to Anjali APMC to Vasna Vasna to Anjali
154 Appendix 20 Morning Route 3: Travel Time and Speed Study (Post-Implementation Stage) Date: 30th December, 2014 Average Avg. Travel Distance Speed Trip Avg. Travel Section Time (m) (km/hr) Speed Speed Time (min) (km/hr) (km/hr) (min) EIB 2 to Shyamal Shyamal to Vejalpur Vejalpur to Jivraj 1, Jivraj to Dharnidhar Afternoon EIB 2 to Shyamal Shyamal to Vejalpur Vejalpur to Jivraj 1, Jivraj to Dharnidhar EIB 2 to Shyamal Shyamal to Vejalpur Vejalpur to Jivraj 1, Jivraj to Dharnidhar EIB 2 to Shyamal Shyamal to Vejalpur Vejalpur to Jivraj 1, Jivraj to Dharnidhar EIB 2 to Shyamal Shyamal to Vejalpur Vejalpur to Jivraj 1, Jivraj to Dharnidhar EIB 2 to Shyamal Shyamal to Vejalpur Vejalpur to Jivraj 1, Jivraj to Dharnidhar EIB 2 to Shyamal Shyamal to Vejalpur Vejalpur to Jivraj 1, Jivraj to Dharnidhar EIB 2 to Shyamal Shyamal to Vejalpur Vejalpur to Jivraj 1, Jivraj to Dharnidhar EIB 2 to Shyamal Shyamal to Vejalpur
155 Appendix 20 Route 3: Travel Time and Speed Study (Post-Implementation Stage) Date: 30th December, 2014 Section Average Avg. Travel Distance Speed Trip Avg. Travel Time (m) (km/hr) Speed Speed Time (min) (km/hr) (km/hr) (min) Vejalpur to Jivraj Jivraj to Dharnidhar EIB 2 to Shyamal Shyamal to Vejalpur Vejalpur to Jivraj Jivraj to Dharnidhar EIB 2 to Shyamal Shyamal to Vejalpur Vejalpur to Jivraj Jivraj to Dharnidhar EIB 2 to Shyamal Shyamal to Vejalpur Vejalpur to Jivraj Jivraj to Dharnidhar EIB 2 to Shyamal Shyamal to Vejalpur Vejalpur to Jivraj Jivraj to Dharnidhar EIB 2 to Shyamal Shyamal to Vejalpur Vejalpur to Jivraj Jivraj to Dharnidhar EIB 2 to Shyamal Shyamal to Vejalpur Vejalpur to Jivraj Jivraj to Dharnidhar EIB 2 to Shyamal Shyamal to Vejalpur Vejalpur to Jivraj Jivraj to Dharnidhar EIB 2 to Shyamal Shyamal to Vejalpur Vejalpur to Jivraj Jivraj to Dharnidhar
156 Appendix 20 Route 3: Travel Time and Speed Study (Post-Implementation Stage) Date: 30th December, 2014 Section Average Avg. Travel Distance Speed Trip Avg. Travel Time (m) (km/hr) Speed Speed Time (min) (km/hr) (km/hr) (min) EIB 2 to Shyamal Shyamal to Vejalpur Vejalpur to Jivraj Jivraj to Dharnidhar Evening EIB 2 to Shyamal Shyamal to Vejalpur Vejalpur to Jivraj Jivraj to Dharnidhar EIB 2 to Shyamal Shyamal to Vejalpur Vejalpur to Jivraj Jivraj to Dharnidhar EIB 2 to Shyamal Shyamal to Vejalpur Vejalpur to Jivraj Jivraj to Dharnidhar EIB 2 to Shyamal Shyamal to Vejalpur Vejalpur to Jivraj Jivraj to Dharnidhar EIB 2 to Shyamal Shyamal to Vejalpur Vejalpur to Jivraj Jivraj to Dharnidhar EIB 2 to Shyamal Shyamal to Vejalpur Vejalpur to Jivraj Jivraj to Dharnidhar EIB 2 to Shyamal Shyamal to Vejalpur Vejalpur to Jivraj Jivraj to Dharnidhar EIB 2 to Shyamal Shyamal to Vejalpur Vejalpur to Jivraj
157 Appendix 20 Route 3: Travel Time and Speed Study (Post-Implementation Stage) Date: 30th December, 2014 Section Average Avg. Travel Distance Speed Trip Avg. Travel Time (m) (km/hr) Speed Speed Time (min) (km/hr) (km/hr) (min) Jivraj to Dharnidhar EIB 2 to Shyamal Shyamal to Vejalpur Vejalpur to Jivraj Jivraj to Dharnidhar EIB 2 to Shyamal Shyamal to Vejalpur Vejalpur to Jivraj Jivraj to Dharnidhar
158 Appendix 20 Route 4: Travel Time and Speed Study (Post-Implementation Stage) Section Distance (m) Travel Time (min) Speed (km/hr) Morning Shyamal to Manekbaug soc Manekbaug to Manekbaug X road Shyamal to Manekbaug soc Manekbaug to Manekbaug X road Shyamal to Manekbaug soc Manekbaug to Manekbaug X road Shyamal to Manekbaug soc Manekbaug to Manekbaug X road Shyamal to Manekbaug soc Manekbaug to Manekbaug X road Shyamal to Manekbaug soc Manekbaug to Manekbaug X road Shyamal to Manekbaug soc Manekbaug to Manekbaug X road Shyamal to Manekbaug soc Manekbaug to Manekbaug X road Shyamal to Manekbaug soc Manekbaug to Manekbaug X road Date: 30th December, 2014 Average Avg. Trip Avg. Travel Speed Speed Time (km/hr) (km/hr) (min) Shyamal to Manekbaug soc Manekbaug to Manekbaug X road Afternoon Shyamal to Manekbaug soc Manekbaug to Manekbaug X road Shyamal to Manekbaug soc Manekbaug to Manekbaug X road Shyamal to Manekbaug soc Manekbaug to Manekbaug X road Shyamal to Manekbaug soc Manekbaug to Manekbaug X road Shyamal to Manekbaug soc Manekbaug to Manekbaug X road
159 Appendix 20 Route 4: Travel Time and Speed Study (Post-Implementation Stage) Section Distance (m) Travel Time (min) Speed (km/hr) Date: 30th December, 2014 Average Avg. Trip Avg. Travel Speed Speed Time (km/hr) (km/hr) (min) Shyamal to Manekbaug soc Manekbaug to Manekbaug X road Shyamal to Manekbaug soc Manekbaug to Manekbaug X road Shyamal to Manekbaug soc Manekbaug to Manekbaug X road Shyamal to Manekbaug soc Manekbaug to Manekbaug X road Shyamal to Manekbaug soc Manekbaug to Manekbaug X road Shyamal to Manekbaug soc Manekbaug to Manekbaug X road Evening Shyamal to Manekbaug soc Manekbaug to Manekbaug X road Shyamal to Manekbaug soc Manekbaug to Manekbaug X road Shyamal to Manekbaug soc Manekbaug to Manekbaug X road Shyamal to Manekbaug soc Manekbaug to Manekbaug X road Shyamal to Manekbaug soc Manekbaug to Manekbaug X road Shyamal to Manekbaug soc Manekbaug to Manekbaug X road Shyamal to Manekbaug soc Manekbaug to Manekbaug X road
160 Appendix 20 Morning Route 5: Travel Time and Speed Study (Post-Implementation Stage) Date: 30th December, 2014 Average Avg. Travel Distance Speed Trip Avg. Travel Section Time (m) (km/hr) Speed Speed Time (min) (km/hr) (km/hr) (min) Jodhpur to Shivranjni Shivranjni to Nehrunagar Afternoon Jodhpur to Shivranjni Shivranjni to Nehrunagar Jodhpur to Shivranjni Shivranjni to Nehrunagar Jodhpur to Shivranjni Shivranjni to Nehrunagar Jodhpur to Shivranjni Shivranjni to Nehrunagar Jodhpur to Shivranjni Shivranjni to Nehrunagar Jodhpur to Shivranjni Shivranjni to Nehrunagar Jodhpur to Shivranjni Shivranjni to Nehrunagar Jodhpur to Shivranjni Shivranjni to Nehrunagar Jodhpur to Shivranjni Shivranjni to Nehrunagar Jodhpur to Shivranjni Shivranjni to Nehrunagar Jodhpur to Shivranjni Shivranjni to Nehrunagar Jodhpur to Shivranjni Shivranjni to Nehrunagar Jodhpur to Shivranjni
161 Appendix 20 Route 5: Travel Time and Speed Study (Post-Implementation Stage) Date: 30th December, 2014 Average Avg. Travel Distance Speed Trip Avg. Travel Section Time (m) (km/hr) Speed Speed Time (min) (km/hr) (km/hr) (min) Shivranjni to Nehrunagar Jodhpur to Shivranjni Shivranjni to Nehrunagar Jodhpur to Shivranjni Shivranjni to Nehrunagar Jodhpur to Shivranjni Shivranjni to Nehrunagar Evening Jodhpur to Shivranjni Shivranjni to Nehrunagar Jodhpur to Shivranjni Shivranjni to Nehrunagar Jodhpur to Shivranjni Shivranjni to Nehrunagar Jodhpur to Shivranjni Shivranjni to Nehrunagar Jodhpur to Shivranjni Shivranjni to Nehrunagar Jodhpur to Shivranjni Shivranjni to Nehrunagar Jodhpur to Shivranjni Shivranjni to Nehrunagar Jodhpur to Shivranjni Shivranjni to Nehrunagar Jodhpur to Shivranjni Shivranjni to Nehrunagar
162 Appendix 20 Morning Route 6: Travel Time and Speed Study (Post-Implementation Stage) Date: 30th December, 2014 Average Avg. Travel Distance Speed Trip Avg. Travel Section Time (m) (km/hr) Speed Speed Time (min) (km/hr) (km/hr) (min) Mansi to Keshavbaug Keshavbaug to Andhjan Afternoon Mansi to Keshavbaug Keshavbaug to Andhjan Mansi to Keshavbaug Keshavbaug to Andhjan Mansi to Keshavbaug Keshavbaug to Andhjan Mansi to Keshavbaug Keshavbaug to Andhjan Mansi to Keshavbaug Keshavbaug to Andhjan Mansi to Keshavbaug Keshavbaug to Andhjan Mansi to Keshavbaug Keshavbaug to Andhjan Mansi to Keshavbaug Keshavbaug to Andhjan Mansi to Keshavbaug Keshavbaug to Andhjan Mansi to Keshavbaug Keshavbaug to Andhjan Mansi to Keshavbaug Keshavbaug to Andhjan Mansi to Keshavbaug Keshavbaug to Andhjan Mansi to Keshavbaug Keshavbaug to Andhjan
163 Appendix 20 Route 6: Travel Time and Speed Study (Post-Implementation Stage) Date: 30th December, 2014 Section Average Avg. Travel Distance Speed Trip Avg. Travel Time (m) (km/hr) Speed Speed Time (min) (km/hr) (km/hr) (min) Mansi to Keshavbaug Keshavbaug to Andhjan Mansi to Keshavbaug Keshavbaug to Andhjan Mansi to Keshavbaug Keshavbaug to Andhjan Mansi to Keshavbaug Keshavbaug to Andhjan Mansi to Keshavbaug Keshavbaug to Andhjan Mansi to Keshavbaug Keshavbaug to Andhjan Mansi to Keshavbaug Keshavbaug to Andhjan Mansi to Keshavbaug Keshavbaug to Andhjan Mansi to Keshavbaug Keshavbaug to Andhjan Evening Mansi to Keshavbaug Keshavbaug to Andhjan Mansi to Keshavbaug Keshavbaug to Andhjan Mansi to Keshavbaug Keshavbaug to Andhjan Mansi to Keshavbaug Keshavbaug to Andhjan Mansi to Keshavbaug Keshavbaug to Andhjan Mansi to Keshavbaug
164 Appendix 20 Route 6: Travel Time and Speed Study (Post-Implementation Stage) Date: 30th December, 2014 Average Avg. Travel Distance Speed Trip Avg. Travel Section Time (m) (km/hr) Speed Speed Time (min) (km/hr) (km/hr) (min) Keshavbaug to Andhjan Mansi to Keshavbaug Keshavbaug to Andhjan Mansi to Keshavbaug Keshavbaug to Andhjan Mansi to Keshavbaug Keshavbaug to Andhjan Mansi to Keshavbaug Keshavbaug to Andhjan Mansi to Keshavbaug Keshavbaug to Andhjan Mansi to Keshavbaug Keshavbaug to Andhjan Mansi to Keshavbaug Keshavbaug to Andhjan Mansi to Keshavbaug Keshavbaug to Andhjan Mansi to Keshavbaug Keshavbaug to Andhjan Mansi to Keshavbaug Keshavbaug to Andhjan
165 Appendix 20 Morning Route 7: Travel Time and Speed Study (Post-Implementation Stage) Date: 30th December, 2014 Average Avg. Travel Distance Speed Trip Avg. Travel Section Time (m) (km/hr) Speed Speed Time (min) (km/hr) (km/hr) (min) EIB 4 to Mansi Mansi to Vastrapur Vastrapur to Iim Afternoon EIB 4 to Mansi Mansi to Vastrapur Vastrapur to Iim EIB 4 to Mansi Mansi to Vastrapur Vastrapur to Iim EIB 4 to Mansi Mansi to Vastrapur Vastrapur to Iim EIB 4 to Mansi Mansi to Vastrapur Vastrapur to Iim EIB 4 to Mansi Mansi to Vastrapur Vastrapur to Iim EIB 4 to Mansi Mansi to Vastrapur Vastrapur to Iim EIB 4 to Mansi Mansi to Vastrapur Vastrapur to Iim EIB 4 to Mansi Mansi to Vastrapur Vastrapur to Iim EIB 4 to Mansi Mansi to Vastrapur Vastrapur to Iim EIB 4 to Mansi Mansi to Vastrapur Vastrapur to Iim
166 Appendix 20 Route 7: Travel Time and Speed Study (Post-Implementation Stage) Date: 30th December, 2014 Average Avg. Travel Distance Speed Trip Avg. Travel Section Time (m) (km/hr) Speed Speed Time (min) (km/hr) (km/hr) (min) EIB 4 to Mansi Mansi to Vastrapur Vastrapur to Iim EIB 4 to Mansi Mansi to Vastrapur Vastrapur to Iim EIB 4 to Mansi Mansi to Vastrapur Vastrapur to Iim EIB 4 to Mansi Mansi to Vastrapur Vastrapur to Iim EIB 4 to Mansi Mansi to Vastrapur Vastrapur to Iim EIB 4 to Mansi Mansi to Vastrapur Vastrapur to Iim Evening EIB 4 to Mansi Mansi to Vastrapur Vastrapur to Iim EIB 4 to Mansi Mansi to Vastrapur Vastrapur to Iim EIB 4 to Mansi Mansi to Vastrapur Vastrapur to Iim EIB 4 to Mansi Mansi to Vastrapur Vastrapur to Iim EIB 4 to Mansi Mansi to Vastrapur Vastrapur to Iim
167 Appendix 20 Route 7: Travel Time and Speed Study (Post-Implementation Stage) Date: 30th December, 2014 Average Avg. Travel Distance Speed Trip Avg. Travel Section Time (m) (km/hr) Speed Speed Time (min) (km/hr) (km/hr) (min) EIB 4 to Mansi Mansi to Vastrapur Vastrapur to Iim EIB 4 to Mansi Mansi to Vastrapur Vastrapur to Iim EIB 4 to Mansi Mansi to Vastrapur Vastrapur to Iim EIB 4 to Mansi Mansi to Vastrapur Vastrapur to Iim
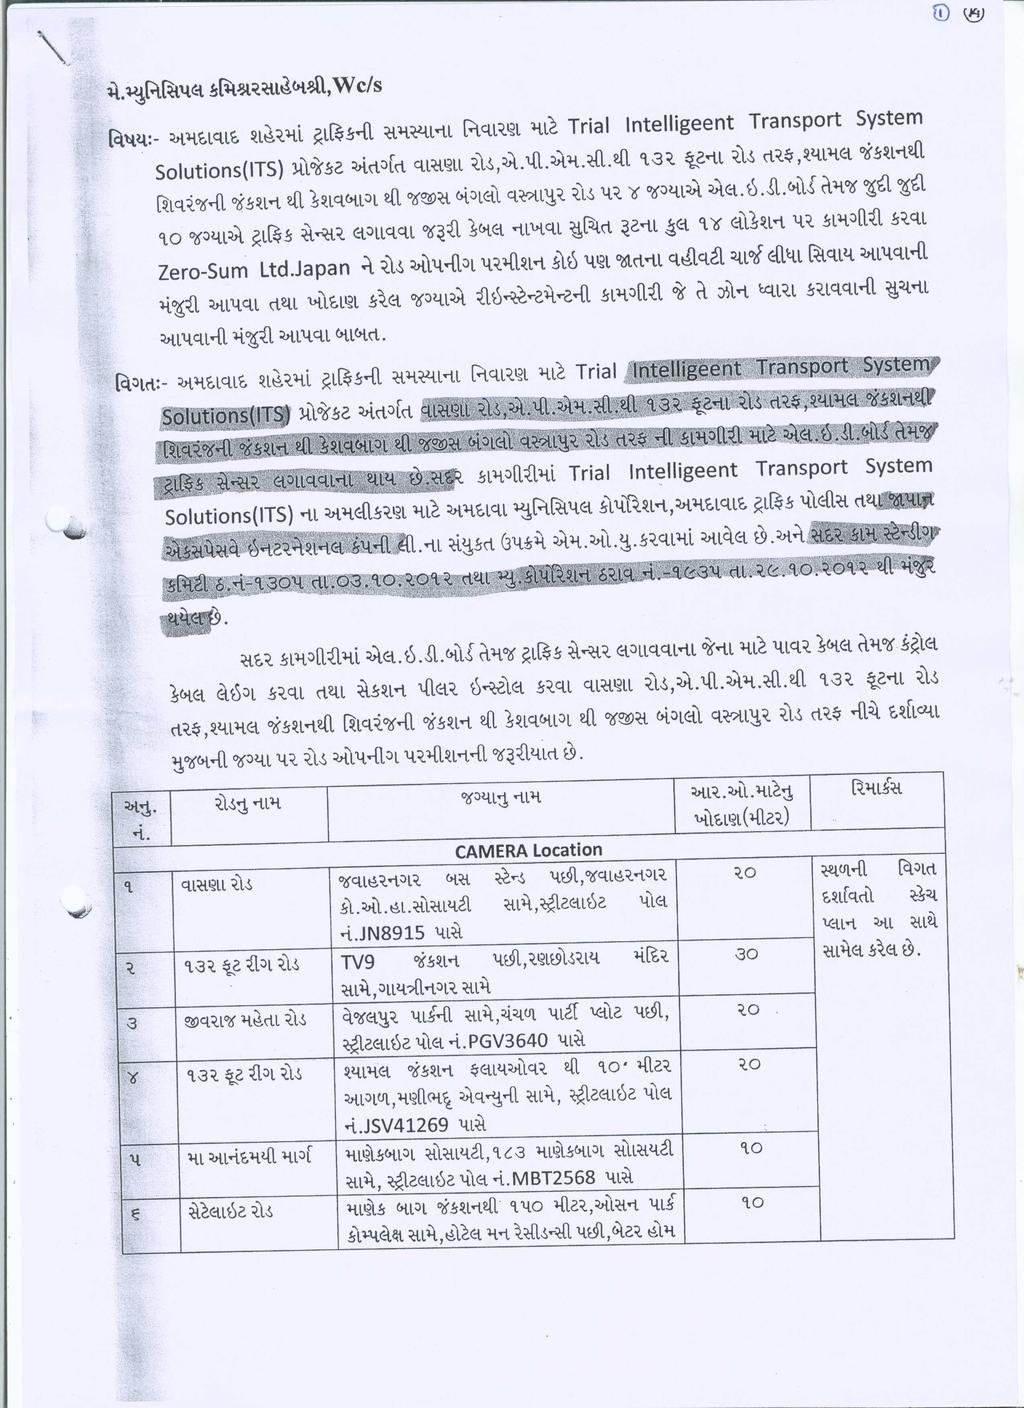
168
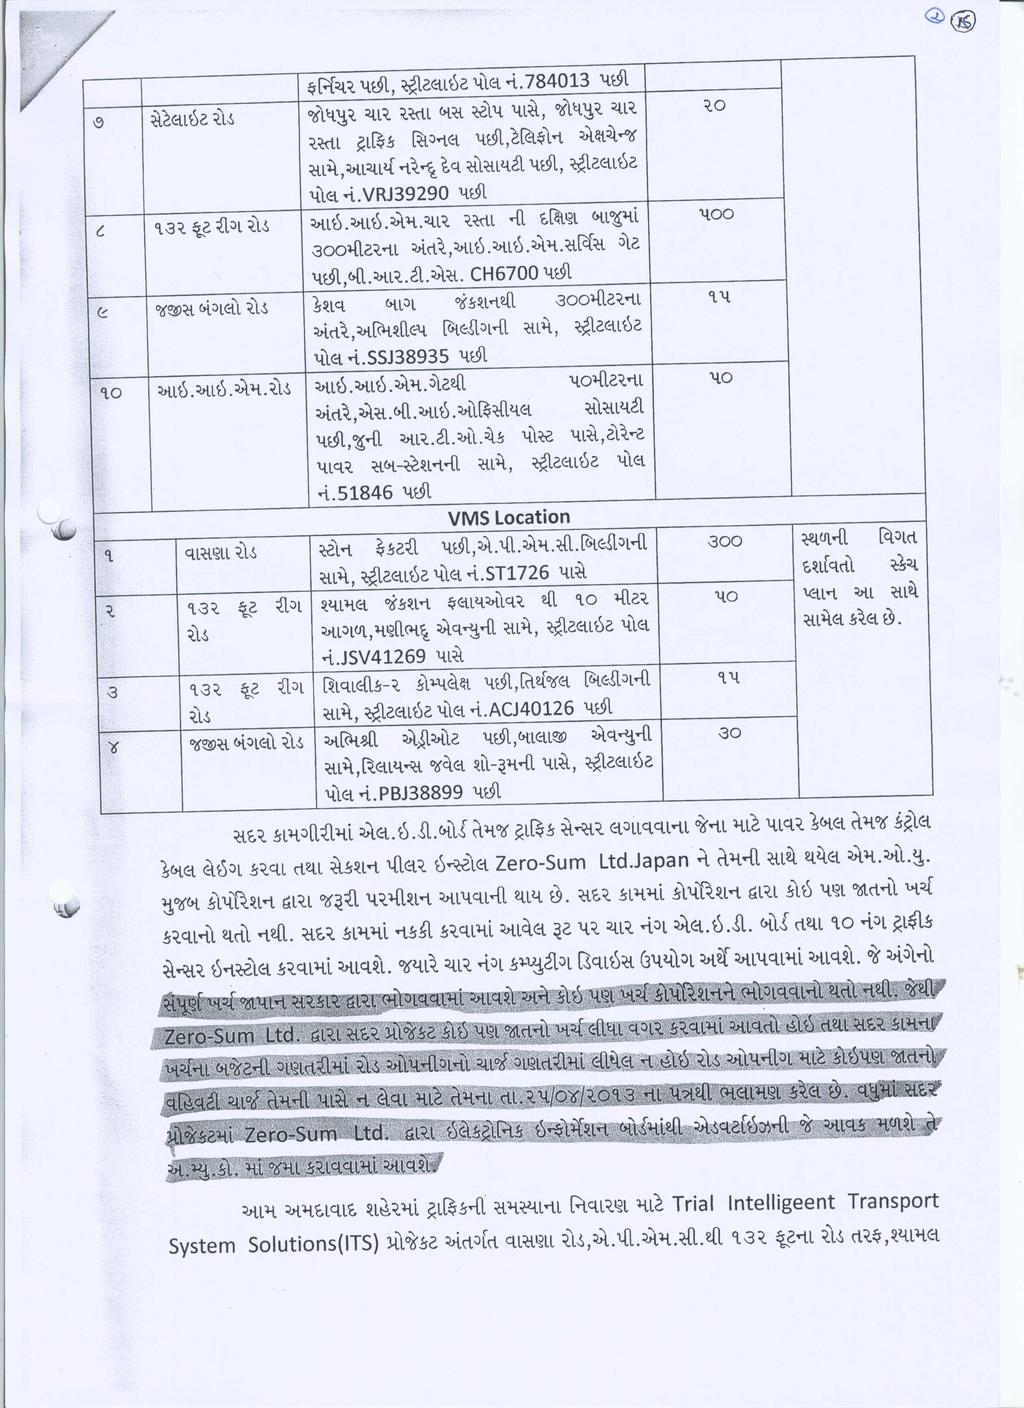
169
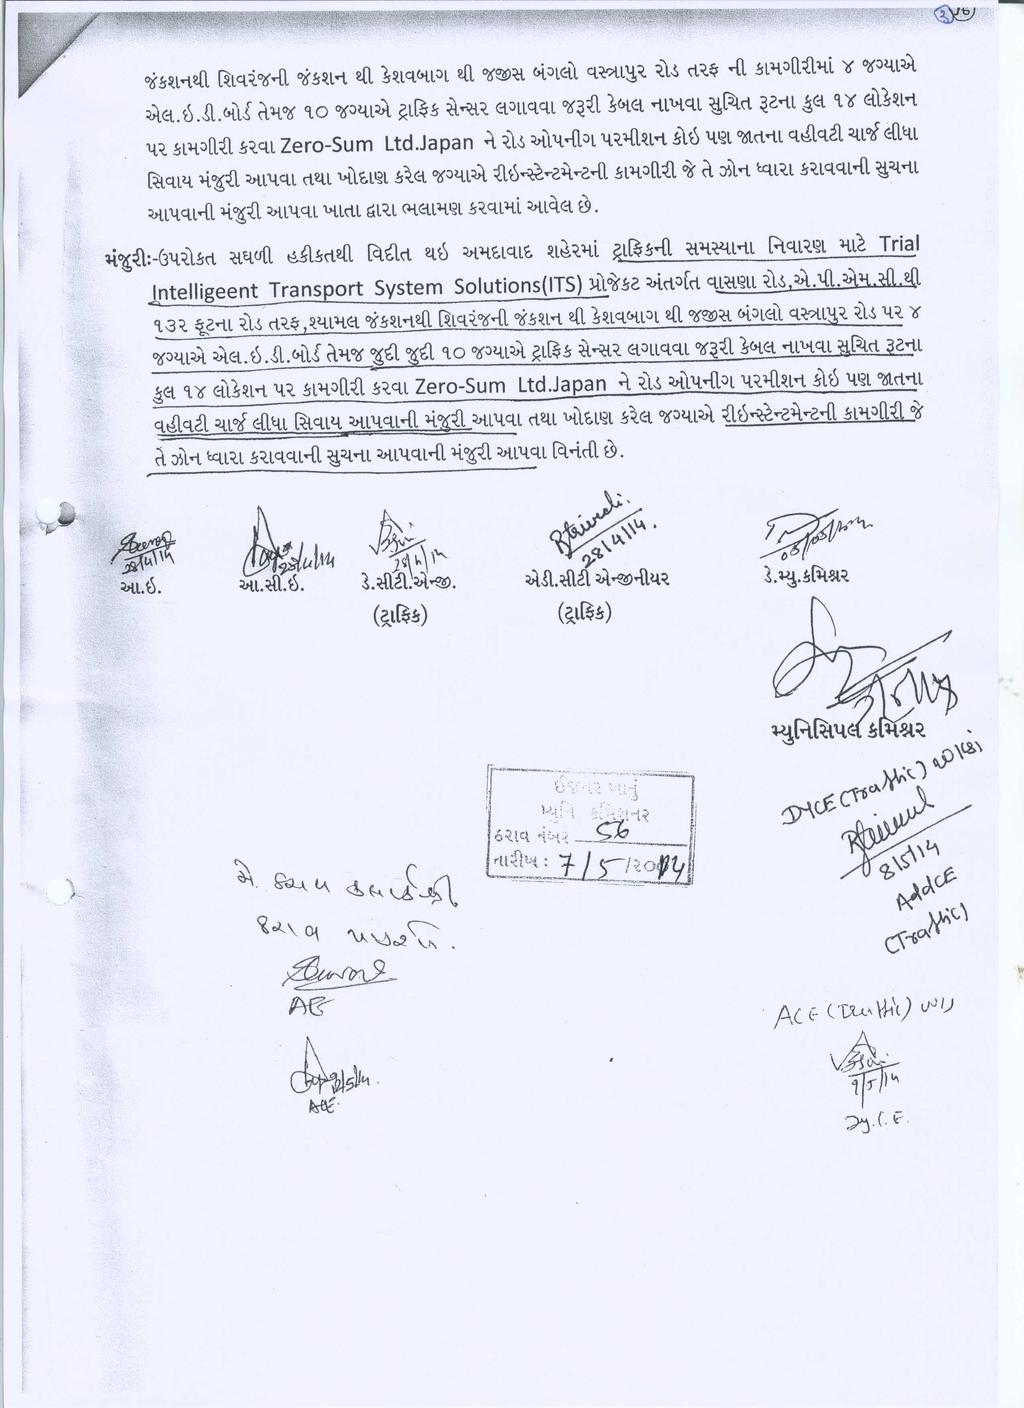
170
171
172
173
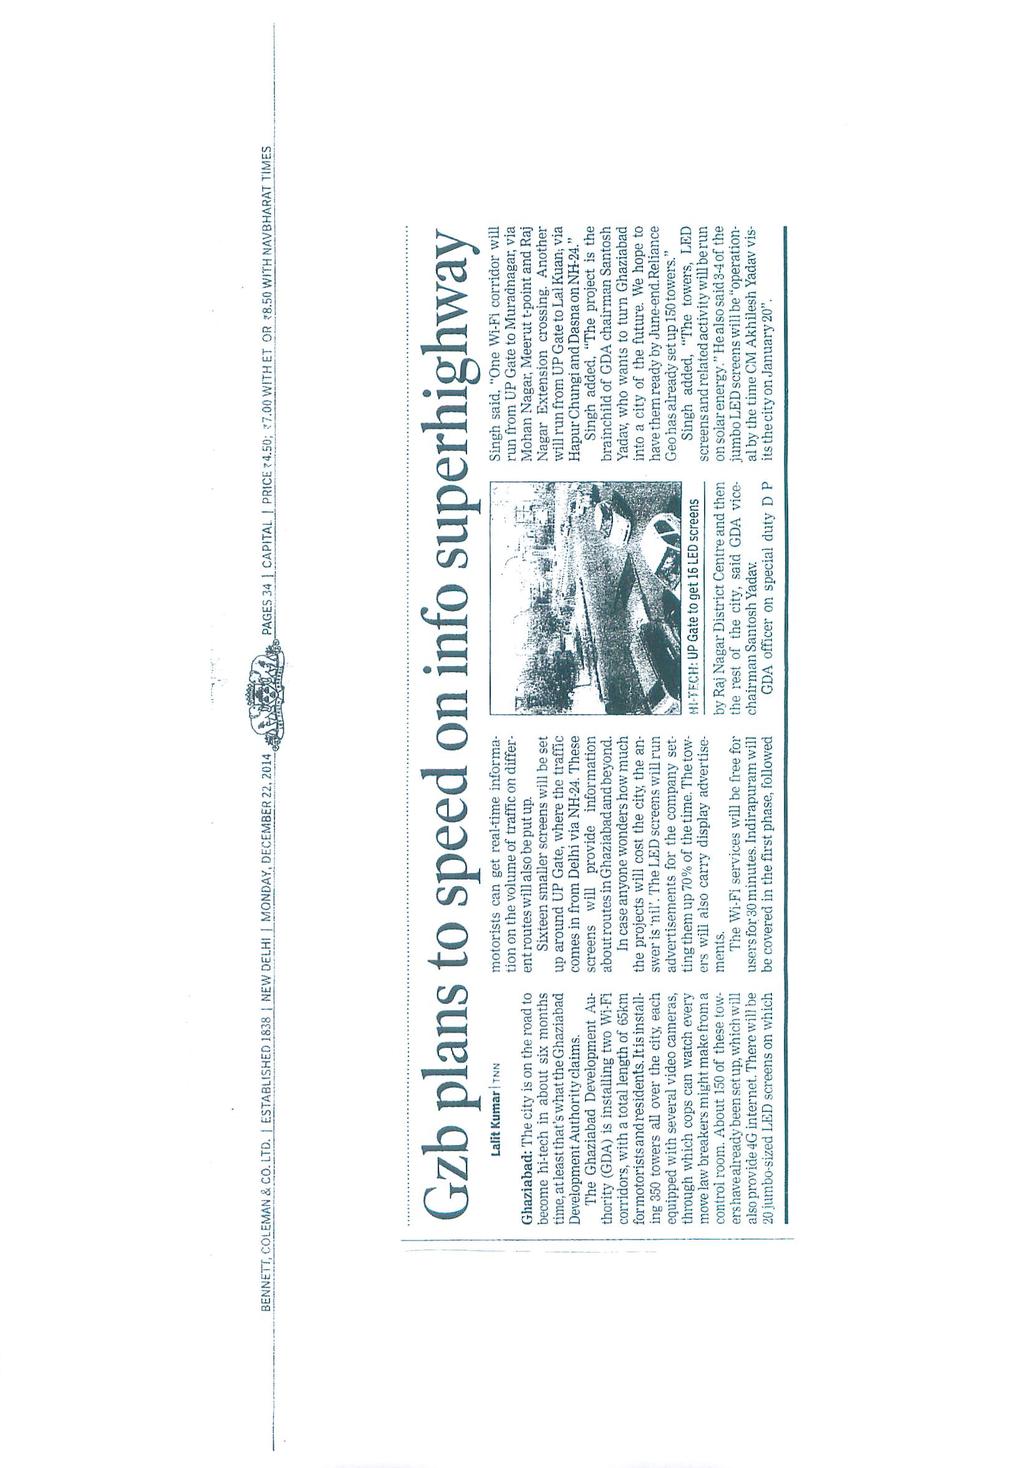
174
Project Deliverable 4.1.3d Individual City Report - City of La Verne
 Pomona Valley ITS Project Project Deliverable 4.1.3d Individual City Report - City of La Verne Prepared by: April 19, 2002 099017000.1 Copyright 2002, Kimley-Horn and Associates, Inc TABLE OF CONTENTS
PREFACE. Service frequency; Hours of service; Service coverage; Passenger loading; Reliability, and Transit vs. auto travel time.
 PREFACE The Florida Department of Transportation (FDOT) has embarked upon a statewide evaluation of transit system performance. The outcome of this evaluation is a benchmark of transit performance that
Monitoring and data acquisition for the safety related traffic information services
 Monitoring and data acquisition for the safety related traffic information services Best Practices on Monitoring Deployment Workshop 12 th September 2013 - Helsinki Contents 1. Transport Scotland and Traffic
This report was prepared by the Lake Zurich Police Department Traffic Safety Division. Intersection location and RLR camera approaches identified:
 POLICE DEPARTMENT 200 Mohawk Trail Lake Zurich, Illinois 60047 (847) 719-1690 LakeZurich.org April 1, 2018 This report is being submitted regarding the red-light cameras. According to the Red Light Running
Appendix B Ultimate Airport Capacity and Delay Simulation Modeling Analysis
 Appendix B ULTIMATE AIRPORT CAPACITY & DELAY SIMULATION MODELING ANALYSIS B TABLE OF CONTENTS EXHIBITS TABLES B.1 Introduction... 1 B.2 Simulation Modeling Assumption and Methodology... 4 B.2.1 Runway
THRESHOLD GUIDELINES FOR AVALANCHE SAFETY MEASURES
 BRITISH COLUMBIA MINISTRY OF TRANSPORTATION & INFRASTRUCTURE AVALANCHE & WEATHER PROGRAMS THRESHOLD GUIDELINES FOR AVALANCHE SAFETY MEASURES British Columbia Ministry of Transportation & Infrastructure
TWENTY-SECOND MEETING OF THE ASIA/PACIFIC AIR NAVIGATION PLANNING AND IMPLEMENTATION REGIONAL GROUP (APANPIRG/22)
") INTERNATIONAL CIVIL AVIATION ORGANIZATION TWENTY-SECOND MEETING OF THE ASIA/PACIFIC AIR NAVIGATION PLANNING AND IMPLEMENTATION REGIONAL GROUP (APANPIRG/22) Bangkok, Thailand, 5-9 September 2011 Agenda
INTERNATIONAL CIVIL AVIATION ORGANIZATION TWENTY-SECOND MEETING OF THE ASIA/PACIFIC AIR NAVIGATION PLANNING AND IMPLEMENTATION REGIONAL GROUP (APANPIRG/22) Bangkok, Thailand, 5-9 September 2011 Agenda
Word Count: 3,565 Number of Tables: 4 Number of Figures: 6 Number of Photographs: 0. Word Limit: 7,500 Tables/Figures Word Count = 2,250
 Katherine F. Turnbull, Ken Buckeye, Nick Thompson 1 Corresponding Author Katherine F. Turnbull Executive Associate Director Texas Transportation Institute Texas A&M University System 3135 TAMU College
(Also known as the Den-Ice Agreements Program) Evaluation & Advisory Services. Transport Canada
 Evaluation & Advisory Services. Transport Canada") Evaluation of Transport Canada s Program of Payments to Other Government or International Agencies for the Operation and Maintenance of Airports, Air Navigation, and Airways Facilities (Also known as the
Evaluation of Transport Canada s Program of Payments to Other Government or International Agencies for the Operation and Maintenance of Airports, Air Navigation, and Airways Facilities (Also known as the
2009 Muskoka Airport Economic Impact Study
 2009 Muskoka Airport Economic Impact Study November 4, 2009 Prepared by The District of Muskoka Planning and Economic Development Department BACKGROUND The Muskoka Airport is situated at the north end
Memorandum. Roger Millar, Secretary of Transportation. Date: April 5, Interstate 90 Operations and Mercer Island Mobility
 Memorandum To: From: The Honorable Dow Constantine, King County Executive; The Honorable Ed Murray, City of Seattle Mayor; The Honorable Bruce Bassett, City of Mercer Island Mayor; The Honorable John Stokes,
London Borough of Barnet Traffic & Development Design Team
 London Borough of Barnet Traffic & Development Design Team AERODROME ROAD PEDESTRIAN FACILITY AND BUS STOP INTRODUCTION FEASIBILITY REPORT Job Number: 60668 Doc Ref: S106/12-13/60668 Author: Manoj Kalair
TMC Monthly Operational Summary
 TMC Monthly Operational Summary December Bureau of Transportation Systems Management & Operations (TSMO) NH Department of Transportation s Mission Transportation excellence enhancing the quality of life
Integration of Pedestrian Traffic Signal Control within SCOOT-UTC Systems
 Traffic Advisory Leaflet 2/09 April 2009 Integration of Pedestrian Traffic Signal Control within SCOOT-UTC Systems Introduction SCOOT 1,2,3 (Split Cycle and Offset Optimisation Technique) is an adaptive
Agenda: SASP SAC Meeting 3
 Agenda: SASP SAC Meeting 3 Date: 04/12/18 Public Involvement Plan Update Defining the System Recommended Classifications Discussion Break Review current system Outreach what we heard Proposed changes Classification
Arlington County Board Meeting Project Briefing. October 20, 2015
 Arlington County Board Meeting Project Briefing October 20, 2015 Project Map 2 Project Context Only Interstate in the Country limited to HOV only traffic during rush hours Stoplight at the end of I-66
FNORTHWEST ARKANSAS WESTERN BELTWAY FEASIBILITY STUDY
 FNORTHWEST ARKANSAS WESTERN BELTWAY FEASIBILITY STUDY EXECUTIVE SUMMARY The 2030 Northwest Arkansas Regional Transportation Plan developed by the Northwest Arkansas Regional Planning Commission (NWARPC)
THIRTEENTH AIR NAVIGATION CONFERENCE
 International Civil Aviation Organization AN-Conf/13-WP/22 14/6/18 WORKING PAPER THIRTEENTH AIR NAVIGATION CONFERENCE Agenda Item 1: Air navigation global strategy 1.4: Air navigation business cases Montréal,
Central Coast Origin-Destination Survey
 Central Coast Origin-Destination Survey July 2016 Central Coast Origin-Destination Survey Prepared for: Santa Barbara County Association of Governments San Luis Obispo Council of Governments Ventura County
An Analysis of Dynamic Actions on the Big Long River
 Control # 17126 Page 1 of 19 An Analysis of Dynamic Actions on the Big Long River MCM Team Control # 17126 February 13, 2012 Control # 17126 Page 2 of 19 Contents 1. Introduction... 3 1.1 Problem Background...
Transfer Scheduling and Control to Reduce Passenger Waiting Time
 Transfer Scheduling and Control to Reduce Passenger Waiting Time Theo H. J. Muller and Peter G. Furth Transfers cost effort and take time. They reduce the attractiveness and the competitiveness of public
TORONTO TRANSIT COMMISSION REPORT NO. SUBJECT: TORONTO-YORK SPADINA SUBWAY EXTENSION STATION NAMES IN THE CITY OF VAUGHAN
 TORONTO TRANSIT COMMISSION REPORT NO. MEETING DATE: February 29, 2011 SUBJECT: TORONTO-YORK SPADINA SUBWAY EXTENSION STATION NAMES IN THE CITY OF VAUGHAN ACTION ITEM RECOMMENDATIONS It is recommended that
 Executive Summary This document contains the Master Plan for T. F. Green Airport. The goal of a master plan is to provide a framework of potential future airport development in a financially feasible manner,
Research Report Agreement T4118, Task 24 HOV Action Plan HOV ACTION PLAN
 Research Report Agreement T4118, Task 24 HOV Action Plan HOV ACTION PLAN by John M. Ishimaru Senior Research Engineer Duane Wright Systems Analyst Programmer Mark E. Hallenbeck Director Jaime Kang Research
NEMSPA Opportunity to Improve
 Opportunity to Improve correlated with Recommendations for HEMS Safety Introduction In February of this year, the (National Transportation Safety Board) met with representatives of professional associations
PRAJWAL KHADGI Department of Industrial and Systems Engineering Northern Illinois University DeKalb, Illinois, USA
 SIMULATION ANALYSIS OF PASSENGER CHECK IN AND BAGGAGE SCREENING AREA AT CHICAGO-ROCKFORD INTERNATIONAL AIRPORT PRAJWAL KHADGI Department of Industrial and Systems Engineering Northern Illinois University
CASCADE OPERATIONAL FOCUS GROUP (OFG)
") CASCADE OPERATIONAL FOCUS GROUP (OFG) Use of ADS-B for Enhanced Traffic Situational Awareness by Flight Crew During Flight Operations Airborne Surveillance (ATSA-AIRB) 1. INTRODUCTION TO ATSA-AIRB In today
CASCADE OPERATIONAL FOCUS GROUP (OFG) Use of ADS-B for Enhanced Traffic Situational Awareness by Flight Crew During Flight Operations Airborne Surveillance (ATSA-AIRB) 1. INTRODUCTION TO ATSA-AIRB In today
PASSENGER SHIP SAFETY. Damage stability of cruise passenger ships. Submitted by the Cruise Lines International Association (CLIA) SUMMARY
 SUMMARY") E MARITIME SAFETY COMMITTEE 93rd session Agenda item 6 MSC 93/6/6 11 March 2014 Original: ENGLISH PASSENGER SHIP SAFETY Damage stability of cruise passenger ships Submitted by the Cruise Lines International
E MARITIME SAFETY COMMITTEE 93rd session Agenda item 6 MSC 93/6/6 11 March 2014 Original: ENGLISH PASSENGER SHIP SAFETY Damage stability of cruise passenger ships Submitted by the Cruise Lines International
Optimizing trajectories over the 4DWeatherCube
 Optimizing trajectories over the 4DWeatherCube Detailed Proposal - SES Awards 2016 Airbus Defence and Space : dirk.schindler@airbus.com Luciad : robin.houtmeyers@luciad.com Eumetnet : kamel.rebai@meteo.fr
Cockpit Display of Traffic Information (CDTI) Assisted Visual Separation (CAVS)
 Assisted Visual Separation (CAVS)") Cockpit Display of Traffic Information (CDTI) Assisted Visual Separation (CAVS) Randall Bone 6 th USA / Europe ATM 2005 R&D Seminar Baltimore, Maryland June 2005 Overview Background Automatic Dependent
Cockpit Display of Traffic Information (CDTI) Assisted Visual Separation (CAVS) Randall Bone 6 th USA / Europe ATM 2005 R&D Seminar Baltimore, Maryland June 2005 Overview Background Automatic Dependent
According to FAA Advisory Circular 150/5060-5, Airport Capacity and Delay, the elements that affect airfield capacity include:
 4.1 INTRODUCTION The previous chapters have described the existing facilities and provided planning guidelines as well as a forecast of demand for aviation activity at North Perry Airport. The demand/capacity
Report on the Crafthole Traffic Light Project 3 rd July th September 2017
 Report on the Crafthole Traffic Light Project 3 rd July 2017 4 th September 2017 Brief History The village of Crafthole sits on the B3247 road, one of the 2 Gateways to the Rame Peninsula, the other being
District 3 ITS Project Update
 District 3 ITS Project Update Chad Williams, P.E. District 3 ITS Engineer Key ITS Projects in District 3 Bay County Advanced Traffic Management System (ATMS) Okaloosa County Computerized Traffic Control
McLean Citizens Association Transportation Committee Project Briefing
 McLean Citizens Association Transportation Committee Project Briefing November 10, 2015 Project Map 2 Project Context Only Interstate in the Country limited to HOV only traffic during rush hours Stoplight
March 4, Mr. H. Dale Hemmerdinger Chairman Metropolitan Transportation Authority 347 Madison Avenue New York, NY Re: Report 2007-F-31
 THOMAS P. DiNAPOLI STATE COMPTROLLER 110 STATE STREET ALBANY, NEW YORK 12236 STATE OF NEW YORK OFFICE OF THE STATE COMPTROLLER March 4, 2008 Mr. H. Dale Hemmerdinger Chairman Metropolitan Transportation
ARRIVAL CHARACTERISTICS OF PASSENGERS INTENDING TO USE PUBLIC TRANSPORT
 ARRIVAL CHARACTERISTICS OF PASSENGERS INTENDING TO USE PUBLIC TRANSPORT Tiffany Lester, Darren Walton Opus International Consultants, Central Laboratories, Lower Hutt, New Zealand ABSTRACT A public transport
Annex III to ED Decision 2017/023/R. AMC and GM to Part-CAT Issue 2, Amendment 13
 Annex III to ED Decision 2017/023/R AMC and GM to Part-CAT Issue 2, Amendment 13 The Annex to Decision 2014/015/R is amended as follows: The text of the amendment is arranged to show deleted text, new
Smart Motorways Programme
 Smart Motorways Programme M27 Junction 4 to 11 Smart Motorway Response to Statutory Instrument Consultation The introduction of variable mandatory speed limits July 2018 Contents Executive Summary 3 1.
Interstate 90 and Mercer Island Mobility Study APRIL Commissioned by. Prepared by
 Interstate 90 and Mercer Island Mobility Study APRIL 2017 Commissioned by Prepared by Interstate 90 and Mercer Island Mobility Study Commissioned by: Sound Transit Prepared by: April 2017 Contents Section
HOW TO IMPROVE HIGH-FREQUENCY BUS SERVICE RELIABILITY THROUGH SCHEDULING
 HOW TO IMPROVE HIGH-FREQUENCY BUS SERVICE RELIABILITY THROUGH SCHEDULING Ms. Grace Fattouche Abstract This paper outlines a scheduling process for improving high-frequency bus service reliability based
USE OF 3D GIS IN ANALYSIS OF AIRSPACE OBSTRUCTIONS
 USE OF 3D GIS IN ANALYSIS OF AIRSPACE OBSTRUCTIONS A project by by Samuka D. W. F19/1461/2010 Supervisor; Dr D. N. Siriba 1 Background and Problem Statement The Airports in Kenya are the main link between
The Transforming Airport
 DAY 2 FOUR PATHWAYS The Transforming Airport Distributed Airport Infrastructure Airport infrastructure; Creating greater choice and convenience for passengers is driving the trend for off-airport facilities.
Analysis of Mode Switching Behavior of PUP Main Campus Students to Pasig River Ferry Service
 Analysis of Mode Switching Behavior of PUP Main Campus Students to Pasig River Ferry Service Vilma CLEMENTE John Ivan GUEVARRA Ryan Maynard MAZO Department of Civil Engineering Polytechnic University of
CENTRAL OREGON REGIONAL TRANSIT MASTER PLAN
 Central Oregon Regional Transit Master Plan Volume II: Surveys and Market Research CENTRAL OREGON REGIONAL TRANSIT MASTER PLAN Volume IV: Service Plan Appendices A-B July 213 Nelson\Nygaard Consulting
CHAPTER 5 SIMULATION MODEL TO DETERMINE FREQUENCY OF A SINGLE BUS ROUTE WITH SINGLE AND MULTIPLE HEADWAYS
 91 CHAPTER 5 SIMULATION MODEL TO DETERMINE FREQUENCY OF A SINGLE BUS ROUTE WITH SINGLE AND MULTIPLE HEADWAYS 5.1 INTRODUCTION In chapter 4, from the evaluation of routes and the sensitive analysis, it
OVERVIEW OF THE FAA ADS-B LINK DECISION
 June 7, 2002 OVERVIEW OF THE FAA ADS-B LINK DECISION Summary This paper presents an overview of the FAA decision on the ADS-B link architecture for use in the National Airspace System and discusses the
MRO 2017 Stakeholder Survey
 MRO 2017 Stakeholder Survey Summary Results Conducted in October 2017 MIDWEST RELIABILITY ORGANIZATION 380 St. Peter Street, Ste.800 St. Paul, MN 55102 P: 651.855.1760 F: 651.855.1712 www.midwestreliability.org
AN-Conf/12-WP/162 TWELFTH THE CONFERENCE. The attached report
 29/11/12 TWELFTH AIR NAVIGATION CONFERENCE Montréal, 19 to 30 November 2012 REPORT OF THE COMMITTEE TO THE CONFERENCE ON AGENDA ITEM 2 The attached report has been approved by thee Committee for submission
2006 WEEKDAY TRAFFIC PROFILE. June 15, 2007
 June 15, 2007 Mr. Gary Stobb, P.E. Director of Planning/Operations Harris County Toll Road Authority 330 Meadowfern, Suite 200 Houston, TX 77067 Re: Westpark Tollway Value Pricing Analysis Dear Mr. Stobb:
Real-time route planning streamlines onboard operations, reduces fuel burn and delays, and improves on-time performance.
 Real-time route planning streamlines onboard operations, reduces fuel burn and delays, and improves on-time performance. Operational Efficiency of Dynamic Navigation Charting Benefits such as improved
Analyzing Risk at the FAA Flight Systems Laboratory
 Analyzing Risk at the FAA Flight Systems Laboratory Presented to: Workshop By: Dr. Richard Greenhaw, FAA AFS-440 Date: 29 November, 2005 Flight Systems Laboratory Who we are How we analyze risk Airbus
Surveillance and Broadcast Services
 Surveillance and Broadcast Services Benefits Analysis Overview August 2007 Final Investment Decision Baseline January 3, 2012 Program Status: Investment Decisions September 9, 2005 initial investment decision:
JOSLIN FIELD, MAGIC VALLEY REGIONAL AIRPORT DECEMBER 2012
 1. Introduction The Federal Aviation Administration (FAA) recommends that airport master plans be updated every 5 years or as necessary to keep them current. The Master Plan for Joslin Field, Magic Valley
Passenger movement simulation in intermodal air-rail terminal
 Passenger movement simulation in intermodal air-rail terminal Antonia COKASOVA, EUROCONTROL Experimental Centre, Brétigny, France and University of Zilina, Slovakia There are numerous advantages in transferring
Chapter 1 EXECUTIVE SUMMARY
 Chapter 1 EXECUTIVE SUMMARY Contents Page Aviation Growth Scenarios................................................ 3 Airport Capacity Alternatives.............................................. 4 Air Traffic
SAMTRANS TITLE VI STANDARDS AND POLICIES
 SAMTRANS TITLE VI STANDARDS AND POLICIES Adopted March 13, 2013 Federal Title VI requirements of the Civil Rights Act of 1964 were recently updated by the Federal Transit Administration (FTA) and now require
SMS HAZARD ANALYSIS AT A UNIVERSITY FLIGHT SCHOOL
 SMS HAZARD ANALYSIS AT A UNIVERSITY FLIGHT SCHOOL Don Crews Middle Tennessee State University Murfreesboro, Tennessee Wendy Beckman Middle Tennessee State University Murfreesboro, Tennessee For the last
Measuring Productivity for Car Booking Solutions
 Measuring Productivity for Car Booking Solutions Value Creation Study Rebecca Bartlett 20th January 2014 Table of Contents Executive Summary Introduction Method Productivity Analysis Scenario 1 Scenario
Flight Arrival Simulation
 Flight Arrival Simulation Ali Reza Afshari Buein Zahra Technical University, Department of Industrial Engineering, Iran, afshari@bzte.ac.ir Mohammad Anisseh Imam Khomeini International University, Department
Congestion. Addressing urban congestion in SEQ. How do you define congestion? South East Queensland is growing. Sustained growth in motorised travel
 How do you define congestion? Addressing urban congestion in SEQ Engineer: traffic volume exceeds road capacity Russell Murray Director Urban Congestion Task Force Department of Transport and Main Roads
Front Line Managers (FLMs) and Airline Pilots Training for Operational Evaluation! of enhanced Final Approach Runway Occupancy Signal (efaros) at DFW!
 and Airline Pilots Training for Operational Evaluation! of enhanced Final Approach Runway Occupancy Signal (efaros) at DFW!") ! Front Line Managers (FLMs) and Airline Pilots Training for Operational Evaluation! of enhanced Final Approach Runway Occupancy Signal (efaros) at DFW! Maria Picardi Kuffner! September 2008, updated July
! Front Line Managers (FLMs) and Airline Pilots Training for Operational Evaluation! of enhanced Final Approach Runway Occupancy Signal (efaros) at DFW! Maria Picardi Kuffner! September 2008, updated July
CAMPER CHARACTERISTICS DIFFER AT PUBLIC AND COMMERCIAL CAMPGROUNDS IN NEW ENGLAND
 CAMPER CHARACTERISTICS DIFFER AT PUBLIC AND COMMERCIAL CAMPGROUNDS IN NEW ENGLAND Ahact. Early findings from a 5-year panel survey of New England campers' changing leisure habits are reported. A significant
Identifying and Utilizing Precursors
 Flight Safety Foundation European Aviation Safety Seminar Lisbon March 15-17 / 2010 Presented by Michel TREMAUD ( retired, Airbus / Aerotour / Air Martinique, Bureau Veritas ) Identifying and Utilizing
Methodology and coverage of the survey. Background
 Methodology and coverage of the survey Background The International Passenger Survey (IPS) is a large multi-purpose survey that collects information from passengers as they enter or leave the United Kingdom.
NCUTCD Proposal for Changes to the Manual on Uniform Traffic Control Devices
 1 2 3 4 5 6 7 8 9 10 11 12 13 14 15 16 17 18 19 20 21 22 23 24 25 26 27 28 29 30 31 32 TECHNICAL COMMITTEE: ITEM NUMBER: TOPIC: ORIGIN OF REQUEST: AFFECTED SECTIONS OF MUTCD: NCUTCD Proposal for Changes
Advanced Transition Training
 Cirrus Aircraft Section 3 Syllabus Suite Advance Transition Advanced Transition Training The Advanced Transition Training course is designed to prepare a proficient instrument-rated pilot for an Instrument
Measure 67: Intermodality for people First page:
 Measure 67: Intermodality for people First page: Policy package: 5: Intermodal package Measure 69: Intermodality for people: the principle of subsidiarity notwithstanding, priority should be given in the
Computer Simulation for Evaluating Visitor Conflicts
 Computer Simulation for Evaluating Visitor Conflicts Why use Simulation? To acquire a comprehensive and dynamic understanding of visitor behavior and their interactions across the landscape (space and
20mph Speed Limit Zones
 Traffic Advisory Leaflet 7/91 May 1991 20mph Speed Limit Zones Summary This leaflet illustrates the main steps in the procedures for the implementation of 20mph zones. It provides brief details on: the
AIRPORTS AUTHORITY OF INDIA S AIRPORT COLLABORATIVE DECISION MAKING SYSTEM. (Presented by Airports Authority of India) SUMMARY
 SUMMARY") 12 th Meeting of Arabian Sea-Indian Ocean ATS Coordination Group ASIOACG/12) & 8 th Meeting of Indian Ocean Strategic Partnership to Reduce Emissions (INSPIRE/8) New Delhi, India, 20-21 September 2017
12 th Meeting of Arabian Sea-Indian Ocean ATS Coordination Group ASIOACG/12) & 8 th Meeting of Indian Ocean Strategic Partnership to Reduce Emissions (INSPIRE/8) New Delhi, India, 20-21 September 2017
The Challenge of Surface Conditions. AST: A New Solution to a Global Aviation Problem. Benefits and Business Value to Airports and Operators
 The Challenge of Surface Conditions AST: A New Solution to a Global Aviation Problem Benefits and Business Value to Airports and Operators 2 3 Runway excursions are among the most-frequently reported accidents
ACAS on VLJs and LJs Assessment of safety Level (AVAL) Outcomes of the AVAL study (presented by Thierry Arino, Egis Avia)
 Outcomes of the AVAL study (presented by Thierry Arino, Egis Avia)") ACAS on VLJs and LJs Assessment of safety Level (AVAL) Outcomes of the AVAL study (presented by Thierry Arino, Egis Avia) Slide 1 Presentation content Introduction Background on Airborne Collision Avoidance
ACAS on VLJs and LJs Assessment of safety Level (AVAL) Outcomes of the AVAL study (presented by Thierry Arino, Egis Avia) Slide 1 Presentation content Introduction Background on Airborne Collision Avoidance
AERONAUTICAL SURVEYS & INSTRUMENT FLIGHT PROCEDURES
 AERONAUTICAL SURVEYS & INSTRUMENT FLIGHT PROCEDURES Current as of November 2012 ALASKA AVIATION SYSTEM PLAN UPDATE Prepared for: State of Alaska Department of Transportation & Public Facilities Division
John Betts School Crossing Review
 John Betts School Crossing Review Paddenswick Road London Borough of Hammersmith & Fulham August 2015 DOCUMENT CONTROL Project Centre has prepared this report in accordance with the instructions from the
helicopter? Fixed wing 4p58 HINDSIGHT SITUATIONAL EXAMPLE
 HINDSIGHT SITUATIONAL EXAMPLE Fixed wing or helicopter? Editorial note: Situational examples are based on the experience of the authors and do not represent either a particular historical event or a full
2010 El Paso Work Place Travel Survey Technical Summary
 2010 El Paso Work Place Travel Survey Technical Summary Prepared by the Texas A&M Transportation Institute June 2013 2010 El Paso Work Place Travel Survey TECHNICAL SUMMARY Texas Department of Transportation
U.Md. Zahir, H. Matsui & M. Fujita Department of Civil Engineering Nagoya Institute of Technology,
 Investigate the effects of bus and passenger arrival patterns and service frequency on passenger waiting time and transit performance of Dhaka metropolitan area. U.Md. Zahir, H. Matsui & M. Fujita Department
1. Introduction. 2.2 Surface Movement Radar Data. 2.3 Determining Spot from Radar Data. 2. Data Sources and Processing. 2.1 SMAP and ODAP Data
 1. Introduction The Electronic Navigation Research Institute (ENRI) is analysing surface movements at Tokyo International (Haneda) airport to create a simulation model that will be used to explore ways
WORKING TOGETHER TO ENHANCE AIRPORT OPERATIONAL SAFETY. Ermenando Silva APEX, in Safety Manager ACI, World
 WORKING TOGETHER TO ENHANCE AIRPORT OPERATIONAL SAFETY Ermenando Silva APEX, in Safety Manager ACI, World Aerodrome Manual The aim and objectives of the aerodrome manual and how it is to be used by operating
CHAPTER 1: INTRODUCTION
 CHAPTER 1: INTRODUCTION Purpose and Scope The information presented in this report represents the study findings for the 2016 Ronan Airport Master Plan prepared for the City of Ronan and Lake County, the
Texas Transportation Institute The Texas A&M University System College Station, Texas
 1. Report No. FHWA/TX-05/0-4434-P1 2. Government Accession No. 3. Recipient's Catalog No. 4. Title and Subtitle GUIDANCE FOR FUTURE DESIGN OF FREEWAYS WITH HIGH- OCCUPANCY VEHICLE (HOV) LANES BASED ON
Reducing Garbage-In for Discrete Choice Model Estimation
 Reducing Garbage-In for Discrete Choice Model Estimation David Kurth* Cambridge Systematics, Inc. 999 18th Street, Suite 3000 Denver, CO 80202 P: 303-357-4661 F: 303-446-9111 dkurth@camsys.com Marty Milkovits
GOVERNMENT OF INDIA OFFICE OF DIRECTOR GENERAL OF CIVIL AVIATION
 GOVERNMENT OF INDIA OFFICE OF DIRECTOR GENERAL OF CIVIL AVIATION ANSS AC NO. 1 of 2017 31.07. 2017 Air Space and Air Navigation Services Standard ADVISORY CIRCULAR Subject: Procedures to follow in case
OFFERING THE UK A LIFELINE
 OFFERING THE UK A LIFELINE R oad markings are the most cost-effective safety device available to road engineers. Markings guide road users, provide advance warning of potential dangers ahead and create
RACOON PROJECT Daniele Teotino - ENAV. RACOON Project Manager Head of SESAR JU Activity Coordination
 RACOON PROJECT Daniele Teotino - ENAV RACOON Project Manager Head of SESAR JU Activity Coordination RACOON in a Nutshell SESAR JU Very Large Scale Demonstration First Italian initiative on Remote TWR solutions
Consideration will be given to other methods of compliance which may be presented to the Authority.
 Advisory Circular AC 139-10 Revision 1 Control of Obstacles 27 April 2007 General Civil Aviation Authority advisory circulars (AC) contain information about standards, practices and procedures that the
HOV LANE PERFORMANCE MONITORING: 2000 REPORT EXECUTIVE SUMMARY
 Final Report Research Project Agreement No. T1803, Task 4 HOV Monitoring V HOV LANE PERFORMANCE MONITORING: 2000 REPORT EXECUTIVE SUMMARY by Jennifer Nee TRAC Research Engineer John Ishimaru TRAC Senior
White Paper: Assessment of 1-to-Many matching in the airport departure process
 White Paper: Assessment of 1-to-Many matching in the airport departure process November 2015 rockwellcollins.com Background The airline industry is experiencing significant growth. With higher capacity
Section 106 Update Memo #1 Attachment D. Traffic Diversion & APE Expansion Methodology & Maps
 Section 106 Update Memo #1 Attachment D Traffic Diversion & APE Expansion Methodology & Maps I-65/I-70 North Split Interchange Reconstruction Project (Des. Nos. 1592385 & 1600808) Traffic Diversion and
MEMORANDUM. Lynn Hayes LSA Associates, Inc.
 MEMORANDUM To: Lynn Hayes LSA Associates, Inc. Date: May 5, 217 From: Zawwar Saiyed, P.E., Senior Transportation Engineer Justin Tucker, Transportation Engineer I Linscott, Law & Greenspan, Engineers LLG
Visitor Use Computer Simulation Modeling to Address Transportation Planning and User Capacity Management in Yosemite Valley, Yosemite National Park
 Visitor Use Computer Simulation Modeling to Address Transportation Planning and User Capacity Management in Yosemite Valley, Yosemite National Park Final Report Steve Lawson Brett Kiser Karen Hockett Nathan
M621. Junctions 1 to 7 Improvement scheme. Share your views
 M621 Junctions 1 to 7 Improvement scheme Share your views Investing in your roads Every road user wants less congested roads to enable swift, safe, comfortable and informed travel. On behalf of the government,
I R UNDERGRADUATE REPORT. National Aviation System Congestion Management. by Sahand Karimi Advisor: UG
 UNDERGRADUATE REPORT National Aviation System Congestion Management by Sahand Karimi Advisor: UG 2006-8 I R INSTITUTE FOR SYSTEMS RESEARCH ISR develops, applies and teaches advanced methodologies of design
Executive Summary. MASTER PLAN UPDATE Fort Collins-Loveland Municipal Airport
 Executive Summary MASTER PLAN UPDATE Fort Collins-Loveland Municipal Airport As a general aviation and commercial service airport, Fort Collins- Loveland Municipal Airport serves as an important niche
The Fourth ATS Coordination meeting of Bay of Bengal, Arabian Sea and Indian Ocean Region (BOBASIO/4) Kolkata, India, September, 2014.
 Kolkata, India, September, 2014.") The Fourth ATS Coordination meeting of Bay of Bengal, Arabian Sea and Indian Ocean Region (BOBASIO/4) Kolkata, India, 22-24 September, 2014. Agenda Item 4: Strategic ATM Plans of Participating States Upper
The Fourth ATS Coordination meeting of Bay of Bengal, Arabian Sea and Indian Ocean Region (BOBASIO/4) Kolkata, India, 22-24 September, 2014. Agenda Item 4: Strategic ATM Plans of Participating States Upper
The Benefits of Attendee Travel Management
 The Benefits of Attendee Travel Management Travel to and from a meeting or an event is very much part of each attendee s event experience. Meeting planners and attendees alike can benefit from inclusion
Australian Journal of Basic and Applied Sciences. Why to Introduce Flat Fare System in Janmarg, Ahmedabad, Gujarat A Case Study
 AENSI Journals Australian Journal of Basic and Applied Sciences ISSN:1991-8178 Journal home page: www.ajbasweb.com Why to Introduce Flat Fare System in Janmarg, Ahmedabad, Gujarat A Case Study 1 Jaynila
Revenue Management in a Volatile Marketplace. Tom Bacon Revenue Optimization. Lessons from the field. (with a thank you to Himanshu Jain, ICFI)
") Revenue Management in a Volatile Marketplace Lessons from the field Tom Bacon Revenue Optimization (with a thank you to Himanshu Jain, ICFI) Eyefortravel TDS Conference Singapore, May 2013 0 Outline Objectives
Revenue Management in a Volatile Marketplace Lessons from the field Tom Bacon Revenue Optimization (with a thank you to Himanshu Jain, ICFI) Eyefortravel TDS Conference Singapore, May 2013 0 Outline Objectives
Cooperative systems for road safety Smart Vehicles on Smart Roads. the SAFESPOT Integrated Project
 Cooperative systems for road safety Smart Vehicles on Smart Roads the SAFESPOT Integrated Project G. Vivo SAFESPOT IP Centro Ricerche FIAT Background on cooperative systems for a safe and efficient mobility...
2012 Performance Framework AFI
 2012 Performance Framework AFI Nairobi, 14-16 February 2011 Seboseso Machobane Regional Officer ATM, ESAF 1 Discussion Intro Objectives, Metrics & Outcomes ICAO Process Framework Summary 2 Global ATM Physical