The 2015 International Visitors Exit Survey Report
|
|
|
- Bonnie Wells
- 5 years ago
- Views:
Transcription


1 The 2015 International Visitors Exit Survey Report a
2 TANZANIA TOURISM SECTOR SURVEY THE 2015 INTERNATIONAL VISITORS EXIT SURVEY REPORT October 2017 i
3 TABLE OF CONTENTS LIST OF TABLES... iv LIST OF CHARTS... v ACRONYMS... vi FOREWORD... vii ACKNOWLEDGEMENT... viii EXECUTIVE SUMMARY... ix Chapter 1: Recent Developments in the Tourism Industry Global Perspective Tourism Developments in East Africa Tourism Development in Tanzania International Tourist Arrivals Promotion and Marketing Launching of Tourism Portal Zanzibar Promotion Centre in India Destination and Products Awareness Marketing Partnership New Accommodation Establishment Tourism Trade Fair and Exhibitions Establishment of Kilimanjaro Tourism and Trade Fair exhibition International Flights The Restoration Old Boma Satellite Elephant Monitoring in Ruaha National Park Chapter 2: Analysis of the Survey s Results Introduction Source Markets Age Group Purpose of Visit Travel Arrangement First-Time and Repeat Visits Source of Information Travel Party Departure Points ii
4 2.10 Average Length of Stay Night Spent Mode of Payment Mode of Payments by Activity Tourism Activities Average Expenditure Proportion of Expenditure by Products Tourism Earnings Visitors Perception about Tanzania Areas that Need Improvement Chapter 3: Conclusion and Policy Recommendations Conclusion Policy Recommendations Appendices Appendix A: Survey Methodology I. Introduction II. Objective of the Survey III. Scope of the Survey IV. Sample Size V. Fieldwork VI. Survey s Coverage VII. Numerators Manual VIII. Training of Enumerators IX. The Questionnaire X. Data Processing XI. Tourist Expenditure Estimation Appendix B: Questionnaire Appendix C: Statistical Tables References iii
5 LIST OF TABLES Table 1.1: International Tourist Arrivals by Regions, Table 1.2: Market Shares of International Tourist Arrivals... 2 Table 1.3: International Tourist Arrivals: Actual Growth and Projection.. 3 Table 1.4: International Tourism Receipts by Region, Table 2.1: Age Group and Purpose of Visit, United Republic of Tanzania, Table 2.2: Visitors by Travel Arrangement 2015, URT Table 2.3: Source Markets and Purpose of Visit under Package Tour Arrangement, URT Table 2.4: Source Markets and Purpose of Visit under Non-Package Tour Arrangement, URT Table 2.5: Visitors by Travel Arrangement, 2015, Zanzibar Table 2.6: Departure Points Table 2.7: Proportion of Visitors by Departure Points and Purpose of Visit Table 2.8: Length of Stay by Purpose of Visit and Top 15 Source Markets, URT Table 2.9: Length of Stay by Purpose of Visit and Top 15 Source markets, Zanzibar Table 2.10: Mode of Payments by Activity Table 2.11: Average expenditure of Main Source Market, URT Table 2.12: Average expenditure of Main Source Market, Mainland Table 2.13: Average Expenditure of Main Source Market, Zanzibar Table 2.14: Proportion of Expenditure by Products, 2015, Table 2.15: Expenditure of Visitors by Products and Travel Arrangement (URT), Table 2.16: Tourism Earning and Tourist Arrivals in the Top 15 Source Markets iv
6 LIST OF CHARTS Chart 1.1: International Tourist Arrivals to the World, Chart 1.2: Global International Tourism Receipts, Chart 1.3: International Tourist Arrivals to Tanzania, Top 15 Source Markets, Chart 2.1: Top 15 Source Markets for the United Republic of Tanzania. 15 Chart 2.2: Top 15 Source Markets for Tanzania Mainland Chart 2.3: Top 15 Source Markets for Zanzibar Chart 2.4: Age Group Chart 2.5: Age group and Tour Arrangement, United Republic of Tanzania, Chart 2.6: Purpose of Visit in Zanzibar Chart 2.7: Top 15 Source Markets and Package Tour Arrangement, URT Chart 2.8: Top 15 Source Markets and Non-Package Tour Arrangement, URT Chart 2.9: First-time and Repeat Visitors, URT Chart 2.10: Proportional of First-time and Repeat Visitors by Source Markets, URT Chart 2.11: First-time and Repeat Visitors by Purpose of Visit, URT 28 Chart 2.12: First-time and Repeat Visitors by Tour Arrangements, Zanzibar Chart 2.13: First-time and Repeat Visitors by Purpose of Visit, Zanzibar 29 Chart 2.14: Source of Information about Destination Tanzania, Chart 2.15: Visitors by Travel Party Chart 2.16: Visitors by Travel Party, Zanzibar Chart 2.17: Percentage Distribution of Visitors by Nights spent Chart 2.18: Mode of Payment Chart 2.19: Tourism Activities in Tanzania Chart 2.20: Average Expenditure per Person per Night by Purpose of Visit, Chart 2.21: Tourism Earnings and International Tourist Arrivals to Tanzania Chart 2.22: What Impressed Visitors Chart 2.23: Areas that need Improvement v
7 ACRONYMS AAKIA BOT DCC HAT JNIA KAS KIA LGAs MANY MFAIC MNRT MoT MoW MTU NAM NBS TAA TANAPA TCT TIC TTB TUN UNWTO URT VFR ZATI ZCT Abeid Amani Karume International Airport Bank of Tanzania Dar es Salaam City Council Hotel Association of Tanzania Julius Nyerere International Airport Kasumulo Kilimanjaro International Airport Local Government Authorities Manyovu Ministry of Foreign Affairs and International Cooperation Ministry of Natural Resources and Tourism Ministry of Transport Ministry of Works Mtukula Namanga National Bureau of Statistics Tanzania Airport Authority Tanzania National Parks Tourism Confederation of Tanzania Tanzania Investment Centre Tanzania Tourist Board Tunduma United Nations World Tourism Organization United Republic of Tanzania Visiting Friends and Relatives Zanzibar Association of Tourism Investors Zanzibar Commission for Tourism vi
8 FOREWORD The tourism industry which account for about 24.0 percent of Tanzania s exports of goods and services continued to be the leading sector in terms of generating foreign exchange earnings. Given its endowment and having exceptionally rich natural tourism assets of the world heritage status, the sector is an ideal vehicle for propelling growth and poverty reduction. However, during 2015 the number of international tourist arrivals declined slightly by 0.3 percent to 1,137,182 from 1,140,156 registered in As a result of this development, tourism earnings went down by 5.2 percent to USD 1,902.0 million in 2015 from USD 2,006.3 million in In view of the foregoing, we are pleased to introduce the 2015 Tanzania Tourism Sector Survey (TTSS), Report produced by the multi-institutional committee comprising the Ministry of Natural Resources and Tourism (MNRT), Bank of Tanzania (BOT), National Bureau of Statistics (NBS), Immigration Department and the Zanzibar Commission for Tourism (ZCT). The 2015 survey results indicate that most of the visitors were impressed by Tanzania as one of the unique destinations with friendly people and wonderful scenery. However, the majority of the visitors indicated the need for further improvement in the state of roads, particularly within the national parks, unacceptability of credit cards at most of the tourism establishments, traffic jams in Dar es Salaam and poor quality of services in some of the hotels. It is expected that this report will provide useful information to policy makers, investors, academicians and other stakeholders. Hon. Prof. Jumanne Maghembe (MP) Minister Ministry of Natural Resources and Tourism Prof. Benno Ndulu Governor Bank of Tanzania vii
9 ACKNOWLEDGEMENT The Steering Committee of the Tanzania Tourism Sector Survey (TTSS) Project wishes to express heartfelt thanks and appreciation to all those who were involved in the successful completion of the 2015 International Visitors Exit Survey. Special thanks should go to the Chief Executive Officers of the participating institutions namely; the Ministry of Natural Resources and Tourism, Bank of Tanzania, National Bureau of Statistics, Immigration Department, Zanzibar Commission for Tourism and the Tourism Confederation of Tanzania, for their valuable support and guidance. Special appreciation should also go to the Immigration Department staff, particularly the officers in-charge at the Julius Nyerere International Airport, Abeid Amani Karume International Airport, Kilimanjaro International Airport, Horohoro, Namanga, Tunduma, Mtukula and Manyovu boarder points. Similarly, our profound thanks should go to researchers and those who handled the data entry exercise for making the survey a success. This report was prepared under the overall supervision of Mr. Z. A. Kimwaga (Director of Tourism MNRT) and J. J. Nyella (Director, Economic Research and Policy-BOT). The Technical Team was led by Mr. P. Mwiru, Assistant Director of Tourism (MNRT), in collaboration with Ms. N. Moshy, Manager, International Economics and Trade Department (BOT). Other members of the team were Dr. C. Masenya (BOT), Mrs. V. W. Kejo (BOT), Mr. P. Mboya (BOT), Mr. J. Msimbano (MNRT), Mr. V. Tesha (NBS), Ms. E. Lema (NBS), Mrs. J. Rugemalila (NBS), Mr. C. Mndeme (Immigration Department) and Mr. M. Jaffer (ZCT). Special appreciations should also go to Mr. R. Barongo and R. William from BOT for managing the data processing exercise. viii
10 EXECUTIVE SUMMARY International tourist arrivals grew by 4.4 percent to 1,184 million in 2015, according to the UNWTO World Tourism Barometer, March The performance to a large extent is attributed to strong exchange rate fluctuations, the drop in oil prices and other commodities which increased disposable income in importing countries. Looking at international tourist arrivals by region, Europe, the Americas and Asia and the Pacific recorded growth of 4.9 percent, 5.0 percent and 5.0 percent, respectively in International tourist arrivals to the Middle East increased by 2.9 percent while Africa registered a fall of about 2.9 percent, mostly due to weak results in North Africa, which accounts for over one third of arrivals in the region. In East Africa, the number of international tourist arrivals in Kenya continued with a downward trend, contracting by 12.6 percent to 1,180,500 in 2015 from 1,350,400 in 2014, mainly due to security concerns that resulted from negative travel advisories from some European source markets and health concerns associated with spread of Ebola particularly in the West Africa in The number of international tourist arrivals to Tanzania declined by 0.3 percent to 1,137,182 in 2015 from 1,140,156 registered in 2014 consistent with general performance in Africa. On the other hand, international tourist arrivals in Uganda increased by 2.9 percent to 1,302,802 in 2015 from 1,266,046 recorded in This report presents the findings of the 13 th international visitors exit survey, which was conducted for a period of two weeks between August and September Main findings Source Markets The survey findings indicate that the top 15 source markets accounted for 77.2 percent of the total visitors in 2015 compared to 82.0 percent reported in the previous survey. This implies that tourist source markets for Tanzania are becoming more diversified thanks to the Government efforts to increase promotion in nontraditional markets. The list of the top 15 source markets is similar to that of the previous survey with the exception of Uganda that has been replaced with Switzerland. The findings indicate further that the share of visitors from Kenya increased from 4.8 percent in 2014 to 9.7 percent making it the third largest source market for Tanzania in 2015, largely associated with its proximity to Tanzania as well as increased business relations. 1 Economic Survey 2016, Kenya National Bureau of Statistics ix
11 Visitors expenditure Tourism earnings in Tanzania declined by 5.2 percent to USD 1,902.0 million in 2015 from 2,006.3 million recorded in 2014 largely attributed to slight fall in the number of international tourist arrivals and average expenditure per person. The number of international tourist arrivals dropped by 0.3 percent to 1,137,182 in 2015 from 1,140,156 registered in 2014 while overall average expenditure per person per night decreased to USD from USD recorded in Leisure and holidays was the major purpose of visit for most tourists The majority of visitors came for leisure and holidays followed by those who came to visit friends and relatives as well as for business. The dominance of visitors who came for leisure and holiday is associated with the country s endowment of variety of exquisite tourist attractions including national parks, mountains and cultural and historical sites. Only a few visitors came as volunteers. Majority of the visitors stayed between 8 and 28 nights About 51.0 percent of the visitors spend between 8 to 28 nights, followed by those who stayed between 4 to 7 nights. Visitors who stayed more than one month accounted for about six percent of total visitors. The findings also indicate that the average length of stay of a visitor in the United Republic of Tanzania was 10 nights, same as it was in the last past five years. Visitors who stayed the longest were from Netherlands with 16 nights while those who stayed the least were from Zimbabwe and Zambia with 5 nights each. First-time visitors continue to dominate over repeat visitors The survey findings indicate that 52.6 percent of the respondents were firsttime visitors compared to 67.3 percent in the previous survey. Out of the total first-time visitors, 56.0 percent came the under package tour arrangement while the rest used the non-package tour arrangement. First-time visitors prefer the package tour arrangement because in most cases, they are not familiar with the destinations. Wildlife tourism continues to be the main activity The survey findings indicate that wildlife tourism continued to be the main tourism activity in Tanzania, accounting for 34.0 percent of all the visitors. Most of the visitors who came for this activity were from the United States of America, x
12 United Kingdom, France and Netherlands. The second most attractive activity was beach accounting for 24.7 percent and was mostly visited by tourists from Germany, the United Kingdom, Kenya and the United States of America. Other prominent activities were cultural, mountain climbing and business. The majority of visitors who came for business were from Zimbabwe and Zambia coming to utilize Dar es Salaam Port. Cash continued to be a major mode of payment About 81.0 percent of the visitors used cash in settling their transactions while in Tanzania compared to 86.9 percent recorded in 2014 representing a decline of 5.9 percentage points. The number of visitors who settled their bills through credit cards improved to 18.6 percent from 12.8 percent in 2014 while the use of travellers cheque was 0.1 percent. In Zanzibar 75.5 percent of visitors settled their bill in cash while 24.1 percent used credit cards. Unacceptability of credit cards at most of the tourism establishments continues to be a challenge. Visitors are likely to stay longer if credit card facility is widely accepted as it facilitates transactions and reduces the risk of carrying cash. Policy Recommendations a) The findings indicated that unacceptability of credit cards at most of the tourism establishments continues to be a problem to the majority of the visitors as the use of credit cards continues to be low. In view of this there is a need for banks to sensitize owners of tourism establishments and other relevant stakeholders on the importance and benefit of allowing visitors to make use of credit cards when settling their bills. b) The survey s results indicate that the overall average length of stay of visitors to the United Republic of Tanzania was 10 nights same as it was in the past five years. This implies that there is a need of enhancing diversification of tourism products in addition to wildlife which has been a dominant tourism activity. This is expected to increase the number of nights spent and expenditure in the country. c) The findings indicated that wildlife was the activity visited by majority of visitors in 2015, apart from other tourist attractions such as sandy beaches, historical sites, mountains, nature and landscapes. This implies that there is a need of putting more efforts in promoting other forms of tourist attractions so as to complement wildlife tourism. xi
13 d) The findings also indicate many visitors complained about cleanliness and inadequate public toilets in areas such as airports, national parks and roadside, unsatisfactory state of air conditioners at airports and poor states of roads within the national parks. The government is therefore urged to continue with its efforts to improve roads in the national parks and other facilities. e) Traffic jam in Dar es Salaam region continued to be the major concern of most tourists. The government is advised to continue with its efforts to address the infrastructural issues. xii
14 Chapter 1: Recent Developments in the Tourism Industry 1.1 Global Perspective International tourist arrivals grew by 4.4 percent to 1,184 million in 2015, according to the UNWTO World Tourism Barometer, March 2016 (Chart 1.1). This is the 6 th consecutive year of above-average growth, whereby international arrivals increased by over 4.0 percent every year since the post-crisis year of This good performance to a large extend is attributed to strong exchange rate fluctuations, the drop in oil prices and other commodities which increased disposable income in importing countries. Chart 1.1: International Tourist Arrivals to the World, In Millions ,184 1,134 1,088 1, Source: UNWTO World Tourism Barometer, March 2016 Growth in advanced economy destinations was 5.0 percent higher than 4.0 percent recorded in emerging economies. By region, Europe, the Americas and Asia and the Pacific recorded growth of 4.9 percent, 5.0 percent and 5.0 percent, respectively in 2015 (Table 1.1). International tourist arrivals to the Middle East increased by 2.9 percent while Africa registered a fall of about 2.9 percent, mostly due to weak results in North Africa, which accounts for over one third of arrivals in the region. 1
15 Table 1.1: International Tourist Arrivals by Regions, Region In Millions Europe Asia and the Pacific Americas Africa Middle East Percentage Change Europe Asia and the Pacific Americas Africa Middle East Source: UNWTO World Tourism Barometer, various issues Looking at contribution to the international tourist arrivals, Europe continued to account for the largest share, followed by Asia and the Pacific, the Americas, the Middle East and Africa, as indicated in Table 1.2. The same pattern was observed in previous years. However, the share of Africa has been declining reflecting lack of convenient transport, security concerns and threat to wildlife. Table 1.2: Market Shares of International Tourist Arrivals Percent Region Europe Asia and the Pacific Americas Africa Middle East World Source: UNWTO World Tourism Barometer, various issues UNWTO projections indicate that international tourist arrivals will increase by between 3.5 and 4.5 percent in 2016, above the 3.8 percent average recorded between 2005 and 2015 (Table 1.3). Region-wise, the growth is expected to be stronger in Asia and the Pacific and the Americas, followed by Europe. The projections for Africa and the Middle East are positive. 2
16 Table 1.3: International Tourist Arrivals: Actual Growth and Projection Percent Actual Growth Projection Region 2015 Average World to 4.5 Europe to 4.5 Asia and the Pacific to 5.0 Americas to 5.0 Africa to 5.0 Middle East to 5.0 Source: UNWTO World Tourism Barometer, various issues According to the UNWTO World Tourism Barometer of May 2016, international tourism receipts reached USD 1,232 billion in nominal term in 2015 worldwide, lower than 1,295 billion recorded in 2014 (Chart 1.2). The decline in receipts is attributed to unusual strong exchange rate fluctuations which occurred in However, when accounted for exchange rate fluctuations and inflation, international tourism receipts increased by 3.6 percent. The growth rate of receipts is consistent with the increase in international tourist arrivals. This performance confirms the increasingly important role of the tourism sector in stimulating economic growth and contributing to international trade. Chart 1.2: Global International Tourism Receipts, In USD Billions 1,104 1,146 1,236 1,295 1, Source: UNWTO World Tourism Barometer, various issues 3
17 Looking at international tourism receipts by region, Europe, Asia and the Pacific, and Africa recorded a fall in receipts in 2015 largely attributed to strong appreciation of the US dollar against currencies of many countries in these regions, hence rendering receipts earned in currencies of those countries lower in current US dollar terms (Table 1.4). However, taking into account exchange rate fluctuations and inflation, receipts in the Americas, Asia and the Pacific and the Middle East each grew by 4.0 percent, while Europe grew by 3.0 percent and Africa by 2.0 percent. Table 1.4: International Tourism Receipts by Region, Region Billions of USD Europe Asia and the Pacific Americas Africa Middle East Percentage change Europe Asia and the Pacific Americas Africa Middle East Source: UNWTO World Tourism Barometer, Various Issues Alongside international tourism receipts (the travel item of the balance of payments), international tourism generated USD billion in exports through international non-resident passenger transport services, bringing the total value of international tourism exports to USD 1,442 billion in
18 1.2 Tourism Developments in East Africa The number of international tourist arrivals in Kenya continued with a downward trend, declining by 12.6 percent to 1,180,500 in 2015 from 1,350,400 in Likewise, tourism earnings declined by 13.4 per cent to USD million from USD million in the same period. The sector s suppressed performance was mainly due to security concerns that resulted from negative travel advisories from some European source markets and health concerns associated with spread of Ebola particularly in the West Africa in In Uganda, the number of international tourist arrivals increased by 2.9 percent to 1,302,802 in 2015 from 1,266,046 recorded in Tourism Development in Tanzania The number of international tourist arrivals to Tanzania declined by 0.3 percent to 1,137,182 in 2015 from 1,140,156 registered in Consistent with this development, tourism earnings went down by 5.2 percent to USD 1,902.0 million in 2015 from 2,006.3 in International Tourist Arrivals According to Immigration statistics, Kenya continued to be the main source markets for tourists visiting Tanzania accounting for 17.4 percent of all visitors to Tanzania. When compared with 2014, visitors from Kenya increased by 5.0 percent to 197,562 (Chart 1.3). As it was in 2014, the United States of America and United Kingdom also continued to dominate the source markets for Tanzania accounting for 5.8 percent and 4.8 percent of all visitors, respectively. However, visitors from the United States of America and United Kingdom declined by 17.5 percent and 7.9 percent in 2015, respectively when compared with The composition of the top 15 source markets is not different from the one observed in 2014, with the exception of China that has joined the list replacing Netherlands. The appearance of China reflects an increase in business interactions between these two countries. 5
19 Chart 1.3: International Tourist Arrivals to Tanzania, Top 15 Source Markets, 2015 Kenya 197,562 United States of America United Kingdom Italy Germany Burundi Rwanda Uganda Zambia India Zimbabwe South Africa France Mozambique China 66,394 54,599 53,742 52,236 48,210 45,216 37,253 32,694 32,608 30,533 30,288 28,683 27,323 25,444 Source: Immigration Department, Promotion and Marketing Launching of Tourism Portal As the world is transforming to e-tourism, Tanzania Tourist Board has been able to successfully develop and officially launch a new destination website (Tourism Portal) on September H.E. President Jakaya M. Kikwete launched the destination portal. The destination portal ( provides a new platform with detailed information about destination Tanzania and its tourism products, as well sets a platform for Tanzania town stakeholders to promote their business, and tourists to get detailed information; book and purchase certain services online, all in a one stop shop. It further enables tourists to conduct a prepay services for accommodation in Tanzania. 6
 has established a Zanzibar Promotion Centre in India which")

20 H.E. President Jakaya Mrisho Kikwete officially launching destination portal Zanzibar Promotion Centre in India In realizing the importance of India as an emerging market, Zanzibar Commission for Tourism (ZCT) has established a Zanzibar Promotion Centre in India which was officially launched on 1 st April The centre has been tasked to create awareness about the destination and undertake all promotion strategies that will make Zanzibar popular in Asia through conducting roadshows, seminars and workshops, and participate in trade fairs and conduct familiarization (FAM) tours for the travel trade. Minister responsible for Tourism Zanzibar Said Ali Mbarouk (middle) inspecting the office during the opening ceremony of the promotion centre in Mumbai, India. 7

21 Destination and Products Awareness Focusing to increase the destination and products awareness, Tanzania Tourist Board coordinated various familiarization and educational trips for different international media houses, tour agents and journalists and participated in international road shows in different potential markets. The major road shows were organized in China and Switzerland. TTB also attended an investment forum in Dubai and two Presidential Investment Forum organized by the Tanzania Investment Centre (TIC) in Washington D.C, USA and Beijing, China, respectively. In addition, TTB together with TANAPA and NCAA organized familiarization and educational trips for a team of journalists from Public and Private Media houses from South Africa who made a three days visit to Tanzania. They also organized for 51 journalists and tour operators from china to trek Mount Kilimanjaro as a commemoration of 50 years of Tanzania Independence Marketing Partnership In the period between August 2014 May 2015 Tanzania Tourist Board engaged in a marketing partnership with Sunderland Association Football Club (SAFC), focusing to attract tourists from across Europe and the rest of the world through the English premier league. Under this marketing campaign, destination Tanzania was promoted through various SAFC channels and medias such as SAFC stadium digital channels, magazines, social media and prematch outfits. Promotion of Visit Tanzania through stadium digital channels 8

22 1.3.3 New Accommodation Establishments A new five stars Park Hyatt Zanzibar Hotel was opened in Zanzibar during The beachfront Park Hyatt Zanzibar Hotel is housed in the historic heart of Stone Town, a UNESCO World Heritage Site. This is the 36th Park Hyatt hotel worldwide. The establishment of Park Hyatt hotel will provide superior customer satisfaction through better quality of services and facilities in the country. The official inauguration of Park Hyatt Hotel in Zanzibar The new Ramada Resort was established in Dar es Salaam in 2015, which marks the 5 th in Africa after Morocco, Ghana, Nigeria and Tunisia. The hotel has quality accommodation rooms and conference facilities which are suitable for all occasions. 9

 in London, the International Tourism Bourse (ITB) in")
23 Ramada Resort in Dar es Salaam Tourism Trade Fair and Exhibitions In 2015, Tanzania participated in several international tourism exhibitions outside the country with the aim of marketing and promoting Tanzania as a unique tourist destination. The main exhibitions include the World Travel Market (WTM) in London, the International Tourism Bourse (ITB) in Berlin, INDABA in South Africa, Borse Internationale de Tourisms (BIT) in Italy. Tanzania Stand at ITB
.")
24 1.3.5 Establishment of Kilimanjaro Tourism and Trade Fair exhibition Kilimanjaro Tourism and Trade Fair exhibition (KILI FAIR) is the third tourism exhibition to be established in Tanzania after the KARIBU FAIR and Swahili International Tourism Expo (S!TE). The exhibition focused on linking tourism partners and other stakeholders in the industry from both inside and outside the country, with the aim of promoting tourism in Tanzania and raising awareness of her tourist attractions. KILI FAIR was organized by Kili Fair Promotion Co. Ltd and officially inaugurated on 5th June 2015 in Moshi. KILI FAIR in Moshi International Flights Etihad Airways, the National Airline of the United Arab Emirates, expanded its African route network with the launch of the daily flights between Abu Dhabi and Dar es Salaam on 1 st December Etihad Airways operates using Airbus A320 aircraft with 16 Business Class and 120 Economy Class seats. Dar es Salaam is Etihad Airways 110 th destination globally, and its 11 th destination in Africa and the Indian Ocean. The daily schedule offers two-way connectivity over Etihad Airways hub in Abu Dhabi, with convenient onward connections to 45 popular destinations across the Middle East, Europe, the Indian Subcontinent, North and Southeast Asia, and Australasia. It is anticipated the new route will boost flow of tourists in the East African region. 11

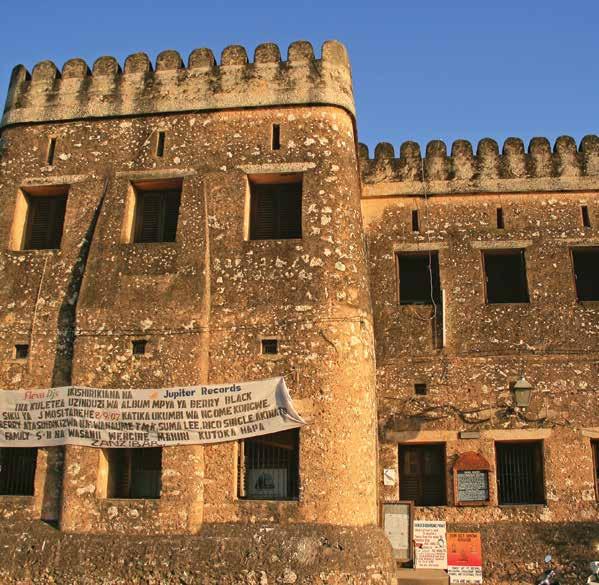
25 For the case of Zanzibar, a Ukrainian charter airline (Wind rose Airlines) launched a weekly flight to Zanzibar effective from September The introduction of this direct flight to Zanzibar will help to boost leisure and business travel from the Ukraine and Russia to Zanzibar and thus contributing to economic and social development. Ukrainian visitors disembarking at Abeid Amaan Karume International Airport The Restoration Old Boma Dar es Salaam City Council (DCC) in collaboration with the Architect Association of Tanzania (AAT) has refurbished the old BOMA building to become the one stop center for tourism and heritage. The centre is located along Morogoro road and Sokoine drive road and is designed to promote City tourism and diversify tourism activities in Dar es Salaam such as City Museums, Tourists Information Centre, tourists restaurant and curio shops. The old boma building aims at promoting historical architecture of Dar es Salaam and it will become the centre for education, professional trainings, community outreach and public cultural events. 12
 to be monitored through the use of satellite system.")
26 1.3.8 Satellite Elephant Monitoring in Ruaha National Park Tanzania National Parks has launched a special program to tag 30 elephants in Ruaha National Park and Rungwa Game Reserve (Great Ruaha Landscape) to be monitored through the use of satellite system. The main goal of the monitoring exercise is to provide information on elephants seasonal movement patterns, extent and distribution in the landscape which will help rangers to plan more informed patrols outside the core protected area. The elephants are therefore fitted with inbuilt mortality sensor; and in cases where a fitted elephant is killed a ranger will be informed through the Satellite GPS units distributed in Game Reserves and Wildlife Management Areas. Conservation experts place collar on elephants 13
27 Chapter 2: Analysis of the Survey s Results 2.1 Introduction This chapter presents the analytical findings resulting from the 13 th round of the international visitors exit survey conducted in The findings are presented in a manner that can be of useful to various stakeholders including policy makers, planners, marketers, and researchers. The chapter provides details on where visitors to Tanzania come from, popular activities and areas visited, demographic structure and expenditure pattern, among others. Statistics are presented in tables, charts and graphics to provide a swift understanding of the issues being discussed. 2.2 Source Markets The survey results show that there was an increase of 3.5 percent in the number of tourist who visited both Tanzania Mainland and Zanzibar compared to visitors received in The top 15 source markets accounted for 77.2 percent of the total visitors in 2015 compared to 82.0 percent reported in the previous survey (Chart 2.1). This implies that tourist source markets for Tanzania are becoming more diversified thanks to the Government efforts to increase promotion in nontraditional markets. The list of the top 15 source markets is similar to that of the previous survey with the exception of Uganda that has been replaced with Switzerland. The United States of America, United Kingdom and Italy continued to maintain the lead source markets accounting for 29.1 percent of the total visitors in 2015 lower from 35.5 percent reported in The findings also show a notable increase in the number of visitors from Kenya which increased its share from 4.8 percent in 2014 to 9.7 percent making it the third largest source market for Tanzania in Position of Kenya is largely associated with its proximity to Tanzania as well as increased business relations. It is worth noting that Kenya is one of the major sources of foreign private investments in Tanzania particularly in the finance and insurance activities. Results show that most Kenyans come to Tanzania to visit their friends and relatives most of whom are working in these activities. 14
28 Chart 2.1: Top 15 Source Markets for the United Republic of Tanzania Percent United States of America United Kingdom Kenya Italy Germany France Netherland Zimbabwe South Africa Spain Zambia Canada Switzerlands Australia China The top 15 source markets for Tanzania Mainland is similar to that of URT with slight changes in positions of some countries. For instance, Italy which appears the fourth largest source market under URT, occupies 10th position in Tanzania Mainland largely due to its prominence in Zanzibar (Chart 2.2). The top 15 source markets in Tanzania Mainland accounted for 76.5 percent of all visitors in 2015 compared to 80.8 percent reported in Chart 2.2: Top 15 Source Markets for Tanzania Mainland Percent United States of America United Kingdom Kenya France Germany Netherlands Zimbabwe Zambia Canada Spain Italy South Africa Switzerland Australia China
29 In the case of Zanzibar, the source markets are also more diversified than in the previous survey as the top 15 source markets accounted for 82.4 percent in 2015 compared to 87 percent in Similarly, the list of the top 15 source markets remained unchanged with the exception of Denmark, which has now been replaced by the United Arab Emirates (Chart 2.3). Chart 2.3: Top 15 Source Markets for Zanzibar Percent Italy United Kingdon United States of America France Germany Netherlands Spain South Africa Switzerland Canada Kenya Belgium United Arab Emirates Australia China Age Group Survey findings show that the age profile of tourists who came to Tanzania in 2015 is unevenly distributed from persons below 18, 18-24, 25-44, and above 65 age groups (Chart 2.4). Similar to the previous surveys, most tourists (45 percent) were in the age group followed by those at age group. The number of senior citizen with 65 years of age and above continued to decline as their share dropped from 6 percent recorded in 2014 to 3.9 percent in Further, the results show a notable increase in the share of visitors with below 18 years of age, an increase of 10.8 percentage point from 1.3 percent recorded in
30 Chart 2.4: Age Group Percent Below and Above Age group Similar to the previous surveys, majority of the visitors (65 percent) came for leisure and holidays and were mostly in the age group of Second in prominence were visitors in the years age group. The least number of visitors in this purpose were 65 years and above (Table 2.1). Table 2.1: Age Group and Purpose of Visit, United Republic of Tanzania, 2015 Percent Purpose of visit Visiting Age group Business Leisure and holidays Meeting and conference Scientific and academic friend and relatives Volunteering Other Grand total Below and Above Generally, slight majority of visitors have higher preference for package tour than non-package tour (51.7 percent). However, as shown in Chart 2.5, visitors below 18 years age group and those of 45-year-old and above have higher 17
31 preference for package tour. The country stands to benefit more from visitors with non-package tour arrangement as they tend to spend more at destination compared to those under package tour arrangement. This cements the earlier observation regarding the need to develop products more suited to the age group not only because they have higher preference for holiday making but also most of them come under the non-package tour arrangement. Chart 2.5: Age group and Tour Arrangement, United Republic of Tanzania, 2015 Percent Non-package Package Below and Above 2.4 Purpose of Visit Out of 15,515 surveyed visitors, majority came for leisure and holidays, visiting friends and relatives as well as business. Other visitors came for meetings and conference, volunteering and other purposes. The dominance of visitors who came for leisure and holiday is associated with the country s endowment of variety of exquisite tourist attractions including national parks, mountains and cultural and historical sites. The trend is more or less the same as 2014 survey results. 18

32 Note: Other purposes include missionaries, transit, scientific and academic. Further analysis show that most of visitors from Italy, the United States of America, the United Kingdom and France came for leisure and holidays. Visitors from Zimbabwe, Zambia and Kenya dominated in the business category. The prominence of Zimbabwe and Zambia is largely explained by strategic location of Tanzania whereby these visitors come to clear vehicles at the Dar es Salaam port and for business purposes. The dominance of business visitors from Kenya is partly explained by the fact that it is one of the major sources of foreign private investments in Tanzania. 19


.")


33 Leisure and holidays Business Italy,14.5% United Kingdom, 14.2% France, 10.1% United States of America, 13.9% Business Visitors are mostly from neighbouring countries The results also show that visitors who came for meetings and conference where mostly from Kenya, South Africa and the United States of America. Majority of tourists from Kenya, the United Kingdom and the United States of American also came to visit friends and relatives (VFR). The dominance of Kenya in the VFR category is largely associated with its proximity with the country. Meetings and conference Visiting friends and relatives Kenya, 35.8% Kenya, 41.7% United States of America, 16.7% United Kingdom, 16.0% South Africa, 16.7% United Kingdom, 10.1% United States of America, 14.0% Visitors by purpose and country of residence, URT


34 Out of 7,562 visitors surveyed in Zanzibar, 88.1 percent came for leisure and holidays, followed by 7.1 percent who came for visiting friends and relatives, the remaining visitors came for business, meetings and conference and other purposes such as volunteering, transit and religious missions. The dominance of holiday visitors is not surprising, as Zanzibar is known for its exotic nature, cultural and historical sites and notwithstanding her sandy white beaches. Majority of visitors who come for holiday are from Italy, France and the United Kingdom. Similarly, visitors from the United States of America, the United Kingdom and Canada came mostly to visit with friends and relatives. Chart 2.6: Purpose of Visit in Zanzibar Volunteering 1.9% Business 1.3% Meetings and Conference 0.8% Others 0.8% Visiting Friends and Relatives 7.1% Leisure and Holidays 88.1% Leisure and holidays Visiting friends and relatives Visitors by purpose and country of residence, Zanzibar
35 2.5 Travel Arrangement The survey results indicate that, majority of the visitors came under the non package tour arrangement (53.1 percent) and the rest came under the package tour arrangement (46.9 percent). The same pattern was revealed in 2008 and 2011 surveys. Table 2.2 indicates that out of all visitors who came under the package tour arrangement, most of them were from Italy (14.3 percent) followed by the United States of America and the least number were from Zambia (0.2 percent). With respect to non-package tour arrangement, the greatest number of visitors was from Kenya (16.7 percent) followed by the United States of America and the least number were from Australia (1.1 percent). Table 2.2: Visitors by Travel Arrangement 2015, URT Percent Country of Residence Package Tour Arrangement Non-Package United States of America United Kingdom Kenya Italy Germany France Netherlands Zimbabwe South Africa Spain Zambia Canada Switzerland Australia China Others Total Looking at source markets by travel arrangement, Chart 2.7 indicates that Italy was the leading source market under the package tour arrangement followed by the United States of America and the United Kingdom. The least countries in the list of top 15 source markets for the package tour arrangement were Kenya, Zimbabwe and Zambia. 22
36 Chart 2.7: Top 15 Source Markets and Package Tour Arrangement, URT Percent Italy United States of America United Kingdom France Germany Netherlands Spain Canada South Africa Australia Switzerland China Kenya Zimbabwe Zambia Kenya was the leading country in terms of source markets for non package tour arrangement, followed by the United States of America and the United Kingdom. Countries with the least number of visitors under the non package tour arrangement were Spain, China, and Australia (Chart 2.8). Chart 2.8: Top 15 Source Markets and Non-Package Tour Arrangement, URT Percent Kenya United Kingdom Zambia Germany Italy Canada Spain Australia
37 The survey findings reveal that, majority of the visitors who came under the package tour arrangement from each of the country were holiday makers with the exception of Zimbabwe and Zambia (Table 2.3). More than half of the business visitors came from Zimbabwe. Visitors from Kenya and Zambia under this travel arrangement came mainly for meetings and conference. Those who came to visit friends and relatives were mainly from Kenya and the United States of America. Canada and the United States of America brought more visitors for volunteering. Table 2.3: Source Markets and Purpose of Visit under Package Tour Arrangement, URT Percent Purpose of Visit Country of Residence Business Leisure and holidays Meetings and conference Visiting friends and relatives Volunteering Other Total United States of America United Kingdom Kenya Italy Germany France Netherlands Zimbabwe South Africa Spain Zambia Canada Switzerland Australia China Others Total The survey findings show that, majority of the visitors who came under the non-package tour arrangement from each of the country were holiday makers with the exception of Kenya, Zambia and Zimbabwe while visitors from Zambia 24
38 and Zimbabwe dominated in the business category (Table 2.4). Most of the visitors who came for meetings and conference were from South Africa, Kenya and China. Visitors from Kenya, Canada and the United Kingdom led the list in visiting friends and relatives. Those who came for volunteering were mainly from Spain, the United States of America and Canada. Table 2.4: Source Markets and Purpose of Visit under Non-Package Tour Arrangement, URT Country of Residence Business Leisure and holidays Meetings and Conference Purpose of Visit Visiting friends and relatives Percent Volunteering Other Total United States of America United Kingdom Kenya Italy Germany France Netherlands Zimbabwe South Africa Spain Zambia Canada Switzerland Australia China Others Total For Zanzibar, the findings indicate that like in the previous surveys majority of visitors came under the package tour arrangement (63 percent), while the rest (37 percent) came the under the non-package tour arrangement. Italy was the leading country that brought majority of visitors under the package tour arrangement, followed by France and the United Kingdom. The lowest number of visitors who came under the package tour arrangement was from the United 25
39 Arab Emirates. With respect to the non package tour arrangement, the highest number of visitors was from the United States of America followed by the United Kingdom and Germany and the lowest was from China. Table 2.5: Visitors by Travel Arrangement, 2015, Zanzibar Tour Arrangement Country of Residence Package Non-Package Italy United Kingdom United States Of America France Germany Netherlands Spain South Africa Switzerland Canada Kenya Belgium United Arab Emirates Australia China Others Total Percent 2.6 First-Time and Repeat Visits The survey s findings indicate that 52.6 percent of the respondents were firsttime visitors compared to 56 percent in the previous survey. Out of the total first-time visitors, 56.0 percent came under the package tour arrangement while the rest used the non-package tour arrangement. The majority of the repeat visitors (86.6 percent) came under the non package tour arrangement (Chart 2.9). Majority of First-time visitors prefer the package tour arrangement because in most cases, they are not familiar with the destinations. 26
40 Chart 2.9: First-time and Repeat Visitors, URT Percent Non- Package Package First Time Visitors Repeat Visitors Chart 2.10 shows that majority of visitors from top 15 source markets were First-time visitors with the exception of Netherlands, Switzerland and Zambia. Chart 2.10: Proportional of First-time and Repeat Visitors by Source Markets, URT Percent First time Visitors Repeat Visitors United States of America United Kingdom kenya zimbambwe Italy 12.3 United States of America 11.2 France 7.9 united Kingdom 11.2 Germany 7.8 Zambia 11.1 kenya 6.0 South Africa 6.8 South Africa 4.8 Germany 3.8 Spain 4.8 Italy 3.3 Canada 4.6 Netherlands 2.7 Netherlands 4.3 Canada 2.1 Australia 4.0 Switzerland 1.8 Zimbabwe 3.6 France 1.6 China 3.1 China 1.5 Switzerland 3.0 Australia 1.5 Zambia 1.7 Spain


41 The survey findings reveal that, almost three quarters of all First-time visitors came for leisure and holiday, whereas the least came for other purposes such as scientific and academic. On the other hand, about 30 percent of repeat visitors came for visiting relatives and friends and this was followed by those who came for business. Volunteering category had the lowest percent of repeat visitors (Chart 2.11). Chart 2.11 First-time and Repeat Visitors by Purpose of Visit, URT Majority of tourists who visited Zanzibar in 2015 were First-time visitors and mostly used the package tour arrangement; whereas majority of repeat visitors came under the non package tour arrangement (Chart 2.12). 28

42 Chart 2.12: First-time and Repeat Visitors by Tour Arrangements, Zanzibar Percent Non - Package Package First Time Visitors Repeat Visitors Majority of both the first-time and repeat visitors came for leisure and holiday, while the smallest number of first-time and repeat visitors came for other purposes and meetings and conference, respectively (Chart 2.13) Chart 2.13: First-time and Repeat Visitors by Purpose of Visit, Zanzibar 29

43 2.7 Source of Information During the 2015 survey, 41.8 percent of all visitors responded that travel agents and tour operators were the main source of information about Tanzania; followed by those who heard from word of mouth from friends and relatives (Chart 2.14). Visitors who heard about Tanzania through travel agents and tour operators were mostly from Italy, the United Kingdom, United States of America and France, while those who received information through friends and relatives were from Kenya, the United Kingdom and the United States of America. Newspapers, magazines and brochures and web were also equally important sources of information. Other sources of information were Tanzania s missions abroad, trade fairs, radio stations, television networks, travel guide books and through work/business. 30
44 Chart 2.14: Source of Information about Destination Tanzania, 2015 Percent Travel agent, tour operator 42.0 Friends and relatives 37.0 Others 6.9 Newspaper and magazines 6.0 Web 4.8 Trade fair, Tanzania Missions and Media Travel Party Majority of visitors (28.3 percent) during this survey travelled alone, which is an increase of 13.6 percentage point compared to the 2014 survey, followed by visitors travelled with friends and relatives. Those travelled with children continue to be the least. (Chart 2.15). Chart 2.15: Visitors by Travel Party Percent Alone 28.3 With friends/relatives 38.3 With friends/relatives 27.2 With spouse 24.0 With spouse and children 19.5 With spouse and children 17.2 With spouse 19.0 Alone 14.7 With children 6.3 With children 5.9 On the contrary, in Zanzibar, visitors travelled with spouse and children constituted the largest proportion, followed by those travelling with friends and relatives. Same trend as URT those travelled with children remained the least (Chart 2.16). 31
45 Chart 2.16: Visitors by Travel Party, Zanzibar Percent With spouse and children 29.6 With other friends/relatives 27.7 With spouse 26.7 Alone 10.8 With children Departure Points The 2015 survey covered eight departure points; three airports and five border posts. Large proportion of visitors (77.7 percent) departed through airports (Table 2.6). The dominance of airports as departure points is largely explained by the fact that most of visitors to Tanzania are from long haul destinations. There is a slight proportion increase of visitors who uses land border posts by 0.1 percent in the 2015 Survey from 22.3 percent recorded in 2014 Survey. Usually, large number of visitors who uses land border posts came from the neighboring countries, i.e. Zambia, Kenya, Uganda, and Zimbabwe. Table 2.6: Departure Points Departure points Visitors Percent JNIA 6, AAKIA 3, KIA 1, NAM 1, HOR TUN MANY MTK Total 15,
46 Table 2.7 portrays that, AAKIA continues being the leading in handling the largest volume of visitors who came for leisure and holiday by 37.6 percent as compared with other departure points. KIA and JNIA took the second and third volume of visitors who came for leisure and holiday purposes. This is associated with availability and connectivity of many international airlines coming to Tanzania and existence of diversity of tourist attractions, i.e. sandy beaches, national parks etc. Likewise, visitors departed via KIA who came for scientific and academic; and meetings and conferences led by a proportion of 48.5 percent and 78.7 percent respectively. Tunduma border point continued to be the most departure point for business visitors with the share of 45.5 percent. This is constituted with Dar es Salaam being the commercial hub where most of Zimbabweans and Zambians purchase their commodities at Kariakoo market and collect imported goods through Dar es Salaam Port. Table 2.7: Proportion of Visitors by Departure Points and Purpose of Visit Purpose of the Visit (Percent) Leisure and Meetings and Scientific and Visiting Friends Departure points Business Holidays Conference On Transit Academic and Relatives Volunteering Other AAKIA NAM KIA JNIA HOR MTK MANY TUN Total Total Visitors (Absolute) 1,660 10, ,
47 2.10 Average Length of Stay Indicator on the length of stay for the visitors was derived from the number of nights spent in the country. The survey results revealed that an overall average length of stay of visitors to URT was 10 nights (Table 2.8). For a period of past five years the length of stay remained unchanged at 10 nights. Visitors from Netherlands had longest length of stay of 16 nights followed by visitors from Germany and Spain who stayed for 13 nights. This is partly attributable to the location of these source markets which are long haul destination. On the other hand, most of neighbour countries such as Zimbabwe and Zambia spent minimal length of stay of 5 nights. In addition, visitors to URT who came under business purposes spent only 6 nights. Leisure and holiday makers to URT recorded an average length of stay of 10 nights while those who came to visit friends and relatives and other visitors spent 12 nights. Table 2.8: Length of Stay by Purpose of Visit and Top 15 Source Markets, URT Country of Residence Business Leisure and Holidays Visiting Friends and Relatives Other Average United States of America United Kingdom Kenya Italy Germany France Netherlands Zimbabwe South Africa Spain Zambia Canada Switzerland Australia China Average
48 Table 2.9 indicates that average length of stay for Zanzibar visitors was 6 nights. When compared with the previous surveys, the pattern for the length of stay has remained unchanged for the past five years. Visitors from Italy, Netherlands, Switzerland and China recorded average length of stay of 7 nights. The other countries recorded an average of between 4 to 6 nights. In terms of purpose of visit, the length of stay across all purpose recorded 6 nights. Table 2.9: Length of Stay by Purpose of Visit and Top 15 Source markets, Zanzibar Country of Residence Business Leisure and Holidays Visiting Friends and Relatives Other Average Italy United Kingdom United States of America France Germany Netherlands Spain South Africa Switzerland Canada Kenya Belgium United Arab Emirates Australia China Average Night Spent Visitors spent different number of nights in the country depending on the purpose of the travel and country of origin. The survey s findings show that about 15 percent of visitors to the United Republic of Tanzania spent between 1 to 3 nights (Chart 2.17). Also visitors who spent 4 to 7 nights accounted for about 28 percent of all visitors, while 33 percent of visitors stayed between 8 to 14 nights. Generally, about three quarter of all visitors spent about two weeks. Proportion of visitors who spent more than 28 nights was less than seven percent. 35
49 Chart 2.17: Percentage Distribution of Visitors by Nights spent Percent to 3 Nights 4 to 7 Nights 8 to 14 Nights 15 to 28 Nights 29 to 91 Nights 92 to 360 Nights 2.12 Mode of Payment Survey findings indicate that 81.0 percent of visitors to Tanzania settled their bills in cash compared to 86.9 percent recorded in 2014 representing a decline of 6.8 percent (Chart 2.18). The number of visitors who settled their bills through credit cards improved to 18.6 percent from 12.8 percent in 2014 while the use of travelers cheque was 0.1 percent. In Zanzibar 75.5 percent of visitors settled their bill in cash while 24.1 percent used credit cards. Unacceptability of credit cards at most of the tourism establishments continues to be a problem to visitors since the use of credit cards as a mode of payment continues to be low. It is worth noting that this has been an issue of concern to visitors even in the previous surveys. In view of these finding there is a need for banks to sensitize owners of tourism establishments and other relevant stakeholders on the importance and benefit of allowing visitors to make use of credit cards to settle their bills. One of the benefits of allowing visitors to settle their bills using credit cards is the possibility of them staying longer. 36
50 Chart 2.18: Mode of Payment Percent Cash 81.0 Credit card 18.6 Others Mode of Payments by Activity Table 2.10 shows that out of 6,787 visitors who settled their bills in cash 46.1 percent made payments in beaches and wildlife tourism activities, while out of 1,560 visitors who used credit cards to settle their bills 68.1 percent made payments for beaches, conferences and wildlife tourism activities. Table 2.10: Mode of Payments by Activity Percent Mode of Payments Cash Credit card Other Grand total Wildlife Beach Cultural Mountain climbing Business Shopping Conference Diving and sports fishing Bird watching hunting Other Other modes include, travelers cheque, Banker Cheque, Transfers 37
51 2.14 Tourism Activities During the 2015 survey, majority of visitors went to visit the national parks in the northern and southern circuits, followed by those visiting the country s exquisite beaches mostly in Zanzibar Island. Majority of other visitors were interested with the country s cultural heritage and historical sites. Given that Tanzania is strategically located a good number of visitors from neighboring came to utilize the services Dar es Salaam port. Other activities which attracted visitors include conference tourism, shopping, bird watching and hunting. The findings indicate that 34.0 percent of visitors came for game viewing to see the country s unique wildlife ranging from lion, hippopotamus, giraffe, zebra and rhinos (Chart 2.19). Majority of visitors who came to visit wildlife were from the United States of America, the United Kingdom, France and Netherlands. Chart 2.19: Tourism Activities in Tanzania Percent Wildlife Beach Cultural Mountain climbing Business Conference Shopping Diving and sports fishing Bird watching hunting 38


52 Elephants Leopard Lions Wonderful wildlife in Tanzania Hipoppotamus The second most attractive activity is beach tourism, whereby of all the surveyed visitors, 24.7 percent came to enjoy the country s wonderful sandy beaches. Visitors from Italy, Germany, the United Kingdom, Kenya and the United States of America took the lead in beaches activities. Visitors came for white sandy beaches 39


53 The third activity was cultural tourism, accounting for 7.1% of the surveyed visitors. This is explained by the country s richest history and cultural heritage found in sites like Bagamoyo ruins, kilwa kivinje, Zanzibar s stone town. Visitors the United States of America, the United Kingdom and Kenya from were mostly interested with this activity. Cultural and historical sites Mountain climbing used to be the third most attractive activity, however this year it has been surpassed by the cultural tourism. Majority of visitors who came for mountain climbing were from the United States of America, the United Kingdom and Canada. Mount Kilimanjaro 40

 and Zambia (29.5 percent) of all visitors who came for vehicle clearance.")

54 Other activities were bird watching with majority of visitors coming from the France, Germany and Spain. Meanwhile, visitors who came to consume the services of Dar Port were mostly from Zimbabwe (55.1 percent) and Zambia (29.5 percent) of all visitors who came for vehicle clearance. This is largely due to the fact that these countries are landlocked. Likewise, visitors from neighboring countries come to shop at the famous Kariakoo Market; these visitors include Kenyans, Zimbabweans and Zambians. Bird Watching Hunting Safaris Shopping at Kariakoo 41

55 2.15 Average Expenditure The overall average expenditure per person per night of visitors to the United Republic of Tanzania is USD 199 compared to USD recorded in Visitors who came under the package tour arrangement spent on average USD 305 while those who came non-package spent an average of USD 141 per person per night. Under the Package tour arrangement, international visitors who came for business spent the most depicting an average of USD 466 per person per night followed by holiday markers whose average expenditure per person per night is USD 285. Those who came under the non-package tour arrangement indicates that business visitors spent on average USD 157 per person per night and holiday visitors spent an average of USD 148. The results further show that in mainland Tanzania visitors who came under the package tour arrangement spent an average of USD 310 per person per night, compared with an average of USD 247 spent by visitors under the same tour arrangement in Zanzibar (Chart 2.20). Chart 2.20: Average Expenditure per Person per Night by Purpose of Visit, Business Leisure and Holidays Visiting Friends and Relatives Other Values in USD Independent Packaged URT Combined Average Independent Packaged Mainland Combined Average Independent Package Tour Zanzibar combined average 42
56 Looking at average expenditure by source markets, the findings indicate that visitors from Switzerland, the United Arab Emirates, France, Zambia, United States of America, and Germany who came under the package tour arrangement spent the most with an average of more than USD 300. Visitors from Zimbabwe, Germany, Netherlands, Kenya and Zambia who come under the non-package tour arrangement spent least with an average below USD 100 per person per night (Table 2.11). Table 2.11: Average expenditure of Main Source Market, URT Value in USD Country of Residence Travel Arrangement Overall Visitors Non-package Package United States Of America United Kingdom Kenya Germany France Italy Netherlands South Africa Zimbabwe Spain Zambia Canada Switzerland United Arab Emirates Belgium The main source market in Mainland Tanzania indicates that visitors from Zambia, France, the United States of America, China, Germany and Netherlands who came under the package tour arrangement on average spent more than USD 300 per person per night while visitors from Zimbabwe, Germany, Kenya, Netherlands, Italy and Zambia who came under the non-package tour arrangement on average spent less than USD 100 per person per night (Table 2.12). 43
57 Table 2.12: Average expenditure of Main Source Market, Mainland Value in USD Country of Residence Travel Arrangement Non-package Package Overall Visitors United States Of America United Kingdom Kenya France Germany Netherlands Zimbabwe Spain Zambia Canada Italy South Africa Switzerland Belgium China The main source market in Zanzibar depicts that under the package tour arrangement Czech Republic, France, the United Kingdom, Netherlands, the United Arab Emirates spent on average more than USD 300 per person per night. Under the non-package tour arrangement only visitors from Czech Republic spent on average less than USD 100 per person per night (Table 2.13). Table 2.13: Average Expenditure of Main Source Market, Zanzibar Value in USD Country of Residence Travel Arrangement Non-package Package Overall Visitors United Kingdom France United States Of America Netherlands South Africa Kenya United Arab Emirates Australia Austria China Israel Portugal Czech Republic Luxembourg Uganda
58 2.16 Proportion of Expenditure by Products International visitors to the United Republic of Tanzania indicate different spending behaviors. Out of the total expenditure of an international visitor in 2015, 46 percent was spent on accommodation, 15 percent on food and drinks, 13 percent on transport services. Only one percent was spent on cultural services. In Tanzania mainland, the findings indicate that out of the total expenditure of international visitors, 50 percent was spent on accommodation, 20 percent on food and drinks and 10 percent on transportation services. In case of Zanzibar, international visitors spend 33 on accommodation, 19 percent on souvenir, 13 percent on food and drinks and 8 percent on transportation (Table 2.14). Rising number of visitors and increased spending is bound to influence employment within the tourism industry. The integrated labor force survey of 2014 shows that number of persons employed directly or indirectly in Tanzania Mainland in the tourism industry stood at 1,195,233 in Table 2.14: Proportion of Expenditure by Products, 2015, Percent Products Mainland Zanzibar URT Accommodation services Food and drinks services Transportation services Cultural services Hunting, sports and recreational services Sightseeing and excursion services Mountain climbing services 3 NA 4 Visa, taxes and fees Souvenirs Tips and donations Other Total
59 Table 2.15 shows that out of total expenditure spent by international visitors who came under the package arrangement 47 percent was spent on accommodation, 19 percent on food and drinks and 9 percent on Transportation. On the other hand, those who used the non-package tour arrangement spent 49 percent on accommodation, 23 percent on food and drinks, 10 percent on souvenirs only five percent on transportation. Table 2.15: Expenditure of Visitors by Products and Travel Arrangement (URT), 2015 Percent Travel Arrangement Product Non-package Package Accommodation services Food and drinks services Transportation services 5 9 Cultural services 1 1 Hunting, sports and recreational services 2 2 Sightseeing and excursion services 3 4 Mountain climbing services 1 3 Visa, taxes and fees 2 2 Souvenirs 10 7 Tips and donations 3 3 Other 1 3 Total Tourism Earnings Tourism earnings in Tanzania declined by 5.2 percent to USD 1,902.0 million in 2015 from 2,006.3 recorded in 2014 largely attributed to slight fall in the number of international tourist arrivals and average expenditure per person (Chart 2.21). The number of international tourist arrivals to Tanzania declined by 0.3 percent to 1,137,182 in 2015 from 1,140,156 registered in Much of the fall in tourist arrivals were recorded in major top source markets particularly in the United States of America, France, Netherlands, Canada, Switzerland and Australia (Table 2.16). In the case of Zanzibar, the earnings increased to USD million from USD million recorded in 2014 resulting from the increase in the number of arrivals from 198,539 in 2014 to 202,209 in
60 Chart 2.21: Tourism Earnings and International Tourist Arrivals to Tanzania 2200 Tourism Earnings (USD Millions) ,200 1, International Arrivals (000) International Visitor Arrivals (000) Earnings Table 2.16: Tourism Earning and Tourist Arrivals in the Top 15 Source Markets Country of Residence International Tourist Arrivals % Change Tourism Earnings (Millions of USD) % Change United States of America 80,484 66, United Kingdom 60,034 54, Kenya 188, , Italy 49,518 53, Germany 47,262 52, France 33,585 28, Netherlands 23,710 20, Zimbabwe 36,497 30, South Africa 26,614 30, Spain 8,757 11, Zambia 36,679 32, Canada 21,185 16, Switzerland 14,900 13, Australia 16,527 15, China 21,246 25,
61 2.18 Visitors Perception about Tanzania Chart 2.22 shows that of all visitors who visited Tanzania 68.7 percent were impressed by the friendliness of the people, wonderful country and wildlife. Tourists were also impressed by the beautiful beaches and a memorable experience. Visitors who were impressed by beaches accounted for 8.0 percent which is very low compared with the number and beauty of beaches in Tanzania mainland and Zanzibar. In Zanzibar 13.1 percent of visitors were impressed by beaches while 30.7 percent were impressed by friendliness of people. These findings call for the Ministry of Natural Resources and Tourism and all other stakeholders to aggressively market all attractive places which are unique to Tanzania and currently not attracting large number of visitors, such as mountain climbing which attracted only 2.9 percent of visitors. Chart 2.22: What Impressed Visitors Percent Friendly People 34.6 Wonderful Country, Landscape, Nature Wildlife Beaches Others Excellent Experience Good Service History and Culture Nice Food Mountain Climbing Satisfies and hope come back


62 2.19 Areas that Need Improvement About 21.1 percent of the visitors were concerned with the state of roads, particularly within the national parks. Inadequate facilities and inland transport particularly public transport was among the main concerns of visitors. Improvement of facilities such as toilets, availability of water and electricity in public toilets along the roads and national parks was also pointed out. Meanwhile, 10.4 percent of surveyed visitors complained about traffic jams particularly in Dar es Salaam (Chart 2.23). This has been a major concern even in the previous surveys. Visitors also complained about too many tips which are also demanded impolitely. Other concerns were unreliability of internet access, credit cards unacceptability at some tourism establishments and slow processing of visa at entry points. Chart 2.23: Areas that need Improvement 49
63 Chapter 3: Conclusion and Policy Recommendations 3.1 Conclusion The survey findings reveal that tourism earnings declined by 5.2 percent to USD 1,902.0 million in 2015 from USD 2,006.3 million recorded in 2014 largely attributed to fall in the number of international tourist arrivals and average expenditure per person. The number of international tourist arrivals went down slightly by 0.3 percent to 1,137,182 in The overall average expenditure per person per night of a visitor was USD 199 in 2015 lower than USD 210 recorded in Policy Recommendations a) The findings indicated that unacceptability of credit cards at most of the tourism establishments continues to be a problem to the majority of the visitors as the use of credit cards continues to be low. In view of this there is a need for banks to sensitize owners of tourism establishments and other relevant stakeholders on the importance and benefit of allowing visitors to make use of credit cards when settling their bills. Responsible Institutions: MNRT, HAT, TCT, ZCT, and ZATI b) The survey s results indicate that the overall average length of stay of visitors to the United Republic of Tanzania was 10 nights same as it was in the past five years. This implies that there is a need of enhancing diversification of tourism products in order to increase the number of nights spent at a destination by tourists. This will have a positive impact on tourist expenditure in the country. Responsible Institutions: MNRT, TTB, LGAs, TCT, ZCT and ZATI c) The findings indicated that wildlife was the activity which visited most by majority of visitors in 2015, apart from other tourist attractions such as sandy beaches, historical sites, mountains, nature and landscapes. This implies that there is a need of putting more efforts in promoting other forms of tourist attractions so as to complement wildlife tourism. Responsible Institutions: MNRT, TTB, TCT, ZCT and ZATI 50
64 d) The findings also indicate many visitors complained about cleanliness of the environment particularly toilets and inadequate water supply in the cities and towns, unsatisfactory state of air conditioners at airports and poor states of roads within the national parks. The government is therefore urged to continue with its efforts to improve roads in the national parks and other facilities. Responsible Institutions: MoW, TAA, TCAA, TANAPA and MNRT e) Traffic jam in Dar es Salaam region continued to be the major concern of most tourists. The government is advised to continue with its efforts to address the infrastructural issues. Responsible Institutions: MoW, MoT and DCC 51
65 52 Appendices
66 Appendix A: Survey Methodology I. Introduction The survey s methodology was designed to collect data that would facilitate a better understanding of the status of the tourism sector and provide an instrument that will enable an appropriate follow-up mechanism. It consists of designing a sample and sample selection; survey instruments including a questionnaire; scope and coverage; training; data collection and processing; and estimation of tourist expenditure. The main objective of the survey is to provide reliable information about visitors to Tanzania, including their number, length of stay, expenditure, travel arrangement and their demographic characteristics. II. Objective of the Survey The primary objective of the survey was to collect up-to-date tourist expenditure information for use in the Tourist Expenditure Model developed in The Model was developed as a tool for estimation of international tourism receipts required in the compilation of National Accounts (NA) and Balance of Payments (BOP) statistics. These statistics are used by the public and the private sector for policy formulation and strategic business planning, respectively. III. Scope of the Survey The respondents for the survey were the departing international visitors. A person is considered as an international visitor if he/she travels to a country other than that of his/her usual residence, for a period not exceeding twelve months; and whose main purpose of visit is other than an activity remunerated from within the country visited. IV. Sample Size The survey was done on sample basis. It was planned to interview 10,959 departing international visitors, equivalent to one percent of the international visitors recorded in Ultimately, the survey managed to randomly interview about 7,491 respondents, who represented around 14,996 visitors in the sample. This sample was considered sufficient to meet the survey s objectives. 53
67 V. Fieldwork The data collection exercise was undertaken for a period of two weeks between August and September Eight teams; seven in Mainland and one in Zanzibar collected the data. Technical Committee members participated in the field supervision of the interviews to ensure questionnaires completeness, quality and consistency. VI. Survey s Coverage In order to obtain the required information from the international visitors, it was important to conduct the survey at entry/exit boarder points. The survey covers eight departure points, namely: Julius Nyerere International Airport, Kilimanjaro International Airport, Abeid Amani Karume International Airport, Horohoro, Namanga, Tunduma, Mtukula and Manyovu border points. VII. Numerators Manual The Technical Committee developed the Enumerators Manual (EM) that was used by the enumerators as a reference document during the survey. The manual contained information and guidelines on concepts and definitions of some of the key words used in the questionnaire. In addition, the manual provided the description of the questions and data crosschecking mechanism. VIII. Training of Enumerators A one-day training of enumerators and supervisors was organized by the Technical Committee s members. A total of 26 enumerators and seven supervisors were trained. The purpose of the training was to guide the enumerators to understand the questionnaire and equip them with interviewing techniques. Enumerators were also trained in methods of field editing, data quality control procedures and fieldwork coordination. The Enumerators Manual was used as a guideline document during the training. IX. The Questionnaire The questionnaire was designed to ensure that the questions asked were in line with user s data needs. The information collected is useful for tourism promotion and macroeconomic policy formulation. A single questionnaire was used to 54
68 gather information for the 2014 International Visitors` Exit Survey. The content of the questionnaire was based on the previous years questionnaires, with slight modifications. The questionnaire used in the survey had 24 questions and it comprised four main parts, namely: visitor profiles, travel behavior, expenditure patterns and visitor s comments (Appendix III). Questions 1 to 10 aimed at establishing the visitor s profiles (nationality, country of residence, travel party, age group, gender, purposes of visit, type of tourism activity and source of information about Tanzania). Questions 11 to 17 aimed at obtaining information about type of tour arrangement (package/non-package), items in the package, costs of package tour and number of nights spent. Questions 18 to 20 were structured to establish tourists earnings ascribed to Tanzania. In addition, the questions probed for details on the amount of money spent in Tanzania. Question 21 and 22 asked the visitors most used mode of payment while in Tanzania and whether they were visiting Tanzania for the First-time or not. Question 23 and 24 sought information about areas that impressed the visitors and those which need improvement. X. Data Processing The processing of the 2015 International Visitors Exit Survey data began after completion of fieldwork. Data processing involved manual editing, coding of open-ended questions, data entry and editing of computer-identified errors. Data entry and editing were accomplished using the ORACLE11g database and web-based application. XI. Tourist Expenditure Estimation Tourists expenditure in the country was estimated using Tourist Expenditure Model that was developed during the comprehensive International Visitors Exit Survey conducted in The model uses the following variables in estimating tourists expenditure: average expenditure by travel arrangement by purpose of visit, proportion of international tourist arrivals by travel arrangement and 55
69 average length of the stay. Data on average expenditure by travel arrangement by purpose of visit, proportion of international tourist arrivals by travel arrangement and average length of the stay were obtained from the survey, while the number of international tourist arrivals was obtained from the Immigration Department. The model is depicted in the following equation: E v = (E P X V P XT) + (E NP XV NP XT) Whereby: E v = Total tourist expenditure in Tanzania E P = Average package tour expenditure per visitor per night, derived from the survey E NP = Average Non-package tour expenditure per visitor per night, derived from the survey V P = Number of international tourist arrivals under the package travel arrangement (The number of international tourist arrivals as recorded by the Immigration Department, adjusted into package visitors by purpose, using package tour arrangement ratio derived from the survey) V NP = Number of international tourist arrivals under the Non-package travel arrangement (The number of international tourist arrivals as recorded by the Immigration Department, proportionately adjusted into non-package visitors using the non-package tour arrangement ratio derived from the survey) T = Average length of stay, derived from the survey The Simplified Model Country of Purpose of Total number of Number of Average Average Expenditure per Total Residence Visit International Tourist International length of Visitor per Night Expenditure Arrivals (sourced from Immigration Dept) Tourist Arrivals by Travel arrangement Stay Package Non Package Package (V P) Nonpackage (V NP) (T) (E P) (E NP) (E V) Business Holiday VFR Other 56
70 Procedure and assumptions used for the estimation of tourist expenditure for 2015: Calculation of average package tour expenditure involved deduction of estimated cost for international fare to Tanzania and the commission accruing to an international tour wholesaler. Information on cost of international transport from source markets was updated using current information gathered from international carriers that bring visitors to Tanzania. It was assumed that 10 percent of the value of the package is retained by the international tour wholesaler to meet overhead costs and commission. The assumption was based on a study on Tourism Earnings in Tanzania that was conducted in Immigration data on the number of international tourist arrivals by purpose of visit were distributed according to the package and non-package arrangements using the travel arrangement ratios as established in the survey. In order to be able to estimate annual tourists expenditure, the survey s results were applied to the total number of international tourist arrivals, as recorded by the Immigration Department. It is worth mentioning that given the homogeneity nature of visitors characteristics, the information collected during the two weeks survey is justifiable to represent the total population. The Immigration Department also provided the number of international tourist arrivals for Zanzibar that enabled the estimation of tourists expenditure for Zanzibar. The average length of stay used was between one to twenty -eight nights. 57
71 Appendix B: Questionnaire THE 2015 INTERNATIONAL VISITORS EXIT SURVEY Please read the instructions carefully before filling the form. INTRODUCTION We hope that your stay in Tanzania was a pleasant one and a rewarding experience. Before you leave, you are kindly requested to provide information relating to your stay in Tanzania. The information will help us to improve and develop the tourism sector. The survey is jointly carried out by the Ministry of Natural Resources and Tourism, National Bureau of Statistics, Bank of Tanzania, Immigration Department and the Zanzibar Commission for Tourism. Your Cooperation is highly appreciated FOR OFFICIAL USE: CODE NUMBER: NAME OF THE RESEARCHER: DATE: SIGNATURE: NAME OF THE DATA ENTRANT: 58
72 1. Nationality Country of Residence 2. What is your age group (tick one only) < [ ] [ ] [ ] [ ] [ ] 3. Are you travelling alone? (Tick) Yes [ ] No [ ] If Yes go to question no With whom are you travelling? (tick one only) With spouse [ ] With children [ ] With spouse and children [ ] With other friends and relatives [ ] 5. What is the number of persons whom you travelling with whose expenses you are paying? 6. Write the number of persons whose expenses you are covering according to their age group (except yourself)? Age group < Number of people [ ] [ ] [ ] [ ] [ ] 7. Gender (including yourself) Number of Females Number of Males 8. MAIN purpose of visit to Tanzania (tick one only) Meetings and Conference [ ] Scientific and Academic [ ] Business [ ] Volunteering [ ] Visiting Friends and Relatives [ ] Day visitors (excursionists) [ ] Leisure and Holidays [ ] Other (please specify)... [ ] 9. What was your MAIN activity in Tanzania, in this trip? (tick one only) Wildlife tourism [ ] Hunting tourism [ ] Beach tourism [ ] Conference tourism [ ] Cultural tourism [ ] Vehicle clearance/pick up [ ] Bird watching [ ] Shopping [ ] Diving and Sport Fishing [ ] Others (please specify):. [ ] Mountain climbing [ ] 59
73 10. What was your MAIN source of information about Tanzania (tick one only) Travel agent, tour operator [ ] Tanzania Mission Abroad [ ] Friends, relatives [ ] TV Networks i.e. CNN, BBC (please specify):... Trade fair [ ] Radio Station (please specify).. [ ] Newspaper, magazines, brochures [ ] Web (please specify).. [ ] Inflight magazines [ ] Others (please specify):.. [ ] 11. Did you travel independently or booked a package tour? Independently Package (If you travelled non-package, go to question 17) 12. Items included in your package tour (tick) International transport (air ticket) [ ] Sightseeing/excursion/game activities [ ] Accommodation [ ] Guided tour [ ] Food and Drinks [ ] Travel insurance [ ] Internal transportation in Tanzania [ ] Other (please specify)... [ ] 13. What is the cost of international transport Currency (Return air ticket) per person? 14. Total cost of the package tour Currency 15. Is the total cost for the whole group? (Tick) Yes [ ] No [ ] 16. Total number of nights in the package tour (INCLUDING nights spent in other countries) 17. Number of nights spent in: Tanzania Mainland Zanzibar Island 18. How much money did you spend (cash, travellers cheque, credit cards) in Tanzania during this trip? Please give your best estimate in case you do not remember the exact figures. Currency 60
74 19. Please give a breakdown of your expenditure in Tanzania on the following; Hotel Currency.. Others (Lodges, Motels, Campsites etc.) Currency.. Food and drinks Currency.. Internal transportation By Air Currency.. By Road Currency.. By Water Currency.. by Railway Currency.. Rentals (Car hires, Charters, Boats, etc) Currency.. Cultural Services (Museums, Historical Sites, etc.) Currency.. Sports and Recreational ( Diving, cycling etc) Currency.. Sight Seeing and Excursion Currency.. Mountain Climbing Currency.. Hunting Currency.. Access/entry/gate fees Currency.. Visa fees and taxes Currency.. Souvenirs (Gifts), precious metals, crafts, etc) Currency.. Tips Currency.. Donations Currency.. Other (please specify) Currency.. Amount 20. Is the above breakdown for the whole party? (Tick) Yes [ ] No [ ] 21. Which mode of payment did you use mostly in Tanzania? Cash [ ] Traveller s Cheques [ ] Credit Card [ ] Other (please specify) [ ] 22. Was this your first trip to Tanzania? (tick) Yes [ ] No [ ] 23. What impressed you most during your trip to Tanzania? What would you consider the most important areas that need improvements? Thank you for your co-operation and for choosing Tanzania as your destination. Have a pleasant journey 61
75 Appendix C: Statistical Tables Table C I: Length of stay by Purpose and Top 15 Source markets to Tanzania, Mainland, 2015 Top 15 Source Markets Business Leisure and Holidays Visiting Friends and Relatives Other Average United States of America United Kingdom Kenya France Germany Netherlands Zimbabwe Zambia Canada Spain Italy South Africa Switzerland China Australia Average
76 Table C II: International Tourist Arrivals Country Total % of Total Kenya 197, United States of America 66, United Kingdom 54, Italy 53, Germany 52, Burundi 48, Rwanda 45, Uganda 37, Zambia 32, India 32, Zimbabwe 30, South Africa 30, France 28, Mozambique 27, China 25, Netherlands 20, Canada 16, Malawi 15, Australia 15, Israel 14, Switzerland 13, Sweden 13, Congo 13, Oman 12, Spain 11, Belgium 11, Denmark 10, Norway 10, Poland 9, South Sudan 8, Comoros 7, Austria 6, Turkey 6, Nigeria 5,
77 Country Total % of Total Ireland 5, Finland 5, Brunei Darussalam 5, Russian Federation 5, Democratic People s Republic of Korea 4, Czech Republic 4, Japan 4, Pakistan 4, Ghana 4, Egypt 4, United Arab Emirates 3, New Zealand 3, Uzbekistan 3, Portugal 3, Philippines 2, Romania 2, Ukraine 2, Mexico 2, Swaziland 2, Brazil 2, Cocos (Keeling) Islands 2, Cabo Verde 2, Hungary 1, Ecuador 1, Ethiopia 1, Malaysia 1, Botswana 1, Serbia 1, Côte D ivoire 1, Yemen 1, Namibia 1, Gabon 1, Cameroon 1, Greece 1, Indonesia 1,
78 Country Total % of Total Somalia 1, Nepal 1, Sudan 1, Thailand 1, Estonia 1, Qatar 1, Georgia 1, Saudi Arabia 1, Bulgaria 1, Syrian Arab Republic 1, Seychelles 1, Argentina 1, Iran 1, Djibouti China, Hong Kong Special Administrative Region Singapore Sri Lanka Slovakia Dominica Croatia Cambodia Algeria Bangladesh Martinique Costa Rica Bosnia and Herzegovina Jersey Iceland Angola Lesotho Taiwan, Province of China Mauritius Chile Lithuania Luxembourg
79 Country Total % of Total Tunisia Gambia Colombia Lebanon Jordan Iraq Kuwait Slovenia Cyprus Bolivia (Plurinational State of) Honduras Viet Nam Uruguay Guinea Chad Solomon Islands Burkina Faso Fiji Heard Island and Mc Donald Islands Venezuela (Bolivarian Republic Of) Peru Cuba Jamaica Malta Trinidad and Tobago Morocco Equatorial Guinea Isle of Man Kazakhstan Sierra Leone Senegal Benin Libya Togo Madagascar
80 Country Total % of Total Nicaragua Mauritania Eritrea Mali Albania Latvia Paraguay Armenia Belarus Sao Tome and Principe Bahrain Niger El Salvador Suriname Azerbaijan Liberia Afghanistan Tajikistan State Of Palestine Andorra The Former Yugoslav Republic of Macedonia San Marino Myanmar Republic of Moldova Panama Haiti Saint Vincent and The Grenadines Guatemala Saint Kitts And Nevis Antigua And Barbuda Liechtenstein Mongolia Central African Republic Grenada Belize
81 Country Total % of Total Guyana Barbados Guinea-Bissau Micronesia (Federated States of) Bermuda Saint Lucia Bahamas China, Macao Special Administrative Region Stateless Bhutan Kyrgyzstan Papua New Guinea Saint Pierre and Miquelon Total 1,137,
82 References BOT, MNRT, NBS, IMMIGRATION DEPARTMENT, ZCT (2014), Tanzania Tourism Sector Survey Report United Nation World Tourism Organization (2016), World Tourism Barometer; Volume 13, March 2016 United Nation World Tourism Organization (2016), World Tourism Barometer; Volume 13, May 2016 Websites; United Nation World Tourism Organization, Tanzania Tourist Board, 69
 www.nbs.go.tz Immigration Department www.immigration.go.tz 74")
83 Ministry of Natural Resources and Tourism (MNRT) Bank of Tanzania (BoT) Zanzibar Commission for Tourism (ZCT) National Bureau of Statistics (NBS) Immigration Department 74
The 2016 International Visitors Exit Survey Report
 The 2016 International Visitors Exit Survey Report a TANZANIA TOURISM SECTOR SURVEY THE 2016 INTERNATIONAL VISITORS EXIT SURVEY REPORT October 2017 i TABLE OF CONTENTS LIST OF TABLES... iv LIST OF CHARTS...
The 2014 International Visitors Exit Survey Report THE TANZANIA TOURISM SECTOR SURVEY
 The 2014 International Visitors Exit Survey Report THE TANZANIA TOURISM SECTOR SURVEY a b TANZANIA TOURISM SECTOR SURVEY THE 2014 INTERNATIONAL VISITORS EXIT SURVEY REPORT November 2016 c d TABLE OF CONTENTS
TANZANIA TOURISM SECTOR SURVEY. The 2008 International Visitors Exit Survey Report
 TANZANIA TOURISM SECTOR SURVEY The 2008 International Visitors Exit Survey Report TANZANIA TOURISM SECTOR SURVEY The 2008 International Visitors Exit Survey Report Dar es Salaam, June 2010 TABLE OF CONTENTS
Executive Summary... i. List of Tables and Figures viii CHAPTER 1: INTRODUCTION.. 1 CHAPTER 2: PRESENTATION OF SURVEY RESULTS 7
 TANZANIA TOURISM SECTOR SURVEY The 2004 International Visitors Exit Survey Report (DRAFT) Dar es Salaam, February 2006 ii CONTENTS Executive Summary.... i List of Tables and Figures viii CHAPTER 1: INTRODUCTION..
TANZANIA TOURISM SECTOR SURVEY. The 2004 International Visitors Exit Survey Report
 TANZANIA TOURISM SECTOR SURVEY The 2004 International Visitors Exit Survey Report Dar es Salaam, December 2006 1 Tanzania Tourism Sector Survey BOT, MNRT, NBS, IMMIGRATION DEPT, ZCT, 2006 First Report,
III. TRADE IN COMMERCIAL SERVICES BY CATEGORY
 .. TRADE IN COMMERCIAL SERVICES BY CATEGORY Transportation services China records impressive growth Exports of world transportation services reached $750 billion in 2007, an increase of 19 per cent, following
TOURISM BUSINESS COUNCIL OF SOUTH AFRICA TRENDS AND INDICATORS REPORT. March 2018
 TOURISM BUSINESS COUNCIL OF SOUTH AFRICA TRENDS AND INDICATORS REPORT March 2018 Compiled by: Ms. Tebogo Umanah General Manager: Policy Analysis and Strategic Projects March 2018 Page 1 CONTENTS INTRODUCTION...
TANZANIA TOURISM SECTOR SURVEY. The 2005 International Visitors Exit Survey Report
 TANZANIA TOURISM SECTOR SURVEY The 2005 International Visitors Exit Survey Report Dar es Salaam, October 2007 i BOT, MNRT, NBS, IMMIGRATION DEPT, ZCT, 2006 Published in 2007 Ministry of Natural Resources
3rd International Forum on sustainable Tourism 20th to 22nd October 2008 Bamako - Mali
 TANZANIA S POLICY ON TOURISM DEVELOPMENT 3rd International Forum on sustainable Tourism 20th to 22nd October 2008 Bamako - Mali Ministry of Natural Resources and Tourism - Tanzania 1 Tanzania basic facts
Western Cape Destination Performance Report: April-June 2016
 Number of arrivals (millions) Western Cape Destination Performance Report: April-June 2016 Global Tourism Performance According to the United Nations World Tourism Organisation, international tourist arrivals
TOURISM BUSINESS COUNCIL OF SOUTH AFRICA TRENDS AND INDICATORS REPORT. May 2018
 TOURISM BUSINESS COUNCIL OF SOUTH AFRICA TRENDS AND INDICATORS REPORT May 2018 Compiled by: Ms. Tebogo Umanah General Manager: Policy Analysis and Strategic Projects May 2018 Page 1 CONTENTS INTRODUCTION...
III. TRADE IN COMMERCIAL SERVICES BY CATEGORY
 .. TRADE IN COMMERCIAL SERVICES BY CATEGORY Transportation services China records impressive growth of world transportation services reached $750 billion in 2007, an increase of 19 per cent, following
Tourism in South Africa A statistical overview
 Tourism in South Africa A statistical overview Purpose of presentation Purpose of the presentation is to present different tourism statistics produced by Stats SA People like to travel we are a country
Making Cooperation Work COMCEC STRATEGY. For Building an Interdependent Islamic World COMCEC TOURISM OUTLOOK 2015
 COMCEC TOURISM OUTLOOK 2015 Aslı TAŞMAZ DADAKOĞLU COMCEC Coordination Office September 2015 OUTLINE The Importance of Tourism for Development Overview of International Tourism in the World International
The United Republic of Tanzania Ministry of Natural Resources and Tourism TOURISM DIVISION The 2013 Tourism Statistical Bulletin
 The United Republic of Tanzania Ministry of Natural Resources and Tourism TOURISM DIVISION The 2013 Tourism Statistical Bulletin INTRODUCTION THE COUNTRY Tanzania covers 945,234 sq. km made up 942,832
SURVEY OUTGOING TOURISTS
 SURVEY OF OUTGOING TOURISTS 2006 SURVEY OF OUTGOING TOURISTS 2006 MINISTRY OF TOURISM, LEISURE & EXTERNAL COMMUNICATIONS REPUBLIC OF MAURITIUS FOREWORD The 2006 Survey of Outgoing Tourists was the eleventh
Ministry of Natural Resources and Tourism Tourism Division. The 2009 Tourism Statistical Bulletin
 Ministry of Natural Resources and Tourism Tourism Division The 2009 Tourism Statistical Bulletin INTRODUCTION THE COUNTRY Tanzania covers 945,234 sq. km made up 942,832 sq. km of mainland Tanzania (formerly
CONTENTS Executive Summary... iii 1. Introduction Major Destinations for Zambia s Exports Major Source Countries for Zambia s
 Bank of Zambia CONTENTS Executive Summary... iii 1. Introduction... 1 2. Major Destinations for Zambia s Exports... 1 3. Major Source Countries for Zambia s Imports... 4 4. Conclusion... 6 ii Executive
SOUTHERN AFRICA TRAVEL AND TOURISM BAROMETER REPORT 2015
 SOUTHERN AFRICA TRAVEL AND TOURISM BAROMETER REPORT 2015 1 Contents 1. TOURISM TRENDS: GLOBAL AND SOUTHERN AFRICA S MARKET SHARE IN AFRICA... 4 1.1. TOURIST ARRIVALS... 4 1.1.1. Global Tourist Arrivals
OIC/COMCEC-FC/33-17/D(16) TOURISM CCO BRIEF ON
 TOURISM CCO BRIEF ON") TOURISM OIC/COMCEC CCO BRIEF ON TOURISM COMCEC COORDINATION OFFICE 0 May 2017 CCO BRIEF ON TOURISM Tourism industry is an important socio-economic tool for both developed and developing countries. It has
TOURISM OIC/COMCEC CCO BRIEF ON TOURISM COMCEC COORDINATION OFFICE 0 May 2017 CCO BRIEF ON TOURISM Tourism industry is an important socio-economic tool for both developed and developing countries. It has
1.0 Introduction Zambia s Major Trading Partners Zambia s Major Export Markets... 4
 Bank of Zambia CONTENTS 1.0 Introduction... 3 2.0 Zambia s Major Trading Partners... 3 3.0 Zambia s Major Export Markets... 4 4.0 Major Source Countries Of Zambia s Imports... 5 5.0 Direction Of Trade
The W20. The 20 wealthiest countries in the world. Publication Date: October 2015 NEW WORLD WEALTH
 The W20 The 20 wealthiest countries in the world Publication Date: October 2015 W20 wealth rankings The following tables ranks the top 20 countries in the world by total individual wealth held. Total individual
International Visitation to the Northern Territory. Year ending September 2018
 International Visitation to the Northern Territory Year ending September 2018 INTERNATIONAL VISITORS IN THE NORTHERN TERRITORY YEAR ENDING SEPTEMBER 2018 VISITORS 289,000-1.1% NIGHTS 3.6 MILLION EXPENDITURE
International Visitation to the Northern Territory. Year ending March 2018
 International Visitation to the Northern Territory Year ending March 2018 The following is a summary of information relevant to the Northern Territory (NT) tourism industry including visitation results
CONTENTS Executive Summary... iii 1. Introduction Major Destinations for Zambia s Exports Major Source Countries for Zambia s
 Bank of Zambia CONTENTS Executive Summary... iii 1. Introduction... 1 2. Major Destinations for Zambia s Exports... 1 3. Major Source Countries for Zambia s Imports... 3 4. Conclusion... 6 ii Executive
Understanding Business Visits
 Understanding Business Visits Foresight issue 153 VisitBritain Research 1 Contents Introduction Summary and Highlights Business Visits in Context UK Business visits and spend Averages Duration of stay
A F R I C A TANZANIA. 21 st POST SHOW REPORT
 21 st TANZANIA A F R I C A 2 0 1 8 East Africa s Largest International Trade Exhibition On Building & Construction Products, Equipments & Machinery POST SHOW REPORT 01-03 November 2018 Diamond Jubilee
TOURISM CCO BRIEF ON
 TOURISM OIC/COMCEC CCO BRIEF ON TOURISM COMCEC COORDINATION OFFICE 0 October 2016 CCO BRIEF ON TOURISM Tourism industry is a critical sector for both developed and developing countries in terms of economic
CONTENTS Executive Summary... iii 1. Introduction Major Destinations for Zambia s Exports Major Source Countries for Zambia s
 Bank of Zambia CONTENTS Executive Summary... iii 1. Introduction... 1 2. Major Destinations for Zambia s Exports... 1 3. Major Source Countries for Zambia s Imports... 4 4. Conclusion... 6 ii Executive
Tourism Statistics Annual Report
 Tourism Statistics 2012 Annual Report Research and Development Department, June 2012 Table of Contents PREFACE... 3 THE WORLD TOURISM SCENE... 3 THIS REPORT... 3 INTERNATIONAL ARRIVAL STATISTICS... 4 INTRODUCTION...
Sources of Information
 Sources of Information Bureau of Immigration: Embarkment and Disembarkment information is collected from 24 Airports, 17 Seaports and 31 Land Checkposts. International Passenger Surveys: Provide Information
International Visitation to the Northern Territory. Year ending December 2017
 International Visitation to the Northern Territory Year ending December 2017 The following is a summary of information relevant to the Northern Territory (NT) tourism industry including visitation results
TRADE STATISTICS BULLETIN
 TRADE STATISTICS BULLETIN May 2014 Est. by Statistics Act 9 of 2011 Namibia Statistics Trade Statistics Bulletin, May 2014 Agency 1 MISSION STATEMENT In a coordinated manner we produce and disseminate
Tourism Statistics
 Tourism Statistics 2006-2010 TABLE OF CONTENTS FOREWORD 4 DEFINITIONS 5 STATISTICAL SUMMARY FOR 2010 6 INTERNATIONAL TOURIST ARRIVALS 7 International Tourist Arrivals: 1994-2010 7 International Tourist
VisitScotland s International Marketing Activity
 VisitScotland The Importance of the Visitor Economy A strong visitor economy helps to position Scotland on the world stage whilst the economic impact of the visitor spend spreads out from the traditional
III. TRADE IN COMMERCIAL SERVICES BY CATEGORY
 . TRADE IN COMMERCIAL SERVICES BY CATEGORY The Highlights Transportation services Rising seaborne trade and air traffic contribute to the increase of transportation services trade In a context of rising
International Visitation to the Northern Territory. Year ending September 2017
 International Visitation to the Northern Territory Year ending September 2017 The following is a summary of information relevant to the Northern Territory (NT) tourism industry including visitation results
1.0 Introduction Zambia s Major Trading Partners Zambia s Major Export Markets... 4
 Bank of Zambia CONTENTS 1.0 Introduction... 3 2.0 Zambia s Major Trading Partners... 3 3.0 Zambia s Major Export Markets... 4 4.0 Major Source Countries Of Zambia s Imports... 5 5.0 Direction Of Trade
Copyrights Statistics Botswana 2016
 STATISTICS BOTSWANA TOURISM STATISTICS ANNUAL REPORT 2014 Copyrights Statistics Botswana 2016 Statistics Botswana. Private Bag 0024 Botswana Tel: (267) 367 1300. Fax: (267) 395 2201.Email: info@statsbots.org.bw
Forecast for Norwegian and foreign holiday and leisure traffic in Norway. Margrethe Helgebostad
 Forecast for Norwegian and foreign holiday and leisure traffic in Norway Margrethe Helgebostad 1 Optimism at the start of the summer season there are many signs that the fifth summer season in a row with
182ND SESSION OF THE COUNCIL
 International Civil Aviation Organization FI-WP/675 19/11/07 WORKING PAPER 182ND SESSION OF THE COUNCIL FINANCE COMMITTEE Subject No. 3 Financial matters for consideration and approval by the Finance Committee
Digest of International Travel and Tourism Statistics 2017
 Vol. 44 Republic of Mauritius Digest of International Travel and Tourism Statistics 2017 Ministry of Finance and Economic Development Statistics Mauritius October 2018 (Price: Rs 75.00) DIGEST OF INTERNATIONAL
1.0 Introduction Zambia s Major Trading Partners Zambia s Major Export Markets... 4
 Bank of Zambia CONTENTS 1.0 Introduction... 3 2.0 Zambia s Major Trading Partners... 3 3.0 Zambia s Major Export Markets... 4 4.0 Major Source Countries Of Zambia s Imports... 5 5.0 Direction Of Trade
UWANDAE EXPO 2019 EVENT CONCEPT
 UWANDAE EXPO2019 EVENT CONCEPT UWANDAE EXPO 2019 EVENT CONCEPT TANZANIA S FIRST DOMESTIC TOURISM TRADE FAIR (INAUGURAL EVENT) 15th 17th FEBRUARY 2019 THE NATIONAL MUSEUM GROUNDS, DAR ES SALAAM PREPARED
Netherlands. Tourism in the economy. Tourism governance and funding
 Netherlands Tourism in the economy The importance of domestic and inbound tourism for the Dutch economy is increasing, with tourism growth exceeding the growth of the total economy in the last five years.
MAJOR AREAS OF TECHNICAL ASSISTANCE
 UNWTO Technical Assistance in Statistics and the Tourism Satellite Account (TSA) Vanessa Satur Programme Manager, Technical Cooperation and Services vsatur@unwto.org MAJOR AREAS OF TECHNICAL ASSISTANCE
From: OECD Tourism Trends and Policies Access the complete publication at: Mexico
 From: OECD Tourism Trends and Policies 2014 Access the complete publication at: http://dx.doi.org/10.1787/tour-2014-en Mexico Please cite this chapter as: OECD (2014), Mexico, in OECD Tourism Trends and
Tourism Statistics. Quarter Contact Statistician: Oabona Machete Tel: (267)
") Tourism Statistics Quarter 1 2016 Contact Statistician: Oabona Machete Email: omachete@statsbots.org.bw Tel: (267) 367 1484 Tourism Statistics Quater 1 2016 1 Published by; Statistics Botswana, Private
Tourism Statistics Quarter 1 2016 Contact Statistician: Oabona Machete Email: omachete@statsbots.org.bw Tel: (267) 367 1484 Tourism Statistics Quater 1 2016 1 Published by; Statistics Botswana, Private
Nigeria: Tourism Market Insights 2017
 6,8% 54,1% 45,9% 93,2% Nigeria: Tourism Market Insights 217 About Nigeria According to Nielson (217), Nigeria is home to over 25 ethnic groups divided on religious, socioeconomic, and political lines.
Country Profile: Kenya 2017
 Country Profile: Kenya 217 1. Global Tourism Performance of Kenya Domestic tourism is the major driving force of the Kenyan tourism sector. The total number of domestic trips rose from 18.1 million in
International Arrivals in Africa 2017 Jan-Jul Year to Date Forward looking 2017 Aug-Dec
 www. forwardkeys. com International Arrivals in 2017 Jan-Jul Year to Date Forward looking 2017 Aug-Dec Special Focus on East n Community (EAC) August 2017 Know tomorrow s travellers 2017YTD: the Americas,
Regional Conference on Air Transport. 02/03 May 2013
 Regional Conference on Air Transport 02/03 May 2013 7 May 2013 1 PRESENTATION BY SARUPANAND KINNOO Ag DIRECTOR OF CIVIL AVIATION 7 May 2013 2 OUTLINE AIR TRANSPORT CHICAGO CONVENTION BILATERAL AIR SERVICES
Report on Target Market Trends
 Report on Target Market Trends Strengthening Tour Operator Associations in Bhutan and Costa Rica, a Bilateral Project Implemented by Association of Bhutanese Tour Operators and Ecole Experience under the
THE DEPARTMENT OF ECONOMIC DEVELOPMENT, ENVIRONMENTAL AFFAIRS AND TOURISM EASTERN CAPE ANNUAL TOURISM BAROMETER 2015
 THE DEPARTMENT OF ECONOMIC DEVELOPMENT, ENVIRONMENTAL AFFAIRS AND TOURISM ANNUAL TOURISM BAROMETER 2015 INNOVATION FOR SUSTAINABLE DEVELOPMENT WWW.DEDEA.GOV.ZA ANNUAL TOURISM BAROMETER 2015 s HIGHLIGHTS
BUSINESS OPPORTUNITIES IN TANZANIA
 BUSINESS OPPORTUNITIES IN TANZANIA FACT PACK June 2015 Business Sweden in Nairobi TANZANIA BRIEF FACTS BASIC FACTS Population: 49,639,138 (2014) Area: 947,300* sq. km Capital: Dar es Salaam Languages:
TABLE OF CONTENTS. TOURIST EXPENDITURE 31 Average Spend per Person per Night ( ) 31 Tourist Expenditure per Annum ( ) 32
 31 Tourist Expenditure per Annum ( ) 32") FALKLAND ISLANDS International Tourism Statistics Report 2013 2 3 4 TABLE OF CONTENTS PAGE INTRODUCTION 6 KEY FACTS AND FIGURES 7 INBOUND TOURISM (OVERNIGHT VISITORS) 8 TOURIST ARRIVALS 8 Tourist Arrivals
FALKLAND ISLANDS International Tourism Statistics Report 2013 2 3 4 TABLE OF CONTENTS PAGE INTRODUCTION 6 KEY FACTS AND FIGURES 7 INBOUND TOURISM (OVERNIGHT VISITORS) 8 TOURIST ARRIVALS 8 Tourist Arrivals
2015 VISITOR ARRIVALS SUMMARY
 2015 VISITOR ARRIVALS SUMMARY 1. Arrivals Summary: Despite some challenges, Papua New Guinea received over 198,685 international visitors in 2015, an increase of 4% or additional 7,000 arrivals compared
Africa attractiveness program 2017 Country profiles. 2 June 2017
 Africa attractiveness program 07 Country profiles June 07 The key economies attract the largest share of FDI Countries ranked by FDI projects 0 - (project numbers below are data) South Africa Nigeria Morocco
Hotel Establishments Statistics. First Half, September 2014
 Hotel Establishments Statistics First Half, 2014 September 2014 Hotel Establishments Statistics First Quarter, 2014-2013 161 Table of Contents Introduction 3 Key Points 4 Hotel Establishments 5 Number
TOURISM PERFORMANCE HIGHLIGHTS 2016
 TOURISM PERFORMANCE HIGHLIGHTS 2016 Foreword As the tourism marketing arm of the South African Government, South African Tourism has developed an integrated marketing strategy that focuses on leisure and
KEY TRENDS IN TOURISM IN AFRICA 41ST ANNUAL WORLD TOURISM CONFERENCE, KIGALI, RWANDA CHRISTY TAWII, RESEARCH ANALYST
 KEY TRENDS IN TOURISM IN AFRICA 41ST ANNUAL WORLD TOURISM CONFERENCE, KIGALI, RWANDA CHRISTY TAWII, RESEARCH ANALYST ABOUT EUROMONITOR INTERNATIONAL GLOBAL OVERVIEW AFRICA S PERFORMANCE REVIEW TOURISM
Magnitude of Tourism
 Magnitude of Tourism 63 Index of Tables Sr.No. Table No. Page No. 1 Table 1 Total Tourist arrivals to Gujarat (2002-2011) 68 2 Table 2 Contribution of Tourism in Gujarat to State GDP 71 3 Table 3 Domestic
World Tourism Organization
 World Tourism Organization Madrid, May 2011 Original: English UNWTO COMMISSION FOR AFRICA Fifty-first meeting Ouagadougou, Burkina Faso, 6 June 2011 Item 6.1 of the provisional agenda REPORT OF THE SECOND
Tourism in numbers
 Tourism in numbers 2013-2014 Glenda Varlack Introduction Tourism is a social, cultural and economic experience which involves the movement of people to countries or places outside their usual environment
POST SHOW REPORT 2012
 WOP DUBAI 2012 INTERNATIONAL PERISHABLES EXPO MIDDLE EAST WORLD OF PERISHABLES WOP DUBAI UAE 2012 POST SHOW REPORT 2012 19-21 2012 NOVEMBER DUBAI WORLD TRADE CENTRE An event organized by: FROM THE ORGANIZERS
Changi Airport Group releases FY2011/12 Annual Report
 Media Release Changi Airport Group releases FY2011/12 Annual Report SINGAPORE, 14 September 2012 Changi Airport Group (CAG) today released its annual report for the financial year ended 31 March 2012 (FY11/12).
WORKSHOP ON COMPILATION OF INTERNATIONAL MERCHANDISE TRADE STATISTICTS ADDIS ABABA, 8-11 NOVEMBER, 2004 COUNTRY REPORT
 WORKSHOP ON COMPILATION OF INTERNATIONAL MERCHANDISE TRADE STATISTICTS ADDIS ABABA, 8-11 NOVEMBER, 2004 COUNTRY REPORT BY: SALEH MZEE SALEH THE CHIEF GOVERNMENT STATISTICIAN (OCGS) ZANZIBAR- TANZANIA NOVEMBER,
US $ 1,800 1,600 1,400 1,200 1,000
 IATA ECONOMIC BRIEFING JULY 9 INFRASTRUCTURE COSTS SUMMARY Historical data indicates that during recession periods infrastructure providers usually increase their prices while other prices are falling
Sub-Regional Workshop on the Development and Effective Use of Intellectual Property Statistics for ARIPO Member States
 Sub-Regional Workshop on the Development and Effective Use of Intellectual Property Statistics for ARIPO Member States FERNANDO DOS SANTOS DIRECTOR GENERAL Meikles Hotel, Harare, Zimbabwe September 14,
International Travel Management Study 2018
 International Travel Management Study 2018 Part 1 Business Travel Outlook Expect more trips and higher spend. Executives are packing their suitcases and flying around the world to do business for their
Tourism Sector Performance. Report
 Tourism Sector Performance Report - 2018 Hon. Najib Balala, EGH CS, Tourism and Wildlife This report gives overall performance of Kenya s tourism sector in 2018 highlighting mainly: International tourist
Tourism Trends, Outlook and Issues. John G.C. Kester. 6th UNWTO/PATA Forum on Tourism Trends and Outlook. Guilin, China October 2012 day 1
 Tourism Trends, Outlook and Issues 6th UNWTO/PATA Forum on Tourism Trends and Outlook Guilin, China 11-13 October 212 day 1 John G.C. Kester Programme Manager, Tourism Trends and Marketing Strategies World
Global travel patterns: an overview
 Journal of Travel Medicine, 2017, 1 5 doi: 10.1093/jtm/tax007 Perspective Perspective Global travel patterns: an overview Dirk Glaesser*, John Kester, Hanna Paulose, Abbas Alizadeh, and Birka Valentin
20 th. POST SHOW REPORT June Kenyatta Int l. Convention Centre, Nairobi, Kenya
 20 th 2017 East Africa s Largest International Trade Exhibition On Multi-Sector Products, Equipment & Machinery POST SHOW REPORT 02-04 June Kenyatta Int l. Convention Centre, Nairobi, Kenya EXPOGROUP Supports
africa s hospitality market
 africa s hospitality market Year in Review 2016 Ghana Nigeria Ethiopia Addis Ababa Kenya In this issue 3 Introduction Windhoek Zambia Lusaka Gabarone Pretoria Dar es Salaam Hahare Namibia Zimbabwe Botswana
TOURISM PERFORMANCE HIGHLIGHTS QUARTER
 TOURISM PERFORMANCE HIGHLIGHTS QUARTER 1 2017 Foreword As the tourism marketing arm of the South African Government, South African Tourism has developed an integrated marketing strategy that focuses on
A rising ELICOS tide lifts all international education ships. So how do we navigate for future success?
 A rising ELICOS tide lifts all international education ships. So how do we navigate for future success? Brett Blacker English Australia AIEC 2015 1 The rising tide. Global context Data and trends Policy
AFRICA. Cape Town, April Experience the World
 AFRICA Cape Town, 10 12 April 2019 Experience the World at WTM Africa 2019 Why WTM Africa? In the Host City of Cape Town Takes place in April every year - the optimal time in the Travel Industry s buying
Opportunities and Risks in Africa
 Opportunities and Risks in Africa Africa is not a country Note: Graphic layout for visualization only (some countries are cut and rotated) Source: Creative Commons. Africa at a glance 212 Total GDP: $2.1
MICE (Meetings, Incentives, Conventions and Exhibitions)
") !!"#$%& Hong Kong's position in MICE market challenged ==`ÜäçÉ=i~ì!"#$%&E!!"F!!"#$%&'()*+,-./012!"#$%&'()*+,-./&012345!"#$%&'()*+,-./0123)*4!"#$%&'!"#$%&'()*+&!"#$%&'()*+,)-./01"234!"#$%&'!()*+,-./01!234!"#$%&'())*+,!"#$%&!"
!!"#$%& Hong Kong's position in MICE market challenged ==`ÜäçÉ=i~ì!"#$%&E!!"F!!"#$%&'()*+,-./012!"#$%&'()*+,-./&012345!"#$%&'()*+,-./0123)*4!"#$%&'!"#$%&'()*+&!"#$%&'()*+,)-./01"234!"#$%&'!()*+,-./01!234!"#$%&'())*+,!"#$%&!"
The Economic Impact of Emirates in the United States. Prepared by:
 Prepared by: www.av-econ.com Alexandria, Virginia July 2017 EXECUTIVE SUMMARY About Emirates Emirates Airline (Emirates), based in Dubai, United Arab Emirates (U.A.E.), was established in 1985 and since
INTERNATIONAL TRAVEL TRADE SHOW OF MALDIVES 1-3 MAY 2018 SECOND YEAR ISIT? Find out more. traveltrademaldives.com
 INTERNATIONAL TRAVEL TRADE SHOW OF MALDIVES HY ISIT? Find out more traveltrademaldives.com 1-3 MAY 2018 SECOND YEAR BOUT TM The first International Travel Trade Show (TTM 2017) concluded with immense support
Table of Contents. Acknowledgements. Executive Summary. Introduction Scope of the Study. 1 Introduction to Russia
 Table of Contents Acknowledgements Executive Summary Introduction Scope of the Study 1 Introduction to Russia 1.1 Country Overview 1.1.1 Geographical and Cultural Diversity 1.1.2 Wealth of Mineral Resources
POST SHOW REPORT September Kenyatta Int l. Convention Centre, Nairobi, Kenya
 st 21 2018 East Africa s Largest International Trade Exhibition On Multi-Sector Products, Equipment & Machinery POST SHOW REPORT 04-06 September Kenyatta Int l. Convention Centre, Nairobi, Kenya EXPOGROUP
WHAT IS MEETINGS AFRICA?
 WHAT IS MEETINGS AFRICA? Meetings Africa is a Pan-African Business Events Trade Show, which has been in existence for 12 years. The Trade Show was born in response to the global meetings industry s growing
Hotel Establishments Statistics April 2013
 Hotel Establishments Statistics 2011-2012 April 2013 16 Table of Contents Introduction... 3 Key Points... 4 Hotel Establishments... 5 Number of Guests... 7 Guest Nights... 9 Average Length of Stay... 10
Tourism Sector Development: JICA s Approach
 Tourism Sector Development: JICA s Approach April 26, 2013 Japan International Cooperation Agency (JICA) JICA s Vision and Mission Mission1 Addressing global agenda Vision Inclusive and Dynamic Development
EXPOGROUP Supports The GO GREEN Campaign Across The Globe. Grow A Plant Every Weekend And Enjoy It Grow!
 21 st KENYA A F R I C A 2 0 1 8 East Africa s Largest International Trade Exhibition On POST SHOW REPORT 03-05 May 2018 Kenyatta Int l. Convention Centre, Nairobi EXPOGROUP Supports The GO GREEN Campaign
Tourist Statistical Report 2012 and 2013
 Tourist Statistical Report 212 and 213 October 214 Produced by the Directorate of Tourism Private Bag 1336 Levinson Arcade Capital Centre Building, 4th floor Windhoek, Namibia Tel +264 61 284233/2259 Fax:
PREMIUM TRAFFIC MONITOR JULY 2014 KEY POINTS
 PREMIUM TRAFFIC MONITOR JULY 2014 KEY POINTS Growth in international air passengers was weak for a second consecutive month with a 2.6% increase in July compared to a year ago premium seat numbers rose
Tourism as an Economic Pillar. Mary Vrolijk 25 September 2015
 Tourism as an Economic Pillar Mary Vrolijk 25 September 2015 Tourism Trends. Tourism: a key role player in economies. Spinoff effects: Job creation, New small and medium enterprises(sme s), Country competiveness,
International Marketing Strategy for the Tanzania Tourist Board (TTB)
") International Marketing Strategy for the Tanzania Tourist Board (TTB) focused on the UK-Market commissioned by Africa Oracle produced by the University of Derby, UK written by Emma Pope and Matthias Jessl
International Marketing Strategy for the Tanzania Tourist Board (TTB) focused on the UK-Market commissioned by Africa Oracle produced by the University of Derby, UK written by Emma Pope and Matthias Jessl
International Visitation to the Northern Territory. Year ending March 2017
 International Visitation to the Northern Territory Year ending March 217 The following is a summary of information relevant to the Northern Territory tourism industry including visitation results from
Frankfurt am Main. The world s leading trade fair for lighting and building services technology. Inspiring tomorrow.
 18 23. 3. 2018 Frankfurt am Main The world s leading trade fair for lighting and building services technology Inspiring tomorrow. 2 Digital future meets design hotspot: Showcase your offer at Light + Building
Tourism Development of the RA Vision Strategy Action plan 2017
 Tourism Development of the RA Vision Strategy Action plan 2017 State Committee for Tourism of the Ministry of Economic Development and Investment of Armenia AGENDA Statistics State policy goals, objectives
A F R I C A. POST SHOW REPORT AUGUST Mlimani Conference Centre, Dar-es-Salaam, Tanzania
 rd 03 2017 SOLAR A F R I C A East Africa s Largest International Trade Exhibition on Solar Products Equipments & Machinery POST SHOW REPORT 16-18 AUGUST Mlimani Conference Centre, Dar-es-Salaam, Tanzania
THE AFRICAN DEVELOPMENT BANK GROUP. At the centre of Africa s transformation
 THE AFRICAN DEVELOPMENT BANK GROUP At the centre of Africa s transformation African Development Bank Group At the centre of Africa s transformation The African Development Bank Group is a multilateral
The Role of Gauteng in South Africa s Backpacking Economy
 The Role of Gauteng in South Africa s Backpacking Economy Jonathan Brandon Mograbi Dissertation submitted to the Faculty of Science of the University of the Witwatersrand, Johannesburg, in fulfilment of
POVERTY REDUCTION THROUGH COMMUNITY-BASED TOURISM IN VIET NAM: A CASE STUDY
 POVERTY REDUCTION THROUGH COMMUNITY-BASED TOURISM IN VIET NAM: A CASE STUDY A paper contributed by the ITC Export-led Poverty Reduction Programme Team (EPRP) POVERTY REDUCTION THROUGH COMMUNITY-BASED TOURISM
AIR PASSENGER MARKET ANALYSIS
 AIR PASSENGER MARKET ANALYSIS OCTOBER 2014 KEY POINTS Air travel volumes were up 5.7% in October year-on-year, slightly stronger than the September rise of 5.2%, and a continuation of the positive growth