FINAL REPORT APRIL 2016
|
|
|
- Frank Stevens
- 5 years ago
- Views:
Transcription
 and the North Pacific Marine Science Organization (PICES), under an award to the University of Hawai i, Social")
1 APRIL 2016 FINAL REPORT Japanese Tsunami Marine Debris Aerial Imagery Analysis and GIS Support Hawai i Coral Reef Initiative This publication is a result of funding from the Ministry of the Environment of Japan, through Hawai i Department of Land and Natural Resources (DLNR) and the North Pacific Marine Science Organization (PICES), under an award to the University of Hawai i, Social Science Research Institute, Hawai i Coral Reef Initiative.
2 CONTENTS SECTION 1: BACKGROUND... 2 Marine Debris and the Japanese Tsunami... 2 Marine Debris Accumulation in Hawaii... 2 Marine Debris Impact... 3 Previous Aerial Marine Debris Mapping of the Main Hawaiian Islands... 3 SECTION 2: PROJECT OVERVIEW... 4 Project Purpose... 4 Project Objective... 4 Deliverables/Outcomes... 4 SECTION 3: METHODS... 5 Aerial Imagery Collection and Processing... 5 Marine Debris Classifications and Categories... 5 GIS Analysis... 6 Marine Debris Identification... 7 Quality Control... 8 SECTION 3: RESULTS... 9 Lāna i Ni ihau Kaua i Hawai i Island Maui Moloka i Kaho olawe O ahu Main Hawaiian Islands NEXT STEPS APPENDIX Appendix A. Additional Maps Appendix B. Examples of types of marine debris Appendix C. Quality Control Protocols
3 SECTION 1: BACKGROUND Marine Debris and the Japanese Tsunami Marine debris is defined as any persistent solid material that is manufactured or processed and directly or indirectly, intentionally or unintentionally, disposed of or abandoned into the marine environment or the Great Lakes. 1 On March 11, 2011, the Tohoku Earthquake and resulting tsunami devastated Japan, claiming human lives and damaging coastal infrastructure, which in turn created millions of tons of debris. Much of this debris was swept back into the ocean, and items buoyant enough to float can travel thousands of miles driven by wind and current. 2 Hawai i is one destination for this debris. Marine Debris Accumulation in Hawaii Several oceanographic processes, including gyres, eddies, and meanders, drive the movement and accumulation of marine debris. Hawai i is located in the center of the North Pacific Subtropical Convergence Zone, largely affected by the Central Pacific Gyre. 3 This gyre is powered by four major ocean currents that stretch across the north Central Pacific Ocean from Japan to California. 4 Because a circulating body of water collects debris in its center, the coastlines of Hawai i receive significant quantities of debris each year. The first confirmed item of Japanese tsunami-linked marine debris in Hawai i, a blue plastic fishing container, was recovered on September 18, 2012 off Makapu u, O ahu. 5 Since 2012, a number of debris items have been intercepted by the state of Hawai i, including 21 vessels and an assortment of buoys, fishing containers, signs, and other items. 6 1 PIFSC Main Hawaiian Islands Derelict Fishing Gear Survey. NOAA Fisheries Pacific Islands Fisheries Science Center, PIFSC Special Publication, SP Ghaderi, Z., & Henderson, J Japanese tsunami debris and the threat to sustainable tourism in the Hawaiian Islands. Tourism Management Perspectives, NOAA Office of Response and Restoration Marine Debris Program How Debris Accumulates. Accessed 12/3/ Ribic, C., Sheavly, S., Rugg, D., & Erdmann, E Trends in marine debris along the U.S. Pacific Coast and Hawai'i Marine Pollution Bulletin, Department of Land and Natural Resources Marine Debris. Accessed 12/3/ Department of Land and Natural Resources Division of Aquatic Resources Marine Debris Coordinator. Personal Communication. 2
4 Marine Debris Impact Marine debris can have numerous impacts on natural environments, many of them detrimental to the overall health of the ecosystem. Wildlife are known to become entangled in debris such as net and line, or mistakenly ingest other debris items that they confuse for food, and incidents such as these can lead to various complications that may ultimately be fatal. 7 Marine debris also damages crucial habitat through its movement and accumulation in coastal areas, which can be particularly harmful to reef habitats through breakage of corals and substrate as wind and wave action forces it across reef structures. 8 Less understood is the potential for marine debris to act as a vector in the transport of aquatic invasive species (AIS) through a process known as rafting. As an example, a 188-ton dock arrived on Oregon shores in 2012 carrying over 100 different species from Japan. 2 These AIS can become established and outcompete and overwhelm the native ecosystem. Impacts of marine debris affect humans as well, with debris presenting a hazard to personal and boating safety, and marring beaches that attract economic income through tourism. 2 The unique environment and tourism-based economy of the Hawaiian Islands could suffer greatly from the effects of marine debris. Previous Aerial Marine Debris Mapping of the Main Hawaiian Islands In 2006 and 2008, the NOAA Pacific Islands Fisheries Science Center (PIFSC) Coral Reef Ecosystem Division (CRED) conducted oblique-angle aerial surveys of derelict fishing gear (DFG) in the Main Hawaiian Islands. 1 The surveys were performed from Hughes 500 helicopters flying at knots at altitudes of 31-92m. Observers recorded data while in-flight when DFG was identified, noting its color, size class, and type of material. The 2006 NOAA aerial survey identified 711 individual DFG sites throughout the Main Hawaiian Islands (surveyed islands included Kaua i, O ahu, Lāna i, Maui, Moloka i, and Hawai i Island). This project also included the removal of 225 piles of DFG from O ahu and 156 piles of DFG from Lāna i, a total of 16 and 17.4 metric tons respectively. Aerial survey methodology was repeated in 2008, and identified 1086 individual DFG sites. The increase from the 2006 study is thought to be reflective of refined flying methods, rather than a result of higher accumulation rates. It was also noted that on islands where removal efforts had not taken place, the size class of DFG was generally larger. This was attributed to smaller debris piles becoming tangled together over time, leading to massive accumulations of net and rope. 7 Sheavly, S., & Register, K. (2007). Marine Debris & Plastics: Environmental Concerns, Sources, Impacts and Solutions. Journal of Polymers and the Environment, Donohue, M., Boland, R., Sramek, C., & Antonelis, G. (2001). Derelict Fishing Gear in the Northwestern Hawaiian Islands: Diving Surveys and Debris Removal in 1999 Confirm Threat to Coral Reef Ecosystems. Marine Pollution Bulletin,
5 SECTION 2: PROJECT OVERVIEW Project Purpose In order to characterize the potential ecological consequence of tsunami debris, it is important to characterize the debris itself. Understanding the type, size, and location of debris accumulating on Hawaiian coastlines is crucial in developing plans to streamline the removal process and mitigate any negative impacts this debris may have on the islands and their inhabitants. Given the vast extent and remoteness of coastlines in the Hawaiian Islands, large scale surveillance efforts are necessary to identify and describe these accumulations. Capture and analysis of high-resolution aerial imagery allows for rapid qualitative and quantitative assessments at this scale, providing data that can be used to plan further management actions and evaluate marine debris accumulation patterns in Hawai i. Project Objective The objective is to document and describe marine debris on coastlines of the Main Hawaiian Islands by using high-resolution aerial imagery paired with ArcGIS mapping software to locate, quantify, and categorize debris accumulations. Deliverables/Outcomes ArcGIS point shapefiles showing marine debris locations, with supporting attribute tables ArcGIS coastline shapefiles showing overall debris density and distribution, with supporting attribute tables Additional maps, figures, and tables displaying debris density, type, and size data Summary report of findings 4
6 SECTION 3: METHODS The project was carried out in multiple phases, beginning with the collection and processing of highresolution aerial imagery of coastlines of the Main Hawaiian Islands to create ArcGIS image files. The second phase was to analyze this imagery using ArcGIS software to identify, quantify, and categorize marine debris accumulations along coastlines of the Main Hawaiian Islands. The final phase involved using the collected data to generate maps and figures displaying marine debris composition, density, and distribution for each island, as well as statewide. Aerial Imagery Collection and Processing Resource Mapping Hawai i (RMH) was contracted by PICES and Hawai i Department of Land and Natural Resources (DLNR) to produce high resolution ortho-imagery of the coastlines of the main eight islands. Aerial surveys were conducted from a Cessna 206 between August and November Using an array of three DSLR cameras, multiple photos were captured every 0.7 seconds while flying at an average ground speed of 85 knots per hour. The cameras were mounted on a three-axis stabilizer gimbal to ensure that photos were taken within 4 degrees of crab, roll and pitch angles. The mapping system also includes differential GPS to collect latitude, longitude and altitude data. The surveys had a target altitude of 2,000 feet above ground level to achieve a ground resolution of two centimeters per pixel and a swath width between meters. Areas where flight restrictions apply, such as military bases and airports, were excluded from the imagery collection process. Using custom photogrammetry software, the aerial photos were mosaicked and ortho-rectified to an accuracy of five meters RMS, then divided into GeoTIFF raster tiles for use in ArcGIS. Marine Debris Classifications and Categories Marine debris type was classified into seven categories (Table 1) prior to GIS analysis. These categories were designed to characterize debris found on shorelines, as different debris types can pose different threats to the marine environment. For example, net and line pose a serious entanglement hazard, while small plastics and foam are more likely to be mistakenly ingested by wildlife. While there are limitations on the ability to determine debris types at this scale, categorization of identifiable debris is useful to determine trends in debris accumulation. If a piece of debris was made up of more than one type of material, the main material was listed and the additional materials were included as a comment. Debris was also categorized by size class (Table 2). Size was measured as the approximate area of the object in meters squared, and four size classes were delineated ranging from less than 0.5 square meters to over 2 square meters. Object size was estimated using the measurement tool within ArcGIS. 5
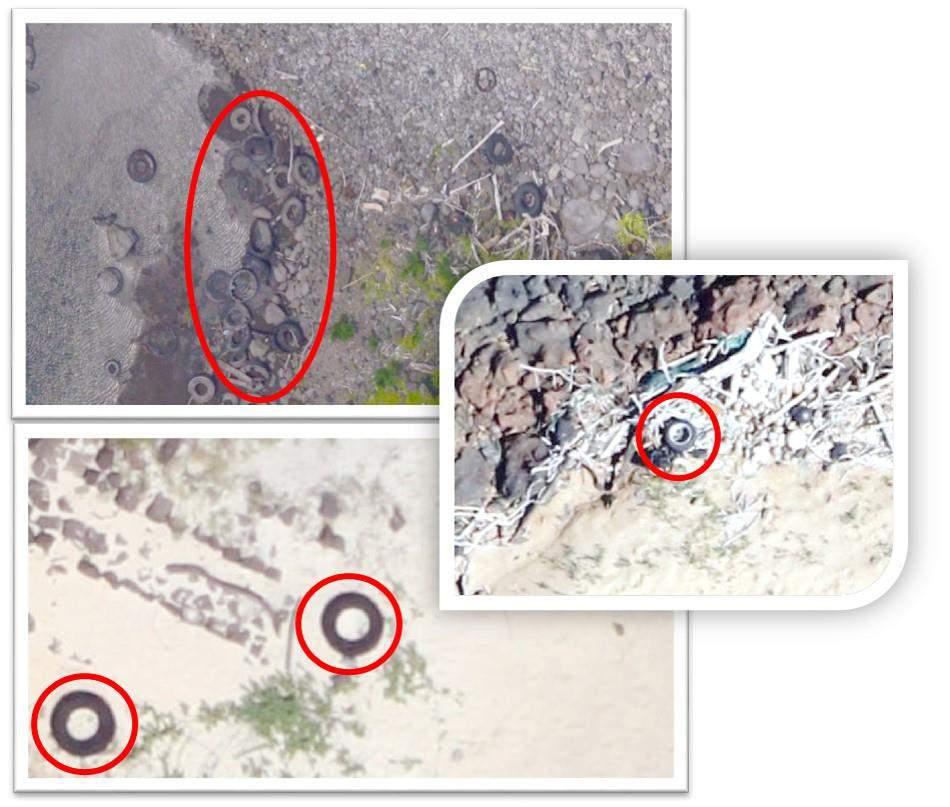
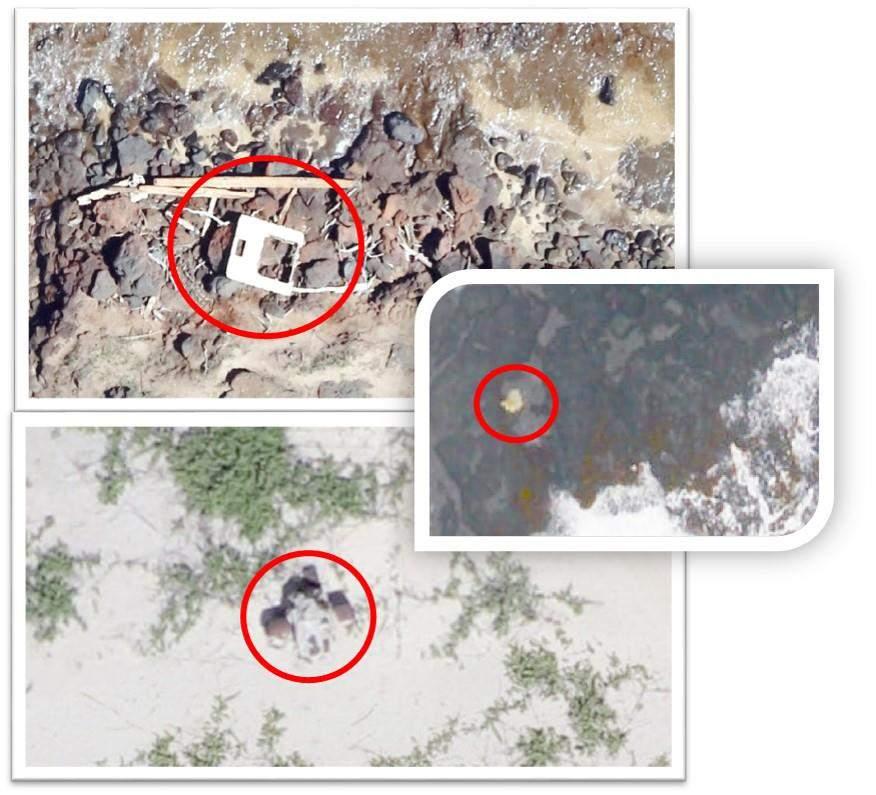
7 Table 1. Seven categories of marine debris material observed in the aerial imagery. See Appendix B for image examples of each category. Type Code Description Buoys and Floats Foam Derelict Fishing Gear Plastic Tires Other Inconclusive B F N P T O I Any float used for mooring, as a buffer for boats, marking a channel, or fishing. Can be plastic, glass, rubber, foam or metal and can range in size. Large blocks used as floats, insulation and packaging material. Foam will often vary in shape and size. Color typically ranges from white to yellow-orange. Derelict fishing gear includes nets and line (single pieces of rope, fishing line, tangled rope, string, twine, and any other type of rope that is not woven into netting). All drums, jugs, tubs, buckets, bins, plastic chairs, plastic pallets, tables, gardening items, outdoor equipment like fins and masks, vehicle parts like bumpers and seats, as well as unidentifiable or broken pieces of plastic. Variable colors, shapes, and sizes with a majority of objects being white. This category includes full tires and tire treads that have been repurposed as boat bumpers. Other includes the categories of processed wood, metal, cloth, and vessels: Wood is any wood-based product such as lumber, furniture, crates, pallets, wooden docks, and ply board. This category does not include fallen logs, tree branches, or any wood material that has not been altered by humans. Metal can include sheet metal, metal drums, tanks, machinery, appliances, and metal piping. Cloth includes sheets, sails and canvas, upholstered furniture, and carpet. Vessels are abandoned boats and boat fragments. If an item was clearly marine debris but it was not possible to determine the material category, the item was marked as inconclusive. Table 2. Size classes used to classify items of marine debris. Size Class Area Measurement Very small < 0.5 m 2 Small m 2 Medium m 2 Large > 2 m 2 GIS Analysis Line shapefiles were created to divide each island s coastline into one-mile-long segments, and tile outlines of polygon shapefiles were created for each of the imagery raster tiles, thus matching the aerial imagery files to the segment of coastline they depict (Figure 1). Analysis was conducted on a segmentby-segment basis to ensure that each area of shoreline was systematically surveyed. Following completed analysis of each one-mile segment of shoreline, the segment was given a rating between 0 and 5, based on density and distribution of debris (Table 3). Total item count, dates completed, observer(s), and additional comments were recorded for each segment in addition to the density rating. 6

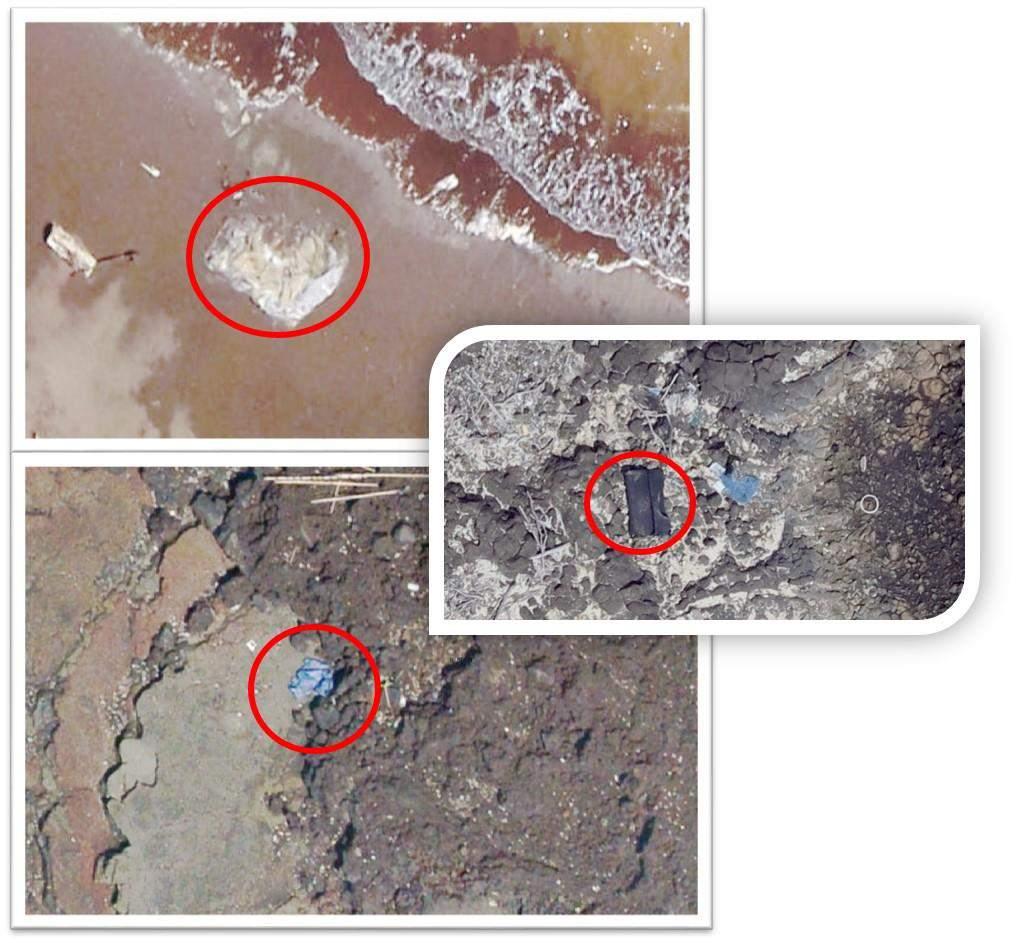
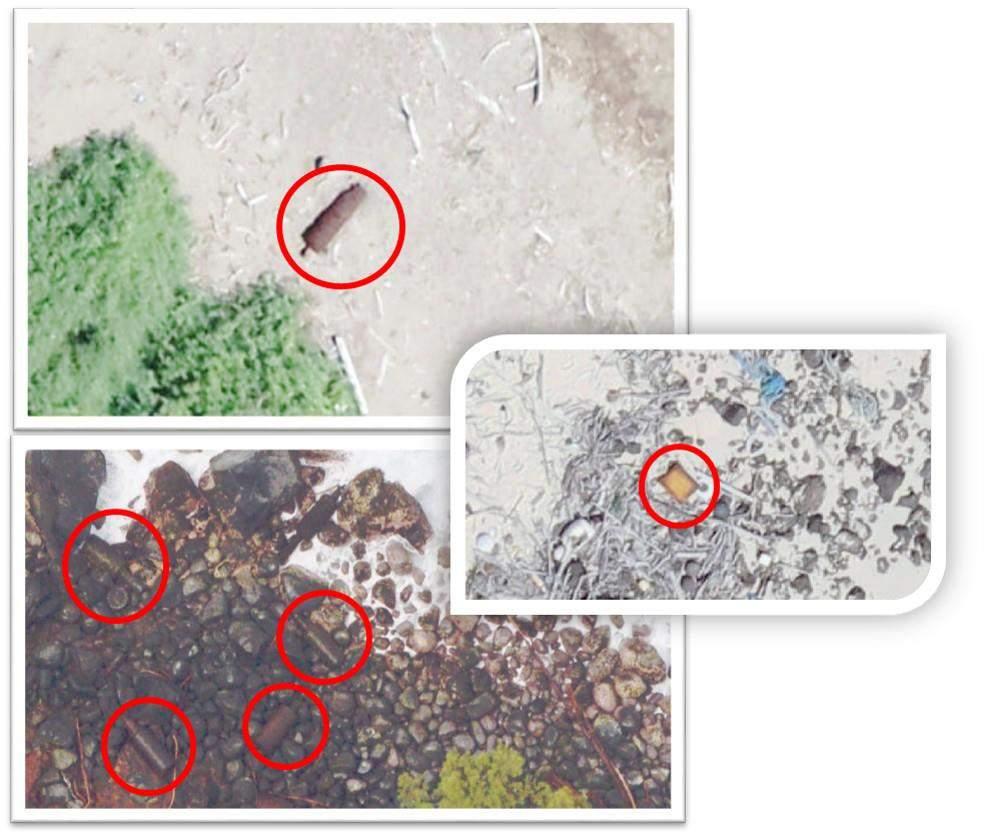
 Marine Debris Identification Point shapefiles were created by the analyst to mark each item of marine debris found (Figure 2).")
8 Figure 1. ArcGIS shapefiles depicting the Kaua i coastline segments and tile polygons, with example image tiles. Table 3. Definitions of debris density ratings given to each 1-mile segment of coastline. Rating Definition 0 No debris found pieces of debris pieces of debris pieces of debris pieces of debris (in pockets or aggregations) pieces of debris (evenly distributed) Marine Debris Identification Point shapefiles were created by the analyst to mark each item of marine debris found (Figure 2). A unique, sequential identification number was attributed to each item, starting at 1 within each one-mile segment of coastline. Descriptive data was then collected for each item, including location (latitude and longitude), type of debris, size class, any comments about the item, and the initials of the observer identifying the debris. Figure 2. Screenshot of identified marine debris on the Ni ihau coast displaying the identification number, line segment, and image tile file name. 7
9 Quality Control Quality control was performed for each coastline after analysis was completed, to assess the accuracy and precision of the data collection, identify potential errors, improve standardization of data collection between observers throughout the course of the project, and enhance confidence in the data. For each island, 20% of the segments were chosen at random to be re-analyzed by a different observer from the one who originally completed the segment. The result of the quality control process was the creation of standardized rules (Table 4), which were subsequently used to guide the marine debris identification process. See Appendix C for more information on quality control, and examples of results from Lāna i. Table 4. Standardized rules for marine debris identification that were used to ensure quality control. Question What counts as debris vs natural material? What is the minimum qualifying size for marine debris? How far inland should I count debris? What counts as evenly distributed? What if there is a concentrated spot of debris? What if I can t tell if an item is processed wood or driftwood? Answer Any object that is a natural color (white, beige, brown) has the potential to be a natural feature (coconut, driftwood, rock). Marine debris should be identified based on its shape (jagged edges, spherical, large objects), color (bright or unnatural colors), and size (can range, but very large objects are likely to be debris). If you can make out clear features of the target debris, then count it. If the object is < 0.2m 2 and ambiguous, disregard the item. On most sand beaches, there is a line of small items washed up by the tide. If there is debris seaward of the high tide line, count it. If it is clear that the waves have washed the debris past the high tide line (you can see water marks and a line of debris past the high tide line), then count it. If the debris is landward of the high tide line, disregard the item. When classifying the segments according to the density rating, evenly distributed means there are not clear gaps between debris accumulations, or there is equal spacing between debris throughout the segment. If there are clear areas of debris and no debris, the segment is aggregated rather than evenly distributed. If there is a clump or pile of debris, label each individual item as best you can. Marking each item is important for the final debris density statistics. If it has rounded edges, it is most likely driftwood. If it has square edges, it is probably processed. 8
10 SECTION 3: RESULTS 9
11 Lāna i Figure 3. Relative density of marine debris identified around the island of Lāna i. Distribution of Debris Marine debris was heavily concentrated on the northeast coast of the island (Figure 3). The highest density of debris was found in a segment on the eastern coast, which contained 386 items. Most of the segments on the south and west shores had fewer than 50 pieces of marine debris, with the exception of one segment, which contained 56 items. Type of Debris Imagery analysis identified a total of 1,829 pieces of marine debris around the coastline of Lāna i (Table 5). The most common type of the debris was plastic (53%) followed by items in the other category (includes processed wood, metal, cloth, and vessels) (14%), and derelict fishing gear (13%) (Figure 4). The remaining categories each contributed 8% or less to the total debris count. 10
12 Table 5. Number of items of each type of marine debris found around Lāna i. Material Count Plastic 969 Other 256 Derelict Fishing Gear 241 Buoys and Floats 150 Foam 130 Tires 71 Inconclusive 12 Total % Inconclusive Tires Foam Buoys and Floats Derelict Fishing Gear Other 50% Plastic 0% Composition of Marine Debris on Lāna i Figure 4. Composition of marine debris around Lāna i. Derelict Fishing Gear: nets and line; Other: processed wood, metal, cloth, and vessels. 11
13 Size of Debris The majority (86%) of marine debris around Lāna i fell into the smallest size classification of less than 0.5m 2 (Figure 5). The remaining size classes each contained 5% or less of the debris (Table 6). Table 6. Number of items of each size class found around Lāna i Classification Size Class (m 2 ) Count Very small < Small Medium Large > 2 79 SIZE OF MARINE DEBRIS ON LĀNA I Medium Large Small Very small Figure 5. Debris size distribution on Lāna i. Very Small: < 0.5 m 2, Small: m 2, Medium: 1 2 m 2, Large: >2 m 2. 12
14 Ni ihau Figure 6. Relative density of marine debris identified around the island of Ni ihau. 13
15 Distribution of Debris Ni ihau had the greatest debris densities on its east-facing shores, particularly on the northeastern corner and a portion of the coast further to the south (Figure 6). All segments on the western coast of the island had 175 or fewer items per one mile. The highest density of debris found was 1,137 items within a one-mile segment, which occurred along the southeastern coast. Three additional segments had a density greater than 600 items per one mile of coastline. Type of Debris A total of 7,871 debris items were identified around the coastline of Ni ihau (Table 7). The most common type of the debris was plastic (46%) followed by buoys and floats (25%), and derelict fishing gear (12%) (Figure 7). The remaining categories each made up 6% or less of the identified debris. Table 7. Number of items of each type of marine debris found around Ni ihau. Material Count Plastic 3665 Buoys and Floats 2000 Derelict Fishing Gear 975 Inconclusive 472 Tires 306 Other 239 Foam 214 Total
16 100% Foam Other Tires Inconclusive Derelict Fishing Gear Buoys and Floats 50% Plastic 0% Composition of Marine Debris on Ni ihau Figure 7. Composition of marine debris identified around Ni ihau. Derelict Fishing Gear: nets and line; Other: processed wood, metal, cloth, and vessels. 15
. Table 8. Number of items of each size class found around Ni ihau.")
17 Size of Debris The smallest category (less than 0.5m 2 ) made up the majority (87%) of marine debris around Ni ihau (Figure 8). The remaining size classes contributed 6% or less to the total debris count (Table 8). Table 8. Number of items of each size class found around Ni ihau. Classification Size Class (m 2 ) Count Very small < Small Medium Large > SIZE OF MARINE DEBRIS ON NI IHAU Small Medium Large Very small Figure 8. Debris size distribution on Ni ihau. Very Small: < 0.5 m 2, Small: m 2, Medium: 1 2 m 2, Large: >2 m 2. 16
18 Kaua i Figure 9. Relative density of marine debris identified around the island of Kaua i. Distribution of Debris On Kaua i, marine debris was most concentrated on eastern shores, particularly at the northern and southern extents (Figure 9). The highest density of debris was found in a segment on the northeast corner, which contained 276 pieces of debris per one mile of shoreline. Almost all segments on the north, west, and southern shores contained 25 or fewer pieces of debris per mile, with the exception of one segment along the south shore, which had a total of 35 pieces of debris. Type of Debris A total of 1,849 pieces of marine debris were identified around the coastline of Kaua i (Table 9). The most common type of the debris was plastic (49%) followed by buoys and floats (27%), and derelict fishing gear (13%) (Figure 10). All other categories each equaled 9% or less to the total debris count. 17
19 Table 9. Number of items of each type of marine debris found around Kaua i. Material Count Plastic 905 Buoys and Floats 310 Derelict Fishing Gear 239 Tires 172 Other 122 Inconclusive 55 Foam 46 Total % Foam Inconclusive Other Tires Derelict Fishing Gear Buoys and Floats 50% Plastic 0% Composition of Marine Debris on Kaua i Figure 10. Composition of marine debris identified around Kaua i. Derelict Fishing Gear: nets and line; Other: processed wood, metal, cloth, and vessels. 18
20 Size of Debris The majority (84%) of marine debris around Kaua i fell into the smallest size classification of less than 0.5m 2 (Figure 11). The next most common was 0.5-1m 2 (7%). The remaining size classes each contained 4% and 3% of the debris, respectively (Table 10). Table 10. Number of items of each size class found around Kaua i. Classification Size Class (m 2 ) Count Very small < Small Medium Large > 2 61 SIZE OF MARINE DEBRIS ON KAUA I Medium Large Small Very small Figure 11. Debris size distribution on Kaua i. Very Small: < 0.5 m 2, Small: m 2, Medium: 1 2 m 2, Large: >2 m 2. 19
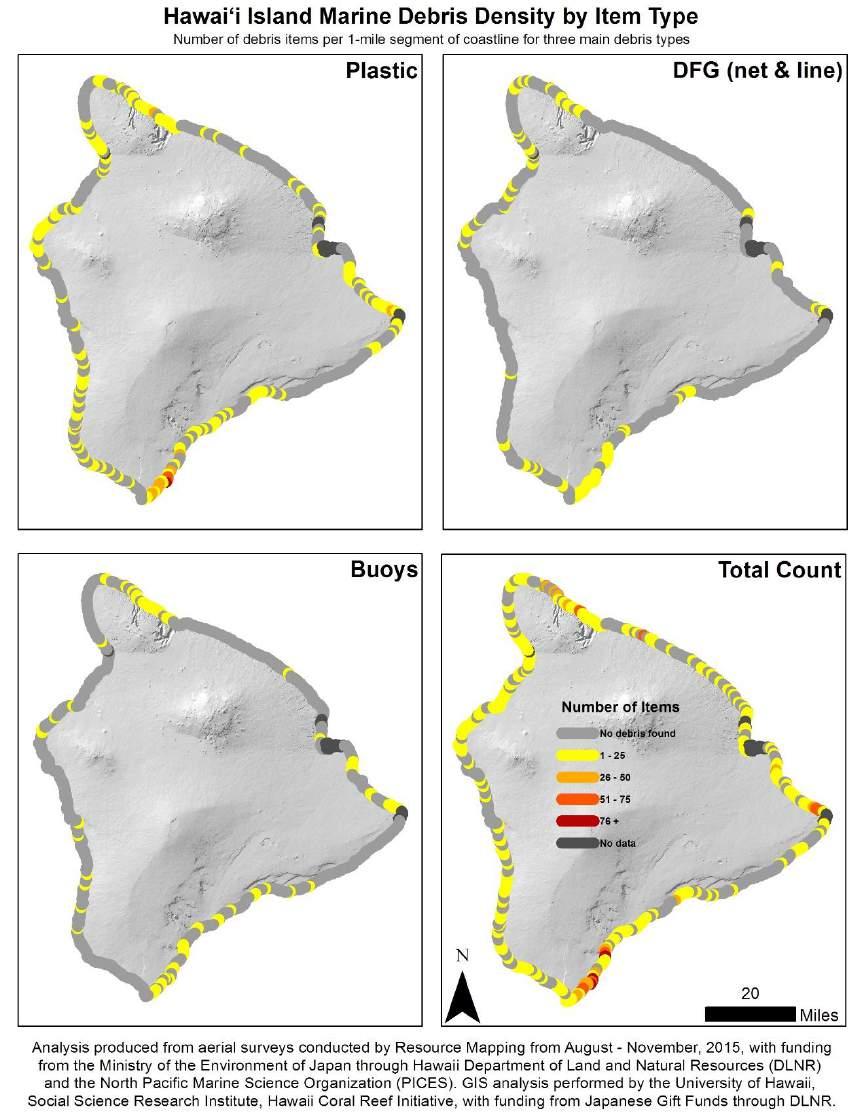
21 Hawai i Island Figure 12. Relative density of marine debris identified around the island of Hawai i. 20
22 Distribution of Debris Hawai i Island had the greatest debris densities near the Kamilo Point area, which is located on the southeastern tip of the island (Figure 12). Highest density of debris items identified was 129 pieces of debris per one-mile segment. All west-facing shores had 25 or fewer pieces of debris per one-mile segment of coast. Small portions of the eastern coast, particularly to the north, had relatively higher densities, but no density higher than 75 items per mile was found anywhere except for the Kamilo Point area on the southeastern tip. Type of Debris Imagery analysis identified a total of 2,200 pieces of marine debris around the coastline of Hawai i Island (Table 11). The most common type of the debris was plastic (52%) followed by buoys and floats (12%) (Figure 13). Inconclusive items and other category items, which includes processed wood, metal, cloth, and vessels, each contributed 9%, with the remaining categories each contributing 8% or less. Table 11. Number of items of each type of marine debris found around Hawai i Island. Material Count Plastic 1138 Buoys and Floats 271 Other 206 Inconclusive 194 Derelict Fishing Gear 180 Tires 134 Foam 77 Total
23 100% Foam Tires Derelict Fishing Gear Inconclusive Other Buoys and Floats 50% Plastic 0% Composition of Marine Debris on Hawai i Island Figure 13. Composition of marine debris around Hawai i Island. Derelict Fishing Gear: nets and line; Other: processed wood, metal, cloth, and vessels. 22
. Table 12. Number of items of each size class found around Hawai i Island.")
24 Size of Debris 85% of the debris found on Hawai i Island fell into the smallest size classification of less than 0.5m 2 (Figure 14). All other size classes each contained 6% or less of the debris (Table 12). Table 12. Number of items of each size class found around Hawai i Island. Classification Size Class (m 2 ) Count Very small < Small Medium Large > 2 78 SIZE OF MARINE DEBRIS ON HAWAI I ISLAND Medium Large Small Very small Figure 14. Debris size distribution on Hawai i Island. Very Small: < 0.5 m 2, Small: m 2, Medium: 1 2 m 2, Large: >2 m 2. 23
25 Maui Figure 15. Relative density of marine debris identified around the island of Maui. Density and Distribution of Debris Maui had the greatest debris density on the northern coast, particularly to the west where the coastline slopes south toward Kahului Bay (Figure 15). The segment with the highest density was also located in this area, with a total of 116 debris items within one mile. Only one other segment, located along the southern coast, contained a density greater than 100 pieces of debris per mile. All but two segments on the southern and western coasts of the island contained 20 or fewer pieces of debris per mile. Type of Debris A total of 1,749 marine debris items were found around the Maui coastline (Table 13). The most common type of debris was plastic (40%) followed by buoys and floats (25%), and inconclusive items (10%) (Figure 16). The remaining categories each made up 8% or less of the debris composition. 24
26 Table 13. Number of items of each type of marine debris found around Maui. Material Count Plastic 702 Buoys and Floats 445 Inconclusive 167 Other 145 Foam 124 Derelict Fishing Gear 86 Tires 80 Total % Tires Derelict Fishing Gear Foam Other Inconclusive 50% Buoys and Floats Plastic 0% Composition of Marine Debris on Maui Figure 16. Composition of marine debris identified around Maui. Derelict Fishing Gear: nets and line; Other: processed wood, metal, cloth, and vessels. 25
27 Size of Debris Most (87%) of the marine debris around Maui fell into the smallest size classification of less than 0.5m 2 (Figure 17). The remaining size classes each contributed 6% or less to the total debris count (Table 14). Table 14. Number of items of each size class found around Maui. Classification Size Class (m 2 ) Count Very small < Small Medium Large > 2 43 SIZE OF MARINE DEBRIS ON MAUI Medium Large Small Very small Figure 17. Debris size distribution on Maui. Very Small: < 0.5 m 2, Small: m 2, Medium: 1 2 m 2, Large: >2 m 2. 26
28 Moloka i Figure 18. Relative density of marine debris identified around the island of Moloka i. Density and Distribution of Debris On Moloka i, marine debris was concentrated on northwestern shores, and a small area on the northeastern corner (Figure 18). Highest debris density found was 612 items within a one-mile segment, with the next highest being 360 items per mile. These segments were adjacent to each other, and both were located on the northwest coast of the island. All remaining segments had fewer than 200 items per mile, with all segments on south-facing shores having 50 or fewer items per mile. Type of Debris Imagery analysis identified a total of 2,878 pieces of marine debris around the coastline of Moloka i (Table 15). The most common types of debris were plastic and buoys and floats, which had similar densities of 37% and 35%, respectively (Figure 19). Inconclusive items made up 14% of the debris composition, with all remaining categories contributing 5% or less. 27
29 Table 15. Number of items of each type of marine debris found around Moloka i. Material Count Plastic 1069 Buoys and Floats 1012 Inconclusive 410 Derelict Fishing Gear 153 Tires 92 Other 90 Foam 52 Total % Foam Other Tires Derelict Fishing Gear Inconclusive 50% Buoys and Floats Plastic 0% Composition of Marine Debris on Moloka i Figure 19. Composition of marine debris identified around Moloka i. Derelict Fishing Gear: nets and line; Other: processed wood, metal, cloth, and vessels. 28
30 Size of Debris 89% of the marine debris on Moloka i fell into the smallest size classification of less than 0.5m 2 (Figure 20). The next size class, 0.5-1m 2, contained 6% of the debris, with the remaining size classes each containing approximately 3% of the debris (Table 16). Table 16. Number of debris items of each size class found around Moloka i. Classification Size Class (m 2 ) Count Very small < Small Medium Large > 2 75 SIZE OF MARINE DEBRIS ON MOLOKA I Medium Large Small Very small Figure 20. Debris size distribution on Moloka i. Very Small: < 0.5 m 2, Small: m 2, Medium: 1 2 m 2, Large: >2 m 2. 29

31 Kaho olawe Figure 21. Relative density of marine debris identified around the island of Kaho olawe. Distribution of Debris Marine debris on Kaho olawe was concentrated in two locations along the coast, both on the northern tip of the island and in the Keoneuli area along the eastern coast, where the shoreline curves inward (Figure 21). The Keoneuli area contained the highest debris density, with 342 debris items found in a one-mile segment. The segment at the northern most point of the island contained 304 items per mile. All south-facing shores contained 25 or fewer items per mile. Type of Debris A total of 1,298 pieces of marine debris were identified around the Kaho olawe coastline (Table 17). The most common type of debris was plastic (47%), followed by buoys and floats and derelict fishing gear, which each made up 21% of the debris composition (Figure 22). All other categories made up 5% or less of the total debris count. 30
32 Table 17. Number of items of each type of marine debris found around Kaho olawe. Material Count Plastic 607 Buoys and Floats 274 Derelict Fishing Gear 272 Other 61 Tires 34 Foam 27 Inconclusive 23 Total % Inconclusive Foam Tires Other Derelict Fishing Gear Buoys and Floats 50% Plastic 0% Composition of Marine Debris on Kaho olawe Figure 22. Composition of marine debris around Kaho olawe. Derelict Fishing Gear: nets and line; Other: processed wood, metal, cloth, and vessels. 31
33 Size of Debris The majority (84%) of marine debris around Kaho olawe fell into the smallest size classification of less than 0.5m 2 (Figure 23). The next size class of 0.5-1m 2 contained 7% of the debris, while the remaining size classes each contained around 5% of the debris (Table 18). Table 18. Number of items of each size class found around Kaho olawe. Classification Size Class (m 2 ) Count Very small < Small Medium Large > 2 60 SIZE OF MARINE DEBRIS ON KAHO OLAWE Medium Large Small Very small Figure 23. Debris size distribution on Kaho olawe. Very Small: < 0.5 m 2, Small: m 2, Medium: 1 2 m 2, Large: >2 m 2. 32
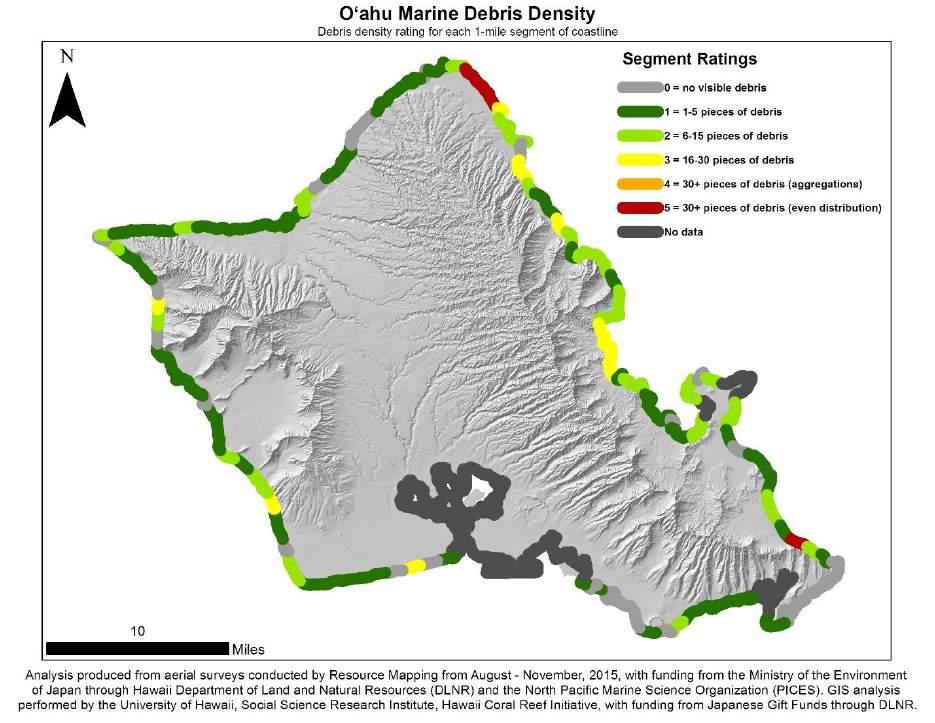
34 O ahu Figure 24. Relative density of marine debris identified around the island of O ahu. Distribution of Debris O ahu marine debris was concentrated on the northern tip of the island, on the east-facing shore between the northern most point and the Kahuku area (Figure 24). Only two segments contained 75 or greater debris items per mile, with the densest segment containing 108 debris items in one mile. All remaining segments contained 50 or fewer debris items per mile, with the majority of segments having a density of 15 or fewer items per mile. Type of Debris Imagery analysis identified a total of 984 pieces of marine debris around the O ahu coastline (Table 19). The most common debris type was plastic (63%) followed by debris in the category other (11%), which is a compilation of debris identified as either processed wood, metal, cloth, or vessels (Figure 25). All remaining debris categories each made up less than 10% of the total debris count. 33
35 Table 19. Number of items of each type of marine debris found around O ahu. Material Count Plastic 618 Other 106 Buoys and Floats 82 Tires 73 Derelict Fishing Gear 57 Inconclusive 32 Foam 16 Total % Foam Inconclusive Derelict Fishing Gear Tires Buoys and Floats Other 50% Plastic 0% Composition of Marine Debris on O ahu Figure 25. Composition of marine debris around O ahu. Derelict Fishing Gear: nets and line; Other: processed wood, metal, cloth, and vessels. 34
36 Size of Debris The smallest size category of less than 0.5m 2 contained the majority (86%) of marine debris on O ahu (Figure 26). The small size class (0.5-1m 2 ) contained 7% of the debris, and the remaining size classes contained 3% and 4% of the debris, respectively (Table 20). Table 20. Number of items of each size class found around O ahu. Classification Size Class (m 2 ) Count Very small < Small Medium Large > 2 36 SIZE OF MARINE DEBRIS ON O AHU Small Medium Large Very small Figure 26. Debris size distribution on O ahu. Very Small: < 0.5 m 2, Small: m 2, Medium: 1 2 m 2, Large: >2 m 2. 35
.")
37 Main Hawaiian Islands Figure 27. Marine debris density across the Main Hawaiian Islands, described as the number of items identified within a 5-mile segment of coastline. Distribution of Debris Marine debris on the Main Hawaiian Islands was heavily concentrated on the island of Ni ihau (Figure 27). Ni ihau contained 38% of the total debris identified across all of the islands surveyed. All other islands contained 14% or less of the total debris identified, with O ahu being the least dense, containing only 5% of the total debris. Debris density was not reflective of coastline length or number of segments (Figure 28). On all islands, marine debris was primarily concentrated on north and east-facing shores, with west-facing shores containing the least amount of debris. 36
38 Average segment density (debris items/mile) Length of coastline (miles) 0 Ni ihau Lāna i Kaho olawe Moloka i Kaua i Maui O ahu Hawai i Island 0 Average Segment Density (items per mile) Coastline Length (miles) Figure 28. Average number of debris items found per 1-mile segment of coastline for the Main Hawaiian Islands, in relation to total coastline length in miles. Type of Debris Imagery analysis identified a total of 20,658 pieces of marine debris on coastlines of the Main Hawaiian Islands. Composition of debris varied between islands (Figure 29), but the most common type of debris on all islands was plastic, making up 47% of the overall composition of debris identified (Figure 30) and at least 37% on any individual island. Buoys and floats and derelict fishing gear were the next largest categories when comparing total debris counts, at 22% and 11%, respectively. Between islands, however, the amount of debris in these categories varied from 8% to 35% (average of 19%) for buoys and floats, and 5% to 21% (average 11%) for derelict fishing gear. Both tires and foam each made up less than 10% of the composition on any island, and 5% and 3% across all islands, respectively. Other category items (items identified as processed wood, metal, cloth, or vessels) contributed 6% to the overall debris count, and inconclusive items contributed 7%, with varying degrees of density across islands. 37
39 Marine Debris Composition on the Main Hawaiian Islands 100% 50% 0% Lāna i Ni ihau Kaua i Hawai i Island Maui Moloka i Kaho olawe O ahu Plastic Buoys and Floats Derelict Fishing Gear Tires Foam Other Inconclusive Figure 29. Composition of marine debris compared between the Main Hawaiian Islands. Derelict Fishing Gear: nets and line; Other: processed wood, metal, cloth, and vessels. 38
40 100% Inconclusive Other Foam Tires Derelict Fishing Gear Buoys and Floats 50% Plastic 0% Composition of Marine Debris on the Main Hawaiian Islands Figure 30. Composition of marine debris found on all of the Main Hawaiian Islands. Derelict Fishing Gear: nets and line; Other: processed wood, metal, cloth, and vessels. Size of Debris Size distribution of marine debris identified on the Main Hawaiian Islands was less variable than type composition (Figure 31). The smallest category (< 0.5m 2 ) made up 86% of the total debris found on all islands (Figure 32), and contributed between 84% to 89% on individual islands. The remaining categories each made up less than 10% on any island, with the total contribution statewide from the small category (0.5 1m 2 ) being 6% and the total contribution from the remaining size classes (1 2m 2 and > 2m 2 ) being 4% each. 39
41 Marine Debris Size Distribution on the Main Hawaiian Islands 100% 50% 0% Lāna i Ni ihau Kaua i Hawai i Island Maui Moloka i Kaho olawe O ahu Very small Small Medium Large Figure 31. Size distribution of marine debris compared between the Main Hawaiian Islands. Very Small: < 0.5 m 2, Small: m 2, Medium: 1 2 m 2, Large: >2 m 2. SIZE OF MARINE DEBRIS ON THE MAIN HAWAIIAN ISLANDS Medium Large Small Very small Figure 32. Debris size distribution across all of the Main Hawaiian Islands. Very Small: < 0.5 m 2, Small: m 2, Medium: 1 2 m 2, Large: >2 m 2. 40
42 Number of Items/Number of Hours Length of coastline (miles) 0 Ni ihau Lāna i Kaho olawe Moloka i Kaua i Maui O ahu Hawai i Island 0 Average Segment Density (items per mile) Coastline Length (miles) Estimated Total Hours for Analysis Figure 33. Amount of hours for analysis, compared to average segment density (1-mile segments) and length of coastline in miles. Analysis Effort Aerial imagery analysis was conducted between October 2015 and February 2016, with analysts working a varied number of hours per week. The amount of time required to analyze an island s coastline was dependent on multiple factors. The main factors determining analysis time were 1) average segment density; 2) total coastline length; and 3) analyst experience. Since the analysis for this project was completed by students learning the GIS process, the increase in experience using the program over time was shown to impact the total analysis time, with analysis progressing faster further along into the project. For example, Lāna i and Kaho olawe had similar average segment densities, however Lāna i was the first island surveyed, while Kaho olawe was one of the last islands surveyed, resulting in a faster analysis time for Kaho olawe (Figure 33). Islands were analyzed in the following order: Lāna i, Ni ihau, Hawai i Island, Kaua i, Maui, Moloka i, Kaho olawe, and O ahu. 41


43 NEXT STEPS This project focused on the collection and processing of data to provide a comprehensive assessment of the distribution and composition of marine debris on Hawaiian coastlines; however, the ultimate goal is to mitigate possible negative effects this debris may have on coastal areas. The next steps toward achievement of this goal would be to use the data provided from this project to organize and plan cleanup efforts, and develop a community-accessible database to distribute debris data and track removal efforts throughout the islands. Accomplishment of these tasks involves additional efforts to prepare, such as the ground-truthing of reported debris and preparation of this data for online access and publication. Additional possibilities for future directions include analysis of changes over time with repeated imagery datasets, and investigating patterns in debris movement and accumulation in relation to oceanographic features such as currents and wind, or coastal features such as coral reef or wildlife habitat. The image collection and analysis techniques used here could also be applied to other areas of research and conservation as a method for collecting data on a large scale. For example, similar approaches could be used in projects that seek to characterize distribution of other natural resources, such as native or invasive species, or to survey coral bleaching on nearshore reefs (Figure 34, 35). There are numerous other possibilities for using aerial imagery data to identify and analyze features important to the understanding of biological, ecological, and geographical processes. Figure 34. Imagery analyzed for this project shows endangered Hawaiian Monk Seals resting on Ni ihau beaches that are littered with marine debris, including plastic and derelict fishing gear, which present ingestion and entanglement hazards. 42

 and Kāne ohe Bay (right)")
44 Figure 35. Imagery analyzed for this project shows bleached coral in Lanikai (left) and Kāne ohe Bay (right) on the island of O ahu. 43
45 APPENDIX Appendix A. Additional Maps Lāna i 44

46 45

47 46
48 47
49 48

50 Ni ihau 49
51 50

52 51

53 52
54 Kaua i 53
55 54

56 55
57 56

58 57

59 Hawai i Island 58
60 59
61 60
62 61

63 62
64 Maui 63
65 64

66 65

67 66
68 67
69 Moloka i 68
70 69

71 70

72 71
73 72
74 Kaho olawe 73
75 74

76 75
77 76

78 O ahu 77
79 78

80 79

81 80
82 81
83 Main Hawaiian Islands 82

84 Appendix B. Examples of types of marine debris Buoys and Floats: 83
85 Cloth: 84

86 Foam: 85

87 Line: 86
88 Metal: 87

89 Net: 88

90 Plastic: 89
91 Tire: 90

92 Wood: 91

93 Vessel: 92
94 Inconclusive: 93
95 Appendix C. Quality Control Protocols 1. QC was performed on 1-mile coastline segments. 20% of the line segments for each island were selected at random using a random number generator. 2. Marine debris observers were not made aware of which line segments are designated as QC segments until after that segment has been completely processed. 3. Marine debris was identified in the QC segments in the exact same way as the original analysis, but with a different observer from the original analyst. 4. Once a QC line segment was fully processed, it was compared against the original and discrepancies between the datasets were quantified. To quantify how consistently observers identified debris, percent accuracy was used: Original analysis % accuracy = * 100 QC analysis % accuracy = * 100 Total % accuracy = * 100 QC Results Summary: Accuracy increased in later analyses and the large gap in consistency between the original analysis and QC analysis also decreased. This suggests that observers were becoming more discerning in identifying debris over time. The original and QC analysis had a statically similar percent accuracy (ANOVA, F = 0.14, p = 0.72), there was little variation between the two separate analyses in the number of debris items identified. However, there was a statistically significant difference in the total debris items identified between the two analyses (ANOVA, F = p = 0.02). Therefore, observers should be aware of commonly overlooked items and natural items that are commonly identified as debris. 94


96 The QC process in the formation of the following marine debris identification rules: 1. If you can make out clear features of the target debris, then count it. If the object is <0.2m2 and ambiguous, disregard the item as inconclusive 2. On most sand beaches, there is a line of small items washed up by the tide. If there is debris seaward of the high tide line, count it. If it is clear that the waves have washed the debris past the high tide line (you can see water marks and a line of debris past the high tide line), then count it. If the debris is landward of the high tide line, disregard the item as inconclusive. 95
97 3. When classifying the segments according to the debris rating, evenly distributed means, are there clear areas of debris and no debris?. If so, the segment is not evenly distributed. However, if there are not clear gaps between debris and beach, then that means the segment is evenly distributed. Also, if there is equal spacing between debris, then that segment is evenly distributed. 4. Any object that is a natural color (white, beige, brown) has the potential to be a natural feature (coconut, driftwood, rock). Marine debris should be identified based on its shape (jagged edges, spherical, large objects), color (bright or unnatural colors), and size (can range, but very large objects are likely to be debris). 5. If there is a clump or pile of debris, label each individual item as best you can. Marking each item is important for the final debris density statistics. 6. If it has rounded edges, it is most likely driftwood. If it has square edges, it is probably processed. 96
VOLUME 1 JANUARY 2016
 JANUARY 2016 VOLUME 1 Japanese Marine Debris Aerial Imagery Analysis and GIS Support Hawaii Coral Reef Initiative This publication is a result of funding from the Japanese Tsunami Marine Debris Gift Fund,
What is an Marine Protected Area?
 Policies, Issues, and Implications of Marine Protected Areas Kara Anlauf University of Idaho Before the House Subcommittee on Fisheries Conservation, Wildlife and Oceans April 29, 2003 What is an Marine
Tufts University Water: Systems, Science, and Society (WSSS) Program
 Program") To: From: John Foster, Elbow Cay, the Bahamas; Friends of the Environment, Marsh Harbor, the Bahamas Alex Bedig, Amanda Garfield, Shonda Gaylord, Jack Melcher, Melissa Ng, Nathan Rawding, Kendall Webster,
To: From: John Foster, Elbow Cay, the Bahamas; Friends of the Environment, Marsh Harbor, the Bahamas Alex Bedig, Amanda Garfield, Shonda Gaylord, Jack Melcher, Melissa Ng, Nathan Rawding, Kendall Webster,
Coverage of Mangrove Ecosystem along Three Coastal Zones of Puerto Rico using IKONOS Sensor
 Coverage of Mangrove Ecosystem along Three Coastal Zones of Puerto Rico using IKONOS Sensor Jennifer Toledo Rivera Geology Department, University of Puerto Rico, Mayagüez Campus P.O. Box 9017 Mayagüez,
Clam Framework Map Book NEFMC Habitat Advisory Panel Meeting, April 3, 2018
 #3 Clam Framework Map Book NEFMC Habitat Advisory Panel Meeting, April 3, 218 Page 4 Management areas relevant to Clam dredge framework. Includes Great South Channel Habitat Management Area, divided into
MARPOL Consolidated Edition 2017
 MARPOL Consolidated Edition 2017 International Convention for the Prevention of Pollution from Ships Errata March 2018 Chapter 4 Regulations on energy efficiency for ships On pages 293 and 294, and page
MARINE PROTECTED AREAS LESSON PLAN Water Parks
 Marine Protected Areas U. S. Marine Protected Areas Lesson Plan MARINE PROTECTED AREAS LESSON PLAN Water Parks Theme U.S. Marine Protected Areas Links to Overview Essays and Resources Needed for Student
ReefFix. May, For the Organization of American States (OAS) and the Inter-American Biodiversity Information Network (IABIN)
 and the Inter-American Biodiversity Information Network (IABIN)") Fondation pour la Protection de la Biodiversité Marine FoProBiM B.P. 642 www.foprobim.org (mail) 6011 Henning St. Port-au-Prince, Haiti Bethesda, MD 20817 ReefFix Rapid Assessment of the Economic Value
Fondation pour la Protection de la Biodiversité Marine FoProBiM B.P. 642 www.foprobim.org (mail) 6011 Henning St. Port-au-Prince, Haiti Bethesda, MD 20817 ReefFix Rapid Assessment of the Economic Value
Appendix B Ultimate Airport Capacity and Delay Simulation Modeling Analysis
 Appendix B ULTIMATE AIRPORT CAPACITY & DELAY SIMULATION MODELING ANALYSIS B TABLE OF CONTENTS EXHIBITS TABLES B.1 Introduction... 1 B.2 Simulation Modeling Assumption and Methodology... 4 B.2.1 Runway
U.S. Activities in Puerto Rico, U.S. Virgin Islands and the Wider Caribbean. NOAA and the US Coral Reef Task Force
 U.S. Activities in Puerto Rico, U.S. Virgin Islands and the Wider Caribbean NOAA and the US Coral Reef Task Force U.S. Coral Reef Task Force Co-Chairs: National Oceanic and Atmospheric Administration (NOAA)
U.S. Coast Guard - American Waterways Operators Annual Safety Report
 American Waterways Operators U.S. Coast Guard - American Waterways Operators Annual Safety Report National Quality Steering Committee Meeting December 12, 2017 Established Safety Metrics For 17 years,
Predicting Flight Delays Using Data Mining Techniques
 Todd Keech CSC 600 Project Report Background Predicting Flight Delays Using Data Mining Techniques According to the FAA, air carriers operating in the US in 2012 carried 837.2 million passengers and the
Wildlife Management from a Regulatory Perspective
 Wildlife Management from a Regulatory Perspective Description Operators of aircraft have a reasonable expectation that any wildlife hazard which may exist at an airport they use will be managed to a level
Member s report on activities related to ICRI
 Member s Report INTERNATIONAL CORAL REEF INITIATIVE (ICRI) 32 nd General Meeting 7-9 December 2017 Nairobi, Kenya Member s report on activities related to ICRI MALAYSIA Reporting period November November
DOWNLOAD OR READ : CORAL REEFS OF THE WORLD VOLUME 2 INDIAN OCEAN RED SEA AND GULF PDF EBOOK EPUB MOBI
 DOWNLOAD OR READ : CORAL REEFS OF THE WORLD VOLUME 2 INDIAN OCEAN RED SEA AND GULF PDF EBOOK EPUB MOBI Page 1 Page 2 coral reefs of the world volume 2 indian ocean red sea and gulf coral reefs of the pdf
Exemplar for Internal Achievement Standard Geography Level 1. Conduct geographic research, with direction
 Exemplar for internal assessment resource Geography for Achievement Standard 91011 Exemplar for Internal Achievement Standard Geography Level 1 This exemplar supports assessment against: Achievement Standard
Title/Name of the area: Chwaka Bay, Zanzibar
 Title/Name of the area: Chwaka Bay, Zanzibar Presented by: Dr. Charles Lugomela, Ag. Head, Department of Aquatic Sciences and Fisheries, University of Dar es Salaam, P.O. Box 35064 Dar es Salaam, Tanzania
A GIS Analysis of Probable High Recreation Use Areas in Three Sisters Wilderness Deschutes and Willamette National Forests
 Lindsey Kiesz Geo 565 Term Project 3/15/2010 A GIS Analysis of Probable High Recreation Use Areas in Three Sisters Wilderness Deschutes and Willamette National Forests Introduction The Three Sisters Wilderness
Spatial Distribution and Characteristics of At-Risk Species in the Southeast U.S.
 Nicholas Institute for Environmental Policy Solutions Scoping Document Part 2 Exploratory Analysis of Characteristics and Trends of At-Risk Species in the Southeast U.S. Spatial Distribution and Characteristics
Report: 2 derelict barges in Flushing Bay & large source of styrofoam pollution. Importance: High. All,
 Report: 2 derelict barges in Flushing Bay & large source of styrofoam pollution Importance: High All, This report and request is being submitted by Riverkeeper in partnership with two citizen groups: the
Report on shipping accidents in the Baltic Sea area during 2010
 HELSINKI COMMISSION Baltic Marine Environment Protection Commission Report on shipping accidents in the Baltic Sea area during 2010 Photo by Maritime office in Gdynia Table of contents 1 Introduction...
TOWARDS SUSTAINABLE MANAGEMENT OF MARINE AND COASTAL HABITATS ASIA- PACIFIC DAY FOR THE OCEAN
 TOWARDS SUSTAINABLE MANAGEMENT OF MARINE AND COASTAL HABITATS WANNAKIAT THUBTHIMSANG PHUKET MARINE BIOLOGICAL CENTER, DMCR, THAILAND ASIA- PACIFIC DAY FOR THE OCEAN 20 NOVEMBER 2018, CONFERENCE ROOM 4,
Questions and Answers
 Home The Region Questions & Answers Documents Maps & Imagery Reserve Council Public Comment Search This Site About This Site Questions and Answers 1. Why is the President making this announcement? 2. What
Egnatia Odos Observatory. Egnatia Odos Observatory Monitoring of Egnatia Motorway s s Spatial Impacts
 Egnatia Odos Observatory Egnatia Odos Observatory Monitoring of Egnatia Motorway s s Spatial Impacts 1 Egnatia Odos Observatory 1. The unique Greek observatory of transport and spatial impacts 2. Scope
DAMAGE ASSESSMENT OF SAND FENCING GARDEN CITY, NORTH LITCHFIELD AND LITCHFIELD BEACH GEORGETOWN COUNTY, SC
 OF SAND FENCING GARDEN CITY, NORTH LITCHFIELD AND LITCHFIELD BEACH GEORGETOWN COUNTY, SC June 07, 2017 PREPARED FOR: GEORGETOWN COUNTY DEPARTMENT OF PUBLIC SERVICES PREPARED BY: The EARTHWORKS Group 11655
Saving Sharks Proposing a New Marine Protected Area
 Saving Sharks Proposing a New Marine Protected Area What would be the ideal characteristics of a marine protected area designed to conserve white sharks in the Pacific Ocean? Learning Objectives Describe
Needs for UAS in Response
 UAS Potential Uses and Limitations October 21, 2015 Michele Jacobi Office Response and Restoration 10/27/2015 1 Needs for UAS in Response Limited access to areas of interest (distance, safety concerns,
U.S. Coast Guard - American Waterways Operators Annual Safety Report
 American Waterways Operators U.S. Coast Guard - American Waterways Operators Annual Safety Report National Quality Steering Committee Meeting August 3, 216 Established Safety Metrics For 16 years, the
Finn Creek Park. Management Direction Statement Amendment
 Finn Creek Park Management Direction Statement Amendment November 2013 Management Direction Statement Amendment Approved by: Jeff Leahy Regional Director, Thompson Cariboo BC Parks November 12, 2013 Date
SMS HAZARD ANALYSIS AT A UNIVERSITY FLIGHT SCHOOL
 SMS HAZARD ANALYSIS AT A UNIVERSITY FLIGHT SCHOOL Don Crews Middle Tennessee State University Murfreesboro, Tennessee Wendy Beckman Middle Tennessee State University Murfreesboro, Tennessee For the last
Seahorse Superheroes Marine Debris Mural Project Making Art from Trash
 Seahorse Superheroes Marine Debris Mural Project Making Art from Trash The following activity has been created by Project Seahorse, and made possible by the generous support of the Herbert W. Hoover Foundation.
Site Coordinator Guide
 GGC MAKE A DIFFERENCE DAYS GREAT CANADIAN SHORELINE CLEANUP Site Coordinator Guide Site Coordinator Guide Introduction The Great Canadian Shoreline Cleanup (Shoreline Cleanup) is a joint conservation initiative
Coastal vessels The number of insurance accidents and accident rate fluctuation 8.0%
 1 2 3 4 5 6 1 In November 2013, a Loss & Prevention Seminar under the theme of Prevention of damage to harbour facilities was held at the following five areas: Tokyo, Kobe, Imabari, Fukuoka and Saeki.
EFFECT OF THE COASTAL CONSERVATION DUE TO BEACH NOURISHMENT OF TOTORI SAND DUNE COAST
 Proceedings of the 7 th International Conference on Asian and Pacific Coasts (APAC 203) Bali, Indonesia, September 2-26, 203 EFFECT OF THE COASTAL CONSERVATION DUE TO BEACH NOURISHMENT OF TOTORI SAND DUNE
Lesson 5: Campus Debris Survey
 Lesson 5: Campus Debris Survey Lesson 5 Presentation Content Engage Explore Explain Elaborate Evaluate Litter and Albatross Litter on Our Campus Analyzing Results Our Litter and Albatross Spreading the
GCRMN: An evolving approach for coral reef monitoring to support ICRI, management & policy
 GCRMN: An evolving approach for coral reef monitoring to support ICRI, management & policy Jeremy B.C. Jackson, Science Director, GCRMN Andy Hooten Global Coordinator, GCRMN Vivian Lam Deputy Coordinator,
Appalachian Trail Sustainability Research Study
 Appalachian Trail Sustainability Research Study Appalachian National Scenic Trail 2,175 mile footpath from Maine to Georgia Crosses 14 states, 6 NPS units, and 8 National Forests, Managed by the NPS A.T.
1.0 BACKGROUND NEW VETERANS CHARTER EVALUATION OBJECTIVES STUDY APPROACH EVALUATION LIMITATIONS... 7
 New Veterans Charter Evaluation Plan TABLE CONTENTS Page 1.0 BACKGROUND... 1 2.0 NEW VETERANS CHARTER EVALUATION OBJECTIVES... 2 3.0 STUDY APPROACH... 3 4.0 EVALUATION LIMITATIONS... 7 5.0 FUTURE PROJECTS...
Jamaica Member Report
 National Environment and Jamaica Member Report International Coral Reef Initiative 28 th General Meeting October 14-17, 2013 Belize City, Belize Loúreene Jones Coastal and Marine Resources Beaches Wetlands
SeagrassNet Monitoring in Great Bay, New Hampshire, 2016
 University of New Hampshire University of New Hampshire Scholars' Repository PREP Reports & Publications Institute for the Study of Earth, Oceans, and Space (EOS) 9-28-2017 SeagrassNet Monitoring in Great
Report on shipping accidents in the Baltic Sea area during Introduction
 HELSINKI COMMISSION Baltic Marine Environment Protection Commission Report on shipping accidents in the Baltic Sea area during 2009 Introduction Reports on shipping accidents in the Baltic Sea area have
TRANSATLANTIC PLATFORM FOR ACTION ON THE GLOBAL ENVIRONMENT (T-PAGE) 1. Background Paper on US Marine Protected Areas (MPAs)
 1. Background Paper on US Marine Protected Areas (MPAs)") TRANSATLANTIC PLATFORM FOR ACTION ON THE GLOBAL ENVIRONMENT (T-PAGE) 1 Background Paper on US Marine Protected Areas (MPAs) June 2007 Authors: Melanie Nakagawa, Attorney, International Program Kate Wing,
TRANSATLANTIC PLATFORM FOR ACTION ON THE GLOBAL ENVIRONMENT (T-PAGE) 1 Background Paper on US Marine Protected Areas (MPAs) June 2007 Authors: Melanie Nakagawa, Attorney, International Program Kate Wing,
Photopoint Monitoring in the Adirondack Alpine Zone
 Photopoint Monitoring in the Adirondack Alpine Zone Julia Goren (PI) and Seth Jones Adirondack High Peaks Summit Steward Program Adirondack Mountain Club summit@adk.org PO Box 867, Lake Placid, NY 12946
MONTEREY REGIONAL AIRPORT MASTER PLAN TOPICAL QUESTIONS FROM THE PLANNING ADVISORY COMMITTEE AND TOPICAL RESPONSES
 MONTEREY REGIONAL AIRPORT MASTER PLAN TOPICAL QUESTIONS FROM THE PLANNING ADVISORY COMMITTEE AND TOPICAL RESPONSES Recurring topics emerged in some of the comments and questions raised by members of the
Hawai i Visitor Spending Rose 9 Percent in April 2017 Four Largest Visitor Markets Reported Growth in Spending and Arrivals
 For Immediate Release: May 25, 2017 HTA Release (17-16) Hawai i Visitor Spending Rose 9 Percent in April 2017 Four Largest Visitor Markets Reported Growth in Spending and Arrivals HONOLULU Visitors spent
2017 INTERNATIONAL COASTAL CLEANUP VANUATU REPORT
 2017 INTERNATIONAL VANUATU REPORT During September this year VESS encouraged people of Vanuatu to participate in the Ocean Conservancy s International Coastal Cleanup (ICC). In this, the 32nd year of the
BACKGROUND DECISION. Decision Memo Page 1 of 6
 DECISION MEMO DEVIL S ELBOW BY-PASS, BOUNDARY TRAIL NO.1 U.S. FOREST SERVICE T9N, R7E, SECTION 9 RANGE 5E COWLITZ COUNTY WA MOUNT ST. HELENS NATIONAL VOLCANIC MONUMENT, GIFFORD PINCHOT NATIONAL FOREST
HAWAI I TOURISM INDUSTRY SET NEW RECORDS IN 2016 $15.6 BILLION IN VISITOR SPENDING; 8.9 MILLION ARRIVALS
 For Immediate Release: January 30, 2017 HTA Release (17-04) HAWAI I TOURISM INDUSTRY SET NEW RECORDS IN 2016 $15.6 BILLION IN VISITOR SPENDING; 8.9 MILLION ARRIVALS HONOLULU Hawai i s tourism industry
3.10 BIOLOGICAL RESOURCES
 3.10 BIOLOGICAL RESOURCES The isolated nature and volcanic origin of the Hawaiian Islands has resulted in a truly unique diversity of habitats and species. Hawai i s habitats range from alpine deserts
A GEOGRAPHIC ANALYSIS OF OPTIMAL SIGNAGE LOCATION SELECTION IN SCENIC AREA
 A GEOGRAPHIC ANALYSIS OF OPTIMAL SIGNAGE LOCATION SELECTION IN SCENIC AREA Ling Ruan a,b,c, Ying Long a,b,c, Ling Zhang a,b,c, Xiao Ling Wu a,b,c a School of Geography Science, Nanjing Normal University,
Labrador - Island Transmission Link Target Rare Plant Survey Locations
 27-28- Figure: 36 of 55 29-28- Figure: 37 of 55 29- Figure: 38 of 55 #* Figure: 39 of 55 30- - east side Figure: 40 of 55 31- Figure: 41 of 55 31- Figure: 42 of 55 32- - secondary Figure: 43 of 55 32-
EAST 34 th STREET HELIPORT. Report 2007-N-7
 Thomas P. DiNapoli COMPTROLLER OFFICE OF THE NEW YORK STATE COMPTROLLER DIVISION OF STATE GOVERNMENT ACCOUNTABILITY Audit Objectives... 2 Audit Results - Summary... 2 Background... 3 Audit Findings and
Marine Debris Distribution, Variation and Pattern/Seasonal Changes along the Coast and on Sea Surface of the Kagoshima Bay
 Marine Debris Distribution, Variation and Pattern/Seasonal Changes along the Coast and on Sea Surface of the Kagoshima Bay Benjamin Dotto MAJANGA 1, Shigeru FUJIEDA 2, Ryuichiro NISHI 3 and Kazunori HOSOTANI
2013 Annual Visitor Research Report
 2013 Annual Visitor Research Report Aloha, On behalf of the Hawai i Tourism Authority (HTA), the state agency for tourism, we are pleased to present the 2013 Annual Visitor Research Report. This report
Department of Agricultural and Resource Economics, Fort Collins, CO
 May 2016 EDR 16-01 Department of Agricultural and Resource Economics, Fort Collins, CO 80523-1172 http://dare.colostate.edu/pubs MAPPING THE WESTERN U.S. AGRITOURISM INDUSTRY: HOW DO TRAVEL PATTERNS VARY
Biodiversity is life Biodiversity is our life
 Biodiversity is life Biodiversity is our life Chapter 10 Section 2 Biodiversity at Risk Objectives Define and give examples of endangered and threatened species. Describe several ways that species are
Analysis of en-route vertical flight efficiency
 Analysis of en-route vertical flight efficiency Technical report on the analysis of en-route vertical flight efficiency Edition Number: 00-04 Edition Date: 19/01/2017 Status: Submitted for consultation
Magnetic Island Summary Report 2018
 Reef Check Australia Magnetic Island Summary Report Reef Check Foundation Ltd. (Australia) www.reefcheckaustralia.org This report should be cited as: J. Loder and G. Molinaro (). Reef Check Australia Magnetic
Sizing up Australia s eastern Grey Nurse Shark population
 Image: David Harasti A new estimate of adult population size for Australia s eastern Grey Nurse Shark drew on widespread genetic sampling and forensic exploration of family trees. Grey Nurse Sharks are
RISING PERFORMANCE. Civil aviation is an outlier. It s BY ERIK DAHLBERG
 RISING PERFORMANCE Compact mobile mapping systems can be installed on small passenger cars. Civil aviation is an outlier. It s among the few industries where tight government regulations are widely accepted
Underwater Acoustic Monitoring in US National Parks
 Underwater Acoustic Monitoring in US National Parks Megan F McKenna 1, Christopher Garsha 2, Erik Stabenau 1, Christine Gabriele 1, Timothy Clark 1, Clayton Pollock 1, Brinnen Carter 1, Samantha Bietsch
Intra-Urban Land Cover Classification in High Spatial Resolution Images using Object-Oriented Analysis: trends and challenges
 Intra-Urban Land Cover Classification in High Spatial Resolution Images using Object-Oriented Analysis: trends and challenges Carolina Moutinho Duque de Pinho carolina@dpi.inpe.br Introduction What is
Appalachian Power Company Smith Mountain Hydroelectric Project FERC No Debris Management Plan
 Appalachian Power Company Smith Mountain Hydroelectric Project FERC No. 2210 Debris Management Plan Final July2008 TABLE OF CONTENTS Description Page SUMMARY 1 1.0 Introduction.. 2 1.1 Project Lands and
Discriminate Analysis of Synthetic Vision System Equivalent Safety Metric 4 (SVS-ESM-4)
") Discriminate Analysis of Synthetic Vision System Equivalent Safety Metric 4 (SVS-ESM-4) Cicely J. Daye Morgan State University Louis Glaab Aviation Safety and Security, SVS GA Discriminate Analysis of
Discriminate Analysis of Synthetic Vision System Equivalent Safety Metric 4 (SVS-ESM-4) Cicely J. Daye Morgan State University Louis Glaab Aviation Safety and Security, SVS GA Discriminate Analysis of
DATE: January 19, WCA Governing Board. Johnathan Perisho, Project Manager. Mark Stanley, Executive Officer
 Item 14 DATE: January 19, 2017 TO: FROM: THROUGH: SUBJECT: WCA Governing Board Johnathan Perisho, Project Manager Mark Stanley, Executive Officer Item 14: Consideration of a resolution to accept an acquisition
Gold Coast Airport Aircraft Noise Information Report
 Gold Coast Airport Aircraft Noise Information Report Quarter 3 2012 (July to September) 1 Version Control Version Number Detail Prepared by Date 1 - Environment 2 November 2012 2 Updated Figure 10 Environment
POST-IMPLEMENTATION COMMUNITY IMPACT REVIEW
 POST-IMPLEMENTATION COMMUNITY IMPACT REVIEW RNAV STAR updates and RNP AR approaches at Winnipeg James Armstrong Richardson International Airport NAV CANADA 77 Metcalfe Street Ottawa, Ontario K1P 5L6 November
VAST Challenge 2017 Reviewer Guide: Mini-Challenge 1
 VAST Challenge 2017 Reviewer Guide: Mini-Challenge 1 This document provides information to support peer review of submissions to VAST Challenge 2017, Mini-Challenge 1. It covers background about the submission
Tsunami Survey Results in the NPS and Reproduction Analysis Using Tsunami Inversion
 Technical Workshop on the Accident of TEPCO s Fukushima Dai-ichi NPS Tsunami Survey Results in the NPS and Reproduction Analysis Using Tsunami Inversion July 24, 2012 Tomoyuki Tani Agenda 1. Overview of
Table 5-15 Special Use Airspace in the SBMR Airspace ROI
 5.4 AIRSPACE 5.4.1 Affected Environment The affected airspace environment is described below in terms of its principal attributes, namely controlled and uncontrolled airspace, special use airspace, military
HEATHROW COMMUNITY NOISE FORUM
 HEATHROW COMMUNITY NOISE FORUM 3Villages flight path analysis report January 216 1 Contents 1. Executive summary 2. Introduction 3. Evolution of traffic from 25 to 215 4. Easterly departures 5. Westerly
Susitna-Watana Hydroelectric Project (FERC No ) Recreation Resources Study Study Plan Section Study Implementation Report
 Recreation Resources Study Study Plan Section Study Implementation Report") (FERC No. 14241) Recreation Resources Study Study Plan Section 12.5 2014 Study Implementation Report Prepared for Prepared by AECOM November 2015 TABLE OF CONTENTS 1. Introduction... 4 2. Study Objectives...
(FERC No. 14241) Recreation Resources Study Study Plan Section 12.5 2014 Study Implementation Report Prepared for Prepared by AECOM November 2015 TABLE OF CONTENTS 1. Introduction... 4 2. Study Objectives...
PREFACE. Service frequency; Hours of service; Service coverage; Passenger loading; Reliability, and Transit vs. auto travel time.
 PREFACE The Florida Department of Transportation (FDOT) has embarked upon a statewide evaluation of transit system performance. The outcome of this evaluation is a benchmark of transit performance that
FUTENMA REPLACEMENT FACILITY BILATERAL EXPERTS STUDY GROUP REPORT. August 31, 2010
 FUTENMA REPLACEMENT FACILITY BILATERAL EXPERTS STUDY GROUP REPORT August 31, 2010 MANDATE AND SCOPE OF WORK: In order to achieve the earliest possible relocation of Marine Corps Air Station Futenma, the
Research Report Agreement T4118, Task 24 HOV Action Plan HOV ACTION PLAN
 Research Report Agreement T4118, Task 24 HOV Action Plan HOV ACTION PLAN by John M. Ishimaru Senior Research Engineer Duane Wright Systems Analyst Programmer Mark E. Hallenbeck Director Jaime Kang Research
NYS Snowmobile Trails Grant-in-Aid Program Trail System Prior Approval Application Packet Phase I
 NYS Snowmobile Trails Grant-in-Aid Program Trail System Prior Approval Application Packet Phase I Application Deadline: June 30, 2010 Snowmobile Unit New York State Office of Parks, Recreation and Historic
CAFNEC Submission to the proposed amendments to the. Plan of Management
 Management Cairns CAFNEC Submission to the proposed amendments to the Cairns Area Plan of Management Please accept this submission on Behalf of the Cairns and Far North Environment Centre. Regards 19 March
Biodiversity Studies in Gorongosa
 INTRODUCTION Gorongosa National Park is a 1,570-square-mile protected area in Mozambique. Decades of war, ending in the 1990s, decimated the populations of many of Gorongosa s large animals, but thanks
Interstate 90 and Mercer Island Mobility Study APRIL Commissioned by. Prepared by
 Interstate 90 and Mercer Island Mobility Study APRIL 2017 Commissioned by Prepared by Interstate 90 and Mercer Island Mobility Study Commissioned by: Sound Transit Prepared by: April 2017 Contents Section
Route Causes. The largest percentage of European helicopter. For helicopters, the journey not the destination holds the greatest risk.
 draganm /Fotolia.com Route Causes For helicopters, the journey not the destination holds the greatest risk. BY RICK DARBY The largest percentage of European helicopter accidents in 00 05 studied by the
Module 1 Educator s Guide: Representative Discussion Points Investigation 3
 Module 1 Educator s Guide: Representative Discussion Points Investigation 3 Ethiopia and Eritrea Our combined population is 59,578,171 people. We have just emerged from a long period of civil war and famine.
UAS to GIS Utilizing a low-cost Unmanned Aerial System (UAS) for Coastal Erosion Monitoring
 for Coastal Erosion Monitoring") UAS to GIS Utilizing a low-cost Unmanned Aerial System (UAS) for Coastal Erosion Monitoring Agenda Scope of today s presentation Demonstration Objectives Wrightsville Beach Test Area Masonboro Inlet Jetties
UAS to GIS Utilizing a low-cost Unmanned Aerial System (UAS) for Coastal Erosion Monitoring Agenda Scope of today s presentation Demonstration Objectives Wrightsville Beach Test Area Masonboro Inlet Jetties
Dr. Melissa Grigione And Kurt Menke. Jaguar -Arturo. Jaguarundi -Arturo. Ocelot -Arturo. Caso. Caso. Caso
 Identifying Priority Conservation Areas in the U.S.- Mexico Border Region for America s Neotropical Cats, the Jaguar, Jaguarundi and Ocelot: An International Effort Dr. Melissa Grigione And Kurt Menke
Header i
 Header i 048285014.10 Header Sub Title Body Text here. Body text here. Body text here. Section 1... 1 Executive Summary... 1 Opportunities and Constraints... 3 Overall Opportunities and Constraints Map
CONGESTION MONITORING THE NEW ZEALAND EXPERIENCE. By Mike Curran, Manager Strategic Policy, Transit New Zealand
 CONGESTION MONITORING THE NEW ZEALAND EXPERIENCE 26 th Australasian Transport Research Forum Wellington New Zealand 1-3 October 2003 By, Manager Strategic Policy, Transit New Zealand Abstract New Zealand
Lidar Imagery Reveals Maine's Land Surface in Unprecedented Detail
 Maine Geologic Facts and Localities December, 2011 Lidar Imagery Reveals Maine's Land Surface in Unprecedented Detail Text by Woodrow Thompson, Department of Agriculture, Conservation & Forestry 1 Introduction
Robson Valley Avalanche Tract Mapping Project
 Robson Valley Avalanche Tract Mapping Project Prepared for: Chris Ritchie Ministry of Water Land and Air Protection 325 1011 4th Avenue Prince George, BC. V2L3H9 and Dale Seip Ministry of Forests 1011
Population Movement in the Tohoku Region after the Great East Japan Earthquake Disaster
 83 Population Movement in the Tohoku Region after the Great East Japan Earthquake Disaster Takashi ABE Abstract This paper clarifies the demographic change in the Tohoku Region after the Great East Japan
% farmers/private landowners in watershed applying BMPs. Other (Number of participants completed the training)
") Easygrants ID: 23803 National Fish and Wildlife Foundation NFWF/Legacy Grant Project ID: 0302.10.023803 U. S. Coral Reef Task Force Partnership Initiative 2010 - Submit Final Programmatic Report (Activities
Easygrants ID: 23803 National Fish and Wildlife Foundation NFWF/Legacy Grant Project ID: 0302.10.023803 U. S. Coral Reef Task Force Partnership Initiative 2010 - Submit Final Programmatic Report (Activities
Produced by: Destination Research Sergi Jarques, Director
 Produced by: Destination Research Sergi Jarques, Director Economic Impact of Tourism Epping Forest - 2014 Economic Impact of Tourism Headline Figures Epping Forest - 2014 Total number of trips (day & staying)
Disaster Risk Management in Tourism Destinations
 Disaster Risk Management in Tourism Destinations Dr. Stefanos Fotiou United Nations Environment Programme Division of Technology, Industry and Economics This presentation is about Tourism and Risk Tourism
MEASURING ACCESSIBILITY TO PASSENGER FLIGHTS IN EUROPE: TOWARDS HARMONISED INDICATORS AT THE REGIONAL LEVEL. Regional Focus.
 Regional Focus A series of short papers on regional research and indicators produced by the Directorate-General for Regional and Urban Policy 01/2013 SEPTEMBER 2013 MEASURING ACCESSIBILITY TO PASSENGER
TWENTY-SECOND MEETING OF THE ASIA/PACIFIC AIR NAVIGATION PLANNING AND IMPLEMENTATION REGIONAL GROUP (APANPIRG/22)
") INTERNATIONAL CIVIL AVIATION ORGANIZATION TWENTY-SECOND MEETING OF THE ASIA/PACIFIC AIR NAVIGATION PLANNING AND IMPLEMENTATION REGIONAL GROUP (APANPIRG/22) Bangkok, Thailand, 5-9 September 2011 Agenda
INTERNATIONAL CIVIL AVIATION ORGANIZATION TWENTY-SECOND MEETING OF THE ASIA/PACIFIC AIR NAVIGATION PLANNING AND IMPLEMENTATION REGIONAL GROUP (APANPIRG/22) Bangkok, Thailand, 5-9 September 2011 Agenda
Communicating the Economic and Social Importance of Coral Reefs for South East Asian countries
 Communicating the Economic and Social Importance of Coral Reefs for South East Asian countries This fact sheet will provide you with information extracted from economic studies BASICS Coral reefs are among
4.2 AIRSPACE. 4.2 Airspace. Supplemental Draft Environmental Impact Statement August 2008 Military Training Activities at Mākua Military Reservation
 4.2 AIRSPACE 4.2.1 Impact Methodology Impacts on airspace use were assessed by evaluating the potential effects of the proposed training activities on the principal attributes of airspace use, as described
Hawai i Timeshare Quarterly July - September 2018
 Statewide Timeshare Performance & es During the third quarter of 2018, Hawai i s timeshare industry achieved an 90.1% occupancy rate, unchanged compared with the same period during 2017. The statewide
Preliminary Flight Data Analysis (Lee A. Christel, Ph.D, Aug 19, 2015)
") Purpose Palo Alto residents have noticed a dramatic increase in the amount of air traffic and associated noise over the city. It is suspected that Palo Alto has been unfairly burdened with increases that
Purpose Palo Alto residents have noticed a dramatic increase in the amount of air traffic and associated noise over the city. It is suspected that Palo Alto has been unfairly burdened with increases that
1.0 OUTLINE OF NOISE ANALYSIS...3
 Table of Contents 1.0 OUTLINE OF NOISE ANALYSIS...3 2.0 METHODOLOGY...3 2.1 BACKGROUND...3 2.2 COMPUTER MODELING...3 3.0 EXISTING NOISE ENVIRONMENT...4 3.1 EXISTING SANTA MONICA MUNICIPAL AIRPORT NOISE...4
Adapting to climate change by promoting sustainable livelihoods, human and food security, and resilient ecosystems
 Adapting to climate change by promoting sustainable livelihoods, human and food security, and resilient ecosystems ICRI Indian Ocean Day December 13, 2011 Regional Challenges Atlantic Caribbean Challenge
MARINE PROTECTED AREA IN MALAYSIA
 MARINE PROTECTED AREA IN MALAYSIA AB RAHIM GOR YAMAN Director, Division of Planning and Management Department of Marine Park Ministry of Natural Resources and Environment abrahim@nre.gov.my History of