Pennsylvania Public Transportation Annual Performance Report. Fiscal Year
|
|
|
- Cecilia Sparks
- 5 years ago
- Views:
Transcription
1 Pennsylvania Public Transportation Annual Performance Report Fiscal Year 28-9 April 21
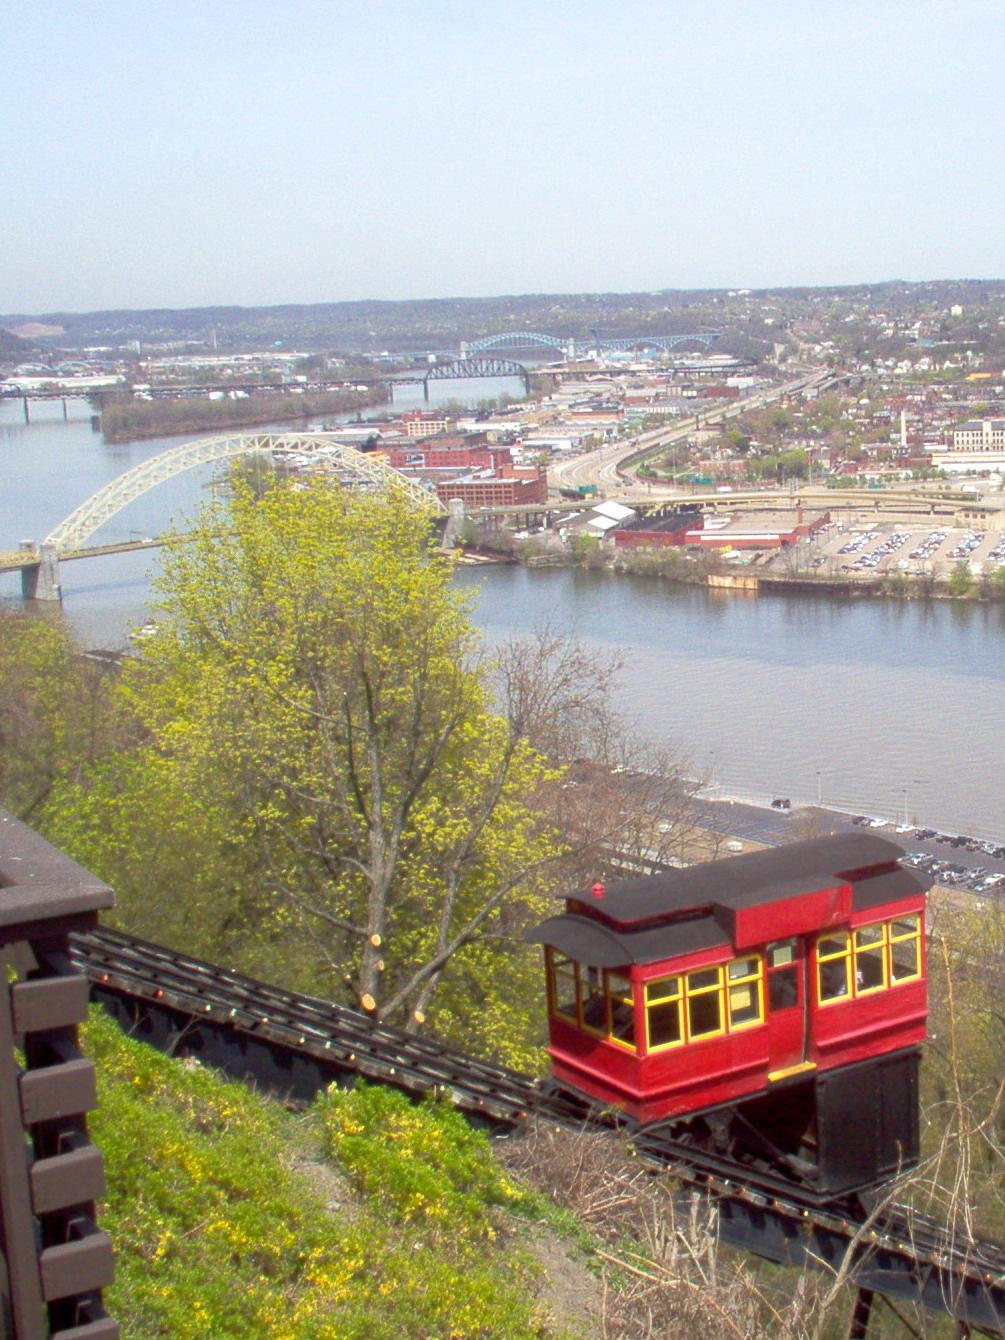
2 This report is published annually to present a state of the industry report to Pennsylvania s citizens and elected officials. It also serves to comply with the terms of Act 44 of 27 which requires that the Pennsylvania Department of Transportation annually compile, analyze, and publish performance results for state-supported transit providers. This document highlights the following topics: Changing circumstances influencing ridership, costs and other performance factors Trends in levels of service, the cost of service, ridership and funding Major accomplishments New initiatives A preview of the challenges and opportunities that will help shape the future agenda for those that financially support, provide, or use public transportation services in Pennsylvania. Front cover, clockwise from far left: Amtrak s Pennsylvanian in Perry County; Mid-Mon Valley Transit Authority (MMVTA) maintenance facility groundbreaking, Donora; ATA bus, Johnsonburg; Duquesne Inclined Plane, Pittsburgh; Montgomery County Suburban Transit paratransit vehicle; COLT bus in Lebanon.
3
4
5 Year In Review Overview and Looking Forward Introduction A Year of Contrasts Pennsylvania Public Transportation Annual Performance Report Fiscal Year 28-9 Fiscal Year 28-9 brought many challenges, as PennDOT s Bureau of Public Transportation (BPT) and the state s transit providers took steps to minimize the adverse impacts of a faltering economy to provide a solid foundation for the future: Using stimulus funding, important transit capital projects that were being deferred due to insufficient capital funding were advanced. Transit providers across the state carefully evaluated routes, schedules, fare structures, and technology improving system efficiency and maximizing income. Transit systems benefitted from carryover funding from the Public Transportation Trust Fund (PTTF), a dedicated fund for public transportation that was created through Act 44 of 27. Funding that was not distributed in the prior fiscal year was carried forward to FY As a result, transit systems were held harmless and not forced to cut service or increase fares. The PTTF is one of the major legislative successes of Act 44. The PTTF is one of the major legislative successes of Act 44. The year was also marked by contrasts and dramatic change for the country, for Pennsylvania, and for the public transportation industry as noted in the following chronology: Summer 28 With gas prices at $4 per gallon, public transit systems across the country were experiencing unprecedented increases in ridership and calls for service expansion as more travelers embraced public transportation as a cost-effective means of meeting everyday mobility needs. Using the additional resources provided through Act 44 of 27, Pennsylvania s transit industry responded by selectively adjusting service to meet changing demand. Fall 28 - While the softening of the housing boom and troubling reports out of the financial industry were a cause for concern, the turbulence in the country s financial system that followed and the resulting impact on every aspect of government, employers, families and individuals was beyond even the most pessimistic forecasts. Transportation, as a leading economic indica- Pennsylvania Public Transportation Performance Report Fiscal Year 28-9 ES-1

6 Year in Review Overview and Looking Forward tor, began to see a softening of the transit market due to the impact of rising unemployment, fewer work trips, lower gasoline prices and a public more cautious about travel in general. State revenue collections, which directly impact transit funding, initially remained surprisingly solid despite the troubling financial news across the country. Winter 29 The panic caused by bankruptcies of several major financial institutions was felt throughout the economy. Job losses escalated and transit systems experienced continued declines in ridership. Gasoline prices plunged in FY 28-9 after reaching historic peaks in July 28. Spring 29 The transportation industry saw some hope as the federal government took steps to reverse the economic decline through the American Recovery and Revitalization Act (ARRA or Stimulus Funding as it is commonly known) and high speed rail investment initiatives. The stimulus funding placed emphasis on transportation projects as a means of quickly creating jobs while also creating durable improvements to the nation s infrastructure. Economic Conditions affect Transit Trends in FY 28-9 Any discussion of the trends in public transportation performance factors that were observed in FY 28-9 would be incomplete without a discussion and understanding of the underlying changes that were occurring in the economy and the market for public transportation services. As noted in the introduction, gasoline prices and unemployment two factors that have a direct bearing on transit ridership were both undergoing dramatic shifts during the year as illustrated in Figures 1 and 2. Just as the spike in the cost of gas to slightly over $4. per * July 28 June 29 Cents per Gallon Jan 8 Apr July Figure 1 Average Monthly Retail Gasoline Prices (Central Atlantic States) January 28 - December 29 Fiscal Year 28-9 Oct Jan 9 Month Apr July Oct Source: Energy Information Administration ES-2 Pennsylvania Public Transportation Performance Report Fiscal Year 28-9
7 Year in Review Overview and Looking Forward gallon through the spring of 28 produced record numbers of transit trips across the country and within Pennsylvania, the decline in fuel costs during FY 28-9 resulted in moderation of the rate of transit ridership increase. 9.% 8.5% 8.% Figure 2 Pennsylvania Unemployment Rate January 28 - December 29 Fiscal Year 28-9 Also, since work commuters are a major component of total transit ridership, fewer workers quickly translates into fewer bus passengers. A weak economy also results in fewer discretionary trips such as to shopping or recreation destinations. The combined impact of these two factors can be seen in the quarterly ridership and the overall ridership trend line illustrated in Figure 3. As gasoline prices dropped and unemployment increased, ridership declined. Stimulus Funds Transit Capital Projects Creating and Preserving Jobs in Pennsylvania From the American Reinvestment and Recovery Act (ARRA) of 29, Pennsylvania s transit agencies received $346.4 million in federal stimulus funding for capital improvement projects. Selected projects maximized the creation and retention of jobs in the Commonwealth. Percentage 7.5% 7.% 6.5% 6.% 5.5% 5.% 4.5% 4.% Jan Apr Jul Oct Jan 29 Month Source: U.S. Dept. of Labor, Bureau of Labor Statistics Apr Jul Oct Figure 3 Pennsylvania Quarterly Total Transit Trips FY 27-9 Fiscal Year 28-9 The majority of the funding ($36.8 million, or 88.5 percent) was allocated by federal formula to the State s urban transit systems. That funding, which supported approximately 1 projects, is administered directly by the Federal Transit Administration (FTA). The remaining $39.6 million was awarded to PennDOT to be used for rural and intercity bus and rail projects. Millions The following projects are representative examples of projects financed with stimulus funding: 92 1Q 7-8 2Q 7-8 3Q 7-8 4Q 7-8 1Q 8-9 2Q 8-9 3Q 8-9 4Q 8-9 Quarter Source: PennDOT BPT Dotgrants Pennsylvania Public Transportation Performance Report Fiscal Year 28-9 ES-3


8 Year in Review Overview and Looking Forward Other Examples of Stimulus Projects New Castle Park and Ride Expansion Schuylkill Intermodal Facility Project Westmoreland County Maintenance Facility Warren County Maintenance Facility Improvements Pittsburgh s North Shore Connector - $62.5 million of stimulus funding was allocated to this light rail system expansion project that is scheduled to open for service in December 211. By providing more attractive and convenient connections between Downtown, the North Shore and Station Square, this regionally significant project will benefit many business, cultural, educational, recreation, employment and residential centers. Williamsport Transit Garage and Office Facility and Church Street Travel and Information Center River Valley Transit (RVT) will utilize $1.2 million of stimulus funding to upgrade their facility to increase indoor vehicle storage capacity and provide a state-ofthe-art transit vehicle maintenance facility. In addition, RVT received $2.5 million of ARRA funding to construct the new Church Street Transportation Center that will serve as an intermodal facility for both local mass transit an intercity bus services. Butler County Transit Center - $5.3 million of stimulus funding was awarded to the Butler Transit Authority (BTA) for the construction of new administrative offices, maintenance area, storage area and wash bay. Phase II of the project will enclose the bus storage area, and construct an attractive and comfortable waiting area for passengers making connections between local transit, intercity buses and a planned commuter service and park-n-ride. Elizabethtown Train Station Stimulus funding was awarded to the Borough of Elizabethtown for improvements to the 1915-era train station along Amtrak s Keystone Corridor. The project will include renovation of the existing station house, addition of retail space, construction of high-level boarding platforms to bring the station into compliance with ADA, canopies for overhead weather protection, expanded parking and an intermodal drop-off and pick-up area for taxis and buses. SEPTA Bridge Replacement The Lansdale Bridge is a twin, twogirder open deck railroad structure located on SEPTA s R5 Lansdale Regional Rail Line over the Wissahickon Creek in Lower Gwynedd Township, Montgomery County. The existing bridge superstructures were installed in 195 on stone abutments dating back to the 187s. The $3.3 million scope of work included bridge design and full replacement of the superstructure and concrete bearing seats. The design of the bridge replacement was accomplished over a 6 week period in early 29 and both bridges were successfully replaced in late October and mid-november of 29. ES-4 Pennsylvania Public Transportation Performance Report Fiscal Year 28-9

9 Year in Review Overview and Looking Forward High Speed Rail Stimulus money was not limited to just urban and rural transit systems, as Pennsylvania was awarded $26 million to remove the three remaining grade crossings on the Keystone East corridor between Harrisburg and Philadelphia, to improve interlocking at 3th Street Station, and to make other structural improvements. The state will also receive $75, to perform a feasibility study to determine the improvements necessary for high-speed service on the Keystone Corridor West between Harrisburg and Pittsburgh. Act 44 Public Transportation Program Reform Act 44 of 27 improved the accountability of transit and called for public transportation reform, including increasing the efficiency and effectiveness of state transit investments and the services they support. During FY 28-9, efforts were focused on developing and implementing an updated transit performance evaluation process, conducting an evaluation of the efficiency and effectiveness of the current approach to managing and delivering human service transportation, and identifying and providing training to enhance management development and skills. Human Service Transportation (HST) The Department of Transportation, the Department of Public Welfare, Office of the Budget, and the Department of Aging collaborated on a study of Human Service Transportation. The study identified significant opportunities for a new program model to help sustain service for the long-term, improve cost-effectiveness, and enhance service for consumers. Study recommendations included listening sessions with stakeholders (conducted in November and December 29), a review of State level program administration for opportunities to streamline and standardize management, voluntary pilot projects to demonstrate the results of new approaches to management and delivery of HST (proposals received in March 21), and the establishment of performance criteria, standards and targets to measure HST efficiency, productivity and effectiveness. Human Service Transportation (HST) serves critical needs, providing access to medical care, jobs, and important social services. Training/Capacity Building A new Pennsylvania Transit Executive Seminar (TES) was designed by the Eno Center for Transportation Leadership, in partnership with PennDOT, the Pennsylvania Public Transportation Association (PPTA) and PennTRAIN. The purpose of the TES is to cultivate creative and visionary leadership for Pennsylvania s transit industry, broaden leadership capacity, and enhance the understanding of transportation issues. Pennsylvania Public Transportation Performance Report Fiscal Year 28-9 ES-5
10 Year in Review Overview and Looking Forward In addition, PennTRAIN, through its ongoing training activities, provided 15 training sessions attended by 37 transit industry employees from Pennsylvania and neighboring states. Twenty-six individuals graduated from the Professional Supervisor Program. Performance Improvement PennDOT developed a comprehensive transit performance evaluation process that was formalized through publication of temporary regulations, effective in FY The process, which included establishing five year minimum performance standards, was field tested through a pilot performance review of Capital Area Transit (CAT). PennDOT is refining the process and will conduct additional reviews, working towards a five-year cycle for all fixed route transit systems. Capital Planning Tool - PennDOT manages public transportation capital grant programs and awards state and federal funding exceeding $3 million annually to transit systems throughout Pennsylvania. Act 44 of 27 requires PennDOT to develop and maintain 4- and 12-year capital plans. PennDOT is developing a web-based tool which will document both current and future capital needs. The tool is expected to be integrated with the Department s planning/programming process and Multi Modal Project Management System (MPMS) as well as the Dotgrants Consolidated Capital Application. The Capital Planning Tool will create a resource to obtain consistent information among the transit systems, the planning organizations and various PennDOT offices, and to provide a basis of information for the development of PennDOT s transit capital program. The tool will also allow the Department to: Maintain a statewide capital inventory Manage existing capital grants Project future capital needs and develop spending plans. Capital Program Benefits a Full Range of Transit Users PennDOT provided over $3 million in capital grant funding to the Commonwealth s urban and rural transit providers in FY The funding was used for improvements designed to benefit the full range of transit users, including fixed-route bus and rail, intercity bus and rail, and demand-responsive commu- * $3 million does not include ARRA ES-6 Pennsylvania Public Transportation Performance Report Fiscal Year 28-9

11 Year in Review Overview and Looking Forward nity transportation (HST) services. The grants supported all types of durable improvements new construction projects, reconstruction and renovation of existing bus and rail infrastructure, acquisition of new buses and rail vehicles, and communications and technology support equipment. The following are representative urban and rural capital projects - additional capital projects are highlighted under the descriptions of Stimulus Projects and the Keystone Rail Corridor Initiative: Lancaster Transit Facility The Red Rose Transit Authority (RRTA) is upgrading its 3 year-old facility to add a bus storage building, expand administrative office space and add a customer service center. The project has been awarded a Federal TIGER grant for the incorporation of energy sustainability features such as solar panels, geothermal heating and cooling for the administration building, insulated green roof system including skylights and a waste oil burner for heating the bus storage building. Hazelton Intermodal Facility - A new Intermodal Center was constructed in downtown Hazleton. It will serve as a terminal for three intercity bus carriers and provide offices for Hazleton Public Transit (HPT) and the Hazleton Parking Authority. The facility will provide improved accessibility to HPT staff for tickets sales, program enrollment and customer service. Hazleton s new Intermodal Center opened to travelers in November 29, becoming the first stimulus (American Recovery and Reinvestment Act) intermodal project completed in Pennsylvania. Technical Assistance Highlights Act 44 of 27 emphasizes the importance of accountability at all levels of public transportation management, efficiency and effectiveness of service delivery and the strategic investment of public dollars in public transportation infrastructure and service. The purpose of the technical assistance undertaken by PennDOT is to recognize the precepts of Act 44 and promote their application in service delivery/operations, program management and capital project decisions. The following are examples of technical assistance topics addressed during FY 28-9: Pooled Costs Pension and health care costs are two major categories of expense that the Transportation Funding and Reform Commission (TFRC) identified as escalating at rates far in excess of both total transit expenses and transit industry price indexes. Although the trends in health and pension costs have been some- Pennsylvania Public Transportation Performance Report Fiscal Year 28-9 ES-7
12 Year in Review Overview and Looking Forward what erratic since the publication of the TFRC report, they continue to grow at rates that exceed the escalation in total expense, and were also found to be higher than the cost experience of benchmark employers. This study identified a number of opportunities including the following: Pooling of health care coverage among transit systems could produce annual savings of 3-5 percent in administrative costs. Health and wellness programs should be further investigated for longterm cost control benefits. Each transit system should examine a wide range of options with potential to mitigate cost increases at every policy renewal. Lottery Fund Free Transit and Shared Ride Program Evaluation PennDOT performed a thorough review of SEPTA and PAAC the state s two largest transit systems - methodologies for capturing and reporting information on lottery funded free transit and shared-ride services to ensure accurate data for reimbursement calculations. Environmental Studies PennDOT helped systems expedite environmental clearance for eligibility for federal funds. Examples included: Butler Transit Authority intermodal transit center Crawford Area Transportation Authority - administration facility Endless Mountains Transportation Authority (Bradford, Sullivan, Tioga Counties) - new park and ride lot at the Mansfield facility County of Lebanon Transportation - park and ride facility Mid-Mon Valley Transit Authority Donora Intermodal Transit Center Montour County administration building Union Snyder Transportation Alliance new office and maintenance shop Westmoreland County Transportation Authority intermodal transit center York County Transportation Authority (rabbittransit) parking lot rehabilitation Strategic Planning/Service Evaluations Prior to Act 44 of 27, little funding was available to study changing demographics and their impact on each public transportation system, or to create a current service plan and a long term strategic plan for each public transportation system. Act 44 s emphasis on accountability, performance measurement, and the strategic investment of state and federal funds, as well as the availability of technical assistance funding, created a climate ES-8 Pennsylvania Public Transportation Performance Report Fiscal Year 28-9
13 Year in Review Overview and Looking Forward for and avenues to develop strategic plans and transit development plans, to evaluate routes and fares, and to conduct performance reviews. To document public transportation needs based on current information, to maximize operating efficiency and effectiveness, and to make valid projections of future needs, several transit systems have received assistance in developing strategic plans, Transit Development Plans. Examples included: AMTRAN (Altoona) Performance Review and TDP BARTA (Reading/Berks County) Strategic Plan BCTA (Beaver) Route Evaluation CamTran (Johnstown/Cambria) Strategic Plan and TDP Port Authority of Allegheny County (PAAC) TDP Somerset Needs Assessment and Service Plan Westmoreland County Human Service Transportation Management Plan Technology Enhancements Improve Efficiencies and Customer Service The use of technology in improving operating efficiencies and customer service is apparent across the state s network of public transportation systems. A few of these developments are highlighted below: Traveler Information Services - Patrons of the Pocono Pony transit system based in Monroe County have several state-of-the art traveler information technologies to help plan their trips and navigate the transit system - without ever looking at a bus schedule. RouteShout, a technology developed by a Pittsburgh based company, is a technology that provides transit schedule information to any iphone or SMS text message enabled cell phone. Each bus stop has a unique code that customers can use in a cell phone text message. The service responds to the text message with the time of the next inbound and outbound arrival for each route that serves that bus stop. Alternative Transportation Web Site - This site, which is located at provides an overview and presents summary information on: Ridesharing (carpooling, vanpooling) Public Transportation, including providers (Bus, Rail) Biking Walking Traveling Green Public Transportation & Google Maps For those who use iphones or similar devices, finding where and when the bus will arrive could not be easier. Using Google Maps, a user can enter their starting point and destination and Google will provide the exact details for the whole trip, including where the closest bus stop is and the time the trip will finish. This free service is currently available in Philadelphia, Pittsburgh and in Monroe County. Google Maps is also available on a laptop or desktop that has an internet connection, so trip planning from home or work is more userfriendly. Pennsylvania Public Transportation Performance Report Fiscal Year 28-9 ES-9
14 Year in Review Overview and Looking Forward Seniors and Persons with Disabilities Employer Benefits in Pennsylvania In addition, the website includes marketing and educational materials that explain the broad based benefits of public transportation, how to use the bicycle racks provided on some buses, calculations of savings that can be realized through ridesharing, how to start a carpool, and calculations of the carbon footprint for alternative modes. Initiatives Advance Passenger Rail Immediately following President Obama s unveiling of a blueprint for a new national network of high-speed passenger rail lines, PennDOT applied for and received funding awards for improvements on Keystone East Corridor and a study of the Keystone West Corridor: Amtrak s Pennsylvanian serves communities between Harrisburg and Pittsburgh. Keystone East Rail Corridor Capital Improvements The Department continues to invest in improving the rail facilities and services on the Harrisburg- Philadelphia line including long-needed station improvements. The most significant initiative along the Keystone East during FY 28-9 is the Elizabethtown Train Station and Rehabilitation project. Construction activities recently began, paid for with FTA ARRA funding. The station is undergoing major renovations and the low level platforms are being demolished to make way for new elevated passenger platforms extending 5 feet on each side of the station. The station and platforms will be handicap accessible. Construction is anticipated to be completed in January 211. Keystone West Study This work will study the improvements required to extend current Keystone service west to Pittsburgh at higher speeds and with increased frequency of service from one round trip per day to eight daily round trips. Future Opportunities, Challenges and Initiatives The obvious near-term challenges include dealing with a struggling economy, stagnant or declining ridership and the uncertainty regarding the ability of the Act 44 funding sources to meet current and future needs. Transit systems will continue to economize by fine tuning their systems and services until the economy rebounds and unemployment related ridership declines are reversed. The experi- ES-1 Pennsylvania Public Transportation Performance Report Fiscal Year 28-9
15 Year in Review Overview and Looking Forward ence of several years ago, during the economic boom and rapid escalation of fuel prices, demonstrates that travelers will turn to public transportation in increasing numbers as it makes economic sense to make that shift. The temporary lull in transit demand affords an opportunity to take the steps that will prepare for the inevitable demand for expansion of transit services. Several noteworthy initiatives that will better position the transit industry and PennDOT to address future mobility needs are: Regional Connectors Study This project will assess the need and service options for addressing the growing demand for public transportation options between urbanized areas in Southcentral Pennsylvania. Land development patterns both residential and commercial are resulting in urbanized areas that are converging, creating increased demand for travel options that connect them. High Speed Rail - PennDOT s high-speed planning and development efforts could lead to a new model for addressing long-standing mobility needs that are often not advanced in deference to projects that are easier to implement. A time-competitive rail service on the Philadelphia to Pittsburgh corridor has the potential to provide enhanced mobility while reducing congestion along parallel highways and at airports. Improving Paratransit Scheduling PennDOT has released an RFP for paratransit software. This initiative is designed to: o Provide a standard tool for demand responsive community transportation programs with all basic features o Allow transit systems to customize the tool beyond the basic features o Ensure consistency of data and reporting compliance o Remove the burden of RFP development, proposal evaluation and selection, and software testing from each individual transit system o Facilitate the implementation of statewide changes. A software vendor will be selected in 21. Pennsylvania Public Transportation Performance Report Fiscal Year 28-9 ES-11
16 Year in Review Overview and Looking Forward Conclusion In July 21, Act 44 revenue for transit will drop from $41 million to $25 million annually, due to the federal decision not to approve the application to toll I-8. In April 21, it is apparent that transit capital and operating funding will soon fall far short of needs. The shortfall will eventually rapidly escalate as a result of continued cost escalation and lagging growth in revenue and funding. The levels of funding originally anticipated from Act 44 sources were adversely impacted by the general decline in state revenue collection and more recently by the federal denial of the proposal to toll I-8. In summary, FY 28-9 was a turbulent year with many unforeseen events that affected the way that transit providers must conduct their everyday business. Fortunately, dealing with uncertainty and change is nothing new to today s transit managers. Rather than being discouraged by the challenges, the Department and the network of state-supported transit providers continue to collaboratively finetune and improve one of the nation s most diverse and expansive networks of public transportation services. While implementing the immediate actions necessary to adjust to present circumstances, we will proactively take the steps necessary to position the Commonwealth to anticipate and capitalize on emerging opportunities and have the strategies in place to ensure the long-term success of the state s public transportation systems and services. The Department alone cannot assure the desired outcomes without the corresponding financial support necessary to preserve existing service and respond to emerging markets. It is clear that new funding approaches will be needed. The loss of over $15 million each year presents a challenge that will require the immediate and collective effort of the public transit industry and all of the industry s partners. ES-12 Pennsylvania Public Transportation Performance Report Fiscal Year 28-9
17 Contents Year in Review Overview and Looking Forward... ES1 Contents...i Glossary of Terms...iii Section I Urban Systems...1 Section II Rural Systems...51 Section III Community Transportation (Shared Ride)...81 Section IV Intercity Bus...19 Section V Commuter Rail Index Pennsylvania Public Transportation Performance Report - Fiscal Year 28-9 i
18 ii Pennsylvania Public Transportation Performance Report - Fiscal Year 28-9
19 Glossary of Terms Urban and Rural Systems Act 44: State Act 44 of 27. Act 44 Section 1513 Distribution Factors: Factors used to determine the amount of operating assistance available for distribution to local transportation organizations under Section 1513 of Act 44. Factors include total passengers, senior passengers, revenue vehicle hours, and revenue vehicle miles. Fixed Route Public Transportation Service: Defined by Act 44 as regularly scheduled general public transportation that is provided according to published schedules along designated routes, with specified stopping points for the taking on and discharging of passengers. Operating Expenses: Defined by Act 44 as total expenses required to continue service to the public and to permit needed improvements in service which are not selfsupporting and otherwise for any purpose in furtherance of public passenger transportation. Operating Revenue: Defined by Act 44 as the total revenue earned by a local transportation organization through its transit operations. The term includes passenger fares, reimbursement in lieu of fares for senior passengers, charter revenue, school bus revenue, advertising revenue, and other miscellaneous revenue such as public and private route guarantee funds. Paratransit Service: Defined by Act 44 as transit service operating on a non fixed route basis in order to provide complementary transportation service to persons who are functionally unable to use fixed route public transportation service, as required by the Americans with Disabilities Act of 199. Revenue Vehicle Hours: Defined by Act 44 as the total amount of time calculated in hours during which vehicles are in service and available for public use in fixed route public transportation service or paratransit service. The term does not include deadhead hours. Revenue Vehicle Miles: Defined by Act 44 as the total amount of distance calculated in miles during which vehicles are in service and available for public use in fixed route public transportation service or paratransit service. The term does not include deadhead miles. Senior Passengers: Defined by Act 44 as senior citizens (persons who are at least 65 years of age) who ride on fixed route public transportation service. Total Passengers: Defined by Act 44 as the total of all originating passengers plus transfer passengers carried on fixed route public transportation service and paratransit service. Pennsylvania Public Transportation Performance Report - Fiscal Year 28-9 iii
20 Glossary of Terms Community Transportation 65+ (Senior Citizens) Passenger Trips: The number of one-way passenger trips reported for persons 65 years of age or older. Senior Citizens are responsible for a portion (approximately 15%) of the general public fare for Community Transportation (shared-ride) service. The Commonwealth reimburses the Community Transportation provider the difference between the passenger portion and full fare. Average Shared-Ride Fare The average amount collected from the passenger and/ or a sponsoring agency for a one-way shared-ride trip, calculated by dividing the shared-ride fare structure revenue by total trips. Cost to the Commonwealth per Senior Citizen Trip The average amount of Lottery funds reimbursed through the Shared-Ride Program for Senior Citizens for a one-way passenger trip for persons 65 and older. The amount is equal to approximately 85% of the average shared-ride fare. MATP: Medical Assistance Transportation Program (NEMT non-emergency medical transportation) funded by the PA Department of Public Welfare. PwD: Rural Transportation Program for Persons with Disabilities. Persons with disabilities pay a portion (approximately 15%) of the general public fare for Community Transportation (shared-ride) service. The Commonwealth reimburses the Community Transportation provider the difference between the passenger portion and full fare. Total Trips: The number of one-way passenger trips reported for general public shared-ride service. This includes passengers who are 65+ as well as those under 65. Commuter Rail Train Miles: The number of miles when a train is in service and available for public use. iv Pennsylvania Public Transportation Performance Report - Fiscal Year 28-9
21
22 Section I Urban Systems URBAN SYSTEMS Pennsylvania Public Transportation Performance Report - Fiscal Year
23 SEPTA (Southeastern Pennsylvania Transportation Authority) URBAN SYSTEMS Southeastern Pennsylvania Transportation Authority (SEPTA) 1234 Market Street Philadelphia, PA Mr. Joseph M. Casey (General Manager) Service Area Statistics (2 Census) Square Miles: 869 Population: 3,337,77 Act 44 Fixed Route Distribution Factors Total Passengers: 328,748,65 Senior Passengers: 24,747,165 Revenue Vehicle Miles: 84,797,866 Revenue Vehicle Hours: 6,516,171 House District Bucks: 18, 29, 31, 14, 141, 142, 143, 144, 145, 178 Chester: 13, 26, 155, 156, 157, 158, 16, 167, 168 Delaware: 159, 16, 161, 162, 163, 164, 165, 166, 168, 185, 191 Montgomery: 53, 61, 7, 146, 147, 148, 149, 15, 151, 152, 153, 154, 157, 17, 194 Philadelphia: 152, 154, 169, 17, 172, 173, 174, 175, 177, 179, 18, 181, 182, 184, 185, 186, 188, 19, 191, 192, 194, 195, 197, 198, 2, 21, 22, 23 Senate District Bucks: 6, 1, 12, 24 Chester: 9, 19, 26, 36, 44, 48 Delaware: 8, 9, 17, 26 Montgomery: 4, 7, 1, 12, 17, 19, 24, 44 Philadelphia: 1, 2, 3, 4, 5, 7, 8 Act 44 Operating Assistance Operating Assistance: $517,22,392 Required Local Match: $77,553,359 Fare Information Fixed Route Base: $2. Fixed Route Avg: $1.83 Last Base Fare Increase: July 21 (25%) Total Fleet Size Fixed Route: 2,336 Paratransit: 427 Systemwide: 2,763 Employees Full Time Part Time Fixed Route: 9, Paratransit: 87 Systemwide: 9, OPERATING BUDGET Maint., $5,438 Fuel Utils, $17,53 OPERATING EXPENSE ('s) $1,12,748 Purchased Trans, $23,72 Other, $4,117 Op & Mech Salaries and Wages, $42,916 State, $47,684 Local, $73,893 OPERATING FUNDS ('s) $1,12,748 Revenue, $436,12 Fringes, $361,744 Admin Salaries and Wages, $44,958 Federal, $32,69 2 Pennsylvania Public Transportation Performance Report - Fiscal Year 28-9
24 (Southeastern Pennsylvania Transportation Authority) SEPTA Community Transportation System Profile on page 13 $4 Operating Expense Per Passenger $3 $2 $1 $ URBAN SYSTEMS 35, 3, Total Passengers ('s) $8 Operating Revenue Per Revenue Vehicle Hour* 25, $6 2, 15, $4 1, 5, $2 $ 7, Revenue Vehicle Hours ('s) $18 Operating Expenses Per Revenue Vehicle Hour 6, 5, 4, 3, 2, $15 $12 $9 $6 1, $3 $ 1, Revenue Vehicle M iles ('s) 6 Total Ridership Per Revenue Vehicle Hour 8, 5 6, 4, , 1 SEPTA FY 25-6 financial and operating statistics affected by seven-day strike in November 25 Data prior to FY5-6 is inconsistent with Act 44 of 27 definitions *As of 28, per Act 44, Free Transit for Senior Citizen grants are reported as Act 44 operating assistance rather than revenue. Pennsylvania Public Transportation Performance Report - Fiscal Year
25 PAAC (Port Authority of Allegheny County) URBAN SYSTEMS Port Authority of Allegheny County (PAAC) 345 Sixth Avenue 3rd Floor Pittsburgh, PA Mr. Stephen Bland (Chief Executive Officer) Service Area Statistics (2 Census) Square Miles: 775 Population: 1,415,244 House District Allegheny: 16, 19, 2, 21, 22, 23, 24, 25, 27, 28, 3, 32, 33, 34, 35, 36, 38, 39, 4, 42, 44, 45, 46 Senate District Allegheny: 37, 38, 4, 42, 43, 45, 46, 47 Fare Information Fixed Route Base: $2. Fixed Route Avg: $1.57 Last Base Fare Increase: Jan. 28 (14.3%) Act 44 Fixed Route Distribution Factors Total Passengers: 67,574,4 Senior Passengers: 6,174,525 Revenue Vehicle Miles: 31,399,521 Revenue Vehicle Hours: 2,196,99 Employees Full Time Part Time Fixed Route: 2,78 Paratransit: Systemwide: 3, Act 44 Operating Assistance Operating Assistance: $184,457,99 Required Local Match: $27,668,699 Total Fleet Size Fixed Route: 952 Paratransit: 439 Systemwide: 1,391 OPERATING BUDGET Fuel Utils, $32,26 Purchased Trans, $12,584 Maint., $18,376 OPERATING EXPENSE ('s) $317,648 Other, $8,594 Op & Mech Salaries and Wages, $122,67 OPERATING FUNDS ('s) $317,648 Local, $29,976 Revenue, $82,743 Federal, $18,975 Fringes, $19,15 Admin Salaries and Wages, $14,68 State, $185,954 4 Pennsylvania Public Transportation Performance Report - Fiscal Year 28-9
26 (Port Authority of Allegheny County) PAAC Community Transportation System Profile on page 11 $6 Operating Expense Per Passenger $5 $4 $3 $2 $1 $ URBAN SYSTEMS 8, Total Passengers ('s) $6 Operating Revenue Per Revenue Vehicle Hour* 6, $5 $4 4, $3 2, $2 $1 $ 3, Revenue Vehicle Hours ('s) $18 Operating Expenses Per Revenue Vehicle Hour 2,5 $15 2, $12 1,5 $9 1, $6 5 $3 $ 5, Revenue Vehicle M iles ('s) 4 Total Ridership Per Revenue Vehicle Hour 4, 3, 2, , 1 5 Data prior to FY5-6 is inconsistent with Act 44 of 27 definitions *As of 28, per Act 44, Free Transit for Senior Citizen grants are reported as Act 44 operating assistance rather than revenue. Pennsylvania Public Transportation Performance Report - Fiscal Year
27 AMTRAN (Altoona Metro Transit) URBAN SYSTEMS Altoona Metro Transit (AMTRAN) 331 Fifth Avenue Altoona, PA 1662 Mr. Eric Wolf (General Manager) Service Area Statistics (2 Census) Square Miles: 25 Population: 69,68 House District Blair: 79, 8, 81 Senate District Blair: 3 Fare Information Fixed Route Base: $1.3 Fixed Route Avg: $1.19 Last Base Fare Increase: June 27 (4%) Act 44 Fixed Route Distribution Factors Total Passengers: 676,391 Senior Passengers: 89,456 Revenue Vehicle Miles: 512,997 Revenue Vehicle Hours: 4,741 Employees Full Time Part Time Fixed Route: 41 7 Paratransit: Systemwide: 41 7 Act 44 Operating Assistance Operating Assistance: $2,387,64 Required Local Match: $11,527 Total Fleet Size Fixed Route: 36 Paratransit: 38 Systemwide: 74 OPERATING BUDGET OPERATING EXPENSE ('s) $3,666 OPERATING FUNDS ('s) $3,666 Other, $385 Purchased Trans, $143 Maint., $188 Op & Mech Salaries and Wages, $1,345 Local, $113 Revenue, $71 Fuel Utils, $374 Fringes, $1,35 Admin Salaries and Wages, $196 State, $1,899 Federal, $944 6 Pennsylvania Public Transportation Performance Report - Fiscal Year 28-9
28 (Altoona Metro Transit) AMTRAN $7 $6 Operating Expense Per Passenger $5 $4 $3 $2 $1 $ URBAN SYSTEMS Total Passengers ('s) $3 $25 $2 Operating Revenue Per Revenue Vehicle Hour* $15 $1 $5 $ 5 Revenue Vehicle Hours ('s) $12 Operating Expenses Per Revenue Vehicle Hour 4 $1 3 2 $8 $6 $4 1 $2 $ 6 Revenue Vehicle M iles ('s) 25 Total Ridership Per Revenue Vehicle Hour Data prior to FY5-6 is inconsistent with Act 44 of 27 definitions *As of 28, per Act 44, Free Transit for Senior Citizen grants are reported as Act 44 operating assistance rather than revenue. Pennsylvania Public Transportation Performance Report - Fiscal Year
29 BCTA (Beaver County Transit Authority*) URBAN SYSTEMS Beaver County Transit Authority (BCTA) 2 West Washington Street Rochester, PA 1574 Ms. Mary Jo Morandini (General Manager) Service Area Statistics (2 Census) Square Miles: 44 Population: 24,441 House District Beaver: 9, 1, 14, 15, 16, 46 Senate District Beaver: 46, 47 Fare Information Fixed Route Base: $1.75 Fixed Route Avg: $1.87 Last Base Fare Increase: Jan. 25 (4%) Act 44 Fixed Route Distribution Factors Total Passengers: 84,868 Senior Passengers: 71,178 Revenue Vehicle Miles: 1,72,114 Revenue Vehicle Hours: 6,32 Employees Full Time Part Time Fixed Route: 55 4 Paratransit: 36 1 Systemwide: 91 5 Act 44 Operating Assistance Operating Assistance: $2,995,854 Required Local Match: $342,446 Total Fleet Size Fixed Route: 25 Paratransit: 23 Systemwide: 48 OPERATING BUDGET Purchased Trans, $ Maint., $352 OPERATING EXPENSE ('s) $4,411 Other, $492 Op & Mech Salaries and Wages, $1,648 OPERATING FUNDS ('s) $4,411 Local, $299 Revenue, $1,331 Fuel Utils, $834 Fringes, $841 Admin Salaries and Wages, $244 State, $2,418 Federal, $363 *Includes Rural Service 8 Pennsylvania Public Transportation Performance Report - Fiscal Year 28-9
30 (Beaver County Transit Authority) BCTA Community Transportation System Profile on page 83 $7 $6 Operating Expense Per Passenger $5 $4 $3 $2 $1 $ URBAN SYSTEMS 9 Total Passengers ('s) $24 Operating Revenue Per Revenue Vehicle Hour* 75 $2 6 $16 45 $12 3 $8 15 $4 $ 7 Revenue Vehicle Hours ('s) $8 Operating Expenses Per Revenue Vehicle Hour 6 5 $6 4 3 $4 2 1 $2 $ 1,4 Revenue Vehicle M iles ('s) 15 Total Ridership Per Revenue Vehicle Hour 1,2 1, Data prior to FY5-6 is inconsistent with Act 44 of 27 definitions *As of 28, per Act 44, Free Transit for Senior Citizen grants are reported as Act 44 operating assistance rather than revenue. Pennsylvania Public Transportation Performance Report - Fiscal Year
31 BARTA (Berks Area Regional Transportation Authority) URBAN SYSTEMS Berks Area Regional Transportation Authority (BARTA) 17 North 11th Street Reading, PA 1964 Mr. Dennis Louwerse (Executive Director) Ext Service Area Statistics (2 Census) Square Miles: 864 Population: 373,638 House District Berks: 124, 125, 126, 127, 128, 129, 13, 134, 187 Senate District Berks: 11, 29, 44, 48 Fare Information Fixed Route Base: $1.6 Fixed Route Avg: $1.8 Last Base Fare Increase: Jan. 27 (1%) Act 44 Fixed Route Distribution Factors Total Passengers: 2,978,258 Senior Passengers: 491,238 Revenue Vehicle Miles: 1,813,367 Revenue Vehicle Hours: 145,47 Employees Full Time Part Time Fixed Route: 96 7 Paratransit: 48 1 Systemwide: Act 44 Operating Assistance Operating Assistance: $6,948,159 Required Local Match: $36,845 Total Fleet Size Fixed Route: 54 Paratransit: 37 Systemwide: 91 OPERATING BUDGET Purchased Trans, $32 Maint., $437 Fuel Utils, $2,126 OPERATING EXPENSE ('s) $1,81 Other, $84 Op & Mech Salaries and Wages, $3,567 OPERATING FUNDS ('s) $1,81 Local, $343 Revenue, $2,743 Fringes, $2,919 Admin Salaries and Wages, $655 State, $5,775 Federal, $1,949 1 Pennsylvania Public Transportation Performance Report - Fiscal Year 28-9
32 (Berks Area Regional Transportation Authority) BARTA Community Transportation System Profile on page 84 $4 Operating Expense Per Passenger $3 $2 $1 $ URBAN SYSTEMS 3,5 3, 2,5 2, 1,5 1, Total Passengers ('s) $3 $25 $2 $15 $1 Operating Revenue Per Revenue Vehicle Hour* 5 $5 $ 2 Revenue Vehicle Hours ('s) $8 Operating Expenses Per Revenue Vehicle Hour 16 $ $4 4 $2 $ 2, Revenue Vehicle M iles ('s) 25 Total Ridership Per Revenue Vehicle Hour 1,5 2 1, Data prior to FY5-6 is inconsistent with Act 44 of 27 definitions *As of 28, per Act 44, Free Transit for Senior Citizen grants are reported as Act 44 operating assistance rather than revenue. Pennsylvania Public Transportation Performance Report - Fiscal Year
33 CamTran (Cambria County Transit Authority*) URBAN SYSTEMS Cambria County Transit Authority (CamTran) 726 Central Avenue Johnstown, PA 1592 Ms. Rose Lucey-Noll (Executive Director) Ext Service Area Statistics (2 Census) Square Miles: 688 Population: 152,598 House District Cambria: 71, 72, 73 Senate District Cambria: 35 Fare Information Fixed Route Base: $1.5 Fixed Route Avg: $1.8 Last Base Fare Increase: Jan. 27 (3.5%) Act 44 Fixed Route Distribution Factors Total Passengers: 1,292,292 Senior Passengers: 335,368 Revenue Vehicle Miles: 1,182,739 Revenue Vehicle Hours: 88,347 Employees Full Time Part Time Fixed Route: 84 9 Paratransit: 16 3 Systemwide: 1 12 Act 44 Operating Assistance Operating Assistance: $5,833,89 Required Local Match: $52,491 Total Fleet Size Fixed Route: 49 Paratransit: 1 Systemwide: 59 OPERATING BUDGET Purchased Trans, $ Maint., $499 Fuel Utils, $845 OPERATING EXPENSE ('s) $7,417 Other, $745 Op & Mech Salaries and Wages, $2,811 OPERATING FUNDS ('s) $7,417 Local, $52 Revenue, $1,349 Fringes, $2,11 Admin Salaries and Wages, $47 State, $3,765 Federal, $1,783 *Includes Rural Service Note: Other category includes the Inclined Plane 12 Pennsylvania Public Transportation Performance Report - Fiscal Year 28-9
 $1 Operating Expenses Per Revenue Vehicle Hour 1 8 6 4 $8 $6 $4 2 $2 $ 1,5 Revenue Vehicle M iles ('s) 2 Total")
34 (Cambria County Transit Authority) CamTran Community Transportation System Profile on page 86 $6 Operating Expense Per Passenger $5 $4 $3 $2 $1 $ URBAN SYSTEMS 1,5 Total Passengers ('s) $25 Operating Revenue Per Revenue Vehicle Hour* 1,2 $2 9 $15 6 $1 3 $5 $ 12 Revenue Vehicle Hours ('s) $1 Operating Expenses Per Revenue Vehicle Hour $8 $6 $4 2 $2 $ 1,5 Revenue Vehicle M iles ('s) 2 Total Ridership Per Revenue Vehicle Hour 1,25 1, Data prior to FY5-6 is inconsistent with Act 44 of 27 definitions *As of 28, per Act 44, Free Transit for Senior Citizen grants are reported as Act 44 operating assistance rather than revenue. Pennsylvania Public Transportation Performance Report - Fiscal Year
35 CAT (Capital Area Transit) URBAN SYSTEMS Capital Area Transit (CAT) 91 North Cameron Street P.O. Box 1571 Harrisburg, PA 1715 Mr. James Hoffer (Executive Director) Service Area Statistics (2 Census) Square Miles: 137 Population: 292,94 House District Cumberland: 87, 88, 89, 92, 199 Dauphin: 98, 13, 14, 15, 16 Senate District Cumberland: 31 Dauphin: 15, 27, 48 Fare Information Fixed Route Base: $1.65 Fixed Route Avg: $1.27 Last Base Fare Increase: July 28 (3.1%) Act 44 Fixed Route Distribution Factors Total Passengers: 2,656,259 Senior Passengers: 21,215 Revenue Vehicle Miles: 1,889,149 Revenue Vehicle Hours: 143,36 Employees Full Time Part Time Fixed Route: Paratransit: Systemwide: Act 44 Operating Assistance Operating Assistance: $6,416,998 Required Local Match: $6,659 Total Fleet Size Fixed Route: 78 Paratransit: 56 Systemwide: 134 OPERATING BUDGET OPERATING EXPENSE ('s) $13,356 OPERATING FUNDS ('s) $13,356 Purchased Trans, $256 Other, $972 Local, $638 Revenue, $3,144 Maint., $641 Fuel Utils, $1,74 Fringes, $3,632 Op & Mech Salaries and Wages, $5,341 Admin Salaries and Wages, $81 State, $6,4 Federal, $3,57 14 Pennsylvania Public Transportation Performance Report - Fiscal Year 28-9
36 (Capital Area Transit) CAT Community Transportation System Profile on page 86 $6 Operating Expense Per Passenger $5 $4 $3 $2 $1 $ URBAN SYSTEMS 3, Total Passengers ('s) $25 Operating Revenue Per Revenue Vehicle Hour* 2,5 2, 1,5 1, $2 $15 $1 5 $5 $ 2 Revenue Vehicle Hours ('s) $1 Operating Expenses Per Revenue Vehicle Hour 15 $8 1 $6 $4 5 $2 $ 2,5 Revenue Vehicle M iles ('s) 2 Total Ridership Per Revenue Vehicle Hour 2, 16 1,5 12 1, Data prior to FY5-6 is inconsistent with Act 44 of 27 definitions *As of 28, per Act 44, Free Transit for Senior Citizen grants are reported as Act 44 operating assistance rather than revenue. Pennsylvania Public Transportation Performance Report - Fiscal Year
37 Capitol Bus Company URBAN SYSTEMS Capitol Bus Company 161 South Cameron Street Harrisburg, PA 1715 Mr. Joseph Wrabel (Chief Financial Officer) Service Area Statistics (2 Census) Square Miles: 45 Population: 18,138 House District Dauphin: 98, 13, 14, 15, 16 Lebanon: 11, 12 Senate District Dauphin: 15, 27, 48 Lebanon: 48 Fare Information Fixed Route Base: $1.85 Fixed Route Avg: $4.27 Last Base Fare Increase: Act 44 Fixed Route Distribution Factors Total Passengers: 7,1 Senior Passengers: 29 Revenue Vehicle Miles: 25,441 Revenue Vehicle Hours: 1,39 Employees Full Time Part Time Fixed Route: 3 Paratransit: Systemwide: 3 Act 44 Operating Assistance Operating Assistance: $124,785 Required Local Match: $18,718 Total Fleet Size Fixed Route: 1 Paratransit: Systemwide: 1 OPERATING BUDGET Purchased Trans, $ Maint., $7 Other, $35 OPERATING EXPENSE ('s) $126 Op & Mech Salaries and Wages, $37 Admin Salaries and Wages, $4 Local, $24 OPERATING FUNDS ('s) $126 Revenue, $31 Federal, $ Fuel Utils, $37 Fringes, $6 State, $71 16 Pennsylvania Public Transportation Performance Report - Fiscal Year 28-9
38 Capitol Bus Company $2 Operating Expense Per Passenger $16 $12 $8 $4 $ URBAN SYSTEMS 8 Total Passengers ('s) $3 Operating Revenue Per Revenue Vehicle Hour* 6 $25 $2 4 $15 2 $1 $5 $ 1,6 1,4 1,2 1, Revenue Vehicle Hours $12 $1 $8 Operating Expenses Per Revenue Vehicle Hour $6 $4 $2 $ Revenue Vehicle M iles ('s) Total Ridership Per Revenue Vehicle Hour Data prior to FY5-6 is inconsistent with Act 44 of 27 definitions *As of 28, per Act 44, Free Transit for Senior Citizen grants are reported as Act 44 operating assistance rather than revenue. Pennsylvania Public Transportation Performance Report - Fiscal Year
39 CATA (Centre Area Transportation Authority) URBAN SYSTEMS Centre Area Transportation Authority (CATA) 281 West Whitehall Road State College, PA 1681 Mr. Hugh Mose (General Manager) Ext Service Area Statistics (2 Census) Square Miles: 133 Population: 83,444 House District Centre: 76, 77, 171 Senate District Centre: 34 Fare Information Fixed Route Base: $1.25 Fixed Route Avg: $.64 Last Base Fare Increase: 23 (25%) Act 44 Fixed Route Distribution Factors Total Passengers: 7,17,65 Senior Passengers: 35,662 Revenue Vehicle Miles: 1,492,481 Revenue Vehicle Hours: 114,798 Employees Full Time Part Time Fixed Route: Paratransit: Systemwide: Act 44 Operating Assistance Operating Assistance: $3,378,286 Required Local Match: $372,584 Total Fleet Size Fixed Route: 52 Paratransit: 8 Systemwide: 6 OPERATING BUDGET OPERATING EXPENSE ('s) $9,745 OPERATING FUNDS ('s) $9,745 Purchased Trans, $194 Maint., $75 Other, $657 Op & Mech Salaries and Wages, $4,675 State, $3,379 Local, $42 Revenue, $4,846 Fuel Utils, $791 Fringes, $2,71 Admin Salaries and Wages, $67 Federal, $1,1 18 Pennsylvania Public Transportation Performance Report - Fiscal Year 28-9
40 (Centre Area Transportation Authority) CATA Community Transportation System Profile on page 87 $1.5 Operating Expense Per Passenger $1.25 $1. $.75 $.5 $.25 $. URBAN SYSTEMS 8, 7, 6, Total Passengers ('s) $5 $4 Operating Revenue Per Revenue Vehicle Hour* 5, 4, 3, $3 $2 2, 1, $1 $ 14 Revenue Vehicle Hours ('s) $9 Operating Expenses Per Revenue Vehicle Hour $75 $6 $45 $3 $15 $ 1,6 Revenue Vehicle M iles ('s) 7 Total Ridership Per Revenue Vehicle Hour 1,4 1,2 1, Data prior to FY5-6 is inconsistent with Act 44 of 27 definitions *As of 28, per Act 44, Free Transit for Senior Citizen grants are reported as Act 44 operating assistance rather than revenue. Pennsylvania Public Transportation Performance Report - Fiscal Year
41 COLTS (County of Lackawanna Transit System) URBAN SYSTEMS County of Lackawanna Transit System (COLTS) North South Road Scranton, PA 1854 Mr. Robert J. Fiume (Executive Director) Ext Service Area Statistics (2 Census) Square Miles: 14 Population: 213,295 House District Lackawanna: 112, 113, 114, 115 Senate District Lackawanna: 22 Fare Information Fixed Route Base: $1.25 Fixed Route Avg: $1.22 Last Base Fare Increase: 1994 (25%) Act 44 Fixed Route Distribution Factors Total Passengers: 2,43,765 Senior Passengers: 1,124,927 Revenue Vehicle Miles: 1,158,288 Revenue Vehicle Hours: 95,8 Employees Full Time Part Time Fixed Route: 73 4 Paratransit: Systemwide: 73 4 Act 44 Operating Assistance Operating Assistance: $6,336,434 Required Local Match: $443,818 Total Fleet Size Fixed Route: 33 Paratransit: Systemwide: 33 OPERATING BUDGET Purchased Trans, $561 Maint., $523 OPERATING EXPENSE ('s) $6,749 Other, $568 Op & Mech Salaries and Wages, $2,119 OPERATING FUNDS ('s) $6,749 Revenue, Local, $464 $1,157 Federal, $518 Fuel Utils, $725 Fringes, $1,83 Admin Salaries and Wages, $423 State, $4,61 2 Pennsylvania Public Transportation Performance Report - Fiscal Year 28-9
42 (County of Lackawanna Transit System) COLTS $4 Operating Expense Per Passenger $3 $2 $1 $ URBAN SYSTEMS 2,4 Total Passengers ('s) $35 Operating Revenue Per Revenue Vehicle Hour* 2, $3 1,6 1,2 8 4 $25 $2 $15 $1 $5 $ 1 Revenue Vehicle Hours ('s) $1 Operating Expenses Per Revenue Vehicle Hour 8 $8 6 $6 4 $4 2 $2 $ 1,5 Revenue Vehicle M iles ('s) 25 Total Ridership Per Revenue Vehicle Hour 1, Data prior to FY5-6 is inconsistent with Act 44 of 27 definitions *As of 28, per Act 44, Free Transit for Senior Citizen grants are reported as Act 44 operating assistance rather than revenue. Pennsylvania Public Transportation Performance Report - Fiscal Year
43 COLT (County of Lebanon Transit Authority) URBAN SYSTEMS County of Lebanon Transit Authority (COLT) 2 Willow St. Lebanon, PA 1746 Ms. Theresa L. Giurintano (Executive Director) Ext Service Area Statistics (2 Census) Square Miles: 362 Population: 12,327 House District Lebanon: 11, 12 Senate District Lebanon: 48 Fare Information Fixed Route Base: $1.4 Fixed Route Avg: $1.11 Last Base Fare Increase: July 27 (4%) Act 44 Fixed Route Distribution Factors Total Passengers: 311,293 Senior Passengers: 48,518 Revenue Vehicle Miles: 523,225 Revenue Vehicle Hours: 34,254 Employees Full Time Part Time Fixed Route: 32 3 Paratransit: 15 Systemwide: 47 3 Act 44 Operating Assistance Operating Assistance: $1,351,452 Required Local Match: $68,994 Total Fleet Size Fixed Route: 13 Paratransit: 14 Systemwide: 27 OPERATING BUDGET OPERATING EXPENSE ('s) $2,594 OPERATING FUNDS ('s) $2,594 Purchased Trans, $ Maint., $152 Other, $31 Op & Mech Salaries and Wages, $76 Local, $77 Revenue, $424 Fuel Utils, $463 State, $1,134 Fringes, $479 Admin Salaries and Wages, $43 Federal, $ Pennsylvania Public Transportation Performance Report - Fiscal Year 28-9
44 (County of Lebanon Transit Authority) COLT Community Transportation System Profile on page 89 $1 Operating Expense Per Passenger $8 $6 $4 $2 $ URBAN SYSTEMS 35 Total Passengers ('s) $2 Operating Revenue Per Revenue Vehicle Hour* 3 25 $16 2 $12 15 $8 1 5 $4 $ Revenue Vehicle Hours ('s) Operating Expenses Per Revenue Vehicle Hour 4 $1 3 $8 $6 2 $4 1 $2 $ 6 Revenue Vehicle M iles ('s) 12 Total Ridership Per Revenue Vehicle Hour Data prior to FY5-6 is inconsistent with Act 44 of 27 definitions *As of 28, per Act 44, Free Transit for Senior Citizen grants are reported as Act 44 operating assistance rather than revenue. Pennsylvania Public Transportation Performance Report - Fiscal Year
45 EMTA (Erie Metropolitan Transit Authority) URBAN SYSTEMS Erie Metropolitan Transit Authority (EMTA) 127 East 14th Street Erie, PA 1653 Mr. Dennis Solensky (Executive Director) Service Area Statistics (2 Census) Square Miles: 77 Population: 189,872 House District Erie: 1, 2, 3, 4, 5 Senate District Erie: 21, 49 Fare Information Fixed Route Base: $1.1 Fixed Route Avg: $1.15 Last Base Fare Increase: March 1997 (1%) Act 44 Fixed Route Distribution Factors Total Passengers: 3,78,543 Senior Passengers: 156,317 Revenue Vehicle Miles: 2,149,182 Revenue Vehicle Hours: 19,938 Employees Full Time Part Time Fixed Route: Paratransit: Systemwide: Act 44 Operating Assistance Operating Assistance: $6,817,189 Required Local Match: $642,529 Total Fleet Size Fixed Route: 77 Paratransit: 7 Systemwide: 147 OPERATING BUDGET Maint., $78 Fuel Utils, $1,259 Purchased Trans, $ OPERATING EXPENSE ('s) $12,883 Other, $622 Op & Mech Salaries and Wages, $5,466 OPERATING FUNDS ('s) $12,883 Local, $777 Revenue, $2,971 Fringes, $4,316 Admin Salaries and Wages, $44 State, $6,76 Federal, $3,59 24 Pennsylvania Public Transportation Performance Report - Fiscal Year 28-9
46 (Erie Metropolitan Transit Authority) EMTA Community Transportation System Profile on page 92 $5 Operating Expense Per Passenger $4 $3 $2 $1 $ URBAN SYSTEMS 3,5 3, 2,5 Total Passengers ('s) $25 $2 Operating Revenue Per Revenue Vehicle Hour* 2, $15 1,5 1, 5 $1 $5 $ 25 Revenue Vehicle Hours ('s) $8 Operating Expenses Per Revenue Vehicle Hour 2 $ $4 5 $2 $ 2,5 Revenue Vehicle M iles ('s) 24 Total Ridership Per Revenue Vehicle Hour 2, 2 1,5 1, Data prior to FY5-6 is inconsistent with Act 44 of 27 definitions *As of 28, per Act 44, Free Transit for Senior Citizen grants are reported as Act 44 operating assistance rather than revenue. Pennsylvania Public Transportation Performance Report - Fiscal Year
47 FACT (Fayette Area Coordinated Transportation) URBAN SYSTEMS Fayette Area Coordinated Transportation (FACT) 825 Airport Road Lemont Furnace, PA Ms. Lori Groover-Smith (Acting Director) Ext Service Area Statistics (2 Census) Square Miles: 79 Population: 148,644 House District Fayette: 49, 5, 51, 52, 58, 59 Senate District Fayette: 32 Fare Information Fixed Route Base: $1.4 Fixed Route Avg: $1.24 Last Base Fare Increase: July 28 (12%) Act 44 Fixed Route Distribution Factors Total Passengers: 131,581 Senior Passengers: 33,746 Revenue Vehicle Miles: 582,398 Revenue Vehicle Hours: 3,52 Employees Full Time Part Time Fixed Route: 1 6 Paratransit: 22 6 Systemwide: Act 44 Operating Assistance Operating Assistance: $582,62 Required Local Match: $87,393 Total Fleet Size Fixed Route: 1 Paratransit: 42 Systemwide: 52 OPERATING BUDGET OPERATING EXPENSE ('s) $1,784 OPERATING FUNDS ('s) $1,784 Other, $137 Op & Mech Salaries and Wages, $145 Admin Salaries and Wages, $47 Local, $163 Revenue, $38 Fringes, $86 State, $583 Purchased Trans, $1,71 Maint., $36 Fuel Utils, $262 Federal, $ Pennsylvania Public Transportation Performance Report - Fiscal Year 28-9
48 (Fayette Area Coordinated Transportation) FACT Community Transportation System Profile on page 92 $15 Operating Expense Per Passenger $12 $9 $6 $3 $ URBAN SYSTEMS Total Passengers ('s) $14 $12 Operating Revenue Per Revenue Vehicle Hour* 1 $1 8 $8 6 $6 4 $4 2 $2 $ Revenue Vehicle Hours ('s) Operating Expenses Per Revenue Vehicle Hour 35 $7 3 $6 25 $5 2 $4 15 $3 1 $2 5 $1 $ 7 Revenue Vehicle M iles ('s) 5 Total Ridership Per Revenue Vehicle Hour Data prior to FY5-6 is inconsistent with Act 44 of 27 definitions. *As of 28, per Act 44, Free Transit for Senior Citizen grants are reported as Act 44 operating assistance rather than revenue. Effective FY 28-9, subcontractors purchase fuel from FACT, resulting in a major increase in revenue. Pennsylvania Public Transportation Performance Report - Fiscal Year
49 HPT (Hazleton Public Transit) URBAN SYSTEMS Hazleton Public Transit (HPT) 4 North Church Street Hazleton, PA 1821 Ms. Renee Craig (Acting Director) Ext Service Area Statistics (2 Census) Square Miles: 12 Population: 52, House District Luzerne: 116, 122, 124 Senate District Luzerne: 14, 27, 29 Fare Information Fixed Route Base: $1.25 Fixed Route Avg: $1.34 Last Base Fare Increase: Oct. 26 (33%) Act 44 Fixed Route Distribution Factors Total Passengers: 247,29 Senior Passengers: 117,297 Revenue Vehicle Miles: 363,927 Revenue Vehicle Hours: 28,74 Employees Full Time Part Time Fixed Route: 29 Paratransit: 6 3 Systemwide: 35 3 Act 44 Operating Assistance Operating Assistance: $1,561,118 Required Local Match: $1,251 Total Fleet Size Fixed Route: 13 Paratransit: 3 Systemwide: 16 OPERATING BUDGET Fringes, $21 OPERATING EXPENSE ('s) $1,888 Fuel Utils, $22 Maint., $13 OPERATING FUNDS ('s) $1,888 Local, $66 Revenue, $175 Admin Salaries and Wages, $83 Op & Mech Salaries and Wages, $ Other, $127 Purchased Trans, $1,622 State, $1,23 Federal, $ Pennsylvania Public Transportation Performance Report - Fiscal Year 28-9
50 (Hazleton Public Transit) HPT $1 Operating Expense Per Passenger $8 $6 $4 $2 $ URBAN SYSTEMS 3 Total Passengers ('s) $12 Operating Revenue Per Revenue Vehicle Hour* 25 $1 2 $8 15 $6 1 $4 5 $2 $ 5 Revenue Vehicle Hours ('s) $8 Operating Expenses Per Revenue Vehicle Hour 4 $6 3 2 $4 1 $2 $ 6 Revenue Vehicle M iles ('s) 1 Total Ridership Per Revenue Vehicle Hour Data prior to FY5-6 is inconsistent with Act 44 of 27 definitions *As of 28, per Act 44, Free Transit for Senior Citizen grants are reported as Act 44 operating assistance rather than revenue. Pennsylvania Public Transportation Performance Report - Fiscal Year
51 LANTA (Lehigh and Northampton Transportation Authority) URBAN SYSTEMS Lehigh and Northampton Transportation Authority (LANTA) 16 Lehigh Street Allentown, PA 1813 Mr. Armando Greco (Executive Director) Service Area Statistics (2 Census) Square Miles: 1,615 Population: 579,156 House District Lehigh: 131, 132, 133, 134, 135, 183, 187 Northampton: 131, 133, 135, 136, 137, 138, 183 Senate District Lehigh: 16, 18, 24 Northampton: 16, 18, 24, 19 Fare Information Fixed Route Base: $2. Fixed Route Avg: $.75 Last Base Fare Increase: April 27 (15%) Act 44 Fixed Route Distribution Factors Total Passengers: 5,684,868 Senior Passengers: 849, Revenue Vehicle Miles: 3,869,929 Revenue Vehicle Hours: 245,289 Employees Full Time Part Time Fixed Route: Paratransit: 4 2 Systemwide: Act 44 Operating Assistance Operating Assistance: $11,64,826 Required Local Match: $617,18 Total Fleet Size Fixed Route: 78 Paratransit: 15 Systemwide: 183 OPERATING BUDGET OPERATING EXPENSE ('s) $2,919 Other, $4,716 Op & Mech Salaries & Wages, $5,753 OPERATING FUNDS ('s) $2,919 Revenue, $4,387 Local, $667 Purchased Trans, $61 Maint., $1,486 Fuel Utils, $2,852 Admin Salaries & Wages, $56 Fringes, $5,545 State, $1,558 Federal, $5,37 3 Pennsylvania Public Transportation Performance Report - Fiscal Year 28-9
52 (Lehigh and Northampton Transportation Authority) LANTA Community Transportation System Profile on page 96 $4 Operating Expense Per Passenger $3 $2 $1 $ URBAN SYSTEMS 6, Total Passengers ('s) $25 Operating Revenue Per Revenue Vehicle Hour* 5, 4, 3, 2, $2 $15 $1 1, $5 $ 3 Revenue Vehicle Hours ('s) $9 Operating Expenses Per Revenue Vehicle Hour 25 $75 2 $6 15 $45 1 $3 5 $15 $ 5, Revenue Vehicle M iles ('s) 24 Total Ridership Per Revenue Vehicle Hour 4, 2 3, 2, 1, Data prior to FY5-6 is inconsistent with Act 44 of 27 definitions *As of 28, per Act 44, Free Transit for Senior Citizen grants are reported as Act 44 operating assistance rather than revenue. Pennsylvania Public Transportation Performance Report - Fiscal Year
53 LCTA (Luzerne County Transportation Authority) URBAN SYSTEMS Luzerne County Transportation Authority (LCTA) 315 Northampton Street Kingston, PA 1874 Mr. Stanley Strelish (Executive Director) Service Area Statistics (2 Census) Square Miles: 56 Population: 22,5 House District Luzerne: 114, 116, 117, 118, 119, 12, 121 Senate District Luzerne: 14, 2, 22, 27 Fare Information Fixed Route Base: $1.5 Fixed Route Avg: $1.18 Last Base Fare Increase: Aug. 26 (2%) Act 44 Fixed Route Distribution Factors Total Passengers: 1,754,756 Senior Passengers: 777,891 Revenue Vehicle Miles: 1,1,531 Revenue Vehicle Hours: 77,516 Employees Full Time Part Time Fixed Route: 69 1 Paratransit: 12 Systemwide: 81 1 Act 44 Operating Assistance Operating Assistance: $4,877,313 Required Local Match: $38,28 Total Fleet Size Fixed Route: 38 Paratransit: 24 Systemwide: 62 OPERATING BUDGET OPERATING EXPENSE ('s) $6,491 OPERATING FUNDS ('s) $6,491 Purchased Trans, $315 Other, $394 Op & Mech Salaries and Wages, $2,547 Local, $441 Revenue, $1,14 Maint., $349 Fuel Utils, $685 Admin Salaries and Wages, $285 State, $3,327 Federal, $1,619 Fringes, $1, Pennsylvania Public Transportation Performance Report - Fiscal Year 28-9
54 (Luzerne County Transportation Authority) LCTA $5 Operating Expense Per Passenger $4 $3 $2 $1 $ URBAN SYSTEMS 1,8 Total Passengers ('s) $35 Operating Revenue Per Revenue Vehicle Hour* 1,5 $3 1,2 9 6 $25 $2 $15 $1 3 $5 $ Revenue Vehicle Hours ('s) Operating Expenses Per Revenue Vehicle Hour 1 $1 75 $8 5 $6 $4 25 $2 $ 1,2 Revenue Vehicle M iles ('s) 25 Total Ridership Per Revenue Vehicle Hour 1, Data prior to FY5-6 is inconsistent with Act 44 of 27 definitions *As of 28, per Act 44, Free Transit for Senior Citizen grants are reported as Act 44 operating assistance rather than revenue. Pennsylvania Public Transportation Performance Report - Fiscal Year
55 MMVTA (Mid Mon Valley Transit Authority) URBAN SYSTEMS Mid Mon Valley Transit Authority (MMVTA) 13 McKean Avenue Charleroi, PA 1522 Mrs. Valerie Kissell (Executive Director) Service Area Statistics (2 Census) Square Miles: 79 Population: 56,58 House District Washington: 39, 46, 48, 49, 5 Westmoreland: 25, 52, 54, 55, 56, 57, 58, 59 Senate District Washington: 32, 37, 46 Westmoreland: 32, 38, 39, 41, 45, 46 Fare Information Fixed Route Base: $2. Fixed Route Avg: $2.72 Last Base Fare Increase: July 28 (33%) Act 44 Fixed Route Distribution Factors Total Passengers: 374,271 Senior Passengers: 69,2 Revenue Vehicle Miles: 758,856 Revenue Vehicle Hours: 47,783 Employees Full Time Part Time Fixed Route: 7 Paratransit: Systemwide: 7 Act 44 Operating Assistance Operating Assistance: $2,156,246 Required Local Match: $47,374 Total Fleet Size Fixed Route: 25 Paratransit: 2 Systemwide: 27 OPERATING BUDGET Fringes, $125 Admin Salaries and Wages, $311 OPERATING EXPENSE ('s) $3,66 Fuel Utils, $41 Maint., $3 State, $1,662 Local, $58 OPERATING FUNDS ('s) $3,66 Revenue, $812 Op & Mech Salaries and Wages, $ Other, $376 Purchased Trans, $2,417 Federal, $1, Pennsylvania Public Transportation Performance Report - Fiscal Year 28-9
56 (Mid Mon Valley Transit Authority) MMVTA $15 Operating Expense Per Passenger $12 $9 $6 $3 $ URBAN SYSTEMS Total Passengers ('s) $25 $2 Operating Revenue Per Revenue Vehicle Hour* $15 $1 1 5 $5 $ Revenue Vehicle Hours ('s) Operating Expenses Per Revenue Vehicle Hour 6 $1 5 $ $6 $4 1 $2 $ 1, Revenue Vehicle M iles ('s) 1 Total Ridership Per Revenue Vehicle Hour Data prior to FY5-6 is inconsistent with Act 44 of 27 definitions *As of 28, per Act 44, Free Transit for Senior Citizen grants are reported as Act 44 operating assistance rather than revenue. Pennsylvania Public Transportation Performance Report - Fiscal Year
57 Pottstown, Borough of URBAN SYSTEMS Borough of Pottstown 1 East High Street Pottstown, PA Mr. Jason Bobst (Borough Manager) Service Area Statistics (2 Census) Square Miles: 34 Population: 51, House District Montgomery: 53, 61, 7, 146, 147, 148, 149, 15, 151, 152, 153, 154, 157, 17, 194 Senate District Montgomery: 4, 7, 1, 12, 17, 19, 24, 44 Fare Information Fixed Route Base: $1.5 Fixed Route Avg: $1.37 Last Base Fare Increase: 27 (2%) Act 44 Fixed Route Distribution Factors Total Passengers: 246,494 Senior Passengers: 37,649 Revenue Vehicle Miles: 33,179 Revenue Vehicle Hours: 2,429 Employees Full Time Part Time Fixed Route: 7 7 Paratransit: Systemwide: 7 7 Act 44 Operating Assistance Operating Assistance: $938,56 Required Local Match: $55,123 Total Fleet Size Fixed Route: 8 Paratransit: 2 Systemwide: 1 OPERATING BUDGET Fringes, $ Admin Salaries and Wages, $ OPERATING EXPENSE ('s) $1,75 Fuel Utils, $173 Maint., $ State, $654 Local, $86 OPERATING FUNDS ('s) $1,75 Revenue, $275 Op & Mech Salaries and Wages, $113 Other, $32 Purchased Trans, $1,387 Federal, $69 36 Pennsylvania Public Transportation Performance Report - Fiscal Year 28-9
58 Pottstown, Borough of $8 Operating Expense Per Passenger $6 $5 $3 $2 $ URBAN SYSTEMS 3 Total Passengers ('s) $2 Operating Revenue Per Revenue Vehicle Hour* $16 $12 $8 5 $4 $ Revenue Vehicle Hours ('s) Operating Expenses Per Revenue Vehicle Hour 3 $1 25 $ $6 $4 $2 $ 35 Revenue Vehicle M iles ('s) 15 Total Ridership Per Revenue Vehicle Hour Data prior to FY5-6 is inconsistent with Act 44 of 27 definitions *As of 28, per Act 44, Free Transit for Senior Citizen grants are reported as Act 44 operating assistance rather than revenue. Pennsylvania Public Transportation Performance Report - Fiscal Year
59 RRTA (Red Rose Transit Authority) URBAN SYSTEMS Red Rose Transit Authority (RRTA) 45 Erick Road Lancaster, PA 1761 Mr. David Kilmer (Executive Director) Service Area Statistics (2 Census) Square Miles: 952 Population: 42,92 House District Lancaster: 37, 41, 43, 96, 97, 98, 99, 1 Senate District Lancaster: 13, 36, 48 Fare Information Fixed Route Base: $1.5 Fixed Route Avg: $1.35 Last Base Fare Increase: July 27 (8%) Act 44 Fixed Route Distribution Factors Total Passengers: 2,79,387 Senior Passengers: 247,384 Revenue Vehicle Miles: 1,772,748 Revenue Vehicle Hours: 126,313 Employees Full Time Part Time Fixed Route: 8 11 Paratransit: 1 4 Systemwide: Act 44 Operating Assistance Operating Assistance: $4,439,756 Required Local Match: $193,521 Total Fleet Size Fixed Route: 43 Paratransit: 88 Systemwide: 131 OPERATING BUDGET OPERATING EXPENSE ('s) $9,144 OPERATING FUNDS ('s) $9,144 Purchased Trans, $629 Other, $596 Op & Mech Salaries and Wages, $3,171 Local, $222 Revenue, $2,551 Maint., $77 State, $4,468 Fuel Utils, $1,284 Admin Salaries and Wages, $344 Federal, $1,93 Fringes, $2,35 38 Pennsylvania Public Transportation Performance Report - Fiscal Year 28-9
60 (Red Rose Transit Authority) RRTA Community Transportation System Profile on page 12 $5 Operating Expense Per Passenger $4 $3 $2 $1 $ URBAN SYSTEMS 2,5 Total Passengers ('s) $25 Operating Revenue Per Revenue Vehicle Hour* 2, $2 1,5 $15 1, $1 5 $5 $ 15 Revenue Vehicle Hours ('s) $8 Operating Expenses Per Revenue Vehicle Hour 12 $7 $6 9 6 $5 $4 $3 3 $2 $1 $ 2, Revenue Vehicle M iles ('s) 2 Total Ridership Per Revenue Vehicle Hour 1, , Data prior to FY5-6 is inconsistent with Act 44 of 27 definitions *As of 28, per Act 44, Free Transit for Senior Citizen grants are reported as Act 44 operating assistance rather than revenue. Pennsylvania Public Transportation Performance Report - Fiscal Year
61 SVSS (Shenango Valley Shuttle Service) URBAN SYSTEMS Shenango Valley Shuttle Service 2495 Highland Road Hermitage, PA Mr. Thomas Tulip (Administrator) Service Area Statistics (2 Census) Square Miles: 672 Population: 12,293 House District Mercer: 7, 8, 17 Senate District Mercer: 5 Fare Information Fixed Route Base: $1. Fixed Route Avg: $.57 Last Base Fare Increase: July 26 (33%) Act 44 Fixed Route Distribution Factors Total Passengers: 97,158 Senior Passengers: 29,14 Revenue Vehicle Miles: 142,34 Revenue Vehicle Hours: 13,183 Employees Full Time Part Time Fixed Route: 5 1 Paratransit: 1 1 Systemwide: 6 2 Act 44 Operating Assistance Operating Assistance: $648,813 Required Local Match: $39,827 Total Fleet Size Fixed Route: 6 Paratransit: 1 Systemwide: 7 OPERATING BUDGET Other, $275 Purchased Trans, $ OPERATING EXPENSE ('s) $771 Op & Mech Salaries and Wages, $174 Admin Salaries and Wages, $6 OPERATING FUNDS ('s) $771 Local, $4 Revenue, $129 Federal, $ Maint., $86 Fuel Utils, $9 Fringes, $86 State, $62 4 Pennsylvania Public Transportation Performance Report - Fiscal Year 28-9
62 (Shenango Valley Shuttle Service) SVSS Community Transportation System Profile on page 97 (Mercer County) $1 Operating Expense Per Passenger $8 $6 $4 $2 $ URBAN SYSTEMS 15 Total Passengers ('s) $12 Operating Revenue Per Revenue Vehicle Hour* 12 $1 9 6 $8 $6 $4 3 $2 $ 2 Revenue Vehicle Hours ('s) $1 Operating Expenses Per Revenue Vehicle Hour 15 $8 1 $6 $4 5 $2 $ 2 Revenue Vehicle M iles ('s) 12 Total Ridership Per Revenue Vehicle Hour Data prior to 26 is inconsistent with Act 44 of 27 definitions *As of 28, per Act 44, Free Transit for Senior Citizen grants are reported as Act 44 operating assistance rather than revenue. Pennsylvania Public Transportation Performance Report - Fiscal Year
63 Washington, City of URBAN SYSTEMS City of Washington 55 W. Maiden Street Washington, PA 1531 Ms. Nancy Basile (Transit Coordinator) Service Area Statistics (2 Census) Square Miles: 33 Population: 61,634 House District Washington: 39, 4, 46, 48, 49, 5 Senate District Washington: 32, 37, 46 Fare Information Fixed Route Base: $1.1 Fixed Route Avg: $2.21 Last Base Fare Increase: June 24 (1%) Act 44 Fixed Route Distribution Factors Total Passengers: 47,431 Senior Passengers: 17,1 Revenue Vehicle Miles: 169,536 Revenue Vehicle Hours: 12,76 Employees Full Time Part Time Fixed Route: 3 1 Paratransit: 1 3 Systemwide: 4 13 Act 44 Operating Assistance Operating Assistance: $955,921 Required Local Match: $115,478 Total Fleet Size Fixed Route: 5 Paratransit: 4 Systemwide: 9 OPERATING BUDGET Other, $283 OPERATING EXPENSE ('s) $998 Op & Mech Salaries and Wages, $25 OPERATING FUNDS ('s) $998 Revenue, $78 Local, $115 Federal, $ Purchased Trans, $ Maint., $77 Fuel Utils, $184 Admin Salaries and Wages, $179 Fringes, $25 State, $85 42 Pennsylvania Public Transportation Performance Report - Fiscal Year 28-9
64 Washington, City of $24 Operating Expense Per Passenger $2 $16 $12 $8 $4 $ URBAN SYSTEMS 5 Total Passengers ('s) $1 Operating Revenue Per Revenue Vehicle Hour* 4 $8 3 $6 2 $4 1 $2 $ Revenue Vehicle Hours ('s) Operating Expenses Per Revenue Vehicle Hour 15 $1 12 $8 9 $6 6 $4 3 $2 $ 2 Revenue Vehicle M iles ('s) 5 Total Ridership Per Revenue Vehicle Hour Data prior to FY5-6 is inconsistent with Act 44 of 27 definitions *As of 28, per Act 44, Free Transit for Senior Citizen grants are reported as Act 44 operating assistance rather than revenue. Pennsylvania Public Transportation Performance Report - Fiscal Year
65 WCTA (Westmoreland County Transit Authority*) URBAN SYSTEMS Westmoreland County Transit Authority (WCTA) 41 Bell Way Greensburg, PA 1561 Mr. Larry Morris (Executive Director) Service Area Statistics (2 Census) Square Miles: 664 Population: 297,851 House District Westmoreland: 25, 52, 54, 55, 56, 57, 58, 59 Senate District Westmoreland: 32, 38, 39, 41, 45, 46 Fare Information Fixed Route Base: $1.5 Fixed Route Avg: $1.83 Last Base Fare Increase: Feb. 28 (25%) Act 44 Fixed Route Distribution Factors Total Passengers: 463,29 Senior Passengers: 8,685 Revenue Vehicle Miles: 93,143 Revenue Vehicle Hours: 46,111 Employees Full Time Part Time Fixed Route: Paratransit: Systemwide: Act 44 Operating Assistance Operating Assistance: $2,39,122 Required Local Match: $223,73 Total Fleet Size Fixed Route: 33 Paratransit: 92 Systemwide: 125 OPERATING BUDGET OPERATING EXPENSE ('s) $4,469 OPERATING FUNDS ('s) $4,469 Fringes, $97 Fuel Utils, $513 Maint., $265 Local, $35 Revenue, $938 Admin Salaries and Wages, $336 Op & Mech Salaries and Wages, $ Other, $198 Purchased Trans, $3,6 State, $1,871 Federal, $1,31 *Includes Rural Service 44 Pennsylvania Public Transportation Performance Report - Fiscal Year 28-9
66 (Westmoreland County Transit Authority) WCTA $12 Operating Expense Per Passenger $1 $8 $6 $4 $2 $ URBAN SYSTEMS 5 Total Passengers ('s) $3 Operating Revenue Per Revenue Vehicle Hour* 4 $ $2 $15 $1 1 $5 $ 5 Revenue Vehicle Hours ('s) $12 Operating Expenses Per Revenue Vehicle Hour 4 $1 3 2 $8 $6 $4 1 $2 $ 1, Revenue Vehicle M iles ('s) 12 Total Ridership Per Revenue Vehicle Hour Data prior to FY5-6 is inconsistent with Act 44 of 27 definitions *As of 28, per Act 44, Free Transit for Senior Citizen grants are reported as Act 44 operating assistance rather than revenue. Pennsylvania Public Transportation Performance Report - Fiscal Year
67 Williamsport RVT (River Valley Transit) URBAN SYSTEMS River Valley Transit (RVT) 15 West Third Street Williamsport, PA 1771 Mr. William Nichols, Jr. (General Manager) Service Area Statistics (2 Census) Square Miles: 89 Population: 69,764 House District Lycoming: 83, 84 Senate District Lycoming: 23 Fare Information Fixed Route Base: $2. Fixed Route Avg: $.79 Last Base Fare Increase: May 25 (33%) Act 44 Fixed Route Distribution Factors Total Passengers: 1,297,367 Senior Passengers: 214,278 Revenue Vehicle Miles: 843,496 Revenue Vehicle Hours: 55,66 Employees Full Time Part Time Fixed Route: 42 6 Paratransit: 2 Systemwide: 42 8 Act 44 Operating Assistance Operating Assistance: $3,231,299 Required Local Match: $237,325 Total Fleet Size Fixed Route: 33 Paratransit: 2 Systemwide: 35 OPERATING BUDGET Purchased Trans, $24 Maint., $24 OPERATING EXPENSE ('s) $4,63 Other, $854 Op & Mech Salaries and Wages, $1,736 Local, $237 OPERATING FUNDS ('s) $4,63 Revenue, $891 Federal, $4 Fuel Utils, $683 Fringes, $777 Admin Salaries and Wages, $325 State, $3,75 46 Pennsylvania Public Transportation Performance Report - Fiscal Year 28-9
68 (River Valley Transit) Williamsport RVT $4 Operating Expense Per Passenger $3 $2 $1 $ URBAN SYSTEMS 1,4 1,2 1, Total Passengers ('s) $3 $25 $2 $15 $1 $5 Operating Revenue Per Revenue Vehicle Hour* $ Revenue Vehicle Hours ('s) Operating Expenses Per Revenue Vehicle Hour 6 $1 5 $ $6 $4 $2 $ 1, Revenue Vehicle M iles ('s) 3 Total Ridership Per Revenue Vehicle Hour Data prior to FY5-6 is inconsistent with Act 44 of 27 definitions *As of 28, per Act 44, Free Transit for Senior Citizen grants are reported as Act 44 operating assistance rather than revenue. Pennsylvania Public Transportation Performance Report - Fiscal Year
69 YCTA (York County Transportation Authority*) URBAN SYSTEMS York County Transportation Authority 123 Roosevelt Avenue York, PA 1744 Mr. Richard Farr (Executive Director) Service Area Statistics (2 Census) Square Miles: 911 Population: 381,751 House District York: 47, 92, 93, 94, 95, 193, 196 Senate District York: 13, 15, 28, 31, 33 Fare Information Fixed Route Base: $1.35 Fixed Route Avg: $1.49 Last Base Fare Increase: Jan. 27 (4%) Act 44 Fixed Route Distribution Factors Total Passengers: 1,426,775 Senior Passengers: 154,43 Revenue Vehicle Miles: 1,547,746 Revenue Vehicle Hours: 116,931 Employees Full Time Part Time Fixed Route: 76 2 Paratransit: Systemwide: Act 44 Operating Assistance Operating Assistance: $3,995,218 Required Local Match: $283,498 Total Fleet Size Fixed Route: 36 Paratransit: 55 Systemwide: 91 OPERATING BUDGET Purchased Trans, $736 OPERATING EXPENSE ('s) $8,21 Other, $1,169 Op & Mech Salaries and Wages, $2,821 Local, $465 OPERATING FUNDS ('s) $8,21 Revenue, $1,838 Maint., $411 Fuel Utils, $1,398 Fringes, $1,43 Admin Salaries and Wages, $236 State, $2,857 Federal, $3,41 *Includes Rural Service 48 Pennsylvania Public Transportation Performance Report - Fiscal Year 28-9
70 (York County Transportation Authority) YCTA Community Transportation System Profile on page 18 $6 Operating Expense Per Passenger $5 $4 $3 $2 $1 $ URBAN SYSTEMS 2,5 Total Passengers ('s) $25 Operating Revenue Per Revenue Vehicle Hour* 2, $2 1,5 $15 1, $1 5 $5 $ Revenue Vehicle Hours ('s) Operating Expenses Per Revenue Vehicle Hour 14 $ $6 8 6 $4 4 $2 2 $ 1,8 Revenue Vehicle M iles ('s) 2 Total Ridership Per Revenue Vehicle Hour 1,5 16 1, Data prior to FY5-6 is inconsistent with Act 44 of 27 definitions *As of 28, per Act 44, Free Transit for Senior Citizen grants are reported as Act 44 operating assistance rather than revenue. Pennsylvania Public Transportation Performance Report - Fiscal Year
71
72 Section II Rural Systems RURAL SYSTEMS Pennsylvania Public Transportation Performance Report - Fiscal Year
73 ATA (Area Transportation Authority of North Central PA) Area Transportation (ATA) 44 Transportation Center Johnsonburg, PA Mr. Michael Imbrogno (Chief Executive Officer) House District Cameron: 67 Clearfield: 74, 75 Elk: 75 Jefferson: 66 McKean: 65, 67 Potter: 67 Senate District Cameron: 25 Clearfield: 25, 35, 41 Elk: 25 Jefferson: 25 McKean: 25 Potter: 25 RURAL SYSTEMS Service Area Statistics (2 Census) Square Miles: 5,91 Population: 234,416 Fare Information: Fixed Route Base: $1.25 Fixed Route Avg: $1.6 Last Base Fare Increase: July 28 (25%) Act 44 Fixed Route Distribution Factors Total Passengers: 319,395 Senior Passengers: 25,478 Revenue Vehicle Miles: 1,191,183 Revenue Vehicle Hours: 93,385 Employees Full Time Part Time Fixed Route: 2 9 Paratransit: Systemwide: 2 9 Act 44 Operating Assistance Operating Assistance: $3,197,78 Required Local Match: $195,24 Total Fleet Size Fixed Route: 87 Paratransit: Systemwide: 87 OPERATING BUDGET Purchased Trans, $186 Maint., $247 Other, $588 OPERATING EXPENSE ('s) $4,755 Op & Mech Salaries and Wages, $1,578 Local, $195 State, $1,696 OPERATING FUNDS ('s) $4,755 Revenue, $973 Fuel Utils, $456 Fringes, $1,121 Admin Salaries and Wages, $579 Federal, $1, Pennsylvania Public Transportation Performance Report - Fiscal Year 28-9
74 (Area Transportation Authority of North Central PA) ATA Community Transportation System Profile on page 83 $16 Operating Expense Per Passenger $14 $12 $1 $8 $6 $ Total Passengers ('s) $2 $ $12 $1 $8 Operating Revenue Per Revenue Vehicle Hour* RURAL SYSTEMS $6 $4 $2 $ Revenue Vehicle Hours ('s) Operating Expenses Per Revenue Vehicle Hour 1 $6 8 $5 6 4 $4 $3 $2 2 $1 $ Revenue Vehicle M iles ('s) Total Ridership Per Revenue Vehicle Hour 1,4 5 1,2 1, Data prior to FY5-6 is inconsistent with Act 44 of 27 definitions *As of 28, per Act 44, Free Transit for Senior Citizen grants are reported as Act 44 operating assistance rather than revenue. Pennsylvania Public Transportation Performance Report - Fiscal Year
75 BTA (Butler Transit Authority) Butler Transit Authority (BTA) 21 South Main Street, Suite 12 Butler, PA 161 Mr. John H. Paul (Executive Director) House District Butler: 8, 1, 11, 12, 64 Senate District Butler: 21, 4, 41, 5 RURAL SYSTEMS Service Area Statistics (2 Census) Square Miles: 15 Population: 33,339 Fare Information: Fixed Route Base: $1. Fixed Route Avg: $1.11 Last Base Fare Increase: July 22 (25%) Act 44 Fixed Route Distribution Factors Total Passengers: 239,9 Senior Passengers: 56,13 Revenue Vehicle Miles: 229,114 Revenue Vehicle Hours: 17,92 Employees Full Time Part Time Fixed Route: 3 4 Paratransit: Systemwide: 3 4 Act 44 Operating Assistance Operating Assistance: $591,451 Required Local Match: $32,179 Total Fleet Size Fixed Route: 6 Paratransit: Systemwide: 6 OPERATING BUDGET Other, $233 Op & Mech Salaries and Wages, $ OPERATING EXPENSE ('s) $1,261 Admin Salaries and Wages, $158 Fringes, $43 OPERATING FUNDS ('s) $1,261 Revenue, Local, $32 $22 Purchased Trans, $646 Fuel Utils, $146 Maint., $33 State, $497 Federal, $53 54 Pennsylvania Public Transportation Performance Report - Fiscal Year 28-9
76 (Butler Transit Authority) BTA $8 Operating Expense Per Passenger $7 $6 $5 $4 $3 $ Total Passengers ('s) $1 $ $12 $1 $8 $6 $4 Operating Revenue Per Revenue Vehicle Hour* RURAL SYSTEMS 5 $2 $ Revenue Vehicle Hours ('s) Operating Expenses Per Revenue Vehicle Hour 2 $1 16 $8 12 $6 8 $4 4 $2 $ 25 Revenue Vehicle M iles ('s) 14 Total Ridership Per Revenue Vehicle Hour Data prior to FY5-6 is inconsistent with Act 44 of 27 definitions *As of 28, per Act 44, Free Transit for Senior Citizen grants are reported as Act 44 operating assistance rather than revenue. Pennsylvania Public Transportation Performance Report - Fiscal Year
77 Carbon County Community Transit Carbon County (CARBON) Carbon County Courthouse Jim Thorpe, PA Mr. Denis J. Meyers (Director) House District Carbon: 122 Senate District Carbon: 14, 29 RURAL SYSTEMS Service Area Statistics (2 Census) Square Miles: 381 Population: 58,82 Fare Information: Fixed Route Base: $1.5 Fixed Route Avg: $1.37 Last Base Fare Increase: Nov (5%) Act 44 Fixed Route Distribution Factors Total Passengers: 8,15 Senior Passengers: 6,738 Revenue Vehicle Miles: 33,15 Revenue Vehicle Hours: 1,68 Employees Full Time Part Time Fixed Route: 26 Paratransit: 3 Systemwide: 56 Act 44 Operating Assistance Operating Assistance: $22,449 Required Local Match: $25,274 Total Fleet Size Fixed Route: 1 Paratransit: 17 Systemwide: 18 OPERATING BUDGET OPERATING EXPENSE ('s) $113 OPERATING FUNDS ('s) $113 Other, $13 Revenue, $7 Federal, $ Local, $12 Purchased Trans, $1 State, $93 56 Pennsylvania Public Transportation Performance Report - Fiscal Year 28-9
78 Carbon County Community Transit Community Transportation System Profile on page 87 $1 Operating Expense Per Passenger $8 $6 $4 $ Total Passengers ('s) $ $6 $5 $4 Operating Revenue Per Revenue Vehicle Hour* RURAL SYSTEMS 9 $3 6 $2 3 $1 $ Revenue Vehicle Hours ('s) Operating Expenses Per Revenue Vehicle Hour 5 $5 4 $4 3 $3 2 $2 1 $1 $ 1 Revenue Vehicle M iles ('s) 5 Total Ridership Per Revenue Vehicle Hour Data prior to FY5-6 is inconsistent with Act 44 of 27 definitions *As of 28, per Act 44, Free Transit for Senior Citizen grants are reported as Act 44 operating assistance rather than revenue. Pennsylvania Public Transportation Performance Report - Fiscal Year
79 CATA (Crawford Area Transportation Authority) Crawford Area Transportation Authority (CATA) Room 21, Professional Building 231 Chestnut Street Meadville, PA Mr. Timothy C. Geibel (Executive Director) House District Crawford: 5, 6, 17 Senate District Crawford: 5 RURAL SYSTEMS Service Area Statistics (2 Census) Square Miles: 1.5 Population: 86,169 Fare Information: Fixed Route Base: $1. Fixed Route Avg: $.66 Last Base Fare Increase: Aug. 24 (25%) Act 44 Fixed Route Distribution Factors Total Passengers: 28,795 Senior Passengers: 36,75 Revenue Vehicle Miles: 188,257 Revenue Vehicle Hours: 16,15 Employees Full Time Part Time Fixed Route: 1 Paratransit: 8 4 Systemwide: 8 5 Act 44 Operating Assistance Operating Assistance: $5,885 Required Local Match: $25,699 Total Fleet Size Fixed Route: 5 Paratransit: 14 Systemwide: 19 OPERATING BUDGET OPERATING EXPENSE ('s) $697 OPERATING FUNDS ('s) $697 Fringes, $12 Fuel Utils, $95 Maint., $24 Local, $26 Revenue, $156 Admin Salaries and Wages, $72 State, $31 Op & Mech Salaries and Wages, $1 Other, $3 Purchased Trans, $463 Federal, $ Pennsylvania Public Transportation Performance Report - Fiscal Year 28-9
80 (Crawford Area Transportation Authority) CATA Community Transportation System Profile on page 9 $5 Operating Expense Per Passenger $4 $3 $2 $ Total Passengers ('s) $ $1 $8 Operating Revenue Per Revenue Vehicle Hour* RURAL SYSTEMS 15 $6 1 $4 5 $2 $ Revenue Vehicle Hours ('s) Operating Expenses Per Revenue Vehicle Hour 2 $6 16 $ $4 $3 $2 4 $1 $ 25 Revenue Vehicle M iles ('s) 15 Total Ridership Per Revenue Vehicle Hour Data prior to FY5-6 is inconsistent with Act 44 of 27 definitions *As of 28, per Act 44, Free Transit for Senior Citizen grants are reported as Act 44 operating assistance rather than revenue. Pennsylvania Public Transportation Performance Report - Fiscal Year
81 DuFAST (DuBois, Falls Creek, Sandy Township Joint Transportation Authority) DuBois, Falls Creek, Sandy Township Joint Transportation Authority (DuFAST) 178 Spider Lake Road DuBois, PA 1581 Ms. Kristen Vida (Executive Director) House District Clearfield: 74, 75 Senate District Clearfield: 25, 35, 41 RURAL SYSTEMS Service Area Statistics (2 Census) Square Miles: 57.8 Population: 18,378 Fare Information: Fixed Route Base: $1.25 Fixed Route Avg: $.68 Last Base Fare Increase: July 29 (25%) Act 44 Fixed Route Distribution Factors Total Passengers: 64,77 Senior Passengers: 27,285 Revenue Vehicle Miles: 125,555 Revenue Vehicle Hours: 9,681 Employees Full Time Part Time Fixed Route: 8 Paratransit: Systemwide: 8 Act 44 Operating Assistance Operating Assistance: $447,72 Required Local Match: $31,389 Total Fleet Size Fixed Route: 5 Paratransit: Systemwide: 5 OPERATING BUDGET Purchased Trans, $ Maint., $19 OPERATING EXPENSE ('s) $51 Other, $12 Op & Mech Salaries and Wages, $172 OPERATING FUNDS ('s) $51 Revenue, $32 Local, $38 Federal, $119 Fuel Utils, $69 Fringes, $77 Admin Salaries and Wages, $71 State, $321 6 Pennsylvania Public Transportation Performance Report - Fiscal Year 28-9
82 (DuBois, Falls Creek, Sandy Township Joint Transportation Authority) DuFAST $12 Operating Expense Per Passenger $1 $8 $6 $4 $ Total Passengers ('s) $ $4 $3 Operating Revenue Per Revenue Vehicle Hour* RURAL SYSTEMS 4 3 $2 2 1 $1 $ Revenue Vehicle Hours ('s) Operating Expenses Per Revenue Vehicle Hour 12 $6 1 $5 8 $4 6 $3 4 $2 2 $1 $ Revenue Vehicle M iles ('s) 7 6 Total Ridership Per Revenue Vehicle Hour Data prior to FY5-6 is inconsistent with Act 44 of 27 definitions *As of 28, per Act 44, Free Transit for Senior Citizen grants are reported as Act 44 operating assistance rather than revenue. Pennsylvania Public Transportation Performance Report - Fiscal Year
83 EMTA (Endless Mountains Transportation Authority) Endless Mountains Transportation Authority (EMTA) Route 22 Athens, PA 1881 Ms. Karen Graber (General Manager) House District Bradford: 68, 11 Sullivan: 11 Tioga: 68 Senate District Bradford: 23 Sullivan: 23 Tioga: 25 RURAL SYSTEMS Service Area Statistics (2 Census) Square Miles: 2,734 Population: 11,69 Fare Information: Fixed Route Base: $1. Fixed Route Avg: $1.16 Last Base Fare Increase: Oct. 25 (25%) Act 44 Fixed Route Distribution Factors Total Passengers: 142,632 Senior Passengers: 22,155 Revenue Vehicle Miles: 78,47 Revenue Vehicle Hours: 35,712 Employees Full Time Part Time Fixed Route: 8 13 Paratransit: 9 17 Systemwide: 17 3 Act 44 Operating Assistance Operating Assistance: $552,649 Required Local Match: $42,585 Total Fleet Size Fixed Route: 19 Paratransit: 46 Systemwide: 65 OPERATING BUDGET Purchased Trans, $ Maint., $67 OPERATING EXPENSE ('s) $1,251 Other, $83 Op & Mech Salaries & Wages, $566 Local, $72 OPERATING FUNDS ('s) $1,251 Revenue, $148 Fuel Utils, $26 State, $465 Fringes, $241 Admin Salaries & Wages, $88 Federal, $ Pennsylvania Public Transportation Performance Report - Fiscal Year 28-9
84 (Endless Mountains Transportation Authority) EMTA Community Transportation System Profile on page 91 $12 Operating Expense Per Passenger $1 $8 $6 $4 $ Total Passengers ('s) $ $1 $8 $6 $4 Operating Revenue Per Revenue Vehicle Hour* RURAL SYSTEMS 4 2 $2 $ Revenue Vehicle Hours ('s) Operating Expenses Per Revenue Vehicle Hour 4 $ $6 $5 $4 $3 $2 $1 $ Revenue Vehicle M iles ('s) Total Ridership Per Revenue Vehicle Hour Data prior to FY5-6 is inconsistent with Act 44 of 27 definitions *As of 28, per Act 44, Free Transit for Senior Citizen grants are reported as Act 44 operating assistance rather than revenue. Pennsylvania Public Transportation Performance Report - Fiscal Year
85 Indigo (Indiana County Transit Authority) Indiana County Transit Authority (INDIGO) P.O. Box 869 Indiana, PA 1571 Mr. John Kanyan (Executive Director) House District Indiana: 6, 62, 66 Senate District Indiana: 41 RURAL SYSTEMS Service Area Statistics (2 Census) Square Miles: 83 Population: 89,994 Fare Information: Fixed Route Base: $1. Fixed Route Avg: $1. Last Base Fare Increase: July 1999 (25%) Act 44 Fixed Route Distribution Factors Total Passengers: 446,185 Senior Passengers: 24,11 Revenue Vehicle Miles: 414,264 Revenue Vehicle Hours: 3,134 Employees Full Time Part Time Fixed Route: 3 11 Paratransit: 2 3 Systemwide: Act 44 Operating Assistance Operating Assistance: $98,918 Required Local Match: $4,614 Total Fleet Size Fixed Route: 15 Paratransit: 19 Systemwide: 34 OPERATING BUDGET Purchased Trans, $ Maint., $158 Fuel Utils, $192 OPERATING EXPENSE ('s) $1,939 Other, $168 Op & Mech Salaries and Wages, $758 State, $737 Local, $41 OPERATING FUNDS ('s) $1,939 Revenue, $533 Fringes, $444 Admin Salaries and Wages, $22 Federal, $ Pennsylvania Public Transportation Performance Report - Fiscal Year 28-9
86 (Indiana County Transit Authority) Indigo Community Transportation System Profile on page 95 $8 Operating Expense Per Passenger $7 $6 $5 $4 $3 $ Total Passengers ('s) $1 $ $21 $18 $15 $12 $9 $6 $3 $ Operating Revenue Per Revenue Vehicle Hour* RURAL SYSTEMS Revenue Vehicle Hours ('s) Operating Expenses Per Revenue Vehicle Hour 35 $ $7 $6 $5 $4 $3 $2 $1 $ Revenue Vehicle M iles ('s) Total Ridership Per Revenue Vehicle Hour Data prior to FY5-6 is inconsistent with Act 44 of 27 definitions *As of 28, per Act 44, Free Transit for Senior Citizen grants are reported as Act 44 operating assistance rather than revenue. Pennsylvania Public Transportation Performance Report - Fiscal Year
87 Mid-County Transit Mid-County Transit 22 North Grant Avenue Kittanning, PA 1621 Mr. Scott Kloes (General Manager) House District Armstrong: 6, 63 Senate District Armstrong: 41 RURAL SYSTEMS Service Area Statistics (2 Census) Square Miles: 19.7 Population: 11,837 Fare Information: Fixed Route Base: $1. Fixed Route Avg: $1.19 Last Base Fare Increase: Aug. 23 (25%) Act 44 Fixed Route Distribution Factors Total Passengers: 53,793 Senior Passengers: 3,145 Revenue Vehicle Miles: 151,577 Revenue Vehicle Hours: 1,753 Employees Full Time Part Time Fixed Route: 7 3 Paratransit: Systemwide: 7 3 Act 44 Operating Assistance Operating Assistance: $52,281 Required Local Match: $28,654 Total Fleet Size Fixed Route: 6 Paratransit: Systemwide: 6 OPERATING BUDGET Purchased Trans, $ OPERATING EXPENSE ('s) $682 Other, $98 Op & Mech Salaries & Wages, $25 Local, $3 OPERATING FUNDS ('s) $682 Revenue, $77 Maint., $69 State, $245 Fuel Utils, $11 Fringes, $95 Admin Salaries & Wages, $114 Federal, $33 66 Pennsylvania Public Transportation Performance Report - Fiscal Year 28-9
88 Mid-County Transit Community Transportation System Profile on page 97 $14 $12 Operating Expense Per Passenger $1 $8 $6 $ Total Passengers ('s) $2 $ $8 $7 $6 $5 $4 $3 $2 $1 $ Operating Revenue Per Revenue Vehicle Hour* RURAL SYSTEMS Revenue Vehicle Hours ('s) Operating Expenses Per Revenue Vehicle Hour 15 $ $6 $5 $4 6 3 $3 $2 $1 $ Revenue Vehicle M iles ('s) Total Ridership Per Revenue Vehicle Hour Data prior to FY5-6 is inconsistent with Act 44 of 27 definitions *As of 28, per Act 44, Free Transit for Senior Citizen grants are reported as Act 44 operating assistance rather than revenue. Pennsylvania Public Transportation Performance Report - Fiscal Year
89 MCTA (Monroe County Transportation Authority) Monroe County Transportation Authority (MCTA) P.O. Box 339 Scotrun, PA Ms. Peggy Howarth (Executive Director) House District Monroe: 118, 139, 176, 189 Senate District Monroe: 14, 16, 18, 2, 22, 29 RURAL SYSTEMS Service Area Statistics (2 Census) Square Miles: 611 Population: 138,687 Fare Information: Fixed Route Base: $1.25 Fixed Route Avg: $.66 Last Base Fare Increase: Feb (25%) Act 44 Fixed Route Distribution Factors Total Passengers: 347,95 Senior Passengers: 29,39 Revenue Vehicle Miles: 537,79 Revenue Vehicle Hours: 37,167 Employees Full Time Part Time Fixed Route: 15 9 Paratransit: 7 15 Systemwide: Act 44 Operating Assistance Operating Assistance: $1,646,699 Required Local Match: $15,18 Total Fleet Size Fixed Route: 15 Paratransit: 35 Systemwide: 5 OPERATING BUDGET Purchased Trans, $25 Other, $429 OPERATING EXPENSE ('s) $3,182 Op & Mech Salaries & Wages, $1, Local, $15 OPERATING FUNDS ('s) $3,182 Revenue, $672 Maint., $278 Fuel Utils, $433 Fringes, $597 Admin Salaries & Wages, $42 State, $1,493 Federal, $ Pennsylvania Public Transportation Performance Report - Fiscal Year 28-9
90 (Monroe County Transportation Authority) MCTA Community Transportation System Profile on page 98 $14 $12 Operating Expense Per Passenger $1 $8 $6 $ Total Passengers ('s) $2 $ $25 $2 Operating Revenue Per Revenue Vehicle Hour* RURAL SYSTEMS 225 $15 15 $1 75 $5 $ Revenue Vehicle Hours ('s) Operating Expenses Per Revenue Vehicle Hour 4 $ $ $6 $4 1 5 $2 $ Revenue Vehicle M iles ('s) Total Ridership Per Revenue Vehicle Hour Data prior to FY5-6 is inconsistent with Act 44 of 27 definitions *As of 28, per Act 44, Free Transit for Senior Citizen grants are reported as Act 44 operating assistance rather than revenue. Pennsylvania Public Transportation Performance Report - Fiscal Year
91 Mount Carmel, Borough of Borough of Mount Carmel 137 West Fourth Street, Suite 1 Mr. Jerry Matzura (Transit Manager) Ext. 12 House District Northumberland: 17 Senate District Northumberland: 27 RURAL SYSTEMS Service Area Statistics (2 Census) Square Miles: 56 Population: 33, Fare Information: Fixed Route Base: $1. Fixed Route Avg: $1.2 Last Base Fare Increase: Aug. 27 (3%) Act 44 Fixed Route Distribution Factors Total Passengers: 56,46 Senior Passengers: 5,25 Revenue Vehicle Miles: 5,677 Revenue Vehicle Hours: 5,9 Employees Full Time Part Time Fixed Route: 8 Paratransit: Systemwide: 8 Act 44 Operating Assistance Operating Assistance: $283,72 Required Local Match: $8,248 Total Fleet Size Fixed Route: 3 Paratransit: Systemwide: 3 OPERATING BUDGET OPERATING EXPENSE ('s) $513 Op & Mech Other, $5 Salaries and Wages, $ Local, $8 OPERATING FUNDS ('s) $513 Revenue, $8 Purchased Trans, $398 Maint., $6 Admin Salaries and Wages, $65 Fringes, $35 Fuel Utils, $3 State, $321 Federal, $175 7 Pennsylvania Public Transportation Performance Report - Fiscal Year 28-9
92 Mount Carmel, Borough of $1 Operating Expense Per Passenger $8 $6 $4 $ Total Passengers ('s) $ $2. $1.5 Operating Revenue Per Revenue Vehicle Hour* RURAL SYSTEMS 4 3 $ $.5 $. Revenue Vehicle Hours ('s) Operating Expenses Per Revenue Vehicle Hour 6 $12 5 $1 4 $8 3 $6 2 $4 1 $2 $ 6 Revenue Vehicle M iles ('s) 12 Total Ridership Per Revenue Vehicle Hour Data prior to FY5-6 is inconsistent with Act 44 of 27 definitions *As of 28, per Act 44, Free Transit for Senior Citizen grants are reported as Act 44 operating assistance rather than revenue. Pennsylvania Public Transportation Performance Report - Fiscal Year
93 NCATA (New Castle Area Transit Authority) New Castle Area Transit Authority (NCATA) 311 Mahoning Avenue New Castle, PA 1612 Mr. Leonard L. Lastoria (General Manager) House District Lawrence: 9, 1, 17 Senate District Lawrence: 47, 5 RURAL SYSTEMS Service Area Statistics (2 Census) Square Miles: 177 Population: 96,246 Fare Information: Fixed Route Base: $.75 Fixed Route Avg: $1.25 Last Base Fare Increase: July 1989 (25%) Act 44 Fixed Route Distribution Factors Total Passengers: 1,96,71 Senior Passengers: 443,495 Revenue Vehicle Miles: 1,12,299 Revenue Vehicle Hours: 54,117 Employees Full Time Part Time Fixed Route: 55 Paratransit: Systemwide: 55 Act 44 Operating Assistance Operating Assistance: $3,522,63 Required Local Match: $142,775 Total Fleet Size Fixed Route: 3 Paratransit: Systemwide: 3 OPERATING BUDGET OPERATING EXPENSE ('s) $5,679 OPERATING FUNDS ('s) $5,679 Purchased Trans, $66 Other, $61 Op & Mech Salaries & Wages, $1,681 Local, $143 Revenue, $657 Maint., $428 Fuel Utils, $734 Fringes, $1,883 Admin Salaries & Wages, $285 State, $2,368 Federal, $2, Pennsylvania Public Transportation Performance Report - Fiscal Year 28-9
94 (New Castle Area Transit Authority) NCATA $6 Operating Expense Per Passenger $5 $4 $3 $2 $1 1,2 1, Total Passengers ('s) $ $14 $12 $1 $8 $6 $4 Operating Revenue Per Revenue Vehicle Hour* RURAL SYSTEMS 2 $2 $ Revenue Vehicle Hours ('s) Operating Expenses Per Revenue Vehicle Hour 6 $12 5 $1 4 $8 3 $6 2 $4 1 $2 $ Revenue Vehicle M iles ('s) Total Ridership Per Revenue Vehicle Hour 1,2 25 1, Data prior to FY5-6 is inconsistent with Act 44 of 27 definitions *As of 28, per Act 44, Free Transit for Senior Citizen grants are reported as Act 44 operating assistance rather than revenue. Pennsylvania Public Transportation Performance Report - Fiscal Year
95 STS (Schuylkill Transportation System) Schuylkill Transportation System (STS) 252 Industrial Park Road Saint Clair, PA 1797 Mr. Michael Micko (Vice President for Transportation Services) House District Schuylkill: 123, 124, 125 Senate District Schuylkill: 29 RURAL SYSTEMS Service Area Statistics (2 Census) Square Miles: 778 Population: 15,336 Fare Information: Fixed Route Base: $1.25 Fixed Route Avg: $1.39 Last Base Fare Increase: July 1998 (9%) Act 44 Fixed Route Distribution Factors Total Passengers: 248,571 Senior Passengers: 132,526 Revenue Vehicle Miles: 43,486 Revenue Vehicle Hours: 27,326 Employees Full Time Part Time Fixed Route: 25 3 Paratransit: 2 14 Systemwide: Act 44 Operating Assistance Operating Assistance: $1,353,358 Required Local Match: $41,694 Total Fleet Size Fixed Route: 14 Paratransit: 29 Systemwide: 43 OPERATING BUDGET Purchased Trans, $1 Maint., $114 OPERATING EXPENSE ('s) $1,87 Other, $311 Op & Mech Salaries and Wages, $69 Local, $41 OPERATING FUNDS ('s) $1,87 Revenue, $143 Federal, $437 Fuel Utils, $279 Fringes, $312 Admin Salaries and Wages, $172 State, $1, Pennsylvania Public Transportation Performance Report - Fiscal Year 28-9
96 (Schuylkill Transportation System) STS Community Transportation System Profile on page 12 $1 Operating Expense Per Passenger $8 $6 $4 $ Total Passengers ('s) $ $6 $5 $4 Operating Revenue Per Revenue Vehicle Hour* RURAL SYSTEMS 15 $3 1 $2 5 $1 $ Revenue Vehicle Hours ('s) Operating Expenses Per Revenue Vehicle Hour 35 $ $6 $ $3 $15 $ Revenue Vehicle M iles ('s) Total Ridership Per Revenue Vehicle Hour Data prior to FY5-6 is inconsistent with Act 44 of 27 definitions *As of 28, per Act 44, Free Transit for Senior Citizen grants are reported as Act 44 operating assistance rather than revenue. Pennsylvania Public Transportation Performance Report - Fiscal Year
97 VCTO (Venango County Transportation Office) Venango County Transportation Office (VCTO) 1 Dale Ave Franklin, PA Ms. Sally Mays (Director) House District Venango: 64 Senate District Venango: 21 RURAL SYSTEMS Service Area Statistics (2 Census) Square Miles: 1 Population: 36,354 Fare Information: Fixed Route Base: $1.5 Fixed Route Avg: $1.38 Last Base Fare Increase: July 25 (2%) Act 44 Fixed Route Distribution Factors Total Passengers: 57,793 Senior Passengers: 12,949 Revenue Vehicle Miles: 166,11 Revenue Vehicle Hours: 7,816 Employees Full Time Part Time Fixed Route: 4 3 Paratransit: Systemwide: 4 3 Act 44 Operating Assistance Operating Assistance: $267,929 Required Local Match: $18,18 Total Fleet Size Fixed Route: 3 Paratransit: Systemwide: 3 OPERATING BUDGET Purchased Trans, $ Maint., $43 OPERATING EXPENSE ('s) $377 Other, $44 Op & Mech Salaries and Wages, $122 Local, $1 State, $143 OPERATING FUNDS ('s) $377 Revenue, $71 Fuel Utils, $78 Fringes, $67 Admin Salaries and Wages, $23 Federal, $ Pennsylvania Public Transportation Performance Report - Fiscal Year 28-9
98 (Venango County Transportation Office) VCTO Community Transportation System Profile on page 16 $8 Operating Expense Per Passenger $7 $6 $5 $4 $3 $ Total Passengers ('s) $1 $ $12 $1 $8 $6 $4 $2 $ Operating Revenue Per Revenue Vehicle Hour* RURAL SYSTEMS 1 Revenue Vehicle Hours ('s) $6 Operating Revenue Per Revenue Vehicle Hour* 8 $5 6 4 $4 $3 $2 2 $1 $ Revenue Vehicle M iles ('s) Total Ridership Per Revenue Vehicle Hour Data prior to FY5-6 is inconsistent with Act 44 of 27 definitions *As of 28, per Act 44, Free Transit for Senior Citizen grants are reported as Act 44 operating assistance rather than revenue. In FY 27-8 Venango Co. received a onetime, multi-year, Gas Tax rebate in the amount of $17,433 Pennsylvania Public Transportation Performance Report - Fiscal Year
99 Warren County Transit Authority Warren County Transit Authority 42 Clark Street Warren, PA Mr. John Aldrich (Executive Director) House District Warren: 65 Senate District Warren: 21, 25 RURAL SYSTEMS Service Area Statistics (2 Census) Square Miles: 883 Population: 43,863 Fare Information: Fixed Route Base: $.75 Fixed Route Avg: $.66 Last Base Fare Increase: Nov (25%) Act 44 Fixed Route Distribution Factors Total Passengers: 74,665 Senior Passengers: 9,74 Revenue Vehicle Miles: 197,534 Revenue Vehicle Hours: 11,427 Employees Full Time Part Time Fixed Route: 6 7 Paratransit: 4 7 Systemwide: 1 14 Act 44 Operating Assistance Operating Assistance: $512,675 Required Local Match: $28,547 Total Fleet Size Fixed Route: 5 Paratransit: 14 Systemwide: 19 OPERATING BUDGET Purchased Trans, $ OPERATING EXPENSE ('s) $679 Op & Mech Salaries and Wages, $181 Other, $116 Local, $22 OPERATING FUNDS ('s) $679 Revenue, $45 Maint., $55 Fuel Utils, $57 Fringes, $178 Admin Salaries and Wages, $92 State, $338 Federal, $ Pennsylvania Public Transportation Performance Report - Fiscal Year 28-9
100 Warren County Transit Authority Community Transportation System Profile on page 16 $1 Operating Expense Per Passenger $8 $6 $4 $ Total Passengers ('s) $ $6 $5 $4 $3 $2 Operating Revenue Per Revenue Vehicle Hour* RURAL SYSTEMS 2 $1 $ Revenue Vehicle Hours ('s) Operating Expenses Per Revenue Vehicle Hour 15 $ $6 $5 $4 6 3 $3 $2 $1 $ Revenue Vehicle M iles ('s) Total Ridership Per Revenue Vehicle Hour Data prior to FY5-6 is inconsistent with Act 44 of 27 definitions *As of 28, per Act 44, Free Transit for Senior Citizen grants are reported as Act 44 operating assistance rather than revenue. Pennsylvania Public Transportation Performance Report - Fiscal Year
101
102 Section III COMMUNITY TRANSPORTATION Community Transportation (Shared Ride) Pennsylvania Public Transportation Performance Report - Fiscal Year
103 Adams County Transit Authority Adams County Transit Authority Rear 257 4th Street Gettysburg, PA Mr. Richard Farr, Executive Director COMMUNITY TRANSPORTATION Service Area Statistics (2 Census) Adams County Square Miles: 52 Population: 91, Population: 12,656 % of Population 65 and older: 13.9% Total Fleet Size: Community Transportation: 14 Fare Information: Average Shared-Ride Fare $11.61 Cost to Commonwealth per Senior Citizen Trip $9.72 Last Base Fare Increase: August 26 45, 4, 35, 3, 25, 2, 15, 1, Allied Coordinated Transportation Services, Inc. 5, Public Service Ridership FY8-9 PwD Trips: 3,834 FY Trips Total Trips MATP Provider PwD Provider PwD Program Start Date 8/1/6 Subcontractors % of Service Provided by Subcontractor 2.% Allied Coordinated Transportation Services, Inc. 241 West Grant Street New Castle, PA Mr. Thomas Scott, CEO Service Area Statistics (2 Census) Lawrence County Square Miles: 36 Population: 94, Population: 18,223 % of Population 65 and older: 19.3% Total Fleet Size: Community Transportation: 2 Fare Information: Average Shared-Ride Fare $12.83 Cost to Commonwealth per Senior Citizen Trip $11.2 Last Base Fare Increase: July 25 9, 8, 7, 6, 5, 4, 3, 2, 1, Public Service Ridership FY8-9 PwD Trips: 3,231 FY Trips Total Trips MATP Provider PwD Provider PwD Program Start Date 3/1/3 Subcontractors No % of Service Provided by Subcontractor N/A 82 Pennsylvania Public Transportation Performance Report - Fiscal Year 28-9
104 Area Transportation Authority of North Central PA 44 Transportation Center Johnsonburg, PA Mr. Michael Imbrogno, Executive Director Area Transportation Authority of North Central PA Service Area Statistics (2 Census) Cameron, Clearfield, Elk, Jefferson, McKean, and Potter Counties Square Miles: 5,91 Population: 234, Population: 4,25 % of Population 65 and older: 17.2% Total Fleet Size: Community Transportation: 48 Fare Information: Average Shared-Ride Fare $4.7 Cost to Commonwealth per Senior Citizen Trip $4.5 Last Base Fare Increase: July 28* *Fare increase effective during FY , 3, 25, 2, 15, 1, 5, Public Service Ridership FY8-9 PwD Trips: 18,646 FY Trips Total Trips MATP Provider: PwD Provider: PwD Program Start Date: 1/2/1 Subcontractors: % of Service Provided by Subcontractor: 6.4% Beaver County Transit Authority COMMUNITY TRANSPORTATION Beaver County Transit Authority 2 West Washington Street Rochester, PA Ms. Mary Jo Morandini, General Manager Service Area Statistics (2 Census) Beaver County Square Miles: 434 Population: 181, Population: 32,424 % of Population 65 and older: 18.4% Total Fleet Size: Community Transportation: 19 Fare Information: Average Shared-Ride Fare $19.5 Cost to Commonwealth per Senior Citizen Trip $16.55 Last Base Fare Increase: July 28 12, 1, 8, 6, 4, 2, Public Service Ridership FY8-9 PwD Trips: 82 FY Trips Total Trips MATP Provider: PwD Provider: PwD Program Start Date: 5/1/3 Subcontractors: No % of Service Provided by Subcontractor: N/A Pennsylvania Public Transportation Performance Report - Fiscal Year
105 Berks Area Regional Transportation Authority Berks Area Regional Transportation Authority 17 North Eleventh Street Reading, PA Mr. Dennis Louwerse, Executive Director Service Area Statistics (2 Census) Berks County Square Miles: 864 Population: 373, Population: 56,19 % of Population 65 and older: 15.% Total Fleet Size: Community Transportation: 5 12, 1, 8, 6, Public Service Ridership COMMUNITY TRANSPORTATION Fare Information: Average Shared-Ride Fare $11.4 Cost to Commonwealth per Senior Citizen Trip $9.82 Last Base Fare Increase: Jan. 27 Blair Senior Services, Inc. 4, 2, FY8-9 PwD Trips: 2,84 FY Trips Total Trips MATP Provider: PwD Provider: PwD Program Start Date: 9/1/6 Subcontractors: % of Service Provided by Subcontractor: 33.% Blair Senior Services, Inc. 132 Twelfth Avenue Altoona, PA Mr. William Davis, Vice President Service Area Statistics (2 Census) Blair County Square Miles: 526 Population: 129, Population: 22,456 % of Population 65 and older: 17.4% Total Fleet Size: Community Transportation: 36 Fare Information: Average Shared-Ride Fare $13.5 Cost to Commonwealth per Senior Citizen Trip $1.83 Last Base Fare Increase: July 28 18, 16, 14, 12, 1, 8, 6, 4, 2, Public Service Ridership FY8-9 PwD Trips: 4,487 FY Trips Total Trips MATP Provider: PwD Provider: PwD Program Start Date: 5/1/3 Subcontractors: No % of Service Provided by Subcontractor: N/A 84 Pennsylvania Public Transportation Performance Report - Fiscal Year 28-9
106 Bucks County Transport, Inc. Bucks County Transport, Inc. P.O. Box 51 Holicong, PA Mr. Vincent Volpe, Director Service Area Statistics (2 Census) Bucks County Square Miles: 67 Population: 597, Population: 74,94 % of Population 65 and older: 12.4% Total Fleet Size: Community Transportation: 16 Fare Information: Average Shared-Ride Fare $2.98 Cost to Commonwealth per Senior Citizen Trip $17.52 Last Base Fare Increase: April 28 25, 2, 15, 1, 5, Public Service Ridership FY8-9 PwD Trips: 19,195 FY Trips Total Trips MATP Provider: PwD Provider: PwD Program Start Date: 6/1/7 Subcontractors: % of Service Provided by Subcontractor: 64.% Butler County Community Action & Development COMMUNITY TRANSPORTATION Butler County Community Action & Development 124 West Diamond Street Butler, PA Ms. Janine Kennedy, Director Service Area Statistics (2 Census) Butler County Square Miles: 789 Population: 174, Population: 24,821 % of Population 65 and older: 12.3% Total Fleet Size: Community Transportation: 15 Fare Information: Average Shared-Ride Fare $12.8 Cost to Commonwealth per Senior Citizen Trip $1.1 Last Base Fare Increase: July 27 7, 6, 5, 4, 3, 2, 1, Public Service Ridership FY8-9 PwD Trips: N/A FY Trips Total Trips MATP Provider: PwD Provider: No PwD Program Start Date: N/A Subcontractors: % of Service Provided by Subcontractor: 1.% Pennsylvania Public Transportation Performance Report - Fiscal Year
107 Cambria County Transit Authority Cambria County Transit Authority 726 Central Avenue Johnstown, PA Ms. Rose Lucey-Noll, Executive Director COMMUNITY TRANSPORTATION Service Area Statistics (2 Census) Cambria County Square Miles: 688 Population: 152, Population: 3,87 % of Population 65 and older: 19.7% Total Fleet Size: Community Transportation: 17 Fare Information: Average Shared-Ride Fare $5.3 Cost to Commonwealth per Senior Citizen Trip $4.48 Last Base Fare Increase: Feb. 28 Capital Area Transit 1, 9, 8, 7, 6, 5, 4, 3, 2, 1, Public Service Ridership FY8-9 PwD Trips: 173 FY Trips Total Trips MATP Provider: No PwD Provider: PwD Program Start Date: 7/1/7 Subcontractors: No % of Service Provided by Subcontractor: N/A Capital Area Transit/Share-A-Ride 91 North Cameron Street P.O. Box 1571 Harrisburg, PA Mr. James Hoffer, Executive Director Service Area Statistics (2 Census) Dauphin County Square Miles: 525 Population: 251, Population: 35,844 % of Population 65 and older: 14.2% Total Fleet Size: Community Transportation: 56 25, 2, 15, 1, Public Service Ridership FY8-9 PwD Trips: 12,64 Fare Information: Average Shared-Ride Fare $17.39 Cost to Commonwealth per Senior Citizen Trip $14.33 Last Base Fare Increase: March 27 5, FY Trips Total Trips MATP Provider: PwD Provider: PwD Program Start Date: 4/7/3 Subcontractors: % of Service Provided by Subcontractor: 32.% 86 Pennsylvania Public Transportation Performance Report - Fiscal Year 28-9
108 Carbon County Carbon County c/o LANTA 16 Lehigh Street Allentown, PA Mr. Denis Meyers, Assistant Executive Director Service Area Statistics (2 Census) Carbon County Square Miles: 381 Population: 58, Population: 1,866 % of Population 65 and older: 18.5% Total Fleet Size: Community Transportation: 17 Fare Information: Average Shared-Ride Fare $18.14 Cost to Commonwealth per Senior Citizen Trip $15.52 Last Base Fare Increase: March 29 9, 8, 7, 6, 5, 4, 3, 2, 1, Public Service Ridership FY8-9 PwD Trips: 3,954 FY Trips Total Trips MATP Provider: PwD Provider: PwD Program Start Date: 4/1/5 Subcontractors: % of Service Provided by Subcontractor: 1.% Centre Area Transportation Authority COMMUNITY TRANSPORTATION Centre Area Transportation Authority 281 West Whitehall Road State College, PA Mr. Hugh Mose, General Manager Service Area Statistics (2 Census) State College, Centre County Square Miles: 133 Population: 83, Population: 8,587 % of Population 65 and older: 1.3% Total Fleet Size: Community Transportation: 7 Fare Information: Average Shared-Ride Fare $1. Cost to Commonwealth per Senior Citizen Trip $8.5 Last Base Fare Increase: July 23 25, 2, 15, 1, 5, Public Service Ridership FY8-9 PwD Trips: N/A FY Trips Total Trips MATP Provider: No PwD Provider: No PwD Program Start Date: N/A Subcontractors: % of Service Provided by Subcontractor: 1.% Pennsylvania Public Transportation Performance Report - Fiscal Year
109 Centre County Centre County Office of Transportation 42 Holmes Street Bellefonte, PA Mr. Keith Hamilton, Director COMMUNITY TRANSPORTATION Service Area Statistics (2 Census) Centre County excluding State College Square Miles: 975 Population: 52, Population: 5,49 % of Population 65 and older: 1.5% Total Fleet Size: Community Transportation: 23 Fare Information: Average Shared-Ride Fare $15.17 Cost to Commonwealth per Senior Citizen Trip $12.2 Last Base Fare Increase: April 29 Chester County 1, 9, 8, 7, 6, 5, 4, 3, 2, 1, Public Service Ridership FY8-9 PwD Trips: 4,862 FY Trips Total Trips MATP Provider: PwD Provider: PwD Program Start Date: 4/15/3 Subcontractors: No % of Service Provided by Subcontractor: N/A ROVER Community Transportation 495 Thomas Jones Way, Suite 34 Exton, PA Mr. Gary D. Krapf, President Service Area Statistics (2 Census) Chester County Square Miles: 756 Population: 433, Population: 5,677 % of Population 65 and older: 11.7% Total Fleet Size: Community Transportation: 6 Fare Information: Average Shared-Ride Fare $21.11 Cost to Commonwealth per Senior Citizen Trip $15.55 Last Base Fare Increase: June 27 35, 3, 25, 2, 15, 1, 5, Public Service Ridership FY8-9 PwD Trips: 22,74 FY Trips Total Trips *Fare increase effective during FY 29-1 MATP Provider: PwD Provider: PwD Program Start Date: 4/1/7 Subcontractors: % of Service Provided by Subcontractor: 9.% 88 Pennsylvania Public Transportation Performance Report - Fiscal Year 28-9
110 Clarion County Clarion County Transportation 338 Amsler Avenue, Suite 1 Shippenville, PA Mr. Dennis Smith, Supervisor Service Area Statistics (2 Census) Clarion County Square Miles: 62 Population: 41, Population: 6,336 % of Population 65 and older: 15.2% Total Fleet Size: Community Transportation: 21 Fare Information: Average Shared-Ride Fare $16.73 Cost to Commonwealth per Senior Citizen Trip $13.56 Last Base Fare Increase: Nov , 4, 35, 3, 25, 2, 15, 1, 5, Public Service Ridership FY Trips Total Trips MATP Provider: PwD Provider: PwD Program Start Date: 7/1/8 Subcontractors: No % of Service Provided by Subcontractor: N/A County of Lebanon Transit Authority COMMUNITY TRANSPORTATION County of Lebanon Transit Authority 2 Willow Street Lebanon, PA Ms. Theresa Giurintano, Executive Director Service Area Statistics (2 Census) Lebanon County Square Miles: 362 Population: 12, Population: 19,696 % of Population 65 and older: 16.4% Total Fleet Size: Community Transportation: 13 Fare Information: Average Shared-Ride Fare $16.44 Cost to Commonwealth per Senior Citizen Trip $14.7 Last Base Fare Increase: July 27 8, 7, 6, 5, 4, 3, 2, 1, Public Service Ridership FY8-9 PwD Trips: 43 FY Trips Total Trips MATP Provider: PwD Provider: PwD Program Start Date: 7/1/7 Subcontractors: No % of Service Provided by Subcontractor: N/A Pennsylvania Public Transportation Performance Report - Fiscal Year
111 Crawford Area Transportation Authority Crawford Area Transportation Authority 231 Chestnut Street, Room 21 Meadville, PA Mr. Timothy C. Geibel, Executive Director Service Area Statistics (2 Census) Crawford County Square Miles: 1,13 Population: 9, Population: 14,52 % of Population 65 and older: 15.6% Total Fleet Size: Community Transportation: 1 6, 5, 4, 3, Public Service Ridership COMMUNITY TRANSPORTATION Fare Information: Average Shared-Ride Fare $14.51 Cost to Commonwealth per Senior Citizen Trip $12.9 Last Base Fare Increase: Jan. 28 Cumberland County 2, 1, FY8-9 PwD Trips: 2,16 FY Trips Total Trips MATP Provider: PwD Provider: PwD Program Start Date: 4/1/3 Subcontractors: % of Service Provided by Subcontractor: 5.% Cumberland County Transportation Department 31 Allen Road, Suite 21 Carlisle, PA Ms. Rose Cook, Director Service Area Statistics (2 Census) Cumberland County Square Miles: 55 Population: 213, Population: 31,754 % of Population 65 and older: 14.9% Total Fleet Size: Community Transportation: 24 Fare Information: Average Shared-Ride Fare $12.36 Cost to Commonwealth per Senior Citizen Trip $1.31 Last Base Fare Increase: April 27 16, 14, 12, 1, 8, 6, 4, 2, Public Service Ridership FY8-9 PwD Trips: 8,823 FY Trips Total Trips MATP Provider: PwD Provider: PwD Program Start Date: 1/15/1 Subcontractors: % of Service Provided by Subcontractor: 8.% 9 Pennsylvania Public Transportation Performance Report - Fiscal Year 28-9
112 Delaware County Community Transit of Delaware County 26 Eddystone Avenue Eddystone, PA Mr. David Trout, Executive Director Service Area Statistics (2 Census) Delaware County Square Miles: 184 Population: 55, Population: 85,669 % of Population 65 and older: 15.6% Total Fleet Size: Community Transportation: 48 Fare Information: Average Shared-Ride Fare $25.98 Cost to Commonwealth per Senior Citizen Trip $21.41 Last Base Fare Increase: Feb , 2, 15, 1, 5, Public Service Ridership FY Trips Total Trips MATP Provider: PwD Provider: PwD Program Start Date: 7/1/7 Subcontractors: % of Service Provided by Subcontractor: 5.9% Endless Mountains Transportation Authority COMMUNITY TRANSPORTATION Endless Mountains Transportation Authority Route 22 Athens, PA Ms. Karen Graber, General Manager Service Area Statistics (2 Census) Bradford, Sullivan, Tioga Counties Square Miles: 2,734 Population: 11, Population: 17,97 % of Population 65 and older: 16.2% Total Fleet Size: Community Transportation: 4 Fare Information: Average Shared-Ride Fare $25.3 Cost to Commonwealth per Senior Citizen Trip $21.47 Last Base Fare Increase: Oct. 25* 8, 7, 6, 5, 4, 3, 2, 1, Public Service Ridership FY8-9 PwD Trips: 6,239 FY Trips Total Trips *Fare increase effective during FY 29-1 MATP Provider: PwD Provider: PwD Program Start Date: 3/28/3 Subcontractors: No % of Service Provided by Subcontractor: N/A Pennsylvania Public Transportation Performance Report - Fiscal Year
113 Erie Metropolitan Transit Authority Erie Metropolitan Transit Authority/LIFT 825 West 18th Street Erie, PA Ms. Rachel Maloney, LIFT Manager COMMUNITY TRANSPORTATION Service Area Statistics (2 Census) Erie County Square Miles: 82 Population: 28, Population: 4,256 % of Population 65 and older: 14.3% Total Fleet Size: Community Transportation: 58 Fare Information: Average Shared-Ride Fare $15.83 Cost to Commonwealth per Senior Citizen Trip $12.86 Last Base Fare Increase: Aug. 23 Fayette Area Coordinated Transportation 25, 2, 15, 1, 5, Public Service Ridership FY8-9 PwD Trips: 4,3 FY Trips Total Trips MATP Provider: PwD Provider: PwD Program Start Date: 3/1/3 Subcontractors: No % of Service Provided by Subcontractor: N/A Fayette Area Coordinated Transportation 825 Airport Road Lemont Furnace, PA Ms. Lori Groover-Smith, Director Service Area Statistics (2 Census) Fayette County Square Miles: 79 Population: 148, Population: 26,93 % of Population 65 and older: 18.1% Total Fleet Size: Community Transportation: 33 Fare Information: Average Shared-Ride Fare $14.63 Cost to Commonwealth per Senior Citizen Trip $11.56 Last Base Fare Increase: July 28 16, 14, 12, 1, 8, 6, 4, 2, Public Service Ridership FY8-9 PwD Trips: 6,346 FY Trips Total Trips MATP Provider: PwD Provider: PwD Program Start Date: 4/1/7 Subcontractors: % of Service Provided by Subcontractor: 79.% 92 Pennsylvania Public Transportation Performance Report - Fiscal Year 28-9
114 Forest County Forest County Transportation Forest County Building Marienville, PA Ms. Nancy Woodman, Director Service Area Statistics (2 Census) Forest County Square Miles: 428 Population: 4, Population: 985 % of Population 65 and older: 19.8% Total Fleet Size: Community Transportation: 12 Fare Information: Average Shared-Ride Fare $27.9 Cost to Commonwealth per Senior Citizen Trip $2.93 Last Base Fare Increase: Dec. 27* *Fare increase effective during FY , 2, 15, 1, 5, Public Service Ridership FY8-9 PwD Trips: 1,64 FY Trips Total Trips MATP Provider: PwD Provider: PwD Program Start Date: 6/1/8 Subcontractors: No % of Service Provided by Subcontractor: N/A Franklin County COMMUNITY TRANSPORTATION Franklin County Transportation 21 Franklin Farm Lane Chambersburg, PA Ms. Gloria Strine, Director of Transportation Service Area Statistics (2 Census) Franklin County Square Miles: 772 Population: 129, Population: 2,751 % of Population 65 and older: 16.1% Total Fleet Size: Community Transportation: 24 Fare Information: Average Shared-Ride Fare $16. Cost to Commonwealth per Senior Citizen Trip $13.6 Last Base Fare Increase: April 28 7, 6, 5, 4, 3, 2, 1, Public Service Ridership FY8-9 PwD Trips: 5,298 FY Trips Total Trips MATP Provider: PwD Provider: PwD Program Start Date: 4/1/7 Subcontractors: No % of Service Provided by Subcontractor N/A Pennsylvania Public Transportation Performance Report - Fiscal Year
115 Greene County Greene County Transportation Department 19 Jefferson Road Waynesburg, PA Ms. Karen Bennett, Administrator Service Area Statistics (2 Census) Greene County Square Miles: 576 Population: 4, Population: 6,193 % of Population 65 and older: 15.2% Total Fleet Size: Community Transportation: 23 6, 5, 4, 3, Public Service Ridership COMMUNITY TRANSPORTATION Fare Information: Average Shared-Ride Fare $21.62 Cost to Commonwealth per Senior Citizen Trip $12.5 Last Base Fare Increase: Dec Huntingdon-Bedford-Fulton Counties 2, 1, FY8-9 PwD Trips: 7,63 FY Trips Total Trips MATP Provider: PwD Provider PwD Program Start Date 1/2/1 Subcontractors No % of Service Provided by Subcontractor N/A Huntingdon Bedford Fulton Area Agency on Aging 24 Wood Street Bedford, PA Mr. Alan Smith, Executive Director Service Area Statistics (2 Census) Huntingdon, Bedford, Fulton Counties Square Miles: 2,326 Population: 19, Population: 17,59 % of Population 65 and older: 15.5% Total Fleet Size: Community Transportation: 47 Fare Information: Average Shared-Ride Fare $13.47 Cost to Commonwealth per Senior Citizen Trip $11.52 Last Base Fare Increase: March 26 12, 1, 8, 6, 4, 2, Public Service Ridership FY8-9 PwD Trips: 4,218 FY Trips Total Trips MATP Provider: PwD Provider PwD Program Start Date 5/1/6 Subcontractors No % of Service Provided by Subcontractor N/A 94 Pennsylvania Public Transportation Performance Report - Fiscal Year 28-9
116 Indiana County Transportation Authority Indiana County Transportation Authority 1657 Saltsburg Avenue Indiana, PA Mr. Gerald Blair, Executive Director Service Area Statistics (2 Census) Indiana County Square Miles: 829 Population: 89, Population: 13,323 % of Population 65 and older: 14.9% Total Fleet Size: Community Transportation: 19 Fare Information: Average Shared-Ride Fare $14.8 Cost to Commonwealth per Senior Citizen Trip $14.24 Last Base Fare Increase: Feb , 4, 35, 3, 25, 2, 15, 1, 5, Public Service Ridership FY8-9 PwD Trips: 1,215 FY Trips Total Trips MATP Provider: PwD Provider PwD Program Start Date 4/1/8 Subcontractors % of Service Provided by Subcontractor 71.% Lackawanna County COMMUNITY TRANSPORTATION Lackawanna County Coordinated Transportation 8 North South Road Scranton, PA Mr. John Tomcho, Administrative Manager Service Area Statistics (2 Census) Lackawanna County Square Miles: 459 Population: 213, Population: 41,542 % of Population 65 and older: 19.5% Total Fleet Size: Community Transportation: 24 Fare Information: Average Shared-Ride Fare $8.75 Cost to Commonwealth per Senior Citizen Trip $7.4 Last Base Fare Increase: July 27* 8, 7, 6, 5, 4, 3, 2, 1, Public Service Ridership FY8-9 PwD Trips: 7 FY Trips Total Trips *Fare increase effective during FY 29-1 MATP Provider: PwD Provider PwD Program Start Date 7/1/7 Subcontractors No Pennsylvania Public Transportation Performance Report - Fiscal Year
117 Lehigh & Northampton Transportation Authority Lehigh & Northampton Transportation Authority 16 Lehigh Street Allentown, PA Mr. Armando Greco, Executive Director COMMUNITY TRANSPORTATION Service Area Statistics (2 Census) Lehigh and Northampton Counties Square Miles: 1,614 Population: 579, Population: 91,464 % of Population 65 and older: 15.8% Total Fleet Size: Community Transportation: 15 Fare Information: Average Shared-Ride Fare $21.3 Cost to Commonwealth per Senior Citizen Trip $17.8 Last Base Fare Increase: Oct. 28 Luzerne-Wyoming Counties 5, 45, 4, 35, 3, 25, 2, 15, 1, 5, Public Service Ridership FY8-9 PwD Trips: 2,96 FY Trips Total Trips MATP Provider: PwD Provider PwD Program Start Date 3/1/7 Subcontractors % of Service Provided by Subcontractor 1.% Luzerne-Wyoming Counties Transportation Department 29 Wyoming Avenue Forty Fort, PA Mr. Anthony DePolo, Director Service Area Statistics (2 Census) Luzerne and Wyoming Counties Square Miles: 1,288 Population: 347, Population: 66,457 % of Population 65 and older: 19.1% Total Fleet Size: Community Transportation: 56 Fare Information: Average Shared-Ride Fare $14.81 Cost to Commonwealth per Senior Citizen Trip $12.29 Last Base Fare Increase: Nov. 28 3, 25, 2, 15, 1, 5, Public Service Ridership FY8-9 PwD Trips: 1,31 FY Trips Total Trips MATP Provider: PwD Provider PwD Program Start Date 7/1/7 Subcontractors % of Service Provided by Subcontractor 1.% 96 Pennsylvania Public Transportation Performance Report - Fiscal Year 28-9
118 Mercer County Mercer County Regional Council of Governments 2495 Highland Road Hermitage, PA Mr. Thomas Tulip, Executive Director Service Area Statistics (2 Census) Mercer County Square Miles: 672 Population: 12, Population: 21,74 % of Population 65 and older: 18.1% Total Fleet Size: Community Transportation: 19 Fare Information: Average Shared-Ride Fare $14.84 Cost to Commonwealth per Senior Citizen Trip $13.36 Last Base Fare Increase: July 25 1, 8, 6, 4, 2, Public Service Ridership FY8-9 PwD Trips: 2,244 FY Trips Total Trips MATP Provider: PwD Provider PwD Program Start Date 1/1/3 Subcontractors No % of Service Provided by Subcontractor N/A Mid-County Transit Authority COMMUNITY TRANSPORTATION Town & Country Transit 22 North Grant Avenue Kittanning, PA Mr. Scott Kloes, General Manager Service Area Statistics (2 Census) Armstrong County Square Miles: 654 Population: 72, Population: 13,53 % of Population 65 and older: 18.% Total Fleet Size: Community Transportation: 18 Fare Information: Average Shared-Ride Fare $15.5 Cost to Commonwealth per Senior Citizen Trip $12.77 Last Base Fare Increase: March 28 7, 6, 5, 4, 3, 2, 1, Public Service Ridership FY8-9 PwD Trips: N/A FY Trips Total Trips MATP Provider: No PwD Provider No PwD Program Start Date N/A Subcontractors % of Service Provided by Subcontractor 32.% Pennsylvania Public Transportation Performance Report - Fiscal Year
119 Mifflin and Juniata Counties Call-A-Ride Service 1 Buena Vista Circle Lewistown, PA Ms. Cynthia Sunderland, Director of Transportation Service Area Statistics (2 Census) Mifflin and Juniata Counties Square Miles: 83 Population: 69, Population: 11,378 % of Population 65 and older: 16.4% 7, 6, Public Service Ridership COMMUNITY TRANSPORTATION Total Fleet Size: Community Transportation: 26 Fare Information: Average Shared-Ride Fare $14.66 Cost to Commonwealth per Senior Citizen Trip $12.13 Last Base Fare Increase: Feb. 26 Monroe County Transportation Authority 5, 4, 3, 2, 1, FY8-9 PwD Trips: 1,66 FY Trips Total Trips MATP Provider: PwD Provider PwD Program Start Date 4/1/7 Subcontractors No % of Service Provided by Subcontractor N/A Monroe County Transportation Authority P.O. Box 339 Scotrun, PA Ms. Margaret Howarth, Executive Director Service Area Statistics (2 Census) Monroe County Square Miles: 69 Population: 138, Population: 17,36 % of Population 65 and older: 12.3% Total Fleet Size: Community Transportation: 24 Fare Information: Average Shared-Ride Fare $17.82 Cost to Commonwealth per Senior Citizen Trip $14.43 Last Base Fare Increase: April 29 7, 6, 5, 4, 3, 2, 1, Public Service Ridership FY8-9 PwD Trips: 6,274 FY Trips Total Trips MATP Provider: PwD Provider PwD Program Start Date 7/1/6 Subcontractors No % of Service Provided by Subcontractor N/A 98 Pennsylvania Public Transportation Performance Report - Fiscal Year 28-9
120 Montour County Montour County Transportation 112 Woodbine Lane, Suite 1 Danville, PA Ms. Amanda Boyer, Director Service Area Statistics (2 Census) Montour County Square Miles: 131 Population: 18, Population: 3,12 % of Population 65 and older: 17.1% Total Fleet Size: Community Transportation: 9 Fare Information: Average Shared-Ride Fare $1.64 Cost to Commonwealth per Senior Citizen Trip $9.2 Last Base Fare Increase: May 25 25, 2, 15, 1, 5, Public Service Ridership FY8-9 PwD Trips: 85 FY Trips Total Trips MATP Provider: PwD Provider PwD Program Start Date 4/1/8 Subcontractors No % of Service Provided by Subcontractor N/A MTR Transportation/Columbia County COMMUNITY TRANSPORTATION MTR Transportation t/d/b/ak-cab, Inc. P.O. Box 23 Berwick, PA Mr. Mark Ryman, Owner Service Area Statistics (2 Census) Columbia County Square Miles: 486 Population: 64, Population: 1,22 % of Population 65 and older: 15.9% Total Fleet Size: Community Transportation: 13 Fare Information: Average Shared-Ride Fare $12.58 Cost to Commonwealth per Senior Citizen Trip $1.67 Last Base Fare Increase: July 23 45, 4, 35, 3, 25, 2, 15, 1, 5, Public Service Ridership FY8-9 PwD Trips: 7,66 FY Trips Total Trips MATP Provider: PwD Provider PwD Program Start Date 4/1/7 Subcontractors No % of Service Provided by Subcontractor N/A Pennsylvania Public Transportation Performance Report - Fiscal Year
121 Northumberland County Northumberland County Transportation 2154 Trevorton Road, 3rd Floor Coal Township, PA COMMUNITY TRANSPORTATION Service Area Statistics (2 Census) Northumberland County Square Miles: 46 Population: 94, Population: 18,2 % of Population 65 and older: 19.% Total Fleet Size: Community Transportation: 25 Fare Information: Average Shared-Ride Fare $1.83 Cost to Commonwealth per Senior Citizen Trip $8.68 Last Base Fare Increase: July 25 Perry County 16, 14, 12, 1, 8, 6, 4, 2, Public Service Ridership FY8-9 PwD Trips: 2,789 FY Trips Total Trips MATP Provider: PwD Provider PwD Program Start Date 3/1/7 Subcontractors % of Service Provided by Subcontractor 1.% Perry County Transportation Department 35 Fickes Lane Newport, PA Mr. Gary Eby, Transportation Director Service Area Statistics (2 Census) Perry County Square Miles: 554 Population: 43, Population: 5,345 % of Population 65 and older: 12.3% Total Fleet Size: Community Transportation: 28 Fare Information: Average Shared-Ride Fare $25.14 Cost to Commonwealth per Senior Citizen Trip $21.11 Last Base Fare Increase: Oct. 28 4, 35, 3, 25, 2, 15, 1, 5, Public Service Ridership FY8-9 PwD Trips: 3,511 FY Trips Total Trips MATP Provider: PwD Provider PwD Program Start Date 3/1/7 Subcontractors % of Service Provided by Subcontractor 2.% 1 Pennsylvania Public Transportation Performance Report - Fiscal Year 28-9
122 Pike County Pike County Area Agency on Aging 15 Pike County Boulevard Hawley, PA Ms. Robin S. LoDolce, Executive Director Service Area Statistics (2 Census) Pike County Square Miles: 547 Population: 46, Population: 7,17 % of Population 65 and older: 15.2% 35, 3, Public Service Ridership Total Fleet Size: Community Transportation: 22 Fare Information: Average Shared-Ride Fare $16.41 Cost to Commonwealth per Senior Citizen Trip $12.46 Last Base Fare Increase: July 23* *Fare increase effective during FY , 2, 15, 1, FY8-9 PwD Trips: 3,674 5, FY Trips Total Trips MATP Provider: PwD Provider PwD Program Start Date 7/1/6 Subcontractors % of Service Provided by Subcontractor 98.% Port Authority of Allegheny County COMMUNITY TRANSPORTATION Port Authority of Allegheny County/ACCESS 345 Sixth Avenue, Third Floor Pittsburgh, PA Mr. Stephen Bland, Executive Director Service Area Statistics (2 Census) Allegheny County Square Miles: 73 Population: 1,281, Population: 228,416 % of Population 65 and older: 17.8% Total Fleet Size: Community Transportation: 39 Fare Information: Average Shared-Ride Fare $19.99 Cost to Commonwealth per Senior Citizen Trip $15.41 Last Base Fare Increase: July 28 1,8, 1,6, 1,4, 1,2, 1,, 8, 6, 4, 2, Public Service Ridership FY8-9 PwD Trips: N/A FY Trips Total Trips MATP Provider: PwD Provider N/A PwD Program Start Date N/A Subcontractors % of Service Provided by Subcontractor 1.% Pennsylvania Public Transportation Performance Report - Fiscal Year
123 Red Rose Transit Authority Red Rose Transit Authority 45 Erick Road Lancaster, PA Ms. Linda Rannels, Director of Shared-Ride/ Customer Service Service Area Statistics (2 Census) Lancaster County Square Miles: 949 Population: 47, Population: 66,6 % of Population 65 and older: 14.% 35, 3, 25, Public Service Ridership COMMUNITY TRANSPORTATION Total Fleet Size: Community Transportation: 5 Fare Information: Average Shared-Ride Fare $18. Cost to Commonwealth per Senior Citizen Trip $13.4 Last Base Fare Increase: July 28 Schuylkill County 2, 15, 1, 5, FY8-9 PwD Trips: 7,569 FY Trips Total Trips MATP Provider: PwD Provider PwD Program Start Date 7/1/3 Subcontractors % of Service Provided by Subcontractor 1% Schuylkill Transportation System P.O. Box 67 St. Clair, PA Mr. Mike Micko, VP of Public Transportation Services Service Area Statistics (2 Census) Schuylkill County Square Miles: 778 Population: 15, Population: 29,866 % of Population 65 and older: 19.9% 14, 12, 1, Public Service Ridership Total Fleet Size: Community Transportation: 29 Fare Information: Average Shared-Ride Fare $14.7 Cost to Commonwealth per Senior Citizen Trip $11.56 Last Base Fare Increase: July 23 *Fare increase effective during FY , 6, 4, FY8-9 PwD Trips: 14,46 2, FY Trips Total Trips MATP Provider: PwD Provider PwD Program Start Date 1/17/1 Subcontractors % of Service Provided by Subcontractor 52.% 12 Pennsylvania Public Transportation Performance Report - Fiscal Year 28-9
124 Somerset County Tableland Services, Inc. 535 East Main Street Somerset, PA Ext. 26 Mr. Jeffrey Masterson, Executive Director Mr. Joe Isenman, Transportation Manager Service Area Statistics (2 Census) Somerset County Square Miles: 1,75 Population: 8, Population: 14,436 % of Population 65 and older: 18.% Total Fleet Size: Community Transportation: 18 Fare Information: Average Shared-Ride Fare $1.89 Cost to Commonwealth per Senior Citizen Trip $9.41 Last Base Fare Increase: July 26 4, 35, 3, 25, 2, 15, 1, 5, Public Service Ridership FY8-9 PwD Trips: 666 FY Trips Total Trips MATP Provider: PwD Provider PwD Program Start Date 7/1/7 Subcontractors % of Service Provided by Subcontractor 1.% Southeastern Pennsylvania Transportation Authority COMMUNITY TRANSPORTATION Southeastern Pennsylvania Transportation Authority 1234 Market Street Philadelphia, PA Mr. James Foley, Chief Operating Officer CCT Service Area Statistics (2 Census) Philadelphia County Square Miles: 135 Population: 1,517, Population: 213,722 % of Population 65 and older: 14.1% Total Fleet Size: Community Transportation: 349 Fare Information: Average Shared-Ride Fare $24.9 Cost to Commonwealth per Senior Citizen Trip $21.9 Last Base Fare Increase: July 27 1,, 8, 6, 4, 2, Public Service Ridership FY8-9 PwD Trips: N/A FY Trips Total Trips MATP Provider: No PwD Provider N/A PwD Program Start Date N/A Subcontractors % of Service Provided by Subcontractor 1.% Pennsylvania Public Transportation Performance Report - Fiscal Year
 Lycoming and Clinton Counties Square Miles: 2,126 Population: 157,958 65+ Population: 25,614 % of Population")
125 STEP, Inc./Lycoming-Clinton Counties STEP, Inc Lincoln Street Williamsport, PA Ms. Janet Alling, President & CEO COMMUNITY TRANSPORTATION Service Area Statistics (2 Census) Lycoming and Clinton Counties Square Miles: 2,126 Population: 157, Population: 25,614 % of Population 65 and older: 16.2% Total Fleet Size: Community Transportation: 39 Fare Information: Average Shared-Ride Fare $13.89 Cost to Commonwealth per Senior Citizen Trip $11.49 Last Base Fare Increase: May 29 Suburban Transit Network, Inc. 16, 14, 12, 1, 8, 6, 4, 2, Public Service Ridership FY8-9 PwD Trips: 13,954 FY Trips Total Trips MATP Provider: PwD Provider PwD Program Start Date 4/1/3 Subcontractors % of Service Provided by Subcontractor 21.% Suburban Transit Network, Inc. 98 Harvest Drive, Suite 1 Blue Bell, PA Ms. Patricia Moir, Executive Director Service Area Statistics (2 Census) Montgomery County Square Miles: 483 Population: 75, Population: 111,797 % of Population 65 and older: 14.9% Total Fleet Size: Community Transportation: 129 Fare Information: Average Shared-Ride Fare $16.5 Cost to Commonwealth per Senior Citizen Trip $15.78 Last Base Fare Increase: Sept. 27 6, 5, 4, 3, 2, 1, Public Service Ridership FY8-9 PwD Trips: 5,616 FY Trips Total Trips MATP Provider: PwD Provider PwD Program Start Date 6/1/7 Subcontractors % of Service Provided by Subcontractor 1.% 14 Pennsylvania Public Transportation Performance Report - Fiscal Year 28-9
126 Susquehanna County Transportation Susquehanna County Transportation Industrial Park Road State Rt. 29 South Montrose, PA 1881 Ms. Ronalyn Corbin, Transportation Program Director Service Area Statistics (2 Census) Susquehanna County Square Miles: 823 Population: 42, Population: 6,546 % of Population 65 and older: 15.5% Total Fleet Size: Community Transportation: 12 Fare Information: Average Shared-Ride Fare $2.67 Cost to Commonwealth per Senior Citizen Trip $15.3 Last Base Fare Increase: June 24* *Fare increase effective during FY , 3, 25, 2, 15, 1, 5, Public Service Ridership FY8-9 PwD Trips: N/A FY Trips Total Trips MATP Provider: PwD Provider PwD Program Start Date 4/1/1 Subcontractors No % of Service Provided by Subcontractor N/A Union-Snyder Transportation Alliance COMMUNITY TRANSPORTATION Union-Snyder Transportation Alliance 161 Industrial Boulevard, Suite 7 Lewisburg, PA Ms. Cynthia Zerbe, Administrator Service Area Statistics (2 Census) Union and Snyder Counties Square Miles: 648 Population: 79, Population: 1,859 % of Population 65 and older: 13.7% Total Fleet Size: Community Transportation: 18 Fare Information: Average Shared-Ride Fare $16.22 Cost to Commonwealth per Senior Citizen Trip $11.88 Last Base Fare Increase: June 29 8, 7, 6, 5, 4, 3, 2, 1, Public Service Ridership FY8-9 PwD Trips: 11,471 FY Trips Total Trips MATP Provider: PwD Provider PwD Program Start Date 4/15/3 Subcontractors No % of Service Provided by Subcontractor N/A Pennsylvania Public Transportation Performance Report - Fiscal Year
127 Venango County COMMUNITY TRANSPORTATION Venango County Transportation Office 1 Dale Ave Franklin, PA Ms. Sally Mays, Director Service Area Statistics (2 Census) Venango County Square Miles: 675 Population: 57, Population: 9,657 % of Population 65 and older: 16.8% Total Fleet Size: Community Transportation: 15 Fare Information: Average Shared-Ride Fare $14.73 Cost to Commonwealth per Senior Citizen Trip $12.23 Last Base Fare Increase: March 28 Warren County Transit Authority 4, 35, 3, 25, 2, 15, 1, 5, Public Service Ridership FY Trips Total Trips MATP Provider: PwD Provider PwD Program Start Date 7/1/6 Subcontractors % of Service Provided by Subcontractor 87.% Warren County Transit Authority 42 Clark Street Warren, PA Mr. John Aldrich, Executive Director Service Area Statistics (2 Census) Warren County Square Miles: 883 Population: 43, Population: 7,312 % of Population 65 and older: 16.7% Total Fleet Size: Community Transportation: 8 Fare Information: Average Shared-Ride Fare $11.8 Cost to Commonwealth per Senior Citizen Trip $1.4 Last Base Fare Increase: Aug , 4, 35, 3, 25, 2, 15, 1, 5, Public Service Ridership FY8-9 PwD Trips: 123 FY Trips Total Trips MATP Provider: PwD Provider PwD Program Start Date 7/1/7 Subcontractors % of Service Provided by Subcontractor 12.% 16 Pennsylvania Public Transportation Performance Report - Fiscal Year 28-9
128 Washington County Transportation Authority 382 West Chestnut Street, Suite 18 Washington, PA Ms. Sheila Gombita, Executive Director Washington County Transportation Authority Service Area Statistics (2 Census) Washington County Square Miles: 857 Population: 22, Population: 36,323 % of Population 65 and older: 17.9% 35, 3, Public Service Ridership Total Fleet Size: Community Transportation: 7 Fare Information: Average Shared-Ride Fare $18.54 Cost to Commonwealth per Senior Citizen Trip $11.78 Last Base Fare Increase: May 28 25, 2, 15, 1, 5, FY8-9 PwD Trips: 38,296 FY Trips Total Trips MATP Provider: PwD Provider PwD Program Start Date 1/2/1 Subcontractors % of Service Provided by Subcontractor 1.% Wayne County COMMUNITY TRANSPORTATION Wayne County Area Agency on Aging 323 1th Street Honesdale, PA Ms. Andrea Whyte, Deputy Administrator Service Area Statistics (2 Census) Wayne County Square Miles: 729 Population: 47, Population: 8,352 % of Population 65 and older: 17.5% Total Fleet Size: Community Transportation: 25 Fare Information: Average Shared-Ride Fare $22.15 Cost to Commonwealth per Senior Citizen Trip $18.69 Last Base Fare Increase: July 28 5, 45, 4, 35, 3, 25, 2, 15, 1, 5, Public Service Ridership FY8-9 PwD Trips: 1,33 FY Trips Total Trips MATP Provider: PwD Provider PwD Program Start Date 7/1/7 Subcontractors No % of Service Provided by Subcontractor N/A Pennsylvania Public Transportation Performance Report - Fiscal Year
129 Westmoreland County COMMUNITY TRANSPORTATION Westmoreland County *Shared-Ride Service in Westmoreland County is provided by: Byers Taxi Service, Inc., Greensburg Yellow Cab, Manor Valley Taxi, Inc., Tri-County Access and Veteran s Cab Co., Inc. Service Area Statistics (2 Census) Westmoreland County Square Miles: 1,25 Population: 369, Population: 67,781 % of Population 65 and older: 18.3% Total Fleet Size: Community Transportation: 11 Fare Information: Average Shared-Ride Fare $12.24 Cost to Commonwealth per Senior Citizen Trip $1.33 Last Base Fare Increase: N/A York County Transportation Authority 25, 2, 15, 1, 5, Public Service Ridership FY8-9 PwD Trips: N/A FY Trips Total Trips MATP Provider: PwD Provider No PwD Program Start Date N/A Subcontractors York County Transportation Authority 123 Roosevelt Avenue York, PA Mr. Richard Farr, General Manager Service Area Statistics (2 Census) York County Square Miles: 94 Population: 381, Population: 51,492 % of Population 65 and older: 13.5% Total Fleet Size: Community Transportation: 54 Fare Information: Average Shared-Ride Fare $13.7 Cost to Commonwealth per Senior Citizen Trip $11.69 Last Base Fare Increase: July 28 14, 12, 1, 8, 6, 4, 2, Public Service Ridership FY8-9 PwD Trips: 11,77 FY Trips Total Trips MATP Provider: PwD Provider PwD Program Start Date 1/2/1 Subcontractors % of Service Provided by Subcontractor 4.% 18 Pennsylvania Public Transportation Performance Report - Fiscal Year 28-9
130 Section IV Intercity Bus INTERCITY BUS Pennsylvania Public Transportation Performance Report - Fiscal Year
131 Intercity Bus Program Intercity Bus Program Serves Thirty-eight [38] Counties Provides opportunities to travel into and outside of the state Carriers & Routes Served: Bieber (operating as Bieber Tourways) Reading Philadelphia INTERCITY BUS Subsidized Carriers: Service Type Carl R. Bieber, Inc. S; C; G; T Capitol Bus Company S; C; G Fullington Auto Bus Company S; C; G; SB Greyhound Lines, Inc. S; C; G Myers Coach Lines, Inc. S; C; G Susquehanna Transit Company S; C; G; SB Service Provided: Type Scheduled Route Service S Charter C Group and Party G School Bus Service SB Tours T Average Fare: $13. Average Psgrs./Bus Trip 17 Average Trip Length 63.4 miles Total # of Vehicles Required 44 coaches Capitol Bus (operating as Capitol Trailways) Harrisburg Reading Lebanon Reading Harrisburg Scranton Pottsville Philadelphia Fullington (operating as Fullington Trailways) State College Harrisburg Pittsburgh Bradford State College Wilkes-Barre State College Pittsburgh DuBois Harrisburg Greyhound Lines, Inc. Philadelphia Scranton Pittsburgh Erie Harrisburg Pittsburgh Myers Coach Lines, Inc. Pittsburgh Grove City Susquehanna (operating as Susquehanna Trailways) Williamsport Philadelphia Williamsport Easton Harrisburg Elmira OPERATING FUNDS ('S) $1,99 Local, $1,345 State, $1,345 Revenue, $5,69 Federal, $2, Pennsylvania Public Transportation Performance Report - Fiscal Year 28-9

132 Intercity Bus Program Operating Expense per Passenger $3 $25 $2 $15 $1 $5 $ FY4-5 Total Passengers ('s) Operating Revenue Per Vehicle M ile FY4-5 Total Bus Trips ('s) $2. $1.75 $1.5 $1.25 $1. $.75 $.5 $.25 $. $5. $4. $3. $2. FY4-5 Operating Expenses Per Vehicle M ile INTERCITY BUS 5 $1. FY4-5 $. FY4-5 Revenue Vehicle M iles ('s) Total Subsidy Per Vehicle M ile 4, 3,5 3, 2,5 2, 1,5 1, 5 FY4-5 $2. $1.75 $1.5 $1.25 $1. $.75 $.5 $.25 $. FY4-5 Pennsylvania Public Transportation Performance Report - Fiscal Year
Pennsylvania Public Transportation Annual Performance Report. Fiscal Year
 Pennsylvania Public Transportation Annual Performance Report Fiscal Year 27-8 April 29 Year In Review Overview and Looking Forward Introduction Pennsylvania Public Transportation Annual Performance
Pennsylvania Public Transportation ANNUAL PERFORMANCE REPORT. Fiscal Year
 Pennsylvania Public Transportation ANNUAL PERFORMANCE REPORT Fiscal Year 214 15 April 3, 216 On the cover: Mount Joy Amtrak Station Preliminary design, Market Street Bridge looking west Courtesy of Michael
Establishes a fare structure for Tacoma Link light rail, to be implemented in September 2014.
 RESOLUTION NO. R2013-24 Establish a Fare Structure and Fare Level for Tacoma Link MEETING: DATE: TYPE OF ACTION: STAFF CONTACT: PHONE: Board 09/26/2013 Final Action Ric Ilgenfritz, Executive Director,
APPENDIX B COMMUTER BUS FAREBOX POLICY PEER REVIEW
 APPENDIX B COMMUTER BUS FAREBOX POLICY PEER REVIEW APPENDIX B COMMUTER BUS FAREBOX POLICY PEER REVIEW The following pages are excerpts from a DRAFT-version Fare Analysis report conducted by Nelson\Nygaard
PERFORMANCE REPORT NOVEMBER 2017
 PERFORMANCE REPORT NOVEMBER 2017 Note: New FY2018 Goal/Target/Min or Max incorporated in the Fixed Route and Connection Dashboards. Keith A. Clinkscale Performance Manager INTRODUCTION/BACKGROUND In June
SAMTRANS TITLE VI STANDARDS AND POLICIES
 SAMTRANS TITLE VI STANDARDS AND POLICIES Adopted March 13, 2013 Federal Title VI requirements of the Civil Rights Act of 1964 were recently updated by the Federal Transit Administration (FTA) and now require
Board of Directors Information Summary
 Regional Public Transportation Authority 302 N. First Avenue, Suite 700, Phoenix, Arizona 85003 602-262-7433, Fax 602-495-0411 Board of Directors Information Summary Agenda Item #6 Date July 11, 2008 Subject
WESTERN EL DORADO COUNTY SHORT AND LONG-RANGE TRANSIT PLAN Executive Summary
 WESTERN EL DORADO COUNTY SHORT AND LONG-RANGE TRANSIT PLAN Executive Summary Prepared for the El Dorado County Transportation Commission Prepared by The El Dorado County Transportation Commission (EDCTC)
Why we re here: For educational purposes only
 Transportation 2050 Why we re here: For educational purposes only Transportation 2050 Bus Elements PUBLIC TRANSIT DEPARTMENT City of Phoenix Citizens Committee on the Future of Phoenix Transportation (CCFPT)
2 YORK REGION TRANSIT MOBILITY PLUS 2004 SYSTEM PERFORMANCE REVIEW
 2 YORK REGION TRANSIT MOBILITY PLUS 2004 SYSTEM PERFORMANCE REVIEW The Joint Transit Committee and Rapid Transit Public/Private Partnership Steering Committee recommends the adoption of the recommendation
Transit Performance Report FY (JUNE 30, 2007)
") Transit Performance Report FY 2006-2007 (JUNE 30, 2007) J ANUARY 2008 TRANSIT PERFORMANCE REPORT FY 2006 2007 (JUNE 30, 2007) Transit Performance Report I SSUED: JANUARY 2008 The Transit Performance Report
Transit Performance Report FY 2006-2007 (JUNE 30, 2007) J ANUARY 2008 TRANSIT PERFORMANCE REPORT FY 2006 2007 (JUNE 30, 2007) Transit Performance Report I SSUED: JANUARY 2008 The Transit Performance Report
MONTHLY OPERATIONS REPORT SEPTEMBER 2015
 MONTHLY OPERATIONS REPORT SEPTEMBER 215 Table of Contents SEPTEMBER 215 Section Page September Highlights... 3 Strategic Goals Progress Update... 4 Ridership... 6 Revenue... 9 Expenses... 1 System Summary...
Att. A, AI 46, 11/9/17
 Total s San Diego Metropolitan Transit System POLICY 42 PERFORMANCE MONITORING REPORT Page 1 of 6 Date: 11/8/17 OBJECTIVE Develop a Customer-Focused and Competitive System The following measures of productivity
SUB-REGIONAL PERFORMANCE MEASURES
 SUB-REGIONAL PERFORMANCE MEASURES 29 REPORT Overall regional performance is a function of five major areas: Service Coverage - monitors both how much service is available to people in the region (in terms
REGION OF WATERLOO INTERNATIONAL AIRPORT AIRPORT MASTER PLAN EXECUTIVE SUMMARY MARCH 2017
 REGION OF WATERLOO INTERNATIONAL AIRPORT AIRPORT MASTER PLAN EXECUTIVE SUMMARY MARCH 2017 Contact: Chris Wood, Airport General Manager cwood@regionofwaterloo.ca (519) 648-2256 ext. 8502 Airport Master
Tourism Satellite Account Calendar Year 2016
 Tourism Satellite Account Calendar Year 2016 Key Definitions 1. Tourism/Tourist: Refers to the leisure travel/traveler segment. 2. Travel/Traveler: Includes both leisure and business travel/travelers.
SOUTHEASTERN PENNSYLVANIA TRANSPORTATION AUTHORITY
 SOUTHEASTERN PENNSYLVANIA TRANSPORTATION AUTHORITY CUSTOMIZED COMMUNITY TRANSPORTATION CCT CONNECT SERVICE TARIFF NO. 229 SUPPLEMENT NO. 10 LOCAL RATES OF FARE AND REGULATIONS GOVERNING THE FURNISHING
Public Transit Services on NH 120 Claremont - Lebanon
 Public Transit Services on NH 120 Claremont - Lebanon Overview of Preferred Alternative April 12, 2011 Presentation Overview Study Goals Quick Review Methodology and Approach Key Findings Results of Public
RACINE COUNTY PUBLIC TRANSIT PLAN:
 RACINE COUNTY PUBLIC TRANSIT PLAN: 2013-2017 Recommended Transit Service Improvement Plan NEWSLETTER 3 SEPTEMBER 2013 This newsletter describes the final recommended public transit plan for the City of
FY Transit Needs Assessment. Ventura County Transportation Commission
 FY 18-19 Transit Needs Assessment Ventura County Transportation Commission Contents List of Figures and Appendices.. 2 Appendices... 1 Chapter 1: Introduction What is the Ventura County Transportation
RD INSTRUCTION 1980-D, EXHIBIT C PAGE 240 GUARANTEED HOUSING PROGRAM INCOME LIMITS
 RD INSTRUCTION 1980-D, EXHIBIT C PAGE 240 Allentown-Bethlehem-Easton, PA-NJ MSA Allentown-Bethlehem-Easton, PA HUD Metro FMR Area VERY LOW INCOME 25700 29350 33000 36650 39600 42550 45450 48400 LOW INCOME
Other Principle Arterials Minor Arterial Major Collector Minor Collector Local
 CHAPTER 10 TRANSPORTATION Introduction The system of public roads in East Pikeland Township is decidedly rural in character. Since the 1984, the road network has remained much the same, with the addition
DEMOGRAPHICS AND EXISTING SERVICE
 EXECUTIVE SUMMARY The Central Corridor light-rail transit (LRT) project will open in 2014 and operate between downtown Minneapolis and downtown St. Paul, serving the University of Minnesota and University
STEP ALTERNATIVES RANKING TABLE
 ALTERNATIVES RANKING TABLE Priority Ranking 0 = Lowest Priority 1 2 3 4 5 = Highest Priority Abbreviations TD = Transportation Disadvantaged PWD = People with Disabilities I. Existing Enhancements Increase
Sound Transit Operations August 2015 Service Performance Report. Ridership
 Ridership Total Boardings by Mode Mode Aug-14 Aug-15 % YTD-14 YTD-15 % ST Express 1,534,241 1,553,492 1.3% 11,742,839 12,354,957 5.2% Sounder 275,403 326,015 18.4% 2,139,086 2,463,422 15.2% Tacoma Link
Word Count: 3,565 Number of Tables: 4 Number of Figures: 6 Number of Photographs: 0. Word Limit: 7,500 Tables/Figures Word Count = 2,250
 Katherine F. Turnbull, Ken Buckeye, Nick Thompson 1 Corresponding Author Katherine F. Turnbull Executive Associate Director Texas Transportation Institute Texas A&M University System 3135 TAMU College
Date: 11/6/15. Total Passengers
 Total San Diego Metropolitan Transit System POLICY 42 PERFORMANCE MONITORING REPORT Page 1 of 6 OBJECTIVE Develop a Customer-Focused and Competitive System The following measures of productivity and service
Peer Performance Measurement February 2019 Prepared by the Division of Planning & Market Development
 2017 Regional Peer Review Peer Performance Measurement February 2019 Prepared by the Division of Planning & Market Development CONTENTS EXECUTIVE SUMMARY... 3 SNAPSHOT... 5 PEER SELECTION... 6 NOTES/METHODOLOGY...
AGENDA GUEMES ISLAND FERRY OPERATIONS PUBLIC FORUM
 AGENDA GUEMES ISLAND FERRY OPERATIONS PUBLIC FORUM Wednesday, August 17, 211 6: p.m. Guemes Island Community Hall ~ 7549 Guemes Island Road Thank you for attending the second Annual Public Forum in 211.
Sound Transit Operations June 2016 Service Performance Report. Ridership
 Ridership Total Boardings by Mode Mode Jun-15 Jun-16 % YTD-15 YTD-16 % ST Express 1,622,222 1,617,420-0.3% 9,159,934 9,228,211 0.7% Sounder 323,747 361,919 11.8% 1,843,914 2,099,824 13.9% Tacoma Link 75,396
COLT RECOMMENDED BUSINESS PLAN
 COLT RECOMMENDED BUSINESS PLAN 2008 INTRODUCTION The past decade has been one of change in Lebanon County and this situation is expected to continue in the future. This has included growth in population,
Greater Portland Transit District
 Greater Portland Transit District TO: FROM: Freeport Town Council Greg Jordan - Metro General Manager DATE: September 10, 2014 SUBJECT: Metro Request to Pursue Grant Funding for Trial Express Bus Service
September 2014 Prepared by the Department of Finance & Performance Management Sub-Regional Report PERFORMANCE MEASURES
 September 2014 Prepared by the Department of Finance & Performance Management 2013 Sub-Regional Report PERFORMANCE MEASURES REGIONAL PERFORMANCE MEASURES RTA staff has undertaken the development of a performance
General Issues Committee Item Transit Operating Budget Ten Year Local Transit Strategy
 General Issues Committee Item 4.1 2017 Transit Operating Budget Ten Year Local Transit Strategy January 27, 2017 Presentation Outline 2017 Operating Budget Overview Ten Year Local Transit Strategy 2 2017
Aviation, Rail, & Trucking 6-1
 6-1 This chapter describes the services, facilities, and condition of air, rail, and trucking as components of the transportation system. These three intermodal areas have an impact on the factors to be
MONTHLY OPERATIONS REPORT DECEMBER 2015
 MONTHLY OPERATIONS REPORT DECEMBER 215 Table of Contents DECEMBER 215 Section Page December Highlights... 3 Strategic Goals Progress Update... 4 Ridership... 6 Revenue... 9 Expenses... 1 System Summary...
Jan-18. Dec-17. Travel is expected to grow over the coming 6 months; at a slower rate
 Analysis provided by TRAVEL TRENDS INDEX DECEMBER 2018 CTI reading of 51.8 in December 2018 indicates that travel to or within the U.S. grew 3.6% in December 2018 compared to December 2017. LTI predicts
Sound Transit Operations March 2018 Service Performance Report. Ridership
 March 218 Service Performance Report Ridership Total Boardings by Mode Mar-17 Mar-18 % YTD-17 YTD-18 % ST Express 1,622,116 1,47,79-4.6% 4,499,798 4,428,14-1.6% Sounder 393,33 39,6.% 1,74,96 1,163,76 8.3%
Bristol Virginia Transit
 Bristol Virginia Transit 1 Transit Overview Bristol Virginia Transit (BVT) is a Federally Funded and certified urban area transit system. BVT began operation in its current form in 1982. In Fiscal Year
Creating Sustainable Communities Through Public Transportation
 Creating Sustainable Communities Through Public Transportation 21 st Transportation Committee January 16, 2008 Keith T. Parker Chief Executive Officer Charlotte Area Transit System (CATS) Charlotte Mecklenburg
Oct-17 Nov-17. Travel is expected to grow over the coming 6 months; at a slower rate
 Analysis provided by TRAVEL TRENDS INDEX OCTOBER 2018 CTI reading of 51.6 in October 2018 indicates that travel to or within the U.S. grew 3.2% in October 2018 compared to October 2017. LTI predicts travel
PUBLIC TRANSIT IN KENOSHA, RACINE, AND MILWAUKEE COUNTIES
 PUBLIC TRANSIT IN KENOSHA, RACINE, AND MILWAUKEE COUNTIES #118404v1 Regional Transit Authority June 19, 2006 1 Presentation Overview Existing Public Transit Transit System Peer Comparison Recent Transit
Sound Transit Operations January 2017 Service Performance Report. Ridership. Total Boardings by Mode
 January 217 Service Performance Report Ridership ST Express Sounder Tacoma Link Link Paratransit Jan-16 Jan-17 % 1,433,7 1,3,33 4.9% 331,27 7,121 98,411 3,633 Total Boardings by Mode 363,6 74,823 1,76,914
Current Operations CHAPTER II INTRODUCTION DESCRIPTION OF TRANSPORTATION SERVICES
 Chapter II CHAPTER II Current Operations INTRODUCTION This chapter provides an overview of Centre Area Transportation Authority (CATA). CATA is a joint municipal authority formed under the Municipal Authorities
Governor Corbett Announces State Investment in 24 Rail Projects
 News for Immediate Release Nov. 9, 2012 Governor Corbett Announces State Investment in 24 Rail Projects Harrisburg Twenty-four freight-rail projects across Pennsylvania will improve businesses rail access,
SRTA Year End Fixed Route Ridership Analysis: FY 2018
 SRTA Year End Fixed Route Ridership Analysis: FY 2018 2018 Contents Introduction... 1 A. Key Terms Used in this Report... 1 Key Findings... 2 A. Ridership... 2 B. Fare Payment... 4 Performance Analysis
Sound Transit Operations December 2014 Service Performance Report. Ridership
 Ridership Total Boardings by Mode Mode Dec-13 Dec-14 % YTD-13 YTD-14 % ST Express 1,266,130 1,396,787 10.3% 16,605,299 17,661,976 6.4% Sounder 248,710 285,016 14.6% 3,035,735 3,361,317 10.7% Tacoma Link
Investor Update Issue Date: April 9, 2018
 Investor Update Issue Date: April 9, 2018 This investor update provides guidance and certain forward-looking statements about United Continental Holdings, Inc. (the Company or UAL ). The information in
Oct-17 Nov-17. Sep-17. Travel is expected to grow over the coming 6 months; at a slightly faster rate
 Analysis provided by TRAVEL TRENDS INDEX SEPTEMBER 2018 CTI reading of.8 in September 2018 indicates that travel to or within the U.S. grew 1.6% in September 2018 compared to September 2017. LTI predicts
JOSLIN FIELD, MAGIC VALLEY REGIONAL AIRPORT DECEMBER 2012
 1. Introduction The Federal Aviation Administration (FAA) recommends that airport master plans be updated every 5 years or as necessary to keep them current. The Master Plan for Joslin Field, Magic Valley
Tulsa Airports Improvement Trust Strategic Plan Update
 Tulsa Airports Improvement Trust Strategic Plan Update 2016-2026 TABLE OF CONTENTS I. Background II. III. IV. Existing Conditions and Future Requirements Mission, Vision, & Goals Strengths, Weakness, Opportunities
STUDY OVERVIEW MASTER PLAN GOALS AND OBJECTIVES
 INTRODUCTION An Airport Master Plan provides an evalua on of the airport s avia on demand and an overview of the systema c airport development that will best meet those demands. The Master Plan establishes
Ozaukee County Transit Development Plan
 Ozaukee County Transit Development Plan Record of Public Comments and Recommended Transit Service Plan June 5, 2018 Kevin Muhs Deputy Director #242846 Status of the Transit Development Plan Existing Conditions
YOSEMITE AREA REGIONAL TRANSPORTATION SYSTEM
 YOSEMITE AREA REGIONAL TRANSPORTATION SYSTEM Short Range Transit Plan Prepared for the Merced County Association of Governments/YARTS Prepared by LSC Transportation Consultants, Inc. YOSEMITE AREA REGIONAL
Aviation Tax Report. June 30, 2016
 Aviation Tax Report June 30, 2016 Prepared by The Minnesota Department of Transportation 395 John Ireland Boulevard Saint Paul, Minnesota 55155-1899 Phone: 651-296-3000 Toll-Free: 1-800-657-3774 TTY, Voice
Federal Subsidies to Passenger Transportation December 2004
 U.S. Department of Transportation Bureau of Transportation Statistics Federal Subsidies to Passenger Transportation December 2004 Federal Subsidies to Passenger Transportation Executive Summary Recent
METROBUS SERVICE GUIDELINES
 METROBUS SERVICE GUIDELINES In the late 1990's when stabilization of bus service was accomplished between WMATA and the local jurisdictional bus systems, the need for service planning processes and procedures
Sound Transit Operations March 2017 Service Performance Report. Ridership. Total Boardings by Mode
 March 217 Service Performance Report Ridership ST Express Sounder Tacoma Link Link Paratransit Mar-16 Mar-17 % 1,83,4 1,621,49 2.4% 37,496 82,631 1,264,47 3,821 Total Boardings by Mode 389,98 87,39 1,89,43,297
REVIEW OF THE STATE EXECUTIVE AIRCRAFT POOL
 STATE OF FLORIDA Report No. 95-05 James L. Carpenter Interim Director Office of Program Policy Analysis And Government Accountability September 14, 1995 REVIEW OF THE STATE EXECUTIVE AIRCRAFT POOL PURPOSE
METRO FLEET FUNDING HUMAN RESOURCES
 2018 FACT SHEET METRO FLEET METRO s overall revenue-producing fleet totals 235 vehicles: 144 large buses and 91 smaller paratransit buses. Some passenger vehicles are equipped with a hydraulic lift to
Executive Summary. Introduction. Community Assessment
 Executive Summary Introduction The Red Rose Transit Authority (RRTA) Transit Development Plan provides an evaluation of existing RRTA fixed route services, with the outcome being practical recommendations
ALL ABOARD LABOR S LONG TERM PASSENGER TRANSPORT STRATEGY
 ALL ABOARD LABOR S LONG TERM PASSENGER TRANSPORT STRATEGY Revitalising Passenger Transport Increasing traffic congestion in our cities and a lack of transport services in our regional towns is frustrating
Chapter 3. Burke & Company
 Chapter 3 Burke & Company 3. WRTA RIDERSHIP AND RIDERSHIP TRENDS 3.1 Service Overview The Worcester Regional Transit Authority (WRTA) provides transit service to over half a million people. The service
EXECUTIVE DIRECTOR. The Potomac Rappahannock Transportation Commission is seeking an ABOUT THE ORGANIZATION
 The Potomac Rappahannock Transportation Commission is seeking an EXECUTIVE DIRECTOR ABOUT THE ORGANIZATION The Potomac Rappahannock Transportation Commission (PRTC) is a multi-jurisdictional agency that
Economic Impacts of Campgrounds in New York State
 Economic Impacts of Campgrounds in New York State June 2017 Report Submitted to: Executive Summary Executive Summary New York State is home to approximately 350 privately owned campgrounds with 30,000
VCTC Transit Ridership and Performance Measures Quarterly Report
 VCTC Transit Ridership and Performance Measures Quarterly Report Overview Quarter 2 Fiscal Year 2018-2019 This report provides performance measures for VCTC Intercity Bus Service covering the FY 2018-19
DRAFT Service Implementation Plan
 2017 Service Implementation Plan October 2016 SECTION NAME 2017 Service Implementation Plan October 2016 2017 SERVICE IMPLEMENTATION PLAN TABLE OF CONTENTS Table of Contents... I List of Tables... III
PERFORMANCE REPORT JANUARY Keith A. Clinkscale Performance Manager
 PERFORMANCE REPORT JANUARY 2018 Keith A. Clinkscale Performance Manager INTRODUCTION/BACKGROUND Keith A. Clinkscale Performance Manager FIXED ROUTE DASHBOARD JANUARY 2018 Safety Max Target Goal Preventable
B GEORGIA INFRASTRUCTURE REPORT CARD AVIATION RECOMMENDATIONS DEFINITION OF THE ISSUE. Plan and Fund for the Future:
 2014 GEORGIA INFRASTRUCTURE REPORT CARD B + RECOMMENDATIONS Plan and Fund for the Future: While the system continues to enjoy excess capacity and increased accessibility it still needs continued focus
Financial Reporting: What is Your Responsibility? Tina Kettle, United Technologies Corporation Doug Stewart, AircraftLogs Monday, Jan 16, 3:30 5:00
 Financial Reporting: What is Your Responsibility? Tina Kettle, United Technologies Corporation Doug Stewart, AircraftLogs Monday, Jan 16, 3:30 5:00 Agenda Session Objective Understanding the impact of
PORTLAND NORTH INTER-CITY EXPRESS SERVICE Freeport-Yarmouth-Cumberland-Falmouth-Portland Concept Report June 2014
 Greater Portland Transit District PORTLAND NORTH INTER-CITY EXPRESS SERVICE Freeport-Yarmouth-Cumberland-Falmouth-Portland Concept Report June 2014 In February 2014, Metro s Board of Directors approved
The Economic Impact of Tourism in Buncombe County, North Carolina
 The Economic Impact of Tourism in Buncombe County, North Carolina 2017 Analysis September 2018 Introduction and definitions This study measures the economic impact of tourism in Buncombe County, North
Thank you for participating in the financial results for fiscal 2014.
 Thank you for participating in the financial results for fiscal 2014. ANA HOLDINGS strongly believes that safety is the most important principle of our air transportation business. The expansion of slots
A Master Plan is one of the most important documents that can be prepared by an Airport.
 The Master Plan A Master Plan is one of the most important documents that can be prepared by an Airport. A Master Plan is a visionary and a strategic document detailing planning initiatives for the Airport
Sound Transit Operations January 2018 Service Performance Report. Ridership
 January 218 Service Performance Report Ridership Total Boardings by Mode Jan-17 Jan-18 % YTD-17 YTD-18 % ST Express 1,3,33 1,7,91.3% 1,3,33 1,7,91.3% Sounder 367,33 416,8 13.3% 367,33 416,8 13.3% Tacoma
The Travel and Tourism Industry in Vermont. A Benchmark Study of the Economic Impact of Visitor Expenditures on the Vermont Economy 2005
 The Travel and Tourism Industry in Vermont A Benchmark Study of the Economic Impact of Visitor Expenditures on the Vermont Economy 2005 INTRODUCTION GENERAL November, 2006 This 2005 update of the original
ATTACHMENT A.7. Transit Division Performance Measurements Report Fiscal Year Fourth Quarter
 TTCHMENT.7 Transit Division Performance Measurements Report Fiscal Year 2012-13 Fourth Quarter Introduction The Orange County Transportation uthority (OCT) operates a countywide network of local, community,
The Economic Impact of Tourism in Hillsborough County. July 2017
 The Economic Impact of Tourism in Hillsborough County July 2017 Table of contents 1) Key Findings for 2016 3 2) Local Tourism Trends 7 3) Trends in Visits and Spending 12 4) The Domestic Market 19 5) The
Smart Commute Action Plan for The Middle School
 Smart Commute Action Plan for The Middle School 2014 Smart Commute Plan for the Middle School 1 Staff Survey Summary Smart Commute Action Plan for the Middle School The Middle School gave its first Smart
Rides Mass Transit District. Jackson County Mass Transit District. FY 2020 Program of Projects (POP) Carbondale UZA
 Carbondale UZA") Rides Mass Transit District Jackson County Mass Transit District FY 2020 Program of Projects (POP) Carbondale UZA General Rides Mass Transit District (RMTD) is the public transportation provider for the
Rides Mass Transit District Jackson County Mass Transit District FY 2020 Program of Projects (POP) Carbondale UZA General Rides Mass Transit District (RMTD) is the public transportation provider for the
Fare Policy Discussion Background and History
 Fare Policy Discussion Background and History Transportation Committee Nick Eull Senior Manager of Revenue Operations February 27 th, 2017 2013 Fare Policy Analysis Report Cross-functional group comprised
ECONOMIC DEVELOPMENT INCENTIVES AND PROGRAMS. Provide Airport Encroachment Protection. Standardize Ad Valorem Tax Exemptions
 ECONOMIC MASTER PLAN Florida s airport industry indicates the following programs are needed to maximize its impact on the State s economy: AIRPORT SECURITY Develop Model Security Plan for General Aviation
Draft Executive Summary
 Draft Executive Summary The Juneau Tourism Plan development process was undertaken by Egret Communications and ARA Consulting in April 2001, under contract with the City and Borough of Juneau, Alaska.
Citi Industrials Conference
 Citi Industrials Conference June 13, 2017 Andrew Levy Executive Vice President and Chief Financial Officer Safe Harbor Statement Certain statements included in this presentation are forward-looking and
2016 Regional Transportation Alternatives Program (TAP) Grant Application
 Grant Application") 2016 Regional Transportation Alternatives Program (TAP) Grant Application PROJECT TITLE: Yelm-Tenino Trail Extension Feasibility Study TRPC use only GENERAL PROJECT INFORMATION Agency or Organization City
2016 Regional Transportation Alternatives Program (TAP) Grant Application PROJECT TITLE: Yelm-Tenino Trail Extension Feasibility Study TRPC use only GENERAL PROJECT INFORMATION Agency or Organization City
TransAction Overview. Introduction. Vision. NVTA Jurisdictions
 Introduction Vision NVTA Jurisdictions In the 21 st century, Northern Virginia will develop and sustain a multimodal transportation system that enhances quality of life and supports economic growth. Investments
Like many transit service providers, the Port Authority of Allegheny County (Port Authority) uses a set of service level guidelines to determine
 uses a set of service level guidelines to determine") Transit service consists of two fundamental elements: frequency (how often service operates) and service span (how long service runs during the day). Combined, these two factors measure how much service
Transit service consists of two fundamental elements: frequency (how often service operates) and service span (how long service runs during the day). Combined, these two factors measure how much service
Airport Planning Area
 PLANNING AREA POLICIES l AIRPORT Airport Planning Area LOCATION AND CONTEXT The Airport Planning Area ( Airport area ) is a key part of Boise s economy and transportation network; it features a multi-purpose
CONTACT: Investor Relations Corporate Communications
 NEWS RELEASE CONTACT: Investor Relations Corporate Communications 435.634.3200 435.634.3553 Investor.relations@skywest.com corporate.communications@skywest.com SkyWest, Inc. Announces Second Quarter 2016
Chapter 1 EXECUTIVE SUMMARY
 Chapter 1 EXECUTIVE SUMMARY Contents Page Aviation Growth Scenarios................................................ 3 Airport Capacity Alternatives.............................................. 4 Air Traffic
Westover Metropolitan Airport Master Plan Update
 Westover Metropolitan Airport Master Plan Update June 2008 INTRODUCTION Westover Metropolitan Airport (CEF) comprises the civilian portion of a joint-use facility located in Chicopee, Massachusetts. The
Chapter Seven COST ESTIMATES AND FUNDING A. GENERAL
 Chapter Seven COST ESTIMATES AND FUNDING A. GENERAL This chapter delineates the recommended 2005 2024 Sussex County Airport Capital Improvement Program (CIP). It further identifies probable construction
Sound Transit Operations January 2014 Service Performance Report. Ridership
 Ridership Total Boardings by Mode Mode Jan-13 Jan-14 % YTD-13 YTD-14 % ST Express 1,343,290 1,426,928 6.2% 1,343,290 1,426,928 6.2% Sounder 245,135 256,775 4.7% 245,135 256,775 4.7% Tacoma Link 86,229
3. Aviation Activity Forecasts
 3. Aviation Activity Forecasts This section presents forecasts of aviation activity for the Airport through 2029. Forecasts were developed for enplaned passengers, air carrier and regional/commuter airline
INVESTOR PRESENTATION. May 2015
 INVESTOR PRESENTATION May 2015 Forward-looking Statements This presentation contains forward-looking statements within the meaning of the Private Securities Litigation Reform Act of 1995 that reflect the
Investor Update September 2017 PARTNER OF CHOICE EMPLOYER OF CHOICE INVESTMENT OF CHOICE
 Investor Update September 2017 PARTNER OF CHOICE EMPLOYER OF CHOICE INVESTMENT OF CHOICE 1 Forward Looking Statements In addition to historical information, this presentation contains forward-looking statements
49 May-17. Jun-17. Travel is expected to grow over the coming 6 months; at a slower rate
 Analysis provided by TRAVEL TRENDS INDEX MAY 2018 CTI reading of 51.7 in May 2018 shows that travel to or within the U.S. grew 3.4% in May 2018 compared to May 2017. LTI predicts moderating travel growth
Assessment of Travel Trends
 I - 2 0 E A S T T R A N S I T I N I T I A T I V E Assessment of Travel Trends Prepared for: Metropolitan Atlanta Rapid Transit Authority Prepared by: AECOM/JJG Joint Venture Atlanta, GA October 2011 General
PREFACE. Service frequency; Hours of service; Service coverage; Passenger loading; Reliability, and Transit vs. auto travel time.
 PREFACE The Florida Department of Transportation (FDOT) has embarked upon a statewide evaluation of transit system performance. The outcome of this evaluation is a benchmark of transit performance that
Ministry of Parks, Culture and Sport. Plan for saskatchewan.ca
 Ministry of Parks, Culture and Sport Plan for 2018-19 saskatchewan.ca Table of Contents Statement from the Minister... 1 Response to Government Direction... 2 Operational Plan... 3 Highlights... 7 Financial