Sarasota County Area Transit
|
|
|
- Frederick Short
- 6 years ago
- Views:
Transcription
1 Sarasota County Area Transit
2 AL
3 EXECUTIVE SUMMARY The purpose and intent of this project is to perform an organizational evaluation of Sarasota County Area Transit to provide a baseline from which to evaluate proposals to provide efficient and effective transit service. The organizational evaluation was conducted following the Independent Cost Estimate (ICE) process established by the Federal Transit Administration (FTA). Over the past several years there have been numerous discussions regarding increasing the efficiency and effectiveness of Sarasota County Area Transit. Ideas considered range from merging Sarasota County Area Transit with Manatee County Area Transit to privatizing all or portions of transit operations. Benefits of merging services could include reducing duplicative functions and gaining economics of scale in negotiations and the purchase of capital and goods. Federal, State and Local governments across the US have looked at the potential to privatize portions of the transit services that they provided to members of the public and the business community. Opportunities also exist to improve the efficiency of existing transit service. In order to effectively evaluate the cost and benefits of any proposal to provide transit service, it is important to have a firm understanding of the current transit service being provided and how the provision of that service compares with peer transit agencies. This report can serve as a baseline to develop ICE compliant scopes to solicit proposals to privatize transit or to develop a Comprehensive Operations Analysis scope of service to determine efficiencies currently provided by Sarasota County Area Transit. The report starts with a review of the mission, vision, vales, history and legislative basis of Sarasota County Area Transit. The relevant Comprehensive Plan policies related to the provision of transit service is also included in the report. An organizational overview is part of the report that focuses on the services provided, staffing, revenues, expenses and existing capital. An overview of existing transit service was also conducted that looked at route performance, transit frequency, cost of service and revenue generated. An evaluation of 11 peer group transit agencies, four of which are currently privatized, is included in the report. There are currently several fixed-routes that perform efficiently and effectively. At the same time there are several routes that could be re-evaluated to determine if improvements could be made to improve efficiency and effectiveness. The peer group comparative analysis demonstrates that the fixed-route transit service operates in a manner similar to its peers. The comparative analysis also indicates that paratransit service operates below its peers and that opportunities to reduce cost and improve services should be further evaluated. This report, consistent with all ICE requirements, provides the baseline information necessary for the Board of County Commissioners to evaluate proposals for the future provision of transit service.
4
5
6
7
8 LEGISLATIVE BASIS In 1974, the Board of County Commissioners explored alternatives to the funding and operation of a regional transit services and created the Sarasota County Transportation Authority under Sarasota County Ordinance Despite the creation of the separate authority, transit service has continued to be provided and funded by the Board of County Commissioners. Operationally, SCAT is an operating department of Sarasota County Government. Sarasota County Area Transit (SCAT) transit planning is established consistent by local, State and federal requirements and is guided by a Transit Development Plan, as required by all Florida transit agencies receiving State block grant funds. The Transit Development Plan (TDP) is a 10-year transit capital and operating plan that is updated by Sarasota County annually with major updates every 5-years. The TDP makes specific recommendations as to how the SCAT bus system can respond to the public transit needs of Sarasota County. The passage of the Americans with Disabilities Act (ADA) of 1990 mandated both the purchase of accessible transit buses and the provision of complementary paratransit services providing equal access to public transportation services for passengers within a ¾ mile service area along the fixed route. The ADA requires SCAT to submit a plan for complementary paratransit services. SCAT incorporates the required plan for complementary paratransit services in the Sarasota County Transportation Disadvantaged Services Plan (TDSP) required for agencies receiving State Transportation Disadvantaged funds and updated annually with major updates every 3-years. A primary goal of the current TDSP is to provide a level of fixed route service to allow accommodating eligible paratransit riders. The cost of that complementary paratransit service is significantly greater than the current level of State and federal operating assistance. SARASOTA COUNTY COMPREHENSIVE PLAN The Sarasota County Comprehensive Plan is an official public document adopted by the Sarasota County Commission to guide decision-making related to the physical development of the county. The contents of the plan are all-inclusive, general and long range. "All-inclusive" means that the plan addresses all geographical parts of the community and all functional elements that can affect physical, cultural and community development. "General" means that it includes general policies and designations, not detailed regulations. 6
9
10
11
12
13
14
15
16
17
18
19
20
21
22
23 SCAT FIXED ROUTE RIDERSHIP, HOURS, AND FAREBOX RECOVERY, Oct. 1, Sept. 30, Total Total Total Passenger Estimated Route Revenue Passengers Passenger Trips Trips Per Annual hours Using (passes + cash) Revenue Cost for Period Passes Hour 2013 Total Net Cost Revenue Per Passenger Trip Farebox Recovery #1 Fruitville 11,615 83, , $926,761 #2 Cocoanut Ave. 4,990 69, , $398,152 #3 Pinecraft 3,576 34,846 57, $285,329 #4 Lido 3,530 24,899 46, $281,659 #5 Osprey-Swift 7,976 51,878 84, $636,405 #6 Beneva 18, , , $1,504,520 #7 Newtown-NE. 5,105 62,572 94, $407,328 #8 Newtown-301 4,791 58,022 90, $382,274 #9 North Port 8,392 72, , $669,598 #11 Siesta Key 8,370 69, , $667,842 #12 No. Lockwood 9, , , $776,995 #13 Venice 8,121 33,868 55, $647,975 #14 Bee Ridge 5,150 66, , $410,919 #15 Cattlemen 12,323 71, , $983,252 #16 Englewood 8,073 35,892 62, $644,145 #17 Trail 27, , , $2,220,476 #18 Longboat (excludes MCAT) 5,249 12,173 33, $418,818 #20/29 Toledo/Glenallen 4,027 15,528 26, $321,314 #40 Webber Limited 8,043 18,228 36, $641,751 #99 Palmetto (excludes MCAT) 12,243 67, , $976,869 TOTALS 177,997 1,543,456 2,744, $14,202,381 $115,250 $5.70 $69,807 $3.28 $43,364 $4.23 $40,788 $5.14 $66,390 $6.71 $313,458 $3.11 $65,664 $3.62 $68,884 $3.45 $105,098 $4.67 $107,999 $4.48 $189,770 $2.32 $42,867 $10.95 $96,646 $2.77 $110,293 $6.91 $55,934 $9.38 $403,863 $3.74 $31,832 $11.50 $23,382 $11.27 $20,207 $17.21 $171,097 $2.64 $2,142,592 $ % 18% 15% 14% 10% 21% 16% 18% 16% 16% 24% 7% 24% 11% 9% 18% 8% 7% 3% 18% 15%
24
25
26 SCAT SUNDAY & EXPRESS ROUTE RIDERSHIP, HOURS, AND FAREBOX RECOVERY, Oct. 1, Sept. 30, 2013 Total Total Total Passenger Estimated Total Net Cost Farebox Route Revenue Passengers Passenger Trips Trips Per Annual Revenue Per Recovery hours Using (passes + cash) Revenue Cost Passenger for Period Passes Hour Trip EXCLUSIVE SUNDAY SERVICE #215 Cocoanut-Univ ,554 6, $52,422 # 1411 Lk Sara-Siesta Key 1,273 7,261 14, $101,573 #1713 Trail-Jacaranda 2,150 20,842 34, $171,549 #9S North Port 401 1,794 3, $31,996 EXPRESS TRANSIT SERVICE #90X NP-Venice Express 1,648 1,021 2, $131,494 #100X North Port Express 3,181 17,270 27, $253,812 $4,780 $7.03 $12,014 $6.38 $29,155 $4.11 $2,948 $9.00 $6,190 $61.85 $96,899 $5.81 SCAT FIXED ROUTE CHARACTERISTICS, Oct. 1, Sept. 30, 2013 Number Frequency Service Route of DAYTIME Buses Span 9% 12% 17% 9% 5% 38% #1 Fruitville/#1A Fruitville :40 AM - 7:35 PM #2 Cocoanut Ave :30 AM - 9:50 PM #3 Pinecraft :50 AM - 7:03 PM #4 Lido :40 AM - 7:05 PM #5 Osprey-Swift :17 AM - 7:56 PM #6 Beneva :13 AM - 10:15 PM #7 Newtown-NE :40 AM - 9:36 PM #8 Newtown :25 AM - 9:16 PM #9 North Port :50 AM - 8:25 PM #11 Siesta Key :00 AM - 9:00 PM #12 No. Lockwood :15 AM - 11:05 PM #13 Venice :00 AM - 7:53 PM #14 Bee Ridge :45 AM - 11:00 PM #15 Cattlemen :10 AM - 7:14 PM #16 Englewood :43 AM - 7:58 PM #17 Trail :15 AM - 11:01 PM #18 Longboat (Excludes MCAT) :30 AM - 8:07 PM #20/29 Toledo/Glenallen :23 AM - 8:40 PM #40 Webber Limited :55 AM - 6:25 PM #99 Palmetto (Excludes MCAT) :15 AM - 8:35 PM
27 SCAT FIXED ROUTE CHARACTERISTICS, Oct. 1, Sept. 30, 2013 Number Frequency Service Route of DAYTIME Buses Span EXCLUSIVE SUNDAY #215 Cocoanut-Univ. 1 # 1411 Lk Sara-Siesta Key 2 #1713 Trail-Jacaranda 3 #9S North Port Sunday 1 Y ROUTES 90 9:15 AM - 10:29 PM 60 8:00 AM - 10:58 PM 60 6:10 AM - 10:48 PM 60 10:34 AM - 6:26 PM EXPRESS ROUTES #90X NP-Venice Express 2 IRREGULAR 5:40 AM - 9:09 PM #100X North Port Express 2 IRREGULAR 4:48 AM - 9:39 AM
28
29
30
31
32
33
34
35
36
37
38
39
40
41
42
43
44
45 Sarasota County Board of County Commissioners Fund Revenue & Expenditure Report Sarasota County Transit Auth - Fund 430 October 2013 Through May 2014 Revenues: Adopted Budget Variance Amended Year to Month to Over (Under) Budget Date Date Encumbrance Amended Fund Administration 13,959, ,987, ,594, (7,393,052.87) 47.1 % SCAT Operators , , % SCAT Administration 2,282, ,282, ,152, , (1,130,049.10) 50.5 % SCAT Administration Express , , , % Sect 5307 FTA Grant Applicatio 1,000, ,000, (1,000,000.00) 0.0 % FTA FL-90-X668 Section 5307 OP 72, , (72,304.00) 0.0 % FTA FL-90-X696 Section 5307 FR 100, , (100,000.00) 0.0 % FTA FL-90-X775 Section , , (257,119.00) 0.0 % FTA FL-90-X579 Security (0.62) (0.62) 0.0 % FTA FL-90-X810 FY % Job Access Reverse Commute Grt % JARC 0708 SCAT 70, , (70,000.00) 0.0 % JARC FDOT FY11-FY12 AQI46 430, , , (406,223.91) 5.5 % FDOT Express Development APO57 200, , , (157,209.93) 21.4 % FTA Section 5311 AQR08 30, , (30,395.00) 0.0 % FDOT Block AOV77 1,300, % FDOT Operating Block AQQ ,349, (1,349,597.00) 0.0 % Total Revenues 19,701, ,778, ,866, , (11,912,226.54) 39.8 % % Actual Expenditures: SCAT Operators 11,970, ,683, ,977, , , ,564, % SCAT Operators Express Bus 398, , , , , , % SCAT Operations Supervisors 774, , , , , % SCAT Ops Supervisors Express 21, , , , % SCAT Non Vehicle Maintenance 634, , , , , , % SCAT Non Vehicle Maint Express 68, , , , % SCAT Vehicle Maintenance Admin (0.00) % SCAT Vehicle Maint Adm Express 1, % SCAT Vehicle Maint Servicing (0.00) % SCAT Veh Maint Inspect Mainten 2,492, ,518, ,254, , , , % SCAT Veh Maint Servicing Expre % SCAT Veh Maint Inspect Express 252, , , , , , % SCAT Administration 1,720, ,890, ,010, , , , % SCAT Administration Express 166, , , , , , % FTA FL-90-X668 Section 5307 OP 72, , , , % FTA FL-90-X696 Section 5307 FR 100, , , % User Name: Sara Valari Run Date: 05/13/2014 Report ID: HPGL1000 (Monthly Amts) Page 1
46 Sarasota County Board of County Commissioners Fund Revenue & Expenditure Report Sarasota County Transit Auth - Fund 430 October 2013 Through May 2014 Variance Adopted Amended Year to Month to Over (Under) % Budget Budget Date Date Encumbrance Amended Actual FTA FL-90-X775 Section , , , , , % JARC 0708 SCAT 70, , , % JARC FDOT FY11-FY12 AQI46 431, , , , % FDOT Express Development APO57 201, , , % FTA SECTION 5311 AOV % FTA Section 5311 AQR08 30, , , , % FDOT Operating Block AQQ , , % PW Administration SCAT 37, , , , , % Total Expenditures 19,701, ,778, ,470, , ,341, ,966, % Revenue Less Expenditures (1,603,769.90) (621,189.73) (1,341,793.61) (2,945,563.51) User Name: Sara Valari Run Date: 05/13/2014 Report ID: HPGL1000 (Monthly Amts) Page 2
47 Sarasota County Board of County Commissioners Fund Revenue & Expenditure Report SCAT Community Transport Coord - Fund 432 October 2013 Through May 2014 Revenues: Adopted Budget Variance Amended Year to Month to Over (Under) Budget Date Date Encumbrance Amended Fund Administration 6,113, ,128, ,040, (3,088,606.84) 49.6 % CTC Administration 650, , , , , (121,189.62) 81.4 % FTA ADA 5307 Grant 200, , (200,000.00) 0.0 % FTA FL-90-X810 FY % Transportation Disadvantage Gr 580, % Transp Disadv FY12 AQP % Trans Disav FY13 AR , , (375,844.06) 35.2 % New Freedom SCAT , , (0.92) (83,000.92) 0.0 % New Freedom SCAT 217, , (217,439.66) 0.0 % New Freedom 0910 Pines % Total Revenues 7,844, ,859, ,581, , , (4,086,081.10) 48.0 % % Actual Expenditures: CTC Operators 2,075, ,075, ,220, , , , % CTC Operations Supervisors 456, , , , , % CTC Non Vehicle Maintenance 202, , , , , , % CTC Vehicle Maint Administrati % CTC Vehicle Maint Servicing (0.00) 0.0 % CTC Veh Maint Inspect Maintena 1,023, ,038, , , , , % CTC Administration 3,203, ,204, ,708, , , , % Transportation Disadvantage Gr 580, % Transp Disadv FY12 AQP60 1, % Trans Disav FY13 AR , , , , % New Freedom SCAT , , , % New Freedom SCAT 217, , , % PW Administration CTC % Total Expenditures 7,844, ,859, ,958, , , ,020, % Revenue Less Expenditures (376,675.82) (258,890.81) (688,755.23) (1,065,431.05) User Name: Sara Valari Run Date: 05/13/2014 Report ID: HPGL1000 (Monthly Amts) Page 3
48
49
50
51
52
53
54
55
56
57
58
59
60
61
62
63
64
65
66
67
68
69
70
71


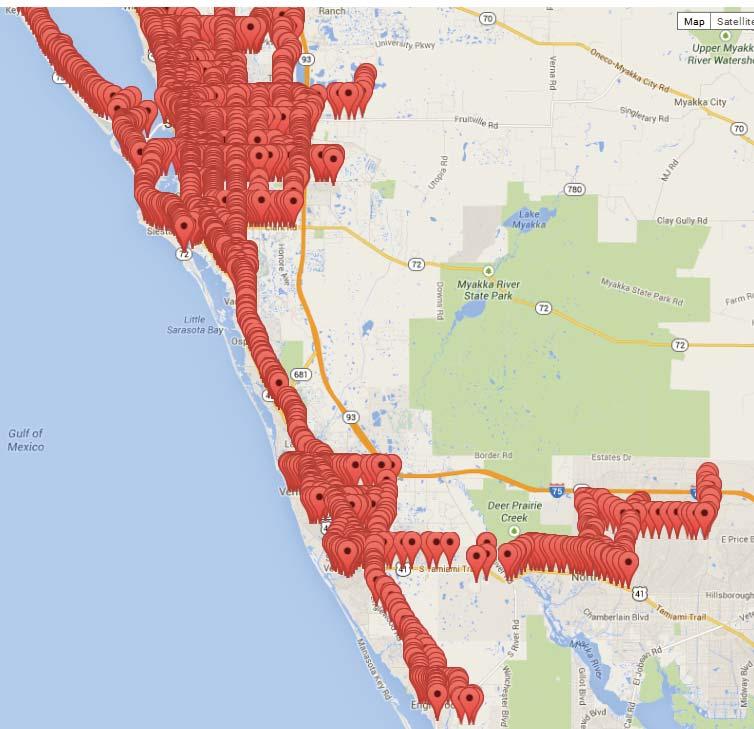
72 Figure 6-15: 2005 SCAT Route Coverage of Urban Transit Area Proposed Extension
73
74 Figure 6-11: Sarasota County Transit Routes ( B, Ord. No ,Oct. 27, 2010)
75


76 Rd Monday-Saturday Lunes-Sábado TERMINAL 17th St W Green Bridge Bus. 41 Bus. 41 Bayshore Rd City of Palmetto City of Bradenton t U.S. 41 Tamiama Trail Ave Ave N MANATEE SARASOTA Town of Longboat Key Old Bradenton Rd City of Sarasota Cocoanut Ave Orange Ave B. Click here to see changes to Route #2 Ocean Blvd Midnight Pass U.S. 41 Tamiama Trail Laurel Rd City of Venice Albee Farm Rd 9th St W DESOTO STATION A 18 Gulf of Mico Dr Bay Shore Rd Ken Thompson Pkwy 4 99 Blvd John Ringling Siesta Dr 11 Tallevast Rd Osprey Ave University Pkwy Stickney y Rd Pt Desoto Rd Dr Martin Luther King Jr Wy 7 Osprey Ave A 17 12th St Ringling Blvd P B D Tuttle Ave 5 Bahia Vista St Swift Rd Lockwood Ridge Rd 12 Lockwood Ridge Rd Beneva Rd Gulf Gate Dr 6 17th St Webber St 14 3 McIntosh Rd 15 1 Honore Ave 1A 15 C Gantt Rd Cattlemen Rd University Pkwy Fruitville Rd A. Click here to see changes to Route #1A Bee Ridge Rd Proctor Rd Clark Rd Palmer Blvd C. Click here to see changes to the Transfer Point Map MAP Inset Legend Libraries Schools Colleges and Universities Hospital Shopping Areas Park Areas Beneva Rd E G. Click here to see changes to Route F Venice Ave Venice Ave G Seminole Center Rd 13 Center Rd Shamrock Blvd Blvd D. Click here to see changes to Route 9 and Route 16 9 H Jacaranda J. Click here to see information on Express Routes 90X and 100X Price Blvd 29 I Sumter Blvd 20 City of North Port Toledo Blade Blvd 16 Gulf of Mexico Old Englewood Rd Indiana Ave Dearborn St Selma Hosmer Ave Pine St River Rd Doctors Dr Medical Blvd F. Click here to see changes to Route 13 For more detailed route information and time schedules, please check individual route maps, which are available locations, or online at For questions, K. Route 8 should be Route 13 E. Click here to see changes to Route 9 H and I. Click here to see changes to Route 20 and 29 Effective 7/17/10 SCAT Para mayor información sobre los servicios SCAT, llamar al o visitar For more information on SCAT services, call or visit
77
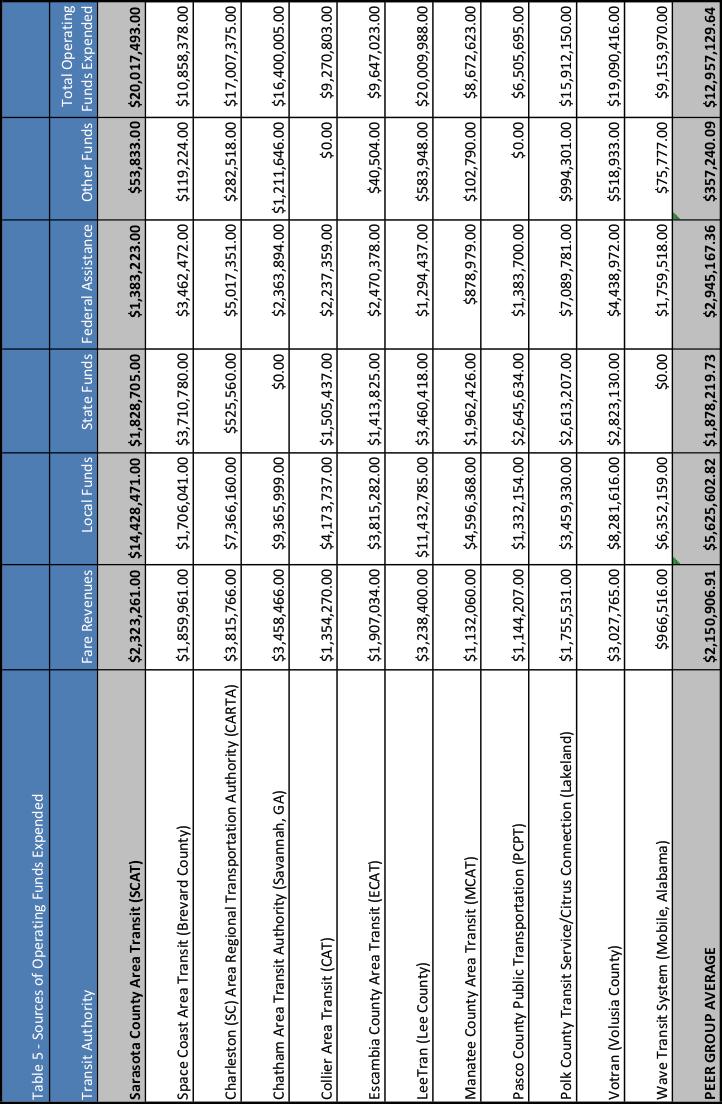
78 ID Number: Pinkney Avenue Sarasota, FL Sarasota County Area Transit (SCAT) Transit General Manager: Ms Glama Carter (941) General Information Financial Information Summary Operating Expenses Urbanized Area (UZA) Statistics Census Sarasota-Bradenton, FL Square Miles Population Population Ranking out of 465 UZAs Other UZAs Served Service Area Statistics Square Miles Population , ,474 Service Consumption Annual Passenger Miles Annual Unlinked Trips Average Weekday Unlinked Trips Average Saturday Unlinked Trips Average Sunday Unlinked Trips Service Supplied Annual s Annual Vehicle Revenue Hours Vehicles Operated in Maximum Service Vehicles Available for Maximum Service Base Period Requirement 16,636,194 2,961,808 9,790 7,129 1,719 3,897, , Fare Revenues Earned Sources of Operating Funds Expended Fare Revenues (12%) Local Funds (72%) State Funds (9%) Federal Assistance (7%) Other Funds (0%) Total Operating Funds Expended Sources of Capital Funds Expended Local Funds (50%) State Funds (10%) Federal Assistance (41%) Other Funds (0%) Total Capital Funds Expended $2,323,261 $2,323,261 $14,428,471 $1,828,705 $1,383,223 $53,833 $20,017,493 $1,623,615 $318,098 $1,335,259 $0 $3,276,972 Salary, Wages, Benefits Materials and Supplies Purchased Transportation Other Operating Expenses Total Operating Expenses Reconciling Cash Expenditures $11,421,419 $3,647,773 $2,297,379 $2,549,746 $19,916,317 $101,176 Vehicles Operated in Maximum Service and Uses of Capital Funds Sources of Operating Funds Expended Sources of Capital Funds Expended Mode Directly Operated Purchased Revenue Transportation 1 Vehicles Systems and Guideways Facilities and Stations Other Total Bus 42 0 $0 $18,817 $872,373 $832,766 $1,723,956 Demand Response $266,978 $0 $0 $0 $266,978 Commuter Bus 3 0 $1,286,038 $0 $0 $0 $1,286,038 Total $1,553,016 $18,817 $872,373 $832,766 $3,276,972 Modal Characteristics Mode Operating Expenses1 Fare Revenues1 Uses of Capital Funds Annual Passenger Miles Annual Vehicle Revenue Miles Annual Unlinked Trips Annual Vehicle Revenue Hours Bus $13,052,528 $1,843,786 $1,723,956 14,182,213 2,681,399 2,769, ,137 N/A % Demand Response $6,302,941 $412,243 $266,978 1,729,132 1,099, ,282 92,763 N/A N/A 53% Commuter Bus $560,848 $67,232 $1,286, , ,153 25,887 3,750 N/A N/A 167% Fixed Guideway Directional Route Miles Vehicles Available for Maximum Service Average Fleet Age in Years Vehicles Operated in Maximum Service Peak to Base Ratio Percent Spares Performance Measures Service Efficiency Service Effectiveness Service Effectiveness Mode Vehicle Revenue Hour Passenger Mile Unlinked Passenger Trip Vehicle Revenue Hour Bus $4.87 $72.46 $0.92 $ Demand Response $5.73 $67.95 $3.65 $ Commuter Bus $4.79 $ $0.77 $ Operating Expenses per Passenger Mile Operating Expenses per Passenger Mile Bus Bus Bus Demand Response Demand Response Demand Response 1 Excludes data for purchased transportation reported separately Data Source: 2012 National Transit Database 2012 National Transit Profiles - Full Reporting Agencies Page 238
79 ID Number: John Street Charleston, SC Charleston Area Regional Transportation Authority (CARTA) Executive Director: Ms. Christine Wilkinson (843) General Information Financial Information Summary Operating Expenses Urbanized Area (UZA) Statistics Census Charleston-North Charleston, SC Square Miles Population Population Ranking out of 465 UZAs Other UZAs Served Service Area Statistics Square Miles Population , ,286 Service Consumption Annual Passenger Miles Annual Unlinked Trips Average Weekday Unlinked Trips Average Saturday Unlinked Trips Average Sunday Unlinked Trips Service Supplied Annual s Annual Vehicle Revenue Hours Vehicles Operated in Maximum Service Vehicles Available for Maximum Service Base Period Requirement 18,721,574 4,904,480 15,538 12,656 4,632 3,439, , Fare Revenues Earned Sources of Operating Funds Expended Fare Revenues (22%) Local Funds (43%) State Funds (3%) Federal Assistance (30%) Other Funds (2%) Total Operating Funds Expended Sources of Capital Funds Expended Local Funds (21%) State Funds (51%) Federal Assistance (28%) Other Funds (0%) Total Capital Funds Expended $3,827,766 $3,815,766 $7,366,160 $525,580 $5,017,351 $282,518 $17,007,375 $755,922 $1,780,489 $969,872 $15,000 $3,521,283 Salary, Wages, Benefits Materials and Supplies Purchased Transportation Other Operating Expenses Total Operating Expenses Reconciling Cash Expenditures $578,501 $2,394,750 $12,418,069 $1,469,860 $16,861,180 $146,195 Vehicles Operated in Maximum Service and Uses of Capital Funds Sources of Operating Funds Expended Sources of Capital Funds Expended Mode Directly Operated Purchased Revenue Transportation 1 Vehicles Systems and Guideways Facilities and Stations Other Total Bus 0 81 $2,053,782 $112,912 $876,456 $259,020 $3,302,170 Demand Response 0 23 $0 $0 $219,114 $0 $219,114 Total $2,053,782 $112,912 $1,095,570 $259,020 $3,521,284 Modal Characteristics Mode Operating Expenses1 Fare Revenues1 Uses of Capital Funds Annual Passenger Miles Annual Vehicle Revenue Miles Annual Unlinked Trips Annual Vehicle Revenue Hours Bus $14,330,763 $3,577,474 $3,302,170 17,938,164 2,848,262 4,832, ,562 N/A % Demand Response $2,530,417 $250,292 $219, , ,482 72,342 39,371 N/A N/A 4% Fixed Guideway Directional Route Miles Vehicles Available for Maximum Service Average Fleet Age in Years Vehicles Operated in Maximum Service Peak to Base Ratio Percent Spares Performance Measures Service Efficiency Service Effectiveness Service Effectiveness Mode Vehicle Revenue Hour Passenger Mile Unlinked Passenger Trip Vehicle Revenue Hour Bus $5.03 $69.04 $0.80 $ Demand Response $4.28 $64.27 $3.23 $ Operating Expenses per Passenger Mile Operating Expenses per Passenger Mile Bus Bus Bus Demand Response Demand Response Demand Response 1 Excludes data for purchased transportation reported separately Data Source: 2012 National Transit Database 2012 National Transit Profiles - Full Reporting Agencies Page 265
80 ID Number: East Gwinnett Street, P.O. Box 9118 Savannah, GA Chatham Area Transit Authority (CAT) Executive Director: Ms. Nancy Nichols (912) General Information Financial Information Summary Operating Expenses Urbanized Area (UZA) Statistics Census Savannah, GA Square Miles Population Population Ranking out of 465 UZAs Other UZAs Served Service Area Statistics Square Miles Population , ,128 Service Consumption Annual Passenger Miles Annual Unlinked Trips Average Weekday Unlinked Trips Average Saturday Unlinked Trips Average Sunday Unlinked Trips Service Supplied Annual s Annual Vehicle Revenue Hours Vehicles Operated in Maximum Service Vehicles Available for Maximum Service Base Period Requirement 14,257,052 4,559,963 14,845 11,233 4,892 3,151, , Fare Revenues Earned Sources of Operating Funds Expended Fare Revenues (21%) Local Funds (57%) State Funds (0%) Federal Assistance (14%) Other Funds (7%) Total Operating Funds Expended Sources of Capital Funds Expended Local Funds (20%) State Funds (0%) Federal Assistance (80%) Other Funds (0%) Total Capital Funds Expended $3,458,466 $3,458,466 $9,365,999 $0 $2,363,894 $1,211,646 $16,400,005 $2,471,946 $0 $9,887,785 $0 $12,359,731 Salary, Wages, Benefits Materials and Supplies Purchased Transportation Other Operating Expenses Total Operating Expenses Reconciling Cash Expenditures $22,496 $2,292,744 $13,842,730 $242,035 $16,400,005 $0 Vehicles Operated in Maximum Service and Uses of Capital Funds Sources of Operating Funds Expended Sources of Capital Funds Expended Mode Directly Operated Purchased Revenue Transportation 1 Vehicles Systems and Guideways Facilities and Stations Other Total Bus 0 52 $2,929,633 $151,798 $7,237,563 $0 $10,318,994 Demand Response 0 20 $1,043,212 $0 $0 $0 $1,043,212 Ferryboat 0 1 $997,525 $0 $0 $0 $997,525 Total 0 73 $4,970,370 $151,798 $7,237,563 $0 $12,359,731 Modal Characteristics Mode Operating Expenses1 Fare Revenues1 Uses of Capital Funds Annual Passenger Miles Annual Vehicle Revenue Miles Annual Unlinked Trips Annual Vehicle Revenue Hours Bus $13,368,112 $3,324,852 $10,318,994 13,356,133 2,432,822 3,838, ,214 N/A % Demand Response $2,095,352 $133,614 $1,043, , ,935 78,906 53,128 N/A N/A 30% Ferryboat $936,541 $0 $997, ,991 15, ,082 7, N/A 200% Fixed Guideway Directional Route Miles Vehicles Available for Maximum Service Average Fleet Age in Years Vehicles Operated in Maximum Service Peak to Base Ratio Percent Spares Performance Measures Service Efficiency Service Effectiveness Service Effectiveness Mode Vehicle Revenue Hour Passenger Mile Unlinked Passenger Trip Vehicle Revenue Hour Bus $5.49 $68.83 $1.00 $ Demand Response $2.98 $39.44 $3.19 $ Ferryboat $59.47 $ $3.84 $ Operating Expenses per Passenger Mile Operating Expenses per Passenger Mile Bus Bus Bus Demand Response Demand Response Demand Response 1 Excludes data for purchased transportation reported separately Data Source: 2012 National Transit Database 2012 National Transit Profiles - Full Reporting Agencies Page 220
81 ID Number: RADIO RD Naples, FL Collier Area Transit (CAT) Administrator, Public Services Division: Mr. Steve Carnell (239) General Information Financial Information Summary Operating Expenses Urbanized Area (UZA) Statistics Census Bonita Springs, FL Square Miles Population Population Ranking out of 465 UZAs Other UZAs Served Service Area Statistics Square Miles Population , , ,785 Service Consumption Annual Passenger Miles Annual Unlinked Trips Average Weekday Unlinked Trips Average Saturday Unlinked Trips Average Sunday Unlinked Trips Service Supplied Annual s Annual Vehicle Revenue Hours Vehicles Operated in Maximum Service Vehicles Available for Maximum Service Base Period Requirement 11,372,395 1,323,444 4,134 3,597 1,562 2,456, , Fare Revenues Earned Sources of Operating Funds Expended Fare Revenues (15%) Local Funds (45%) State Funds (16%) Federal Assistance (24%) Other Funds (0%) Total Operating Funds Expended Sources of Capital Funds Expended Local Funds (17%) State Funds (24%) Federal Assistance (60%) Other Funds (0%) Total Capital Funds Expended $1,354,270 $1,354,270 $4,173,737 $1,505,437 $2,237,359 $0 $9,270,803 $707,059 $1,006,284 $2,552,115 $0 $4,265,458 Salary, Wages, Benefits Materials and Supplies Purchased Transportation Other Operating Expenses Total Operating Expenses Reconciling Cash Expenditures $876,391 $1,814,742 $6,153,182 $426,488 $9,270,803 $0 Vehicles Operated in Maximum Service and Uses of Capital Funds Sources of Operating Funds Expended Sources of Capital Funds Expended Mode Directly Operated Purchased Revenue Transportation 1 Vehicles Systems and Guideways Facilities and Stations Other Total Bus 0 16 $1,123,071 $1,155,885 $1,746,146 $123,646 $4,148,748 Demand Response 0 25 $116,710 $0 $0 $0 $116,710 Total 0 41 $1,239,781 $1,155,885 $1,746,146 $123,646 $4,265,458 Modal Characteristics Mode Operating Expenses1 Fare Revenues1 Uses of Capital Funds Annual Passenger Miles Annual Vehicle Revenue Miles Annual Unlinked Trips Annual Vehicle Revenue Hours Bus $5,779,387 $1,195,029 $4,148,748 10,146,075 1,231,778 1,207,866 67,318 N/A % Demand Response $3,491,416 $159,241 $116,710 1,226,320 1,224, ,578 68,001 N/A N/A 20% Fixed Guideway Directional Route Miles Vehicles Available for Maximum Service Average Fleet Age in Years Vehicles Operated in Maximum Service Peak to Base Ratio Percent Spares Performance Measures Service Efficiency Service Effectiveness Service Effectiveness Mode Vehicle Revenue Hour Passenger Mile Unlinked Passenger Trip Vehicle Revenue Hour Bus $4.69 $85.85 $0.57 $ Demand Response $2.85 $51.34 $2.85 $ Operating Expenses per Passenger Mile Operating Expenses per Passenger Mile Bus Bus Bus Demand Response Demand Response Demand Response 1 Excludes data for purchased transportation reported separately Data Source: 2012 National Transit Database 2012 National Transit Profiles - Full Reporting Agencies Page 274
82 ID Number: West Fairfield Drive Pensacola, FL Escambia County Area Transit (ECAT) General Manager: Ms. Mary Lou Franzoni (850) General Information Financial Information Summary Operating Expenses Urbanized Area (UZA) Statistics Census Pensacola, FL-AL Square Miles Population Population Ranking out of 465 UZAs Other UZAs Served Service Area Statistics Square Miles Population , ,765 Service Consumption Annual Passenger Miles Annual Unlinked Trips Average Weekday Unlinked Trips Average Saturday Unlinked Trips Average Sunday Unlinked Trips Service Supplied Annual s Annual Vehicle Revenue Hours Vehicles Operated in Maximum Service Vehicles Available for Maximum Service Base Period Requirement 8,258,162 1,523,099 5,434 2, ,865, , Fare Revenues Earned Sources of Operating Funds Expended Fare Revenues (20%) Local Funds (40%) State Funds (15%) Federal Assistance (26%) Other Funds (0%) Total Operating Funds Expended Sources of Capital Funds Expended Local Funds (0%) State Funds (0%) Federal Assistance (100%) Other Funds (0%) Total Capital Funds Expended $1,907,034 $1,907,034 $3,815,282 $1,413,825 $2,470,378 $40,504 $9,647,023 $0 $0 $162,608 $0 $162,608 Salary, Wages, Benefits Materials and Supplies Purchased Transportation Other Operating Expenses Total Operating Expenses Reconciling Cash Expenditures $24,554 $0 $9,538,131 $84,338 $9,647,023 $0 Vehicles Operated in Maximum Service and Uses of Capital Funds Sources of Operating Funds Expended Sources of Capital Funds Expended Mode Directly Operated Purchased Revenue Transportation 1 Vehicles Systems and Guideways Facilities and Stations Other Total Bus 0 31 $0 $0 $162,608 $0 $162,608 Demand Response 0 24 $0 $0 $0 $0 $0 Total 0 55 $0 $0 $162,608 $0 $162,608 Modal Characteristics Mode Operating Expenses1 Fare Revenues1 Uses of Capital Funds Annual Passenger Miles Annual Vehicle Revenue Miles Annual Unlinked Trips Annual Vehicle Revenue Hours Bus $8,126,624 $1,734,533 $162,608 7,844,630 1,451,900 1,473, ,760 N/A % Demand Response $1,520,399 $172,501 $0 413, ,532 49,687 25,840 N/A N/A 17% Fixed Guideway Directional Route Miles Vehicles Available for Maximum Service Average Fleet Age in Years Vehicles Operated in Maximum Service Peak to Base Ratio Percent Spares Performance Measures Service Efficiency Service Effectiveness Service Effectiveness Mode Vehicle Revenue Hour Passenger Mile Unlinked Passenger Trip Vehicle Revenue Hour Bus $5.60 $77.57 $1.04 $ Demand Response $3.68 $58.84 $3.68 $ Operating Expenses per Passenger Mile Operating Expenses per Passenger Mile Bus Bus Bus Demand Response Demand Response Demand Response 1 Excludes data for purchased transportation reported separately Data Source: 2012 National Transit Database 2012 National Transit Profiles - Full Reporting Agencies Page 232
83 ID Number: Landing View Road Fort Myers, FL Lee County Transit (LeeTran) Transit Director: Mr. Steven Myers (239) General Information Financial Information Summary Operating Expenses Urbanized Area (UZA) Statistics Census Cape Coral, FL Square Miles Population Population Ranking out of 465 UZAs Other UZAs Served Service Area Statistics Square Miles Population , ,381 Service Consumption Annual Passenger Miles Annual Unlinked Trips Average Weekday Unlinked Trips Average Saturday Unlinked Trips Average Sunday Unlinked Trips Service Supplied Annual s Annual Vehicle Revenue Hours Vehicles Operated in Maximum Service Vehicles Available for Maximum Service Base Period Requirement 23,519,620 3,895,816 12,898 8,605 2,940 4,347, , Fare Revenues Earned Sources of Operating Funds Expended Fare Revenues (16%) Local Funds (57%) State Funds (17%) Federal Assistance (6%) Other Funds (3%) Total Operating Funds Expended Sources of Capital Funds Expended Local Funds (13%) State Funds (9%) Federal Assistance (76%) Other Funds (1%) Total Capital Funds Expended $3,221,217 $3,238,400 $11,432,785 $3,460,418 $1,294,437 $583,948 $20,009,988 $469,931 $333,557 $2,676,917 $44,686 $3,525,091 Salary, Wages, Benefits Materials and Supplies Purchased Transportation Other Operating Expenses Total Operating Expenses Reconciling Cash Expenditures $13,878,829 $3,646,305 $103,757 $2,381,097 $20,009,988 $0 Vehicles Operated in Maximum Service and Uses of Capital Funds Sources of Operating Funds Expended Sources of Capital Funds Expended Mode Directly Operated Purchased Revenue Transportation 1 Vehicles Systems and Guideways Facilities and Stations Other Total Bus 46 0 $0 $0 $2,454,131 $1,053,778 $3,507,909 Demand Response 36 0 $0 $0 $0 $0 $0 Vanpool 0 11 $0 $0 $0 $17,183 $17,183 Total $0 $0 $2,454,131 $1,070,961 $3,525,092 Modal Characteristics Mode Operating Expenses1 Fare Revenues1 Uses of Capital Funds Annual Passenger Miles Annual Vehicle Revenue Miles Annual Unlinked Trips Annual Vehicle Revenue Hours Bus $15,300,979 $2,754,811 $3,507,909 20,790,054 2,982,647 3,754, ,385 N/A % Demand Response $4,537,795 $379,832 $0 1,085,204 1,139, ,274 65,302 N/A N/A 19% Vanpool $171,214 $86,574 $17,183 1,644, ,724 39,463 7,590 N/A N/A 0% Fixed Guideway Directional Route Miles Vehicles Available for Maximum Service Average Fleet Age in Years Vehicles Operated in Maximum Service Peak to Base Ratio Percent Spares Performance Measures Service Efficiency Service Effectiveness Service Effectiveness Mode Vehicle Revenue Hour Passenger Mile Unlinked Passenger Trip Vehicle Revenue Hour Bus $5.13 $84.82 $0.74 $ Demand Response $3.98 $69.49 $4.18 $ Vanpool $0.76 $22.56 $0.10 $ Operating Expenses per Passenger Mile Operating Expenses per Passenger Mile Bus Bus Bus Demand Response Demand Response Demand Response 1 Excludes data for purchased transportation reported separately Data Source: 2012 National Transit Database 2012 National Transit Profiles - Full Reporting Agencies Page 223
84 ID Number: th Avenue, East Bradenton, FL Manatee County Area Transit (MCAT) Department Director: Mr. Ron Schulhofer (941) General Information Financial Information Summary Operating Expenses Urbanized Area (UZA) Statistics Census Sarasota-Bradenton, FL Square Miles Population Population Ranking out of 465 UZAs Other UZAs Served Service Area Statistics Square Miles Population , ,833 Service Consumption Annual Passenger Miles Annual Unlinked Trips Average Weekday Unlinked Trips Average Saturday Unlinked Trips Average Sunday Unlinked Trips Service Supplied Annual s Annual Vehicle Revenue Hours Vehicles Operated in Maximum Service Vehicles Available for Maximum Service Base Period Requirement 8,697,358 1,849,279 5,935 4,291 1,339 1,819, , Fare Revenues Earned Sources of Operating Funds Expended Fare Revenues (13%) Local Funds (53%) State Funds (23%) Federal Assistance (10%) Other Funds (1%) Total Operating Funds Expended Sources of Capital Funds Expended Local Funds (0%) State Funds (19%) Federal Assistance (81%) Other Funds (0%) Total Capital Funds Expended $1,132,060 $1,132,060 $4,596,368 $1,962,426 $878,979 $102,790 $8,672,623 $0 $539,604 $2,247,793 $0 $2,787,397 Salary, Wages, Benefits Materials and Supplies Purchased Transportation Other Operating Expenses Total Operating Expenses Reconciling Cash Expenditures $5,544,176 $1,891,358 $0 $1,237,090 $8,672,624 $0 Vehicles Operated in Maximum Service and Uses of Capital Funds Sources of Operating Funds Expended Sources of Capital Funds Expended Mode Directly Operated Purchased Revenue Transportation 1 Vehicles Systems and Guideways Facilities and Stations Other Total Bus 19 0 $457,099 $606,404 $1,446,724 $253,600 $2,763,827 Demand Response 22 0 $0 $23,570 $0 $0 $23,570 Total 41 0 $457,099 $629,974 $1,446,724 $253,600 $2,787,397 Modal Characteristics Mode Operating Expenses1 Fare Revenues1 Uses of Capital Funds Annual Passenger Miles Annual Vehicle Revenue Miles Annual Unlinked Trips Annual Vehicle Revenue Hours Bus $6,403,900 $892,121 $2,763,827 7,863,533 1,263,676 1,767,086 86,926 N/A % Demand Response $2,268,724 $239,939 $23, , ,608 82,193 38,863 N/A N/A 32% Fixed Guideway Directional Route Miles Vehicles Available for Maximum Service Average Fleet Age in Years Vehicles Operated in Maximum Service Peak to Base Ratio Percent Spares Performance Measures Service Efficiency Service Effectiveness Service Effectiveness Mode Vehicle Revenue Hour Passenger Mile Unlinked Passenger Trip Vehicle Revenue Hour Bus $5.07 $73.67 $0.81 $ Demand Response $4.08 $58.38 $2.72 $ Operating Expenses per Passenger Mile Operating Expenses per Passenger Mile Bus Bus Bus Demand Response Demand Response Demand Response 1 Excludes data for purchased transportation reported separately Data Source: 2012 National Transit Database 2012 National Transit Profiles - Full Reporting Agencies Page 221
85 ID Number: Galen Wilson Boulevard Port Richey, FL Pasco County Public Transportation (PCPT) Assistant County Administrator: Dr. Suzanne Salichs (727) General Information Financial Information Summary Operating Expenses Urbanized Area (UZA) Statistics Census Tampa-St. Petersburg, FL Square Miles Population Population Ranking out of 465 UZAs Other UZAs Served Service Area Statistics Square Miles Population 957 2,441, ,697 Service Consumption Annual Passenger Miles Annual Unlinked Trips Average Weekday Unlinked Trips 2 Average Saturday Unlinked Trips 2 Average Sunday Unlinked Trips 2 Service Supplied Annual s Annual Vehicle Revenue Hours Vehicles Operated in Maximum Service Vehicles Available for Maximum Service Base Period Requirement 7,564,443 1,031,816 3,517 2, ,794, , Fare Revenues Earned Sources of Operating Funds Expended Fare Revenues (18%) Local Funds (20%) State Funds (41%) Federal Assistance (21%) Other Funds (0%) Total Operating Funds Expended Sources of Capital Funds Expended Local Funds (0%) State Funds (0%) Federal Assistance (100%) Other Funds (0%) Total Capital Funds Expended $1,144,207 $1,144,207 $1,332,154 $2,645,634 $1,383,700 $0 $6,505,695 $0 $0 $311,566 $0 $311,566 Salary, Wages, Benefits Materials and Supplies Purchased Transportation Other Operating Expenses Total Operating Expenses Reconciling Cash Expenditures $3,066,845 $1,349,019 $1,173,536 $916,296 $6,505,696 $0 Vehicles Operated in Maximum Service and Uses of Capital Funds Sources of Operating Funds Expended Sources of Capital Funds Expended Mode Directly Operated Purchased Revenue Transportation 1 Vehicles Systems and Guideways Facilities and Stations Other Total Bus 18 0 $0 $53,899 $97,798 $125,727 $277,424 Demand Response - Taxi 0 37 $0 $0 $0 $0 $0 Demand Response 11 0 $0 $8,537 $0 $25,605 $34,142 Total $0 $62,436 $97,798 $151,332 $311,566 Modal Characteristics Mode Operating Expenses1 Fare Revenues1 Uses of Capital Funds Annual Passenger Miles Annual Vehicle Revenue Miles Annual Unlinked Trips Annual Vehicle Revenue Hours Bus $4,284,245 $1,099,739 $277,424 6,926,827 1,210, ,591 68,728 N/A % Demand Response - Taxi $1,280,911 $25,802 $0 379, ,389 44,307 22,127 N/A 50 N/A 37 N/A 35% Demand Response $940,540 $18,666 $34, , ,529 30,918 11,463 N/A N/A 18% Fixed Guideway Directional Route Miles Vehicles Available for Maximum Service Average Fleet Age in Years Vehicles Operated in Maximum Service Peak to Base Ratio Percent Spares Performance Measures Service Efficiency Service Effectiveness Service Effectiveness Mode Vehicle Revenue Hour Passenger Mile Unlinked Passenger Trip Vehicle Revenue Hour Bus $3.54 $62.34 $0.62 $ Demand Response - Taxi $3.38 $57.89 $3.38 $ Demand Response $4.60 $82.05 $3.64 $ Operating Expenses per Passenger Mile Operating Expenses per Passenger Mile Bus Bus Bus Demand Response - Taxi Demand Response - Taxi Demand Response - Taxi 1 Excludes data for purchased transportation reported separately 2 Average UPT values not available for DT Demand Response Taxi Data Source: 2012 National Transit Database 2012 National Transit Profiles - Full Reporting Agencies Page 248
86 ID Number: Golfview Avenue, Drawer HS09, P.O. Box 9005 Bartow, FL Polk County Transit Services Division - Polk County Board of County Commissioners (PCTS) Purchased transportation provider(s) filing a separate report: Lakeland Area Mass Transit District Citrus Connection (4031) Director, Polk County Transit Services: Mr. Paul Simmons (863) General Information Financial Information Summary Operating Expenses Urbanized Area (UZA) Statistics Census Lakeland, FL Square Miles Population Population Ranking out of 465 UZAs Other UZAs Served Service Area Statistics Square Miles Population , ,924 Service Consumption Annual Passenger Miles Annual Unlinked Trips Average Weekday Unlinked Trips Average Saturday Unlinked Trips Average Sunday Unlinked Trips Service Supplied Annual s Annual Vehicle Revenue Hours Vehicles Operated in Maximum Service Vehicles Available for Maximum Service Base Period Requirement 6,522, ,316 2,117 2, ,931, , Fare Revenues Earned Sources of Operating Funds Expended Fare Revenues (5%) Local Funds (23%) State Funds (20%) Federal Assistance (51%) Other Funds (1%) Total Operating Funds Expended Sources of Capital Funds Expended Local Funds (10%) State Funds (23%) Federal Assistance (67%) Other Funds (0%) Total Capital Funds Expended $394,440 $394,440 $1,681,484 $1,461,450 $3,774,250 $63,706 $7,375,330 $34,448 $82,502 $242,602 $0 $359,552 Salary, Wages, Benefits Materials and Supplies Purchased Transportation Other Operating Expenses Total Operating Expenses Reconciling Cash Expenditures $2,978,191 $659,424 $1,825,508 $1,912,207 $7,375,330 $0 Vehicles Operated in Maximum Service and Uses of Capital Funds Sources of Operating Funds Expended Sources of Capital Funds Expended Mode Directly Operated Purchased Revenue Transportation 1 Vehicles Systems and Guideways Facilities and Stations Other Total Bus 11 0 $0 $74,023 $225,885 $25,196 $325,104 Demand Response $34,448 $0 $0 $0 $34,448 Total $34,448 $74,023 $225,885 $25,196 $359,552 Modal Characteristics Mode Operating Expenses1 Fare Revenues1 Uses of Capital Funds Annual Passenger Miles Annual Vehicle Revenue Miles Annual Unlinked Trips Annual Vehicle Revenue Hours Bus $2,665,590 $280,796 $325,104 4,957, , ,711 32,614 N/A % Demand Response $4,709,740 $113,644 $34,448 1,564,614 1,257, ,605 86,666 N/A N/A 26% Fixed Guideway Directional Route Miles Vehicles Available for Maximum Service Average Fleet Age in Years Vehicles Operated in Maximum Service Peak to Base Ratio Percent Spares Performance Measures Service Efficiency Service Effectiveness Service Effectiveness Mode Vehicle Revenue Hour Passenger Mile Unlinked Passenger Trip Vehicle Revenue Hour Bus $3.95 $81.73 $0.54 $ Demand Response $3.75 $54.34 $3.01 $ Operating Expenses per Passenger Mile Operating Expenses per Passenger Mile Bus Bus Bus Demand Response Demand Response Demand Response 1 Excludes data for purchased transportation reported separately Data Source: 2012 National Transit Database 2012 National Transit Profiles - Full Reporting Agencies Page 267
87 ID Number: George Jenkins Boulevard Lakeland, FL Lakeland Area Mass Transit District (Citrus Connection) Provides purchased transportation to: Polk County Transit Services Division - Polk County Board of County Commissioners (4127) Executive Director: Mr. Tom Phillips (863) General Information Financial Information Summary Operating Expenses Urbanized Area (UZA) Statistics Census Lakeland, FL Square Miles Population Population Ranking out of 465 UZAs Other UZAs Served Service Area Statistics Square Miles Population , ,000 Service Consumption Annual Passenger Miles Annual Unlinked Trips Average Weekday Unlinked Trips Average Saturday Unlinked Trips Average Sunday Unlinked Trips Service Supplied Annual s Annual Vehicle Revenue Hours Vehicles Operated in Maximum Service Vehicles Available for Maximum Service Base Period Requirement 6,341,769 1,197,815 4,341 2, ,306,511 97, Fare Revenues Earned Sources of Operating Funds Expended Fare Revenues (16%) Local Funds (21%) State Funds (13%) Federal Assistance (39%) Other Funds (11%) Total Operating Funds Expended Sources of Capital Funds Expended Local Funds (51%) State Funds (2%) Federal Assistance (47%) Other Funds (0%) Total Capital Funds Expended $1,361,091 $1,361,091 $1,777,846 $1,151,757 $3,315,531 $930,595 $8,536,820 $1,238,694 $43,338 $1,134,748 $0 $2,416,780 Salary, Wages, Benefits Materials and Supplies Purchased Transportation Other Operating Expenses Total Operating Expenses Reconciling Cash Expenditures $5,627,107 $1,791,247 $0 $1,058,036 $8,476,390 $60,430 Vehicles Operated in Maximum Service and Uses of Capital Funds Sources of Operating Funds Expended Sources of Capital Funds Expended Mode Directly Operated Purchased Revenue Transportation 1 Vehicles Systems and Guideways Facilities and Stations Other Total Bus 22 0 $1,642,504 $13,843 $668,816 $91,617 $2,416,780 Demand Response 13 0 $0 $0 $0 $0 $0 Total 35 0 $1,642,504 $13,843 $668,816 $91,617 $2,416,780 Modal Characteristics Mode Operating Expenses1 Fare Revenues1 Uses of Capital Funds Annual Passenger Miles Annual Vehicle Revenue Miles Annual Unlinked Trips Annual Vehicle Revenue Hours Bus $6,849,656 $1,213,724 $2,416,780 5,760, ,379 1,104,769 69,553 N/A % Demand Response $1,626,734 $147,367 $0 580, ,132 93,046 27,888 N/A N/A 31% Fixed Guideway Directional Route Miles Vehicles Available for Maximum Service Average Fleet Age in Years Vehicles Operated in Maximum Service Peak to Base Ratio Percent Spares Performance Measures Service Efficiency Service Effectiveness Service Effectiveness Mode Vehicle Revenue Hour Passenger Mile Unlinked Passenger Trip Vehicle Revenue Hour Bus $6.94 $98.48 $1.19 $ Demand Response $5.10 $58.33 $2.80 $ Operating Expenses per Passenger Mile Operating Expenses per Passenger Mile Bus Bus Bus Demand Response Demand Response Demand Response 1 Excludes data for purchased transportation reported separately Data Source: 2012 National Transit Database 2012 National Transit Profiles - Full Reporting Agencies Page 226
Transit Peer Comparison
 Transit Peer Comparison October 2016 Based on data from the National Transit Database, US Department of Transportation and the US Census Peer Transit Communities, FY2014 Community County Population Source:
Date: 11/6/15. Total Passengers
 Total San Diego Metropolitan Transit System POLICY 42 PERFORMANCE MONITORING REPORT Page 1 of 6 OBJECTIVE Develop a Customer-Focused and Competitive System The following measures of productivity and service
St. Johns County Transit Development Plan Update
 St. Johns County Transit Development Plan Update 2012-2021 Demographic Information Population 190,000 people in 2010 51% increase from 2000 Employment 64% over age 16 in labor force St. Augustine, Ponte
TENTATIVE FIVE YEAR WORK PROGRAM FISCAL YEARS
 Florida Department of TRANSPORTATION - DISTRICT ONE TENTATIVE FIVE YEAR WORK PROGRAM FISCAL YEARS 2017-2021 DISTRICT ONE HEADQUARTERS (BARTOW) SOUTHWEST AREA OFFICE (FORT MYERS) MISSION STATEMENT The Department
Att. A, AI 46, 11/9/17
 Total s San Diego Metropolitan Transit System POLICY 42 PERFORMANCE MONITORING REPORT Page 1 of 6 Date: 11/8/17 OBJECTIVE Develop a Customer-Focused and Competitive System The following measures of productivity
GOLDEN CRESCENT REGIONAL PLANNING COMMISSION
 GOLDEN CRESCENT REGIONAL PLANNING COMMISSION The Golden Crescent Regional Planning Commission (GCRPC) is a political subdivision of the State of Texas created by the Regional Planning Act of 1965. GCRPC
Peer Performance Measurement February 2019 Prepared by the Division of Planning & Market Development
 2017 Regional Peer Review Peer Performance Measurement February 2019 Prepared by the Division of Planning & Market Development CONTENTS EXECUTIVE SUMMARY... 3 SNAPSHOT... 5 PEER SELECTION... 6 NOTES/METHODOLOGY...
APPENDIX B COMMUTER BUS FAREBOX POLICY PEER REVIEW
 APPENDIX B COMMUTER BUS FAREBOX POLICY PEER REVIEW APPENDIX B COMMUTER BUS FAREBOX POLICY PEER REVIEW The following pages are excerpts from a DRAFT-version Fare Analysis report conducted by Nelson\Nygaard
Comprehensive Operational Analysis
 June 2016 Revised August 2016 Comprehensive Operational Analysis of the Sarasota County Area Transit System Recommendations Report Sarasota County Area Transit Comprehensive Operations Analysis Technical
Bristol Virginia Transit
 Bristol Virginia Transit 1 Transit Overview Bristol Virginia Transit (BVT) is a Federally Funded and certified urban area transit system. BVT began operation in its current form in 1982. In Fiscal Year
APPENDIX B. Arlington Transit Peer Review Technical Memorandum
 APPENDIX B Arlington Transit Peer Review Technical Memorandum Arlington County Appendix B December 2010 Table of Contents 1.0 OVERVIEW OF PEER ANALYSIS PROCESS... 2 1.1 National Transit Database...2 1.2
Current Operations CHAPTER II INTRODUCTION DESCRIPTION OF TRANSPORTATION SERVICES
 Chapter II CHAPTER II Current Operations INTRODUCTION This chapter provides an overview of Centre Area Transportation Authority (CATA). CATA is a joint municipal authority formed under the Municipal Authorities
MONTHLY OPERATIONS REPORT DECEMBER 2015
 MONTHLY OPERATIONS REPORT DECEMBER 215 Table of Contents DECEMBER 215 Section Page December Highlights... 3 Strategic Goals Progress Update... 4 Ridership... 6 Revenue... 9 Expenses... 1 System Summary...
RTA ScoreCard December 2009
 Background and Context RTA ScoreCard December 2009 Chapter 25 of the Acts of 2009 modernized the transportation systems of the Commonwealth and created the new MassDOT. Section 6 of this law established
SARASOTA COUNTY GOVERNMENT Sarasota County Area Transit
 SARASOTA COUNTY GOVERNMENT Sarasota County Area Transit TO: THROUGH: FROM: DATE: July 11, 2017 SUBJECT: Sarasota County Commission Thomas A. Harmer, County Administrator Rocky A. Burke, Director, Sarasota
ESCAMBIA COUNTY AREA TRANSIT MTAC REPORT
 ESCAMBIA COUNTY AREA TRANSIT MTAC REPORT November 8, 2017 Meeting Escambia County Area Transit 1515 W. Fairfield Drive Pensacola, FL 32501 850-595-3228 INTRODUCTION 2 Summary Background MTAC ECAT Benchmarks
Board of Directors Information Summary
 Regional Public Transportation Authority 302 N. First Avenue, Suite 700, Phoenix, Arizona 85003 602-262-7433, Fax 602-495-0411 Board of Directors Information Summary Agenda Item #6 Date July 11, 2008 Subject
Swedish Service Routes, American Style: Local Bus for the Suburbs 70TH ANNUAL OHIO TRANSPORTATION ENGINEERING CONFERENCE OCTOBER 25, 2016
 Swedish Service Routes, American Style: Local Bus for the Suburbs 70TH ANNUAL OHIO TRANSPORTATION ENGINEERING CONFERENCE OCTOBER 25, 2016 Swedish Service Route Model Response to growing expense of Special
October REGIONAL ROUTE PERFORMANCE ANALYSIS
 October 2018 2017 REGIONAL ROUTE PERFORMANCE ANALYSIS The Council s mission is to foster efficient and economic growth for a prosperous metropolitan region Metropolitan Council Members Alene Tchourumoff
September 2014 Prepared by the Department of Finance & Performance Management Sub-Regional Report PERFORMANCE MEASURES
 September 2014 Prepared by the Department of Finance & Performance Management 2013 Sub-Regional Report PERFORMANCE MEASURES REGIONAL PERFORMANCE MEASURES RTA staff has undertaken the development of a performance
MONTHLY OPERATIONS REPORT SEPTEMBER 2015
 MONTHLY OPERATIONS REPORT SEPTEMBER 215 Table of Contents SEPTEMBER 215 Section Page September Highlights... 3 Strategic Goals Progress Update... 4 Ridership... 6 Revenue... 9 Expenses... 1 System Summary...
Chapter 3. Burke & Company
 Chapter 3 Burke & Company 3. WRTA RIDERSHIP AND RIDERSHIP TRENDS 3.1 Service Overview The Worcester Regional Transit Authority (WRTA) provides transit service to over half a million people. The service
Title VI Service Equity Analysis
 Pierce Transit Title VI Service Equity Analysis Pursuant to FTA Circular 4702.1B September 2013 Service Change February 2013 Page intentionally left blank PIERCE TRANSIT TITLE VI SERVICE EQUITY ANALYSIS
SAMTRANS TITLE VI STANDARDS AND POLICIES
 SAMTRANS TITLE VI STANDARDS AND POLICIES Adopted March 13, 2013 Federal Title VI requirements of the Civil Rights Act of 1964 were recently updated by the Federal Transit Administration (FTA) and now require
LOWER RIO GRANDE VALLEY DEVELOPMENT COUNCIL
 LOWER RIO GRANDE VALLEY DEVELOPMENT COUNCIL The Lower Rio Grande Valley Development Council (LRGVDC) is a political subdivision of Texas that Texas Transportation Code Chapter 458 authorizes, and therefore
Metropolitan Statistical Area (MSA) Exports to the World
 Exports to the World") Florida s 2015 Metropolitan Statistical Area (MSA) Exports to the World PREPARED BY: Enterprise Florida, Inc. International Trade & Development 201 Alhambra Circle, Suite 610 T: (305) 808-3660 Coral Gables,
Florida s 2015 Metropolitan Statistical Area (MSA) Exports to the World PREPARED BY: Enterprise Florida, Inc. International Trade & Development 201 Alhambra Circle, Suite 610 T: (305) 808-3660 Coral Gables,
Community Transit Solutions for the Suburbs CTAA Expo June 2014
 Community Transit Solutions for the Suburbs CTAA Expo June 2014 New Suburban Challenges Lower density development patterns Where is the funding to compete with urban and suburban commuter needs? Increased
SARASOTA COUNTY GOVERNMENT CITIZENS ADVISORY COMMITTEE FOR PUBLIC TRANSPORTATION MINUTES Thursday, October 19, 2017 Gulf Gate Library Meeting Room A
 Gulf Gate Library Meeting Room A Committee Members Present Dorothy Hudson, Chair Scott Whiterell Ronald Collins Raquel Cummings SCAT Personnel Present Rob Lewis, Interim Director Kendra Keiderling, Marketing,
EL PASO COUNTY REGIONAL TRANSIT INSTITUTIONAL OPTIONS ASSESSMENT STUDY
 EL PASO COUNTY REGIONAL TRANSIT INSTITUTIONAL OPTIONS ASSESSMENT STUDY Sponsored by: El Paso County Funding Support: Texas Department of Transportation Technical Assistance to the County: Texas A&M Transportation
2017 TBARTA Future Regional Priority Projects Adopted by TBARTA Board, December 9, 2016
 2017 TBARTA Future Regional Priority Projects Adopted by TBARTA Board, December 9, 2016 Project numbers do not signify ranking they are for mapping identification purposes only. 1. 15th Street East The
ARLINGTON COUNTY, VIRGINIA. County Board Agenda Item Meeting of February 22, 2014
 ARLINGTON COUNTY, VIRGINIA County Board Agenda Item Meeting of February 22, 2014 DATE: January 23, 2014 SUBJECT: Request to authorize advertisement of a public hearing to consider an ordinance amending
Existing Services, Ridership, and Standards Report. June 2018
 Existing Services, Ridership, and Standards Report June 2018 Prepared for: Prepared by: Contents Overview of Existing Conditions... 1 Fixed Route Service... 1 Mobility Bus... 34 Market Analysis... 41 Identification/Description
Transit Performance Report FY (JUNE 30, 2007)
") Transit Performance Report FY 2006-2007 (JUNE 30, 2007) J ANUARY 2008 TRANSIT PERFORMANCE REPORT FY 2006 2007 (JUNE 30, 2007) Transit Performance Report I SSUED: JANUARY 2008 The Transit Performance Report
Transit Performance Report FY 2006-2007 (JUNE 30, 2007) J ANUARY 2008 TRANSIT PERFORMANCE REPORT FY 2006 2007 (JUNE 30, 2007) Transit Performance Report I SSUED: JANUARY 2008 The Transit Performance Report
FY Transit Needs Assessment. Ventura County Transportation Commission
 FY 18-19 Transit Needs Assessment Ventura County Transportation Commission Contents List of Figures and Appendices.. 2 Appendices... 1 Chapter 1: Introduction What is the Ventura County Transportation
RACINE COUNTY PUBLIC TRANSIT PLAN:
 RACINE COUNTY PUBLIC TRANSIT PLAN: 2013-2017 Recommended Transit Service Improvement Plan NEWSLETTER 3 SEPTEMBER 2013 This newsletter describes the final recommended public transit plan for the City of
PERFORMANCE REPORT NOVEMBER 2017
 PERFORMANCE REPORT NOVEMBER 2017 Note: New FY2018 Goal/Target/Min or Max incorporated in the Fixed Route and Connection Dashboards. Keith A. Clinkscale Performance Manager INTRODUCTION/BACKGROUND In June
TTI REVIEW OF FARE POLICY: PRELIMINARY FINDINGS
 TTI REVIEW OF FARE POLICY: PRELIMINARY FINDINGS December 2014 STATUS: TTI REVIEW OF FARE POLICY Goal: Identify and evaluate different options for a revised fare structure, including pricing strategies
Quarterly Report Transit Bureau, Local Transit Operations. First Quarter, Fiscal Year 2015 (July 2014 September 2014) ART & STAR
 ART & STAR") Quarterly Report Transit Bureau, Local Transit Operations First Quarter, Fiscal Year 2015 (July 2014 September 2014) ART & STAR A Arlington Transit ART 1) Introduction The purpose of ART is to provide
Quarterly Report Transit Bureau, Local Transit Operations First Quarter, Fiscal Year 2015 (July 2014 September 2014) ART & STAR A Arlington Transit ART 1) Introduction The purpose of ART is to provide
2.0 Miami-Dade Transit System Overview
 2.0 Miami-Dade Transit System Overview Miami-Dade Transit operates the 14 th largest transit system in the United States and is the largest transit system in the State of Florida. MDT is one of the largest
Schedule ROUTE. All Week. Broward County Transit
 For more details on our fares please visit our web site at Broward.org/BCT or call customer service: 954.357.8400. Reading A Timetable - It s Easy 1. The map shows the exact bus route. 2. Major route intersections
Schedule ROUTE. All Week. Broward County Transit
 For more details on our fares please visit our web site at Broward.org/BCT or call customer service: 954.357.8400. Reading A Timetable - It s Easy 1. The map shows the exact bus route. 2. Major route intersections
ATTACHMENT A.7. Transit Division Performance Measurements Report Fiscal Year Fourth Quarter
 TTCHMENT.7 Transit Division Performance Measurements Report Fiscal Year 2012-13 Fourth Quarter Introduction The Orange County Transportation uthority (OCT) operates a countywide network of local, community,
PUBLIC TRANSIT IN KENOSHA, RACINE, AND MILWAUKEE COUNTIES
 PUBLIC TRANSIT IN KENOSHA, RACINE, AND MILWAUKEE COUNTIES #118404v1 Regional Transit Authority June 19, 2006 1 Presentation Overview Existing Public Transit Transit System Peer Comparison Recent Transit
Domestic Migration Patterns
 Planning Services Division October 2004 Number 27 Domestic Migration Patterns Between 2000 and 2003, 259,000 people moved into Broward from other counties in the United States while 233,000 moved away,
STEP ALTERNATIVES RANKING TABLE
 ALTERNATIVES RANKING TABLE Priority Ranking 0 = Lowest Priority 1 2 3 4 5 = Highest Priority Abbreviations TD = Transportation Disadvantaged PWD = People with Disabilities I. Existing Enhancements Increase
Performance Measurement:
 Regional Transportation Authority Performance Measurement: Peer Reporting Transport Chicago June 7, 2013 1 RTA Performance Measurement Program 2008 RTA Act amendment Purpose: Transparency & accountability
Schedule ROUTE. All Week. Broward County Transit
 For more details on our fares please visit our web site at Broward.org/BCT or call customer service: 954.357.8400. Reading a Timetable - It s Easy 1. The map shows the exact bus route. 2. Major route intersections
Ozaukee County Transit Development Plan
 Ozaukee County Transit Development Plan Record of Public Comments and Recommended Transit Service Plan June 5, 2018 Kevin Muhs Deputy Director #242846 Status of the Transit Development Plan Existing Conditions
Minutes of the Third Meeting THE WASHINGTON COUNTY TRANSIT DEVELOPMENT PLAN ADVISORY COMMITTEE
 Minutes of the Third Meeting THE WASHINGTON COUNTY TRANSIT DEVELOPMENT PLAN ADVISORY COMMITTEE Date: May 8, 2013 Time: 9:30 a.m. Place: Conference Room 249 Washington Highway Department 900 Lang Street
Sound Transit Operations August 2015 Service Performance Report. Ridership
 Ridership Total Boardings by Mode Mode Aug-14 Aug-15 % YTD-14 YTD-15 % ST Express 1,534,241 1,553,492 1.3% 11,742,839 12,354,957 5.2% Sounder 275,403 326,015 18.4% 2,139,086 2,463,422 15.2% Tacoma Link
Matt Miller, Planning Manager Margaret Heath-Schoep, Paratransit & Special Projects Manager
 DATE May 2, 218 Item #12 TO FROM GCTD Board of Directors Matt Miller, Planning Manager Margaret Heath-Schoep, Paratransit & Special Projects Manager MS SUBJECT I. EXECUTIVE SUMMARY This quarterly report
Board Box. February Item # Item Staff Page 1. Key Performance Indicators M. Thompson Financial Report for Dec H.
 Board Box February 2016 Item # Item Staff Page 1. Key Performance Indicators M. Thompson 2-8 2. Financial Report for Dec. 2015 H. Rodriguez 9-13 ITEM 1 February 15, 2016 TO: FROM: RE: BOARD OF DIRECTORS
Pinellas Suncoast Transit Authority Community Bus Plan
 Pinellas Suncoast Transit Authority Community Bus Plan FINAL REPORT JANUARY 2014 Prepared by: TABLE OF CONTENTS Executive Summary... 2 Community Bus Plan Introduction... 22 Previous Studies... 25 Market
1 DEMAND RESPONSE OVERVIEW
 1 DEMAND RESPONSE OVERVIEW Forty-nine transit agencies in Ohio operate demand response service, not including demand response services operated as part of the transit service provided in conjunction with
Factors that Affect Fixed-Route Ridership Frequency Connections and accessibility Travel time Travel cost Service area coverage Reliability
 The transit industry defines ridership as the number of passengers who board public transportation vehicles called unlinked passenger trips. Ridership measures transit utilization at the system, route,
REVIEW OF SUN METRO LIFT SERVICES
 REVIEW OF SUN METRO LIFT SERVICES Prepared for Review by Linda Cherrington, Research Scientist Suzie Edrington, Associate Research Scientist Zachary Elgart, Associate Transportation Researcher Shuman Tan,
SARASOTA COUNTY GOVERNMENT CITIZENS ADVISORY COMMITTEE FOR PUBLIC TRANSPORTATION MINUTES THURSDAY, January 8, 2015
 Administration Center Training Room 1 st Floor Committee Members Present Dorothy Hudson, Chair Frederic Bigio, Vice Chair Scott Whiterell Steve Bruegger Ronald Collins SCAT Personnel Present Rocky Burke,
Sarasota County Area Transit Express Bus and North Port Park and Ride
 Sarasota County Area Transit Express Bus and North Port Park and Ride City of North Port Commission and Sarasota County Commissioners Joint Meeting March 20, 2010 SCAT Update for North Port Park and Ride
About This Report GAUGE INDICATOR. Red. Orange. Green. Gold
 ATTACHMENT A About This Report The Orange County Transportation Authority (OCTA) operates a countywide network of local, community, rail connector, and express bus routes serving over 6, bus stops. OCTA
4 YORK REGION TRANSIT DON MILLS SUBWAY STATION ACCESS AGREEMENT
 4 YORK REGION TRANSIT DON MILLS SUBWAY STATION ACCESS AGREEMENT The Transit Committee recommends the adoption of the recommendations contained in the following report, September 20, 2007, from the General
Schedule ROUTE. All Week. Broward County Transit
 For more details on our fares please visit our web site at Broward.org/BCTor call customer service: 954.357.8400. Reading a Timetable - It s Easy 1. The map shows the exact bus route. 2. Major route intersections
Report by Finance Committee (B) Washington Metropolitan Area Transit Authority Board Action/Information Summary
 Washington Metropolitan Area Transit Authority Board Action/Information Summary") Report by Finance Committee (B) 07-28-2016 Washington Metropolitan Area Transit Authority Board Action/Information Summary Action Information MEAD Number: 201753 Resolution: Yes No TITLE: National Harbor
Report by Finance Committee (B) 07-28-2016 Washington Metropolitan Area Transit Authority Board Action/Information Summary Action Information MEAD Number: 201753 Resolution: Yes No TITLE: National Harbor
Schedule Effective 11/18/12
 For more details on our fares please visit our web site at Broward.org/BCT or call customer service: 954.357.8400. Reading a Timetable - It s Easy 1. The map shows the exact bus route. 2. Major route intersections
DRT Performance Measurement: the U.S. Experience
 DRT Performance Measurement: the U.S. Experience FOR ANYBODY GOING ANYWHER IN LA HABRA International Conference on Demand Responsive Transportation Breckenridge, Colorado September 2016 DRT Performance
FY Year End Performance Report
 Overall Ridership Big Blue Bus carried 18,748,869 passengers in FY2014-2015, a 0.3% reduction from the year prior. This negligible reduction in ridership represents the beginnings of a reversal from a
Sound Transit Operations January 2014 Service Performance Report. Ridership
 Ridership Total Boardings by Mode Mode Jan-13 Jan-14 % YTD-13 YTD-14 % ST Express 1,343,290 1,426,928 6.2% 1,343,290 1,426,928 6.2% Sounder 245,135 256,775 4.7% 245,135 256,775 4.7% Tacoma Link 86,229
TIMETABLE ROUTE. Customer Service. Holiday Bus Service. Effective10/31/10. Fares. Fare Deals. 10 Ride Pass: 10 Rides any time, any day.
 TIMETABLE ROUTE 60 Monday - Sunday Effective10/31/10 Broward Central Terminal to Highway 441 and N. W. 15 Street via Andrews Avenue and Martin Luther King Jr. Boulevard/ Coconut Creek Parkway A service
MONTHLY REPORT SEPTEMBER 2017
 MONTHLY REPORT 2017 SUN SHUTTLE RIDERSHIP ROUTE PASSENGERS: CURRENT YEAR PRIOR YEAR AMOUNT PERCENTAGE BUDGET AMOUNT PERCENTAGE TOTAL PASSENGERS 17,250 20,318 (3,068) -15.1% 18,231 (981) -5.4% CALENDAR
Establishes a fare structure for Tacoma Link light rail, to be implemented in September 2014.
 RESOLUTION NO. R2013-24 Establish a Fare Structure and Fare Level for Tacoma Link MEETING: DATE: TYPE OF ACTION: STAFF CONTACT: PHONE: Board 09/26/2013 Final Action Ric Ilgenfritz, Executive Director,
Mobile Farebox Repair Program: Setting Standards & Maximizing Regained Revenue
 Mobile Farebox Repair Program: Setting Standards & Maximizing Regained Revenue Michael J. Walk, Chief Performance Officer Larry Jackson, Directory of Treasury Maryland Transit Administration March 2012
WESTERN EL DORADO COUNTY SHORT AND LONG-RANGE TRANSIT PLAN Executive Summary
 WESTERN EL DORADO COUNTY SHORT AND LONG-RANGE TRANSIT PLAN Executive Summary Prepared for the El Dorado County Transportation Commission Prepared by The El Dorado County Transportation Commission (EDCTC)
Schedule ROUTE. All Week. Broward County Transit
 For more details on our fares please visit our web site at Broward.org/BCT or call customer service: 954.357.8400. Reading a Timetable - It s Easy. The map shows the exact bus route. 2. Time points are
Service Recommendation Plan. June 2018
 Service Recommendation Plan June 2018 Prepared for: Prepared by: Contents Introduction... 1 Cost Constrained Scenario... 1 Mankato Service... 4 University Service... 5 North Mankato Service... 6 Mobility
TABLE OF CONTENTS PREFACE & CONTACTS DEMOGRAPHICS TRAVEL BEHAVIOR CHARACTERISTICS MODAL STATISTICS TOURISM TRANSPORTATION FINANCING
 TABLE OF CONTENTS PREFACE & CONTACTS DEMOGRAPHICS TRAVEL BEHAVIOR CHARACTERISTICS MODAL STATISTICS TOURISM TRANSPORTATION FINANCING TRANSPORTATION EDUCATION & RESEARCH DIRECTORY MISCELLANEOUS INDEX on
8 CROSS-BOUNDARY AGREEMENT WITH BRAMPTON TRANSIT
 8 CROSS-BOUNDARY AGREEMENT WITH BRAMPTON TRANSIT The Transportation Services Committee recommends the adoption of the recommendations contained in the following report dated May 27, 2010, from the Commissioner
MONTHLY REPORT JUNE 2017
 & MONTHLY REPORT JUNE 2017 SECTION Sun Tran & Sun Van Monthly Operations Report Table of Contents June 2017 PAGE I.System Highlights and Accomplishments 3-10 II.Sun Tran a.ridership 11 b.revenue 12 c.pass
Fiscal Management and Control Board. Fare Policy October 16, Draft for Discussion & Policy Purposes Only
 Fiscal Management and Control Board Fare Policy October 16, 2015 1 Components of Fares Fare Level Different types of pricing by: By mode By time of day By distance By rider type (reduced fare) Subscription
USL POLICIES AND HOTEL RESERVATIONS RULES - "NO STAY-NO PLAY" RULE
 2017 SYL FINALS USL POLICIES AND HOTEL RESERVATIONS RULES - "NO STAY-NO PLAY" RULE 1. Our "STAY TO PLAY" policy applies to all teams that participate in the SYL finals. It requires hotel reservations to
COLT RECOMMENDED BUSINESS PLAN
 COLT RECOMMENDED BUSINESS PLAN 2008 INTRODUCTION The past decade has been one of change in Lebanon County and this situation is expected to continue in the future. This has included growth in population,
New System. New Routes. New Way. May 20, 2014
 Route Optimization I N I T I A T I V E New System. New Routes. New Way. May 20, 2014 1 Welcome Blueprint for Transportation Excellence (BTE) 20 year strategic plan Blueprint 2020 JTA s five-year plan for
Schedule ROUTE. All Week. Broward County Transit
 For more details on our fares please visit our web site at Broward.org/BCT or call customer service: 954.357.8400. Reading A Timetable - It s Easy 1. The map shows the exact bus route. 2. Major route intersections
Sound Transit Operations June 2016 Service Performance Report. Ridership
 Ridership Total Boardings by Mode Mode Jun-15 Jun-16 % YTD-15 YTD-16 % ST Express 1,622,222 1,617,420-0.3% 9,159,934 9,228,211 0.7% Sounder 323,747 361,919 11.8% 1,843,914 2,099,824 13.9% Tacoma Link 75,396
Regional Fare Change Overview. Nick Eull Senior Manager of Revenue Operations Metro Transit
 Regional Fare Change Overview Nick Eull Senior Manager of Revenue Operations Metro Transit Committee of the Whole April 5 th, 2017 Today s Presentation Fare change goals and considerations Public engagement
DISTRICT EXPRESS LANES ANNUAL REPORT FISCAL YEAR 2017 JULY 1, 2016 JUNE 30, FloridaExpressLanes.com
 DISTRICT EXPRESS LANES ANNUAL REPORT FISCAL YEAR 2017 JULY 1, 2016 JUNE 30, 2017 FloridaExpressLanes.com This page intentionally left blank. TABLE OF CONTENTS List of Figures... ii List of Tables.... ii
KANE PLAZA OFFICE TOWER. Main St at School Ave, Sarasota, FL 34237
 PROPERTY OVERVIEW IAN BLACK REAL ESTATE has been retained as the exclusive agent for the management and leasing of KANE PLAZA, located in Downtown Sarasota at the roundabout at Main Street and 1 S School
CHAPTER 5: Operations Plan
 CHAPTER 5: Operations Plan Report Prepared by: Contents 5 OPERATIONS PLAN... 5-1 5.1 Proposed Service Changes... 5-2 5.1.1 Fiscal Year 2017... 5-2 5.1.2 Fiscal Year 2018... 5-6 5.1.3 Fiscal Year 2019...
AGENDA REQUEST. AGENDA ITEM NO: XII.A.2. BY Financial Administration John Lege Financial Administration Deputy Director Strickland
 AGENDA HEADING: Legislative Public Hearings AGENDA REQUEST COMMISSION MEETING DATE: September 8, 2015 AGENDA ITEM NO: XII.A.2. BY Financial Administration John Lege Financial Administration Deputy Director
DOES BEACH NOURISHMENT PROTECT PROPERTY VALUES FROM HURRICANES? THE CASE OF THE 2004 AND 2005 HURRICANES
 DOES BEACH NOURISHMENT PROTECT PROPERTY VALUES FROM HURRICANES? THE CASE OF THE 2004 AND 2005 HURRICANES James Murley, Director, Center for Urban and Environmental Solutions (CUES), FAU Dr. Lenore Alpert,
Annual Route Report Operating Data. Prepared for: Board of Directors. Final 4/26/2018
 Annual Route Report 2017 Operating Data Prepared for: Board of Directors Final 4/26/2018 Upon request, alternative formats of this document will be produced for people with disabilities. Please call 325-6094
General Issues Committee Item Transit Operating Budget Ten Year Local Transit Strategy
 General Issues Committee Item 4.1 2017 Transit Operating Budget Ten Year Local Transit Strategy January 27, 2017 Presentation Outline 2017 Operating Budget Overview Ten Year Local Transit Strategy 2 2017
Schedule ROUTE. All Week. Broward County Transit
 For more details on our fares please visit our web site at Broward.org/BCT or call customer service: 954.357.8400. Reading A Timetable - It s Easy 1. The map shows the exact bus route. 2. Major route intersections
TRANSPORTATION SERVICE Actual
 PERFORMANCE REPORT-THIRD QUARTER VISION TO DELIVER REGIONAL MULTI-MODAL TRANSPORTATION SERVICES AND INFRASTRUCTURE IMPROVEMENTS THAT SIGNIFICANTLY AND CONTINUALLY INCREASE TRANSIT MARKET SHARE. MISSION
ATTACHMENT G STATE OF FLORIDA DEPARTMENT OF FINANCIAL SERVICES DIVISION OF TREASURY DFS TR RFP CONSOLIDATED REVOLVING ACCOUNT SYSTEM SERVICES
 ATTACHMENT G STATE OF FLORIDA DEPARTMENT OF FINANCIAL SERVICES DIVISION OF TREASURY DFS TR RFP 1718-01 CONSOLIDATED REVOLVING ACCOUNT SYSTEM SERVICES AGENCY STREET ADDRESS CITY/STATE/ZIP RESPONDENT'S BANK
Circuit 1, 17, and 20
 Florida Network of Youth and Family Services Programs by Circuit Circuit 1, 17, and 20 Lutheran Services Florida Shelters: Currie House Circuit 1 4610 West Fairfield Drive Pensacola, Florida 32506 850-453-2772
Maryland Department of Transportation The Secretary's Office
 December 13, 2013 Maryland Department of Transportation The Secretary's Office Martin O'Malley Govemor Anthony G. Brown Lt. Govemor James T. Smith, Jr. Secretary The Honorable Edward J. Kasemeyer Chair,
Demand-Responsive Transportation in the TCQSM
 Demand-Responsive Transportation in the TCQSM Buffy Ellis KFH Group, Inc. Presentation Overview Brief introduction to the project DRT in the TCQSM, 1st Edition DRT in the TCQSM, 2nd Edition Key Issues
Schedule Effective 4/23/17
 Real Time Bus Information MyRide.Broward.org Broward County Transit ROUTE30 All Week Schedule Effective 4/23/17 West Regional Terminal to Broward Central Terminal via Peters Road/Davie Boulevard 954-357-8400
Why we re here: For educational purposes only
 Transportation 2050 Why we re here: For educational purposes only Transportation 2050 Bus Elements PUBLIC TRANSIT DEPARTMENT City of Phoenix Citizens Committee on the Future of Phoenix Transportation (CCFPT)
Albany Area Metropolitan Planning Organization RTP Project Management Team
 DRAFT MEMORANDUM #5 DATE: September 1, 2015 TO: FROM: Albany Area Metropolitan Planning Organization RTP Project Management Team Scott Chapman Nelson\Nygaard Paul Leitman Nelson\Nygaard SUBJECT: Albany
MONTHLY REPORT SEPTEMBER 2017
 & MONTHLY REPORT SEPTEMBER 2017 SECTION Sun Tran & Sun Van Monthly Operations Report Table of Contents September 2017 PAGE I.System Highlights and Accomplishments 3-10 II.Sun Tran a.ridership 11 b.revenue