2010 ANNUAL REPORT TO THE LEGISLATURE
|
|
|
- Emil Goodwin
- 5 years ago
- Views:
Transcription


1 This document is made available electronically by the Minnesota Legislative Reference Library as part of an ongoing digital archiving project ANNUAL REPORT TO THE LEGISLATURE PREPARED BY THE METROPOLITAN AIRPORTS COMMISSION AVIATION NOISE AND SATELLITE PROGRAMS OFFICE MARCH 2011
2 TABLE OF CONTENTS 1 INTRODUCTION OVERVIEW METROPOLITAN AIRPORTS COMMISSION STRATEGIC PLAN MINNEAPOLIS-ST. PAUL INTERNATIONAL AIRPORT (MSP) OVERVIEW MSP AIRPORT FACILITIES Airfield Terminal 1 - Lindbergh Terminal 2 - Humphrey Terminal Way-Finding Signage Light Rail and Bus Transit MSP Long Term Comprehensive Plan Update MSP 2020 Environmental Assessment AIRPORT ACTIVITY AND SERVICE TRENDS Passenger Originations/Destinations and Connections Annual Revenue Passengers Annual Aircraft Operations Non-stop Markets COMPARISON OF MSP FORECASTED ACTIVITY WITH ACTUAL ACTIVITY AIRPORT CAPACITY AND DELAY Airfield Capacity Airfield Delay TECHNOLOGICAL / CAPACITY ENHANCEMENTS Precision Instrument Approaches STEWARDS OF TOMORROW'S AIRPORT RESOURCES (STAR) PROGRAM RELIEVER AIRPORTS OVERVIEW DESCRIPTION OF RELIEVER AIRPORT FACILITIES Airlake Airport (LVN) Anoka County-Blaine Airport (ANE) Crystal Airport (MIC) Flying Cloud Airport (FCM) Lake Elmo Airport (21D) St. Paul Downtown Airport (STP) HISTORIC AND FORECAST ACTIVITY LEVELS DEVELOPMENT PROGRAMS Airlake Airport (LVN) Anoka County-Blaine Airport (ANE) Crystal Airport (MIC) Flying Cloud Airport (FCM) Lake Elmo Airport (21D) St. Paul Downtown Airport (STP)
3 LIST OF TABLES Table 2.1: Existing Airport Facilities... 7 Table 2.2: Non-stop Markets by Metropolitan Area Table 2.3: Comparison of Capacity and Delay Table 2.4: Top 15 Large Hub Airports with Highest Average Total Delay per Operation Table 2.5: Precision Instrument Approaches Table 3.1: Historical View of Based Aircraft at MAC Reliever Airports Table 3.2: Historical View of Operations at MAC Reliever Airports Table 3.3: Summary of Based Aircraft Forecast at MAC Reliever Airports Table 3.4: Summary of Forecast Operations at MAC Reliever Airports LIST OF FIGURES Figure 2-1: Minneapolis-St. Paul International Airport Layout Figure 1-1: MAC Airports in the Seven-County Metropolitan Area Figure 2-2: Terminal 1 - Lindbergh Figure 2-3: Terminal 2 - Humphrey Figure 2-4: Annual Domestic Passenger Origination/Destination Totals, Figure 2-5: Total Annual Revenue Passengers, Figure 2-6: Annual Aircraft Operations, Figure 2-7: Number of Non-stop Markets, Figure 2-8: Non-stop Markets by Type of Service, 2010 Figure 2-9: Population vs. Non-stop Service, 2010 Figure 2-10: Forecast vs. Actual 2010 Passenger Originations/Destinations, MSP Figure 2-11: Forecast vs. Actual 2010 Total Revenue Passengers, MSP Figure 2-12: Forecast vs. Actual 2010 Total Aircraft Operations, MSP Figure 2-13: MSP Flights Delayed by ATC Figure 2-14: On-time Gate Arrivals, MSP vs. National Average, Figure 2-15: MSP Average Delay Per Aircraft Operation, Figure 3-1: Airlake Airport Layout Figure 3-2: Anoka County-Blaine Airport Layout Figure 3-3: Crystal Airport Layout Figure 3-4: Flying Cloud Airport Layout Figure 3-5: Lake Elmo Airport Layout Figure 3-6: St. Paul Downtown Airport Layout 3
4 1. INTRODUCTION 1.0 OVERVIEW The Metropolitan Airports Commission (MAC) was created in 1943 by the Minnesota Legislature to promote air transportation in the seven-county metropolitan area. The MAC s 15-member board of commissioners consists of 13 appointments by Minnesota's Governor and one appointment each by the mayors of Minneapolis and St. Paul to set the MAC s policies. Those policies are implemented by the MAC's executive director and staff. The MAC airport system is comprised of seven airports: Minneapolis-St. Paul International and six reliever airports. The reliever airports include Airlake, Anoka County-Blaine, Crystal, Flying Cloud, Lake Elmo and St. Paul Downtown. Figure 1-1 shows each MAC airport location. In 1989, the Minnesota Legislature adopted the Metropolitan Airport Planning Act. This legislation required the MAC and the Metropolitan Council (MC) to complete a comprehensive and coordinated program to plan for major airport development in the Twin Cities. The planning activities were designed to compare the option of expanding Minneapolis-St. Paul International Airport (MSP) at its current site with the option of building a new airport elsewhere. The analysis was completed in 1996, and the MAC and the MC formally submitted their recommendations to the Legislature on March 18, On April 2, 1996, legislation was passed by both the House and Senate; Governor Arne Carlson signed it, terminating further study of a new airport and directing the MAC to implement the MSP 2010 Long Term Comprehensive Plan. This same legislation requires the MAC to prepare an annual report to the Legislature that describes recent MSP airport activity, current and anticipated capacity and delay for the airfield and terminals, and technological developments that could improve airport efficiency. In 2006, the 1996 legislation was amended to require the MAC to include an update on the six reliever airports in the annual report and to submit the report to the Legislature by March 30 each year. The 2010 Annual Report to the Legislature is divided into three main sections: 1. Introduction 2. Minneapolis-St. Paul International Airport 3. Reliever Airports The main sections are further subdivided into sub-sections pertinent to the various facilities. 4


5 2010 ANNUAL REPORT TO THE LEGISLATURE Figure 1-1: MAC Airports in the Seven-County Metropolitan Area *2008 O&D passengers estimated from first two quarters of Sources: U.S. DOT; HNTB analysis.
6 1.1 THE METROPOLITAN AIRPORTS COMMISSION STRATEGIC PLAN The Metropolitan Airports Commission s (MAC) core mission is to provide and promote safe, convenient, environmentally-sound and cost-competitive aviation services for its customers. This mission and the MAC s organizational vision and goals for MSP and the reliever airports are outlined in the Strategic Plan (Plan). The MAC s vision statement and commitment is To give our customers the best airport experience in North America. To that end, several key initiatives included in the Plan focus on customer service enhancements. Key initiatives for 2010 included: 1. Expansion of airport-wide customer service partnership program 2. Benchmarking top airport competition 3. Installation of new highway and terminal way-finding signage 4. Opening a new Terminal 2-Humphrey Skyway 5. Increasing MSP s Accessibility Index 6. Promoting MSP to international and domestic airlines 7. Implementation strategy for incorporating social media and mobile communications into customer communications 8. Development of a central Web portal for tenant communications, forms, processinstructions, feedback, and Q&A 9. Implementation of provisions of the 60 DNL Noise Program 10. Pursuance of new MSP and Reliever Airports revenue opportunities 11. Complete implementation and integration of EnterpriseOne and GIS elements 5
7 2. MINNEAPOLIS-ST. PAUL INTERNATIONAL AIRPORT (MSP) 2.0 OVERVIEW Minneapolis-St. Paul International Airport (MSP) is the primary commercial service airport in Minnesota. Owned and operated by the Metropolitan Airports Commission (MAC), its funding stems from self-generated revenues from airport users, aviation grants, bonds, and passenger facility charges. MSP does not receive an appropriation from the State s local property taxes. Aircraft operations and passenger activity associated with MSP contribute to the Twin Cities economy by generating or supporting 153,000 associated jobs, $10.7 billion in business revenue and $1.4 billion in local purchases. 1 The next sections of this report highlight facilities, activities and resource management at MSP as follows: A description of MSP facilities A description of MSP activity and service trends A comparison of MSP forecasted activity with actual activity Current airfield capacity and average length of delay statistics Technological developments affecting aviation and their effects on airport operations and capacity Environmental resource management 2.1 MSP AIRPORT FACILITIES Airfield The MSP airfield is approximately 3,400 acres in size and consists of two parallel runways, one north-south runway and one crosswind runway. Runway 4-22 is 11,006 feet long (with environmental approvals for an extension to 12,000 feet); Runway 12R- 30L is 10,000 feet long; Runway 12L-30R is 8,200 feet long; and Runway is 8,000 feet long. Figure 2-1 shows MSP s current general airport layout, and Table 2.1 summarizes the major airport components. Deicing pads are located at the end of each parallel runway. Runway has a seven-position deicing pad only at its north end to accommodate departures to the south because current operating restrictions normally preclude departures to the north over Minneapolis. All the deicing pads have facilities nearby for recharging deicing trucks and for providing a rest area for deicing crews. A combined operations and maintenance facility adjacent to the 12L deicing pad serves to coordinate deicing operations on all pads. 1 According to the Local and Regional Economic Impacts of the Minneapolis/St. Paul International Airport, conducted by John C. Martin Associates LLC. and completed in March


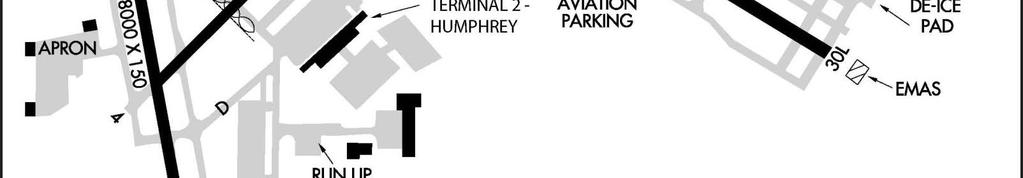
8 2010 ANNUAL REPORT TO THE LEGISLATURE Figure 2-1: Minneapolis-St. Paul International Airport Layout
9 There are two cargo aprons (50 acres total) located at MSP: Infield Cargo Apron and West Cargo Apron. The Infield Cargo Apron is situated between Runway 12R-30L and Runway and supports a FedEx cargo sort facility and a UPS facility. The West Cargo Apron accommodates a multi-tenant cargo facility, and three aircraft maintenance hangars are located on an apron on the western edge of the airfield. Table 2.1 EXISTING AIRPORT FACILITIES Airport Components Quantity RUNWAYS East-West Parallel (Runways 12L-30R and 12R-30L) 2 North-South (Runway 17-35) 1 Crosswind (Runway 4-22) 1 Total Runways 4 Other Runway Information: Longest Runway (Runway 4-22) 11,006 ft. (1) TERMINAL BUILDING FACILITIES Terminal 1-Lindbergh million sq. ft. 2.8 Terminal 2-Humphrey million sq. ft..4 Total Terminal Square Footage (millions) 3.2 Terminal 1-Lindbergh Gates 117 Terminal 2-Humphrey Gates 10 Total Gates 127 PUBLIC AUTO PARKING Terminal 1-Lindbergh 14,400 Terminal 2-Humphrey 9,200 Total Public Auto Parking Spaces 23,600 Note: (1) Runway 4-22 is the longest runway (11,006 ft.) and has environmental approval to be extended to 12,000 feet. Source: Metropolitan Airports Commission Airport Development. 7
10 2.1.2 Terminal 1-Lindbergh Terminal 1-Lindbergh is the largest terminal at MSP. It was originally built in 1962 and named the Charles A. Lindbergh Terminal in During 2010, changes were made to roadway signage that now refer to this terminal as Terminal 1 and list the individual air carrier service providers that serve the terminal. For more information regarding this change, please refer to Section of this document. Terminal 1-Lindbergh is located between the north parallel runway (12L) and the south parallel runway (12R), east of Runway Figure 2-2 displays the terminal layout with single-loaded and double-loaded concourses, and 117 gate positions. Of those, 10 gates support international arrivals into the International Arrival Facility. A concourse tram and moving sidewalks assist passenger travel along Concourse C. Moving sidewalks also facilitate passenger movement on Concourses A, B and G, and through the skyway connector between Concourses C and G. Four parking ramps provide shortand long-term parking for passengers and space for rental cars. A tram assists passenger movements from the terminal to the two most distant parking ramps, light rail transit and auto rental facilities. In 2010, eparkelite was introduced to enhance the customer service experience for parking at MSP. eparkelite is a convenient option for frequent parking customers because the program offers a guaranteed parking space in any of MSP s public parking ramps. It uses a ZipPass unit placed on a vehicle s dashboard to allow convenient, automatic ramp entry and exit Terminal 2-Humphrey Terminal 2-Humphrey was opened in 1977 and named for Hubert H. Humphrey. A new terminal replaced the original terminal in The current terminal is located southwest of the parallel runways and consists of 10 gates currently used by Sun Country, AirTran, Icelandair, Southwest Airlines and charter companies. Changes in roadway signage that occurred in 2010 refer to the Humphrey Terminal as Terminal 2 and list the individual air carrier service providers that serve the terminal (see Section 2.1.4). The building layout of Terminal 2-Humphrey is depicted in Figure 2-3, and includes an International Arrival Facility, and public parking spaces for approximately 9,200 vehicles. The eparkelite service explained in the previous section also apply to the Terminal 2- Humphrey parking facility. In 2010, Terminal 2-Humphrey had its busiest year on record, accommodating more than 2.56 million total passengers and handling more than 26,000 aircraft operations. In December 2010 the MAC completed construction of the Orange Ramp Skyway, which provides an elevated, temperature-regulated connection between Terminal 2, the Orange parking ramp and the light rail station. Construction of the Orange Ramp 8
11 2010 ANNUAL REPORT TO THE LEGISLATURE Figure 2-2: 2: Terminal 1-Lindbergh
12 2010 ANNUAL REPORT TO THE LEGISLATURE Figure 2-3: Terminal 2-Humphrey
13 Skyway and associated Terminal 2-Humphrey expansion was completed in less than a year and included installation of 1,154 linear feet of moving walk, two elevators, and an escalator bank Terminal Way-Finding Signage MSP is the only major U.S. airport with passenger terminals located on two separate roadway systems. Between late March and mid-april 2010, new signs were installed along roadways and highways around MSP. The signs designate the terminals as Terminal 1 and Terminal 2 rather than Lindbergh and Humphrey, respectively. This new signage allowed, for the first time in MSP history, the names of the airlines located at each terminal to be listed on highway signs so passengers have the information they need to select the right highway exit and terminal for their airline. Since implementation of the new way-finding signage, complaints associated with terminal building location signage have been reduced. At the MAC and in the terminal buildings, the official names of the terminals retain the historic references in addition to the supplemental numerical designations as follows: Terminal 1-Lindbergh and Terminal 2-Humphrey Light Rail and Bus Transit The Metro Transit Hiawatha Line provides a light rail transit (LRT) option for MSP travelers and visitors commuting between terminals and off-airport locations from downtown Minneapolis to the Mall of America. The Terminal 1-Lindbergh Station at MSP is located below ground at the south end of the Terminal 1-Lindbergh parking complex, and the Terminal 2-Humphrey Station is located directly east of Terminal 2-Humphrey. No fare is required for travel between the two MSP LRT stations. A bus station at ground level above the Terminal 1-Lindbergh LRT station provides additional mass transit service and connectivity between the LRT and bus systems. Metro Transit estimates that approximately 3,400 boardings occurred per day in 2010 at the airport terminal stations, which remains consistent with the level of activity at those stations in MSP Long Term Comprehensive Plan Update In 2010, the MAC completed an update to the MSP Long Term Comprehensive Plan (LTCP). The previous plan was published in 1996 and included projects that dramatically improved airfield efficiency, particularly with the addition of Runway and associated infrastructure in The updated LTCP is necessary for planning purposes, and it reflects significant changes in the aviation industry and impacts of recent economic conditions on aviation. This plan identifies facility improvements for MSP out to the year 2030 based upon revised aircraft operations and passenger activity forecasts. 9
14 Several goals were established as part of the LTCP Update: 1. Provide sufficient, environmentally-friendly facilities to serve existing and future demand; 2. Provide improved energy efficiencies; 3. Encourage increased use of public transportation; 4. Minimize confusion associated with having two terminals and multiple access points; 5. Allow for flexibility in growth; 6. Utilize and maintain existing facilities to the fullest extent possible; and 7. Enhance aircraft operational safety and efficiency. Forecasts for the year 2030 indicate an increase in passenger boardings of more than 73 percent and aircraft operations of about 40 percent (see Figures 2-10 through 2-12). Based upon these forecasts, the LTCP Update primarily focuses on terminal and landside facilities that are inadequate for the increased passenger flow or have become outdated. Proposed modifications to the airfield in the updated LTCP address taxiway improvements intended to augment airfield circulation. There are no runway-related additions or improvements being proposed. The LTCP is divided into four 5-year phases with the following proposed projects: Phase I: Seventeen new gates at Terminal 2-Humphrey New explosive detection system at Terminal 2-Humphrey Terminal 2-Humphrey Auto Rental Facility Terminal 2-Humphrey parking expansion Terminal 2-Humphrey roadway system improvements Phase II: Curbside expansion at Terminal 1-Lindbergh Terminal 1-Lindbergh remodeling Expansion of Concourse G in Terminal 1-Lindbergh Terminal 1-Lindbergh parking expansion Phase III: Ten new gates at Terminal 2-Humphrey Terminal 2-Humphrey roadway access improvements Terminal 2-Humphrey Orange Ramp parking expansion Terminal 1-Lindbergh in/outbound roadway improvements Continued expansion of Concourse G at Terminal 1-Lindbergh MSP Hotel Delta overnight package express relocation Airline flight kitchen replacement 10
15 Phase IV: Crossover taxiway construction Terminal 1-Lindbergh parking expansion Loading dock facility relocation Post Office retail operation relocation Public review and comments on the LTCP Update were solicited in February The Metropolitan Council s approval was received in September 2010 and the MAC Commission approved the final document also in September The MAC also authorized staff to start the federal/state environmental review process for the projects proposed to be implemented by the year MSP 2020 Improvements Environmental Assessment In 2010, the MAC initiated an environmental assessment (EA) pertaining to Phase I and Phase II proposed projects to evaluate and disclose the potential environmental impacts of those development projects at MSP. The EA is being conducted in accordance with the requirements of the National Environmental Policy Act as well as the Minnesota Environmental Review Program. The proposed development (Proposed Action) to be evaluated in the EA is based on the findings of the airport s Long Term Comprehensive Plan (LTCP) Update. The Proposed Action as identified in the 2030 Long Term Comprehensive Plan Update for MSP includes terminal and landside improvements needed by the year As such, the Proposed Action consists of the following components: Improvements to Terminal 2-Humphrey: Construct approximately 17 new gates, including jet bridges, apron improvements, hydrant fueling, and site utility improvements Provide auto rental facilities (quick turnarounds) Expand parking Improve the roadway system, including the 34th Avenue/Interstate 494 interchange and MN State Highway 5/Post Road interchange if needed Improvements to Terminal 1-Lindbergh: Reconfigure Ground Level Green/Gold Parking Ramp to provide additional arrival curb Remodel the ticketing and baggage claim areas and Concourse E Relocate a number of Concourse G gates to Concourse E Extend Concourse G for a new, expanded international terminal/customs Border Protection (CBP) facility, including approximately 10 new gates, jet bridges, apron improvements, hydrant fueling, site utility improvements, and necessary support facilities Construct a new parking ramp east of the current Red-Blue Ramp 11
16 The EA will assess the environmental consequences of the Proposed Action and the reasonable alternatives. Impact categories will be analyzed according to the criteria included in Federal Aviation Administration (FAA) Orders E, Environmental Impacts: Policies and Procedures, and B National Environmental Policy Act Implementing Instructions for Airport Actions, and the Minnesota Environmental Assessment Worksheet (EAW). The impact analyses will be conducted for the five years after the Proposed Action is implemented, The EA analyses will likely focus on the environmental categories listed below: 1. Air Quality (Including Vehicle-related and Stationary Source Air Emissions) 2. Noise / Compatible Land Use 3. Vehicular Traffic 4. Water Quality (Including Physical Impacts on Water Resources) 5. Cumulative Impacts Currently, the MAC is in the early stages of developing the Draft EA. As the environmental analysis process moves forward the development plans will be refined, possibly resulting in revisions to the phases and implementation timeframes specified in the LTCP Update. According to the project schedule, the analysis for the Draft EA will be completed in late The Draft and Final EA will be circulated for agency and public review in early If, based on the Final EA, it is determined that the Proposed Action would not result in a significant impact, the FAA will issue a Finding of No Significant Impact (FONSI) and the MAC will issue a Record of Decision (ROD). Implementation of each of the components of the Proposed Action will be demanddriven and may begin as early as mid
17 2.2 AIRPORT ACTIVITY AND SERVICE TRENDS MSP is served by 12 commercial passenger airlines; eight are located at Terminal 1- Lindbergh and four are located at Terminal 2-Humphrey. This section highlights an overview of the airline and passenger activity, and aircraft operations trends in There were economic challenges that beleaguered the entire aviation industry during the past several years, including MSP. However, in 2010 the passenger levels at MSP rose, marking the end of a consecutive four-year decline. In 2010 a total of 32,839,441 passengers arrived and departed MSP, a 1.4 percent increase over the 2009 passenger level of 32,378,599. Passengers included in these totals are revenue and non-revenue passengers that utilized traditional major air carrier services, regional air carriers or charter companies. Total passengers at MSP peaked in 2005 with 37,663,664, which is approximately 13 percent higher than the 2010 level. Delta Air Lines is the largest air carrier service provider at MSP and operates out of Terminal 1-Lindbergh. The merger of Delta Air Lines with Northwest Airlines was completed on January 31, 2010 after first being announced in April Delta Air Lines and its regional partners currently operate 434 flights per day from MSP to more than 130 destinations worldwide. In 2010, flights were added to nine destinations, as follows: Buffalo NY, Bloomington IL, Birmingham AL, Lansing MI, Norfolk VA, Fort Dodge IA, Marquette MI, Providence RI, and Pierre SD. Sun Country Airlines is based at MSP and continues to grow its markets and expand its services from Terminal 2-Humphrey. In 2010, Sun Country operated approximately 25 flights per day and served more than 20 year-round and seasonal destinations. For the past five years, this MSP-based air carrier has consistently ranked within the top 10 domestic airlines in Travel+Leisure s World s Best Service Awards. In December 2010, Sun Country announced it will begin new daily service to Washington-Reagan National Airport through Lansing MI in April 2011, and announced it will begin twice-weekly service from MSP to London Gatwick Airport in May Southwest Airlines began service from MSP in March 2009 after nearly 20 years of recruitment efforts by the MAC. Southwest now operates approximately 17 roundtrip flights per day from two gates in Terminal 2-Humphrey and has expanded its daily service to four destinations: Chicago Midway, Denver, St. Louis, and (as of August 2010) Phoenix. Southwest Airlines reports that 2010 marked the airline s 38th consecutive year of profitability Passenger Originations/Destinations and Connections Figure 2-4 depicts the annual historical passenger originations/destinations (O&D) data for MSP for the years 1990 through O&D passengers are those who begin or end their trip at the airport. Connecting passengers are those who travel through the airport en route to another destination. 13

")
 ssengers (M O&D")

18 2010 ANNUAL REPORT TO THE LEGISLATURE MSP Figure 2-4: Annual Passenger Originations/Destinations (O&D) Totals illions) ssengers (M O&D Pa Source: U.S. DOT DB1B, Metropolitan Airports Commission 2010 Year End Statistics Report.
19 The following information details MSP O&D and connecting passenger data for 2010: There were 16,991,034 O&D passengers in 2010, which is nearly 2.1 percent higher than the 2009 O&D passenger level of 16,638, Between 1990 and 2010, O&D passengers at MSP rose from 9.5 million to nearly 17 million. This change represents an estimated annual compounded growth rate of 2.95 percent. O&D passenger demand is driven primarily by local socioeconomic factors. There were 7,219,542 connecting passengers at MSP in 2010, which is slightly lower than the connecting passenger level of 7,232,185 in Annual Revenue Passengers The revenue passenger level at MSP reported by the airlines in 2010 reached 31,734,714, nearly 1.5 percent higher than the previous year s level of 31,273,244. Revenue passengers in 2010 accounted for 96.6 percent of total passengers at MSP. When MSP revenue passengers and aircraft operations activity of traditional major air carriers is compared with the passengers and operations activity of regional air carriers over the past five years, there is a trend that indicates a shift toward increased use of regional-type aircraft (i.e., those with fewer than 100 seats). This shift was evident in 2010 with 20.9 percent more passengers traveling on regional air carriers than in 2009, while approximately 4.3 percent fewer passengers traveled on traditional air carriers 4. Further, the number of aircraft arrivals and departures flown in regional aircraft rose by 10.6 percent while operations flown by the traditional aircraft in 2010 decreased by nearly 9.4 percent from the year earlier. Total annual revenue passenger levels are shown in Figure 2-5 and include O&D and connecting passengers. Between 1990 and 2010, total annual revenue passengers grew from 19.2 million to 31.7 million, an annual compounded growth rate of 2.4 percent. Rising passenger levels in 2010 were not isolated to MSP. Overall, Airports Council International reports that the level of domestic passengers is up 5.2 percent and the level of international passengers is up 7.3 percent compared to Because of prior Detroit Metro Airport comparison requirements, the source used to obtain the data from was based on data reported by the U.S. DOT and HNTB analysis. The airport comparison is no longer required in this report; therefore, the 2009 and 2010 numbers were derived from Metropolitan Airports Commission year end reports, providing the most accurate MSP-specific statistics.. 3 Metropolitan Airport Commission 2010 Year End Statistics report. 4 Metropolitan Airport Commission 2010 Year End Statistics report. 5 Airport Council International (ACI) Traffic Statistics December


 0 Sources:")

20 2010 ANNUAL REPORT TO THE LEGISLATURE Figure 2-5: Total Annual Revenue Passengers MSP Revenue e Passengers s (Millions) 0 Sources: Metropolitan Airports Commission 2010 Year End Statistics Report.
21 2.2.3 Annual Aircraft Operations Total aircraft operations at MSP in 2010 were slightly higher than the levels reported in The total number of landings and takeoffs reported by the Federal Aviation Administration (FAA) in 2010 is 435,583, 1 percent higher than the 2009 operations level of 432,604. Total operations at MSP peaked in 2004 when the FAA reported 540,727 aircraft arrived at and departed from the airport. Annual MSP aircraft operations are presented in Figure 2-6. In 1990, MSP had 382,960 annual operations according to FAA Air Traffic Control Tower counts. Total annual operations at MSP generally increased through 2000 then declined as a result of the terrorist attacks on September 11, The year 2001 ended with 501,252 total operations at MSP, a 4 percent decline from the previous year. In 2002 and 2003 operations rose approximately 1.2 percent over the level in 2001, but then jumped up 6 percent in The years that followed 2004 were impacted by increasing fuel prices and an overall struggling economy, which was reflected in the fairly steady decline of aircraft operations at MSP between 2004 and During that timeframe operations dropped from 540,727 to 432,604; many airlines reduced their scheduled flights and thinned out their fleets to lower operating costs, and several airlines raised ticket prices and initiated fees for traditionally no-charge passenger services (e.g., baggage fees, ticket counter customer service, in-flight food and beverages, etc.) to generate additional revenue Non-stop Markets Figure 2-7 shows the number of non-stop domestic and international (including Canadian) markets served from MSP from 2004 through The domestic markets included in these totals are those that are served by an annual average of at least five weekly non-stop flights. The international markets include those that are served by an annual average of at least one weekly non-stop flight. Some of these markets are served only seasonally. Based on Official Airline Guide data, there were 135 non-stop markets served by MSP in domestic and 21 international that met the criteria mentioned above. This total is slightly greater than the 134 total non-stop markets served in Figure 2-8 summarizes the use of various types of aircraft that serve MSP s non-stop markets. In 2010, approximately 23.7 percent of the non-stop markets were served exclusively by traditional Air Carrier jet service compared with 22 percent in There is also an increase in the percentage of non-stop markets served by Regional air carrier aircraft from 14 percent in 2009 to 19.3 percent in Markets served by Turboprop and Mixed Regional & Turboprop aircraft accounted for 5.9 percent and 9.6 percent respectively in 2010 compared with 5 percent and 14 percent in The remaining 41.5 percent of MSP non-stop markets in 2010 were served by Mixed Air Carrier & Regional aircraft. 15
22 2010 ANNUAL REPORT TO THE LEGISLATURE Figure 2-6: Annual Aircraft Operations Aircraft Ope erations (Tho ousands) MSP 0.00 Sources: Metropolitan Airports Commission Year End Operations Report Updated 2/8/10 and FAA OpsNet.


23 2010 ANNUAL REPORT TO THE LEGISLATURE Figure 2-7: Number of Non-stop Markets Domestic International Sources: DataBase Products and BACK Aviation Solutions, Official Airline Guide, U.S. DOT T100 via InterVISTAS, and MAC Analysis

 Turboprop = Turboprop Aircraft (e.g.,sf34) Source: Official Airline Guide, InterVISTAS, and MAC Analysis")
24 2010 ANNUAL REPORT TO THE LEGISLATURE Figure 2-8: MSP Non-stop Markets by Aircraft Type 2010 Regional 19.3% 135 MSP Non-stop Markets Air Carrier Service 23.7% Turboprop 5.9% Mixed Regional and Turboprop 9.6% Mixed Air Carrier & Regional 41.5% Air Carrier= Air Carrier Jet Aircraft (e.g., A320) Regional= Air Carrier Regional Jet Aircraft (e.g., CRJ) Turboprop = Turboprop Aircraft (e.g.,sf34) Source: Official Airline Guide, InterVISTAS, and MAC Analysis
25 Table 2.2 and Figure 2-9 compare Minneapolis-St. Paul to other major metropolitan areas in terms of the number of non-stop markets served by each airport per population of the Metropolitan Statistical Area. Table 2.2 NON-STOP MARKETS BY METROPOLITAN AREA 2010 Rank Metropolitan Area Population (1) (Millions) Non-stop Markets (2)(3) Markets/Population (Millions) Ratio 1 New York Los Angeles Chicago Washington D.C - Baltimore Boston San Francisco - Oakland Dallas - Ft. Worth Philadelphia Houston Atlanta Miami - Fort Lauderdale Detroit Phoenix Seattle Minneapolis - St. Paul Denver San Diego St. Louis Cleveland Orlando Notes: (1) U.S. Census Bureau; Annual Estimates of Population of Metropolitan and Micropolitan Statistical Areas: April 1, July 1, 2009 (CBSA-EST ); Annual Estimates of the Population of Combined Statistical Areas: April 1, 2000 to July 1, 2009 (CBSA-EST ) (2) Metropolitan areas served by more than one airport are counted once. (3) Markets include those receiving an average of at least five weekly non-stop domestic flights or one weekly non-stop international flight during CY Sources: US Census Bureau, OAG CY2010, InterVISTAS and MAC analysis 16
26 2010 ANNUAL REPORT TO THE LEGISLATURE 250 Figure 2-9: Population vs. Non-stop Service 2010 Atlanta New York 200 Chicago Non-stop Markets Denver Houston Miami-Ft. Lauderdale Detroit MINNEAPOLIS- ST. PAUL Tampa- St. Petersburg Dallas-Ft. Worth Philadelphia Washington Phoenix San Francisco Seattle-Tacoma Boston Los Angeles 50 Cleveland San Diego St. Louis Population (Millions) Sources: US Census Bureau, OAG CY2010, InterVISTAS and MAC analysis
27 2.3 COMPARISON OF MAC FORECAST WITH ACTUAL ACTIVITY In 2010, the MAC updated the Long Term Comprehensive Plan (LTCP) for MSP. Revised forecasts were approved as part of that process and published in mid A critical element of the LTCP is to balance the long-term airfield, terminal, and landside facilities serving the airport. A re-appraisal of the forecasts was necessary given the merger of Delta Air Lines and Northwest Airlines and to assess the impacts of recent fuel price increases on the transportation industry as well as those of the recent economic recession. The revised forecast analyses contain the annual and derivative activity forecasts for the airport, and assume landside and airfield capacity will be available to accommodate the anticipated demand. Forecast data were developed for the years: 2010, 2015, 2020, 2025, and The General Base Forecast Assumptions considered during the forecasting process are detailed in the complete MSP LTCP document and include: 1. No return to airline regulation, as occurred prior to 1979; market conditions will dictate the airline services provided and associated fares/fees. 2. No major economic downturn, such as the depression that occurred during the 1930s. 3. No major international conflicts that would disrupt aviation. 4. No major trade wars or embargoes that would restrict flow of commerce and travel. 5. Security requirements are assumed as a result of terrorist activity; however, it is assumed that the Transportation Security Administration would establish measures to limit security-related delay. 6. The real cost of fuel is assumed to increase from 2009 levels; however, no major disruptions, similar to what occurred in the 1970s, are assumed. 7. No major changes in the physical environment are assumed. It is assumed that global climate changes will not be sufficient to force restrictions on the burning of hydrocarbons or major fuel tax increases. 8. Successful implementation of required changes and improvements for the national airspace system to accommodate unconstrained aviation demand are assumed. 9. No major airline consolidation is assumed due to established government regulations and labor union resistance; however, minor airline consolidation could continue. Further, it is assumed that major airlines that are in Chapter 11 bankruptcy during the preparation of the updated forecast will successfully reemerge. 10. It is assumed that new entrants will attempt to establish service at MSP within the forecast period, including JetBlue, which will likely introduce service at MSP by 2015, while Southwest Airlines will continue to expand services and markets served from MSP. 17
28 11. It is assumed that airline alliances (e.g., SkyTeam) will continue; and Delta Air Lines is assumed to continue to operate as a hub air carrier at MSP. The information provided in Figures 2-10 through 2-12 compares the actual 2010 activity with the 2010 updated low and high MSP forecast range. The bottom 2010 forecast line represents the low forecast range and assumes high fuel cost will cause air fares to rise and passenger demand to fall. In this scenario, by the year 2030, MSP passenger enplanements would rise slowly at an average annual increase of 1.2 percent, and aircraft operations would increase at an average annual rate of 0.6 percent. The top 2010 forecast line represents the high range that assumes that low fuel cost will result in reduced air fares, which will boost air travel by increasing passenger demand. In this scenario, passenger enplanements will increase at an average of 2.9 percent annually, and aircraft operations are projected to increase at an average annual rate of 2 percent. A comparison of actual 2010 activity and forecasted activity for the Origination and Destination (O&D) passengers, revenue passenger enplanements, and aircraft operations is provided in Figures 2-10 through For reference, the updated 2010 forecast and the previous 1993 forecast are provided in the comparison figures. It should be noted that activity levels fluctuate from year to year around a long-term average, and it is important to distinguish between these short-term fluctuations and long-term trends when evaluating a forecast. Figure 2-10 shows a comparison of actual and forecasted O&D passengers. Actual O&D passengers in 2010 were approximately 17 million, which is 2.2 percent below the 2010 LTCP Update Forecast of 17.4 million O&D passengers. Figure 2-11 shows the slight increase in 2010 of actual revenue passengers over 2009 levels. This increase ended a four-year downward trend; however, the actual revenue passenger level of million in 2010 is 4.2 percent below the 2010 LTCP Update Forecast level of million Figure 2-12 compares total aircraft operations as counted by the Federal Aviation Administration based on air traffic counts from MSP Air Traffic Control. Aircraft operations reached 435,583 in 2010, which is 1 percent higher than the 2009 operations level of 432,604. However, the actual total operations level in 2010 is 5.5 percent below the 2010 LTCP Update Forecast level of 463,
29 2010 ANNUAL REPORT TO THE LEGISLATURE Figure 2-10: Minneapolis-St. Paul International Airport Forecast vs. Actual 2010 O&D Passengers Actual O&D Passengers 1993 High Forecast 1993 Low Forecast 2010 LTCP Forecast 2010 LTCP High Forecast 2010 LTCP Low Forecast Total Passengers (Millions) Sources: MSP Long Term Comprehensive Plan Update 2010, Metropolitan Airports Commission, and HNTB analysis.
30 2010 ANNUAL REPORT TO THE LEGISLATURE Figure 2-11: Minneapolis-St. Paul International Airport Forecast vs. Actual 2010 Total Revenue Passengers ns) Actual Revenue Passengers 1993 High Forecast 1993 Low Forecast 2010 LTCP Forecast 2010 LTCP High Forecast 2010 LTCP Low Forecast Total Pass sengers (Millio Sources: MSP Long Term Comprehensive Plan Update 2010, Metropolitan Airports Commission, and HNTB analysis.
31 2010 ANNUAL REPORT TO THE LEGISLATURE Figure 2-12: Minneapolis-St. Paul International Airport Forecast vs. Actual 2010 Total Aircraft Operations ions (Thousand ds) Total Operati Actual Aircraft Operations Level 1993 High Forecast 1993 Low Forecast 2010 LTCP Forecast 2010 LTCP High Forecast 2010 LTCP Low Forecast Sources: MSP Long Term Comprehensive Plan Update 2010, Metropolitan Airports Commission, and HNTB analysis.
32 2.4 AIRPORT CAPACITY AND DELAY This section describes the airfield capacity at MSP. Aircraft delay analysis also is provided Airfield Capacity Airfield capacity is typically described in terms of hourly capacity and annual capacity under good and poor weather conditions. Table 2.3 shows existing and future hourly capacity for MSP. Table 2.3 MSP AIRFIELD CAPACITY Hourly Airfield Capacity Existing Future Optimum Rate (1) Marginal Rate (2) IFR Rate (3) Notes: (1) Ceiling and visibility above minima for visual approaches. (2) Below visual approach minima but better than instrument conditions. (3) Instrument conditions (ceiling less than 1,000 feet or visibility less than 3 miles). Source: Federal Aviation Administration (FAA) Air Traffic Control Tower Analysis As shown in Table 2.3, existing hourly capacity at MSP is about 150 operations in good weather and 120 operations in poor weather. Specific conditions that define poor weather include the airport s most commonly used instrument configuration, where operations are conducted below visual approach minima (e.g., instrument approaches). According to the FAA s 2004 Airport Capacity Benchmark Report, it is possible that improvements in technology could occur in the future that will support higher capacity levels. These improvements include advanced Traffic Management Advisor (TMA) technology to allow controllers to sequence aircraft more efficiently, and Cockpit Display of Traffic Information (CDTI) and CDTI Enhanced Flight Rules (CEFR), which will enable specially-equipped aircraft to maintain visual approaches even in marginal weather conditions. In 2010 the MSP Performance Based Navigation (PBN) Task Force convened to discuss the implementation of navigational technologies to enhance air traffic procedures at MSP. These enhancements include a coordinated airspace-wide 19
33 analysis for use of Area Navigation (RNAV) departure and arrival procedures and Optimum Profile Descent (OPD) arrivals. Forecasted aircraft operations developed for the MSP LTCP Update project total aircraft operations will reach 630,837 operations in Therefore, MSP s current airfield location and configuration have the capacity necessary to meet projected demand through In 2009, the MSP Noise Oversight Committee (NOC) and the MAC s Stewards of Tomorrow s Airport Resources (STAR) Program focused on development of RNAV departure procedures for Runway 17 and Runways 12L and 12R. These procedures are designed to help increase airspace efficiency and reduce airport delay, fuel burn, emissions and noise impacts. These developments are likely to positively influence airport capacity. Testing of these procedures was conducted and completed in phases with voluntary cooperation by three participant airlines that had aircraft equipped with the necessary technology. The MAC worked closely with FAA Air Traffic Control on development of these procedures and received input and endorsement from the MSP NOC prior to submitting the final procedures in late 2009 for FAA approval. These procedures are currently on hold pending the outcome of MSP Performance Based Navigation (PBN) Task Force airspace-wide coordination efforts Airfield Delay Delay can be measured in several ways. This section reviews various delay measures as they are reported by the FAA and apply to MSP. Number of Delayed Flights as Reported by the FAA The FAA Air Traffic Operations Network (OPSNET) database counts flights that were reported by Air Traffic Control (ATC) to be delayed for more than 15 minutes. Delays of less than 15 minutes are not counted, nor are delays not initiated by ATC. In addition, since delays are reported by facility, a flight that was delayed by 13 minutes by one facility and 12 minutes by another facility (for a total delay of 25 minutes) was not included in the OPSNET database prior to October 1, These data limitations should be kept in mind when reviewing OPSNET delay data. In 2008, the FAA made significant modifications to its reporting rules that will affect historical data comparisons. The FAA now combines arrival and enroute delays into one category, and now reports delays for aircraft which accumulate 15 minutes or more holding delay at each facility throughout the entire route of flight. Figure 2-13 depicts the number of MSP flights delayed by ATC. Delays peaked in 2002 when a total of 8,733 flights were reported delayed. Over the next five years, the number of delayed flights steadily decreased, reaching a low of 1,474 in 2006 (which was the first full year of operation with Runway 17-35). In 2007, the closure of Runway 12R-30L for two months due to reconstruction contributed to the jump in the number of reported delays. The number of delayed flights dropped significantly in 2008 to 1,579, 20
34 2010 ANNUAL REPORT TO THE LEGISLATURE 10,000 9,000 Figure 2-13: MSP Flights Delayed by ATC* Nu umber of Delayed Fli ghts 8,000 7,000 6,000 5,000 4,000 3,000 2,000 1, * *This total is reported differently in 2008 due to FAA adjusting the way air traffic control calculates delays for arriving and departing flights. Source: FAA OPSNET
35 but dramatically increased in 2009 to 7,880 due to the closure of Runway 12L-30R for two months for reconstruction work. The number of delayed flights in 2010 totaled 1,962. Percentage of Flights Arriving On-time The data series used to calculate on-time performance for arrivals is the FAA s Aviation System Performance Metrics (ASPM) database. Within this data set, aircraft must be airborne in order for them to be considered delayed; therefore, cancelled and/or diverted flights are not considered late in this system. Scheduled times typically include some cushion for delay, especially for arrivals operating during peak periods. A delayed flight can be attributed to mechanical problems, lack of crew or poor weather, and is not limited to capacity constraints. Figure 2-14 shows average on-time gate arrival performance for domestic air carrier flights at MSP based on the delay data extracted from the FAA ASPM database. The top graph compares MSP s rolling 12-month average for on-time performance and compares it with the national average. Between 2001 and 2008, the highest on-time performance for MSP occurred in 2002 and 2003, when overall annual on-time performance averaged about 84 percent. In 2004 and 2005, on-time performance slowly declined to about 80 percent, and remained at roughly 80 percent through In general, MSP s on-time performance has tracked fairly closely to the national average. MSP saw its on-time performance decline in 2007 to a low of 73 percent due to reconstruction of Runway 12R-30L from August 13, 2007 to October 18, 2007 and poor weather at MSP in December In 2008 MSP s on-time percentages remained steady at about 74 percent for the first six months. By year s end the annual average in 2008 rose to 79.6 percent. In 2009, MSP s annual rolling average for on-time gate arrivals reached a high of 83.4 percent by July, but then dipped to 80.6 percent by the end of the year. The reconstruction of Runway 12L-30R from August 18 to October 30, 2009 was a contributing factor to this decline in on-time performance. In 2010, the rolling average for on-time gate arrivals reached 80.8 percent in January, tracked slightly above the national average level until June, then remained slightly below the national average through the summer months. In October the 12-month rolling average peaked at percent and then dipped to percent in December. Average Delay per Aircraft Operation Finally, average delay per operation that is attributable to the airport is examined. Airport-attributable delay can be estimated by comparing a flight s actual air and taxi times with estimated unconstrained times. The total cumulative amount of delay experienced by all scheduled flights in the database is then divided by the total number of flights in the database for the same time period. The output is usually expressed in minutes of delay per operation. In editions of this report prior to 2005, delay was estimated by using the FAA s Consolidated Operations and Delay Analysis System (CODAS) and the U.S. 21
36 2010 ANNUAL REPORT TO THE LEGISLATURE Figure 2-14 On-Time Gate Arrivals Percent of On-time Gate Arrivals, MSP vs. National Average 1 (12-Month Moving Average) MSP National Average New Runway Runway 12R/30L Opens at MSP Closed for Reconst. Runway 12L/30R Closed for Reconst. JMMJSNJMMJSNJMMJSNJMMJSNJMMJSNJMMJSNJMMJSNJMMJSNJMMJSNJMMJSN rivals Percent of On-Time Gate Ar Avg. Delay/Operation Pct. Good Weather 2 Comparison of MSP Monthly On-time Gate Arrivals 1 and Percent of Good Weather New Runway Opens at MSP Runway 12R/30L Closed for Reconst. Runway 12L/30R Closed for Reconst. JMMJSNJMMJSNJMMJSNJMMJSNJMMJSNJMMJSNJMMJSNJMMJSNJMMJSNJMMJSN Percentage of flights arriving within 15 minutes of scheduled arrival time. National average consists of the top 55 airports in ASPM database through Oct and top 75 airports for rest of period. 2. Good weather is defined as when conditions may allow visual approaches; actual separation standards used at time of observation are not available in ASPM database. Sources: FAA-APO Aviation System Performance Metrics (ASPM) database.
37 Department of Transportation (DOT) Airline Service Quality Performance (ASQP) database to compare optimal vs. actual taxi and flight times for MSP. Subsequent to 2005, the FAA s Aviation System Performance Metrics (ASPM) database was used to estimate delay. The FAA replaced CODAS with this new program, providing delay information to industry professionals and government agencies. ASPM data come from ARINC s Out-Off-On-In (OOOI), Enhanced Traffic Management System (ETMS), ASQP, weather data, airport arrival and departure rates (15-minute interval), airport runway configurations and cancellations. Creation of the ASPM database provided a more comprehensive analysis of airport delay and capacity. The FAA also uses the results to create performance benchmarks for airports based on facility enhancements that occur each year. The FAA s main objective was to develop a clear and well-supported methodology to calculate aircraft delays that would be accepted by both government and industry as valid, accurate and reliable. Currently, there is general industry acceptance of the ASPM metric. The ASPM information presented in Figure 2-15 shows average delay per operation. The top graph compares MSP s 12-month rolling average with the average for 75 highdelay airports tracked by the FAA. Between 2001 and 2005, MSP s average delay per operation ranged between 6.5 minutes and 7.1 minutes, while the average delay for the 75 airports tracked by the FAA ranged from about 4.8 minutes to 5.6 minutes. After MSP s new runway opened in late October 2005, average delay per aircraft began to decrease dramatically, reaching a low of about 5.5 minutes toward the end of The 12-month rolling average delay per operation began to increase steadily, reaching about 7.5 minutes by the end of 2007, while average delay for the 75 airports tracked by the FAA remained fairly constant at about 6.0 minutes. During 2008, MSP s average delay per operation dropped from 7.6 minutes in January to 5.6 in December, and remained between 5.0 and 5.9 minutes until October 2010 when the 12-month rolling average reached an all-time low average delay per aircraft operation of 4.83 minutes. There are many factors that contribute to airfield delay, including poor weather conditions, runway closures (typically due to construction), changes in airline schedules, changes in Air Traffic Control procedures, airline fleet mix changes, airline practices, and other factors. In addition, how delays are defined or reported can change over time. For these reasons, it is often difficult to determine and report the precise causes for delays or to be definitive about delay trends. The bottom graph of Figure 2-15 compares MSP s month-by-month average delay per operation with the percentage of time the airport operated in poor weather conditions (which typically increases delays). As shown, the highest delays were experienced in summer 2007 when Runway 12R-30L was closed for reconstruction, and again in December 2007 when the airport was operating in poor weather conditions more than 60 percent of the time. Poor weather conditions contributed significantly to the level of delay exceeding 7.1 minutes in February 2008, 7.9 minutes in December 2008, and 8.3 minutes in October When compared to other large hub U.S. airports as shown in Table 2.4, MSP ranked 11 th overall in 2010 in terms of highest average delay per operation. 22
 National Average New Runway Opens at")
38 2010 ANNUAL REPORT TO THE LEGISLATURE (Min.) Avg. Delay Per Operation MSP Figure 2-15 MSP Average Delay Per Aircraft Operation 1 Compared to National Average (12-Month Moving Average) National Average New Runway Opens at MSP Runway 12R/30L Closed for Reconst. Runway 12L/30R Closed for Reconst. J M M J S N J M M J S N J M M J S N J M M J S N J M M J S N J M M J S N J M M J S N J M M J S N J M M J S N J M M J S N Comparison of MSP Average Delay Per Aircraft Operation and Percent Poor Weather 2 Avg. Delay Per Operation (M Min.) Avg. Delay/Operation Pct. Poor Weather 2 New Runway Opens at MSP Runway 12R/30L Closed for Reconst. Runway 12L/30R Closed for Reconst. J MMJ SN J MMJ SN J MMJ SN J MMJ SN J MMJ SN J MMJ SN J MMJ SN J MMJ SN J MMJ SN J MMJ SN (1) An operation is either a landing or a takeoff. National average consists of top 55 airports in ASPM database through Oct and top 75 airports for rest of period. (2) Poor weather is defined as when aircraft must make instrument approaches; actual separation standards used at time of observation are not available in ASPM database. Sources: FAA-APO Aviation System Performance Metrics (ASPM) database Poor Weather 2 Percent
39 Table 2.4 TOP 15 LARGE HUB AIRPORTS WITH HIGHEST AVERAGE TOTAL DELAY PER OPERATION Rank Airport 2010 Total Airport Operations 2010 Average Minutes of Delay per Operation 2009 Avg. Minutes of Delay per Operation 2009 Rank Change from 2009 to LGA 367, JFK 404, ATL 950, PHL 460, EWR 408, DTW 432, ORD 882, SLC 365, BOS 368, CLT 529, MSP 435, DEN 635, DFW 652, MIA 376, IAH 531, Source: FAA OPSNET for airport operations data, and FAA ASPM for average minutes of delay (taxi-in, taxi-out, and airborne delay). 23
40 2.5 TECHNOLOGICAL AND CAPACITY ENHANCEMENTS The FAA continuously investigates potential capacity-enhancing development/ technology in an effort to increase airport efficiency and reduce delay. When advances are identified, efforts are made to implement the technology at the busiest airports. This section describes these efforts as they apply to MSP. In 1993, the FAA published the Minneapolis-Saint Paul International Airport Capacity Enhancement Plan. The purpose of the plan was to identify potential cost-effective projects which would appreciably increase airport capacity. The plan was followed by the 1996 Airport Capacity Enhancement Terminal Airspace Study, which identified potential methods of improving airspace capacity. Airport Surface Detection Equipment (ASDE-3) was installed at MSP in 1996 to allow air traffic controllers to see aircraft maneuvering on the ground during poor visibility conditions. Installation of an upgraded system called ASDE-X was completed in 2009, but the upgraded system retained some components of the older ASDE-3. All-in-all, the upgraded system added remote units around MSP s airfield to provide for more precise aircraft positioning; it provides seamless coverage for complete aircraft identification information, and it will allow for the Next Generation (NextGen) of navigation technology (Automatic Dependence Surveillance - Broadcast "ADS-B") to broadcast critical information using the Global Navigation Satellite System. Capacity improvements at MSP will be aided by the use of Flight Management System/Area Navigation Routes (FMS/ RNAV). These RNAV Routes will provide a more efficient and predictable traffic flow of aircraft during the arrival and departure phases of flight. In 2009 development of RNAV departure procedures for Runways 17, 12L and 12R were completed by the MAC in coordination with the FAA and three air carrier service airlines at MSP. The MSP Noise Oversight Committee endorsed the final procedures in July 2009; the MAC board approved the procedures in December; and the final procedures were submitted for FAA approval and implementation in late As mentioned in section 2.4.1, these procedures are currently on hold pending the outcome of MSP Performance Based Navigation (PBN) Task Force airspace-wide coordination efforts. In an effort to increase the operational efficiency and capacity of MSP during inclement weather, the MAC has implemented additional CAT II and CAT III capabilities at the airport. Cat II approaches (currently on Runway 30L) allow approaches down to 1200 feet visibility and 110-feet cloud ceiling. CAT III(a) approaches (Runway 12R) allow descent down to 700 feet visibility and no ceiling. CAT III(b) approaches (currently on Runways 12L and 35) allow descent down to 600 feet visibility, and no ceiling. Future increases in MSP capacity levels will depend, in part, on the introduction of new aircraft avionics. An enhanced tool called Automatic Dependent Surveillance-Broadcast/Cockpit Display of Traffic Information (ADS-B/CDTI) 24
41 identifies the location of other aircraft and displays their position in the cockpit. This technology allows pilots to maintain the desired separation between aircraft more precisely; however, aircraft must be properly equipped to use this device. The ADS-B system requires associated ground equipment to be installed to facilitate the transfer of traffic information to the aircraft. The ground equipment associated with ADS-B was installed at MSP in September The FAA has issued a Notice of Proposed Rule Making that calls for all aircraft that will operate in a terminal area, such as MSP, to have on-board aircraft equipment by Alternative airspace improvements were studied in the Airport Capacity Enhancement Terminal Airspace Study. The report found that the existing airspace around MSP could be reconfigured to accommodate the then-proposed north-south runway. In addition, airspace efficiency could be improved either by adding a new jet arrival fix or a new parallel jet arrival stream. These improvements were implemented with the opening of Runway in October In 2009, installation of the Multilateration Flight Tracking (MLAT) System and upgrades to the Metropolitan Airports Commission Noise and Operations Monitoring System (MACNOMS) were completed and full implementation occurred in The original Airport Noise and Operations Monitoring System (ANOMS) was installed in 1992 and was used extensively for reporting and analyzing aircraft operations and related noise levels around MSP. Data limitations with ANOMS included a minimum hold period of three days before the flight tracks were received and available for analysis. The new MLAT System provides increased functionality and same-day flight track data availability, including near real-time access to flight track data through the noise program website: Precision Instrument Approaches In addition to runway separation and configuration, airfield capacity can be greatly affected by how the runways are equipped for inclement weather. The number and type of precision instrument approaches at MSP is summarized in Table
42 Table 2.5 PRECISION INSTRUMENT APPROACHES MSP CAT I CAT II CAT III Runways: 30R 30L 12L (b) 12R (a) 35 (b) Notes: The term decision height is defined as the height at which a decision must be made during a precision approach to either continue the landing maneuver or execute a missed approach. Precision approaches are categorized based on decision height and the horizontal visibility that a pilot has along the runway. Visibility values are expressed in statute miles or in terms of runway visual range (RVR) if RVR measuring equipment is installed at an airport. The different classes of precision instrument approaches are: i. Category I (CAT I) provides approaches to a decision height down to 200 feet and a basic visibility of ¾ statute miles or as low as 1,800 feet RVR. ii. Category II (CAT II) provides approaches to a decision height down to 100 feet and an RVR down to 1,200 feet. iii. Category IIIa (CAT IIIa) provides approaches without a decision height (down to the ground) or a decision height below 100 feet and an RVR down to 700 feet. iv. Category IIIb (CAT IIIb) provides approaches without a decision height or a decision height below 50 feet and an RVR down to 150 feet. v. Category IIIc (CAT IIIc) provides approaches without a decision height and RVR. This will permit landings in "0/0 conditions," that is, weather conditions with no ceiling and visibility as during periods of heavy fog. Source: December 2006 U.S. Terminal Procedures, NOAA. 26
43 2.6 STEWARDS OF TOMORROW S AIRPORT RESOURCES (STAR) PROGRAM The Metropolitan Airports Commission (MAC) has been a longtime leader in addressing environmental concerns through a wide spectrum of initiatives, ranging from a standardsetting noise mitigation program to the preservation of Minnesota wetlands. The MAC views environmental sustainability as an integral part of its mission and is committed to setting the standard in environmental stewardship in the development and operation of its airport system. Sustainable solutions are those that address long-term environmental, operational, financial and social needs. Recognizing that MSP is a large and complex operation with many stakeholders, the MAC is focused on optimizing and improving all MAC-controlled operation and development actions at MSP in an effort to minimize impacts to the environment and implement sustainable solutions. Additionally, the MAC continues to conduct outreach and advocacy to influence, to the degree possible, non-mac-controlled activities at MSP to further reduce environmental impacts. At the March 17, 2008 MAC Commission meeting, the Stewards of Tomorrow s Airport Resources (STAR) Program was introduced. The intent of the STAR Program is to maintain a focus on the MAC s commitment to the environment and the community through the development of initiatives that are environmentally-sound and contribute to the financial viability and operational efficiency at MSP and the reliever airports. Sustainable practices to date focus on the following areas: Energy Conservation/Renewable Energy Green Buildings, Facilities and Infrastructure Water Quality and Conservation Air Quality Waste Management and Recycling Noise Abatement Natural Resources Management Financial Stability The 2010 energy conservation program is estimated to have reduced electrical consumption by 825 MWH/yr and natural gas usage by 148,500 Therms/yr, which results in a projected utility cost savings of $208,600. In addition, the MAC received utility company rebates of approximately $30,000 for Since the STAR program s inception in 2008, the calculated electrical-usage reduction is 135,137,625 kilowatts; gas-usage reduction is 748,148 therms; and the cumulative total utility cost reduction equates to $9,919,000. Additionally, the utility rebates total $174,
44 In 2010, the MAC STAR Program accomplishments included energy conservation projects and education, environmental enhancements for facilities, water quality and conservation efforts, and air quality improvements. Other STAR program efforts in 2010 included: 1. Recovering heat expelled from the Terminal 1-Lindbergh boilers and installation of supplemental cooling to allow the winter chilled water cooling system to be used in lieu of the less-efficient air-cooled condensing units. 2. Lighting conservation at Concourse C with installation of automatic lighting controls that turn off lights when the space is unoccupied. 3. Installation of energy conservation devices on moving walks and escalators. These devices will reduce moving walkway energy consumption by approximately 15 percent and escalator energy consumption by 23 percent. 4. Evaluation of infrared imaging used to identify areas of Terminal 1-Lindbergh that waste energy through excessive air leakage or inadequate insulation. 28
45 3. RELIEVER AIRPORTS 3.0 OVERVIEW The Metropolitan Airports Commission (MAC) owns and operates six reliever airports throughout the metropolitan area that surrounds Minneapolis-St. Paul International Airport (MSP). Reliever airports are defined by the Federal Aviation Administration (FAA) as airports designated to relieve congestion at commercial service airports and to provide improved general aviation access to the overall community. This system of airports generates an estimated $1.4 billion annually for the Twin Cities economy 6 while reducing general aviation operations at MSP. The reliever airports are Airlake, Anoka County-Blaine, Crystal, Flying Cloud, Lake Elmo and St. Paul Downtown. This portion of the report highlights the facilities and activities at each of the reliever airports and organizes the information into the following three sections: Description of Reliever Airport Facilities Historic and Existing Activity Levels Development Programs 3.1 RELIEVER AIRPORT FACILITIES According to the Metropolitan Council Transportation Policy Plan, adopted January 14, 2009, all but one of the MAC reliever airports are classified as minor airports. This means that primary runway lengths are between 2,500 and 5,000 feet. St. Paul Downtown is classified as an intermediate airport, which means its primary runway is between 5,000 and 8,000 feet long. Airport users at the MAC reliever airports include air taxi, business aviation, general aviation, flight training, recreational aviation, and military aviation. Each of the reliever airports is open for public use 24 hours per day, in keeping with federal regulations. The following sections outline the existing airport facilities at each location Airlake Airport (LVN) Airlake Airport (LVN) consists of approximately 595 acres, and the airfield includes one northwest-southeast runway and one full-length parallel taxiway. Runway is 4,098 feet long by 75 feet wide. The airport has a precision instrument approach to Runway 30 and a non-precision approach to Runway 12. Figure 3-1 shows the general airport layout and facilities. A Fixed Base Operator (FBO) at the airport provides fueling and aircraft maintenance services. The airport had approximately 147 based aircraft and an estimated 35,662 aircraft operations in There is no Air Traffic Control 6 Metropolitan Airports Commission, Economic Impact Analysis of the Reliever Airport System, Wilder Research, October
46 2010 ANNUAL REPORT TO THE LEGISLATURE Figure 3-1: Airlake Airport (LVN) Layout Sources: Metropolitan Airports Commission and HNTB analysis.
47 Tower located at the airport. Aircraft operators utilize common traffic advisory procedures while flying to and from the airport Anoka County-Blaine Airport (ANE) Anoka County-Blaine Airport (ANE), also known as Janes Field, consists of approximately 1,900 acres, and the airfield includes one east-west runway and one north-south runway. Both runways have full-length parallel taxiways. Runway 9-27 is 5,000 feet long by 100 feet wide and Runway is 4,855 feet long by 100 feet wide. The airport has a precision instrument approach to Runway 27 and non-precision instrument approaches to Runways 9, 18 and 27. Figure 3-2 shows the general airport layout and facilities. Two FBOs at the airport provide fueling, flight training and aircraft maintenance services for aircraft and helicopters. The airport had 433 based aircraft and 79,589 aircraft operations in A non-federal Air Traffic Control Tower is located at the airport and operates each day in the winter from 7 a.m. to 9 p.m., and 7 a.m. to 10 p.m. in the summer. The change in operating hours coincides with daylight saving time Crystal Airport (MIC) Crystal Airport (MIC) consists of approximately 436 acres and includes two northwestsoutheast runways and two southwest-northeast runways. Runway 14R-32L has a fulllength parallel taxiway. Runway 14L-32R is 3,263 feet long by 75 feet wide, Runway 14R-32L is 3,266 feet long by 75 feet wide and Runway 6L-24R is 2,499 feet long by 75 feet wide. The turf runway (6R-24L) is 2,122 feet long by 150 feet wide, and is closed during the winter months. The airport has two non-precision instrument approaches. Figure 3-3 shows the general airport layout and facilities. Three FBOs at the airport provide fueling, flight training and aircraft maintenance services. The airport had 219 based aircraft and 44,229 annual aircraft operations in An FAA-operated Air Traffic Control Tower is located at the airport and operates each day in the winter from 7 a.m. to 9 p.m., and 7 a.m. to 10 p.m. in the summer. The change in operating hours coincides with daylight saving time Flying Cloud Airport (FCM) Flying Cloud Airport (FCM) consists of approximately 860 acres and includes two eastwest runways and one north-south runway. All runways have full-length parallel taxiways. Runway 10R-28L was extended to 5,000 feet long and widened to 100 feet in 2009; Runway 10L-28R was extended to 3,900 feet in 2008 and is 75 feet wide; and Runway is 2,691 feet long by 75 feet wide. The airport has a precision instrument approach to Runway 10R and non-precision instrument approaches to Runways 10L, 28L, 28R, 18, and 36. It also has a published precision instrument approach procedure for helicopters. Figure 3-4 shows the general airport layout and facilities. Six FBOs at the airport provide fueling, flight training and aircraft maintenance services for aircraft and helicopters. The airport had approximately 403 based aircraft and 94,244 aircraft operations in An FAA-operated Air Traffic Control Tower is located at the airport, 30

48 2010 ANNUAL REPORT TO THE LEGISLATURE Figure 3-2: Anoka County-Blaine Airport (ANE) Layout Sources: Metropolitan Airports Commission and HNTB analysis. Note: O&D Passenger estimates are based on the first two quarters of 2008.

")
49 2010 ANNUAL REPORT TO THE LEGISLATURE Figure 3-3: Crystal Airport (MIC) Layout

")
50 2010 ANNUAL REPORT TO THE LEGISLATURE Figure 3-4: Flying Cloud Airport (FCM) Layout
51 and operates each day in the winter from 7 a.m. to 9 p.m. and 7 a.m. to 10 p.m. in the summer. The change in operating hours coincides with daylight saving time Lake Elmo Airport (21D) Lake Elmo Airport (21D) consists of approximately 640 acres and includes one northwest-southeast runway and one southwest-northeast runway. Both runways have full-length parallel taxiways. Runway is 2,850 feet long by 75 feet wide, and Runway 4-22 is 2,497 feet long by 75 feet wide. The airport has two non-precision instrument approaches to the airport. Figure 3-5 shows the general airport layout and facilities. One FBO at the airport provides fueling, flight training and aircraft maintenance services. The airport had 229 based aircraft and an estimated 34,374 aircraft operations in There is no Air Traffic Control Tower located at the airport. Aircraft operators utilize common traffic advisory procedures while flying to and from the airport St. Paul Downtown Airport (STP) St. Paul Downtown Airport (STP) is commonly referred to as Holman Field. The land area measures approximately 576 acres, and the airfield consists of two northwestsoutheast runways and one east-west runway. Runway has a full-length parallel taxiway. Both of the other runways have partial parallel taxiways. Runway is 6,491 feet long by 150 feet wide; Runway is 4,004 feet long by 150 feet wide; and Runway 9-27 is 3,642 feet long by 100 feet wide. The airport has precision instrument approaches to Runways 14 and 32 and non-precision instrument approaches to Runways 14, 31 and 32. It also has a published precision instrument approach procedure for helicopters. Figure 3-6 shows the general airport layout and facilities. Two FBOs at the airport provide fueling, flight training and aircraft maintenance services for aircraft. The airport had 100 based aircraft and 88,995 aircraft operations in An FAA-operated Air Traffic Control Tower is located at the airport and operates from 7 a.m. to 10 p.m. on weekends and 6 a.m. to 10 p.m. on weekdays. 31
52 2010 ANNUAL REPORT TO THE LEGISLATURE Figure 3-5: Lake Elmo Airport (21D) Layout


")
53 2010 ANNUAL REPORT TO THE LEGISLATURE Figure 3-6: St. Paul Downtown Airport (STP) Layout
2009 ANNUAL REPORT TO THE LEGISLATURE
 This document is made available electronically by the Minnesota Legislative Reference Library as part of an ongoing digital archiving project. http://www.leg.state.mn.us/lrl/lrl.asp 2009 ANNUAL REPORT
2011 ANNUAL REPORT TO THE LEGISLATURE
 2011 ANNUAL REPORT TO THE LEGISLATURE PREPARED BY THE METROPOLITAN AIRPORTS COMMISSION NOISE PROGRAM OFFICE MARCH 2012 TABLE OF CONTENTS 1 INTRODUCTION... 4 1.0 OVERVIEW... 4 1.1 METROPOLITAN AIRPORTS
msp macnoise.com MSP Noise Oversight Committee (NOC) November 17, 2010
 November 17, 2010") MSP Noise Oversight Committee (NOC) November 17, 2010 Operations Update Technical Advisor s Report Summary MSP Complaints September October 2010 3,025 3,567 2009 6,350 6,001 Total Operations September
MSP Noise Oversight Committee (NOC) November 17, 2010 Operations Update Technical Advisor s Report Summary MSP Complaints September October 2010 3,025 3,567 2009 6,350 6,001 Total Operations September
2008 ANNUAL REPORT TO THE LEGISLATURE
 This document is made available electronically by the Minnesota Legislative Reference Library as part of an ongoing digital archiving project. http://www.leg.state.mn.us/lrl/lrl.asp 2008 ANNUAL REPORT
Bridget Rief, Vice President Planning and Development Metropolitan Airports Commission
 Bridget Rief, Vice President Planning and Development Metropolitan Airports Commission Topics Operations and Air Service Trends Economic Impact Striving for Excellence Planning for the Future Prep for
State of the Airport Robert S. Bowen, Executive Director October 18, 2018
 Robert S. Bowen, Executive Director October 18, 2018 A Year of Change The last year will be remembered as a period when the airlines, bolstered by a growing national economy, moderate fuel prices and changing
CHAPTER 4: ALTERNATIVES
 MSP Long Term Comprehensive Plan Update Metropolitan Airports Commission 4.1 INTRODUCTION CHAPTER 4: ALTERNATIVES Several alternatives were developed and evaluated based on their capability to meet the
FORECASTING FUTURE ACTIVITY
 EXECUTIVE SUMMARY The Eagle County Regional Airport (EGE) is known as a gateway into the heart of the Colorado Rocky Mountains, providing access to some of the nation s top ski resort towns (Vail, Beaver
Westover Metropolitan Airport Master Plan Update
 Westover Metropolitan Airport Master Plan Update June 2008 INTRODUCTION Westover Metropolitan Airport (CEF) comprises the civilian portion of a joint-use facility located in Chicopee, Massachusetts. The
Brian Ryks Executive Director and CEO
 Brian Ryks Executive Director and CEO MAC Commissioners MAC Finances 2016 Budgeted Operating Revenues Utilities and Other 5% Airline Rates and Charges 34% Rents and Fees 14% Concessions 47% 2016 Budgeted
Planning, Development and Environment Committee
 Page 1 of 7 MEMORANDUM TO: Planning, Development and Environment Committee FROM: Neil Ralston, Airport Planner Airport Development (726-8129) SUBJECT: 2035 MSP LONG TERM COMPREHENSIVE PLAN FORECAST, FACILITY
Airport Master Plan. Brookings Regional Airport. Runway Runway 17-35
 Runway 17-35 Airport Master Plan Runway 12-30 Brookings Regional Airport Table of Contents Table of Contents Chapter 1: Master Plan Goals... 1-1 1.1. Introduction... 1 1.2. Objective 1 Identify improvements
Appendix B Ultimate Airport Capacity and Delay Simulation Modeling Analysis
 Appendix B ULTIMATE AIRPORT CAPACITY & DELAY SIMULATION MODELING ANALYSIS B TABLE OF CONTENTS EXHIBITS TABLES B.1 Introduction... 1 B.2 Simulation Modeling Assumption and Methodology... 4 B.2.1 Runway
Forecast and Overview
 Forecast and Overview DENVER INTERNATIONAL AIRPORT Overall goals of the (MPR): Work with DEN to refine the preferred airport development plan to guide the development over an approximate 25-year planning
1.0 Project Background Mission Statement and Goals Objectives of this Sustainable Master Plan
 TABLE OF CONTENTS CHAPTER 1 INTRODUCTION 10 Project Background 1-1 11 Mission Statement and Goals 1-1 12 Objectives of this Sustainable Master Plan 1-2 CHAPTER 2 INVENTORY 20 Airport Background 2-1 201
Draft Concept Alternatives Analysis for the Inaugural Airport Program September 2005
 Draft Concept Alternatives Analysis for the Inaugural Airport Program September 2005 Section 3 - Refinement of the Ultimate Airfield Concept Using the Base Concept identified in Section 2, IDOT re-examined
The Metropolitan Airports Commission and MSP International Airport
 The Metropolitan Airports Commission and MSP International Airport Brian Ryks, Executive Director and CEO Metropolitan Airports Commission My Flight Track Duluth Aberdeen St. Cloud Twin Cities Grand Rapids
MINNEAPOLIS-ST. PAUL PUBLIC INPUT MEETING 3 RD QUARTER 2016 INTERNATIONAL AIRPORT (MSP)
") 3 RD QUARTER 2016 MINNEAPOLIS-ST. PAUL INTERNATIONAL AIRPORT (MSP) PUBLIC INPUT MEETING Metropolitan Airports Commission Noise Program Office July 27, 2016 PUBLIC INPUT MEETING Meeting Goals To hear the
3 RD QUARTER 2016 MINNEAPOLIS-ST. PAUL INTERNATIONAL AIRPORT (MSP) PUBLIC INPUT MEETING Metropolitan Airports Commission Noise Program Office July 27, 2016 PUBLIC INPUT MEETING Meeting Goals To hear the
3. Aviation Activity Forecasts
 3. Aviation Activity Forecasts This section presents forecasts of aviation activity for the Airport through 2029. Forecasts were developed for enplaned passengers, air carrier and regional/commuter airline
Minneapolis-St. Paul International Airport (MSP)
") 2 nd Quarter 2016 Minneapolis-St. Paul International Airport (MSP) Public Input Meeting Metropolitan Airports Commission Noise Program Office April 27, 2016 PUBLIC INPUT MEETING Meeting Goals To hear the
2 nd Quarter 2016 Minneapolis-St. Paul International Airport (MSP) Public Input Meeting Metropolitan Airports Commission Noise Program Office April 27, 2016 PUBLIC INPUT MEETING Meeting Goals To hear the
2. 1:45 to 1:50 Review and Approval of November 18, 2009 NOC Meeting Minutes
 Minneapolis/St. Paul International Airport (MSP) Noise Oversight Committee (NOC) Meeting Agenda January 2, 21 1:3 P.M. Lindbergh Conference Room MAC General Office Building 64 28 th Avenue South Minneapolis,
3 Aviation Demand Forecast
 3 Aviation Demand 17 s of aviation demand were prepared in support of the Master Plan for Harrisburg International Airport (the Airport or HIA), including forecasts of enplaned passengers, air cargo, based
The presentation was approximately 25 minutes The presentation is part of Working Group Meeting 3
 This is the presentation for the third Master Plan Update Working Group Meeting being conducted for the Ted Stevens Anchorage International Airport Master Plan Update. It was given on Thursday March 7
Table of Contents. Master Plan March 2014 TOC i Spokane International Airport
 Table of Contents Page Chapter 1 Inventory 1. Introduction... 1 1 1.1 Community Profile... 1 2 1.1.1 Location and Setting... 1 1 1.1.2 Climate... 1 2 1.1.3 Socioeconomic Conditions... 1 5 1.1.4 Area Land
APPENDIX D MSP Airfield Simulation Analysis
 APPENDIX D MSP Airfield Simulation Analysis This page is left intentionally blank. MSP Airfield Simulation Analysis Technical Report Prepared by: HNTB November 2011 2020 Improvements Environmental Assessment/
MINNEAPOLIS-ST. PAUL RELIEVER AIRPORTS Activity Forecasts Technical Report April 2009
 1. Introduction MINNEAPOLIS-ST. PAUL RELIEVER AIRPORTS Activity Forecasts Technical Report April 2009 The purpose of this analysis is to provide aviation activity forecasts for use in the Long- Term Comprehensive
CHAPTER 1 EXECUTIVE SUMMARY
 CHAPTER 1 EXECUTIVE SUMMARY 1 1 EXECUTIVE SUMMARY INTRODUCTION William R. Fairchild International Airport (CLM) is located approximately three miles west of the city of Port Angeles, Washington. The airport
Chapter 2 FINDINGS & CONCLUSIONS
 Chapter 2 FINDINGS & CONCLUSIONS 2.01 GENERAL Dutchess County acquired the airport facility in 1947 by deed from the War Assets Administration. Following the acquisition, several individuals who pursued
City of Austin Department of Aviation Austin Bergstrom International Airport 2040 Master Plan. Public Workshop #2 April 19, 2018
 City of Austin Department of Aviation Austin Bergstrom International Airport 2040 Master Plan Public Workshop #2 April 19, 2018 DISCUSSION TOPICS Introduction About the Master Plan Public Workshop #1 Recap
The purpose of this Demand/Capacity. The airfield configuration for SPG. Methods for determining airport AIRPORT DEMAND CAPACITY. Runway Configuration
 Chapter 4 Page 65 AIRPORT DEMAND CAPACITY The purpose of this Demand/Capacity Analysis is to examine the capability of the Albert Whitted Airport (SPG) to meet the needs of its users. In doing so, this
DEVELOPMENT OF TOE MIDFIELD TERMINAL IROJECT CAPACITY ENHANCEMENT REPORT DEPARTMENT OF AVIATION TOM FOERSTER CHAIRMAN BARBARA HAFER COMMISSIONER
 PETE FLAHERTY COMMISSIONER TOM FOERSTER CHAIRMAN DEPARTMENT OF AVIATION BARBARA HAFER COMMISSIONER STEPHEN A. GEORGE DIRECTOR ROOM M 134, TERMINAL BUILDING GREATER PITTSBURGH INTERNATIONAL AIRPORT PITTSBURGH,
Draft Concept Alternatives Analysis for the Inaugural Airport Program September 2005
 Draft Concept Alternatives Analysis for the Inaugural Airport Program September 2005 Section 1 - Introduction This report describes the development and analysis of concept alternatives that would accommodate
Noise Oversight Committee
 Noise Oversight Committee July 22, 2015 Audio recordings are made of this meeting 1 Noise Oversight Committee July 22, 2015 Item 1 Review and Approve Draft Meeting Minutes Minutes from May 20, 2015 Noise
FLL Master Plan Update Technical Advisory Committee (TAC) Briefing #1. September 28, 2016
 Briefing #1. September 28, 2016") FLL Master Plan Update Technical Advisory Committee (TAC) Briefing #1 September 28, 2016 TAC Committee Role: Internal Stakeholders To provide input on the master planning analysis from the technical and
FLL Master Plan Update Technical Advisory Committee (TAC) Briefing #1 September 28, 2016 TAC Committee Role: Internal Stakeholders To provide input on the master planning analysis from the technical and
Document prepared by MnDOT Office of Aeronautics and HNTB Corporation. MINNESOTA GO STATE AVIATION SYSTEM PLAN
 LAST UPDATE JULY 2013 Acknowledgements The preparation of this document was financed in part by a grant from the Federal Aviation Administration (Project No: 3-27-0000-07-10), with the financial support
MONTEREY REGIONAL AIRPORT MASTER PLAN TOPICAL QUESTIONS FROM THE PLANNING ADVISORY COMMITTEE AND TOPICAL RESPONSES
 MONTEREY REGIONAL AIRPORT MASTER PLAN TOPICAL QUESTIONS FROM THE PLANNING ADVISORY COMMITTEE AND TOPICAL RESPONSES Recurring topics emerged in some of the comments and questions raised by members of the
Welcome to the Boise Airport Master Plan Update Open House
 Welcome to the Boise Airport Master Plan Update Open House Get the facts and sign up for the Master Plan Update newsletter at http://www.iflyboise.com/about-boi/master-plan/ What does the Master Plan Update
Chapter 1: Introduction Draft
 Chapter 1: Draft TABLE OF CONTENTS 1... 4 1.6.1 Stakeholder Engagement Plan... 10 Chapter 1 Page 2 TABLE OF EXHIBITS Exhibit 1.1-1 ABIA Annual Growth Since 1993... 5 Exhibit 1.4-1: ABIA Location Map...
S p NA, illil MINNEAPOLIS- ST. PAUL INTERNATIONAL AIRPORT ( MSP) NOISE OVERSIGHT COMMITTEE ( NOC) RESOLUTION #
 NOISE OVERSIGHT COMMITTEE ( NOC) RESOLUTION #") NA, S p illil r, MINNEAPOLIS- ST. PAUL INTERNATIONAL AIRPORT ( MSP) NOISE OVERSIGHT COMMITTEE ( NOC) RESOLUTION # 01-2014 REGARDING FUTURE FAA PERFORMANCE- BASED NAVIGATION ( PBN)/ AREA NAVIGATION ( RNAV)
NA, S p illil r, MINNEAPOLIS- ST. PAUL INTERNATIONAL AIRPORT ( MSP) NOISE OVERSIGHT COMMITTEE ( NOC) RESOLUTION # 01-2014 REGARDING FUTURE FAA PERFORMANCE- BASED NAVIGATION ( PBN)/ AREA NAVIGATION ( RNAV)
SouthwestFloridaInternational Airport
 SouthwestFloridaInternational Airport SouthwestFloridaInternationalAirportislocatedinLee CountyalongtheGulfCoastofSouthFlorida,tenmiles southeastofthefortmyerscentralbusinessdistrict. Theprimaryhighwayaccesstotheairportfrom
ECONOMIC IMPACT OF THE RELIEVER AIRPORTS
 Metropolitan Airports Commission ECONOMIC IMPACT OF THE RELIEVER AIRPORTS Prepared for Prepared by April 3, 2018 Executive Summary The Metropolitan Airports Commission engaged InterVISTAS Consulting Inc.
AIRPORT MASTER PLAN UPDATE
 AIRPORT MASTER PLAN UPDATE PENSACOLA INTERNATIONAL AIRPORT Technical Advisory Committee Meeting #2 June 20, 2017 Agenda» Introduction» Facility Requirements Airside Terminal Landside General Aviation Cargo
Chapter 1: Introduction
 Chapter 1: TABLE OF CONTENTS 1... 4 1.1 Master Plan Study Content... 4 1.2 Purpose and Scope of Master Plan Study... 4 1.3 Airport History and Role... 6 1.4 Airport Location and Service Area... 6 1.5 ABIA
JOSLIN FIELD, MAGIC VALLEY REGIONAL AIRPORT DECEMBER 2012
 1. Introduction The Federal Aviation Administration (FAA) recommends that airport master plans be updated every 5 years or as necessary to keep them current. The Master Plan for Joslin Field, Magic Valley
Challenges and Changes! Jeff Hamiel! Metropolitan Airports Commission!
 Challenges and Changes! Jeff Hamiel! Metropolitan Airports Commission! Industry Consolidation! Trend: Airline Outsourcing! Above- and below-wing services! Aircraft cleaning! Wheelchair assistance services!
TABLE OF CONTENTS. General Study Objectives Public Involvement Issues to Be Resolved
 TABLE OF CONTENTS Description Page Number LIST OF ACRONYMS... a CHAPTER ONE INTRODUCTION General... 1-1 Study Objectives... 1-1 Public Involvement... 1-2 Issues to Be Resolved... 1-2 CHAPTER TWO EXISTING
Time-series methodologies Market share methodologies Socioeconomic methodologies
 This Chapter features aviation activity forecasts for the Asheville Regional Airport (Airport) over a next 20- year planning horizon. Aviation demand forecasts are an important step in the master planning
Current and Forecast Demand
 Existing Facilities Jacksonville International Airport (JIA) is served by a number of airside and landside facilities. There are two runways that serve the airport in an open V configuration. The Annual
Washington Dulles International Airport (IAD) Aircraft Noise Contour Map Update
 Aircraft Noise Contour Map Update") Washington Dulles International Airport (IAD) Aircraft Noise Contour Map Update Ultimate ASV, Runway Use and Flight Tracks 4th Working Group Briefing 8/13/18 Meeting Purpose Discuss Public Workshop input
Washington Dulles International Airport (IAD) Aircraft Noise Contour Map Update Ultimate ASV, Runway Use and Flight Tracks 4th Working Group Briefing 8/13/18 Meeting Purpose Discuss Public Workshop input
DRAFT FINAL REPORT AIRPORT MASTER PLAN. Rifle Garfield County Airport Revised May 15, 2014
 DRAFT FINAL REPORT AIRPORT MASTER PLAN Rifle Garfield County Airport Revised May 15, 2014 As required by Paragraph 425.B(4) of FAA Order 5100.38C, Airport Improvement Program (AIP) Handbook: The preparation
Norfolk International Airport
 Norfolk International Airport Master Plan Update Technical Advisory Committee Meeting #1 Community Advisory Committee Meeting #1 January 24, 2018 Agenda Project Background Introductions Overview of Airport
Tampa International Airport Master Plan Update. December 12, 2012
 Tampa International Airport Master Plan Update December 12, 2012 1 Prior Presentation Consolidated rental car and people mover Decongest curbsides and roadways Enable rental car growth Gain long term parking
Elevating the Upstate
 Greenville-Spartanburg Int l Airport Elevating the Upstate SC Economic Developers Association October 12, 2012 Introduction/Presentation Outline Introductions Airport Overview Air Service Terminal Improvement
Airport Master Plan. Rapid City Regional Airport. October 2015 FAA Submittal
 Airport Master Plan Rapid City Regional Airport October 2015 FAA Submittal Rapid City Regional Airport Master Plan Update Table of Contents Executive Summary... i Scope & Timeline... i Forecasts... i Preferred
Agenda: SASP SAC Meeting 3
 Agenda: SASP SAC Meeting 3 Date: 04/12/18 Public Involvement Plan Update Defining the System Recommended Classifications Discussion Break Review current system Outreach what we heard Proposed changes Classification
Prepared By: Mead & Hunt, Inc Port Lansing Road Lansing, MI 48906
 Master Plan The preparation of this document was financed in part through a planning grant from the Federal Aviation Administration (FAA) as provided under Section 505 of the Airport and Airway Improvement
ACTION TRANSMITTAL
 Transportation Advisory Board of the Metropolitan Council of the Twin Cities ACTION TRANSMITTAL 2018-16 DATE: February 9, 2018 TO: Transportation Advisory Board FROM: Technical Advisory Committee PREPARED
Forecast of Aviation Activity
 DETROIT METROPOLITAN WAYNE COUNTY AIRPORT FAR PART 150 NOISE COMPATIBILITY STUDY UPDATE CHAPTER B FORECAST OF AVIATION ACTIVITY Forecast of Aviation Activity Introduction This chapter summarizes past aviation
STUDY OVERVIEW MASTER PLAN GOALS AND OBJECTIVES
 INTRODUCTION An Airport Master Plan provides an evalua on of the airport s avia on demand and an overview of the systema c airport development that will best meet those demands. The Master Plan establishes
B GEORGIA INFRASTRUCTURE REPORT CARD AVIATION RECOMMENDATIONS DEFINITION OF THE ISSUE. Plan and Fund for the Future:
 2014 GEORGIA INFRASTRUCTURE REPORT CARD B + RECOMMENDATIONS Plan and Fund for the Future: While the system continues to enjoy excess capacity and increased accessibility it still needs continued focus
September Air Traffic Statistics. Prepared by the Office of Marketing & Consumer Strategy
 September 217 Air Traffic Statistics Prepared by the Office of Marketing & Consumer Strategy This report includes only data submitted by airlines as of the date of publication: November 15, 217. Reports
SPADE-2 - Supporting Platform for Airport Decision-making and Efficiency Analysis Phase 2
 - Supporting Platform for Airport Decision-making and Efficiency Analysis Phase 2 2 nd User Group Meeting Overview of the Platform List of Use Cases UC1: Airport Capacity Management UC2: Match Capacity
Optimized Profile Descents A.K.A. CDA A New Concept RTCA Airspace Working Group
 Optimized Profile Descents A.K.A. CDA A New Concept RTCA Presented to Environmental Working Group December 05, 2007 Outline RTCA Charter and Terms of Reference Objectives Membership and Organization Activities
According to FAA Advisory Circular 150/5060-5, Airport Capacity and Delay, the elements that affect airfield capacity include:
 4.1 INTRODUCTION The previous chapters have described the existing facilities and provided planning guidelines as well as a forecast of demand for aviation activity at North Perry Airport. The demand/capacity
Appendix D Project Newsletters. Tacoma Narrows Airport. Master Plan Update
 Appendix D Project Newsletters Tacoma Narrows Airport Master Plan Update This appendix contains the newsletters distributed throughout the project. These newsletters provided updates and information on
Aviation Insights No. 8
 Aviation Insights Explaining the modern airline industry from an independent, objective perspective No. 8 January 17, 2018 Question: How do taxes and fees change if air traffic control is privatized? Congress
Recommendations for Northbound Aircraft Departure Concerns over South Minneapolis
 Recommendations for Northbound Aircraft Departure Concerns over South Minneapolis March 21, 2012 Noise Oversight Committee Agenda Item #4 Minneapolis Council Member John Quincy Background Summer of 2011
Regional Jets ,360 A319/ , , , ,780
 Excel Tab Name: Seats (18 MAP) PASSENGER AIRLINE FLIGHT SCHEDULE CALCULATION RECORD Summary 17.2 MAP flight schedule* (with Southwest Airlines B737-800s changed to B737-700s) Number of Total Seats Avg.
Draft Concept Alternatives Analysis for the Inaugural Airport Program September 2005
 Section 10 Preferred Inaugural Airport Concept 10.0 Introduction The Preferred Inaugural Airport Concept for SSA was developed by adding the preferred support/ancillary facilities selected in Section 9
BNA Master Plan Update Community Advisory Committee Meeting No. 5
 A Six Sigma Organization BNA Master Plan Update Community Advisory Committee Meeting No. 5 September 19, 2012 Introductions MNAA Staff RW Armstrong Team Albersman & Armstrong, Ltd. Atkins North America,
The CLE Master Plan Includes:
 The CLE Master Plan Includes: An inventory of existing conditions Forecasting future demand and analyzing future needs Evaluating alternative development scenarios Preparing the Airport Layout Plan Preparing
3rd Quarter 2015 Minneapolis-St. Paul International Airport (MSP) Public Input Meeting
 Public Input Meeting") 3rd Quarter 2015 Minneapolis-St. Paul International Airport (MSP) Public Input Meeting Metropolitan Airports Commission Noise Program Office July 28, 2015 Meeting Goals To hear the views and concerns of
3rd Quarter 2015 Minneapolis-St. Paul International Airport (MSP) Public Input Meeting Metropolitan Airports Commission Noise Program Office July 28, 2015 Meeting Goals To hear the views and concerns of
APPENDIX E AVIATION ACTIVITY FORECASTS
 APPENDIX E AVIATION ACTIVITY FORECASTS E.1 PURPOSE AND CONTEXT This appendix presents the St. George Airport (SGU) aviation activity forecasts for the period of 2003 through 2020. Among the components
Executive Summary. MASTER PLAN UPDATE Fort Collins-Loveland Municipal Airport
 Executive Summary MASTER PLAN UPDATE Fort Collins-Loveland Municipal Airport As a general aviation and commercial service airport, Fort Collins- Loveland Municipal Airport serves as an important niche
Aviation, Rail, & Trucking 6-1
 6-1 This chapter describes the services, facilities, and condition of air, rail, and trucking as components of the transportation system. These three intermodal areas have an impact on the factors to be
Noise Oversight Committee
 Noise Oversight Committee March 18, 2015 Audio recordings are made of this meeting Noise Oversight Committee March 18, 2015 Item 1 Review and Approve Draft Meeting Minutes Minutes from January 21, 2015
 Existing Conditions AIRPORT PROFILE Passenger Terminal Complex 57 air carrier gates 11,500 structured parking stalls Airfield Operations Area 9,000 North Runway 9L-27R 6,905 Crosswind Runway 13-31 5,276
Bremerton National Airport Airport Master Plan Project Update February 12, 2013
 Bremerton National Airport Airport Master Plan Project Update February 12, 2013 Project Team Century West Engineering Northwest firm founded in 1969 500+ airport projects completed throughout the Pacific
BNA Master Plan Update Public Meeting No. 2
 A Six Sigma Organization BNA Master Plan Update Public Meeting No. 2 September 18, 2012 Agenda BNA Master Plan Update Consultants Status of the BNA Master Plan Update Workstation Boards Forecasts of Aviation
CHAPTER 4 DEMAND/CAPACITY ANALYSIS
 CHAPTER DEMAND/CAPACITY ANALYSIS INTRODUCTION The demand/capacity analysis examines the capability of the airfield system at Blue Grass Airport (LEX) to address existing levels of activity as well as determine
Table of Contents. Overview Objectives Key Issues Process...1-3
 Table of Contents Chapter One Introduction Overview...1-1 Objectives...1-1 Key Issues...1-2 Process...1-3 Chapter Two Inventory of Existing Conditions Airport Setting...2-1 Locale...2-1 Airport Surroundings...2-5
Presentation Outline. We will leave with:
 Presentation Outline We will leave with: Knowledge of work done to-date Awareness of the methodology and preliminary findings of the aviation demand forecasting Understanding of public outreach efforts
Alternatives. Introduction. Range of Alternatives
 Alternatives Introduction Federal environmental regulations concerning the environmental review process require that all reasonable alternatives, which might accomplish the objectives of a proposed project,
TABLE OF CONTENTS. Washington Aviation System Plan Update July 2017 i
 TABLE OF CONTENTS Chapter 1 Overview... 1-1 1.1 Background... 1-1 1.2 Overview of 2015 WASP... 1-1 1.2.1 Aviation System Performance... 1-2 1.3 Prior WSDOT Aviation Planning Studies... 1-3 1.3.1 2009 Long-Term
STAFF REPORT. Airport Land Use Plan Consistency Review: Santa Barbara Airport Master Plan. MEETING DATE: November 19, 2015 AGENDA ITEM: 7D
 STAFF REPORT SUBJECT: Airport Land Use Plan Consistency Review: Santa Barbara Airport Master Plan MEETING DATE: AGENDA ITEM: 7D STAFF CONTACT: Peter Imhof, Andrew Orfila RECOMMENDATION: Adopt findings
PUBLIC TRANSPORTATION INTRODUCTION
 PUBLIC TRANSPORTATION INTRODUCTION 1 OUTLINE Current Status and Recent Trends Significant Influences A Critical Assessment Arguments Supporting Public Transport Future Influences Ingredients for Future
Appendix M: 2007 Preliminary System Airport Assessments
 Appendix M: 2007 Preliminary System Airport Assessments M Regional System Airports Major Airport - Minneapolis-St. Paul International Airport Minneapolis-St. Paul International Airport Airside capacity
Dallas/Fort Worth International Airport Development Opportunities Southgate Plaza
 Dallas/Fort Worth International Airport Development Opportunities Southgate Plaza City of Dallas Economic Development Committee Briefing March 2, 2009 Business Overview Business Overview DFW s contribution
Corporate Productivity Case Study
 BOMBARDIER BUSINESS AIRCRAFT Corporate Productivity Case Study April 2009 Marketing Executive Summary» In today's environment it is critical to have the right tools to demonstrate the contribution of business
Airlake Airport 2035 Long Term Comprehensive Plan (LTCP)
") Airlake Airport 2035 Long Term Comprehensive Plan (LTCP) Public Informational Meetings August 9 & 10, 2017 Draft LTCP Overview Briefing Agenda Airport Role & Context Existing Conditions & Previous Plan
Airlake Airport 2035 Long Term Comprehensive Plan (LTCP) Public Informational Meetings August 9 & 10, 2017 Draft LTCP Overview Briefing Agenda Airport Role & Context Existing Conditions & Previous Plan
Chapter 1 Introduction
 Chapter 1 Introduction Introduction and Purpose The Airport Master Planning process evaluates an airport s physical facilities, establishes a forecast for future demand, and identifies a development plan
RNO Master Plan Approved Alternatives, Financial Analysis, and Facilities Implementation Plan
 RNO Master Plan Approved Alternatives, Financial Analysis, and Facilities Implementation Plan Project Schedule Today Slide 40 Project Vision To provide an achievable, flexible, fiscally, and environmentally
Dallas Love Field Update. Dallas City Council Briefing February 18, 2015
 Dallas Love Field Update Dallas City Council Briefing February 18, 2015 Purpose Construction Update Impacts of Wright Amendment Repeal Increase in operations/passengers/ projections Concessions performance
Denver International Airport Opportunities for Business
 Denver International Airport Opportunities for Business Presented to The DIA Way Small Business Opportunities Forum by Kim Day, Manager of Aviation August 31, 2009 1 Presentation Outline An Overview of
CHAPTER 1: INTRODUCTION
 CHAPTER 1: INTRODUCTION Purpose and Scope The information presented in this report represents the study findings for the 2016 Ronan Airport Master Plan prepared for the City of Ronan and Lake County, the
Chapter 1 EXECUTIVE SUMMARY
 Chapter 1 EXECUTIVE SUMMARY Contents Page Aviation Growth Scenarios................................................ 3 Airport Capacity Alternatives.............................................. 4 Air Traffic
Study Design Outline. Background. Overview. Desired Study Outcomes. Study Approach. Goals (preliminary) Recession History
 Recession History") MIA BASELINE ACTIVITY FORECASTS, DERIVATIVE DATA AND FLEET MIX PROJECTIONS RESULTS SUMMARY ACCEPTANCE BRIEFING FOR THE AIRPORT AND SEAPORT COMMITTEE (ASC) JULY 15, 2010 Study Design Outline Background
MIA BASELINE ACTIVITY FORECASTS, DERIVATIVE DATA AND FLEET MIX PROJECTIONS RESULTS SUMMARY ACCEPTANCE BRIEFING FOR THE AIRPORT AND SEAPORT COMMITTEE (ASC) JULY 15, 2010 Study Design Outline Background
Airport Master Plan for. Brown Field Municipal Airport PAC Meeting #3
 Airport Master Plan for Brown Field Municipal Airport PAC Meeting #3 Public Meeting #1 > 8/24/17 from 5:30 to 8:00 pm > 41 attendees signed-in > Comments: > EAA area > Environmental constraints > Focus
Fort Lauderdale Hollywood International Airport
 ATLANTA, GEORGIA 1 2 ATLANTA, GEORGIA Fort Lauderdale Hollywood International Airport Master Plan to Master Plan Implementation Jamie McCluskie Director of Aviation Planning & Environmental Broward County
AIRFIELD SAFETY IN THE UNITED STATES
 International Civil Aviation Organization 24/11/09 North American, Central American and Caribbean Office (NACC) Twenty Second Meeting of Directors of Civil Aviation of the Eastern Caribbean (E/CAR/DCA/22)