ECONOMIC IMPACT OF THE RELIEVER AIRPORTS
|
|
|
- Lisa Chandler
- 6 years ago
- Views:
Transcription


1 Metropolitan Airports Commission ECONOMIC IMPACT OF THE RELIEVER AIRPORTS Prepared for Prepared by April 3, 2018
2 Executive Summary The Metropolitan Airports Commission engaged InterVISTAS Consulting Inc. (InterVISTAS) to conduct an economic impact study to account for the operations of the six general aviation (GA) airports under its jurisdiction in the greater Minneapolis-St. Paul metropolitan area. Collectively, they are referred to as the MAC reliever airport system. This study updates a previous economic impact report prepared in 2005 and provides a current snapshot of the airport s economic contribution to the greater Minneapolis-St. Paul area. General aviation is defined as the operation of any type of aircraft certificated by the U.S. Federal Aviation Administration (FAA) other than those used for scheduled airline service, government or the military. General aviation aircraft include fixed-wing piston and turboprop airplanes, jets, helicopters, gliders, and hot-air balloons. General aviation covers everything from the personal use of aircraft by recreational pilots to operations of corporate aircraft to transport people and/or cargo for business purposes. The term general aviation also incorporates sight-seeing flights, aerial photography, air medical services, agriculture-related flights and flight training. The facilities primarily used by GA aircraft are commonly referred to as general aviation airports. The six general aviation airports that form the MAC reliever airport system are: Airlake Airport (LVN). Airlake Airport is located in Lakeville, a suburb south of the metropolitan area. It primarily serves private and recreational pilots on its single runway. Anoka County Blaine Airport (ANE). The airport is located in Blaine, directly north of the Twin Cities. In terms of the number of aircraft based at the airport, it is the largest in the reliever system, serving the most diverse assortment of aircraft, including recreational pilots, corporate and antique aircraft. Crystal Airport (MIC). Northwest of Minneapolis and adjacent to Brooklyn Park and Brooklyn Center, Crystal Airport has three paved and one turf runway and two non-precision instrument approaches. Flying Cloud Airport (FCM). Southwest of the metro area in the suburb of Eden Prairie, Flying Cloud Airport serves both corporate and recreational flying. It is the busiest airport in the reliever system based on the number of aircraft operations. Lake Elmo Airport (21D). East of the Twin Cities, Lake Elmo Airport provides easy access to the metropolitan region along with the scenic destinations along the St. Croix River. St. Paul Downtown Airport (STP). Near the banks of the Mississippi River and in the shadow of downtown St. Paul, this airport is the only airport in the reliever system with a runway longer than 5,000. These six airports complement the operations of Minneapolis-St. Paul International Airport (MSP) and serve as significant economic contributors to the region. Collectively, the airports play critical roles within the metropolitan area by facilitating economic development. They support direct employment and facilitate trade of goods and services, tourism, investment, and enhanced productivity. Individually, each airport supports a relatively large number of aircraft operations (takeoffs and landings). Individually, each airport not only serves both a particular local community, but also contributes as part of an integrated system to support the regional economy. Altogether in 2016, the reliever airports supported an average Metropolitan Airports Commission 2017 Reliever Airport System Economic Study i
3 of almost 900 operations each day or about 80 percent of the average number of daily operations at MSP. Overview of Economic Concepts Economic impact is a measure of the spending and employment associated with a sector of the economy, a specific project, or a change in government policy or regulation. Economic impact can be measured along several dimensions. The most common are: 1. - person years of employment supported (expressed in terms of full time equivalents or ). 1 Because many jobs may be only part-time or seasonal, the number of jobs is greater than the number of person years of employment. Hours worked in part-time and seasonal employment are translated into. 2. Earnings includes wages, salaries, and benefits associated with employment tied to the airport. 3. Economic output - the dollar value of industrial output produced. Sometimes referred to as economic activity, it reflects the spending (e.g., capital improvement plus revenue) by firms, organizations, and individuals. In the case of organizations that do not generate revenue (e.g., government-provided air traffic control services), annual operating expenses are counted. 4. Gross Domestic Product (). Sometimes referred to as Value Added, this is a measure of the money value of final goods and services produced as a result of economic activity. This measure is net of the value of intermediate goods and services used up to produce the final goods and services. The three major components of economic impact are classified as direct, indirect, and induced impacts. Direct impacts account for the economic activity of the aviation sector itself. In the case of an airport, all of those people who work in an aviation-related capacity either on-site or off-site would be considered direct employment (e.g., ground handling, air traffic controllers, etc.). At GA airports, typically the businesses that handle aircraft operations known as Fixed Base Operators (FBOs) -- account for the largest concentration of employment. Indirect impacts arise because of the direct impacts. For an airport, indirect impacts originate from off-site firms that supply goods or services to airport users. An example would be food wholesalers or restaurants that supply food for catering on flights. Induced impacts are those created by the spending of wages, salaries, and profits earned in the course of the direct and indirect economic activities. For instance, if a maintenance employee remodels his/her home, the renovation would support activity in the home construction industry. Visitor spending impacts. Another related economic impact that arises from the airport s operations flows from visitors to a region who arrive and depart via the airport rather than by other means (e.g., auto). The hospitality industry in particular benefits from visitors who spend money on lodging, meals, 1 One person year is equivalent to 1,800 hours of work. Person years are the same as. Metropolitan Airports Commission 2017 Reliever Airport System Economic Study ii


4 entertainment, car rentals, and retail. Direct employment associated with those industries is counted as part of the economic impacts of the airport. Total impacts are the sum of direct, indirect, induced, and visitor spending impacts. Figure ES-1 provides a graphical overview of economic impact at airports. Figure ES-1: Economic Overview Airports Economic of Ongoing Operations The economic impact of the MAC Reliever Airport System extends throughout the entire metropolitan region. Direct economic impact measures the factors directly associated with the six airports. This includes employment of all tenants located on the airports properties. The direct impacts of the reliever airport system in 2016 are estimated to be nearly 1,030 direct jobs (equivalent to approximately 870 direct or person years of employment), earning approximately $56 million in direct wages. Direct employment generates $198 million in direct and $355 million in direct economic output annually. Indirect economic impacts are those that are attributable to firms and organizations that supply goods and/or services to those directly involved in the airports and their operations. This measure accounts for the employment and economic activity that would not occur were it not for the operations of the reliever airports. All of these firms are located off airport properties, elsewhere in the metropolitan region. In 2016, the Ongoing Economic s of the MAC Reliever Airports Annual Direct s: 1,030 jobs 870 full-time equivalents $56 million in wages $198 million in gross domestic product () $355 million in economic output Metropolitan Airports Commission 2017 Reliever Airport System Economic Study iii
5 indirect impacts associated with the reliever airports operations included 670 indirect or person years of employment, earning approximately $44 million in wages. The extent of the airport s economic footprint reverberates throughout the region as employees in firms directly and indirectly associated with the airports spend their wages and salaries and generate another wave of economic activity. These rippled effects are known as the induced economic impacts of the airports operations. The induced impacts resulting from ongoing the reliever airports operations include an estimated 810 induced with an associated $36 million in wages. The total operational economic impact of the reliever airports operations on the region s economy is calculated by summing the direct, indirect and induced impacts from the airports operations. Table ES-1 summarizes the economic impact of the MAC reliever airport system s operations on the metropolitan region in Altogether, in 2016, the economic impacts include a total of 2,340 in the Minneapolis-St. Paul regional economy. Total regional income of all employees amounts to $136 million in wages. Furthermore, the airports operations contributed an estimated $370 million and $662 million in total and total economic output, respectively, to the regional economy. Table ES-1: Total Operational Economic of the Reliever Airport System s Operations, 2016 Direct 1, $56 $198 $355 Indirect $44 $100 $179 Induced $36 $72 $128 Total 2,750 2,340 $136 $370 $662 Note: figures (jobs and ) are rounded to the nearest ten. Totals may not sum due to rounding. Economic of Airport-Related Visitor Spending in the Region Individuals who visit the region via the reliever airports support additional economic impacts by spending their travel dollars locally. The economic impact of visitor spending depends on the total number of true visitors, the amount they spend, the length of stay, and the distribution of their spending across different categories mostly in the hospitality sector. Spending on hotels, restaurants, retail, and entertainment supports jobs and additional spending in the region. Little data is available on the number of visitors to the region who arrived via these airports. No government agency formally and systematically collects data on the number of travelers who use general aviation. The very nature of business aviation, which places a premium on anonymity, makes it difficult to gather data on passenger movements. Metropolitan Airports Commission 2017 Reliever Airport System Economic Study iv
6 Many airports may not have statistically reliable data on the total number of aircraft operations that occur at the airfield. Moreover, not every operation at an airport brings true visitors to the area. Some aircraft operations are local in nature, as opposed to itinerant. In general, local operations are those that occur within the immediate area, originating and returning to the same airport while itinerant operations originated at or were destined to land outside the area. Local operations basically do not bring visitors to the airport, but itinerant operations do. Each of the reliever airports sees a number of itinerant operations, and some of those airports experience large numbers of these flights. With those flights, some pilots and visitors might only stop for fuel or to take a break from flying. A sizeable percentage, however, will spend several hours in the area visiting friends or relatives or conducting business. Some visitors will stay a night or more in the area for personal or business reasons. In those cases, the activity at the airport supports additional economic activity in the local economies, most directly in the hospitality industry. (The impact of business aviation possibly including major business deals is impossible to measure but can clearly have broad and significant impacts on the local and regional economies.) The total economic impact of non-local visitor spending is shown in Table ES-2. Table ES-2: Total Economic of Reliever Airports Visitor Spending, 2016 Direct $15 $27 $48 Indirect $6 $12 $21 Induced $7 $13 $24 Total $27 $52 $94 Note: figures (jobs and ) are rounded to the nearest ten. Totals may not sum due to rounding. Consolidated Economic on the Region The sum of the impacts of the airport s ongoing operations and visitor spending constitute the reliever airports consolidated economic impact in the seven-county region. Table ES-3 summarizes these impacts. Metropolitan Airports Commission 2017 Reliever Airport System Economic Study v
 are rounded to the nearest ten. Totals may not sum due to rounding.")
7 Table ES-3: Consolidated Economic s of the Reliever Airports Operations and Visitor Spending, 2016 Total Direct 1,650 1,380 $71 $224 $403 Total Indirect $50 $112 $200 Total Induced 1, $43 $85 $153 Grand Total 3,660 3,100 $164 $421 $756 Note: figures (jobs and ) are rounded to the nearest ten. Totals may not sum due to rounding. Annual Tax s of Ongoing Operations In addition, ongoing operations at the reliever airport system s airports contribute to government revenue including those received by federal, state, and local governments. Total taxes paid on an annual basis, by airport employers and employees as well as passengers, are estimated at $27 million per year. The majority of taxes accrue to the federal government at 59 percent overall, while the State of Minnesota and local governments receive 41 percent of the tax revenue generated by the airport. These figures exclude any estimated taxes levied on corporate profits. Figure ES-2: Annual Estimated Tax Revenues of the Reliever Airports by Level of Government Metropolitan Airports Commission 2017 Reliever Airport System Economic Study vi
8 Contents Executive Summary... i 1 Introduction and Background... 9 The Greater Minneapolis-St. Paul Region General Aviation is a Substantial Economic Contributor The MAC Reliever Airport System Economic Defined Contributions to Local Governments from Airport Operations Overview of Methodology Economic of Airlake Airport Direct s Multiplier s Total Operational s Visitor s Consolidated s Tax Contributions from Airlake Airport Economic of Anoka County-Blaine Airport Direct s Multiplier s Total Operational s Visitor s Consolidated s Tax Contributions from Anoka County - Blaine Airport Economic of Crystal Airport Direct s Multiplier s Total Operational s Visitor s Consolidated s Tax Contributions from Crystal Airport Economic of Flying Cloud Airport Direct s Multiplier s Total Operational s Visitor s Consolidated s Tax Contributions from Flying Cloud Airport Economic of Lake Elmo Airport Direct s Multiplier s Total Operational s Visitor s Consolidated s Tax Contributions from Lake Elmo Airport Economic of St. Paul Downtown Airport Direct s Metropolitan Airports Commission 2017 Reliever Airport System Economic Study vii
9 Multiplier s Total Operational s Visitor s Consolidated s Tax Contributions from St. Paul Downtown Airport Summary of Economic Results Operational Economic s Economic s from Visitor Spending Consolidated Economic of the Reliever Airports Tax Revenue s Comparison of 2005 and 2016 Economic s Comment on Changes over Time Appendix: Methodology Estimating Current Economic Surveying Direct Inferring Estimating Indirect and Induced s with Economic Multipliers Study Time Frame versus Person Years of Visitor Spending Analysis Tax Analysis Glossary of Terms Metropolitan Airports Commission 2017 Reliever Airport System Economic Study viii
10 1 Introduction and Background The Metropolitan Airports Commission engaged InterVISTAS Consulting Inc. (InterVISTAS) to conduct an economic impact study to account for the operations of the six general aviation (GA) airports under its jurisdiction in the greater Minneapolis-St. Paul metropolitan area. Collectively, they are referred to as the MAC reliever airport system. This study updates a previous economic impact report prepared in 2005, and provides a current snapshot of the airport s economic contribution to the greater Minneapolis-St. Paul area. General aviation is defined as the operation of any type of aircraft certificated by the U.S. Federal Aviation Administration (FAA) other than those used for scheduled airline service, government or the military. General aviation aircraft include fixed-wing piston and turboprop airplanes, jets, helicopters, gliders, and hot-air balloons. General aviation covers everything from the personal use of aircraft by recreational pilots to operations of corporate aircraft to transport people and/or cargo for business purposes. The term general aviation also incorporates sight-seeing flights, aerial photography, air medical services, agriculture-related flights and flight training. The facilities primarily used by GA aircraft are commonly referred to as general aviation airports. The six general aviation airports that form the MAC reliever airport system are: Airlake Airport. Airlake Airport is located in Lakeville, a suburb south of the metropolitan area. It primarily serves private and recreational pilots on its single runway. Anoka County Blaine Airport. Directly north of the Twin Cities in Blaine, the airport is the largest in the reliever system, serving the most diverse assortment of aircraft, including recreational pilots, corporate and antique aircraft. Crystal Airport. Northwest of Minneapolis and adjacent to Brooklyn Park and Brooklyn Center, Crystal Airport has three paved and one turf runway and two non-precision instrument approaches. Flying Cloud Airport. Southwest of the metro area in the suburb of Eden Prairie, Flying Cloud Airport serves both corporate and recreational flying. It is one of the busiest airports in the reliever airport system. Lake Elmo Airport. East of the Twin Cities, Lake Elmo Airport provides easy access to the metropolitan region along with the scenic destinations along the St. Croix River. St. Paul Downtown Airport. Near the banks of the Mississippi River and in the shadow of downtown St. Paul, this airport is the only airport in the reliever system with a runway longer than 5,000. These six airports complement Minneapolis-St. Paul International Airport (MSP), which hosts both GA and commercial airline operations. The reliever airports provide alternative points of access to the metropolitan region for GA operators and help alleviate congestion in the airspace and on MSP s airfield. Collectively, the reliever airports play critical roles within the industry by facilitating the movement of people, goods, and services regionally, nationally, and internationally. The industry facilitates employment and economic development in the broader economy through mechanisms that include trade of goods and services, tourism, investment, and enhanced productivity. Metropolitan Airports Commission 2017 Reliever Airport System Economic Study 9

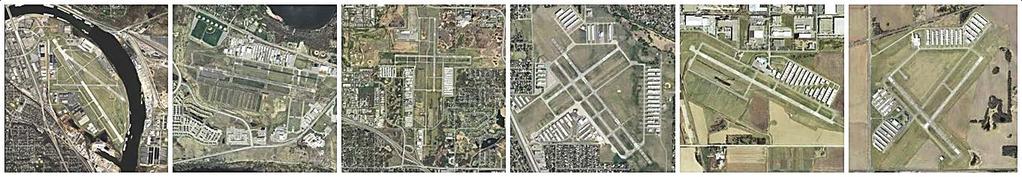
11 The aviation sector is a major economic generator, and airports play a critical role within the industry by facilitating the movement of people, goods, and services throughout the nation and world. The industry facilitates employment and economic development in the broader economy through a number of key mechanisms including tourism, investment, trade of goods and services, and productivity. The Greater Minneapolis-St. Paul Region One of the great metropolitan regions in the United States, Minneapolis, Saint Paul, and the neighboring communities, collectively referred to as the Twin Cities, is renowned for its exceptional quality of life. The area boasts a vibrant culture, tremendous recreational opportunities, beautiful natural surroundings, and a thriving diverse economy. According to data from the U.S. Bureau of Economic Analysis, as of 2015, the metropolitan area included a population of over 3.5 million. The region s population enjoys one of the highest per capita incomes in the nation (over $55,000). Total employment in the region exceeds 2.4 million jobs. The population is also recognized for being among the most highly educated in the nation. The diverse and growing regional economy features agriculture, food processing, computing, printing and publishing, large- and small-scale manufacturing, health care, arts and entertainment as well as medical instruments, education, and finance. The area is home to 17 Fortune 500 companies, including five Fortune 100 companies: UnitedHealth Group, Target, Best Buy, CHS, and 3M. The region also supports a large number of colleges and universities including the University of Minnesota and the University of St. Thomas. The area also hosts teams in five different major league professional sports: the Minnesota Twins, Minnesota Vikings, Minnesota Timberwolves, Minnesota Wild, and Minnesota United FC. St. Paul is the capital of Minnesota and is home to the Minnesota State Capitol, governor s mansion, and most buildings in the state government. The Metropolitan Airports Commission (MAC) operates one of the largest aviation systems in the United States, consisting of MSP and the six reliever airports in the metropolitan area. Figure 1-1 illustrates the location of all the MAC s airports in the Minneapolis-St. Paul (Twin Cities) metropolitan area. The core metropolitan area includes seven counties surrounding the Twin Cities: Anoka, Carver, Dakota, Hennepin, Ramsey, Scott, and Washington. This sevencounty metro region is home to a total population of over 3 million and 2.2 million jobs. Metropolitan Airports Commission 2017 Reliever Airport System Economic Study 10

12 Figure 1-1: MAC Airports in the Seven-County Metropolitan Area Source: InterVISTAS General Aviation is a Substantial Economic Contributor Airports make substantial contributions to local and regional economies. They facilitate the movement of people, goods, and services throughout the nation and the world, allowing the economy to operate more efficiently. Most people have had the experience of flying on commercial aircraft, and have encountered employees at the airport who make that possible. But relatively few have had first-hand experiences with general aviation, so their knowledge of this sector of the economy tends to be limited. GA operations are typically managed by private companies called fixed base operators (FBOs). An FBO is a commercial business authorized by the airport sponsor to operate on an airport and provide aeronautical services such as fueling, hangaring, tie-down and parking, aircraft rental, aircraft maintenance, flight instruction, etc. FBOs serve functions similar to terminals for commercial airline Metropolitan Airports Commission 2017 Reliever Airport System Economic Study 11
13 passengers. In addition to the functions directly related to servicing aircraft, they may include meeting spaces and food service. At smaller airports, these functions might be handled by the airport s management. Larger airports may have more than one FBO, and they compete for customers based on service offerings, amenities and prices. Most people flying to the Twin Cities and surrounding region use commercial aircraft, arriving and departing from Minneapolis-St. Paul International Airport (MSP). But for many others, whether flying for personal recreational purposes or for business, fly into one of the MAC reliever airports. GA also includes other activities. According to data from the FAA s most recent (2015) survey of GA, about half of all GA hours flown is for personal and business purposes. Others include instruction (flight training), aerial application of agricultural products, aerial observation, medical transport, air tours, and air taxi operations. 2 GA Activity Has Been Declining Nationally Nationally, GA activity has been declining. Data from the FAA show broad-based decreases in the number of GA pilots, the number of registered aircraft, and total annual and average flight hours. Since the last economic impact study of the reliever airports was completed in 2005, national-level measures of GA activity show that: The total number of aircraft has declined. From 2004 to 2015, the number of active GA aircraft declined by more than 9,000 aircraft, a loss of four percent. The number of active fixed-wing piston GA aircraft dropped by more than 24,000 (15 percent). Offsetting that decline, the number of active fixed-wing turboprop aircraft increased by over 1300 (16 percent) and the number of active fixed-wing turbojet aircraft increased by over 4,100 (45 percent). The number of active rotorcraft also increased. Turbine powered rotorcraft increased by nearly 2,700 (34 percent). GA hours flown in the U.S. have been declining since at least This is especially noticeable with piston aircraft traffic. Between 2004 and 2015, the total number of GA hours flown dropped by 14 percent. However, some GA sectors are growing. Hours flown by turboprop and turbojet aircraft, more often used for business rather than recreational purposes, increased by eight percent over the period. The FAA does not post data that show that change in the number of certificated active airmen back to (The FAA defines an active airman as one who holds both an airman certificate and a valid medical certificate. The term includes men and women certified as pilots, mechanics or other aviation technicians.) Nationally, since 2010, the number of certificated active airmen declined by more than 43,000 (7 percent). Of those, the number of individuals holding a private pilot s license dropped by 39,707 (20 percent). In Minnesota, FAA s data show that the number of people holding a private pilot s license declined over the same period by 15 percent. 2 Under federal regulations, certificated operators may provide on-demand air taxi (charter) services. FAA regulations cover specific requirements and limits relating to the size (passenger or cargo capacity) of the aircraft, its powerplant (piston or turboprop), qualifications of the flight crew, insurance, and management. Scheduled commercial operations and those using turboprop or jet engines are not included in the GA statistics. Metropolitan Airports Commission 2017 Reliever Airport System Economic Study 12
14 The MAC Reliever Airport System Each of the six reliever airports are described in general below. Airlake Airport Used primarily by recreational pilots, Airlake Airport (KLVN) has a single 4,098' x 75' runway and full length parallel taxiway. There is one fixed base operator at the airport, and no air traffic control tower. In 2016, the airport was home to 139 based aircraft 3 and had an estimated 38,618 flight operations (take off or departure). Anoka County-Blaine Airport The Anoka County Blaine Airport (KANE) was acquired by MAC in The airport is considered by the MAC to be a primary reliever airport for the main Minneapolis St. Paul International Airport (MSP). The airport has a non-federal aircraft control tower and two runways. Runway 9-27 is 5,000' x 100', and Runway is 4,855' x 100'. A precision approach is available on Runway 27. In 2016, the airport was home to 389 based aircraft and had an estimated 80,845 flight operations. More aircraft are based at this airport than at any other MAC reliever airports. Crystal Airport Northwest of Minneapolis and adjacent to Brooklyn Park and Brooklyn Center, Crystal Airport (KMIC) has three paved and one turf runway and two non-precision instrument approaches. The airport is served by a single FBO and has an FAA-operated air traffic control tower. In 2016, the airport was home to 164 based aircraft and had an estimated 36,967 flight operations. Flying Cloud Airport Flying Cloud Airport (KFCM) has a reputation for serving the needs of busy corporate executives and their flight crews. The airport has parallel runways (one 5,000 and the other 3,900 ) along with a 2,691 cross runway. It is served by multiple FBOs and a FAA-operated control tower and an instrument landing system. In 2016, the airport was home to 361 based aircraft and had an estimated 84,038 flight operations, making it the busiest of the six relievers. Lake Elmo Airport The airport (21D) is served by a fixed base operator and an aircraft maintenance provider. Lake Elmo Airport has two runways. Runway 14/32 is 2,850' x 75', and runway 4/22 measures 2,497' x 75.' There are two non-precision instrument approaches to the airport, which has no control tower. Fueling, flight training and aircraft maintenance services are available. In 2016, the airport was home to 194 based aircraft and had an estimated 27,275 flight operations. St. Paul Downtown Airport The airport (KSTP) has the longest runway of the reliever airports and is closest to downtown St. Paul. KSTP has three runways: Runway 14-32, with 6,491' x 150'; Runway 13-31, with 4004' x 150', and Runway 9-27, with 3,642' x 100'. The airport is served by two fixed-base operators and an FAA-operated air traffic control tower. In 2016, the airport was home to 82 based aircraft and had an estimated 54,548 3 Based aircraft are those permanently stored at one airport. Metropolitan Airports Commission 2017 Reliever Airport System Economic Study 13
15 flight operations. While this airport has the smallest number of based aircraft, its long runway and proximity to downtown St. Paul makes this airport uniquely able to serve large private aircraft. Figure 1-2: Total operations 180, , , , ,000 80,000 60,000 40,000 20,000 0 Flying Cloud Change in Total Annual Aircraft Operations 2004 vs St. Paul Downtown Anoka County- Blaine Crystal Lake Elmo Airlake Economic Defined Economic impact is a measure of the spending and employment associated with a sector of the economy, a specific project, or a change in government policy or regulation. Economic impact is most commonly measured along several dimensions. The most common are: 1. - person years of employment supported (expressed in terms of full time equivalents or ). Because many jobs may be only part-time or seasonal, the number of jobs is greater than the number of person years of employment. Hours worked in part-time and seasonal employment are translated into. 2. Earnings includes wages, salaries, and benefits associated with employment tied to the airport. 3. Economic output - the dollar value of industrial output produced. Sometimes referred to as economic activity, it reflects the spending (e.g., capital improvement plus revenue) by firms, organizations, and individuals. In the case of organizations that do not generate revenue (e.g., government-provided air traffic control services), annual operating expenses are counted. 4. Gross Domestic Product (). Sometimes referred to as Value Added, this is a measure of the money value of final goods and services produced as a result of economic activity. This Metropolitan Airports Commission 2017 Reliever Airport System Economic Study 14
16 measure is net of the value of intermediate goods and services used up to produce the final goods and services. The three major components of economic impact are classified as direct, indirect, and induced impacts. These classifications are used as a base for the estimation of total economic impact of an airport. Each of these three components requires different tools of analysis. impact analysis determines the economic impact in terms of jobs created and salaries and wages paid out. In the case of the airport, the direct, indirect, induced, and total number of person years of employment created at the airport is examined to produce a snapshot of airport operations. Direct impacts account for the economic activity of the aviation sector itself. Direct employment impacts are measured by counting those individuals who work in this particular sector of the economy. In the case of an airport, all of those people who work in an aviation-related capacity either on-site or off-site would be considered direct. At the reliever airports, a major source of employment are the Fixed Base Operators (FBOs). These are companies that have been granted the right by an airport (and the MAC) to operate at the airport and provide aeronautical services such as fueling, hangaring, tie-down and parking, aircraft rental or chartering, aircraft maintenance, flight instruction, de-icing and similar services. FBOs also take care of ground handling services, like towing and baggage handling, and other services, such as car rentals, hotel reservations and pilot lounges. Each of the reliever airports have at least one FBO. Several of the airports have multiple FBOs on the airfield. This allows both locally-based aircraft operators and visiting operators some choice for purchasing fuel and other handling services. Some FBOs may only sell limited types of fuel. Some may offer self-service fuel. Major Sources of Direct at the Reliever Airports Aviation Support Services. This includes employment with FBOs, aircraft maintenance, and related companies. Government Enterprises. Examples of employment related to government agencies and departments include the MAC, FAA, and CBP. Building Maintenance & Janitorial Work includes all employment associated with the maintenance and care of buildings on airport land. This includes cleaning, janitorial, and maintenance staff. Depending on the airport, there may also be air traffic control services provided on the airfield. Three of the reliever airports have air traffic control towers that are owned and operated by the FAA. Anoka County-Blaine Airport has air traffic control services provided by a private contractor, supported by funds from the FAA and MAC. The remaining two airports, Lake Elmo Airport and Airlake Airport, have no air traffic control towers. The MAC has staff assigned to support the reliever airports including maintenance staff, mechanics, and management and administrative personnel. Those staff s direct employment and economic effects are included as part of this analysis and allocated across each airport based on information provided by the MAC. Indirect impacts are the upstream impacts that arise because of the direct impacts. For an airport, indirect impacts originate from off-site firms that serve airport users. Indirect employment includes the portion of employment in supplier industries which are dependent on sales to the air transport sector. An example would be food wholesalers that supply food for catering on flights. Another example would be building suppliers that sell materials used for the construction of capital improvements (e.g., a renovated building or hangar). Metropolitan Airports Commission 2017 Reliever Airport System Economic Study 15

17 Induced impacts are economic impacts created by the spending of wages, salaries, and profits earned in the course of the direct and indirect economic activities. Induced employment is employment generated from expenditures by individuals employed indirectly or directly. For instance, if an airline maintenance firm employee decides to remodel his/her home, this would result in additional (induced) employment hours in the general economy. The home renovation project would support hours of induced employment in the construction industry, the construction materials industry, etc. Visitor spending impacts. Another related economic impact that arises from the airports operations flows from visitors to a region who arrive and depart via the airports rather than by other means (e.g., auto). The hospitality industry in particular benefits greatly from these visitors, who spend money on lodging, meals, entertainment, car rentals, and retail. Direct employment associated with those industries is counted as part of the economic impacts of the airport. The economic impacts associated with visitor spending are separately identified in this report. Some economic impact studies may incorporate these impacts into indirect impacts, but the project team accounts for them separately for technical econometric reasons. Clearly, MSP is the primary gateway to the Minneapolis-St. Paul region and millions of visiting passengers arrive and depart from the airport annually. While MSP welcomed approximately 37.5 million passengers in 2016, only a portion of these travelers can be considered true visitors to the region. In 2016, the total number of visitors to the region that arrived and departed via MSP exceeded 5 million. Domestic US visitors spent on average approximately $110 per day. Those averages include the effects of a sizeable portion of travelers who stay with friends and family during their visits, and thus tend to spend less. The estimated spending of domestic visitors at MSP is comparable to that found at other major U.S. airports, adjusting for differences in local costs. Some travelers who fly by GA come into MSP. But many use the reliever airports instead. Those airports offer the same direct access to the Twin Cities and its suburbs. This study accounts for the spending of those visitors who use the six reliever airports. Total impacts are the sum of direct, indirect, induced, and visitor spending impacts. A related aspect of the airports economic impact is the contributions that flow from the supported economic activity to different levels of government in the form of taxes and fees. Accounting for these airports contributions to the public sector is important as part of their comprehensive impact. Metropolitan Airports Commission 2017 Reliever Airport System Economic Study 16
18 Figure 1-3: Economic Overview - Airports Contributions to Local Governments from Airport Operations The operations and employment supported by each of the reliever airports contributes to governmental revenues. Revenue contributions are divided into the following groupings, based on the origins of the resulting impacts: Taxes Related to Employee Compensation. This category includes the federal, state, and local impacts of Social Insurance taxes paid by employers and employees at the reliever airports. It contains the tax impacts generated by retirement plans, temporary disability insurance, and workers compensation payments. These taxes contribute largely to federal government streams; however, smaller contributions are made to state and local governments as well. Taxes Related to Household Income. This category contains the personal tax impacts generated by households related to employment at the reliever airports. The federal impacts include all applicable personal income tax payments. The state and local impacts contain personal income tax payments, fines and fee charges, motor vehicles licensing fees, property taxes, and other applicable taxes. The federal government receives over two-thirds of the tax impacts in this category, while state and local governments share the remaining third. Other Taxes and Fees. These relate to taxes and fees that are paid by corporations to the local, state and federal levels of government. Overview of Methodology InterVISTAS conducted this study during the fall of 2017 based on operations and employment at the airport during calendar year To calculate the direct effects, the study team surveyed all employers associated with economic activity at each of the six airports (e.g., fixed base operators, government agencies, and other tenants) to determine the total number of individuals employed in directly-related occupations, as well as the total amount of earnings (wages) paid to those individuals. This included firms located both on-site at the airports and those located off-site. Metropolitan Airports Commission 2017 Reliever Airport System Economic Study 17
19 The team estimated the impact of spending by visitors to the region who arrived via the airport (as distinct from those who may have driven to the area). These were based on interviews with airport managers and the FBOs, who provided their best professional estimates of the volume of itinerant aircraft traffic, number of people on board, and other variables that drive visitor spending. The average amount spent by visitors varied by airport, due to differences in the mix of business and leisure traffic, the average number of individuals (including pilots and any flight crew) on arriving aircraft, the percentages of visitors who overnight in the region, and other differences in their spending patterns. The team derived the indirect and induced effects associated with the direct and visitor impacts by application of econometric multipliers, which model the behavior of this sector of the economy. The indirect and induced effects have been calculated using the U.S. Bureau of Economic Analysis s Regional Input- Modeling System (RIMS II). 4 To ensure consistency with other economic analyses completed for the MAC, the overall method used was the same applied to the estimate of the economic impact of Minneapolis-St. Paul International Airport. See the Appendix for a more detailed description of the study s methodology. 4 The U.S. Bureau of Economic Analysis s Regional Input- Modeling System (RIMSII) is a regional economic tool that measures the total economic impact of a region ( The model measures demand shocks on employment, earnings, value added, and total gross output, and is based on 2007 national benchmark input-output data and 2015 regional data. Metropolitan Airports Commission 2017 Reliever Airport System Economic Study 18
 is located in Dakota County, approximately 17 miles south of MSP, 20 miles south of the City of Minneapolis, and approximately 25 miles")
20 2 Economic of Airlake Airport Airlake Airport at a Glance Runways: 12/30, 4,099 * 75 Based Aircraft (2016): 139 Operations (2016): 36,618 Percent of Operations that are Itinerant: FAA estimate: 60% FBO estimate: 40% Number of FBOs: One Airlake Airport (LVN) is located in Dakota County, approximately 17 miles south of MSP, 20 miles south of the City of Minneapolis, and approximately 25 miles southwest of the City of St. Paul. The airport serves to relieve congestion at MSP by attracting general aviation traffic away from this larger airport. According to the draft final Airlake Airport Long-Term Comprehensive Plan (LTCP), 5 the airport s primary role is to serve personal, recreational, and business aviation users in the southern metropolitan areas of Dakota and Scott Counties. It is a complimentary reliever airport to MSP. Examples of business services provided at Airlake Airport include flight training, aircraft rentals, charter flights, aircraft management services, and medical flight transportation. Airlake Airport has one primary hangar storage area on the northeast side of the airport that provides approximately 136 indoor aircraft storage spaces. The MAC also has a maintenance structure at the airport. The GA community here is served by a single FBO. Direct s Based on responses to the employment survey by tenant organizations, the airport supports approximately 31 direct jobs. These jobs paid a total of about $0.9 million in wages. The total economic output of the direct employment was $4.1 million. 5 Metropolitan Airports Commission, Final Draft, Airlake Airport 2035 Long-Term Comprehensive Plan (LTCP), November 27, 2017, available at Aviation-Documents/Airlake_Airport_reduced_2035_LTCP_FINAL_DRAFT_Narr.aspx Metropolitan Airports Commission 2017 Reliever Airport System Economic Study 19
21 Table 2.1: Direct Economic s of Airlake Airport Direct $0.9 $2.3 $4.1 Multiplier s The direct economic impacts drive additional economic effects via their relationships with supplier industries and by stimulating spending in the local economy. Combined, these multiplier impacts substantially add to the effect from direct employment. Table 2.2 summarizes the combined indirect and induced economic impacts that flow from the operations of Airlake Airport. Table 2.2: Multiplier s from Airlake Airport Multiplier 22 8 $1.0 $2.1 $3.7 Total Operational s The total impacts of airport are calculated by adding the direct and multiplier impacts. Table 2.3 summarizes the total employment impact of the airport. Table 2.3: Total s from Airlake Airport Total $1.9 $4.4 $7.8 Note: Earlier tables may not sum to these totals due to rounding. Metropolitan Airports Commission 2017 Reliever Airport System Economic Study 20

22 Visitor s Total operations at LVN in 2016 approached 37,000. Based on estimates from the FAA and interviews with the FBO and airport management, the project team estimated that about 59 percent of those operations were itinerant. Allowing for some small percentage of those operations to be gas-and-go types of flights (where the aircraft lands and only takes on fuel without any other local purchase), there was an estimated flights at the airports where visitors spent money locally. According to information from the FBO, the majority of those visitors were for less than a day (i.e., the visitors did not spend the night in the area.) An estimated 20 percent of visitors spent the night. The total amount spent by visitors reflects a combination of the two, along with some catering sold by the FBO. Visitor spending at Airlake Airport is summarized in the table below. Table 2.4: Key Visitor Metrics Consolidated s The consolidated economic impact of Airlake Airport sums the total employment impact with that from visitor spending. In 2016, the operations at Airlake Airport supported a total of 104 jobs (38 ), which paid a total of $3.5 million in wages. The total economic output that the airport stimulated was $13.2 million, with roughly $7.4 million in gross domestic product. Table 2.5: Consolidated Economic s of Airlake Airport Consolidated $3.5 $7.4 $13.2 Note: Earlier tables may not sum to these totals due to rounding. Tax Contributions from Airlake Airport As a result of the operations of Airlake Airport, state and local governments gained approximately $57,000 in tax revenues. In addition, federal tax revenue amounted to approximately $211,000. Altogether, this includes tax contributions for social insurance programs, income taxes, and other government-imposed fees and charges. Metropolitan Airports Commission 2017 Reliever Airport System Economic Study 21
 has played an important role in the Twin Cities since the airport was")
23 3 Economic of Anoka County-Blaine Airport Anoka County Blaine Airport at a Glance Runways: 9/27, 5,000' x 100' 18/36, 4,855' x 100' Based Aircraft (2016): 389 Operations (2016): 80,845 Percent of Operations that are Itinerant: FAA estimate: 48% FBO estimate: 40% Number of FBOs: Two The Anoka County Blaine Airport (KANE) has played an important role in the Twin Cities since the airport was acquired by MAC in The airport is located in the southern part of Anoka County and the City of Blaine, approximately 12 miles from downtown Minneapolis and 12 miles from downtown St. Paul. According to the 2010 long-term comprehensive plan prepared for Anoka County Blaine Airport, 6 the MAC considers that airport s primary role to be as a primary reliever airport for MSP. Anoka County Blaine Airport has its own air traffic control tower that is normally open for 14 to 15 hours daily, depending on the season. When the tower is not open, air navigation services are provided by the FAA s local terminal area traffic control facility (TRACON). Two FBOs are onsite to provide services for local and itinerant traffic. The airport also has hangars and a MAC maintenance and equipment storage facility. Anoka County Blaine Airport was the second busiest of all of the six reliever airports in 2016 in terms of total flight operations. 6 Metropolitan Airports Commission, Anoka County - Blaine Airport (ANE), Final Adoption by MAC June 2010, available at LTCP-DOCUMENT.pdf Metropolitan Airports Commission 2017 Reliever Airport System Economic Study 22
24 Direct s Based on responses to the employment survey by tenant organizations, the airport supports approximately 130 direct jobs. These jobs paid about $6 million in wages. The total economic output of the direct employment was $55 million. Table 3.1: Direct Economic s of Anoka County Blaine Airport Direct $6 $30 $55 Multiplier s The direct economic impacts drive additional economic effects via their relationships with supplier industries and by stimulating spending in the local economy. Combined, these multiplier impacts substantially add to the effect from direct employment. Table 3.2 summarizes the combined indirect and induced economic impacts that flow from the operations of Anoka County - Blaine Airport. Table 3.2: Multiplier s from Anoka County - Blaine Airport Multiplier $11 $25 $46 Total Operational s The total impacts of airport are calculated by adding the direct and multiplier impacts. Table 3.3 summarizes the total employment impact of the airport Metropolitan Airports Commission 2017 Reliever Airport System Economic Study 23

25 Table 3.3: Total s from Anoka County Blaine Airport Total $17 $55 $101 Note: Earlier tables may not sum to these totals due to rounding. Visitor s Total operations at ANE in 2016 exceeded 80,000 in Based on estimates from the FAA and interviews with the FBO and airport management, the project team estimated that slightly under half of those operations (about 48 percent) were itinerant. Allowing for some small percentage of those operations to be gas-and-go types of flights (where the aircraft lands and only takes on fuel without any other local purchase), there was an estimated departures from the airports where visitors had spent money locally. According to information from the FBO, about two-thirds of those visitors were for less than a day (i.e., the visitors did not spend the night in the area.) The remaining third of visitors spent the night. The total amount spent by visitors reflects a combination of the two, along with some catering sold by the FBO. The total number of visitors who spent money in the region in 2016 was nearly 74,000, and the total estimated amount spent was more than $8.5 million. Visitor spending at Anoka County - Blaine Airport is summarized in the table below. Table 3.4: Estimated Visitors and Total Amount Spent Consolidated s The consolidated economic impact of Anoka County - Blaine Airport sums the total employment impact with that from visitor spending. In 2016, the operations at the airport supported a total of 560 jobs (460 ), which paid a total of $22 million in wages. The total economic output that the airport stimulated was $118 million, with roughly $65 million in gross domestic product. Metropolitan Airports Commission 2017 Reliever Airport System Economic Study 24
26 Table 3.5: Consolidated Economic s of Anoka County - Blaine Airport Consolidated $22 $65 $118 Note: Earlier tables may not sum to these totals due to rounding. Tax Contributions from Anoka County - Blaine Airport As a result of the operations of Anoka County - Blaine Airport, state and local governments gained approximately $1.0 million in tax revenues. In addition, federal tax revenue amounted to approximately $1.9 million. Altogether, this includes tax contributions for social insurance programs, income taxes, and other government-imposed fees and charges. Metropolitan Airports Commission 2017 Reliever Airport System Economic Study 25
: 36,967 Percent of Operations that are Itinerant: FAA estimate: 56% FBO estimate: 20% Number of FBOs: Two Crystal Airport is located in Hennepin County, approximately seven miles northwest of")
27 4 Economic of Crystal Airport Crystal Airport at a Glance Runways: 14L/32R, 3,268' x 75' 14R/32L, 3,267' x 75' 6L/24R, 2,500 x 75 6R/24L, 2,153 x 150 (turf) Based Aircraft (2016): 164 Operations (2016): 36,967 Percent of Operations that are Itinerant: FAA estimate: 56% FBO estimate: 20% Number of FBOs: Two Crystal Airport is located in Hennepin County, approximately seven miles northwest of downtown Minneapolis. It lies within the City of Crystal, with small portions of airport property overlapping into the City of Brooklyn Park and the City of Brooklyn Center. It is the closest MAC airport to downtown Minneapolis. According to the airport s draft 2016 long-term comprehensive plan, 7 Crystal Airport s primary role is to serve personal, recreational, and some business aviation users in the northwest metropolitan area, including the cities of Crystal, Brooklyn Park, Brooklyn Center, and Minneapolis. Example business services include flight training, aircraft rentals, charter flights, aircraft and propeller maintenance, sale of aircraft avionics and parts, and medical flight transportation. The airport is a complimentary reliever to MSP. The airport is primarily designed to be used by small, propeller-driven airplanes with fewer than 10 passenger seats. Crystal Airport is served by two FBOs. The airport also has numerous hangar facilities and a MAC maintenance facility. 7 Metropolitan Airports Commission, Draft Crystal Airport, 2035 Long-Term Comprehensive Plan (LTCP), Narrative Report, September 12, 2016, available at Aviation/Airports/Crystal.aspx. Metropolitan Airports Commission 2017 Reliever Airport System Economic Study 26
28 Direct s Based on responses to the employment survey by tenant organizations, the airport supports approximately 100 direct jobs. These jobs paid a total of about $4 million in wages. The total economic output of the direct employment was $35 million. Table 4.1: Direct Economic s of Crystal Airport Direct $4 $21 $35 Multiplier s The direct economic impacts drive additional economic effects via their relationships with supplier industries and by stimulating spending in the local economy. Combined, these multiplier impacts substantially add to the effect from direct employment. Table 4.2 summarizes the combined indirect and induced economic impacts that flow from the operations of Crystal Airport. Table 4.2: Multiplier s from Crystal Airport Multiplier $8 $18 $30 Total Operational s The total impacts of airport are calculated by adding the direct and multiplier impacts. Table 4.3 summarizes the total employment impact of the airport. Metropolitan Airports Commission 2017 Reliever Airport System Economic Study 27

29 Table 4.3: Total s from Crystal Airport Total $12 $39 $66 Note: Earlier tables may not sum to these totals due to rounding. Visitor s Total operations at MIC in 2016 approached 37,000. Based on estimates from the FAA and interviews with the FBO and airport management, the project team estimated that over half -- about 56 percent -- of those operations were itinerant. Allowing for some small percentage of those operations to be gas-andgo types of flights (where the aircraft lands and only takes on fuel without any other local purchase), there was an estimated 8,800 departures from the airports where visitors spent money locally. The project team estimated that about two-thirds of those visitors were on the ground for less than a day (i.e., the visitors did not spend the night in the area.) The remaining two-thirds of the visitors spent the night. The total number of visitors who spent money in the region in 2016 was just under 20,000, and the total estimated amount spent was about $2.4 million. Visitor spending at Crystal Airport is summarized in the table below. Table 4.4: Estimated Visitors and Total Amount Spent Consolidated s The consolidated economic impact of Crystal Airport sums the total employment impact with that from visitor spending. In 2016, the operations at Crystal Airport supported a total of 320 jobs (250 ), which paid a total of $14 million in wages. The total economic output that the airport stimulated was $71 million, with roughly $41 million in gross domestic product. Metropolitan Airports Commission 2017 Reliever Airport System Economic Study 28
30 Table 4.5: Consolidated Economic s of Crystal Airport Consolidated $14 $41 $71 Note: Earlier tables may not sum to these totals due to rounding. Tax Contributions from Crystal Airport As a result of the operations of Crystal Airport, state and local governments gained approximately $0.7 million in tax revenues. In addition, federal tax revenue amounted to approximately $1.6 million. Altogether, this includes tax contributions for social insurance programs, income taxes, and other government-imposed fees and charges. Metropolitan Airports Commission 2017 Reliever Airport System Economic Study 29

31 5 Economic of Flying Cloud Airport Flying Cloud Airport at a Glance Runways: 10R/28L, 5,000' x 100' 10L/28R, 3,898' x75' 18/36, 2,690 x 75 Based Aircraft (2016): 361 Operations (2016): 84,038 Percent of Operations that are Itinerant: FAA estimate: 60% FBO estimate: 70% Number of FBOs: Six The airport is located in Hennepin County, in the south-central area of the City of Eden Prairie, approximately 14 miles from downtown Minneapolis. Its location in the southwest suburbs allow businesses to consider it an important part of their local operations. The MAC considers the airport to be a primary reliever airport for MSP. According to the 2010 long term comprehensive plan, 8 the airport is designed to accommodate aircraft with wingspans less than 79 feet. Aircraft that fall into this category include most single engine and twin piston aircraft and smaller regional and corporate jets. Flying Cloud Airport has its own air traffic control tower that is owned and operated by the FAA. During the times when it is open, it provides air traffic control services. When the tower is closed, air navigation services are provided by Minneapolis Terminal Radar Approach Control (TRACON) located at Minneapolis-St. Paul International Airport and assisted by the Flight Service Station (FSS) at Princeton, Minnesota. The airport is served by six FBOs that offer both outdoor and indoor storage for aircraft. The airport also has other hangar storage areas that are not a part of existing FBO facilities. The MAC also has two maintenance and storage facilities at the airport. Flying Cloud Airport was the busiest of all of the six reliever airports in 2016 in terms of total flight operations. The extension of runway 10R/28L to 5,000 in 2010 enabled the airport to accommodate larger aircraft than previously. 8 Metropolitan Airports Commission, Flying Cloud Airport, Long Term Comprehensive Plan Update FINAL, October 2010, available at Cloud.aspx Metropolitan Airports Commission 2017 Reliever Airport System Economic Study 30
32 Direct s Based on responses to the employment survey by tenant organizations, the airport supports approximately 340 direct jobs. These jobs paid a total of about $18 million in wages. The total economic output of the direct employment was $104 million. Table 5.1: Direct Economic s of Flying Cloud Airport Direct $18 $58 $104 Multiplier s The direct economic impacts drive additional economic effects via their relationships with supplier industries and by stimulating spending in the local economy. Combined, these multiplier impacts substantially add to the effect from direct employment. Table 5.2 summarizes the combined indirect and induced economic impacts that flow from the operations of Flying Cloud Airport. Table 5.2: Multiplier s from Flying Cloud Airport Multiplier $24 $50 $90 Total Operational s The total impacts of airport are calculated by adding the direct and multiplier impacts. Table 5.3 summarizes the total employment impact of the airport Metropolitan Airports Commission 2017 Reliever Airport System Economic Study 31

33 Table 5.3: Total s from Flying Cloud Airport Total $41 $107 $194 Note: Earlier tables may not sum to these totals due to rounding. Visitor s Total operations at FCM in 2016 exceeded 84,000, the most of all six MAC reliever airports. Based on estimates from the FAA and interviews with the FBO and airport management, the project team estimated that nearly 60 percent of those operations were itinerant. Allowing for some small percentage of those operations to be gas-and-go types of flights (where the aircraft lands and only takes on fuel without any other local purchase), there was an estimated 21,400 flight departures from the airport where visitors spent money locally. According to information from the FBOs, about 60 percent of those visitors spent less than a day (i.e., the visitors did not spend the night in the area.). The remaining 40 percent of visitors spent the night. The total number of visitors who spent money in the region in 2016 was over 115,000, and the total estimated amount spent was over $18 million. Visitor spending at Flying Cloud Airport is summarized in the table below. Table 5.4: Estimated Visitors and Total Amount Spent Consolidated s The consolidated economic impact of Flying Cloud Airport sums the total employment impact with that from visitor spending. In 2016, the operations at Flying Cloud Airport supported a total of 1,190 jobs (1,040 ), which paid a total of $52 million in wages. The total economic output that the airport stimulated was $229 million, with roughly $127 million in gross domestic product. Metropolitan Airports Commission 2017 Reliever Airport System Economic Study 32
34 Table 5.5: Consolidated Economic s of Flying Cloud Airport Consolidated 1,190 1,040 $52 $127 $229 Note: Earlier tables may not sum to these totals due to rounding. Tax Contributions from Flying Cloud Airport As a result of the operations of Flying Cloud Airport, state and local governments gained approximately $2.6 million in tax revenues. In addition, federal tax revenue amounted to approximately $4.2 million. Altogether, this includes tax contributions for social insurance programs (i.e., Social Security, unemployment insurance, Medicare, the Pension Benefit Guaranty Corporation program, and the Railroad Retirement Board program), income taxes, and other government-imposed fees and charges. Metropolitan Airports Commission 2017 Reliever Airport System Economic Study 33

35 6 Economic of Lake Elmo Airport Lake Elmo Airport at a Glance Runways: 14/32, 2849 x 75 4/22, 2,496' x 75' Based Aircraft (2016): 194 Operations (2016): 27,275 Percent of Operations that are Itinerant: FAA estimate: 39% FBO estimate: 5% Number of FBOs: One Lake Elmo Airport is located in Washington County, approximately 12 miles east of the downtown Saint Paul business district. According to the 2016 long-term comprehensive plan for Lake Elmo Airport, 9 the MAC believes the primary role of Lake Elmo Airport is to accommodate personal, recreational, and some business aviation users within Washington County and the eastern portion of the metropolitan area. Example business services provided at the airport include flight training and aircraft maintenance. The aircraft that normally use the airport on a regular basis are small, propeller-driven airplanes with fewer than 10 passenger seats. The airport is a complimentary reliever to MSP. The airport is home to a single FBO. The airport also has two main hangar storage areas and a MAC maintenance building. Of the six MAC reliever airports, Lake Elmo Airport is the quietest in terms of flight operations (takeoffs and landings). In 2016, the airport recorded an estimated 27,000 operations, an equivalent of about 75 per day. Direct s Based on responses to the employment survey by tenant organizations, the airport supports approximately 14 direct jobs. These jobs paid a total of about $0.4 million in wages. The total economic output of the direct employment was $5.8 million. 9 Metropolitan Airports Commission, Lake Elmo Airport, 2035 Long-Term Comprehensive Plan (LTCP), Volume 1 Narrative Report, Final MAC Adoption September 2016, available at Documents/Lake_Elmo_Airport_2035_LTCP_FINAL_Narrative_Re-(2).aspx Metropolitan Airports Commission 2017 Reliever Airport System Economic Study 34
36 Table 6.1: Direct Economic s of Lake Elmo Airport Direct $0.4 $3.2 $5.8 Multiplier s The direct economic impacts drive additional economic effects via their relationships with supplier industries and by stimulating spending in the local economy. Combined, these multiplier impacts substantially add to the effect from direct employment. Table 6.2 summarizes the combined indirect and induced economic impacts that flow from the operations of Lake Elmo Airport. Table 6.2: Multiplier s from Lake Elmo Airport Multiplier $1.2 $2.6 $4.8 Total Operational s The total impacts of airport are calculated by adding the direct and multiplier impacts. Table 6.3 summarizes the total employment impact of the airport. Table 6.3: Total s from Lake Elmo Airport Total $1.7 $5.8 $10.6 Note: Earlier tables may not sum to these totals due to rounding. Metropolitan Airports Commission 2017 Reliever Airport System Economic Study 35
37 Visitor s Total operations at 21D in 2016 exceeded 27,000. Based on estimates from the FAA and interviews with the FBO and airport management, the project team estimated that less than 40 percent of those operations were itinerant. Allowing for some small percentage of those operations to be gas-and-go types of flights (where the aircraft lands and only takes on fuel without any other local purchase), there was an estimated 4,500 flights at the airports where visitors spent money locally. According to information from the FBO, the vast majority of those visitors were for less than a day (i.e., the visitors did not spend the night in the area). Only about five percent of visitors spent the night. The total number of visitors who arrived at Lake Elmo Airport was slightly above 10,000, and the total amount spent by those visitors was nearly $1.1 million. Visitor spending at Lake Elmo Airport is summarized in the table below. Table 6.4: Estimated Visitors and Total Amount Spent Consolidated s The consolidated economic impact of Lake Elmo Airport sums the total employment impact with that from visitor spending. In 2016, the airport s operations supported a total of 60 jobs (42 ), which paid a total of $2.3 million in wages. The total economic output that the airport stimulated was $12.8 million, with roughly $7.0 million in gross domestic product. Table 6.5: Consolidated Economic s of Lake Elmo Airport Consolidated $2.3 $7.0 $12.8 Note: Earlier tables may not sum to these totals due to rounding. Tax Contributions from Lake Elmo Airport As a result of the operations of Lake Elmo Airport, state and local governments gained approximately $49,000 in tax revenues. In addition, federal tax revenue amounted to approximately $174,000. Altogether, this includes tax contributions for social insurance programs, income taxes, and other government-imposed fees and charges. Metropolitan Airports Commission 2017 Reliever Airport System Economic Study 36
38 7 Economic of St. Paul Downtown Airport The St. Paul Downtown Airport (STP), also known as Holman Field, is located just five minutes from the St. Paul business center and 15 minutes from downtown Minneapolis. Along with Flying Cloud Airport and Anoka County Blaine Airport, the MAC considers STP to be one of the primary relievers for the Minneapolis St. Paul International Airport. Two FBOs serve the airport. The FBOs provide indoor storage for aircraft. On a limited basis, they may park aircraft outside on their apron areas but generally, airplanes are housed indoors. St. Paul Downtown Airport at a Glance Runways: 14/32, 6,491 x /31, 4,004' x 150' 9/27, 3,642 x 100 Based Aircraft (2016): 82 The MAC also owns several structures on the airport property. These include the original administration building that was constructed in That building formerly hosted the air traffic control facility until the replacement opened in The MAC also owns several maintenance and storage buildings. U.S. Customs and Border Protection operate out of the administration building when clearance is needed for international flights. Number of FBOs: Two Aircraft based at and using the airport includes primarily business jets, but also single-engine, twin-engine piston and turbo props, helicopters and military aircraft (primarily helicopters). It is assumed that flights in and out of the airport are of both a business and a recreational nature. The airport s longest runway allows for operations of relatively large corporate jet aircraft, with wingspans of up to 118. Of all of the MAC reliever airports, STP has the longest runway. This enables it to handle larger aircraft than any of the other relievers. Direct s Operations (2016): 54,548 Percent of Operations that are Itinerant: FAA estimate: 64% FBO estimate: 50% Based on responses to the employment survey by tenant organizations, the airport supports approximately 410 direct jobs. These jobs paid a total of about $27 million in wages. The total economic output of the direct employment was $150 million. Metropolitan Airports Commission 2017 Reliever Airport System Economic Study 37
39 Table 7.1: Direct Economic s of St. Paul Downtown Airport Direct $27 $84 $150 Multiplier s The direct economic impacts drive additional economic effects via their relationships with supplier industries and by stimulating spending in the local economy. Combined, these multiplier impacts substantially add to the effect from direct employment. Table 7.2 summarizes the combined indirect and induced economic impacts that flow from the operations of St. Paul Downtown Airport. Table 7.2: Multiplier s from St. Paul Downtown Airport Multiplier $35 $75 $133 Total Operational s The total impacts of airport are calculated by adding the direct and multiplier impacts. Table 7.3 summarizes the total employment impact of the airport Table 7.3: Total s from St. Paul Downtown Airport Total 1,160 1,030 $62 $159 $283 Note: Earlier tables may not sum to these totals due to rounding. Metropolitan Airports Commission 2017 Reliever Airport System Economic Study 38
40 Visitor s Total operations at STP in 2016 approached 55,000. Based on estimates from the FAA and interviews with the FBO and airport management, over 64 percent of those operations were itinerant. Allowing for some small percentage of those operations to be gas-and-go types of flights (where the aircraft lands and only takes on fuel without any other local purchase), there were nearly 15,000 flights at the airports where visitors spent money locally. According to information from the FBOs, the majority of those visitors spent less than a day in the (i.e., the visitors did not spend the night in the area.) About 25 percent of visitors spent the night. The total amount spent by visitors reflects a combination of the two, along with some catering sold by the FBO. Because the aircraft that make itinerant operations at STP tend to carry relatively large numbers of individuals, the total number of visitors attributed to STP was nearly 90,000. These visitors spent over $15 million locally. Table 7.4: Estimated Visitors and Total Amount Spent Consolidated s The consolidated economic impact of St. Paul Downtown Airport sums the total employment impact with that from visitor spending. In 2016, the operations at STP supported a total of 1,430 jobs (1,260 ), which paid a total of $70 million in wages. The total economic output that the airport stimulated was $312 million, with roughly $174 million in gross domestic product. Table 7.5: Consolidated Economic s of St. Paul Downtown Airport Consolidated 1,430 1,260 $70 $174 $312 Note: Earlier tables may not sum to these totals due to rounding. Tax Contributions from St. Paul Downtown Airport As a result of the operations of St. Paul Downtown Airport, state and local governments gained approximately $6.7 million in tax revenues. In addition, federal tax revenue amounted to approximately $8.1 million. Altogether, this includes tax contributions for social insurance programs, income taxes, and other government-imposed fees and charges. Metropolitan Airports Commission 2017 Reliever Airport System Economic Study 39
 are attributable to direct employment.")
41 8 Summary of Economic Results Operational Economic s The ongoing operations at the six MAC reliever airports support a total of 2,750 jobs (2,340 or person years of employment) in the state, including multiplier impacts. Of this total employment figure, 1,030 jobs (870 ) are attributable to direct employment. As jobs related to the airport extend far beyond its boundaries, the bottom line total also includes approximately 780 additional indirect jobs (670 ) and 950 induced jobs (810 ). The statewide economy benefits significantly from the day-to-day operations of the airports. Annually, the airports contribute an estimated total of $370 million in, alongside an estimated $662 million in economic output. All impacts relating to employment, wages,, and output are illustrated in Table 8-1. Table 8-1: Total Economic s of MAC Reliever Airports Operations, 2016 ($ Millions) ($ Millions) ($ Millions) Direct 1, $56 $198 $355 Indirect $44 $100 $179 Induced $36 $72 $128 Total 2,750 2,340 $136 $370 $662 Note: figures (jobs and ) are rounded to the nearest ten. Totals may not sum due to rounding. Metropolitan Airports Commission 2017 Reliever Airport System Economic Study 40
42 Economic s from Visitor Spending Individuals who visit the region via the reliever airports support additional economic impacts by spending their travel dollars locally. The economic impact of visitor spending depends on the total number of true visitors, the amount they spend, the length of stay, and the distribution of their spending across different categories mostly in the hospitality sector. Spending on hotels, restaurants, retail, and entertainment supports jobs and additional spending in the region. Table 8-2 summarizes the total impacts from non-local visitor spending affiliated with the reliever airports. In 2016, visitor spending across all six airports amounted to $48 million, which in turn supported 620 direct jobs (520 ) and $15 million in direct wages. With multiplier impacts included, the total economic impact from visitor spending includes 910 total jobs (760 ) and $27 million in total wages. Table 8-2: Total Economic of Visitor Spending at the Reliever Airports, in 2016 ($ Millions) ($ Millions) ($ Millions) Direct $15 $27 $48 Indirect $6 $12 $21 Induced $7 $13 $24 Total $27 $52 $94 Note: figures (jobs and ) are rounded to the nearest ten. Totals may not sum due to rounding. Consolidated Economic of the Reliever Airports The total economic impact associated with the MAC reliever airports operations and visitor spending in 2016 was approximately 3,660 jobs, with wages and earnings of $164 million. The total contribution to the region s was approximately $421 million, with a total economic output of $756 million, as shown in Table 8-3. Metropolitan Airports Commission 2017 Reliever Airport System Economic Study 41
43 Table 8-3: Consolidated Economic s of MAC Reliever Airports Operations and Visitor Spending, 2016 ($ Millions) ($ Millions) ($ Millions) Total Direct 1,650 1,380 $71 $224 $403 Total Indirect $50 $112 $200 Total Induced 1, $43 $85 $153 Grand Total 3,660 3,100 $164 $421 $756 Note: figures (jobs and ) are rounded to the nearest ten. Totals may not sum due to rounding. Tax Revenue s The six MAC reliever airports generate considerable tax revenues across all levels of government. On an annual basis, an estimated $27 million in tax is contributed by airport employers, employees, and passengers. Nearly two-thirds of that amount (59%) flowed to the federal government, with the remaining 41% going to state and local governments. These figures exclude any estimates of corporate profit taxes. Figure 8-1: Annual Estimated Tax Revenues of MAC Reliever Airports by Level of Government Metropolitan Airports Commission 2017 Reliever Airport System Economic Study 42
44 9 Comparison of 2004 and 2016 Economic s This report provides an update on information about the MAC reliever airports published in 2005 based on data for Comparisons can be complicated because of differing industry conditions and methodologies, so readers should bear both of those factors in mind. The total economic impact of the MAC Reliever Airports in 2016 is higher relative to Employee from total ongoing operations (airport operations, onsite-site tenants and visitor spending impacts) increased from 2,260 to 3,100, between 2004 and Airport operations have seen growth in employment, despite the natural decline in general aviation activity and total operations at each of the reliever airports (as previously outlined in Section 1 and discussed in further detail below). In 2016, visitor spending is estimated to contribute roughly half the impact that was seen in Table 9-1 summarizes the change between 2004 and Table 9-1: Comparison of 2004 vs Results Measurement % Change (2016 vs. 2004) Total Airport Operations - Total s () 901 2, % Activity $169 $662 N/M Visitor Spending Total s () 1, % Activity ($ Millions) $86 $94 N/M Total s (Airport Operations & Visitor Spending) () 2,259 3,100 36% Activity ($ Millions) $255 $756 N/M Note: Figures may not sum to totals due to rounding. N/M = not meaningful. However, some portion of the change between the 2004 and 2016 results is attributable to differences in methodology. For instance, in the 2004 analysis, the impact of airport operations was calculated based on the dollar volume of operations rather than a direct survey of employment. Further, the 2004 impacts are assessed across a broader geographic scope (i.e., the 2004 results refer to impacts across the 13-county extended Minneapolis-St Paul region which includes two counties in Wisconsin) as opposed to the geographic region encompassed by this study the 7-county metropolitan area. In addition, although multiplier impacts were calculated using RIMS II in both studies, the studies use different versions of the RIMS II multipliers based on the most current data available at the time. The 2004 study also used a non-traditional definition of economic activity, based only on operating expenses and fuel sales. This current study applies the textbook definition of economic activity, which captures ALL spending (e.g., Metropolitan Airports Commission 2017 Reliever Airport System Economic Study 43
45 capital improvement plus revenue) by firms, organizations, and individuals. In the case of organizations that do not generate revenue (e.g., government-provided air traffic control services and expenses by the MAC to staff and maintain these airports), annual operating expenses associated with these facilities are counted. Comment on Changes over Time The entire aviation industry has undergone significant changes in the last 12 years. On the commercial airline side, the major changes include significant consolidation in the industry (e.g., the merger of Delta Air Lines and Northwest Airlines) and a developing pilot shortage that has affected the ability of major airlines and their regional partners to serve smaller communities. In the general aviation industry, GA activity has been declining steadily for years, mostly because of a drop in recreational or leisure flying. Data from the FAA show broad-based decreases in the number of GA pilots, the number of registered aircraft, and total annual and average flight hours. Offsetting those declines, however, are increases in business flying, the expansion of the fractional aviation market, and increases in rotorcraft (helicopter) activity. In general, the FAA s data show a drop of 8 percent in the number of active aircraft in the U.S. between 2004 and 2015 (the latest available data at the time of this report). The number of active fixed-wing piston aircraft dropped by over 24,000 (-15 percent). On the other hand, the number of active turboprop, turbojet, and rotorcraft increased. Similarly, the number of aircraft used primarily for personal or recreational purposes declined by about 7 percent, and the number of aircraft used for business purposes (with paid flight crew) dropped by 34 percent. Over the same time period, the number of aircraft used for business purposes (without a paid flight crew) grew by 10 percent. Flying for instructional and other purposes (e.g., sightseeing, agricultural) also increased. Table 9.2: National Changes in Active Aircraft by Type and Primary Use Type of Aircraft % change (in thousands) % Fixed Wing 182, , % Primary Use change Fixed Wing - Piston 165, , % Personal % Fixed Wing - Turboprop 8,379 9, % Business with paid flight crew % Fixed Wing - Turbojet 9,298 13, % Business without paid flight crew % Rotorcraft 7,821 10, % Instructional % All Other 28,738 35, % Other % Total 219, , % Total % Notes: 1 = Prior to 2014 this category was labeled "Business." 2 = Prior to 2014 this category was labeled "Corporate." Source: FAA. These national trends are reflected in the change in movements at the MAC s reliever airports. Since 2004, the number of operations has declined substantially at all of the reliever airports, with each airport showing anywhere between a one- to two-thirds decrease in operations. At Flying Cloud Airport, the busiest reliever airport, the number of operations fell by 49% between 2004 and Some of that decline may be attributable to changes in how personnel at the airport s air traffic control count aircraft operation, but that cannot be determined with certainty. The FAA does not separately report data for GA operations specific to Minnesota. Some data are available on the number of active pilots whose records indicate that they reside in the state. These records go back only to 2011, so the comparison since 2004 is unavailable. It is probably safe to assume that the overall trends in the number of Minnesota s active pilots broadly corresponds to the national trends in active aircraft and number of hours flown. Metropolitan Airports Commission 2017 Reliever Airport System Economic Study 44
46 Table 9.3 summarizes the changes in Minnesota s active pilots and non-pilot airmen. 10 It highlights that the total number of pilots in Minnesota declined by 7 percent between 2011 and 2016, although the number of individuals holding private pilot s licenses (as opposed to commercial, air transport, or some other type of certificate) decreased by 16 percent. Similarly, the number of other aviation professionals such as mechanics, repairmen, and dispatcher, fell by 11 percent over the same period. Table 9.3: Active Minnesota Pilots and Non-pilot Airmen Category Change % change Students 1,885 2, % Private 1/ 4,705 3,965 (740) -16% Active Commercial 1/ 2,641 1,943 (698) -26% Pilots & Airline Transport 1/ 3,502 3, % Flight Misc. 2/ % Instructors Flight Instructor 3/ 2,469 2, % Remote Pilots 3/ N/A 381 N/A N/A Subtotal - Pilots 12,818 11,972 (846) -7% Non-Pilot Airmen Ground Instructor 1,533 1,189 (344) -22% Flight Engineer 1,512 1,086 (426) -28% Mechanic 6,893 4,708 (2,185) -32% Repair men (79) -14% Parachute Rigger (51) -47% Dispatcher (146) -25% Flight Attendant 5,514 6, % Subtotal - Non Pilot Airmen 16,722 14,299 (2,423) -14% Total 29,540 26,271 (3,269) -11% The MAC has also supported numerous changes within the reliever airport system since 2004, some of which have had impacts on operations at those airports. These include but are not limited to: Installing a floodwall at St. Paul Downtown The acquisition of Regent Aviation by BBA Aviation (Signature Flight Support) The buyout of Modern Aero at Flying Cloud by Premier Aviation Lengthening runway at Flying Cloud Lengthening runway at Anoka County Blaine Adding precision landing system (instrument landing system) at Anoka County Blaine Constructing a new building at Flying Cloud Taken together, these changes highlight the dynamic nature of the GA industry in the greater Minneapolis-St. Paul region. 10 FAA defines the term airmen to includes men and women certified as pilots, mechanics or other aviation technicians. An active airman is one who holds both an airmen certificate and a valid medical certificate. Airmen who must have a valid medical to exercise the privileges of their certificate are all airplane pilots, rotorcraft pilots, flight navigators, and flight engineers. Glider pilots are not required to have a medical examination but the numbers represent only those who had a valid medical certificate on record at the Aeronautical Center. Metropolitan Airports Commission 2017 Reliever Airport System Economic Study 45
47 Appendix: Methodology InterVISTAS conducted this economic impact study during the second half of The study is based on employment data collected from survey respondents for calendar year To calculate the direct employment impacts, the study team surveyed all the employers associated with the operation of each of the six reliever airports (e.g., the FBOs) to determine the number of individuals employed in directly related occupations, as well as the amount of wages paid out to those individuals. The firms surveyed as part of this study are located both on the airport site (on-site) and off airport property (off-site). The employment survey was used to classify the total employment and average wages paid out by business type. In turn, this data was used to calculate the associated tax impacts (government revenue) generated by the airports operations. InterVISTAS estimated the indirect and induced effects using the RIMS II model, which is based on 2007 national benchmark input-output data and 2015 regional data. The previous study conducted in 2005 also used the RIMS II model, with multipliers derived from 2002 benchmark input-output data and 2010 regional data. To derive estimates of the impact of non-local visitors arriving and departing from the reliever airports, InterVISTAS consulted with the FBOs operating at each of the airports and further corroborated the findings with MAC. Wherever possible, the results of this study were validated and measured against recognized and reliable external sources. Estimating Current Economic Direct employment related to ongoing operations at each of the reliever airports is measured first. figures are generally more understandable by the public than more abstract measures, such as economic output or. figures also have the advantage of being a more accurate measure, both because firms are more likely to provide data on employment rather than information on revenues, earnings, and other monetary amounts, and because there is less chance of double counting economic activity. The study team then assessed the indirect and induced (or multiplier ) employment supported by each airport s operations, as well as economic activity in terms of economic output and using economic multipliers. The tax revenues generated annually by operations at each airport are also estimated. Surveying Direct To quantify the total amount of employment attributable to ongoing operations at each of the reliever airports, the project team began by surveying tenants and employers located at the airports. The team followed up with firms and organizations that had not responded to the ed survey via telephone and to encourage them to submit information. In total, 70% of the businesses and organizations contacted responded to the survey, representing roughly 86% of total person years of employment covered by the survey. In total, 51 survey responses were received from on-site tenants. Metropolitan Airports Commission 2017 Reliever Airport System Economic Study 46
48 Inferring For non-responding firms, the project estimated the amount of employment by company using a proven and accepted methodology. At commercial service airports which are under security requirements established by the U.S. Transportation Security Administration, airport operators must require employees of tenant firms/organizations who work at the reliever airport to obtain security badges allowing them to work on the airport properties. This TSA requirement is not applicable to the reliever airports, so the team was not able to estimate total employment based on the number of badges issued. Instead, the team generated inferred amounts of employment for non-responding firms based on a combination of internet research as well as statistical estimates based on responses from similar firms that did submit a survey. The team provided those estimates to the MAC staff with responsibility for and knowledge of operations at each of the airport for their review. The team also referenced the survey results of similar firms and examined information from other credible external sources like the U.S. Bureau of Labor Statistics. There may be firms located off-airport that were not surveyed because their relationships to airportrelated industries were not known. An estimate of employment for these non-surveyed firms was not provided because there was no basis for an assessment. If there were any omissions, it is expected that the volume of missed employment would be minimal. Estimating Indirect and Induced s with Economic Multipliers Measurement of indirect and induced economic activity is difficult. While it may be possible to conduct a survey of downstream employers, the survey would need to cover thousands of firms in order to completely cover indirect employment. For induced employment, the entire economy would need to be scrutinized. In addition to the time and financial resources needed to conduct such surveys, the quality of responses would be suspect. As an alternative to costly and inaccurate surveys, indirect and induced effects are typically measured using economic multipliers. Multipliers are derived from models of the general economy. They come in a variety of forms and differ greatly in definition and application. InterVISTAS purchased the multipliers used for this study from the U.S. Bureau of Economic Analysis (BEA). Those multipliers are based on BEA s most recent Regional Input- Modeling System (RIMS II). RIMS II is based on a highly detailed accounting of national and regional economic structures or relationships. The model tracks how the goods and services produced by one industry are used by other industries and final users. RIMS II adjusts these national relationships to account for regional supply conditions. This version of the RIMS II model is based on 2007 national benchmark input-output data and 2015 regional data. The specific multipliers selected for this study model the economy of the seven-county core metro area -- Anoka, Carver, Dakota, Hennepin, Ramsey, Scott, and Washington counties. This region rather than other potential geographic areas, such as the entire State of Minnesota -- was selected based on the concentration of airport- and airline-related employers in the area, the economic relationship among those firms and organizations, and the residency of the vast majority of employees. InterVISTAS acknowledges that the use of multiplier analysis and indeed any econometric model -- is inevitably subject to certain theoretical and practical constraints and limitations. These include: the accuracy of the structure and parameters of the underlying model; the level of unemployment in the economy; Metropolitan Airports Commission 2017 Reliever Airport System Economic Study 47
49 the assumption of constant returns to scale in production; the assumption that the economy's structure is static over time; and the assumption that there are no displacement effects. That said, the project team believes that the use of this model in entirely consistent with recognized and common professional economic impact modeling. Study Time Frame The employment survey was conducted between October 2017 and January The results reflect employment for calendar year versus Person Years of Traditionally, employment is measured by the number of jobs. However, when part-time and/or seasonal workers are used, this can be a misleading measure resulting in an overstatement of economic impact. Whenever possible, employment impacts are measured both in terms of the number of jobs and the number person-years of employment, often referred to as full-time equivalents (or ). 11 We convert hours worked by part-time and/or seasonal employees into. Visitor Spending Analysis Visitors who fly into the reliever airports contribute to the local, regional, and state-wide economic impacts in ways similar to passengers who arrive via Minneapolis-St. Paul International Airport. The project team developed estimates of the amount and type of spending who arrived at the reliever airports using multiple approaches. Estimating the Number of Non-Local Visitors Verifiable data are not available on the number of people who arrive at an airport on general aviation aircraft. However, there are relatively reliable data on the number of aircraft operations that occur at each airport, and whether those operations were local or itinerant. (An operation refers to a take-off or landing; total operations count both.) The MAC maintains data on total operations at each airport. The FAA also maintains data on operations at most airports in the U.S. (including the six reliever airports). The FAA s data includes estimates on the number of operations that are local versus itinerant. With these data, the team estimated the number of itinerant aircraft operations at each airport. The project team interviewed the FBO managers at most of the airports to develop information on the number of persons on-board each itinerant operation. Based on the data reported by those staff, the team estimated the total number of visitors who arrived in the region at each airport. Estimating Average Spending per Visitor First, the team asked each manager of the airport or the local FBO to report some basic metrics about aircraft operations at their facilities, and estimates of visitors and their spending. Airport managers were asked to estimate: 11 One person year is equivalent to 1,800 hours of work. Person years are the same as. Metropolitan Airports Commission 2017 Reliever Airport System Economic Study 48
50 The percentage of their operations that were local vs. transient; Average number of persons on board, including the pilots; The percentage of visitors who used local ground transportation (e.g., rental cars, car services); Average catering purchases by visiting aircraft; Average length of stay for visitors; and Whether the FBO had any relationships with local hotels. The project team used these data to generate estimates of the total number of visitors who arrived at each airport, the average length of stay, and spending by those visitors. Discussions with these staff also provided insight into the nature of the travellers who used each airport that is, whether the persons on board tended to be traveling for business or personal/leisure reasons. Generally speaking, aircraft activity at St. Paul Downtown tends mostly to be corporate/business aviation. Flying Cloud Airport also supports a high percentage of corporate and business traffic, as does Anoka- Blaine County. Airlake, Crystal, and Lake Elmo airports generally are more oriented toward recreational and leisure flying. In general, business travellers tend to spend more per person per day than leisure travellers. Higher concentrations of corporate and business flying are thus associated with higher amounts of spending. To gauge the reasonableness of the estimates, the project team compared against multiple other estimates: In 2017, InterVISTAS Consulting issued an analysis of the total economic impact of the operations of MSP, which included estimates of the average amount spent by different categories of visitors, including those who arrive by GA. The prior (2005) economic impact analysis of the reliever airports included estimates of the average amount spent by visitors to each of the reliever airports. Those estimates were based originally on data from Greater Minneapolis Convention and Visitors Bureau and from the Minnesota Office of Tourism. Other estimates of the average spending by visitors who arrive at GA airports in other areas. For example, InterVISTAS generated estimates of average spending by GA travellers who arrived at GA airports in Virginia in Similarly, in January 2018, the Allegheny County Airport Authority released a study from another consulting firm that estimated the average amount spent by GA travellers who used both Pittsburgh International Airport and the nearby Allegheny County (GA) Airport. 12 The combination of passenger spending profiles and the calculation of non-local visitors were used to develop the estimate of total visitor spending for The final results are provided in Table I As of the writing of this report, the Commonwealth of Virginia has not released the technical report that describes the visitor impact at Virginia s 66 public use airports. For information on the amount spent by visitors who use the Allegheny Airport Authority s airports, see Metropolitan Airports Commission 2017 Reliever Airport System Economic Study 49
51 Table I-1: Summary of Trip Characteristics of Non-Local Visitors Using Reliever Airports Airport Number of Visitors Average Expenditure per Visitor / Day ($) Total Visitor Spending ($000) Airlake 22,300 $121 $2,819 Anoka County-Blaine 73,700 $116 $8,581 Crystal 19,740 $120 $2,378 Flying Cloud 115,720 $159 $18,437 Lake Elmo 10,130 $108 $1,098 St. Paul Downtown 89,920 $168 $15,077 Total* 332,500 $146 $48,390 Note: Total average (mean) expenditure per visitor is calculated by dividing the total visitor expenditure amount by the total number of visitors that passed through the airports in Figures may not sum to totals due to rounding. Tax Analysis Direct employment figures related to the operations of the reliever airports were entered into the IMPLAN model to generate the resulting federal, state, and local government tax impacts. No indirect or induced impacts (multiplier effects) were considered as part of the tax analysis. Tax revenue contributions are divided into the following groupings: Taxes Related to Employee Compensation. This category includes the federal, state, and local impacts of Social Insurance taxes paid by employers and employees at the airports. It contains the tax impacts generated by retirement plans, temporary disability insurance, and workers compensation payments. These taxes contribute largely to federal government streams; however, smaller contributions are made to state and local governments as well. Taxes Related to Household Income. This category contains the personal tax impacts generated by households related to the airports. The federal impacts include all applicable personal income tax payments. The state and local impacts contain personal income tax payments, fines and fee charges, motor vehicles licensing fees, property taxes, and other applicable taxes. The federal government receives over two-thirds of the tax impacts in this category, while state and local governments share the remaining third. Other Taxes and Fees. These relate to a taxes and fees that are paid by corporations to the local, state and federal levels of government. Metropolitan Airports Commission 2017 Reliever Airport System Economic Study 50
52 Glossary of Terms Contract Work: Any work which is done for a company by an individual who is not on the payroll or work done for a company by another company. Generally speaking, firms will contract out work in areas in which they do not have expertise or when there are cost advantages to doing so. Direct : Direct employment is employment that can be directly attributable to the operations in an industry, firm, etc. It is literally a head count of those people who work in a sector of the economy. In the case of the airport, all of those people who work in an aviation related capacity would be considered direct employment. Economic Activity: (also, Production) The end product of transforming inputs into goods. The end product does not necessarily have to be a tangible good (for example, knowledge), nor does it have to create utility (for example, pollution). Or, more generally, the process of transforming the factors of production into goods and services desired for consumption. Economic : (also Economic Activity, Production) The end product of transforming inputs into goods. The end product does not necessarily have to be a tangible good (for example, knowledge), nor does it have to create utility (for example, pollution). Or, more generally, it is defined as the process of transforming the factors of production into goods and services desired for consumption. : impact analysis determines the economic impact of employment in terms of jobs created and salaries and wages paid out. In the case of the airport, the direct, indirect, induced and total number of jobs or person years created at the airport is examined to produce a snapshot of airport operations. Fixed-Base Operator (FBO): An organization granted the right by an airport to operate at the airport and provide aeronautical services such as fueling, hangaring, tie-down and parking, aircraft rental, aircraft maintenance, flight instruction, and similar services. Full Time Equivalent (FTE): (also Person Year) One full time equivalent (FTE) year of employment is equivalent to the number of hours that an individual would work on a full-time basis for one year. In this study we have calculated one full time equivalent year to be equivalent to 1,800 hours. Full time equivalent years are useful because part time and seasonal workers do not account for one full time job. General Aviation (GA): Refers to all segments of aircraft activity that are not related to the commercial airlines or the military. GA is often divided into two broad categories: leisure or recreational flying and business aviation. Gross Domestic Product: (, also value-added) A measure of the money value of final goods and services produced as a result of economic activity in the nation. This measure is net of the value of intermediate goods and services used up to produce the final goods and services. Ground Transportation: Ground Transportation at the airport includes any vehicles which transport passengers from the airport to the cities or from the cities to the airport. This would include taxicab service, limousine service and hotel van service. Transportation network companies such as Uber or Lyft are also included in this category. Valet services as well as skycaps are included in this category. Indirect : Indirect employment is employment which results because of direct employment. For the airport, it would include that portion of employment in supplier industries which are dependent on sales to the air transport sector. In some cases, contract work would be considered indirect employment. Metropolitan Airports Commission 2017 Reliever Airport System Economic Study 51
53 Induced : Induced employment is employment created because of expenditures by direct and indirect employees. Maintenance Repair and Overhaul (MRO): Generally, a company whose primary mission involves fixing any sort of mechanical, plumbing, or electrical device should it become out of order. In the aircraft maintenance market sector, MRO services also include inspection, rebuilding, alteration and the supply of spare parts, accessories, raw materials, adhesives, sealants, coatings and consumables for aircraft manufacturing. Multiplier Analysis: Analysis using economic multipliers in which indirect and induced economic impacts is quantified. Essentially, a multiplier number is applied to the "directly traceable economic impact" to produce indirect and total effects (see Multiplier.) Multiplier: Economic multipliers are used to infer indirect and induced effects from a particular sector of the economy. They come in a variety of forms and differ in definition and application. A multiplier is a number which would be multiplied by direct effects in order to calculate indirect or induced effects. In the case of the airport, as in many other cases, multipliers can lead to illusory results, and thus must be used with great care. Tenant: A firm which pays a lease to a leasing company or to the airport authority directly. Value-Added: (also ) A measure of the money value of final goods and services produced as a result of economic activity in the nation. This measure is net of the value of intermediate goods and services used up to produce the final goods and service. Metropolitan Airports Commission 2017 Reliever Airport System Economic Study 52

54 Prepared by InterVISTAS Consulting Inc Conn. Ave., NW Suite 601 Washington, DC Telephone:
Document prepared by MnDOT Office of Aeronautics and HNTB Corporation. MINNESOTA GO STATE AVIATION SYSTEM PLAN
 LAST UPDATE JULY 2013 Acknowledgements The preparation of this document was financed in part by a grant from the Federal Aviation Administration (Project No: 3-27-0000-07-10), with the financial support
MINNEAPOLIS-ST. PAUL RELIEVER AIRPORTS Activity Forecasts Technical Report April 2009
 1. Introduction MINNEAPOLIS-ST. PAUL RELIEVER AIRPORTS Activity Forecasts Technical Report April 2009 The purpose of this analysis is to provide aviation activity forecasts for use in the Long- Term Comprehensive
2009 Muskoka Airport Economic Impact Study
 2009 Muskoka Airport Economic Impact Study November 4, 2009 Prepared by The District of Muskoka Planning and Economic Development Department BACKGROUND The Muskoka Airport is situated at the north end
THE 2006 ECONOMIC IMPACT OF TRAVEL & TOURISM IN INDIANA
 THE 2006 ECONOMIC IMPACT OF TRAVEL & TOURISM IN INDIANA A Comprehensive Analysis Prepared by: In Partnership with: PREPARED FOR: Carrie Lambert Marketing Director Indiana Office of Tourism Development
ESTIMATION OF ECONOMIC IMPACTS FOR AIRPORTS IN HAWTHORNE, EUREKA, AND ELY, NEVADA
 TECHNICAL REPORT UCED 97/98-14 ESTIMATION OF ECONOMIC IMPACTS FOR AIRPORTS IN HAWTHORNE, EUREKA, AND ELY, NEVADA UNIVERSITY OF NEVADA, RENO ESTIMATION OF ECONOMIC IMPACTS FOR AIRPORTS IN HAWTHORNE, EUREKA
Economic Impact. Airports and economic development. Airport location. Regional profile. Middleton Municipal Morey Field (C29) 2008 Middleton, WI
 2008 Middleton, WI") Airports and economic development The local general aviation airport is fast becoming the principal access route from a community to the nation and world. As an important part of our statewide transportation
Airports and economic development The local general aviation airport is fast becoming the principal access route from a community to the nation and world. As an important part of our statewide transportation
Fort McMurray International Airport
 FINAL REPORT Fort McMurray International Airport Economic Impacts Associated with Current Air Services PREPARED FOR Fort McMurray Airport Authority (FMAA) PREPARED BY InterVISTAS Consulting Inc. 29 September
The Economic Impact of Tourism Brighton & Hove Prepared by: Tourism South East Research Unit 40 Chamberlayne Road Eastleigh Hampshire SO50 5JH
 The Economic Impact of Tourism Brighton & Hove 2013 Prepared by: Tourism South East Research Unit 40 Chamberlayne Road Eastleigh Hampshire SO50 5JH CONTENTS 1. Summary of Results 1 1.1 Introduction 1 1.2
Table of Contents. Overview Objectives Key Issues Process...1-3
 Table of Contents Chapter One Introduction Overview...1-1 Objectives...1-1 Key Issues...1-2 Process...1-3 Chapter Two Inventory of Existing Conditions Airport Setting...2-1 Locale...2-1 Airport Surroundings...2-5
Economic Impacts of Campgrounds in New York State
 Economic Impacts of Campgrounds in New York State June 2017 Report Submitted to: Executive Summary Executive Summary New York State is home to approximately 350 privately owned campgrounds with 30,000
ACTION TRANSMITTAL
 Transportation Advisory Board of the Metropolitan Council of the Twin Cities ACTION TRANSMITTAL 2018-16 DATE: February 9, 2018 TO: Transportation Advisory Board FROM: Technical Advisory Committee PREPARED
Provided by: South Central Illinois Regional Planning & Development Commission
 Provided by: South Central Illinois Regional Planning & Development Commission Economic Impact Summary of Flora Municipal Airport (KFOA) Table of Content Introduction...1 General Information...3 Ownership...3
The Economic Impact of Tourism Brighton & Hove Prepared by: Tourism South East Research Unit 40 Chamberlayne Road Eastleigh Hampshire SO50 5JH
 The Economic Impact of Tourism Brighton & Hove 2014 Prepared by: Tourism South East Research Unit 40 Chamberlayne Road Eastleigh Hampshire SO50 5JH CONTENTS 1. Summary of Results 1 1.1 Introduction 1 1.2
Summary of Committee Discussion/Questions Metropolitan Transportation Services Senior Planner Russ Owen presented this item.
 Committee Report Business Item No. 2017-191 Transportation Committee For the Metropolitan Council meeting of September 13, 2017 Subject: Final Crystal Airport 2035 Long Term Comprehensive Plan (LTCP) Proposed
The Economic Impact of Tourism on Galveston Island, Texas Analysis
 The Economic Impact of Tourism on Galveston Island, Texas 2012 Analysis Headline Results Headline results Tourism is a significant contributor to business sales, employment, and taxes on Galveston Island.
COLUMBUS REGIONAL AIRPORT AUTHORITY. Economic Impact Study Update. Executive Summary
 COLUMBUS REGIONAL AIRPORT AUTHORITY Economic Impact Study Update Executive Summary November 2012 Hearing a plane overhead is an everyday occurrence. But how many people stop to think that what they are
The forecasts evaluated in this appendix are prepared for based aircraft, general aviation, military and overall activity.
 Chapter 3: Forecast Introduction Forecasting provides an airport with a general idea of the magnitude of growth, as well as fluctuations in activity anticipated, over a 20-year forecast period. Forecasting
The Economic Impact of Tourism New Forest Prepared by: Tourism South East Research Unit 40 Chamberlayne Road Eastleigh Hampshire SO50 5JH
 The Economic Impact of Tourism New Forest 2008 Prepared by: Tourism South East Research Unit 40 Chamberlayne Road Eastleigh Hampshire SO50 5JH CONTENTS Glossary of terms 1 1. Summary of Results 4 2. Table
TABLE OF CONTENTS. Washington Aviation System Plan Update July 2017 i
 TABLE OF CONTENTS Chapter 1 Overview... 1-1 1.1 Background... 1-1 1.2 Overview of 2015 WASP... 1-1 1.2.1 Aviation System Performance... 1-2 1.3 Prior WSDOT Aviation Planning Studies... 1-3 1.3.1 2009 Long-Term
ECONOMIC IMPACT STUDY OF CALIFORNIA AIRPORTS
 ECONOMIC IMPACT STUDY OF CALIFORNIA AIRPORTS MARCH 1, 2013 Prepared for California Airports Council Prepared by Applied Development Economics 100 Pringle Avenue, Suite 560 Walnut Creek, California 94596
AIRPORT: Seattle-Tacoma International (SEA) ASSOCIATED CITY: Seattle ARC: D-V Region: Central Puget Sound
 ASSOCIATED CITY: Seattle ARC: D-V Region: Central Puget Sound") AIRPORT: Seattle-Tacoma International (SEA) ASSOCIATED CITY: Seattle ARC: D-V Region: Central Puget Sound AIRPORT DATA AND FACILITIES (Sea-Tac) is located in King County, 10 miles south of downtown Seattle,
AIRPORT: Seattle-Tacoma International (SEA) ASSOCIATED CITY: Seattle ARC: D-V Region: Central Puget Sound AIRPORT DATA AND FACILITIES (Sea-Tac) is located in King County, 10 miles south of downtown Seattle,
AIRPORT: Yakima Air Terminal (YKM) ASSOCIATED CITY: Yakima ARC: C-III Region: South Central
 ASSOCIATED CITY: Yakima ARC: C-III Region: South Central") AIRPORT: Yakima Air Terminal (YKM) ASSOCIATED CITY: Yakima ARC: C-III Region: South Central AIRPORT DATA AND FACILITIES is located in Yakima County, three miles south of the City. The Airport has 115 based
AIRPORT: Yakima Air Terminal (YKM) ASSOCIATED CITY: Yakima ARC: C-III Region: South Central AIRPORT DATA AND FACILITIES is located in Yakima County, three miles south of the City. The Airport has 115 based
The Economic Impact of Tourism on the District of Thanet 2011
 The Economic Impact of Tourism on the District of Thanet 2011 Prepared by: Tourism South East Research Unit 40 Chamberlayne Road Eastleigh Hampshire SO50 5JH CONTENTS 1. Summary of Results 1 2. Table of
The Economic Impact of Tourism in Jacksonville, FL. June 2016
 The Economic Impact of Tourism in Jacksonville, FL June 2016 Highlights Visitor spending surpassed $2.0 billion in 2015, growing 4.4%. As this money flowed through Duval County, the $2.0 billion in visitor
The Economic Impact of Tourism in North Carolina. Tourism Satellite Account Calendar Year 2015
 The Economic Impact of Tourism in North Carolina Tourism Satellite Account Calendar Year 2015 Key results 2 Total tourism demand tallied $28.3 billion in 2015, expanding 3.6%. This marks another new high
The Economic Impact of Tourism in Maryland. Tourism Satellite Account Calendar Year 2015
 The Economic Impact of Tourism in Maryland Tourism Satellite Account Calendar Year 2015 MD tourism economy reaches new peaks The Maryland visitor economy continued to grow in 2015; tourism industry sales
The Economic Impact of Tourism in Buncombe County, North Carolina
 The Economic Impact of Tourism in Buncombe County, North Carolina 2017 Analysis September 2018 Introduction and definitions This study measures the economic impact of tourism in Buncombe County, North
Impacts of Visitor Spending on the Local Economy: George Washington Birthplace National Monument, 2004
 Impacts of Visitor Spending on the Local Economy: George Washington Birthplace National Monument, 2004 Daniel J. Stynes Department of Community, Agriculture, Recreation and Resource Studies Michigan State
The Economic Impact of Tourism on Calderdale Prepared by: Tourism South East Research Unit 40 Chamberlayne Road Eastleigh Hampshire SO50 5JH
 The Economic Impact of Tourism on Calderdale 2015 Prepared by: Tourism South East Research Unit 40 Chamberlayne Road Eastleigh Hampshire SO50 5JH CONTENTS 1. Summary of Results 1 2. Table of Results Table
The Economic Impact of Tourism on Scarborough District 2014
 The Economic Impact of Tourism on Scarborough District 2014 Prepared by: Tourism South East Research Unit 40 Chamberlayne Road Eastleigh Hampshire SO50 5JH CONTENTS 1. Summary of Results 1 2. Table of
Appendix K: MSP Class B Airspace
 Appendix K: MSP Class B Airspace K All of the open sky covering the United States, from less than an inch off the ground all the way to outer space, is part of America s airspace. This airspace resource
The Economic Impact of Tourism Eastbourne Prepared by: Tourism South East Research Unit 40 Chamberlayne Road Eastleigh Hampshire SO50 5JH
 The Economic Impact of Tourism Eastbourne 2016 Prepared by: Tourism South East Research Unit 40 Chamberlayne Road Eastleigh Hampshire SO50 5JH CONTENTS Page 1. Summary of Results 1 1.1 Introduction 1 1.2
The Economic Impact of Tourism in Hillsborough County. July 2017
 The Economic Impact of Tourism in Hillsborough County July 2017 Table of contents 1) Key Findings for 2016 3 2) Local Tourism Trends 7 3) Trends in Visits and Spending 12 4) The Domestic Market 19 5) The
Westover Metropolitan Airport Master Plan Update
 Westover Metropolitan Airport Master Plan Update June 2008 INTRODUCTION Westover Metropolitan Airport (CEF) comprises the civilian portion of a joint-use facility located in Chicopee, Massachusetts. The
Economic Impact of Tourism in Hillsborough County September 2016
 Economic Impact of Tourism in Hillsborough County - 2015 September 2016 Key findings for 2015 Almost 22 million people visited Hillsborough County in 2015. Visits to Hillsborough County increased 4.5%
COMMERCIAL AND GENERAL AVIATION
 Existing Facilities Daytona Beach International Airport is served by a number of airside and landside facilities. The airport has three asphalt runways: Runway 07L/25R (10,500 feet long by 150 feet wide),
Agenda: SASP SAC Meeting 3
 Agenda: SASP SAC Meeting 3 Date: 04/12/18 Public Involvement Plan Update Defining the System Recommended Classifications Discussion Break Review current system Outreach what we heard Proposed changes Classification
Economic Impact of Kalamazoo-Battle Creek International Airport
 Reports Upjohn Research home page 2008 Economic Impact of Kalamazoo-Battle Creek International Airport George A. Erickcek W.E. Upjohn Institute, erickcek@upjohn.org Brad R. Watts W.E. Upjohn Institute
The 2001 Economic Impact of Connecticut s Travel and Tourism Industry
 The 2001 Economic Impact of Connecticut s Travel and Tourism Industry EXECUTIVE SUMMARY Fred V. Carstensen, Director Stan McMillen, Manager, Research Projects Murat Arik, Research Associate Hulya Varol,
Appendix A - Definitions
 Appendix A - Definitions Aeronautical Activity Any activity conducted at airports which involves, makes possible, or is required for the operation of aircraft, or which contributes to or is required for
The Economic Impact of Tourism on Galveston Island, Texas
 The Economic Impact of Tourism on Galveston Island, Texas 2017 Analysis Prepared for: Headline Results Headline results Tourism is an integral part of the Galveston Island economy and continues to be a
Recommended Performance Measures
 Recommended Performance Measures January 2009 1 RECOMMENDED PERFORMANCE MEASURES Performance measures are utilized by the North Central Texas Council of Governments (NCTCOG) to monitor the performance
FORECASTING FUTURE ACTIVITY
 EXECUTIVE SUMMARY The Eagle County Regional Airport (EGE) is known as a gateway into the heart of the Colorado Rocky Mountains, providing access to some of the nation s top ski resort towns (Vail, Beaver
Tourism Satellite Account Calendar Year 2010
 The Economic Impact of Tourism in Georgia Tourism Satellite Account Calendar Year 2010 Highlights The Georgia visitor economy rebounded in 2010, recovering 98% of the losses experienced during the recession
Wyoming Travel Impacts
 Wyoming Travel Impacts 2000-2014 Wyoming Office of Tourism April 2015 Prepared for the Wyoming Office of Tourism Cheyenne, Wyoming The Economic Impact of Travel on Wyoming 2000-2014 Detailed State and
Economic Impact Analysis. Tourism on Tasmania s King Island
 Economic Impact Analysis Tourism on Tasmania s King Island i Economic Impact Analysis Tourism on Tasmania s King Island This project has been conducted by REMPLAN Project Team Matthew Nichol Principal
Wyoming Travel Impacts
 Wyoming Travel Impacts 2000-2013 Wyoming Office of Tourism April 2014 Prepared for the Wyoming Office of Tourism Cheyenne, Wyoming The Economic Impact of Travel on Wyoming 2000-2013 Detailed State and
CRUISE ACTIVITY IN BARCELONA. Impact on the Catalan economy and socioeconomic profile of cruise passengers (2014)
") CRUISE ACTIVITY IN BARCELONA Impact on the Catalan economy and socioeconomic profile of cruise passengers (2014) 2 CRUISE ACTIVITY IN BARCELONA 2014 Impact on the Catalan economy and socioeconomic profile
CRUISE ACTIVITY IN BARCELONA Impact on the Catalan economy and socioeconomic profile of cruise passengers (2014) 2 CRUISE ACTIVITY IN BARCELONA 2014 Impact on the Catalan economy and socioeconomic profile
The Economic Contributions of Agritourism in New Jersey
 The Economic Contributions of Agritourism in New Jersey Bulletin E333 Cooperative Extension Brian J. Schilling, Extension Specialist in Agricultural Policy Kevin P. Sullivan, Institutional Research Analyst
Technical Memorandum. Synopsis. Steve Carrillo, PE. Bryan Oscarson/Carmen Au Lindgren, PE. April 3, 2018 (Revised)
") Appendix D Orange County/John Wayne Airport (JWA) General Aviation Improvement Program (GAIP) Based Aircraft Parking Capacity Analysis and General Aviation Constrained Forecasts Technical Memorandum To:
Appendix D Orange County/John Wayne Airport (JWA) General Aviation Improvement Program (GAIP) Based Aircraft Parking Capacity Analysis and General Aviation Constrained Forecasts Technical Memorandum To:
TABLE OF CONTENTS. General Study Objectives Public Involvement Issues to Be Resolved
 TABLE OF CONTENTS Description Page Number LIST OF ACRONYMS... a CHAPTER ONE INTRODUCTION General... 1-1 Study Objectives... 1-1 Public Involvement... 1-2 Issues to Be Resolved... 1-2 CHAPTER TWO EXISTING
The Travel and Tourism Industry in Vermont. A Benchmark Study of the Economic Impact of Visitor Expenditures on the Vermont Economy 2005
 The Travel and Tourism Industry in Vermont A Benchmark Study of the Economic Impact of Visitor Expenditures on the Vermont Economy 2005 INTRODUCTION GENERAL November, 2006 This 2005 update of the original
NAPA VALLEY VISITOR INDUSTRY 2016 Economic Impact Report
 NAPA VALLEY VISITOR INDUSTRY 2016 Economic Impact Report Research prepared for Visit Napa Valley by Destination Analysts, Inc. Table of Contents S E C T I O N 1 Introduction 2 S E C T I O N 2 Executive
The Economic Impact of Tourism in North Carolina. Tourism Satellite Account Calendar Year 2013
 The Economic Impact of Tourism in North Carolina Tourism Satellite Account Calendar Year 2013 Key results 2 Total tourism demand tallied $26 billion in 2013, expanding 3.9%. This marks another new high
The Economic Impact of Tourism on Oxfordshire Estimates for 2013
 The Economic Impact of Tourism on Oxfordshire Estimates for 2013 County and District Results September 2014 Prepared by: Tourism South East Research Unit 40 Chamberlayne Road Eastleigh Hampshire SO50 5JH
TED STEVENS ANCHORAGE INTERNATIONAL AIRPORT: ECONOMIC SIGNIFICANCE 2007
 TED STEVENS ANCHORAGE INTERNATIONAL AIRPORT: ECONOMIC SIGNIFICANCE 2007 by Scott Goldsmith Mary Killorin Prepared for Ted Stevens Anchorage International Airport September 2007 Institute of Social and
The Economic Contribution of Cruise Tourism to the Southeast Asia Region in Prepared for: CLIA SE Asia. September 2015
 BREA Business Research & Economic Advisors The Economic Contribution of Cruise Tourism to the Southeast Asia Region in 2014 Prepared for: CLIA SE Asia September 2015 Business Research & Economic Advisors
Economic Impact of Tourism in South Dakota, December 2017
 Economic Impact of Tourism in South Dakota, 2017 December 2017 1) Key findings 1) Growth continues in 2017 but pales against the event driven years of 2015 and 2016 in South Dakota Key facts about South
The Economic Impact of Tourism in Hillsborough County, June 2018
 The Economic Impact of Tourism in Hillsborough County, 2017 June 2018 Table of contents 1) Key Findings for 2017 3 2) Local Tourism Trends 7 3) Trends in Visits and Spending 12 4) The Domestic Market 19
Benchmarking Travel & Tourism in Australia
 Benchmarking Travel & Tourism in Australia How does Travel & Tourism compare to other sectors? Sponsored by: Summary of Findings, November 2013 Outline Introduction... 3 Australia summary..... 8 Data sources
NAPA VALLEY VISITOR INDUSTRY 2012 Economic Impact Report
 Join Visit Napa Valley NAPA VALLEY VISITOR INDUSTRY 2012 Economic Impact Report Research prepared for Visit Napa Valley by Destination Analysts, Inc. Table of Contents SECTION 1 Introduction 2 SECTION
The Economic Impact of Tourism in Walworth County, Wisconsin. July 2013
 The Economic Impact of Tourism in Walworth County, Wisconsin July 2013 Key themes for 2012 The Walworth County, Wisconsin visitor economy continued its brisk growth in 2012. Visitor spending rose 11% after
Benchmarking Travel & Tourism in United Arab Emirates
 Benchmarking Travel & Tourism in United Arab Emirates How does Travel & Tourism compare to other sectors? Summary of Findings, November 2013 Sponsored by: Outline Introduction... 3 UAE summary...... 8
Executive Summary. MASTER PLAN UPDATE Fort Collins-Loveland Municipal Airport
 Executive Summary MASTER PLAN UPDATE Fort Collins-Loveland Municipal Airport As a general aviation and commercial service airport, Fort Collins- Loveland Municipal Airport serves as an important niche
Existing Airport System
 Introduction Rhode Island s Aviation System A strong relationship exists between Rhode Island s economy and aviation. In today s global market place, the state s system of commercial service and general
Economic Impact of Small Community Airports and the Potential Threat to the Economies with the Loss of Air Service
 Economic Impact of Small Community Airports and the Potential Threat to the Economies with the Loss of Air Service January 2017 There are over 350 small communities in the U.S. that currently receive air
NAPA VALLEY VISITOR INDUSTRY 2014 Economic Impact Report
 NAPA VALLEY VISITOR INDUSTRY 2014 Economic Impact Report Research prepared for Visit Napa Valley by Destination Analysts, Inc. Table of Contents SECTION 1 Introduction 2 SECTION 2 Executive Summary 5 SECTION
The Economic Impact of Travel in Minnesota Analysis
 The Economic Impact of Travel in Minnesota 2013 Analysis Overview 2013 Highlights Traveler Spending Traveler spending of $10.3 billion generated $17.6 billion in total business sales in 2013 as travel
Temecula Valley Travel Impacts p
 Temecula Valley Travel Impacts 2000-2017p photo courtesy of Temecula Valley Convention and Visitors Bureau May 2018 Prepared for the Temecula Valley Convention and Visitors Bureau Temecula, California
The Economic Impact of Tourism in Maryland. Tourism Satellite Account Calendar Year 2016
 The Economic Impact of Tourism in Maryland Tourism Satellite Account Calendar Year 2016 County Results Washington County, Visitors Washington County Visitors (thousands) Year Overnight Day Total Growth
Appendix D Project Newsletters. Tacoma Narrows Airport. Master Plan Update
 Appendix D Project Newsletters Tacoma Narrows Airport Master Plan Update This appendix contains the newsletters distributed throughout the project. These newsletters provided updates and information on
Benchmarking Travel & Tourism in Colombia
 Benchmarking Travel & Tourism in Colombia How does Travel & Tourism compare to other sectors? Summary of Findings, November 2013 Sponsored by: Outline Introduction... 3 Colombia summary..... 8 Data sources
VIRGINIA AIRPORT SYSTEM ECONOMIC IMPACT STUDY EXECUTIVE SUMMARY
 VIRGINIA AIRPORT SYSTEM ECONOMIC IMPACT STUDY EXECUTIVE SUMMARY The Economic Importance of Virginia s Airports The Commonwealth of Virginia s diverse system of 66 public-use airports plays a vital role
Houston Airport System Economic Impact Study
 GRA, Incorporated Economic Counsel to the Transportation Industry Houston Airport System Economic Impact Study Final Report June 30, 2011 Prepared by: GRA, Incorporated 115 West Avenue, Suite 201 Jenkintown,
Master Planning AirTAP Fall Forum. Mike Louis, Dan Millenacker
 Master Planning 2007 AirTAP Fall Forum Mike Louis, Dan Millenacker 1 Measures in the State Aviation System Plan (SASP) 2 Goals for the Airport System Are consistent with the prior System Plan and the Statewide
Tourism Satellite Account STATISTICS NEW ZEALAND DECEMBER 2002
 Tourism Satellite Account 1997 1999 STATISTICS NEW ZEALAND DECEMBER 2002 Published in December 2002 by: Statistics New Zealand Te Tari Tatau Wellington, New Zealand Catalogue Number 16.001 ISSN 1175-530X
Business Aviation: Operations and Service Quality by Provider Organisations. Macao, September Captain Scott Macpherson
 Business Aviation: Operations and Service Quality by Provider Organisations Macao, September 2013 Captain Scott Macpherson Business Aviation: Operations and Service Quality by Provider Organizations Today
FINAL REPORT Prepared for the Maryland Aviation Administration. Landrum & Brown, Incorporated Martin Associates
 FINAL REPORT 2013 Prepared for the Maryland Aviation Administration, Incorporated Martin Associates Maryland Aviation Administration Final Report 2013 Prepared by, Incorporated/Martin Associates The preparation
Economic Impact of Tourism in South Dakota, December 2018
 Economic Impact of Tourism in South Dakota, 2018 December 2018 1) Key Findings Growth rebounds in 2018 as a strong hunting season drives tourism growth Key facts about South Dakota s tourism sector Key
Self Catering Holidays in England Economic Impact 2015
 Self Catering Holidays in England Economic Impact 2015 An overview of the economic impact of self catering holidays in England Published by The South West Research Company Ltd March 2017 Contents Page
Benchmarking Travel & Tourism in Russia
 Benchmarking Travel & Tourism in Russia How does Travel & Tourism compare to other sectors? Sponsored by: Summary of Findings, November 2013 Outline Introduction... 3 Russia summary..... 8 Data sources
Aviation Tax Report. June 30, 2016
 Aviation Tax Report June 30, 2016 Prepared by The Minnesota Department of Transportation 395 John Ireland Boulevard Saint Paul, Minnesota 55155-1899 Phone: 651-296-3000 Toll-Free: 1-800-657-3774 TTY, Voice
The Economic Impact of Tourism in The Appalachian Region of Ohio. June 2016
 The Economic Impact of Tourism in The Appalachian Region of Ohio June 2016 Appalachian Region tourism summary Total Tourism Impact Appalachian Region, Ohio Sales Wages Taxes Employment $5.3 billion $1.3
APPENDIX B: NPIAS CANDIDATE AIRPORT ANALYSIS
 APPENDIX B: NPIAS CANDIDATE AIRPORT ANALYSIS The National Plan of Integrated Airport Systems (NPIAS) is the Federal Aviation Administration s (FAA) national airport plan. The NPIAS includes nearly 3,500
FIRST QUARTER RESULTS 2017
 FIRST QUARTER RESULTS 2017 KEY RESULTS In the 1Q17 Interjet total revenues added $4,421.5 million pesos that represented an increase of 14.8% over the income generated in the 1Q16. In the 1Q17, operating
HELSINKI-MALMI INTERNATIONAL AIRPORT BUSINESS PLAN
 Aerial View of the Airport HELSINKI-MALMI INTERNATIONAL AIRPORT BUSINESS PLAN 2015 Helsinki-Malmi International HEM EFHF Overview 2 This business plan has been written for Helsinki- Malmi airport in case
Time-series methodologies Market share methodologies Socioeconomic methodologies
 This Chapter features aviation activity forecasts for the Asheville Regional Airport (Airport) over a next 20- year planning horizon. Aviation demand forecasts are an important step in the master planning
Evaluating Lodging Opportunities
 Evaluating Lodging Opportunities This section explores market opportunities for new lodging accommodations in the downtown area. It will help you understand travel and visitation trends, existing competition,
The Economic Impact of the 2015 ASICS Los Angeles Marathon. September 2015
 The Economic Impact of the 2015 ASICS Los Angeles Marathon September 2015 Introduction and definitions This study measures the economic impact of the 2015 ASICS Los Angeles Marathon held in March 2015.
The Economic Impact of Children's Camps in Michigan
 Extension Bulletin E-1559, July 1981, File 36.42 The Economic Impact of Children's in Michigan Department of Park and Recreation Resources Michigan State University East Lansing, Michigan in cooperation
Economic Impact of Aviation in Arizona
 Economic Impact of Aviation in Arizona Presented by: Arizona Department of Transportation Aeronautics Division May 5, 2004 Aviation Contributes $38.5 Billion to the Arizona Economy PRIMARY IMPACT Economic
Airport Master Plan. Rapid City Regional Airport. October 2015 FAA Submittal
 Airport Master Plan Rapid City Regional Airport October 2015 FAA Submittal Rapid City Regional Airport Master Plan Update Table of Contents Executive Summary... i Scope & Timeline... i Forecasts... i Preferred
The Economic Impact of Tourism West Oxfordshire Prepared by: Tourism South East Research Unit 40 Chamberlayne Road Eastleigh Hampshire SO50 5JH
 The Economic Impact of Tourism West Oxfordshire 2014 Prepared by: Tourism South East Research Unit 40 Chamberlayne Road Eastleigh Hampshire SO50 5JH CONTENTS 1. Summary of Results 1 1.1 Introduction 1
Richard V. Butler, Ph.D. and Mary E. Stefl, Ph.D., Trinity University HIGHLIGHTS
 This study was prepared by Richard V. Butler, Ph.D. and Mary E. Stefl, Ph.D., Trinity University HIGHLIGHTS In 2017, the economic impact of San Antonio s Hospitality Industry was $15.2 billion. The San
TOURISM SPENDING IN ALGONQUIN PROVINCIAL PARK
 TOURISM SPENDING IN ALGONQUIN PROVINCIAL PARK Margaret E. Bowman 1, Paul F.G. Eagles 2 1 Ontario Parks Central Zone, 451 Arrowhead Park Road, RR3, Huntsville, ON P1H 2J4, 2 Department of Recreation and
Airlake Airport 2035 Long Term Comprehensive Plan (LTCP)
") Airlake Airport 2035 Long Term Comprehensive Plan (LTCP) Public Informational Meetings August 9 & 10, 2017 Draft LTCP Overview Briefing Agenda Airport Role & Context Existing Conditions & Previous Plan
Airlake Airport 2035 Long Term Comprehensive Plan (LTCP) Public Informational Meetings August 9 & 10, 2017 Draft LTCP Overview Briefing Agenda Airport Role & Context Existing Conditions & Previous Plan
SALT LAKE CITY INTERNATIONAL AIRPORT AIRPORT REDEVELOPMENT PROGRAM ECONOMIC IMPACT ANALYSIS. September 2018
 SALT LAKE CITY INTERNATIONAL AIRPORT AIRPORT REDEVELOPMENT PROGRAM ECONOMIC IMPACT ANALYSIS September 2018 Table of Contents i TABLE OF CONTENTS I. Introduction and Summary 1 A. Project Background 1 B.
The Economic Impact of Tourism in The Appalachian Region of Ohio. June 2014
 The Economic Impact of Tourism in The Appalachian Region of Ohio June 2014 Appalachia Region Tourism Summary Total Tourism Impact Appalachian Region Sales Wages Taxes Employment $4.9 billion $1.2 billion
The Economic Impact Of Luxembourg Airport 29 April 2016
 The Economic Impact Of Luxembourg Airport 29 April 2016 What is Economic Impact Economic Impact of Luxemburg Airport refers to the contribution of the Airport to the Luxembourg Economy This can be measured
Tourism Satellite Account Calendar Year 2016
 Tourism Satellite Account Calendar Year 2016 Key Definitions 1. Tourism/Tourist: Refers to the leisure travel/traveler segment. 2. Travel/Traveler: Includes both leisure and business travel/travelers.