Reno-Tahoe International Airport RSCVA and RNO Collaboration Governor s Global Tourism Summit November 13, 2018
|
|
|
- Marjorie Harper
- 5 years ago
- Views:
Transcription

1 Reno-Tahoe International Airport RSCVA and RNO Collaboration Governor s Global Tourism Summit November 13, 2018

2 Why Collaborate? Airport is the heart of the community Passengers fill casino floors Hotel rooms Ski slopes Business meetings now more than ever 55% leisure 45% business Largest share of business passengers ever


3 Intense competition between airports/communities The RNO primary catchment area has a population of more than 752,000 From Reno-Sparks, to Lake Tahoe, Rural Nevada and eastern Calif. Intense competition between airports/communities 450 airports competing to land the same aircraft and same airlines

 and RSCVA give")
4 Why Collaborate? Collaboration helps us compete against larger airports, cities Regional Air Service Corporation (RASC) and RSCVA give lift to our air service efforts


5 How Do We Collaborate? Outstanding customer service our customers are RSCVA s customers Overall customer satisfaction 6.55 on a 7-point scale Paws 4 Passengers Kindness Takes Flight Performances We move you Provide a travel experience that makes people want to come back


6 How Do We Collaborate? Air service trips Constant trips to visit airlines RSCVA joins us They explain the marketing support for airlines Extol the virtues of our community


7 Conventions How Do We Collaborate? RNO works in concert with RSCVA Welcome meeting planners/advance teams Attend presentations to meeting planners Interbike Safari Club


8 Special events How Do We Collaborate? Partnerships with events like: Reno Rodeo Burning Man Barracuda Championship Welcome tables and signage Additional customer service


9 How Do We Collaborate? Create air service materials to support RSCVA sales teams Air service 101 classes


10 Advertising How Do We Collaborate? Work with RSCVA to plan advertising in target markets Seed for future routes Routes needing more support RSCVA and RASC bring people into Reno-Tahoe RNO advertises where locals can fly
11 Collaboration Results Annual Seat Capacity at RNO 2018 Seat Capacity is up 25% when compared to ,155,028 4,289,638 4,637, % 5,077,157 5,206, % 8.1% 3.2% Source: FlightGlobal Schedules via Diio Schedule information is subject to change

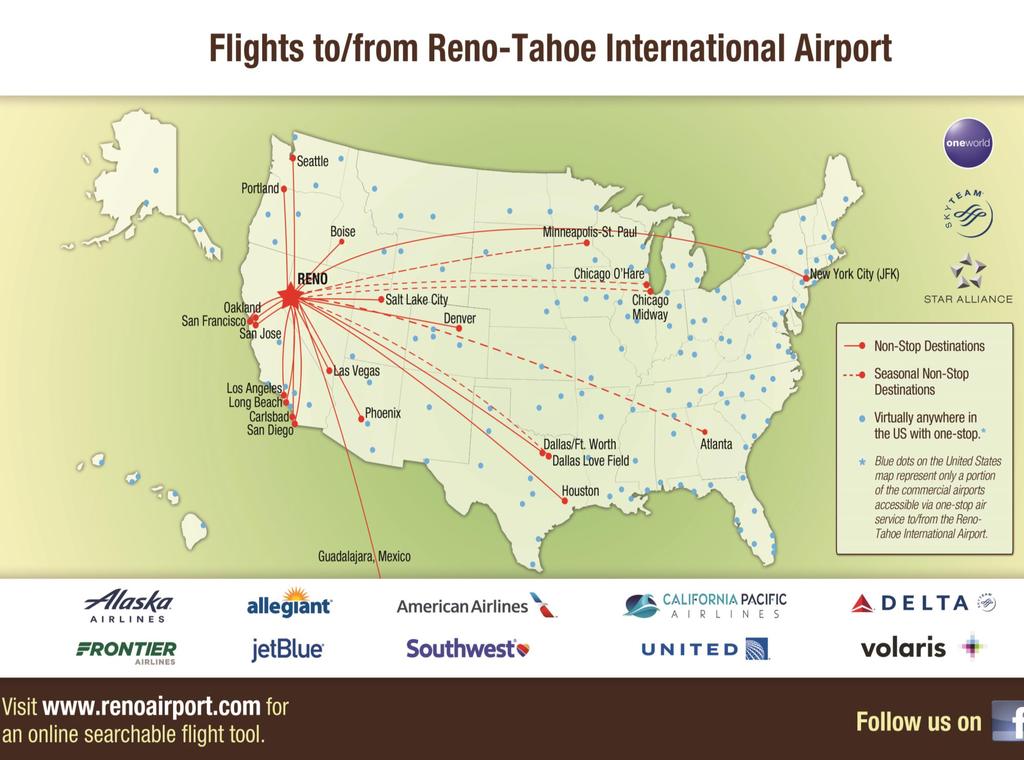
12 Route Map in November 2014
13 14


14 Collaboration Results Exciting Non-Stop Flight Additions New York City May 2015 Boise November 2015 Oakland June 2016 Long Beach August 2016 Atlanta December 2016 Dallas Love Field January 2017 San Jose June 2017 Chicago O Hare June 2017 Denver November 2017 Carlsbad November 2018
15 Collaboration Results Exceptional Air Service Compared to Like-sized Communities Metro Core Based Statistical Area (CBSA) Airport Source: U.S. Census Bureau CBSA Estimates 2010 and INNOVATA Flight Schedule via Diio, Number of Destinations are based on Year Ending December 2017 Population 2010 (CBSA) in thousands Average Daily Departures 2017 Average Daily Seats (one way) 2017 Destinations Lexington, KY, US LEX , Fayetteville/Springd., AR, US XNA , Pensacola, FL, US PNS , Lansing, MI, US LAN Springfield, MO, US SGF , Reno, NV, US RNO , Flint, MI, US FNT , Corpus Christi, TX, US CRP ,288 3 Asheville/Hendersonville, NC, US AVL , Fort Wayne, IN, US FWA , Huntsville/Decatur, AL, US HSV , Mobile, AL, US MOB ,105 5 Santa Barbara, CA, US SBA ,436 7

16 Collaboration Results RTIA is an Economic Engine for the Region 63rd busiest commercial airport in U.S. Airport s economic impact analyzed by UNR College of Business & EKAY Consulting $3.1Billion per year for Washoe County $52 Million in tax revenues for northern Nevada $11 Million alone for Washoe County School District 4,127 jobs at Reno-Tahoe International & Reno-Stead Airports


17 Future Collaboration New flights/markets targeted Master Plan
18 Future Collaboration Potential Growth Markets Seattle Minneapolis/St. Paul Increase service on Alaska Year round on Delta Portland Atlanta Increase service on Alaska Year round on Delta Chicago Phoenix Metro Year round to Midway Year round to O Hare United and American Mesa: Allegiant (potential) New York City Daily service on JetBlue
19 RTIA Top Unserved Markets Potential Target Markets 90 Passengers Daily Each Way Year Ending June Source: U.S. DOT Origin and Destination Passenger Survey via Diio Mi, November 2018
20 Future Collaboration Target Markets Domestic and International Boston: JetBlue L.A. Basin Ontario: Southwest Burbank: Southwest, Alaska Orange County Washington D.C. Metro Dulles: United National: American Baltimore: Southwest Elko Discussion Markets Nashville San Antonio Detroit St. Louis Houston Hobby Regional Short Haul Network Eugene Monterey Springs Santa Rosa International Santa Barbara Fresno Palm Ontario Burbank

21 New Master Plan Charts Future for RNO Master Plan for Reno-Tahoe International Airport Began Oct. 2016, completed Jun Addresses airport growth, aviation industry changes, and FAA standards for next 20 years. Improvements on the horizon for: Concourses Terminal Ticketing & Passenger Flow Parking & Rental Car Facilities and more Master Plan Funding Airport federal funding is antiquated Future projects require creative solutions P3 could be wave of the future Actively exploring public-private partnerships for RNO

22 Questions?
PORTLAND INTERNATIONAL AIRPORT
 PORTLAND INTERNATIONAL AIRPORT (PDX) OPERATIONS & CITIES SERVED 2018 (AS OF SEPTEMBER) SCHEDULED ARRIVALS 268 SCHEDULED DEPARTURES 268 NONSTOP CITIES (AIRPORTS) 57 DOMESTIC CITIES 51 INTERNATIONAL CITIES
International Airport
 Update on Reno Reno-Tahoe Reno-Tahoe International Airport Carson City Culture & Tourism Authority January 14, 2019 CCCTA 01/14/19 Board Meeting Presentation Page 1 of 23 Board of Trustees Lisa Gianoli,
2016 Air Service Updates
 Air Service Update September 2016 2016 Air Service Updates February 2016 Pittsburgh new destination, 2x weekly April 2016 Los Angeles new departure, 1x daily Atlanta new departure, 1x daily Jacksonville
Passenger and Cargo Statistics Report
 Passenger and Cargo Statistics Report Reno-Tahoe International Airport October 2018 U.S. DOMESTIC INDUSTRY OVERVIEW FOR OCTOBER 2018 Systemwide RNO Carriers Domestic Flights year over year comparison Average
Reno-Tahoe International Airport: Giving Lift to the Community Washoe County Commission May 23, 2017
 Reno-Tahoe International Airport: Giving Lift to the Community Washoe County Commission May 23, 2017 Board of Trustees Rick Murdock Chairman City of Reno Andy Wirth Vice Chairman RSCVA Jessica Sferrazza
Hector International Airport Fargo, North Dakota
 Hector International Airport Fargo, North Dakota Volume 073 Twelve Months Ended September 2007 January 2008 Airlines Serving Fargo Carried 831 Onboard Passengers Per Day for the Twelve Months Ended September
Hector International Airport Fargo, North Dakota
 Hector International Airport Fargo, North Dakota Volume 072 Twelve Months Ended June 2007 November 2007 Airlines Serving Fargo Carried 830 Onboard Passengers Per Day for the Twelve Months Ended June 2007,
Norwegian's Free Airfare Promotion
 Norwegian's Free Airfare Promotion Start planning your next vacation with 200+ cruises to incredible destinations, including Alaska, Bahamas & Florida, Bermuda, Canada & New England, Caribbean, Mexican
Portland International Airport (PDX)
") Portland International Airport (PDX) Portland International Airport (PDX) is currently served by 14 international and domestic airlines offering more than 210 scheduled passenger arrivals and departures
Portland International Airport (PDX) Portland International Airport (PDX) is currently served by 14 international and domestic airlines offering more than 210 scheduled passenger arrivals and departures
World Class Airport For A World Class City
 World Class Airport For A World Class City Air Service Update April 2017 2017 Air Service Updates February 2017 Cleveland new destination, 2x weekly Raleigh-Durham new destination, 2x weekly March 2017
Rank Place State Native Hawaiian and Pacific Islander population (alone or in combination
 TABLE 2a: 100 Largest Places Ranked by Number of s (race alone or in *) Living in Hard-to- Census Rank Place State (alone or in 1 Honolulu (CDP) HI 64,196 11,130 17.3 2 New York City NY 14,981 8,211 54.8
2016 Air Service Updates
 Air Service Update May 2016 2016 Air Service Updates February 2016 Pittsburgh new destination, 2x weekly April 2016 Los Angeles new departure, 1x daily Atlanta new departure, 1x daily Jacksonville new
Passenger and Cargo Statistics Report
 Passenger and Cargo Statistics Report RenoTahoe International Airport September 2018 U.S. DOMESTIC INDUSTRY OVERVIEW FOR SEPTEMBER 2018 Systemwide RNO Carriers Domestic Flights year over year comparison
2016 Air Service Updates
 Air Service Update June 2016 2016 Air Service Updates February 2016 Pittsburgh new destination, 2x weekly April 2016 Los Angeles new departure, 1x daily Atlanta new departure, 1x daily Jacksonville new
2016 Air Service Updates
 2016 Air Service Updates February 2016 Pittsburgh new destination, 2x weekly April 2016 Los Angeles new departure, 1x daily Atlanta new departure, 1x daily Jacksonville new destination, 2x weekly Philadelphia
Passenger and Cargo Statistics Report
 Passenger and Cargo Statistics Report RenoTahoe International Airport December 2015 U.S. DOMESTIC INDUSTRY OVERVIEW FOR DECEMBER 2015 All RNO Carriers Domestic Systemwide year over year comparison Average
Passenger and Cargo Statistics Report
 Passenger and Cargo Statistics Report RenoTahoe International Airport July 2018 U.S. DOMESTIC INDUSTRY OVERVIEW FOR JULY 2018 Systemwide RNO Carriers Domestic Flights year over year comparison Average
Passenger and Cargo Statistics Report
 Passenger and Cargo Statistics Report RenoTahoe International Airport June 2018 U.S. DOMESTIC INDUSTRY OVERVIEW FOR JUNE 2018 Systemwide RNO Carriers Domestic Flights year over year comparison Average
Hector International Airport Fargo, North Dakota
 Hector International Airport Fargo, North Dakota Volume 081 Twelve Months Ended March 2008 July 2008 Airlines Serving Fargo Carried 838 Onboard Passengers Per Day for the Twelve Months Ended March 2008,
Passenger and Cargo Statistics Report
 Passenger and Cargo Statistics Report RenoTahoe International Airport November 2017 U.S. DOMESTIC INDUSTRY OVERVIEW FOR NOVEMBER 2017 Systemwide RNO Carriers Domestic Flights year over year comparison
World Class Airport For A World Class City
 World Class Airport For A World Class City Air Service Update October 2017 2017 Air Service Updates February 2017 Cleveland new destination, 2x weekly Raleigh-Durham new destination, 2x weekly March 2017
Passenger and Cargo Statistics Report
 Passenger and Cargo Statistics Report RenoTahoe International Airport January 2018 U.S. DOMESTIC INDUSTRY OVERVIEW FOR JANUARY 2018 Systemwide RNO Carriers Domestic Flights year over year comparison Average
Passenger and Cargo Statistics Report
 Passenger and Cargo Statistics Report RenoTahoe International Airport February 2018 U.S. DOMESTIC INDUSTRY OVERVIEW FOR FEBRUARY 2018 Systemwide RNO Carriers Domestic Flights year over year comparison
No local tax dollars are used to operate Reno-Tahoe International Airport
 Reno-Tahoe International Airport Fact Sheet No local tax dollars are used to operate Reno-Tahoe International Airport Every Day at RTIA Approximately 10,000 passengers arrive/depart RTIA Approximately
Lower Income Journey to Work Market Share From American Community Survey
 Lower Income Journey to Work Market Share From American Community Survey 2006-2010 Table 1: Overall National Data Table 2: Car, Truck or Van Table 3: Transit Table 4: Metrics Table 1 Work Trip Market Share:
Major Metropolitan Area Sales Tax Rates
 August 19, 2010 No. 239 FISCAL FACT Major Metropolitan Area Sales Tax Rates By Lawrence Summers Introduction General sales taxes levied by state, county and city governments in the United States vary greatly,
2012 Airfares CA Out-of-State City Pairs -
 2012 Airfares Out-of-State City Pairs - Contracted rates are from July 1, 2012 through June 30, 2013. Please note all fares are designated as () and ( ) in airline computer reservation systems. fares are
Passenger and Cargo Statistics Report
 Passenger and Cargo Statistics Report RenoTahoe International Airport September 2017 U.S. DOMESTIC INDUSTRY OVERVIEW FOR SEPTEMBER 2017 Systemwide RNO Carriers Domestic Flights year over year comparison
Passenger and Cargo Statistics Report
 Passenger and Cargo Statistics Report RenoTahoe International Airport June 2017 U.S. DOMESTIC INDUSTRY OVERVIEW FOR JUNE 2017 All RNO Carriers Domestic Systemwide year over year comparison Average Load
Passenger and Cargo Statistics Report
 Passenger and Cargo Statistics Report RenoTahoe International Airport September 2015 U.S. DOMESTIC INDUSTRY OVERVIEW FOR SEPTEMBER 2015 All RNO Carriers Domestic Systemwide year over year comparison Average
Airport Code BTR Airport Code GGG. Departure Times Arrival Times Departure Times Arrival Times
 Baton Rouge, LA and Longview, TX Airport Code BTR Airport Code GGG Sun Country Airlines Ticket Counter - Next to United - Main Times Arrival Times Terminal. Times Arrival Times Main Terminal - One Ticket
Passenger and Cargo Statistics Report
 Passenger and Cargo Statistics Report RenoTahoe International Airport July 2017 U.S. DOMESTIC INDUSTRY OVERVIEW FOR JULY 2017 Systemwide RNO Carriers Domestic Flights year over year comparison Average
November 2013 Passenger and Cargo Traffic Statistics Reno-Tahoe International Airport
 November 2013 Passenger and Cargo Traffic Statistics Reno-Tahoe International Airport December 26, 2013 U.S. DOMESTIC INDUSTRY OVERVIEW FOR NOVEMBER 2013 All RNO Carriers Domestic Systemwide year over
World Class Airport For A World Class City
 World Class Airport For A World Class City Air Service Update December 2018 2018 Air Service Updates February 2018 Delta Air Lines Seattle new departure, seasonal, 2x weekly Delta Air Lines Boston new
World Class Airport For A World Class City
 World Class Airport For A World Class City Air Service Update April 2018 2018 Air Service Updates February 2018 Seattle new departure, seasonal, 2x weekly Boston new departure, seasonal, 2x weekly March
Passenger and Cargo Statistics Report
 Passenger and Cargo Statistics Report RenoTahoe International Airport May 2018 U.S. DOMESTIC INDUSTRY OVERVIEW FOR MAY 2018 Systemwide RNO Carriers Domestic Flights year over year comparison Average Load
Passenger and Cargo Statistics Report
 Passenger and Cargo Statistics Report RenoTahoe International Airport April 2018 U.S. DOMESTIC INDUSTRY OVERVIEW FOR APRIL 2018 Systemwide RNO Carriers Domestic Flights year over year comparison Average
March 2014 Passenger and Cargo Traffic Statistics Reno-Tahoe International Airport
 March 2014 Passenger and Cargo Traffic Statistics Reno-Tahoe International Airport April 25, 2014 U.S. DOMESTIC INDUSTRY OVERVIEW FOR MARCH 2014 All RNO Carriers Domestic Systemwide year over year comparison
October 2018 October 2017 Change
 AIR TRAFFIC REPORT SUMMARY: OCTOBER PASSENGERS October October Change Domestic Passengers 1,969,141 1,861,225 5.8% International Passengers 89,328 74,157 20.5% Total Passengers 2,058,469 1,935,382 6.4%
Passenger and Cargo Statistics Report
 Passenger and Cargo Statistics Report RenoTahoe International Airport August 2015 U.S. DOMESTIC INDUSTRY OVERVIEW FOR AUGUST 2015 All RNO Carriers Domestic Systemwide year over year comparison Average
August 2014 Passenger and Cargo Traffic Statistics Reno-Tahoe International Airport
 August 2014 Passenger and Cargo Traffic Statistics Reno-Tahoe International Airport October 8, 2014 U.S. DOMESTIC INDUSTRY OVERVIEW FOR AUGUST 2014 All RNO Carriers Domestic Systemwide year over year comparison
January Air Traffic Statistics. Prepared by the Office of Marketing & Consumer Strategy
 January 218 Air Traffic Statistics Prepared by the Office of Marketing & Consumer Strategy This report includes only data submitted by airlines as of the date of publication: March 21, 218. Reports are
Passengers Boarded At The Top 50 U. S. Airports ( Updated April 2
 (Ranked By Passenger Enplanements in 2006) Airport Table 1-41: Passengers Boarded at the Top 50 U.S. Airportsa Atlanta, GA (Hartsfield-Jackson Atlanta International) Chicago, IL (Chicago O'Hare International)
December 2013 Passenger and Cargo Traffic Statistics Reno-Tahoe International Airport
 December 2013 Passenger and Cargo Traffic Statistics Reno-Tahoe International Airport January 24, 2014 U.S. DOMESTIC INDUSTRY OVERVIEW FOR DECEMBER 2013 All RNO Carriers Domestic Systemwide year over year
February Air Traffic Statistics. Prepared by the Office of Marketing & Consumer Strategy
 February 218 Air Traffic Statistics Prepared by the Office of Marketing & Consumer Strategy 1 This report includes only data submitted by airlines as of the date of publication: April 18, 218. Reports
Passenger and Cargo Statistics Report
 Passenger and Cargo Statistics Report RenoTahoe International Airport December 2016 U.S. DOMESTIC INDUSTRY OVERVIEW FOR DECEMBER 2016 All RNO Carriers Domestic Systemwide year over year comparison Average
Airport Noise Advisory Panel (ANAP)
") Airport Noise Advisory Panel (ANAP) Scheduled Daily Passenger Airlines Departures * 2011 - Reno-Tahoe International Airport (RNO) July (71 non-stop departures) Delta Airlines added one (1) non-stop to
Airport Noise Advisory Panel (ANAP) Scheduled Daily Passenger Airlines Departures * 2011 - Reno-Tahoe International Airport (RNO) July (71 non-stop departures) Delta Airlines added one (1) non-stop to
Passenger and Cargo Statistics Report
 Passenger and Cargo Statistics Report RenoTahoe International Airport January 2017 U.S. DOMESTIC INDUSTRY OVERVIEW FOR JANUARY 2017 All RNO Carriers Domestic Systemwide year over year comparison Average
Non-stop Scheduled Passenger Service at Fargo as of October Top 20 Domestic O&D Passenger Markets at Fargo Twelve Months Ended June 2006
 0 5000 10000 15000 20000 25000 30000 35000 40000 45000 50000 Airport Traffic Quarterly Non-stop Scheduled Passenger Service at Fargo as of October 2006 Top 20 Domestic O&D Passenger Markets at Fargo Twelve
Aviation Insights No. 5
 Aviation Insights Explaining the modern airline industry from an independent, objective perspective No. 5 November 16, 2017 Question: How has air travel in specific metropolitan areas changed in recent
Passenger and Cargo Statistics Report
 Passenger and Cargo Statistics Report Reno-Tahoe International Airport December 2014 U.S. DOMESTIC INDUSTRY OVERVIEW FOR DECEMBER 2014 All RNO Carriers Domestic Systemwide year over year comparison Average
December Air Traffic Statistics. Prepared by the Office of Marketing & Consumer Strategy
 December 217 Air Traffic Statistics Prepared by the Office of Marketing & Consumer Strategy 1 This report includes only data submitted by airlines as of the date of publication: February 2, 217. Reports
September 2013 Passenger and Cargo Traffic Statistics Reno-Tahoe International Airport
 September 2013 Passenger and Cargo Traffic Statistics Reno-Tahoe International Airport October 31, 2013 U.S. DOMESTIC INDUSTRY OVERVIEW FOR SEPTEMBER 2013 All RNO Carriers Systemwide year over year comparison
RTIA HIGHLIGHTS. Facts & Figures. History. Airlines Scheduled Service: Alaska American/ American Eagle Delta Southwest United US Airways
 A Publication of Reno-Tahoe International Airport Airlines Scheduled Service: Alaska American/ American Eagle Delta Southwest United US Airways Charter Service: Allegiant Air Air-Cargo Capital Cargo Intl.
Location, Location, Location. 19 th Annual NIC Conference NIC MAP Data & Analysis Service
 Location, Location, Location 19 th Annual NIC Conference NIC MAP Data & Analysis Service The Great Occupancy Decline 94% Occupancy Trends Majority Nursing Seniors Housing 93% 92% 91% 92.8% 91.0% 90% 89%
December 2012 Passenger and Cargo Traffic Statistics Reno-Tahoe International Airport
 December 2012 Passenger and Cargo Traffic Statistics Reno-Tahoe International Airport January 29, 2013 U.S. DOMESTIC INDUSTRY OVERVIEW FOR DECEMBER 2012 All RNO Carriers Systemwide year over year comparison
August Air Traffic Statistics. Prepared by the Office of Marketing & Consumer Strategy
 August 218 Air Traffic Statistics Prepared by the Office of Marketing & Consumer Strategy This report includes only data submitted by airlines as of the date of publication: October 17, 218. Reports are
August Air Traffic Statistics. Prepared by the Office of Corporate Risk and Strategy
 August 215 Air Traffic Statistics Prepared by the Office of Corporate Risk and Strategy Metropolitan Washington Airports Authority Air Traffic Statistics Table of Contents Summary Air Traffic Summary...
RANKING OF THE 100 MOST POPULOUS U.S. CITIES 12/7/ /31/2016
 OVERVIEW OF THE DATA The following information is based on incoming communication to the National Human Trafficking Hotline via phone, email, and online tip report from December 7, 2007 December 31, 2016
September Air Traffic Statistics. Prepared by the Office of Marketing & Consumer Strategy
 September 2018 Air Traffic Statistics Prepared by the Office of Marketing & Consumer Strategy This report includes only data submitted by airlines as of the date of publication: November 14, 2017. Reports
Chico Municipal Airport. Catchment Area Analysis Results
 Chico Municipal Airport Catchment Area Analysis Results Table of Contents Chico market overview 4 Comparative market analysis 9 Regional airport discussion 14 CIC catchment area results 19 2 Executive
January 2014 Passenger and Cargo Traffic Statistics Reno-Tahoe International Airport
 January 2014 Passenger and Cargo Traffic Statistics Reno-Tahoe International Airport March 12, 2014 U.S. DOMESTIC INDUSTRY OVERVIEW FOR DECEMBER 2013 All RNO Carriers Domestic Systemwide year over year
June Commission Presentation Director s Report
 June Commission Presentation Director s Report Rebecca Hupp Boise Airport Director JUNE 1, 2017 Airport Operations Update May 9 Airport Operations attended and presented at the 2017 National Weather Service
Airport Noise Advisory Panel (ANAP)
") Airport Noise Advisory Panel (ANAP) Scheduled Daily Passenger Airlines Departures * 2012 - Reno-Tahoe International Airport (RNO) April (60 + 1 non-stop departures) Continental discontinued their non-stop
Airport Noise Advisory Panel (ANAP) Scheduled Daily Passenger Airlines Departures * 2012 - Reno-Tahoe International Airport (RNO) April (60 + 1 non-stop departures) Continental discontinued their non-stop
Passenger and Cargo Statistics Report
 Passenger and Cargo Statistics Report RenoTahoe International Airport September 2016 U.S. DOMESTIC INDUSTRY OVERVIEW FOR SEPTEMBER 2016 All RNO Carriers Domestic Systemwide year over year comparison Average
October 2013 Passenger and Cargo Traffic Statistics Reno-Tahoe International Airport
 October 2013 Passenger and Cargo Traffic Statistics Reno-Tahoe International Airport December 4, 2013 U.S. DOMESTIC INDUSTRY OVERVIEW FOR OCTOBER 2013 All RNO Carriers Systemwide year over year comparison
March Commission Presentation Director s Report
 March Commission Presentation Director s Report Rebecca Hupp A.A.E. Boise Airport Director MARCH 1, 2018 Airport Operations Update FAA certification inspection revealed zero discrepancies We commend you
Pre-Response Meeting RLI # AV-01 Food & Beverage Service Terminals 1 & 2
 Pre-Response Meeting RLI #20120821-AV-01 Food & Beverage Service Terminals 1 & 2 January 17, 2013 FLL in Perspective 2011- FLL ranked as the 21 st busiest airport in the U.S. with 23,349,835 total passengers
Outlook for Air Travel
 University of Massachusetts Amherst ScholarWorks@UMass Amherst Tourism Travel and Research Association: Advancing Tourism Research Globally 2014 Marketing Outlook Forum - Outlook for 2015 Outlook for Air
Inter-Office Memo Reno-Tahoe Airport Authority
 Inter-Office Memo Reno-Tahoe Airport Authority Date: November 30, 2009 To: Statistics Recipients From: Krys T. Bart, A.A.E., President/CEO Subject: RENO-TAHOE INTERNATIONAL AIRPORT PASSENGER STATISTICS
Park-Related Total* Expenditure per Resident, by City
 Park-Related Total* per Resident, by City FY 2008 City Population Total Park per Resident Washington, D.C. 591,833 $153,324,830 $259 Seattle 598,541 $150,672,543 $252 Scottsdale 235,371 $50,429,049 $214
July 2012 Passenger and Cargo Traffic Statistics Reno-Tahoe International Airport
 July 2012 Passenger and Cargo Traffic Statistics Reno-Tahoe International Airport August 31, 2012 U.S. DOMESTIC INDUSTRY OVERVIEW FOR JULY 2012 All RNO Carriers Systemwide year over year comparison Average
RTIA HIGHLIGHTS. Facts & Figures. History. Airlines Alaska Allegiant Air American/ American Eagle Delta Southwest United US Airways
 A Publication of Reno-Tahoe International Airport Airlines Alaska Allegiant Air American/ American Eagle Delta Southwest United US Airways Air-Cargo DHL FedEx UPS Facts & Figures Everyday at RTIA Approximately
Get Smart Market Insights from Our Research Team Customer Conference
 Get Smart Market Insights from Our Research Team 217 Customer Conference Presenters Amanda Nunnink Amanda Nunnink Steve Steve Guggenmos Guggenmos Sara Steve Hoffman Griffin Steve Sara Griffin Hoffmann
September Air Traffic Statistics. Prepared by the Office of Marketing & Consumer Strategy
 September 217 Air Traffic Statistics Prepared by the Office of Marketing & Consumer Strategy This report includes only data submitted by airlines as of the date of publication: November 15, 217. Reports
Terminal A - At the Sun Country ticket counter. Departure Times Arrival Times Departure Times Arrival Times
 Omaha, NE Airport Code OMA Airport Code Terminal A - At the Sun Country ticket counter. Times Arrival Times Times Arrival Times Flight #: 8201 03/07/2019 7:55 PM 9:49 PM Laughlin, NV 03/11/2019 8:30 AM
Monthly Employment Watch: Milwaukee and the Nation's Largest Cities
 Monthly Employment Watch: Milwaukee and the Nation's Largest Cities A monthly report on employment trends in the nation s largest cities Prepared by: The University of Wisconsin-Milwaukee Center for Economic
U.S. Metropolitan Area Exports, 2015
 U.S. Metropolitan Area Exports, 2015 Jeffrey Hall Office of Trade and Economic Analysis Industry and Analysis Department of Commerce International Trade Administration September 2016 U.S. Metro Exports:
Population Estimates for U.S. Cities Report 1: Fastest Growing Cities Based on Numeric Increase,
 ulation s for U.S. Cities Report 1: Fastest Growing Cities Based on Numeric Increase, 2015-2015 1 Phoenix AZ 32,113 2.0 1,582,904 1,615,017 167,393 11.6 2 Los Angeles CA 27,173 0.7 3,949,149 3,976,322
May Commission Presentation Director s Report
 May Commission Presentation Director s Report Rebecca Hupp A.A.E. Boise Airport Director MAY 3, 2018 April Runway Closures April 5: 10R/28L, 10:00 a.m. 11:00 a.m. Lighting maintenance April 11: 10L/28R,
PUBLIC TRANSPORTATION INTRODUCTION
 PUBLIC TRANSPORTATION INTRODUCTION 1 OUTLINE Current Status and Recent Trends Significant Influences A Critical Assessment Arguments Supporting Public Transport Future Influences Ingredients for Future
RTIA HIGHLIGHTS. Facts & Figures. History. Airlines Alaska Allegiant Air American Delta JetBlue Southwest Thomas Cook United US Airways Volaris
 A Publication of Reno-Tahoe International Airport Airlines Alaska Allegiant Air American Delta JetBlue Southwest Thomas Cook United US Airways Volaris Air-Cargo DHL FedEx UPS Facts & Figures Everyday at
Suggested Arrival Time Prior to Departure: 1 Hour. Suggested Arrival Time Prior to Departure: 2 hours
 City and First City Detailed Flight Information Second City Detailed Flight Information Farmingdale, NY Airport Code FRG Airport Code Boarding Time 2:30 PM FRG Main Terminal Building Times Arrival Times
INDIANA INTERSTATE AND INTRASTATE LOCAL REDUCED CITY-PAIR FARES
 The following section contains city-pair fares that are lower than walkup mileage-based fares. Although shown in only one direction, the fares in this section apply in both directions, unless otherwise
Census Affects Children in Poverty by Professors Donald Hernandez and Nancy Denton State University of New York, Albany
 Phone: (301) 457-9900 4700 Silver Hill Road, Suite 1250-3, Suitland, MD 20746 Fax: (301) 457-9901 Census Affects in Poverty by Professors Donald Hernandez and Nancy Denton State University of New York,
The FMR history file contains the following fields, all for 2-bedroom FMRs. It is in EXCEL format for easy use with database or spreadsheet programs.
 The FMR history file contains the following fields, all for 2-bedroom FMRs. It is in EXCEL format for easy use with database or spreadsheet programs. GENERAL NOTES 1. There are no Fiscal Year 1984 FMRs
February Air Traffic Statistics. Prepared by the Office of Corporate Risk and Strategy
 February 215 Air Traffic Statistics Prepared by the Office of Corporate Risk and Strategy Commercial Total Dom Int'l Passengers % Change Air Traffic Summary February 215 Passenger Activity (in Millions)
Who Sprawls the Most?
 SPRAWL AMERICAN STYLE Who Sprawls the Most? Jackie Cutsinger Research Assistant, Center for Urban Studies Wayne State University Measuring Sprawl in Major Metros Regionally stratified, nationally representative
BLACK KNIGHT HPI REPORT
 CONTENTS 1 OVERVIEW 2 NATIONAL OVERVIEW 3 LARGEST STATES AND METROS 4 FEBRUARY S BIGGEST MOVERS 5 20 LARGEST STATES 6 40 LARGEST METROS 7 ADDITIONAL INFORMATION OVERVIEW Each month, the Data & Analytics
November Air Traffic Statistics. Prepared by the Office of Corporate Risk and Strategy
 November 214 Air Traffic Statistics Prepared by the Office of Corporate Risk and Strategy Air Traffic Statistics Table of Contents Summary Air Traffic Summary... 1 SH&E Air Traffic Schedule Activity...
Higher Education in America s Metropolitan Areas A Statistical Profile
 Higher Education in America s Metropolitan Areas A Statistical Profile MSA Study No.2 Higher Education in America s Metropolitan Areas A Statistical Profile CONTENTS Why Metro Areas? 1 Executive Summary
Access Across America: Transit 2014
 Access Across America: Transit 2014 Final Report CTS 14-11 Prepared by: Andrew Owen David Levinson Accessibility Observatory Department of Civil, Environmental, and Geo- Engineering University of Minnesota
ILLINOIS INTERSTATE AND INTRASTATE LOCAL REDUCED CITY-PAIR FARES
 The following section contains city-pair fares that are lower than walkup mileage-based fares. Although shown in only one direction, the fares in this section apply in both directions, unless otherwise
INDUSTRY CALENDAR DATE EVENT LOCATION
 INDUSTRY CALENDAR DATE EVENT LOCATION OCTOBER, 2017 2-5 ANMTA Fall Meeting Scottsdale, AZ 3-4 KS Rural In Telec Coalition Fall Meeting Witchita, KS 5-6 MN Telecom Alliance Fall Meeting Broklyn Park, MN
The Metropolitan Airports Commission and MSP International Airport
 The Metropolitan Airports Commission and MSP International Airport Brian Ryks, Executive Director and CEO Metropolitan Airports Commission My Flight Track Duluth Aberdeen St. Cloud Twin Cities Grand Rapids
(Flight Operated by Sun Country) - Sun Country Ticket Counter - City. Departure Times Arrival Times Departure Times Arrival Times
 - Sun Country Ticket Counter - City. Departure Times Arrival Times Departure Times Arrival Times") City and First City Detailed Flight Information Second City Detailed Flight Information Fargo, ND Airport Code FAR Airport Code - City Times Arrival Times counter/allegiant counter. Times Arrival Times
City and First City Detailed Flight Information Second City Detailed Flight Information Fargo, ND Airport Code FAR Airport Code - City Times Arrival Times counter/allegiant counter. Times Arrival Times
Monthly Employment Watch: Milwaukee and the Nation's Largest Cities
 Monthly Employment Watch: Milwaukee and the Nation's Largest Cities A monthly report on employment trends in the nation s largest cities Prepared by: The University of Wisconsin-Milwaukee Center for Economic
1Q 2014 Greater Atlanta HBA Builder Developer Lender Council meeting Information presented by. Atlanta Job Growth
 1Q 2014 Greater Atlanta HBA Builder Developer Lender Council meeting 5-21-2014 Information presented by Eugene James, Regional Director ejames@metrostudy.com 404-510-1080 connect on LinkedIn Atlanta Job
Bridget Rief, Vice President Planning and Development Metropolitan Airports Commission
 Bridget Rief, Vice President Planning and Development Metropolitan Airports Commission Topics Operations and Air Service Trends Economic Impact Striving for Excellence Planning for the Future Prep for
ACI-NA Data Conference: Forming Community Partnerships
 ACI-NA Data Conference: Forming Community Partnerships There is a difference between Northern and Southern Nevada Where is Reno-Tahoe? RNO is Centrally Located on the U.S. West Coast 3 Reno-Tahoe Physical