CHAUTAUQUA COUNTY/ DUNKIRK AIRPORT
|
|
|
- Nancy Cannon
- 5 years ago
- Views:
Transcription

1 CHAUTAUQUA COUNTY/ DUNKIRK AIRPORT May 2017 Airport Master Plan Update FINAL Prepared For: Chautauqua County, New York Prepared By: Passero Associates FAA AIP # NYDOT #
2 Chautauqua County/Dunkirk Airport Airport Master Plan Update i CONTENTS Table of Figures iii 1. Introduction Goals and Objectives of the Master Plan SWOT Analysis Review of Existing Studies Airport Master Plan Update Airport Layout Plan Update Runway Length Analysis Environmental Assessment Studies Commissioned for This Report Inventory of Existing Conditions Airport Background Airport Location Airport History Role in National Air Transportation System State System Plan Meteorological Conditions Magnetic Declination Airport Facility Inventory Airside Facilities Airspace Structure and Approach Procedures Airspace Structure Instrument Approaches Landside Facilities Property, Land Use and Zoning Existing Property Ownership Existing Land use and Zoning Considerations FORECAST of Aviation demand Introduction Historical Based Aircraft and Aeronautical Activity Historical Based Aircraft Levels Historical Aeronautical Activity Aviation Activity Projections Methodologies Forecast of Based Aircraft Based Aircraft Fleet Mix 3-6
3 Chautauqua County/Dunkirk Airport Airport Master Plan Update ii Forecast of General Aviation Operations Airport Utilization Forecast Local/Itinerant Operation Split Instrument Approaches Peaking Characteristics Summary of Recommended Forecasts Comparison to FAA Terminal Area Forecasts Summary Design Criteria/Facility requirements Introduction Airside Facility Requirements Critical Aircraft Runway Requirements Taxiway Requirements Airfield Support Equipment Requirements Landside Facility Requirements General Aviation Aprons Aircraft Hangars General Aviation Terminal Landside Facilities Support Facilities and Property Airport Rescue and Fire Fighting (ARFF) Fuel Storage/Deicing Snow Removal and Grass Cutting Equipment Property Summary Airport Development Plan Airport Development Alternatives and Concepts Alternatives Preferred Development Plan Environmental Overview Environmental Impact Categories Analysis Summary Airport Layout Plan Drawing Set Cover Sheet Data Sheet Existing Facilities 7-1
4 Chautauqua County/Dunkirk Airport Airport Master Plan Update iii 7.4. Airport Layout Plan Inner Portion of the Approach Surfaces Runway Runway Runway Runway Departure End of Runway Future FAR Part 77 Airfield Surfaces Terminal Area Plan Airport Land Use Map Property Map Summary of Changes to the ALP Set Development Phasing & Capital Improvement Program Development Phasing Capital Improvement Program Sources of Capital Funding Airport Financial Structure Conclusion 8-9 TABLE OF FIGURES Figure Vicinity Map Figure 2-2 New York State Aviation System Figure All Weather Wind Rose (13 knots) Figure VFR Weather Wind Rose (13 knots) Figure IFR Weather Wind Rose (13 knots) Figure 2-6 Runway/Taxiway System Figure Box PAPI Schematic Figure 2-8 Surrounding Airspace Figure 2-9 Runway 6 GPS Approach Figure 2-10 Runway 24 GPS Approach Figure 2-11 Runway 33 GPS Approach Figure 2-12 Runway 15 GPS Approach Figure 2-13 Runway 24 VOR Approach Figure Landside Facilities Figure Fuel Facilities Figure 2-16 Existing Airport Property
5 Chautauqua County/Dunkirk Airport Airport Master Plan Update iv Figure 2-17 Existing Zoning Map Figure 3-1 Historical Based Aircraft Figure 3-2 Historical Aeronautical Activity Figure 4-1 Taxiway Design Group Figure 4-2 Runway Design Group B-II Figure 4-3 Runway Design Group C-II Figure 4-4 Taxiway Design Standards based on Airplane Design Group (ADG) Figure 4-5 Taxiway Design Standards Figure 4-6 Approach/Departure Standards Table Figure 4-7 TSS/20:1 Visual Slope Penetrations to Runway 6# Figure 4-8 TSS/Visual 20:1 Slope Penetrations to Runway Figure 4-9 TSS/Visual 20:1 Slope Penetrations to Runway Figure 4-10 TSS/Visual 20:1 Slope Penetrations to Runway Figure 4-11 GQS Penetrations to Runway Figure 4-12 GQS Penetrations to Runway Figure 4-13 GQS Penetrations to Runway Figure 4-14 GQS Penetrations to Runway Figure 5-1. Airfield Development Alternative # Figure 5-2. Airfield Development Alternative # Figure 5-3. Airfield Development Alternative # Figure 5-4. Airfield Development Alternative # Figure 5-5. Airfield Development Alternative # Figure 5-6. Alternative 5 Declared Distances Figure 8-1. Short -term Graphic for Development
6 Chautauqua County/Dunkirk Airport Airport Master Plan Update v TABLE OF TABLES Table 2-1. Recent FAA Grant History Table 2-2. Recent NYSDOT Grant History Table 2-3. Wind Conditions Table 2-4. Runway System Data Table 2-5. Pavement Condition Table Table 2-6. Airports in the Region Table 2-7. Instrument Approach Minima Table 2-8. Existing Hangar Facilities Table 3-1. Trend Line Growth Rates Table 3-2. FAA National Aerospace Forecasts by Aircraft Type Table 3-3. Based Aircraft Projections Table 3-4. Preferred Forecast of Based Aircraft Table 3-5. Based Aircraft Fleet Mix Forecast Table 3-6. General Aviation Operations Projections Table 3-7. Preferred Forecast of Aeronautical Operations Table 3-8. Utilization Forecast Local vs, Itinerant Table 3-9. Instrument Approaches Table Peaking Operations Table Summary of Forecasts Evaluated on this Project Table Summary of Forecasts versus FAA TAF forecasts Table Airport planning Forecast Breakdown Table Airport Planning Forecast Breakdown (OPBA) Table 4-1 Aircraft Approach Category (AAC) Table 4-2 Airplane Design Group Table 4-3 Airfield Compliancy Matrix Table 4-4 Obstructions to TSS/Visual 20: Table 4-5 Obstructions to GQS Table 4-6 Runway Designation Calculation Table 4-7 Apron Designation Calculation Table 4-8 Hangar Facility Requirements Table 4-9 GA Terminal Gross Area Analysis Table 4-10 Summary of Facility Requirements Table 5-1. Evaluation Criteria for Future Development Initiatives
7 Chautauqua County/Dunkirk Airport Airport Master Plan Update vi Table 5-2. Declared Distances for Alternative Table 5-3. Declared Distances for RDC C-II Table 8-1. Phased Development Plan Matrix Table 8-2. Near-Term Capital Improvement Program Table 8-3. Mid-Term Capital Improvement Program Table 8-4. Mid-Term Capital Improvement Program APPENDICES Appendix A - Appendix B - Appendix C - Appendix D - Appendix E - Appendix F - Appendix G - Appendix H - Appendix I - Appendix J - Technical Advisory Committee Based Aircraft Inventory Environmental Information Takeoff Minimums, Departure Procedures, and PAPI OCS Pavement Management Study Summary FAA Forecast Approval Letter ALS Support Information Equipment List Maps ALP Set
8 Chapter One Introduction, Goals, and Objectives
9 Introduction, Goals, and Objectives INTRODUCTION Chautauqua County/Dunkirk Airport (DKK) is a publicly-owned, public-use general aviation airport. Chautauqua County, the airport sponsor, initiated this Master Plan Update for DKK to determine future airport needs. The Master Plan purpose depicts the sponsor s strategy for future airport development. Since the last update of the Airport s Master Plan and federally approved airport layout plan (2003), the Airport has experienced several facility improvements. Specifically, in 2008 the County undertook a Runway Length Analysis study that determined additional runway length was required on Runway 6-24 to adequately serve the business jet aircraft using the airport. In 2013 the runway extension was complete. The Master Plan is being revised to reflect the changes to the airport and its users since 2003, and considering the recently completed runway extension, and to protect aeronautical operations both now and into the foreseeable future to ensure DKK remains an operationally safe and efficient transportation facility able to serve the general and business aviation needs of its users and tenants. This study will review the prior planning efforts conducted for the Airport, analyze market conditions and future requirements, and present an updated master development plan for the Chautauqua County/Dunkirk Airport. A review of existing airport infrastructure and facilities, A forecast of aeronautical demand developed using a variety of methodologies, An analysis of airport development alternatives. Preparation of Airport Layout Plan (ALP) set, and Preparation of a Capital Improvement Plan (CIP) Goals and Objectives of the Master Plan The overarching goal of this study is to determine how DKK can best position itself to provide for safe, reliable, and efficient aeronautical operations, accommodate growing and changing aeronautical demands, and communicate the Airport vision with community stakeholders and protect aeronautical operations with minimal impact on the environment. To simplify this broad goal, several specific goals and objectives can be identified for this study. These include: Goal #1 Develop the airport to be affordable/maintainable/sustainable within the projected economic forecasts and/or revenue forecasts. Objectives: Develop financial plan to include economic forecasts which considers usage, tax base, and community support; and revenue forecasts considers airport business plan and operating budget Goal #2 Develop the airport that supports local and regional economic goals while accommodating new opportunities or shifts in development patterns. Objectives: Develop an ALP that easily integrates with existing and proposed transportation infrastructure. Provide overview of obstructions that are critical to the continued operations during IFR conditions Provide a highly graphical, easily understood ALP update narrative and ALP set to enable the County to communicate the Airport s development initiatives. Pre-position the Airport to benefit from a broad range of funding sources including state and federal agencies. Strategic marketing, including public outreach, additional business users and funding Goal #3 - Engage Airport stakeholders in the visioning and planning process. Objectives: Establish and meet regularly with a Technical Advisory Committee (TAC) as part of the master planning process.
10 Introduction, Goals, and Objectives 1-2 Provide a forum for stakeholders to discuss future planning needs of the Airport. Integrate the contributions of the TAC into the master plan and ALP SWOT Analysis A SWOT (Strength, Weaknesses, Opportunities and Threats) Analysis was reviewed with the Technical Advisory Committee (TAC) members. Following are the results of the analysis, which should be considered throughout the preparation of this Master Plan Update, ultimately affecting the goals and objectives stated above. Strengths: Runway Length FBO Stability and quality of services, low cost of aircraft maintenance Existing Operating Capability in terms of assets and land Location: surrounding land uses, potential users from south Erie County, developable land Proactive relationships between FBO, County and FAA VORTAC approaches Weaknesses: Lack of approach lighting system especially given weather in Western NY Age and condition of hangars Limited airport maintenance and operations staffing Location: not surrounded by vibrant economic activity Value of asset communicated to the surrounding community Potential economic shortfall for future projects Lack of suitable heated hangar space Existing RCO not usable by aircraft on ground to reach controlling ATC, only usable for Cleveland Center over flights Annual operating deficit Opportunities: Strategic location: attract users in south Erie County and future development without significant detrimental impact to surrounding community Installation of approach lighting system opportunity to market DKK as regional aviation center, and service provider Additional heated hangar facilities Work with IDA to promote airport to attract additional businesses Lands available for potential industrial park Threats: Declining local business presence, fewer users from local community Declining economic activity which may lead to fewer dollars available for local share of future projects Low visibility weather from the Lake, lack of approach lighting system, difficult to make out airport environment Public perception/lack of awareness of importance of DKK to the economic vitality and development of Western NY region Wind tower construction and its impact on DKK VORTAC and approach minima Surrounding property concerns over air traffic noise User fees if mandated by government, cost of flying Decommissioning of the DKK VORTAC Night instrument approaches not available due to obstructions
11 Introduction, Goals, and Objectives Review of Existing Studies To support the effort of updating the Chautauqua County / Dunkirk Plan and ALP drawings, several previously developed studies and reports pertaining to the Airport and its surroundings were referenced. The following sections identify and discuss the most substantive elements of these studies, as well as studies commissioned specifically for this study effort Airport Master Plan Update This first-time Airport Master Plan, represents a comprehensive study of Chautauqua County/Dunkirk Airport. This study identified the importance of this airport, as a general aviation airport, within the National Plan of Integrated Airspace. The study projected utilization rates, and highlighted facility improvements. The study resulted in the Airport Layout Plan, a graphic depiction of future airport development, and the FAA uses for funding Capital Improvement. The runways at the time were: Runway 6-24: 5000 x 100 and Runway 15-33: 4000 x 100. Major findings of this Master Plan were a 500 extension to Runway 24 and relocation of Newell Road and land acquisition Airport Layout Plan Update The based business jet aircraft owner was planning on transitioning his aircraft to a larger business jet, which was the driving force for the update to the airport layout plan. The major findings of this Airport Layout Plan Update were a 500 extension to Runway 24, land acquisition, installation on an approach lighting system on Runway 24, relocation of Newell Road, and a 500 extension to Runway 33. However, the runway extension was excluded from the ALP approval until such time as actual justification was going to be realized Runway Length Analysis Based on the findings of the 2001 Airport Layout plan, and the business jet aircraft users of the airport, warranted a runway length analysis to determine the appropriate runway length for Runway This Runway Length Analysis provided the justification for the runway extension for increased operational safety of existing aircraft customer base. The aircraft examined included: Citation XLS+, Cessna 525, 550, 560, 650, Challenger 300, 601, 604, Gulfstream 150, Hawker 400, Lear 31, 35, 45, 60. The results of the runway length analysis concluded that the runway extension on Runway 24 should be 1,000 instead of 500, as proposed in the 2001 Airport Layout Plan Update Environmental Assessment Based on the findings of the Runway Length Analysis, the next step was to environmentally clear the runway extension project through a thorough National Environmental Policy Act (NEPA) Environmental Assessment, verifying that the proposed extension would not result in significant environmental impacts. In 2013 the construction of the runway extension was completed Studies Commissioned for This Report Aeronautical Survey and Photogrammetry Col-EAst New aerial photogrammetry has been obtained by Col-East, as part of this study, to prepare for a lateral approach with vertical guidance on the new Runway Col-East s services were retained to provide these services, and work with the FAA s Airports GIS department to verify the information Pavement Management Study A Pavement Management Study to determine the true pavement strengths that are required to be reported to the flying public is included as part of this study too, under separate cover. Reference to the findings for pavement strength will be incorporated in later chapters of this document. The pavement managements study work included onsite field investigation of each pavement area on the airport, coupled with select pavement sections.

12 Chapter Two Inventory of Existing Conditions
13 Inventory of Existing Conditions INVENTORY OF EXISTING CONDITIONS The process of updating the Master Plan for the Chautauqua County/Dunkirk Airport (DKK) requires the collection and evaluation of baseline information relating to the Airport's property, facilities, services, tenants, access, and utilities. This information is vital in determining any expansions necessitated by the existing or anticipated future aeronautical demand. The information presented in this chapter was obtained through a variety of sources including; airport site visits; interviews with Airport Technical Advisory Committee Members, fixed base operator (FBO), examination of airport records; and review of other public documents Airport Background Airport Location Chautauqua County/Dunkirk Airport lies in the southwestern portion of New York State, in Chautauqua County. It is located in the Town of Sheridan, near the City of Dunkirk and the Chadwick Bay Region. The Town of Sheridan has a population of 2,673 (2010 Census). Its geographic location is latitude 42 o north, longitude 79 o west, with an elevation of 692 feet mean sea level. The airport is surrounded by sparse development, with an active railroad to the north. Figure 2-1 provides both a local vicinity map and regional location map of the Airport. Vehicle ground access to the airport is provided by Middle Road, which connects to New York Route 5 to the west, and Route 91 (Center Road) to the east, just north of the Town of Sheridan. Interstate 90 (New York Thruway) passes the airport to the south Airport History Originally built between , by the Department of Defense to host the Army Air Force in case of coastal attack. Between Dunkirk Airport was used for flight training under the GI Bill. In the 1950 s the airport was abandoned and used for grand prix sports car racing. In 1960 s The DKK VOR was added to the airport, and Dunkirk Aviation was founded as the FBO, located at the airport. The two intersecting runways each measured 4,000 feet. In 1964 Runway 6-24 was rehabilitated using Federal Airport funds and two hangars were constructed. In 1969 Runway 6-24 was extended to 5,000 feet. After the war the City took ownership of the airport, which was later transferred from the City to the County in the late 1980s. Numerous paving and lighting projects have been undertaken since then. In 2010 the T-hangars were constructed and then in 2013 Runway 6-24 was extended to 6,000 feet long to accommodate the business jet aircraft using the airport. Chautauqua County/Dunkirk Airport is owned and operated by Chautauqua County. A fixed base operator (FBO) provides aviation related services under contract with the County. This public-use, general aviation airport is used for recreation, flight school and business operations, providing services to small single and multi-engine aircraft, as well as business jet aircraft Grant History Table 2-1 contains a detailed history of Federal Aviation Administration (FAA) Airport Improvement Program (AIP) grants the airport has received for Capital Improvement Projects (CIPs). A list of New York State Department of Transportation Grants is also provided in Table 2-2.
14 Inventory of Existing Conditions 2-2 Table 2-1. Recent FAA Grant History YEAR DESCRIPTION Install Runway 6-24 Lighting with MIRLs Rehabilitate Taxiway A (Design), Rehabilitate Runway 6-24 (Construct) Construct Taxiway B (Construct),Acquire Snow Removal Equipment Remove Obstructions (Design), Extend Runway 6-24 (Design), Construct Taxiway A (Construction) Acquire Snow Removal Equipment, Rehabilitate Taxiway Lighting (Design), Remove Obstructions (Construction); Rehabilitate Taxiway Lighting (Construction) Install Apron Lighting, Improve Snow Removal Equipment Building, Extend Runway 6-24 (Design) Extend Runway 6-24 (Design), Conduct Airport Master Plan Rehabilitate Apron, Expand Apron Rehabilitate Runway 6-24 (Construction) Extend Runway 6-24 (Design); Acquire Snow Removal Equipment Construct Taxiway B, Install Apron Lighting, Improve Airport Drainage Install Visual Guidance System; Install Airfield Guidance Signs- Rwys 6, 15 and 33 (Design) Install Visual Guidance System; Install Airfield Guidance Signs - Rwys 6, 15, and 33(Construction), Extend Taxiway C and D Rehabilitate Taxiway C and D (Construction) Improve Runway 24 Safety Area (Design) Improve Runway 24 Safety Area (Construction) Install Runway Lighting (MIRL & REIL), Visual Approach Aids (Design) Install Runway Lighting and Visual Approach Aids (Construction) Install Perimeter Fencing (Approx, 22,000 LF) (Construction) Update Airport Layout Plan (Obstruction Study) Rehabilitate Runway (Design); Install Underdrains Construct Sand Storage Building Rehabilitate and Mark Runway 15-33, including installation of underdrains, Improve Access Road (Construction: Phase 1) Acquire Snow Removal Equipment Construct Apron and Rehabilitate Taxiway (Design) Acquire Snow Removal Equipment Rehabilitate Runway 6-24 (Design) Construct Apron, Install Misc NAVAIDs, Rehabilitate Taxiway Acquire Snow Removal Equipment
15 Inventory of Existing Conditions Rehabilitate Taxiway A (Construction) Construct Snow Removal Equipment Building Conduct Aeronautical Survey Runway Conduct Runway Length Analysis Runway Rehabilitate Runway 6-24 (Design) Conduct Environmental Study Acquire Land for Approaches (Engineering, appraisal and negotiations) Rehabilitate Runway 6-24 (Construction) Construct Taxiway (Design) Acquire Land for Approaches Extend Runway 6-24 & Parallel Taxiway including NAVAIDs and Relocation of Newell Road (Design) Extend Runway 24 Relocation of Newell Road (Construction) Extend Runway 24 & Parallel Taxiway including NAVAIDs (Construction) Replace 24 Airfield Guidance Signs, Replace Segmented Circle and Install Two Wind Cones (Design and Construct), Rehabilitate Taxiway Lighting Obstruction Removal: all runway ends Construction Conduct Master Plan Update Table 2-2. Recent NYSDOT Grant History YEAR DESCRIPTION 2007 Reconstruct 16,000 SF Transient Aircraft Parking Apron and Pave 4,000 SF Vehicle Parking 2007 Repair Existing Fence, Install Security Cameras/Lighting, Upgrade Gate Locks/Access Cards 2008 Construct New T-Hangar 2009 Rehabilitate 51,000 SF Vehicle Parking Area Role in National Air Transportation System Chautauqua County/Dunkirk Airport is designated by the FAA as a publicly owned, public-use facility. Under the Airport and Airways Improvement Act, the Secretary of Transportation is required to publish a national plan for the development of public-use airports. This plan is published as the National Plan of Integrated Airport Systems (NPIAS) and includes all commercial service, reliever (high capacity general aviation airports in metropolitan areas), and select general aviation airports. The most recent NPIAS ( ) classifies DKK as a general aviation facility. The general aviation designation is given to airports that provide air service to mostly rural areas. General aviation facilities are an important component of the nation s airport system, providing air services to approximately one-fifth of the United States population.

16 Inventory of Existing Conditions 2-4 Figure Vicinity Map Source: Yahoo Maps A recent FAA report, entitled General Aviation Airports: A National Asset, further typified general aviation airports into four categories based on existing activity measures, such as based aircraft and the number and type of flights. This report categorized the Chautauqua County/Dunkirk Airport as a regional general aviation field. Airports in this category are generally recognized by the report to support regional economies by connecting communities to statewide and interstate markets State System Plan Chautauqua County/Dunkirk Airport is one of 467 regional airports in the state. Per the 2008 New York State Aviation System Plan (NYSASP) DKK is one of 21 general aviation airports in the state that has a runway length between 5,000 to 7,999 feet. It is one of three general aviation airports in the Southern Tier West Region, which includes the three counties of Chautauqua, Cattaraugus, and Allegany. Four are included in the State Aviation System Plan: Chautauqua County/Jamestown Airport, Chautauqua County/Dunkirk Airport, Cattaraugus County Olean Airport and Wellsville Municipal Airport. Chautauqua County/Jamestown Airport is considered a commercial airport, while the remaining three airports are considered general aviation per the NYSASP. Within the NYSASP Chautauqua County/Dunkirk Airport was identified as having a design ARC change from B-II to D-II, or aircraft

17 Inventory of Existing Conditions 2-5 with approach speeds between 91 knots but less than 121 knots, to approach speeds up to 166 knots, with wingspans greater than 49 feet but less than 79 feet, but there is no justification provided in the report for this. The airport is currently designed to B-II design standards, and the airport sponsor wishes to maintain the facility at B-II standards. Figure 2-2 depicts a map of airports, and their category. Figure 2-2 New York State Aviation System Source: New York State Aviation System Plan, Meteorological Conditions The climatic conditions commonly experienced at an airport can play a large role in the layout and usage of the facilities. Weather patterns characterized by periods of low visibility and cloud ceilings often lower the capacity of an airfield, and wind direction and velocity dictate runway usage. Detailed meteorological data and analytics were obtained through the on-site DKK AWOS and online sources. Per historical records for Chautauqua County/Dunkirk Airport ( July is the hottest month of the year, with the average mean temperature 81 o F, and January is the coldest month with the average mean temperature at 21 o F Ceiling and Visibility FAA Advisory Circular (AC) 150/5060-5, Airport Capacity and Delay, identifies three categories of ceiling and visibility minimums. These categories include Visual Flight Rules, and Instrument Flight Rules (IFR). Meteorological data was
18 Inventory of Existing Conditions 2-6 obtained through the National Climatic Data Center (NCDC) consisting of 10 years of hourly observation and environmental conditions as reported by the Automated Surface Observing Station (ASOS) located on the airfield. This data covered , and was analyzed to explore ceiling, visibility, and wind conditions at the Airport, defined below: VFR conditions, when the ceiling is equal to or greater than 1,000 feet above ground level (AGL) and when visibility is equal to or greater than three (3) statute miles, occur at the Airport approximately 95 percent of the time. IFR conditions, when the ceiling is less than 1,000 feet AGL and/or when visibility is less than three (3) statute miles, but when ceiling is greater than 200 feet AGL and visibility is greater than 0.5 statute miles, occur at the Airport approximately 5.1 percent of the time Wind Coverage The orientation of runways for takeoff and landing operations is primarily a function of wind velocity and direction taken together with the ability of aircraft to operate under adverse conditions. Generally, the primary runway at an airport is oriented as closely as practical in the direction of the prevailing winds. The most desirable runway configuration will provide the largest wind coverage for a given maximum crosswind component. The crosswind component is the vector of wind velocity and direction, which acts at a right angle to the runway. Further, runway wind coverage is that percentage of time in which operations can safely occur because of acceptable crosswind components. The FAA has set the criterion for desirable wind coverage for a runway system at 95% based on different allowable crosswind components based on the runway design code (RDC) for each runway. Presently, both Runway 6-24 and Runway are classified with an RDC of B-II, aircraft with approach speeds between 91 knots and less than 121 knots, and wingspans between 49 feet but less than 79 feet. Based on FAA guidance, wind coverage for the Airport should be calculated using a 13-knot crosswind component for RDC B-II runways. Table 2-3 and Figures 2-3, 2-4, and 2-5 present the All Weather, VFR, and IFR windroses as required by the FAA. The runway system provides greater than 95% wind coverage, as recommended by FAA guidance. Table 2-3. Wind Conditions All Weather VFR IFR 10.5 knots 13 knots 10.5 knots 13 knots 10.5 knots 13 knots Runway % 29.54% 28.61% 29.58% 19.01% 29.48% Runway % 67.28% 63.77% 67.17% 67.65% 68.99% Runway % 96.09% 91.65% 96.01% 95.92% 97.74% Runway % 44.08% 39.62% 44.98% 25.48% 27.65% Runway % 44.06% 37.99% 43.55% 42.22% 53.61% Runway % 87.28% 76.79% 87.68% 66.74% 80.2% Runway 6-24 & Runway Combined 98.05% 99.54% 97.98% 99.52% 99.27% 99.90% Source: National Climatic Data Center, , Station , Latest 10 years reported, as obtained from FAA-AGIS Windrose Generator Magnetic Declination Magnetic declination, sometimes called magnetic variation, is the angle between magnetic north and true north. This angle varies relative to one's position on the earth's surface and over time. Current magnetic declination information was derived from the National Geophysical Data Center (NGDC) database in November, Magnetic declination for the Chautauqua County/Dunkirk Airport was calculated to be West. Chapter 4 will address if this declination changes the runway numbers.
19 Figure All Weather Wind Rose (13 knots) Inventory of Existing Conditions 2-7
20 Figure VFR Weather Wind Rose (13 knots) Inventory of Existing Conditions 2-8
21 Figure IFR Weather Wind Rose (13 knots) Inventory of Existing Conditions 2-9
22 Inventory of Existing Conditions Airport Facility Inventory The following sections provide a detailed account of airport facilities and equipment by focusing on airside and landside facilities separately. Airside facilities are those considered integral to the aeronautical activity of the airport while landside facilities are those which utilize the airside facilities or are non-aeronautical in nature but reside on Airport property Airside Facilities Airside facilities generally include those required to support the movement and operation of aircraft. While this most certainly involves the Airport s runway and taxiway system, it also includes the available instrument approaches, airfield lighting, pavement markings, takeoff and landing aids, and airfield signage. Figure 2-7 illustrates the runway and taxiway system. The Airport s facilities will be reviewed against criteria in FAA Advisory Circular AC 150/ A, Airport Design. Both runways have been designed to runway design code (RDC) of B-II, capable of accommodating aircraft with approach speeds less than 121 knots and wingspans less than 79 feet Runway System DKK is developed with two intersecting runways, as shown in Figure 2-6. Runway 6-24 Runway 6-24 is the primary runway at DKK measuring 6,000 feet long by 100 feet wide. Constructed of grooved asphalt, Runway 6-24 was most recently extended in 2013, and the original pavement (5,000 x 100 ) was resurfaced in The pavement is in good condition. There are no displaced thresholds. There is a full-length parallel taxiway on the north side of the runway. The published weight bearing capacity is 49,600 pounds for single wheel gear aircraft. Runway Runway measures 4,000 feet long by 100 feet wide. Constructed of asphalt, the runway was rehabilitated in The pavement is in satisfactory condition. There are no displaced thresholds. There is a full-length parallel taxiway on the west side of the runway. The published weight bearing capacity is 49,600 pounds for single wheel gear aircraft. Runway Protection Zone The function of the runway protection zone (RPZ) is to enhance the protection of people and property on the ground. This is recommended by the FAA to be achieved via airport ownership or control of lands within the limits of the RPZ and clearing of incompatible objects and activities within the area. Structurally, the RPZ is a trapezoidal area at ground level initiating at a point past the runway threshold and runway departure end. The exact dimensions of an RPZ are dependent upon the type of aircraft making regular use of the runway and the lowest visibility minimums available to the runway. Runway Safety Area The Runway Safety Area () is a defined surface surrounding the runway prepared and suitable for reducing the risk of damage to aircraft in the event of an undershoot, overshoot, or excursion from the runway. The should be cleared and graded and have no potentially hazardous ruts, humps, depressions, or other surface variations and should be drained by grading or storm sewers to prevent water accumulations. Additionally, the should be free of objects except those fixed by function such as runway lighting and navigational aids. Similar to the RPZ, the dimensions of the are dependent upon the type of aircraft making regular use of the runway and the lowest visibility minimums available to the runway. Appendix G will include graphics showing the runway safety area off each runway end, based on the preferred design alternative.
23 Inventory of Existing Conditions 2-11 Runway Object Free Area The Runway Object Free Area () is centered about the runway centerline. The required clearing standard for the is to remove aboveground objects protruding above the nearest point of the unless fixed by function. Objects not essential to air navigation or ground maneuvering should not be located within the limits of the. Table 2-4. Runway System Data Runway Runway Design Code (RDC) B-II B-II Length / Width 4,000 / 100' 6,000 / 100' Threshold Crossing Height Landing Pattern Left Left Surface Asphalt Asphalt - Grooved Condition Satisfactory Good Single Wheel Strength 49,600 lbs. 49,600 lbs Instrument Procedures GPS GPS VOR/GPS VOR/GPS Lighting Medium High Approach No No End Identifier No Yes VGSI 4-PAPI 4-PAPI 4-PAPI 4-PAPI Markings Non-Precision Non-Precision Condition Good Good Displaced Threshold No No RPZ Dimensions 500' IW, 700' OW, 1,000' L 500' IW, 700' OW, 1,000' L Dimensions 150' Wide / 300'BDE / 300 PTh 150 Wide / 300'BDE / 300' PTh Dimensions 500 Wide / 300 BDE / 300' PTh 500' Wide / 300' BDE / 300' PTh Source: Airport 5010, Facility Survey, 2013, FAA NFDC Database. Notes: IW = Inner Width; L= Length; OW= Outer Width; BDE = Beyond Departure End; PTh = Prior to Threshold Taxiway System DKK maintains several taxiways and taxilanes, as shown in Figure 2-6, and described below. Taxiway Alpha Taxiway Alpha (A) provides full-length access from the Runway 6 end, to the Runway 24 end, through the main parking area, with two intersecting access taxiways to Runway 6-24, known as Taxiway A1 and A2. This taxiway is 40
24 Inventory of Existing Conditions 2-12 feet in width. This taxiway is offset 400 feet near Runway 24, and greater than 400 feet near the Runway 6 end in the main apron area. Taxiway Bravo Taxiway Bravo (B) is the parallel to Runway At 40 feet in width, connects the two runway ends, and intersects with Taxiway A to access the main apron. This taxiway is offset 300 from Runway Access Taxilanes There are four access taxilanes on the airport. The first one occurs north of Taxiway A to access a privately-owned hangar near end of Runway 24. The second taxilane connects to Taxiway B, near Runway 15 end to provide access to apron and hangar space west side of Runway 15-33; the third connects the apron area to Taxiway A, east of the FBO building; and the last connects to Taxiway A, provides access to the T-Hangar on the west side of the airport. (see Figure 2-6). Taxiway/Taxilane Object Free Area The taxiway/taxilane object free area (TOFA) is centered about the taxiway/taxilane centerline and defines an area win which objects, other than those fixed by function, must be cleared to provide the appropriate safety clearance for an aircraft s wingtips. At present, the TOFA identified for the airfield is compliant with Airplane Design Group (ADG) II standards, 65.5 feet on each side of the taxiway Aprons Two large publicly accessible aprons exist on the airport. The main apron is accessible via Taxiway A. The other apron is on the west side of Runway 15-33, near the runway 15 end, with access provided by an access taxiway that connects to Taxiway B. As of this writing, the main apron is being rehabilitated. There will be 25 small aircraft tiedowns at the completion of the project. The main apron also provides access to the fuel facilities. The other apron, near Runway 15 end has 23 tie-downs for small aircraft and two large aircraft tie-downs. In total, there are 48 small tie-downs and two larger aircraft tie-downs Pavement Conditions New York State does not keep a database of the pavement condition for its airports; however more and more often the pavement condition is being requested by aircraft operators. For this reason, the Pavement Management Study is included as part of this study, and will be provided separately. Table 2-5 contains the existing pavements and their conditions. Table 2-5. Pavement Condition Table ITEM Runway 6-24 Runway Taxiway A Taxiway B T-Hangar Taxilane GA Taxilane (from main apron to TWY A) Transient Apron (Twy B) CONDITION Good Satisfactory Good North: Good; South: Satisfactory/Fair Good Good Good Main Apron Good, recently completed 2015 Source: Airfield Site visit October Note: Levels are good, satisfactory, fair and poor. At satisfactory the pavement should be considered for rehabilitation, while at Satisfactory/fair or below, the pavement should be full depth reconstruction

25 Figure 2-6 Runway/Taxiway System Inventory of Existing Conditions 2-13
26 Inventory of Existing Conditions Airfield Lighting and Equipment Proper airfield lighting is required at all airports that are utilized for nighttime operations. The existing lighting systems at the Airport allow for aircraft operations at night and are supported by equipment in the airfield electric vault. The airfield electric vault is located east of the main apron and north of Taxiway A. Identification Lighting Rotating beacons universally indicate the location and presence of an airport at night or in adverse weather conditions. The rotating beacon at DKK is found atop a freestanding tower erected in an open field west side of Middle Road, at the intersection of Terminal Drive and Middle Road. The beacon equipment atop the tower consist of a optical rotating system which projects two beams of light, one green and one white, 180 degrees apart. The beacon, which is in good condition, operates continuously during nighttime hours and when the airfield is under instrument conditions using a photocell trigger. The tower needs paint maintenance. Runway Lighting Runway lights allow pilots to identify the edges of the runway and assist them in determining the length remaining during periods of darkness or otherwise restricted visibility. These lighting systems are classified per their intensity or brightness. Presently Runway 6-24 is equipped with high intensity runway lights (HIRL). Runway is equipped with medium intensity runway lights (MIRL). Both systems, as well as the taxiway lighting system and PAPI, can be activated by pilots through the common traffic advisory frequency (CTAF) at MHz by keying their on-aircraft microphone in a sequence. None of the runway lighting is LED. The on-site FBO does not have the capability to manually control the lighting system within the FBO building. Consideration for a main control switch for all airfield lighting to be in the FBO building with separate switches for each runway, taxiway and apron in the future is warranted. The runway lights at DKK consist of base mounted light fixtures placed approximately 10 feet from the runway edge. Cables run between the fixtures in buried conduit and overall this lighting system is in good condition. The runway edge lights are white, except for each runway with an instrument approach (Runway 6 and Runway 24) where yellow replaces white for the last 2,000 feet to form a caution zone for landings. Runway lights are white the entire length. As part of the runway lighting system, the identification of the runway ends and thresholds are critical to a pilot during landing and takeoff. Runway end identification lights (REIL) provide pilots with a visual identification of the approach end of a runway during night, instrument, and marginal weather conditions. REIL system consists of a pair of synchronized white flashing lights that are situated on each side and abeam the runway end threshold lights. REILs are only available on Runway 6 and 24 end. Taxiway Lighting All taxiways at DKK are equipped with medium intensity taxiway lights (MITL). Taxiway lights continue around the apron areas. Lights are installed using base mounted light fixtures places 10 feet from the taxiway edge. LED taxiway lights on Taxiway A, from intersection of Runway to Runway 24 end are base mounted, blue lens. The remaining taxiway lights are not LED.
27 Inventory of Existing Conditions Pavement Markings Pavement markings delineate the various movement areas of the airfield. All runways at DKK are marked with nonprecision runway markings consisting of runway designation numbers, centerline striping, threshold stripes, and aiming point markers. All the taxiways and hangar taxilanes have visible centerline stripes with holding position markings located before any runway intersection Takeoff and Landing Aids Visual Glide Slope Indicators There are several airfield systems installed at airports which provide an identification of the aircraft's relation to the most appropriate glideslope when approaching a runway. At DKK, precision approach path indicators (PAPI) systems have been installed on all runway ends. Runways 6, 24, 15 and 33 are equipped with a 4-light PAPI system. PAPIs provide the pilot with visual descent information during an approach to a runway. These lights are typically visible from 5 miles during the day and up to 20 miles at night. PAPIs use a light bar unit that is installed in a single row perpendicular to the runway edge. The lights project a beam of white light in the upper segment and red light in the lower segment. Depending on the aircraft's angle in relation to these lights, the pilot will receive a combination that indicates his position relative to the desired glideslope (at Dunkirk, Runways 6, 24 and 15 are angled at Figure Box PAPI Schematic 3.00 glide path, while Runway 33 is angled at 3.10 glide path.) Wind Indicators/Segmented Circle Perhaps the most basic takeoff and landing aid is the windsock, which informs pilots as to wind direction and speed and suggests an operational pattern. There are three lighted wind socks on the field, one at the corner of the parking lot fence, near the FBO building, one near Runway 24 and one inside the segmented circle. There are no wind cones near Runway 15 or 33. This will be discussed further in section The segmented circle, which aids pilots in locating obscure airports, and provides a centralized location for such indicators and signal devices as may be required on an airport, is located between Runway 6 and Taxiway A near the main apron by the FBO building. Automated Surface Observing System The Airport has an automated surface observing system (ASOS) located west of the intersection of Taxiway A and B, which reports local weather conditions, such as airfield altimeter setting, wind data, temperature, dew point, and cloud/ceiling data, as well as the time the data was collected. Pilots can receive this information on the assigned radio frequency ( MHz) or through the dedicated telephone number This weather station is part of a national system of weather stations and its hourly observations are logged and maintained by the National Oceanic and Atmospheric Administration's (NOAA) National Climatic Data Center (NCDC), but are not self-reporting to be used for instrument approach procedures. VORTAC The DKK VORTAC (VHF Omni-Direction Range and Tactical Air Navigation) antennae is located on the airport across Runway 6-24 and the main apron. Installed in 1969 VOR station broadcasts a VHF radio composite signal including the navigation signal and station's identifier. The navigation signal allows the airborne receiving equipment to determine a bearing from the station to the aircraft (direction from the VOR station in relation to Magnetic North). DKK VORTAC is on radio frequency MHz. However, as part of the FAA s NEXTGEN (Next Generation) system, the FAA is positioning away from ground based navigation systems (VOR) to a satellite based system. As such the DKK VOR is on the FAA list to be decommissioned, or removed from service in the next 3-5 years. Prior
28 Inventory of Existing Conditions 2-16 to decommissioning every approach/flight corridor that uses this VOR will need to be re-written by the FAA, from using the VOR ground based system to using satellite navigation. The two pieces of equipment that are co-located with the VORTAC will remain in service. These are the Distance Measuring Equipment (DME) and Remote Communication Outlet (RCO), described below individually. Distance Measuring Equipment (DME) The distance measuring equipment (DME) is a transponder-based radio observation navigation technology that measures slant distance by timing the delay of the VHF or UHF radio signals. Aircraft use DME to determine their distance from a land-based transponder by sending and receiving pulse pairs two pulses of fixed duration and separation. DME are typically co-located with VORs. This ground-based antenna will continue to be maintained at DKK after the VOR is decommissioned. Presently the frequency is MHz. Remote Communication Outlet (RCO) A remote communication outlet (RCO) is co-located with the DKK VOR. An RCO is a remote aviation radio transceivers, established to extend the communication capabilities of Flight Information Centers (FIC) and Flight Service Stations (FSS). The RCO is used to make a radio call to the outlet as if the pilot were making the call directly to the FSS or FIC. The outlet will relay the call (and the briefer's response) automatically. The RCO at DKK is on frequency MHz. However, this RCO is connected directly to Cleveland Center. If an aircraft on the ground at DKK wishes to depart under instrument conditions they need to transmit to Cleveland Center on frequency MHz, and listen on frequency MHz, over the VOR, to receive their clearance from Buffalo Approach. With the decommissioning of the VOR the ability to listen on frequency MHz over the VOR is likely to be impacted. This will be addressed as part of the VOR decommissioning. While RCOs serve flight service stations, RTRs serve terminal air traffic control facilities. With the decommissioning of the VOR, DKK needs a remote transmitter/receiver (RTR) to have direct communication with Buffalo Approach on the ground. This will provide ground-to-ground communication between Buffalo Approach (air traffic controllers) and pilots located at this satellite airport. This will also create a way for pilots to receive en-route clearances or departure authorizations and cancel IFR flight plans. It will also allow pilots flying below the coverage of the primary air/ground frequency to continue to receive advisories from air traffic control. Presently aircraft cannot reach Buffalo Approach on frequency MHz until they are airborne and about pattern altitude Airfield Signage There are several internally illuminated airfield signs. These include mandatory instruction, location, direction, and designation signs. The mandatory signs include the holding position signs, which identify to pilots the limits of the Runway environment.
29 Inventory of Existing Conditions Airspace Structure and Approach Procedures Airspace Structure Airspace is classified as controlled or uncontrolled. Controlled airspace is supported by ground-to-air communications, NAVAIDs, and air traffic services. Figure 2-8 depicts the regional airspace surrounding DKK as shown on the Detroit sectional chart Class G Airspace Class G airspace does not provide controlled airspace, and operates around DKK from the surface up to 700 feet, before encountering controlled airspace. Within 25 nautical miles of the airport to the north is Canadian Airspace Airports in the Region When conducting a master plan study it is critical to consider the proximity of other airports and services provided within the region. Not only is air traffic directly affected by regional activity, but airports in proximity to each other often compete for market share of based aircraft, fuel sales, and other services. Further there is a potential for airspace conflict with nearby airports. Often airspace interaction requires adjustments to operating procedures to ensure the safe and efficient flow of traffic at all facilities. Table 2-6 identifies an airport having instrument approach procedures within 30 miles of DKK, while Figure 2-8 depicts the service area for DKK. Table 2-6. Airports in the Region LOCATION ID NAME DIRECTION DISTANCE KJHW Chautauqua County/Jamestown Airport South 20 nm Source: Airnav.com, 2014, Detroit Sectional Instrument Approaches During times of inclement weather, instrument approaches enable pilots to safely descend into the Airport environment for landing. There are several different instrument approaches that can be established, each with specific limitations. As the height of clouds and visibility deteriorate, the necessity for instrument approaches increases. When the cloud ceiling is greater than 1,000 feet above ground level (AGL) and the visibility is greater than three statute miles, the conditions are considered visual and pilots can operate under visual flight rules (VFR). In VFR conditions, no published approaches are required for an aircraft to safely land at an airport. However, once the cloud ceiling is less than 1,000 feet AGL and/or the visibility is less than three statute miles, pilots must operate under instrument flight rules (IFR). Additional air traffic control services are provided to pilots during IFR conditions. During the arrival phase, instrument approaches are what allow a pilot to safely navigate to and land on a runway.

30 Figure 2-8 Surrounding Airspace Inventory of Existing Conditions 2-18
31 Inventory of Existing Conditions Categories of Instrument Approaches There are two basic categories for instrument approaches: precision and non-precision. Both precision and nonprecision approaches provide course guidance to the runway centerline they serve. The degree of horizontal guidance increases with the sophistication of the instrument approach aid, which is reflected through the minimum operating parameters for each approach. The primary difference between a precision and non-precision approach is that the precision approach will also have vertical guidance for a specific runway end. This allows an aircraft to descend safely on a fixed glideslope signal, even when the runway environment is not yet in sight. All instrument approaches have heights published that dictate how low a pilot can descend without the runway environment in sight before having to abandon the approach and try again. For precision approaches this is called the decision height and for non-precision approaches, it is referred to as the minimum descent altitude (MDA). Both heights are published in the number of feet above the intended runway s touchdown zone elevation. In addition, every instrument approach has minimum visibility requirements, measured in feet or miles, at which an instrument approach can be attempted. For either type of approach, if visual contact cannot be made before the decision height or missed approach point, then the aircraft must execute a missed approach and either try again or go to an alternate airport Published Approaches for Chautauqua County/Dunkirk Airport Presently, DKK has published straight-in, non-precision instrument approaches to each runway end based on global positioning satellites (GPS). GPS is a satellite-based navigation system that consists of a network of satellites known as a constellation. This constellation provides a celestial reference for determining the position of any point on or above the Earth's surface. By analyzing the time delays of signals received from these satellites, air based receivers can determine latitude, longitude and altitude. Runway 6 and 24 also have very high frequency omni range (VOR) approaches, which is based off a radio signal from the VOR antennae on airport property. These VOR approaches will be eliminated as part of the VOR decommissioning. Approach minima consist of either a decision altitude (DA) or a minimum decent altitude (MDA) and a visibility condition. The DA and MDA essentially provide a pilot with a floor in the airspace he/she must remain above until making visual conformation of the runway end. The visibility condition expresses how poor the visibility can be before the approach is not available to any pilot and the airport is essentially closed to all traffic. The Table 2-7 tabulates the approach minima for the GPS approaches for Runway 6, 24 and 33. Figures 2-9 through Figure 2-13 presents the approach charts for each runway: Table 2-7. Instrument Approach Minima RUNWAY 6 RUNWAY 24 RUNWAY 15 RUNWAY 33 DA/MDA VISIBILITY DA/MDA VISIBILITY DA/MDA VISIBILITY VISIBILITY VISIBILITY LP MDA 403 AGL 1 Mile 407 AGL 1 Mile 316 AGL 1 Mile 1148 AGL 1 ¼ Mile LNAV MDA 503 AGL 1 Mile 427 AGL 1 Mile 376 AGL 1 Mile 1168 AGL 1 ¼ Mile CIRCLING 600 AGL 1 Mile 600 AGL 1 Mile 600 AGL 1 Mile 1168 AGL 1 ¼ Mile Notes: Rwy 6: Visibility increases to 1 1/8 for category C and D for LP straight-in;, increase to 1 3/8 for category C and D LNAV straight-in; and 2 ¾ for category C, and 3 for category D aircraft for Circling approaches. Rwy 24: Visibility increases to 1 1/8 for category C and D for LP straight-in; increase to 1 ¼ for category C and D LNAV straight-in, and 2 ¾ for category C, and 3 for category D aircraft for Circling approaches Rwy 15: Visibility increases to 1 1/8 for category C/D for LNAV straight-in, and 2 ¾ for category C and 3 for category D aircraft for Circling approaches Rwy 33: Visibility increases to 1 ½ for category B, 3 for category C and D for LP/LNAV straight-in and Circling approaches Source: FAA published instrument approach charts valid 27 APR 2017 to 25 MAY 2017.

32 Figure 2-9 Runway 6 GPS Approach Inventory of Existing Conditions 2-20

33 Figure 2-10 Runway 24 GPS Approach Inventory of Existing Conditions 2-21

34 Figure 2-11 Runway 33 GPS Approach Inventory of Existing Conditions 2-22

35 Figure 2-12 Runway 15 GPS Approach Inventory of Existing Conditions 2-23

36 Figure 2-13 Runway 24 VOR Approach Inventory of Existing Conditions 2-24
37 Inventory of Existing Conditions Landside Facilities Landside facilities at the Airport consist of support buildings and structures typically accessible to the airfield. This section will describe the Airport's supporting facilities that aid in the utilization of the airside facilities identified in the preceding sections. Figure 2-14 provides an overview of all landside facilities discussed in this section General Aviation Area Dunkirk Aviation is the full time FBO at the airport, residing near the main apron. This building is located immediately north of the main apron, providing amenities to pilots, office space, lobby, and bathrooms. This space is roughly 3,000 square feet, which includes both public and administrative spaces Airport Hangar Facilities There are a variety of hangar facilities throughout the airport property, mostly in the west- southwest sector of the airport. Figure 2-14 graphically depicts the hangars, while Table 2-8 provides a list of each. Building numbers follow the County s designations. The County leases buildings 1-9 to Dunkirk Aviation. Presently about 60% of the T- hangars are occupied, while the conventional hangars are 100% occupied, per the contracted FBO operator. Table 2-8. Existing Hangar Facilities # FACILITY DESCRIPTION TENANT SQUARE FEET 1 CONVENTIONAL HANGAR DUNKIRK AVIATION 4,680 2 CONVENTIONAL HANGAR DUNKIRK AVIATION 4,680 3 CONVENTIONAL HANGAR DUNKIRK AVIATION 3,720 4 CONVENTIONAL HANGAR DUNKIRK AVIATION 3,720 5 CONVENTIONAL HANGAR DUNKIRK AVIATION 1,600 6 CONVENTIONAL HANGAR DUNKIRK AVIATION 21,600 7 CONVENTIONAL HANGAR DUNKIRK AVIATION 4,800 8 CONVENTIONAL HANGAR DUNKIRK AVIATION 4,340 9 T-HANGAR DUNKIRK AVIATION 9,776 A DPF MAINTENANCE FACILITY CHAUTAUQUA COUNTY 23,000 B DPF EQUIPMENT STORAGE BUILDING CHAUTAUQUA COUNTY 6,500 C DPF STORAGE BUILDING CHAUTAUQUA COUNTY 2,400 D DPF SALT STORAGE BUILDING CHAUTAUQUA COUNTY 6,800 E AIRPORT POLE BARN CHAUTAUQUA COUNTY 2,280 F AIRPORT EQUIPMENT STORAGE BUILDING CHAUTAUQUA COUNTY 2,480 G AIRPORT SAND STORAGE BUILDING CHAUTAUQUA COUNTY 4,000 H AIRPORT (AIRFIELD) ELECTRICAL VAULT CHAUTAUQUA COUNTY 120 I CIVIL AIR PATROL TRAILER CIVIL AIR PATROL REMOVED J FIXED BASE OPERATOR DUNKIRK AVIATION 3,000 Notes: Dimensions taken from Google Earth Hangar #3 needs significant repair and likely will be removed from storing aircraft soon. In addition, there is a privately-owned hangar and fuel facility located northwest of Runway 6-24, closer to the 24 end that houses a business jet aircraft.

38 Figure Landside Facilities Inventory of Existing Conditions 2-26

39 Inventory of Existing Conditions 2-27 Automobile Parking The main paved parking lot for airport users is near the FBO building, off Terminal Drive. This parking lot can accommodate approximately 85 vehicles. A second parking lot is further north to access the Chautauqua County DPF buildings and is not included in calculations for airport users Aviation Fuel Storage and Usage The fuel storage at DKK is near the main apron. On the north side of the apron are two, in-ground, double-walled, for secondary containment, 100LL tanks, each 6,000 gallons. The tanks are in the turf area outside the FBO building. This service will offer both self-service and truck service. Included in the 2015 apron project a designated no parking area will be marked in front of this area. The second fuel system, for Jet A, is on the south side of the apron, consisting of two 10,000 gallon in-ground, coated steel. Refer to Figure Most often aircraft requiring Jet A fuel are services by truck, but sometimes there is a conflict on the apron for aircraft exiting the large hangar if an aircraft is parked at Jet A tank. Figure Fuel Facilities 100-LL Tank Jet A Tank Airport Administration and Maintenance Airport administration is performed by the County Department of Public Facilities, and the Chautauqua County Manager of Airports, with offices located at both the Chautauqua County/Dunkirk and Chautauqua County/Jamestown Airports. Airport Maintenance is located at the airport, inside the sand storage building; along with other Department of Public Works facilities on the west side of Terminal Drive. Airport equipment is utilized
40 Inventory of Existing Conditions 2-28 for all airport maintenance as required and stored in either the equipment storage building, or the sand storage building Airfield Security Security practices and procedures are not federally regulated at general aviation airports such as DKK. However, TSA published Security Guidelines for General Aviation Airports in May of 2004 which presents several best-practices for GA airport security and recommend specific practices based on a variety of airport characteristics and operational thresholds. NYSDOT has issued guidelines as well. DKK has filed their current NYSDOT registration and security plan, valid until The airport is surrounded by a security fence, and gates are either equipped with punch pads, key access or padlocks. Access cards are available to select employees and tenants, owner of aircraft based at DKK, with identification required and registration forms completed, prior to issue. Only authorized personnel have access to the airport operating area. Based aircraft are secured inside hangars. The airport has a firefighter s plan on file with the County and local fire department with all gates and hydrant locations Utilities Public utilities are provided at the airport. All electrical needs are provided from the Airport s dedicated vault, located on the west end of Building #6. Some of the proposed development opportunities may require the extension of electric power, and upgrading the equipment in the vault to meet the demand. The information in this section was determined from prior planning/engineering work as well as utility providers Property, Land Use and Zoning Compatible land use surrounding airports is an important issue when planning for airport growth and sustainability. The following sections will explore airport property ownership and controls as they relate to the Airport as an asset, both physically and operationally Existing Property Ownership Properties in and around the Airport are identified in Figure Airport property is comprised of 450 contiguous acres around the airport. Lands surrounding the airport are mostly open, undeveloped, or farmed land. To the east, between Runway 24 and 33 there are scattered residential development on the east side of Newell Road. To the north there are also scattered residential development, and farmlands. The remaining areas around the airport are open, undeveloped land. There is a commercial through-the-fence (CTTF) operations near Runway 24. This lease arrangements was originally entered in February 1998, with 5 year terms, most recently renewed in April There is also a non-aeronautical use portion of the airport parcel, used for the County DPW. Both of these uses are denoted on the plans Existing Land use and Zoning Considerations Proper land use planning and the level to which airport needs have been institutionalized into the larger context of regional planning and municipal growth management strategies varies considerably across the country. Dunkirk Airport lies within a single jurisdiction of the Town of Sheridan. This township s zoning includes: Agricultural, Residential, Commercial, Public Service and Industrial. The immediate surrounding areas are vacant, industrial and rural/residential. The Town of Sheridan has a review process in place to forward projects near airport to Chautauqua County for their review and input from the Airport Manager particularly relative to height. This is to ensure airspace is not compromised. Figure 2-17 present the existing zoning map in and around the Airport.

41 Figure 2-16 Existing Airport Property Inventory of Existing Conditions 2-29

42 Figure 2-17 Existing Zoning Map Inventory of Existing Conditions 2-30

43 Chapter Three Forecast of Aeronautical Demand
44 Historical Aviation Activities FORECAST OF AVIATION DEMAND 3.1. Introduction General aviation activity is influenced by local population, corresponding business activity and personal income, the cost of flying, the national economy, and number of based aircraft at the airport. Forecasts of aviation demand are presented in this chapter for a 20-year planning period ( ). The projections of aviation activity provide a basis for determining the type, size, and timing of aviation facility development. As a result, the forecast will influence subsequent chapters of this report. Forecasting future activity involves both analytical techniques and subjective considerations. The forecasting approach used in this analysis will be to identify methodologies to project future aviation demand, apply those methodologies to each forecast area of interest, and identify a preferred forecast of activity growth at the Airport. The preferred forecast will be identified through detailed consideration of the forecast analyses presented in this chapter. Aviation forecasts are divided into three planning periods: short-term (0-5 years), intermediate-term (6-10 years) and long-term (11-20 years). The forecasts shall form the basis for facility requirements and airfield capacity analysis. Historical information from airport operations, FAA Terminal Area Forecasts (TAF), Airport Master Record (FAA Form 5010), New York State Aviation System Plan, will be considered. The following forecasts will be developed and presented in this chapter: Based Aircraft Based Aircraft Fleet Mix Annual Aircraft Operations Aircraft Operations Local vs. Itinerant Instrument Approaches Peaking Characteristics 3.2. Historical Based Aircraft and Aeronautical Activity This section presents a general overview of long-term historical trends at DKK which can be identified through historical operational data. Focusing specifically on based aircraft and aviation activity levels, the historical operational information will be utilized to project future activity and based aircraft levels Historical Based Aircraft Levels A projection of GA aircraft that will be based at DKK is required for the proper planning of future airside and landside elements that may be required to facilitate the demand, such as aircraft parking apron, and the number and type of hangar space required. Historical based aircraft data was obtained primarily from the FAA TAF, The data was compared against based aircraft presented in the NYSASP. For the purposes of this study the TAF data will be used to identify historical activities at DKK, with official based aircraft records for 2010 thru 2014 provided by the fixed base operator (FBO). Figure 3-1 depicts the annual based aircraft counts from
45 Historical Aviation Activities 3-2 Figure 3-1 Historical Based Aircraft Source: Airport Records, FAA TAF Historical Aeronautical Activity Historically airport operations were significantly higher in the early reporting years, similar to when based aircraft were higher, have stabilized and remained within 30,000-35,000 operations since Since 2009 the annual reported operations were 29,520 general aviation operations, with an activity mix of 71.2% local and 28.8% itinerant. Figure 3-2 depicts the annual level of general aviation activity at the Airport Figure 3-2 Historical Aeronautical Activity Source: Airport Records, FAA TAF
46 Historical Aviation Activities Aviation Activity Projections Forecasts of aviation demand for DKK will serve as the basis for airport facility planning and facility development implementation to support the Airport s short-term initiatives. Although the prepared forecast covers an extended timeframe, aviation, social and economic trends can only be reasonably projects for the first five years. It is difficult to predict with a great deal of certainty the year-to-year changes in a dynamic aviation industry while forecasting 20 years into the future. Unexpected events in any of these trends, which cannot be factored into the assumptions of the forecast, can cause dramatic changes across the forecast period. Therefore, aviation activity forecasts should be continually evaluated and updated on a regular basis Methodologies The forecasts prepared herein are developed using two frameworks baseline methodologies and strategic scenarios. Both of these frameworks are described below, but generally, baseline methodologies will utilize traditional data analysis and forecasting techniques on verifiable data, whereas the strategic scenarios will introduce subjective elements to the forecasts expected to drive operational growth and overall activity at the Airport. Strategic scenarios could include such things as a new major tenant, an upstart air charter, waiting list of aircraft owners wishing to base at the airport, that may result in changes in operational activity that otherwise would not be forecasted via baseline methodologies Baseline Methodologies The most reliable approach to estimating future aviation demand is to use a variety of analytical techniques. Various methodologies are used throughout the industry including, trend line analysis, market share analysis and projecting along national growth rates. These methods have been applied to develop the most accurate forecast possible for DKK, and are described below in more detail. Trend Line Analysis Trend line analysis examines historical growth trends in activity at a specific airport and applies the historical trends to current demand levels to produce projections of future activity. Trend line analysis assumes that activity, and the factors which have historically affected activity, will continue to influence demand levels at similar rates over an extended period of time. Linear time series trend projections are typically used to provide baseline forecasts that reflect stable market conditions. FAA TAF information was used as the base of historic information. Conversations with TAC members indicated that the past five-year information from the TAF did not accurately depict the based aircraft counts on the airport. As a result, TAF historic information was amended for years based on airport records of based aircraft. Table 3-1 presents the historical growth trends in terms of average annual growth rate (AAGR), which have been identified for both based aircraft and GA operations at DKK. Table 3-1. Trend Line Growth Rates SHORT-TERM MID-TERM LONG-TERM (2-year) (4-year) (10-year) BASED AIRCRAFT (AAGR) 0.0% 0.0% 1.4% OPERATIONS (AAGR) 0.0% 0.0% -1.7% Source: Airport Records, FAA TAF Market Share Analysis Market share analysis, a method for projecting future aeronautical activity, is a relatively easy method to use, and can be applied to any measure for which a reliable higher-level forecast is available. Using this methodology, historical shares are calculated and used as a basis for projecting future shares. This approach is a top-down method of forecasting since forecasts of larger aggregates are used to derive forecasts for smaller elements of the system. For the
47 Historical Aviation Activities 3-4 purposes of performing market share analysis for DKK, data relative to the FAA s Eastern Region and the entire U.S. were reviewed for both general aviation operations and based aircraft. Specific growth rates used in the market share analysis are presented in the summary table in subsequent sections of this chapter. FAA Forecasts The FAA presents aviation forecasts in several different sources, which can be referenced when forecasting future aeronautical demands for a specific airport. Primarily, they include the FAA Aerospace Forecast, which provides growth projections for the entire aviation industry, and the FAA Terminal Area Forecasts (TAF), which utilizes identified national growth trends coupled with historical local growth trends to produce airport-specific activity forecasts. The FAA s national aerospace forecast for identified projected average growth rates for a variety of fixed wing aircraft through the end of its forecast period (2034). These growth rates are identified in Table 3-2 below. The FAA prepared TAF for DKK was not utilized in this analysis as it is unclear whether it had been updated, and maintained to the extent that it would be useful. The TAF projected no growth through Table 3-2. FAA National Aerospace Forecasts by Aircraft Type SINGLE ENGINE MULTI-ENGINE TURBO PROP TURBO JET HELI GA AIRCRAFT BY TYPE -0.40% -0.50% 1.60% 3.00% 2.60% GA HOURS FLOWN BY TYPE -0.60% -0.50% 1.80% 4.20% 2.80% Source: FAA National Aerospace Forecasts The table above identifies that no growth is anticipated in single and multi-engine piston aircraft activity, and in fact, very modest reductions could be realized over the forecast period. Conversely, the forecast projects strong growth in activities by turbo-prop and turbo jet aircraft. For purposes of projecting based aircraft at DKK using FAA Forecast methodology the average annual growth rate of 0.5 percent will be used as the FAA national aerospace forecast projects the active general aviation fleet to increase at that rate between The National Based Aircraft Inventory Program was reviewed and updated to reflect the actual based aircraft at DKK (refer to Appendix B). For the purposes of projecting operational activity, a weighted growth rate calculated using the national forecast rates in the above table results in a weighted AAGR of 1.5% for DKK. New York State Aviation System Plan The most recent published NYSASP (2008) was based on either the FAA TAF or FAA Aerospace Forecasts. For this reason the NYSASP will not be referenced in this document for forecasting purposes, as the FAA TAF and Aerospace Forecasts are analyzed individually. Outside Influences Many of the existing or proposed business jet aircraft operators using DKK do not reside in the immediate area of Chautauqua County, but the south towns of Erie County. The FBO has indicated there is a list of aircraft operators from this area that would base their aircraft at DKK if additional heated hangars were available Forecast of Based Aircraft Utilizing the baseline and strategic methodologies outlined in the preceding sections, multiple forecasts of general aviation operations were developed for DKK. Based aircraft projections for DKK are depicted in Table 3-3.
48 Historical Aviation Activities 3-5 Table 3-3. Based Aircraft Projections YEAR SHORT TERM TREND MID TERM LONG TERM FAA FORECAST TOTAL GA GROWTH RATE FORECASTS 3 YEAR AVERAGE SHARE SHARE OF NEW YORK SHARE OF EASTERN REGION SHARE OF US 5 YEAR AVERAGE SHARE 10 YEAR AVERAGE SHARE 20 YEAR AVERAGE SHARE 3 YEAR AVERAGE SHARE 5 YEAR AVERAGE SHARE 10 YEAR AVERAGE SHARE 20 YEAR AVERAGE SHARE 3 YEAR AVERAGE SHARE 5 YEAR AVERAGE SHARE 10 YEAR AVERAGE SHARE 20 YEAR AVERAGE SHARE AAGR % 0.0% 1.4% 0.5% 0.67% 0.67% 0.67% 0.67% 0.75% 0.75% 0.75% 0.75% 0.85% 0.85% 0.85% 0.85% % 0.0% 1.3% 0.5% 0.69% 0.69% 0.69% 0.69% 0.76% 0.76% 0.76% 0.76% 0.86% 0.86% 0.86% 0.86% % 0.0% 1.4% 0.5% 0.66% 0.66% 0.66% 0.66% 0.73% 0.73% 0.73% 0.73% 0.86% 0.86% 0.86% 0.86% Source: Passero Analysis, 2014 Notes: AAGR color scale utilized a red-to-green pallet where red signifies a low rate, and green signifies a high rate
49 Historical Aviation Activities Selection of Preferred Based Aircraft Forecasts Utilizing the based aircraft projections presented in the preceding sections, it was determined that the most reasonable growth scenario for DKK is based on 3-year share of New York forecasts. This scenario considered the most recent addition of aircraft in the past few years, and can account for the waiting list of aircraft the FBO maintains, along with interest by users outside of Chautauqua County, and the anticipated industry growth trends in general aviation aircraft. The other market share of based aircraft at DKK to the state and the region resulted in fewer based aircraft, not giving sufficient weight to most recent addition of aircraft in the last few years. This coupled with the fact the TAF forecasts does not seem to indicate a true representation of the actual based aircraft at DKK, the preferred methodology to use 3-year share of NY. Table 3-4 shows the projected level of based aircraft in each of the five-year forecast increments. Table 3-4. Preferred Forecast of Based Aircraft YEAR Source: Passero Associates, 2014 BASED AIRCRAFT Based Aircraft Fleet Mix The forecast of based aircraft presented in Table 3-3 was used to project the types of based aircraft (the fleet mix) that should be expected at DKK in the future. The existing aircraft class includes: single-engine piston (SE), multi-engine piston (ME), turboprop (TP), and jet aircraft. The future fleet mix was projected by examining historical fleet mix and utilizing the projected based aircraft and percentage of growth from the FAA Aerospace Forecasts. Table 3-5 shows the share of based single piston aircraft decreasing slightly over the forecast period, while jet aircraft increase slightly. Table 3-5. Based Aircraft Fleet Mix Forecast YEAR SE % ME % TP % TJ % HE % TOTAL % % % 1 2.5% % % % 1 2.3% % % % 1 2.3% % % % 2 4.5% % % % 2 4.2% 47 Source: FAA Aerospace Forecasts, Table 28, Active General Aviation and Air Taxi Aircraft, , airport records Forecast of General Aviation Operations Utilizing the baseline methodologies outlined in the preceding sections, multiple forecast of general aviation operations were developed for DKK. Table 3-6 tabulates general aviation operation projections across methodologies employed.
50 Historical Aviation Activities 3-7 Table 3-6. General Aviation Operations Projections YEAR SHORT TERM TREND MID TERM LONG TERM FAA FORECAST TOTAL GA GROWTH RATE FORECASTS 3 YEAR AVERAGE SHARE SHARE OF NEW YORK SHARE OF EASTERN REGION SHARE OF US 5 YEAR AVERAGE SHARE 10 YEAR AVERAGE SHARE 20 YEAR AVERAGE SHARE 3 YEAR AVERAGE SHARE 5 YEAR AVERAGE SHARE 10 YEAR AVERAGE SHARE 20 YEAR AVERAGE SHARE 3 YEAR AVERAGE SHARE 5 YEAR AVERAGE SHARE 10 YEAR AVERAGE SHARE 20 YEAR AVERAGE SHARE ,520 29,520 29,520 29,520 28,848 28,658 29,027 26,881 29,062 28,427 28,118 25,756 29,412 28,959 29,633 28, ,520 29,520 29,011 29,820 29,078 28,886 29,258 27,095 29,355 28,714 28,401 26,016 29,636 29,180 29,858 28, ,520 29,520 28,511 30,123 29,150 28,958 29,331 27,163 29,500 28,856 28,542 26,144 29,753 29,295 29,977 28, ,520 29,520 28,020 30,429 29,224 29,031 29,406 27,231 29,647 29,000 28,684 26,275 29,871 29,412 30,096 28, ,520 29,520 27,537 30,738 29,301 29,107 29,483 27,302 29,797 29,146 28,829 26,407 29,991 29,529 30,216 28, ,520 29,520 27,063 31,050 29,378 29,184 29,561 27,375 29,949 29,294 28,976 26,542 30,112 29,648 30,338 29, ,520 29,520 26,596 31,365 29,457 29,262 29,640 27,448 30,102 29,445 29,124 26,678 30,235 29,769 30,462 29, ,520 29,520 26,138 31,683 29,537 29,342 29,720 27,523 30,260 29,599 29,277 26,818 30,359 29,892 30,587 29, ,520 29,520 25,688 32,005 29,618 29,422 29,802 27,598 30,416 29,751 29,428 26,956 30,485 30,016 30,714 29, ,520 29,520 25,245 32,330 29,700 29,504 29,885 27,675 30,576 29,908 29,582 27,098 30,613 30,142 30,843 29, ,520 29,520 24,810 32,658 29,784 29,587 29,969 27,753 30,738 30,066 29,739 27,242 30,743 30,270 30,974 29, ,520 29,520 24,383 32,989 29,869 29,671 30,054 27,832 30,903 30,227 29,898 27,387 30,874 30,399 31,106 29, ,520 29,520 23,962 33,324 29,955 29,757 30,141 27,912 31,069 30,390 30,060 27,535 31,008 30,530 31,241 29, ,520 29,520 23,550 33,662 30,042 29,844 30,229 27,993 31,238 30,556 30,223 27,685 31,143 30,664 31,377 30, ,520 29,520 23,144 34,004 30,131 29,932 30,318 28,076 31,410 30,723 30,389 27,837 31,281 30,799 31,516 30, ,520 29,520 22,745 34,349 30,221 30,021 30,409 28,160 31,583 30,893 30,557 27,991 31,421 30,937 31,657 30, ,520 29,520 22,353 34,698 30,312 30,112 30,501 28,245 31,760 31,066 30,728 28,147 31,562 31,077 31,800 30, ,520 29,520 21,968 35,050 30,405 30,205 30,594 28,332 31,936 31,238 30,898 28,303 31,706 31,218 31,945 30, ,520 29,520 21,589 35,406 30,500 30,298 30,689 28,420 32,115 31,413 31,071 28,461 31,853 31,362 32,092 30, ,520 29,520 21,217 35,765 30,595 30,393 30,785 28,509 32,296 31,590 31,247 28,622 32,001 31,509 32,241 30, ,520 29,520 20,852 36,128 30,693 30,490 30,883 28,600 32,480 31,770 31,425 28,785 32,152 31,657 32,394 30,990 AAGR % 0.0% 1.7% 1.5% 0.37% 0.37% 0.37% 0.37% 0.60% 0.60% 0.60% 0.60% 0.47% 0.47% 0.47% 0.47% % 0.0% 1.7% 1.5% 0.32% 0.32% 0.32% 0.32% 0.56% 0.56% 0.56% 0.56% 0.44% 0.44% 0.44% 0.44% % 0.0% 1.7% 1.5% 0.31% 0.31% 0.31% 0.31% 0.56% 0.56% 0.56% 0.56% 0.45% 0.45% 0.45% 0.45% Source: Passero Analysis, 2014 Notes: AAGR color scale utilized a red-to-green pallet where red signifies a low rate, and green signifies a high rate
51 Historical Aviation Activities Selection of Preferred Operations Forecasts Utilizing the operational projections presented in the preceding section, and discussions with the Technical Advisory Committee, it was determined that the most reasonable scenario for DKK be based on 3-year share of New York, as the FAA Aerospace forecasts were determined to be too optimistic. Table 3-7 tabulates the projected level of annual operations in each of the five-year forecast increments. Table 3-7. Preferred Forecast of Aeronautical Operations YEAR , , , , ,693 Source: Passero Associates, 2014 ANNUAL OPERATIONS Airport Utilization Forecast Local/Itinerant Operation Split The level of local and itinerant general aviation operations at an airport can influence a variety of facility recommendations to include such things as hangar and apron space considerations. A local operation is one that is conducted within the airport traffic pattern or stays within 20 miles of the takeoff airport without landing elsewhere. Typically local general aviation operations are associated with training activities and flight instruction; while itinerant operations are arrivals and departures other than local operations performed by either based or transient aircraft, and that do not remain in the traffic pattern. Based on the FAA TAF, the operations split are 71.2% local operations and 28.8% itinerant operations. For the purposes of this analysis the projected future activity will utilize these values. Using the preferred operations forecasts presented in Table 3-7, Table 3-8 projects the level of local and itinerant traffic for the forecasted periods. Table 3-8. Utilization Forecast Local vs, Itinerant YEAR LOCAL % ITINERANT % TOTAL GA OPERATIONS , % 8, % 29, , % 8, % 29, , % 8, % 29, , % 8, % 30, , % 8, % 30,693 Source: FAA TAF and Passero Analysis, Instrument Approaches Instrument approaches occur when the weather conditions require pilots to operate an aircraft referencing their instruments instead of visual reference to the horizon. Instrument approaches usually occur when the weather conditions drop below visual meteorological conditions (VMC), and flight is conducted referencing instruments inside the aircraft, and communication with air traffic control. Since there is no air traffic control tower at DKK, the numbers of actual instrument approaches are estimated by referencing meteorological data for the past 10 years and examining the percent of time the weather is below VMC. In this case instrument weather conditions occur about 5% of the time. To forecast instrument approaches for DKK, total operation forecasts above are multiplied by the
52 Historical Aviation Activities 3-9 amount of time the weather is instrument conditions. An instrument approach is one-half the total instrument operations. Table 3-9. Instrument Approaches YEAR TOTAL OPERATIONS TOTAL INSTRUMENT OPERATIONS TOTAL INSTRUMENT APPROACHES ,078 1, ,457 1, ,869 1, ,312 1, ,693 1, Source: FAA TAF and Passero Analysis, 2014, IFR conditions 5% of the time, instrument approaches ½ total instrument operations 3.4. Peaking Characteristics Annual projections provide a good overview of activity at an airport, but fail to reflect operational characteristics of the facility. In many cases, facility requirements are not driven by annual demand, but rather by the capacity shortfalls and delays experienced during times of peak operational activity. Therefore, forecasts are developed for the peak month, the average day in the peak month, and the peak hour of the peak day. The values for these metrics were calculated using the methodology in FAA Advisory Circular 150/ , Planning and Design Guidelines for Airport Terminal Facilities, with exception to the peak month calculations. For this analysis, the peak month calculations assumed to be an average month plus 20 percent. Specifically, the peak hour operations were calculated using the following approach: Peak Month Operations: This level of activity is defined as the calendar month when peak aircraft operations occur., assuming 10% increase of total annual operations within that month. Average Day/Peak Month: This level of operation is defined as the average day within the peak month determined by dividing peak month operations by number of days within the peak month (in this case 30) Design Hour Operations: This level of operation is defined as the peak hour within the design day, assuming 12% of daily operation in the design hour. Using the preferred operations forecasts present in Table 3-7, Table 3-10 depicts the computation of peak month, peak day, and design hour for each forecasted year. Table Peaking Operations YEAR ANNUAL OPERATIONS PEAK MONTH PEAK DAY DESIGN HOUR TOTAL LOCAL ITINERANT ,078 2, ,457 2, ,869 2, ,312 3, ,693 3, Source: Passero Analysis, Summary of Recommended Forecasts Table 3-11 summarized the forecasts evaluated in this chapter. The forecasts submitted for review and approval are summarized on Tables 3-12 and 3-13.
53 Historical Aviation Activities 3-10 Table Summary of Forecasts Evaluated on this Project FORECAST GA OPERATIONS 29,078 29,457 29,869 30,312 30,693 LOCAL 20,704 20,973 2, ,582 21,853 ITINERANT 8,375 8,484 8,602 8,730 8,840 PEAK MONTH 2,908 2,946 2,987 3,031 3,069 PEAK DAY BASED AIRCRAFT SINGLE ENGINE MULTI-ENGINE/JET ROTOCRAFT INSTRUMENT OPERATIONS Source: Passero Analysis, Comparison to FAA Terminal Area Forecasts If an airport is included in the FAA Terminal Area Forecasts, any new aviation activity forecasts needs to be reviewed and approved by the agency before they can be applied to further analysis. During this review the FAA looks to see if the based aircraft and annual operations forecast differ from the TAF by less than ten percent in the first five year period and 15 percent in the first 10-year period. However, the FAA Memorandum dated December 23, 2004 state, where the 5 and 10-year forecast does not exceed 100,000 total annual operations or 100 based aircraft, then it does not need headquarters review, and should be provided for use in the annual update to the TAF. Being the preferred forecast of annual operations do not exceed 100,000 total annual operations in the first 10 years of the forecast period, it should be validated by the FAA s airports district office in the New York region, approved for use in this planning study, and included in the next update to the FAA s TAF. As mentioned earlier in this report, the FAA has historically not committed the resources to forecasting based aircraft and operational activities at DKK. To express the relationship between the FAA forecast for DKK and that developed in this report, Tables 3-12 and 3-13 compares both based aircraft and operations. The forecasts are within the FAA tolerances. Table Summary of Forecasts versus FAA TAF forecasts FORECAST GA OPERATIONS YEAR FORECAST TAF FORECAST/TAF (% DIFFERENCE) BASE YEAR ,078 29, % BASE YEAR +5 YEARS ,457 29, % BASE YEAR +10 YEARS ,869 29, % BASE YEAR +15 YEARS ,312 29, %
54 Historical Aviation Activities 3-11 Table Airport planning Forecast Breakdown Average Annual Compound Growth Rate Base Yr Level Base Yr +1 yr Base Yr + 5yrs Based Yr +10 yrs Base Yr + 15yrs Base Yr +1 yr Base Yr + 5yrs Based Yr +10 yrs Base Yr + 15yrs Passenger Enplanements Air Carrier % 0.00% 0.00% 0.00% Commuter % 0.00% 0.00% 0.00% TOTAL % 0.00% 0.00% 0.00% Operations Itinerant Air Carrier % 0.00% 0.00% 0.00% Commuter % 0.00% 0.00% 0.00% Total Commercial Operations % 0.00% 0.00% 0.00% General Aviation/Military 8,375 8,395 8,484 8,602 8, % 0.26% 0.27% 0.28% Local General Aviation/Military 20,704 20,755 20,973 21,267 21, % 0.26% 0.27% 0.28% TOTAL OPERATIONS Instrument Operations % 0.25% 0.28% 0.28% Peak Hour Operations % 0.00% 0.00% 0.00% Cargo % 0.00% 0.00% 0.00% Based Aircraft Single Engine (Nonjet) % 0.00% 0.00% 0.00% Multi Engine (Nonjet) % 0.00% 0.00% 0.00% Jet Engine % 13.3% 10.0% 6.67% Helicopter % 0.00% 10.0% 6.67% Other % 0.00% 0.00% 0.00% TOTAL % 0.00% 0.49% 0.65%
55 Historical Aviation Activities 3-12 Table Airport Planning Forecast Breakdown (OPBA) Base Yr Level Base Yr +1 yr Base Yr + 5yrs Based Yr +10 yrs Base Yr + 15yrs Average aircraft size (seat) Air Carrier Commuter Average enplaning load factor Air Carrier Commuter GA OPBA
56 Historical Aviation Activities Summary As a general aviation airport, Chautauqua County/Dunkirk Airport is a vital asset to the aeronautical community and its surrounding municipality. Originally constructed as an airport for small single-engine piston aircraft, the airport has changed, and today sees an increased level of business aircraft using the airport. The data and methods used to forecast aviation demand for the Airport are consistent with those used by the FAA and other general aviation airports around the nation. The forecasts presented in this study are considered to reasonably reflect the activity anticipated at DKK through 2034 given the information analyzed and available during this study. The subsequent chapter will utilize the preferred forecasts identified to examine the ability of existing facilities to accommodate the type and level of traffic anticipated at the Airport.

57 Chapter Four Design Criteria/Facility Requirements Historical Aviation Activities 3-14
58 Design Criteria and Facility Requirements DESIGN CRITERIA/FACILITY REQUIREMENTS When airport owners/sponsors accept funds from the FAA-administered airport financial assistance programs, they must agree to certain obligations (or assurances) which require their facilities be operated in a safe and efficient manner and in accordance with specified conditions. Grant Assurance 29 speaks directly to the need for an airport layout plan (ALP) which details and delineates existing and proposed conditions at an airport for expressing airfield safety, utility, efficiency, property ownership, and proposed capital improvements. FAA advisory circular (AC) 150/ A, Airport Design, contains FAA standards and recommendations for the geometric layout and engineering design of runways, taxiways, aprons, and other facilities at civil airports. This AC is the primary source of design criteria presented in this chapter. This data will be used for airport-specific facility planning and enable the demand/capacity and facility requirements analysis Introduction To ensure the airport meets airfield design and safety requirements and is adequately prepared to accommodate future aeronautical demands, this chapter reviews airfield design criteria and establishes facility requirements for the future planning and development of the Airport. The principal challenge facing any airport is that of meeting future development requirements while maintaining compliance with design and safety requirements. Airport development can be costly, and care should be taken to ensure that each project will help satisfy the projected level of airport needs, be compliant with grant obligations, and remain consistent with the overall Airport and community vision Airside Facility Requirements In order to determine facility requirements, airport facilities must be evaluated against both the existing and forecasted levels of aircraft activity. Before that can be done, it is necessary to identify the FAA criteria for planning and design of airports. Such criteria is a key element in defining airport development needs, as most facilities are directly associated with the size and type of aircraft using the airport. As identified in FAA AC 150/ A, Airport Design, airport design standards provide basic guidelines for safe, efficient, and economic airport systems. These standards are based upon three primary classifications: Aircraft Approach Category (AAC), and Airplane Design Group (ADG), together called the Runway Design Code (RDC), and Taxiway Design Group (TDG). Each of these is defined below while Tables 4-1 and 4-2, and Figure 4-1 details the parameters of each. AAC A grouping of aircraft based on a reference landing speed (V ref ), if specified, or is V ref is not specified, 1.3 times stall speed (V so ) at the maximum certificated landing weight. ADG A classification of aircraft based on wingspan and tail height TDG A classification of airplanes based on outer to outer main gear width (MGW) and cockpit to mail gear (CMG) distance. Table 4-1 Aircraft Approach Category (AAC) AIRCRAFT APPROACH CATEGORY A B C D E Source: FAA AC 150/ A, Table 1-1 APPROACH SPEED Approach speed less than 91 knots Approach speed 91 knots or more but less than 121 knots Approach speed 121 knots or more but less than 141 knots Approach speed 141 knots or more but less than 166 knots Approach speed 166 knots or more

59 Design Criteria and Facility Requirements 4-2 Table 4-2 Airplane Design Group GROUP # TAIL HEIGHT (FT) WINGSPAN (FT) I <20 <49 II 20 -< <79 III 30 -< <118 IV 45 -< <171 V 60 -< <214 VI 66 -< <262 Source: FAA AC 150/ A, Table 1-2 Figure 4-1 Taxiway Design Group Source: FAA AC 150/ A, Table Critical Aircraft In accordance with FAA Order C, Field Formulation of the National Plan of Integrated Airport Systems (NPIAS), dimensional standards (such as runway length and width, separation standards, surface gradients, etc.) should be selected for the critical aircraft that will make substantial use of the airport in the planning period. Substantial use is defined as 500 or more annual itinerant operations (or 250 arrival/departures), or scheduled commercial airline
60 Design Criteria and Facility Requirements 4-3 service. The critical aircraft may be a single aircraft or a composite of the most demanding characteristics of several aircraft. A review of operational records obtained from FAA Traffic Flow Management System Counts (TFMSC) for indicate that business jet aircraft comprise the critical aircraft at Chautauqua County Dunkirk Airport, including Citation CJ2, CJ3, CJ4, Mustang, Citation II (Bravo), Citation XLS, all in design group B-II, as well as the Cessna 650 (VI/VII), Bombardier Challenger 300 and Citation X, group C-II aircraft. The airport has historically been designed to B-II standards. The regulations require at least 250 annual departures for an aircraft, or group of aircraft, to be considered the critical aircraft. The forecasted operations for business jet aircraft are anticipated to increase over the planning horizon, however the increase in operations from the C-II aircraft are not expected to reach the required annual departure threshold for the aircraft to be considered the critical aircraft. Based on TFMSC records for the C-II aircraft only conducted 102 operations for the year. Using the FAA Aerospace forecast for , turbine jet aircraft operations forecast to increase by 3% annually yields fewer than 500 annual operations per year during the planning horizon. The following chapter will examine continued design of the airport under B-II standards. It will also provide a synopsis of required steps to upgrade the RDC to C-II standards, should operations of C-II aircraft change faster than projected. Given the limited runway length of Runway this runway will continue to be designed to B-II standards, consistent with historical development. Figures 4-2 and 4-3 present the FAA design criteria for RDC B-II and C-II airfields. Table 4-3 identifies the existing design standards, as prescribed by the FAA, and notes if there are any areas where standards do not meet the minimum design standards for RDC B-II. The existing runway protection zones dimensions are based on the existing approaches at the airport, with visibility minima of 1 mile. The airport sponsor has indicated that they want to consider an approach lighting system to Runway 24 that could lower the visibility minima from 1 mile to ¾ mile. Only a Medium Intensity Approach Lighting System with Runway Alignment Lights (MALSR) can provide this ¼ mile light credit. A Medium-Intensity Approach Lighting System (MALS/MALSF) are not eligible for the ¼ mile light credit, but can still provide the added runway environment conspicuity. However, since there are obstructions to the visual 20:1 slope, that now are not within the airport sponsor s control, the visibility minima will remain at 1 mile, with a restriction on night approaches. If the penetrating obstacles are not lowered, removed, marked or lighted, a note is published that night circling is NA or Not Authorized. Should the airport sponsor control the 20:1 obstructions there is likelihood that 34:1 obstructions still exist and restrict the development to no lower than ¾ mile. If the approaches could be reduced to not lower than ¾ mile then the runway protection zone dimensions change from 500 inner width, 700 outer width, length of 1000, to 1,000 inner width, 1,510 outer width, length of 1,700 for Runway 24 only. The remaining runways ends are anticipated to remain greater than 1 mile.

61 Design Criteria and Facility Requirements 4-4 Figure 4-2 Runway Design Group B-II Source: FAA AC 150/ A, Table 1-2

62 Design Criteria and Facility Requirements 4-5 Figure 4-3 Runway Design Group C-II Source: FAA AC 150/ A, Table 1-2
63 Design Criteria and Facility Requirements 4-6 Table 4-3 Airfield Compliancy Matrix B-II DESIGN STANDARD EXISTING RWY 15 RWY 33 RWY 6 RWY 24 RUNWAY DESIGN Runway length N/A Runway width Shoulder width 10 TURF TURF Blast pad Width 95 TURF TURF Blast pad length 150 TURF TURF RUNWAY PROTECTION Runway Safety Area () Length beyond departure end Length prior to threshold Width Runway Object Free Area () Length beyond departure end Length prior to threshold Width Runway Obstacle Free Zone (ROFZ) Beyond departure end Width 250 / Approach & Departure Runway Protection Zone (RPZ) Length Inner Width Outer Width Acres / / / /- RUNWAY SEPARTION Runway Centerline to: Holding position Parallel taxiway/taxilane centerline Aircraft parking area 250 >500 >500 Source: Passero Associates 1 ROFZ is dependent on type of aircraft using the runway. Runway 6-24 is capable of accommodating large aircraft, therefore has a larger ROFZ width. Note: Red text delineates a failure to meet design standard, denotes acreage presently owned; Green text delineates where design standards are exceeded Paved blast pad is required for runways and taxiways that accommodate ADG-IV and higher aircraft.
64 Design Criteria and Facility Requirements Runway Requirements As the primary airfield component, a runway must have the proper length, width, and strength to safely accommodate the critical aircraft. FAA advisory circulars and specific aircraft performance data provide guidelines to determine the ultimate runway length required. Runway width requirements are delineated in FAA AC 150/ A. These and other design standards are based on the critical aircraft Approach Category, Design Group, and the runway s approach visibility minimums. Pavement strength is predicated upon the critical aircraft s weight and how that weight is distributed through the landing gear. Projects to rehabilitate runway pavements are routinely conducted every 20 years after the previous major rehabilitation, strengthening, or new construction. These projects, which repair damage to the runway pavement resulting from normal wear, need to be conducted even at airports with regular pavement maintenance programs, including sealing and surface seal coats Runway Length Requirements Runway length requirements will be calculated by taking into consideration the elevation and average hot temperature at the airport, the performance characteristics of the individual aircraft, runway conditions, the operating weight, and the amount of payload (passengers, baggage, and cargo) being carried. The following sections identify FAA recommended adjustments to runway length calculations as well as the assumptions made specific to this analysis to realize a preferred runway length at DKK. The adjustments are identified in AC 150/5325-4B, Runway Length Requirements for Airport Design. A separate Runway Length Analysis study was conducted in the past to justify the need for the recently completed Runway Extension to Runway 24, culminating in a Runway length of 6,000 feet. The design procedure requires certain inputs: airport elevation above sea level (692 ), mean daily maximum temperature of the hottest month at the airport (81 o ), the critical airplanes under evaluation with their respective useful loads. Density Altitude When aircraft operate during periods of high temperatures, the relative increased density altitude decreases an aircraft s operational performance. Density altitude is defined as the altitude at which the density of the International Standard Atmosphere (ISA) is the same as the density of the air being evaluated. Actual density altitude for any given location at any specific time is a function of ground elevation, temperature, atmospheric pressure, and dew point (or the amount of water vapor in the air). Being the density altitude changes over time and has the potential to impact aircraft operational performance, it is prudent to plan a runway to accommodate its traffic demand during times of elevated density altitudes when aircraft operate with less efficiency. When aircraft performance characteristics for specific density altitudes are not obtainable and only seal level performance characteristics are published, a multiplier of 7% (as obtained from FAA Southern Region guidance) per each 1,000 feet above sea level is added to the sea level runway lengths to adjust runway lengths. Adjusting the density altitude for DKK s elevation of 692, the multiplier is rounded to 5%. Runway Vertical Geometry The FAA recommends that the adjusted runway lengths required for an airport be adjusted, if necessary, to account for specific conditions including the maximum difference in runway centerline elevation along the runways length and runway surface conditions. The maximum difference of runway centerline has the potential to impact recommended runway lengths. A runway that has variation in centerline elevation between runway ends produces uphill and downhill conditions, which in turn, impose additional limitations on aircraft when arriving or departing the airfield. For instance, an aircraft departing a runway on its uphill alignment will require additional power and runway length to compensate for the uphill situation. Conversely, aircraft landing on a runway will require additional distance to come to a full stop if oriented on the runways downhill alignment. To adjust for this and ensure runways are appropriately sized to accommodate aircraft in all conditions, the FAA encourages an additional 10 foot of runway length be added to the runway length calculations for each foot of elevation difference between the high and low points of the runway. As Runway 6-24 is the primary runway at DKK, there is a 12.3 foot difference in runway end elevation. Applying 10 feet for each foot difference results in an additional 123 feet be added to any calculated runway length requirements to adjust for this condition.
65 Design Criteria and Facility Requirements 4-8 Contaminated Runway Conditions An adjustment is made to adjusted runway length relative to the runway s surface conditions to address wet and/or slippery runways for landing operations. Wet, slippery, or otherwise contaminated runway conditions, decrease traction and reduce the deceleration performance of aircraft during landing operations. To account for this the required runway length for landing under dry/uncontaminated conditions is increased by 15 percent, as prescribed by the FAA, to adjust landing length requirements for wet conditions which can be regularly expected at the airport. Operational Limitations Declared Distances When the physical runway length at an airfield is not declared as usable for a specific type of operations (takeoff or landing) in a specific direction, declared distances are used to express to pilots the useable runway lengths and ensure airfield and airspace safety requirements are met. Declared distances therefore represent the maximum distances available and suitable for meeting takeoff, rejected takeoff, and landing distance performance requirements. Most often, declared distances are implemented at an airfield to meet Runway Safety Area () and/or Runway Object Free Area () requirements, or to meet runway approach and/or departure surface clearance requirements. The following definitions are necessary to fully understand the terminology and implications of declared distances. Take-off Runway Available (TORA) is defined as the distance to accelerate from brake release to lift off, plus safety factors. This distance defined the length of runway declared available and suitable to satisfy take-off runway minimums. Take-off Distance Available (TODA) is the distance to accelerate from brake release past life off to start the take-off climb, plus safety factors. The distance consists of the TORA plus any remaining runway or clearway beyond the far end of the TORA available to satisfy take-off distance requirements. Accelerate Stop Distance Available (ASDA) is the distance to accelerate from brake release to aircraft take-off decision speed (V1) and then decelerate to a stop, plus safety factors. This distance defines the runway plus stopway declared available and suitable for satisfying ASDA requirements. Landing Distance Available (LDA) is the distance from threshold required to complete approach, touchdown, and deceleration to a stop, plus safety factors. Runway length recommendations made in this report consider not just the physical runway length, but the operational lengths available to aircraft depending on operation type and direction as well. In general, the available TORA and ASDA are the most critical for determining the required runway length for specific aircraft. There are no existing displaced thresholds at DKK, thus runway usability is the full length of runway for both runways. If Runway thresholds are relocated because of obstructions, or an upgrade to RDG C-II standards, then declared distances will be applied to provide standard safety area requirements. This will be discussed further in the next chapter. Runway Length Findings In 2014 Runway 6-24 was extended an additional 1,000 feet to an overall length of 6,000. The FAA TFMSC was reviewed for business jet aircraft using Dunkirk from January 2014 through The jet aircraft include: Citation CJ2, CJ3, CJ4, Mustang, Citation II (Bravo), Citation XLS, Cessna 650 (VI/VII), Bombardier Challenger 300 and Citation X. In addition to the jet aircraft turbine aircraft included the Beech 200 Super King Air, the Raytheon 300 Super King Air, Beech King Air 90, Cessna 208 Caravan and the Piper Cheyenne. Procedures outlined in AC 150/5325-4B, Runway Length Requirements for Airport Design, Chapter 3 are applicable to this airport since most operations at the airport are conducted by turbojet-powered airplanes weighing under 60,000 pounds maximum certificated takeoff-weight in conjunction with other small airplanes of 12,500 pounds or less. As the Cessna Citation X, Hawker 800 and Learjet 45 are listed in Table 3-2 of AC 150/5325-4B, Figure 3-2 of this referenced AC should be consulted for runway length. At 60% useful load the runway length is 5,200 feet. Adjusting
66 Design Criteria and Facility Requirements 4-9 the elevation for effective gradient, for takeoff, would result in 5,323 (5, ), rounded down to 5,300 feet; while adjusting for wet pavement would be increasing the length by 15%, up to 5,500 feet. The resulting length would be 5,500 feet. Therefore, the existing length of 6,000 feet is adequate to meet the users of the primary runway Based on conversations with the FBO operator, Runway is used by aircraft with approach speeds greater than 50 knots, and with fewer than 10 passenger seats. A separate Table in AC 150/5325-4B, Runway Length Requirements for Airport Design is reviewed for this runway. Applying 95% of the fleet, with a maximum temperature of 81 o and airfield elevation of 692 yields a runway length of 3,200 feet. The existing length of 4,000 feet exceeds the runway length needed per this analysis. No further actions on runway lengths are warranted now, and the runway lengths should be preserved and maintained to meet the needs of users and maintain its position as a National/Regional Airport in the National Plan of Integrated Airport Systems Runway Width The existing runway widths are 100 feet, which exceed the RDC B-II requirements, and meets the next design category of C-II. Some aircraft in the next RDC use Runway 6-24 already, including the based Citation X, therefore maintaining this runway width is critical. The design standards are not anticipated to change over the planning period, thus the runway width should be preserved and maintained Runway Pavement Strength A pavement analysis was conducted separately from this report. This analysis conducted a field visit to walk the pavements for a physical inventory, and then also collected core samples. The result of the analysis states that the physical weight bearing capacity of Runway 6-24 and Runway is 49,600 pounds for aircraft with a single wheel type landing gear, 68,000 pounds for dual wheel configuration and 130,000 pounds dual wheel tandem. The pavement strength is suitable for the aircraft that use the airport. No additional strengthening is recommended. However, this analysis concluded that the existing pavement for Taxiway B south, from Runway 6-24 to Runway 33 end needs rehabilitation, and other pavements will need to be rehabilitated in the future. (See Appendix for summary findings of this report) Runway Safety Area/Object Free Area The runway safety area meets design grade requirements Taxiway Requirements FAA AC 150/ A, Airport Design lists the taxiway design standards, as shown in Figures 4-4 and 4-5 below. Both runways are designed to ADG II standards thus this column in Figure 4-5 shows the design standards for taxiway safety area and object free area. The taxiway safety area (TSA) serves a similar purpose as the runway safety area. The TSA provides for cleared and graded land capable of supporting emergency equipment on either side of the taxiway. For an ADG II, the TSA is 79 feet wide, or 39.5 feet on either side of the taxiway centerline and is presently provided. The taxiway and taxilane object free area (TOFA) provide for wingtip clearance for aircraft while on a taxiway or taxilane. Taxiways and taxilanes are considered separately based on the typical speed of aircraft movements. Taxilanes are generally located on apron areas and/or provide access to hangar areas where aircraft move slowly, while taxiways are more of the arterial connectors where aircraft move more quickly. As a result, the taxiway object free area for ADG II aircraft is 131 feet centered on the centerline and the taxilane OFA is reduced to 115 feet centered on the centerline; both are presently provided. Taxiway widths are based on the taxiway design group (TDG) because of the landing gear dimensions (cockpit to main gear length and main gear width). Some of the business jet aircraft that use the airport lie within the TDG 2 family. The taxiway design width for this group is 35 feet. The existing 40 feet width exceeds the standards. Since both taxiways provide access to the apron areas, and TDG 2 aircraft use the apron areas, all taxiways should be
67 Design Criteria and Facility Requirements 4-10 designed to 35 feet, and the fillet at intersection points with the runway should be sufficient to accommodate the aircraft wheels on pavement, without going into the turf Parallel Taxiway Parallel taxiways serve to enhance airport capacity and safety encouraging pilots to exit the runway environment quickly, and should be offset from the runway centerline to allow for wingtip clearances. At present, there is a full length parallel taxiway to Runways 15-33, with a separation from Runway of 300 feet. There is the equivalent of a full length parallel taxiway to Runway 6-24, with the western portion of the taxiway extending through the terminal apron area. During TAC discussions, it was discussed there have been no incursions in this area, and it provides the necessary means to access Runway 6; and there was no desire to provide a full length parallel taxiway to the Runway 6 end. The centerline to centerline separation from Runway 6-24 is 400 feet near the runway 24 end, until it intersects with Runway 15-33, and then increases to pass through the terminal area. Both separations exceed the design standards for RDC B-II, with visibilities greater than 1 mile, which match the existing approaches at the airport. Both taxiways meet the TSA/TOFA standards. If lower minimums are sought for Runway 6-24 then the runway/taxiway separation is adequate down to ¾ mile visibility for both a RDC B-II and C-II. At present, the parallel taxiways to both runways exceed the design standards for a TDG 2 aircraft with their existing 40 feet width. No short or intermediate-term changes are recommended for either taxiway width. In the long term, when pavement has reached it useful life, or the lights have reached their useful life, a re-evaluation of the taxiway width should be conducted to determine if it should be brought to standards, as AIP funding may require this. Such a reduction in width would also require relocating all the lights, which are currently located 10 off the pavement edge, and would exceed tolerances. The taxilanes supporting the T-hangar were designed for smaller aircraft more in line with TDG 1 standards and a taxilane OFA of 115 feet. For this reason, this taxilane is 25 feet in width. No changes are recommended.


 Figure 4-5 Taxiway")

68 Design Criteria and Facility Requirements 4-11 Figure 4-4 Taxiway Design Standards based on Airplane Design Group (ADG) Figure 4-5 Taxiway Design Standards Source: FAA AC 150/ A, Tables 4-1 and 4-2
69 Design Criteria and Facility Requirements Airfield Support Equipment Requirements Several facilities are necessary to support the operations of the airfield, including: instrument approaches, airfield lighting, airfield signage and markings, and communications equipment. Each of these are described in the following sections Instrument Approach Needs Presently all four runway ends are supported with non-precision instrument approaches. All approaches are supported through satellite GPS. These approaches are intended to enable aircraft to approach all runways during inclement weather or for training purposes using aircraft instrumentation. In addition, Runway 6 and 24 are presently supported with a VOR approach. In late 2014 the FAA issued a memorandum that they have intentions on decommissioning and removing the VORTAC in the next 3 or more years. The distance-measuring equipment (DME) and remote communications outlet (RCO) that are collocated with the VORTAC will remain in service. This decommissioning was moved up to 2017 because of a future windmill farm approximately miles southwest of Dunkirk Runway 33. Prior to decommissioning though, all procedures using this system will need to be re-written by flight procedures. With the publication of the new RNAV(GPS) Runway 6 approach the FAA is petitioning to withdraw the Runway 6 VOR approach. The removal of the VORTAC will limit approaches to DKK to GPS approaches exclusively. As of this writing there is a glitch with the Garmin software coding that is voiding all the RNAV(GPS) approaches to DKK, that have LP approaches and no visual decent angle published on the approach plate, from GPS on-board databases. Discussions with Garmin indicate this is a known issue which they are working to resolve, but do not have a proposed date of resolution. The only approaches available now to airport user s databases are the VOR approaches. Decommissioning of the VOR and its associated approaches need to be timed to ensure there is instrument approach coverage to the runways that are workable for all pilots. The County is working with FAA Flight Procedures to determine if there are any temporary workarounds, however Flight Procedures has indicated it would take until end of 2017 to publish new approaches. The reason why there is no published glidepath angle is because of close-in 34:1 obstructions that are off airport property. These obstructions will be removed during a future obstruction removal project. Separately, prior planning for the airport indicated an approach lighting system to Runway 24 to support the business jet aircraft users in identifying the airport environment more easily during the inclement weather that plagues DKK. It was anticipated that with the inception of GPS, and the FAA s desire to move away from ground based navigation (VOR) toward satellite navigation (GPS), the FAA would be able to support an approach lighting system that would support DKK s satellite based instrument approaches. In reviewing FAA Order D, Appendix K, and discussions with FAA New York Airport District Office personnel, the FAA does not have a system in place for an approach lighting system ( ) that supports satellite navigation, nor is there a plan soon. Per FAA Order D, The FAA Air Traffic Organization (ATO) is transitioning to Performance Based Navigation (PBN) approaches, as enabled by satellite navigation, rather than adding new ILS ground based equipment to the National Airspace System. These GPS approaches using Area Navigation (RNAV) provide equivalent instrument approach capability as ground based equipment can for Category 1 approaches. On December 15, 2011, the FAA announced in 76 Federal Register that In order to maximize operational benefits and take advantage of the cost savings associated with WAAS, the FAA no longer intends to establish new Category I ILSs using Facilities and Equipment (F&E) funding. Cat I approach provide decision heights greater or equal to 200 feet, with visibilities greater than or equal to 1,800 feet. With the existing RNAV (GPS) approaches available at DKK an ILS is not eligible. The sought-after ALS would not be part of a complete ILS system and therefore is not subject to FAA takeover for maintenance. Based on funding guidelines in Order D, Table K-3(f) for the ALS system to be considered for AIP funding, it must: 1. Be installed on a designated instrument runway, which Runway 24 is 2. Have a reduction in minimums of at least ¼ mile, a MASLR would provide ¼ mile visibility (see Appendix G)
70 Design Criteria and Facility Requirements Benefit-Cost Analysis conducted by APP-500 resulting in ratio of 1.0 or more (to be determined by FAA, see BCA worksheet in Appendix G) 4. Ownership/Maintenance cannot be transferred to FAA unless part of a complete ILS (County would own the system) 5. Eligible on a Runway that has approach procedure with 300 or more instrument operations or forecasted operations in the next five years (see Appendix G for the TFMSC data) An ALS to Runway 24 cannot be pursued until the approach to Runway 24 is upgraded with an approach with vertical guidance, such as an LPV, or LNAV/VNAV, which is considered a non-precision approach. If the ALS is not funded under AIP, the airport sponsor could seek to install and maintain an ALS with their own money, however such installation would still need to be certified by the FAA. The other option to the airport sponsor is to install an Omni- Directional Approach Lighting System (ODALS) if Runway 24 only has a published instrument approach, not a precision approach. The ODALS must meet the same criteria as above, and is not subject to FAA takeover. Additional documentation, to address the requirements above, can be found in Appendix G of this report providing justification for the ALS. Conversations with the TAC indicated the desire to continue to pursue an approach lighting system to Runway 24, and show it on the ALP for planning purposes. Given the surrounding roadway infrastructure (Newell Road), and the grading of the land off airport property to the south, any approach to the airport needs to consider maintaining greater than ¾ mile visibility to ensure the design and imaginary surfaces do not increase in size and encompass Newell Road. A proposed ALS could improve existing minima of 1 mile down to ¾ miles, with the ¼ mile reduction, which would not affect the design surfaces around Runway 6-24, but would increase the RPZ size. The additional lighting will be extremely useful to the pilot community during the winter condition when lake effect snow and lower weather conditions prevail, providing for an earlier identification of the airport environment. Based on weather data that was collected as part of this effort, IFR conditions prevail for approximately 16% of the time during the winter months. Reduction in ¼ mile visibility could increase the use of the airport during IFR conditions by 8.2%. Separately, as part of this study, obstruction information was obtained to determine if a lateral approach with vertical guidance (LPV) would be possible for Runway 6 and 24. Such an approach will provide similar guidance to an instrument landing system using satellite navigation only. The obstructions that were identified are outlined in the following section. Obstructions and Instrument Approach Limitations In late 2014 thru early 2015 the Airport sponsor undertook an extensive obstruction removal project to eliminate as many identified obstructions as feasible to maintain the existing runway approaches, and establish new approaches to Runway 15 and 33. FAA Flight Procedure personnel provided the known obstructions to Runway 15 and 33 based on the submitted AGIS for that runway. These obstructions were reviewed as well, and can be found in Appendix D. Flight Procedures personnel were notified of the completed obstruction removal and have updated the database to reflect the tree removal. All tree removal performed in 2014/2015 was conducted under negotiated agreement with the landowners. Where agreements could not be reached, tree removal did not occur. Thus, only three obstructions from the original list remain, all off Runway 33. A GPS obstruction study adhering to FAA Advisory Circular 150/ , General Guidance and Specifications for Submission of Aeronautical Surveys to NGS: Field Data Collection and Geographic Information System (GIS) Standards is being conducted for Runway 6-24 as part of this project, to evaluate potential for an LPV approach to Runway 6 and 24. This information will be uploaded to the FAA Airport s GIS (AGIS) system. Part of this master plan examined the threshold siting surface (TSS), or the visual 20:1 surface identified in FAA AC 150/ A, Table 3-2, herein shown as Figure 4-6 against newly acquired aerial imagery. Glideslope Qualification Surface (GQS) penetrations forbid vertical guidance on approaches and limit the ability for an LPV approach; whereas visual 20:1 penetrations limit night operations. Recommended action for penetrations to the GQS or the visual 20:1 surface is removal or lowering the obstructions. From Figure 4-6 the following rows were used for evaluation: Runway 15 and Runway 33: Row 4; Runway 6 and Runway 24: Row 5, because the approach plates are written to include aircraft greater than CAT B, as the approach plates include aircraft CAT C and D too. Applying these standards identified several obstructions. Penetrations to the visual 20:1 will limit night instrument operations unless
71 Design Criteria and Facility Requirements 4-14 they are mitigated through removal, marking, lighting, or use of a PAPI, with prior approval by FAA flight procedures. All runways were also evaluated from Figure 4-6 Row 8, for GQS penetrations, to determine what the restrictions are for a potential LPV approach. Presently all runways have LP/LNAV approaches published to them. This analysis is consistent with the FAA issued Memorandum dated August 18, 2015 reminding the sponsors of their responsibility for Protecting Approach and Departure Surfaces of an airport. The Terminal instrument Procedures (TERPS) focuses on the visual 20:1 surface. Table 4-4 lists the penetrations to the TSS/Visual 20:1 surface; while Table 4-5 lists the penetrations to the GQS, which is limiting LPV approaches to each runway end. To qualify for an LPV approach the GQS must be clear of obstructions. Figures 4-7 through 4-10 graphically identify the TSS Obstructions, while Figures 4-11 through 4-14 identify the GQS penetrations. Identification numbers for GQS penetrations match the TSS identification numbers, where applicable. As of this writing only Runway 33 does not permit night instrument approaches because of the obstructions to the visual 20:1 approach slope. The County is continually working on a remediation plan to eliminate or mitigate the visual 20:1 surface penetrations.

72 Figure 4-6 Approach/Departure Standards Table Design Criteria and Facility Requirements 4-15
73 Design Criteria and Facility Requirements 4-16 Table 4-4 Obstructions to TSS/Visual 20:1 RUNWAY TYPE OF PENETRATION PENETRATION ID# ON/OFF AIRPORT 6 TREE GROUP /- #1 OFF 6 TREE GROUP /- #3 OFF 6 TREE GROUP 8.7 +/- #4 OFF 24 FENCE 5.2 +/- #12 ON 24 WALL/FENCE 0.8 +/- #13 ON 24 TREE 3.5 +/- #14 ON 24 TREE GROUP /- #15 OFF 24 TREE GROUP 9.3 +/- #16 ON 24 TREE GROUP 8.8 +/- #17 OFF:EASEMENT 24 TREE GROUP 1.9 +/- #18 OFF 24 TREE GROUP /- #20 OFF 24 TREE GROUP /- #26 OFF: EASEMENT 15 TREE GROUP /- #39 OFF 33 TREE GROUP 17.4+/- #49 OFF: EASEMENT 33 TREE GROUP /- #51 OFF 33 TREE 4.7 +/- #73 OFF 33 TREE 0.7 +/- #56 OFF 33 TREE 6.8 +/- #62 OFF 33 TREE 1.0 +/- #67 OFF 33 TREE 0.1 +/- #68 OFF 33 TREE GROUP /- #74 OFF These penetrations are highlighted in yellow on Figures 4-7 thru 4-10.

74

75

76
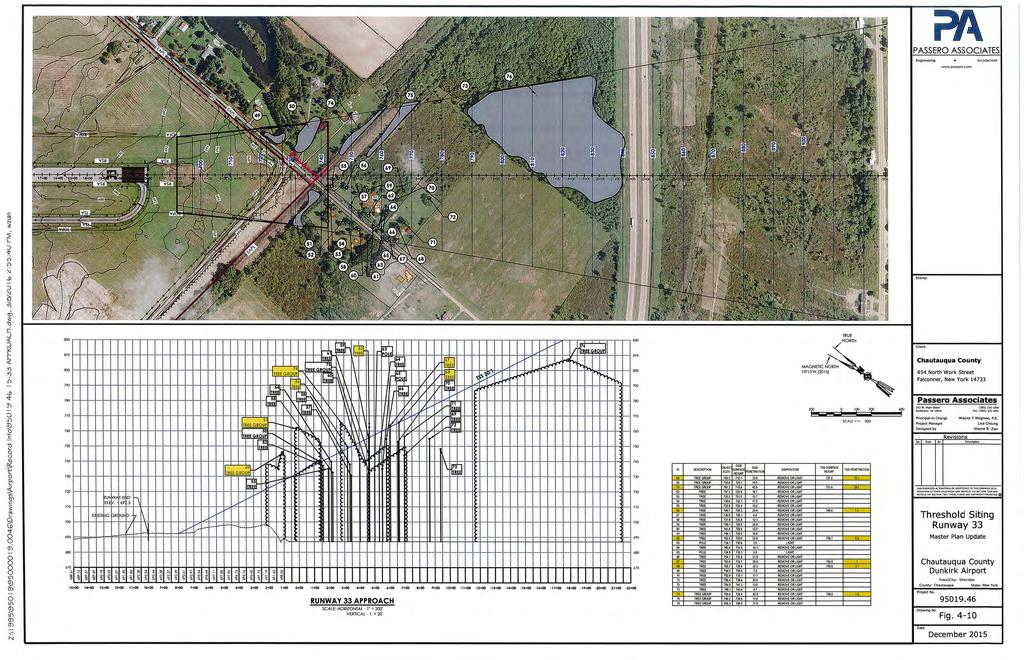
77
78 Design Criteria and Facility Requirements 4-21 Table 4-5 Obstructions to GQS RUNWAY TYPE OF PENETRATION PENETRATION ID# ON/OFF AIRPORT 6 TREE GROUP /- #3 OFF 6 TREE GROUP /- #4 OFF 24 TREE /- #16 ON 24 TREE /- #16 ON 24 TREE GROUP /- #17 OFF: EASEMENT 24 TREE 5.3 +/- #19 OFF 24 TREE GROUP /- #20 OFF 24 TREE 3.2 +/- #33 OFF 15 TREE 1.5 +/- #43 OFF 15 TREE GROUP 4.9 +/- #43 OFF 33 TREE 4.9 +/- #49 OFF: EASEMENT 33 TREE 4.6 +/- #50 OFF: EASEMENT 33 TREE GROUP /- #74 OFF 33 TREE GROUP /- #51 OFF 33 TREE 6.8 +/- #54 OFF: EASEMENT 33 TREE /- #56 OFF 33 TREE /- #59 OFF 33 TREE 5.3 +/- #70 OFF 33 TREE 0.4 +/- #72 OFF 33 TREE GROUP /- #76 OFF

79
80
81

82
83 Design Criteria and Facility Requirements 4-26 Obstruction Summary Each runway has GQS penetrations that limit the ability to obtain an LPV. Many of the GQS penetrations coincide with the TSS/20:1 visual slope penetrations, and if removed could potentially provide an LPV to Runway 6, 24 and 15. The potential for an LPV to Runway 33 is unlikely based on a large group of trees starting 2,400 feet off the runway end. Most of the obstructions are located off airport property, except for a few to Runway 24, which are on airport property, and can be removed by the airport sponsor. When obstructions are removed the airport sponsor can update their AGIS Surface Analysis and Visualization Tool (SAV Tool), or notify Flight Procedure Development of such obstruction removal, with graphic documentation, so their database can be updated. Once updated Flight Procedures would be able to evaluate for an LPV. An Obstacle Action Plan (OAP) will be prepared based on the recent aerial imagery, and submitted to the FAA separately. This plan should be evaluated yearly to include any obstructions that may have been removed in the prior year, and position the airport sponsor to maintain their obstructions as a priority item in their Capital Improvement Plan. If obstructions cannot be removed then the runway lengths may require displacing the threshold, which will be discussed in further detail in the alternatives chapter. The airport seeks not to go below ¾ mile visibility. Removal of the 20:1 obstruction will provide for at least 1-mile visibility and not restrict night operations Airfield Lighting High intensity runway lights (HIRLs) are installed on Runway HIRLs are usually required on runways with precision approaches, but were installed at DKK to aid in identification of the runway environment given the extreme low visibility conditions during inclement weather that comes off Lake Erie. Runway has medium intensity runway lights installed. All runway lights are incandescent. The taxiway lights are a combination of incandescent and light emitting diode (LED) lights. The only stretch of LED taxiway lights run from the intersection of Runway down Taxiway A to Runway 24. All lights are operated on the common traffic advisory frequency (CTAF), MHz. As taxiway lights age, and replacement is needed, the airport should consider installing LED taxiway lights to offset some of the electricity usage costs. In addition, the only manual override airport management has over the lights is at vault. A separate manual override should be installed in the FBO or County offices. While Runway 6-24 has Runway End Identification Lights (REILs), neither Runway 15 nor 33 are equipped with these. Per FAA AC150/ , Design and Installation for Visual Aids, REILs aid in the identification of the runway and runway end, and must be installed on runways that have only a circling approach or a circling and non-precision straight-in approach. For this reason, it is recommended that Runway 15 and 33 each install REILs. All runways are equipped with PAPI, however at the time of this writing, only Runway 24 is operative. Steps to have the NOTAM lifted for the remaining PAPI are under consideration by airport management. Conversations with FAA Flight Check indicated that there are trees approximately 0.3 nautical miles from Runway 6, 15 and 33 that violate the PAPI Obstacle Clearance Surface (OCS) based on 3.0 degrees for Runway 06 and 15, and 3.10 degrees for Runway 33. Refer to Appendix D for detailed plans for the PAPI OCS for each runway end. Once the PAPI are back in service the County can petition Flight Procedures to permit PAPI mitigation for the off-airport visual 20:1 obstructions, if unable to remove or lower Airfield Signage Currently there are several illuminated signs installed along the runway and taxiway lighting circuits. The signage system conforms to minimum requirements established by the FAA for a general aviation airport. The airfield signage is adequate to accommodate the anticipated increase in transient operations that may occur, as stated in the forecasts outlined in Chapter 3. The airport does not have distance remaining signs on either runway, and none are required or recommended. Replace airfield signage as needed from wear Ground Communications An improvement to the communications between aircraft on the ground at DKK with Buffalo Air Traffic Control facilities is warranted. The existing remote communication outlet (RCO) at the airport is a direct link to Cleveland
84 Design Criteria and Facility Requirements 4-27 Center, however Cleveland center is not the proper jurisdiction to issue clearances or close flight plans for aircraft using DKK. This facility is Buffalo Approach, but Buffalo Approach cannot be reached on the ground at DKK. Instead aircraft on the ground call Cleveland Center, who in turn calls Buffalo on a landline to obtain clearances, and aircraft on the ground at DKK listen over the VOR frequency for their clearance, delivered through Cleveland. This existing situation will become an issue soon when the VOR is decommissioned in The RCO s sole purpose today provides communication between Cleveland Center and aircraft overflying DKK. Aircraft departing from, or arriving into, DKK can only access Buffalo when they are at traffic pattern altitude or higher. The existing situation causes concern from two points: for departing aircraft they cannot obtain clearances in a timely fashion, and may takeoff in order to reach Buffalo directly at pattern altitude; and for arriving aircraft if aircraft terminate their approach with runway environment in site, then the approach doesn t officially count toward total approaches to the airport; or worse situation the pilot lands and then needs to physically call Buffalo on the phone to close out their flight plan, which, if not performed in a timely manner, keeps the airspace closed from other airport operations. To rectify this situation, the FAA has been notified by the Airport s District Office for the installation of a remote transmit/receiver (RTR), like an RCO. While RCO serves serve flight service stations, RTRs serve terminal air traffic control facilities. This would provide a direct link from the airport to Buffalo Approach and alleviate the existing situations, including usability and safety of the airport Airfield Pavement Markings Runway Designation A runway designation is identified by the whole numbers nearest the magnetic azimuth of the runway when oriented along the runway centerline, as if on approach to that runway end. This number is then rounded off to the nearest unit of ten. Magnetic azimuth is determined by adjusting the geodetic azimuth associate with a runway to compensate for magnetic declination. Magnetic declination is defined as the difference between true north and magnetic north which varies over time. Magnetic declination is a natural process and does periodically require the re-designation of runways. Current magnetic declination information was derived from the National Geophysical Data Center (NGDC) database. Magnetic declination for the Dunkirk are calculated to be 10 o 15 west. The true bearings were obtained from the aeronautical survey conducted for this study effort. Using the method of East is Least- West is Best, the declination above would be added to the Runway s true bearing to determine its magnetic bearing. Table 4-6 conducts this calculation and identifies what the runway should be marked. This designation assists pilots in aligning their aircraft with the runway, especially when reliant on instruments. Based on this analysis no change to runway designation is required. Table 4-6 Runway Designation Calculation RUNWAY TRUE BEARING MAGNETIC DECLINATION MAGNETIC BEARING RUNWAY DESIGNATION REQUIRED 6 49 O O 15 W 59 O O O 15 W 239 O O O 15 W 150 O O O 15 W 330 O Source: Passero Associates Pavement Markings Airport pavements are marked with painted lines and numbers to aid in the identification of the runways from the air and to provide information to the pilots during the approach phase of the flight, as well as during ground movements. There are three standard sets of markings used depending on the type of runway. These are visual markings, nonprecision markings, and precision markings, and are identified in FAA Advisory Circular 150/ Depending on the type of aircraft activity and physical characteristics of the pavement, additional markings may be required for any of the three broad categories identified above. For example, the FAA requires aiming point markings
85 Design Criteria and Facility Requirements 4-28 on any visual or non-precision runway that is greater than 4,000 feet and used by jet aircraft. The FAA also allows markings on the runway to be upgraded at any time including elements that are not required, but may be deemed necessary to enhance safety. Runway pavements and displaced threshold markings are painted white, while taxiway pavement markings are painted yellow. FAA guidelines state that taxiways should have centerline markings and runway holding position marking whenever they intersect with a runway. Presently, both Runway and 6-24 are marked with thresholds, landing designator, centerline and aiming points to meet non-precision marking. Aiming points are not required on runways less than 4,200 feet, but can be added for visual acuity. Taxiway A and B are marked with centerline and hold lines offset 200. No additional pavement markings are required. Wind Indicators There are no wind indicators on Runway 15 and 33. The distance from these runway ends to the existing wind indicator is great. The installation of wind indicators on each runway is most beneficial to the pilot community to understand wind impacts on landing on a runway. ASOS Conversations with FAA Flight Procedures personnel indicate that the ASOS at DKK cannot be used as a primary altimeter source, hence a penalty is placed on the instrument approach procedures, in the form of raising the minima. DKK s METARS, from its on-site ASOS, is not reported, so flight briefing for DKK relies on the METARS from Jamestown. A situation arises where the weather may be reporting clear skies at DKK, but the METARS at Jamestown is Low IFR. The FBO has commenced investigation into getting the METARS published for DKK, and not rely on Jamestown s METARS. The METARS for DKK need to be published to assist with instrument approaches to the airport Landside Facility Requirements Landside facility requirements are primarily predicated upon the level of aeronautical activities at an airport, the needs and desires of based aircraft owners, and the level of service an airport intends to provide to both its local and itinerant operators. The following sections will review several individual landside facilities and any specific requirements they may occur over the planning horizon. While specific requirements may be identified through a quantitative analysis between existing facilities and forecast of aeronautical demand, recommendations for facility improvement may also be made in the following sections based on qualitative analysis and the desired level of service the County wishes to provide at the airport General Aviation Aprons Given the variety of aircraft that can be categorized as general aviation, the planning of GA aprons is largely dependent on aircraft parking and aircraft movements. GA aprons support a variety of functions, including parking and storage of based and itinerant aircraft, terminal access, fuel access, hangar access, and hangar utility. For planning purposes, based and itinerant aircraft apron requirements are usually considered separately since they serve different functions. Currently all based aircraft are in hangars. The clear majority of itinerant aircraft are stored in hangars as well. For planning purposes though we will estimate that 25% of the itinerant aircraft may require apron space. Airport Cooperative Research Program (ACRP) Report 96, Apron Planning and Design Guidebook, provides a planning metric to estimate apron space required for itinerant aircraft parking. The report identifies that roughly 1,000 square feet of apron space should be provided for ADG 1 aircraft and 1,500 square feet for ADG II aircraft when an adjacent taxilane is provided. For our purposes, since the aprons at DKK are adjacent to a taxilane 1,500 square feet will be applied. In addition, the apron must remain open and available to the numerous transient aircraft frequenting the Airport. Table 4-6 calculates the future apron requirements at DKK using the following assumptions:
86 Design Criteria and Facility Requirements 4-29 Adequate apron must be reserved for all aircraft based on the apron as well as peak period itinerant aircraft without limiting access or utility of the hangars adjacent to the apron area. The peak period for apron utilization is calculated by applying a multiplier of 1.75 to the peak hour calculation for itinerant aircraft Apply 1,500 square feet of apron space each to provide for tie-down area Table 4-7 Apron Designation Calculation BASED AIRCRAFT BASED AIRCRAFT ON APRON ITINERANT AIRCRAFT PEAK HOUR ITINERANT AIRCRAFT PEAK PERIOD (1.75*PH) TOTAL SQUARE FOOTAGE REQUIRED 10,500 10,500 10,500 10,500 10,500 EXISITNG SQUARE FOOTAGE 180, , , , ,500 SURPLUS/(DEFICIT) 170, , , , ,000 Source: Passero Associates It is apparent from the analysis above that the two aprons on the airport are more than adequate to meet the apron requirements. Combined these aprons can accommodate 48 aircraft tie-downs for small aircraft and 2 for larger aircraft Aircraft Hangars Hangars are one of the most desirable means for aircraft storage at any airport when offered at reasonable rates. Most hangar space is primarily utilized by the aircraft based at the airfield with only a small percentage used by itinerant traffic (usually for maintenance or occasional overnights). According to the FBO operator, all based aircraft and most itinerant aircraft prefer to be placed in a hangar. In general, hangar types include a combination of the following facilities: T-hangars - A fully enclosed building housing individual stalls, each capable of storing one aircraft, typically a single-engine or a light multi-engine aircraft. Clearspan Hangars - A fully enclosed building typically capable of holding multiple aircraft. These are often referred to as conventional or box hangars Currently all based aircraft are stored in hangars at DKK: 13 percent in T-hangars (5 aircraft) and 87 percent in conventional clearspan hangars (33 aircraft). There is a strong demand for clearspan hangars, which are full service hangars, meaning the FBO takes care of the aircraft for the aircraft owner. Moreover, there is a high demand for heated hangars, of which only Hangar #7 and #8 are heated. Currently there are eight T-hangar units and eight clearspan hangars. There is one privately owned hangar off airport property that houses three aircraft (1 jet and 2 single engine aircraft) which is not be included in any of the following calculations. The T-hangar facilities are about 60 percent occupied, while the clearspan hangars are currently operating close to 100 percent capacity. FBO conversations with aircraft owners indicate a need for heated hangars for both based jet aircraft, as well as transient aircraft. Presently Hangars #1, 2 and 3 have capacity to house approximately 6 single engine aircraft each. Hangar #4 can store 5 single-engine aircraft, Hangar #5 can store 1 multi-engine aircraft, Hangar #6 can store single/twin engine mix, Hangars #7 can store 3 multi-engine and Hangar #8 can store 3 multi-engine or 1 jet aircraft and 2 singleengine aircraft. According to FBO personnel, a portion of Hangar #7 is on lease to the County Sheriff so it stores 2 multi-engine aircraft and one helicopter. For planning purposes, the number of aircraft per Hangars #1, 2, 4 and 5 will remain unchanged; Hangar #6 is flexible to accommodate single/mutli-engine aircraft, Hangar #7 will accommodate 2 multi-engine aircraft, and a helicopter; and Hangar #8 will accommodate 1 jet aircraft and 2 single engine. Hangar #3 is in poor condition and
87 Design Criteria and Facility Requirements 4-30 will be unable to store aircraft until it is rebuilt. For planning purposes this hangar should be rebuilt in the near term so the calculations for 2015 will be offset by the loss of this storage, less 6 aircraft, but will be added back in by Fortunately some of these single engine aircraft can be displaced into the T-hangars. Airport Cooperative Research Program (ACRP) Report 113, Guidebook on General Aviation Facility Planning, provides a guideline when considering hangar sizes and accommodations for group I and II aircraft. Community hangars with multiple tenants work well in providing flexibility when there is an FBO or manager in charge of the hangar, as is the case at DKK. An 80 x 80 hangar, with a 24 foot door can accommodate approximately 84% of group I and II aircraft; these are aircraft with wingspans less than 79 feet. Comparing this hangar to the TFMSC usage, this hangar could accommodate most of the business jet aircraft that use the airport. A smaller 60 x 60 hangar, with a 16 foot door, can accommodate approximately 28% of the group I and II aircraft fleet, such as the Citation CJ2. Moving single engine aircraft from the clearspan hangars to open up the clearspan hangars for jets is included in the forecast calculations. Applying the forecasts from Chapter 3, along with the above mentioned metrics Table 4-7 illustrates the complete hangar requirements through the planning period for based aircraft. Table 4-8 Hangar Facility Requirements BASED AIRCRAFT BASED AIRCRAFT IN PRIVATE HANGAR BASED AIRCRAFT REQUIRING HANGARS T-HANGAR UNIT DEMAND CLEARSPAN DEMAND (# AIRCRAFT) EXISTING FACILITIES T-HANGAR UNIT CLEARSPAN (# AIRCRAFT) ADDITIONAL T-HANGAR UNITS REQUIRED ADDITIONAL CLEARSPAN STYLE REQUIRED (# AIRCRAFT) Source: Passero Associates The additional clearspan hangars are needed to accommodate the forecasted increase in jet aircraft and helicopters. These facilities should be constructed to be heated hangars, capable of accommodating business jet aircraft, such as the Lear 60, Cessna CJ3 and CJ4. In addition, the hangar space could be rented out for transient jets that use the airport, including aircraft such as the Challenger 600, and Hawker 800, which could be accommodated in an 80 x 80 hangar. A smaller 60 x 60 hangar can be used to accommodate the smaller CJ2 or helicopter. For reasons stated above, a number of hangar facilities will be reflected on the ALP. These hangars will require adjacent apron space, some of which will take away from the available apron, however it will not cause a deficit to available apron space, as mentioned earlier. Additional hangar facilities provide the flexibility for the County to move forward with additional development, as funds and business demands become available. One of the clearspan hangars (hangar #3) is in poor shape, should be considered for removal and replacement in the short-term. When such work is performed insulation and heat should be added to this hangar General Aviation Terminal DKK doesn t have a general aviation terminal per se. The FBO provides many of the services of a general aviation terminal, such as space for offices, waiting areas, flight planning, concessions, storage, and other amenities for pilots and passengers. General aviation terminals also provide the first and last impression of the airport and local area that pilots and passengers experience. Airport Cooperative Research Program (ACRP) Report 113, Guidebook General Aviation Facility Planning, provides a planning metric to estimate space requirements for a general aviation terminal building. For this, an estimate of peak hour pilots/passengers is necessary to determine the number of people that
88 Design Criteria and Facility Requirements 4-31 would use the general aviation terminal facilities during a one-hour period. To estimate the peak hour pilots/passengers, the following methodology was applied with the results shown in Table 4-8. Obtain the peak-hour factors from the forecasts For planning, a factor of 2.5 people (pilots and passengers) per peak hour operation can be assumed. An area of 100 to 150 square feet of space per person was considered adequate to accommodate the peak hour traffic. This value accommodated all functions of a full service general aviation terminal building including FBO counter space, waiting area, snack room, office space, pilot s lounge, restrooms, training area, circulation space, etc. Table 4-9 GA Terminal Gross Area Analysis PEAK HOUR OPERATIONS NUMBER OF PEOPLE (X2.5) TOTAL TERMINAL SPACE (SF) EXISTING FBO (SF) BASED YEAR ,000-4,500 3,000 FORECASTS ,000-4,500 3, ,000-4,500 3, ,000-4,500 3, ,000-4,500 3,000 Source: Passero Associates These results are general in nature and the actual square footage would be determined on needs for internal space usage, if the Airport Sponsor chose to construct a separate building. Discussions with the TAC identified no need for a separate terminal building and continued use of the FBO facility Landside Facilities An integral part of an airport s operations is that which relates to air travel. The landside facilities such as the local street access, airport circulations roads, and automobile parking are equally critical to development. Likewise, the airside components addressed previously are dependent upon the availability of the proper landside features. The following sections address these elements Landside Access The direct landside access to the airport is from Terminal Drive, which connects to Middle Road. Terminal Drive leads to the FBO building, and associated automobile parking (discussed below). There are other access points, through controlled fences, for airport and emergency personnel to access the airport property, but there are only two public access points, a pedestrian gate and automobile gate on the airside of the FBO building. The automobile electric access loop near the FBO building was replaced in 2015 as part of the apron rehabilitation project. There is a separate automobile gate on the east side of the parking lot. There is ample signage to the airport in the surrounding neighborhood. While adequate today, the airport access should be rehabilitated as useful life expires Automobile Parking At many general aviation airports, a number of automobiles are parked in the hangar facilities while the aircraft are in use. Given the configuration of the hangar facilities, most automobiles park in the main parking lot near the FBO building, which prevent unauthorized access onto the airfield. This parking lot is capable of handling 85 automobiles, and was recently rehabilitated in Rehabilitate automobile parking as useful life expires.
89 Design Criteria and Facility Requirements Support Facilities and Property Airport Rescue and Fire Fighting (ARFF) DKK is not identified as a Part 139 airport, and as such there is no federal requirement to position or maintain an aircraft rescue and firefighting (ARFF) unit on the airfield. As present, local firefighting personnel and other first responders are on call to aid in case of an emergency at the airport. Being the airport has no plans to expand its current role, ARFF equipment and personnel will not be required at DKK Fuel Storage/Deicing For an airport, such as DKK, that accommodate general aviation and business jet aircraft, a fuel tank for each type of fuel should be provided. DKK has two fuel storage facilities, one for each type of fuel, on airport property to serve the needs of the flying public. An additional facility is located with the private corporate hanger, off airport property, and is not included in further discussions. The on-airport facilities provide AvGas (100LL) and Jet-A aviation fuels, as described in section of this report. Based on the fleet mix forecasts, single and multi-engine aircraft were combined for AVGAS usage while turbojet and helicopters were added together for Jet A usage. Historic fuel sales information was provided by FBO staff. Based on conversations with the FBO the existing 12,000-gallon AVGAS and 20,000-gallon Jet A tank are sufficient to meet the demand of the fleet using the airport. The tanks are refilled several times a year. Both tanks however are below ground, and in the future, when these tanks reach their useful life, there should be consideration for above-ground tanks. The location of these facilities should be situated for easy access by the refueling vehicle and easy access for aircraft, both into and out of the fuel area, without impacting aircraft maneuvering. There is no deicing conducted at the airport, as aircraft are kept in heated hangars Snow Removal and Grass Cutting Equipment The airport maintains several pieces of equipment to maintain the airport, both during the winter and during the summer. The list of equipment can be found in Appendix H. In 2015 the airport acquiring snow removal equipment consisting of a truck and plow. The next oldest snow removal equipment, a blower, dates from Based on conversations with the airport manager and staff, there are no known problems with the existing equipment as of this writing. The County maintains the equipment typically past the 10-year useful life. The next piece of equipment that will need replacing is the blower. When new snow removal equipment is needed, an analysis of the type and size of the equipment will be justified at that time. In addition, the airport maintains grass cutting equipment that is not funded under FAA AIP. The airport will need a brush hog soon to maintain the grounds outside the airport fence Property Security Fencing and Access Control Security fencing is the most common means of securing a perimeter of an airport. As described in section , the entirety of the airfield is enclosed with a 8-foot tall perimeter fence with 3 strands of barbed wire on top. The fence line has a number of secure access points and security measures are in place to ensure positive access control of the airfield. The existing fence and access control measures meet the recommendations made by New York State and the Transportation Security Administration (TSA) for general aviation airport security. Any future development on the airfield will include additions or modifications to the security fence as needed Wildlife The FAA has had a wildlife hazard management program in place for more than 50 years. This program focuses on mitigating wildlife hazards on or near airports through habitat modification, harassment technology, and research.
90 Design Criteria and Facility Requirements 4-33 The program continues to evolve and include a number of advisory circulars, best management practices, and resources to assist airports. While the airport is enclosed by fencing, it continues to have a wildlife issue near the culvert that runs under Runway 24. In 2015 a project was completed to address this wildlife issue, by installing a curtain on the culvert. The drainage swales were cleared to prevent additional growth that may attract wildlife Land The existing airport property boundary encompasses approximately 450 acres of land. The airport property is surrounded by several roadways, Cook Road, near Runway 6 end, Sheridan Road, near Runway 33 end, Newell Road, near Runway 24 end and Middle Road, near Runway 15 end. The County maintains several easements within the RPZ off each runway end, but not the complete RPZ. Some lands within the Runway 15 RPZ are Railroad Right-of- Way (ROW) lands that can t be owned, but the Airport sponsor has successfully worked with the Railroad to clear tree obstructions. Some lands within the Runway 33 are abandoned railroad ROW. The County has successfully worked with the Railroad to clear obstructions. Some lands within the Runway 6 RPZ were abandoned Railroad ROW, but sold to a private landowner. The County will need to work with this landowner to obtain an easement, at minimum, to control obstructions. Some lands within the Runway 24 RPZ are on private property. The County will need to work with the landowners to obtain easements, at minimum, to control obstructions. In recent years, the County has collaboratively worked with adjacent landowners to remove tree obstructions, but has not pursued eminent domain or additional easements. The County should ensure that the existing easements meet the current airspace requirements and are maintained to permit future obstruction removal, as well as pursue easements over the remaining lands within the RPZ, and other lands that are limiting the approaches to the runway (see section above). The airport has surplus land east and west of Runway 15-33, herein termed developable land. With the decommissioning of the VOR a portion of these lands become available for development. These lands may be available for aviation or non-aviation related development. The airport sponsor should work with the industrial development agency (IDA) to determine if these lands could be developed for aviation related businesses (ie., cargo) or non-aeronautical related businesses that would benefit with a presence near an airport, further fostering economic development within the County. If lands are to be used for non-aeronautical related development justification that these lands are not needed for aviation development will be warranted, especially if the land is to be released from airport property. Any development on these lands needs to ensure it doesn t conflict with surrounding airspace, attract wildlife, inhibit visibility or create radio interference. There are no known plans for this area at the time of this writing, thus the ALP will depict these lands for planning purposes only, and denote them as developable lands. Separately there is an additional sliver of airport land, approximately 10.9 acres, across Middle Road, near the airport beacon. This land is not needed for aviation purposes and should be considered for non-aeronautical development. Early coordination with the FAA for development on these lands should occur. Some required steps include: filing Form , along with necessary environmental review and non-aeronautical review. These reviews are necessary ensure the proposal will not negatively impact airport operations. This land will be labeled for planning purposes, non- aeronautical use only on the ALP Summary Table 4-10 provides a summary of the facility requirements that were determined necessary to satisfy the forecast of aviation demand and provide a safe, efficient, and user-friendly operating environment. Essentially, this table includes the minimum improvements required over the 20-year planning period. Some additional facilities will also be planned and included as part of the final ALP and capital improvement program to enhance the Airport. The order in which these improvements are listed does not have any relation to the priority or phasing of such projects.
91 Design Criteria and Facility Requirements 4-34 Table 4-10 Summary of Facility Requirements RUNWAYS TAXIWAYS AIRFIELD SUPPORT LANDSIDE FACILITIES SUPPORT FACILITIES MAINTAIN RUNWAY LENGTHS AND WIDTHS REHABILITATE PAVEMENTS AS USEFUL LIFE APPROACHES INSTALL APPROACH LIGHTING SYSTEM RWY 24 TO >= ¾ MILE INSTALL REILS RWY REHABILITATE TAXIWAY B SOUTH FROM RWY 6-24 TO RUNWAY 33 RE-EVALUATE TAXIWAY WIDTH & REPLACE LIGHTING ON WIDTHS GREATER THAN DESIGN STANDARDS FAA TO DECOMISSION THE VOR IN 2017 REMOVE OBSTRUCTIONS LIMITING INSTRUMENT APPROACHES & PAPI OCS CLEARANCE UPGRADE AIRFIELD LIGHTSING TO LED AS NEEDED, ENSURE USABILITY WITH INFRARED USERS INSTALL LIGHT CONTROL SWITCH INSIDE FBO REPLACE AIRFIELD SIGNAGE AS NEEDED UPGRADE RCO/RTR TO COMMUNICATE WITH BUFFALO DIRECTLY ON THE GROUND INSTALL NEW FUEL FARM, WHEN OLD TANKS ARE REACHING USEFUL LIFE MAINTAIN RUNWAY DESIGNATION MAINTAIN RUNWAY MARKINGS INSTALL ADDITONAL WIND CONES RWY 15 & 33 REHABILITATE APRONS AS USEFUL LIFE APPROACHES REHABILITATE/REPLACE EXISTING CLEARSPAN HANGAR#3 WITH HEATED HANGAR CONSTRUCT ADDITIONAL HEATED HANGARS REHABILITATE TERMINAL DRIVE REHABILITATE AUTOMOBILE PARKING AS USEFUL LIFE APPROACHES ACQUIRE SNOW REMOVAL EQUIPMENT PURCHASE BRUSH HOG EQUIPMENT RELOCATE AIRPORT FENCE AROUND PROPOSED DEVELOPMENT PUBLISH METARS ACQUIRE EASEMENTS TO REMOVE OBSTRUCTIONS LAND DEVELOPMENT EAST AND WEST SIDE OF RUNWAY Source: Passero Associates
92 Chapter Five Alternatives
93 Design Criteria and Facility Requirements AIRPORT DEVELOPMENT PLAN The primary objective of this chapter is to consider airport development alternatives that meet the aviation needs over the planning period while satisfying the ultimate development goals for the Airport. Airport Management s primary goal for the airport is to maintain capability of existing facilities. These discussions aided in the development of the alternative plans for development, in conjunction with industry trends and associated facilities. For this reason, the airport development plans are divided into phases: (1) to maintain the existing capabilities of the airport, (2) to provide economic development, and (3) to improve airfield visibility during poor weather conditions. All alternatives were evaluated across the general criteria outlined in Table 5-1. Table 5-1. Evaluation Criteria for Future Development Initiatives CRITERIA DESCRIPTION Airport Design Standards The plan must resolve any existing or future deficiencies as they relate to FAA design and safety criteria. Facility Requirements Environmental Cost Any selected development plan should be capable of meeting the Airport's facility needs as they have been identified for the planning period. Airport growth and expansion has the potential to impact the Airport's environs. The selected development plan should seek to minimize environmental impacts. The preferred development plan should also recognize sensitive environmental features; such as, wetlands, archeologically/historically significant areas, etc., that may be impacted by any proposed development. Some alternatives may result in excessive costs as a result of expensive construction, acquisition, or other development and/or environmental requirements. In order for a preferred development plan to best serve the Airport and the community it must satisfy development needs at a reasonable cost. Obstruction Analysis The plan should identify and minimize obstructions that would inhibit operations. Land Acquisition The plan needs to identify land acquisition necessary to meet the necessary design standards. Feasibility The selected development plan should be capable of being implemented. Therefore, it must be acceptable to the FAA, NYSDOT, local governments, and the community served by the Airport. The preferred development plan should proceed along a path that supports the area's long-term economic development. Source: Passero, Airport Development Alternatives and Concepts The Airport development plan outlines the necessary development and facility improvements to meet the forecast demand, and to provide the Airport and surrounding community with the greatest overall benefit Alternatives Airfield facilities, by their very nature, are the focal point of an airport complex. Because of their role, and the fact that they physically dominate a great deal of an airport s property, airfield facility needs are often the most critical factor in the determination of viable airport development alternatives. Specifically, the runway and taxiway systems of an airfield generally require the greatest commitment of land area and often have the greatest influence on the identification and development of other airport facilities.
94 Design Criteria and Facility Requirements 5-2 The potential for physical expansion of an airport to accommodate airfield development is the primary factor that determines development in the long term. The runway and taxiway systems directly affect the efficiency of aircraft movements both on the ground and in the surrounding airspace. The runway and taxiway systems also impact the size and type of aircraft an airfield can regularly facilitate. The following sections of this report outline development options when looking specifically at the airfield and its necessary facilities and spatial requirements to facilitate safe and efficient aircraft operations. Landside development is limited, based on the previous chapter, and will be consistent with each of the alternatives. Landside development considers the following: light GA, corporate GA, aircraft services (FBO, maintenance/repair), airfield services (airport maintenance, fuel, etc.), and non-aviation use areas. There are discussions between the Airport sponsor and the local industrial development agency (IDA) to identify potential developable land on the airport that may not be required for aeronautical development. The land use plans must meet the forecasted demand for facilities. Presently all development is in the northwest corner of the airport. Discussions with members of the TAC indicated the need to continue to infill development in the existing terminal area. Additional conventional hangars, and necessary apron to connect the hangars to the existing apron area are required. Replacement of Hangar #3 is also included, being replaced with a heated hangar. It also includes identification of areas on the airport that could be development for aviation-related or non-aviation related uses. Setback and building height requirements, along with airfield line of sight criteria were considered when identifying these areas. Proximity to roadway and existing gate access were also considered Required Airfield Improvements Some airfield improvements are required at the Airport to meet FAA design and safety standards and to ensure compliance with federal grant assurances Proposed Airfield Improvements The existing airfield is situated such that it provides adequate runways and suitable full-length parallel taxiways. The dimensions of the runways and runway to taxiway separation are suitable to address the needs of the users of the runway. Historically the airport has been developed to B-II standards, which meets the user s needs. Some taxiway pavement rehabilitation is needed because of age, but overall the airfield configuration for runways and taxiways are sufficient. There are no foreseeable needs for additional runway length or changes to the existing taxiway layouts Airfield Alternatives Airfield alternatives are presented in the following sections. Each airfield alternative attempts to include the required and proposed improvements discussed in earlier chapters. These concepts were prepared for the purpose of facilitating an active discussion with the TAC and discover a plan for DKK which supports its aeronautical users and maximizes its public value to the surrounding communities. The airfield alternatives focus on impacts to the existing facility, specifically obstruction impacts to the usability of each runway. These obstructions impact the visual 20:1 surface, the GQS 30:1 surface and the PAPI surface. Obstructions are obtained from mapping that was completed for this master plan, and were identified earlier in section The TAC wants to address development at the airport in an order to (1) retain usage of existing facilities; (2) improve economic development of the airport; and (3) improve the usability of Runway 24, through the installation of an approach lighting system to aid in airfield identification during low visibility conditions. Airfield Alternative One Alternative One, Figure 5-1, is essentially a "Do-Nothing" approach with respect to runway development and obstruction analysis. This alternative is used to examine a minimalist approach to airport improvement. This alternative would serve to address issues relative to meeting basic design standards and safety requirements. This alternative does not fully support all the future desires by the aeronautical users, namely an approach lighting system to Runway 24, or more importantly the necessary obstruction removal to support the existing instrument approaches. These obstructions are restricting the use of existing instrument approaches, and negatively impacting the usability of the airport. For these reasons this alternative is not a viable option.
95 Design Criteria and Facility Requirements 5-3 Airfield Alternative Two Alternative Two, Figure 5-2, explores maintaining the usability of the existing facility, the primary goal of airport management and members of the TAC. This alternative maintains runway/taxiway/apron pavement. This alternative considered that although the runway width exceeds design standards, the runway is currently used by the next category of aircraft, which would require a wider runway, thus maintaining the existing runway width. This alternative focuses on clearing the necessary obstruction to the visual 20:1 as identified in Table 4-4. Since most of these obstructions are off airport property, this alternative considers the necessary easement acquisitions for the obstruction removal. Through obstruction removal the existing runway ends would remain unchanged, and the existing instrument approaches would not be restricted. Availability of the GPS approach through third party providers should be rectified as the obstructions that currently limit the approach angle would be removed. The PAPI OCS (obstacle clearance surface) would be cleared for Runway 6, 24, and 15. Appendix D contains the drawings for the PAPI OCS evaluation. Airfield Alternative Three Alternative Three, Figure 5-3, explores the concept of removing obstructions, similar to Alternative 2, to maintain the usability of the airfield, and provide economic development. This alternative addresses airport management s first two goals, and would also provide the required facilities identified earlier in this report. This alternative maintains runway/taxiway/apron pavement. This alternative considered that although the runway width exceeds design standards, the runway is currently used by the next category of aircraft, which would require a wider runway, thus maintaining the existing runway width. It provides for the future landside development identified earlier in this report, along with identifying other developable lands. These developable lands are shown for planning purposes, and additional work would be required prior to approval by the FAA to develop such lands, including, but not limited to, type of development known, land lease review, aeronautical or non-aeronautical use, environmental review. The lands on the east and west of Runway 33, as shown in this alternative can be either aeronautical or non-aeronautical use. Lands to the northwest of the airport, across Middle Road will not be required for aeronautical use and should be considered for non-aeronautical, revenue generating projects, as long as the project meets airport grant assurances and received proper FAA approvals. Airfield Alternative Four Alternative Four, Figure 5-4, explores the concept of removing obstruction, similar to Alternative 2, and provide economic development, similar to Alternative 3. This alternative includes the option of adding an approach lighting system on Runway 24 end. The goal of the installation of the ALS would be raise awareness of the airport environment, especially during inclement weather conditions. At the existing 1-mile visibility, the installation of an ALS could reduce the minima to ¾ mile. Planning for this reduction results in the RPZ dimensions increasing from 500 feet inner width, 700 feet outer width and 1,000 feet long to 1,000 feet inner width, 1,510 feet outer width and 1,700 feet long. The increase in land required goes from acres to acres. This alternative includes the easement acquisition of the additional lands within the RPZ that are not currently under easement or acquisition. This alternative addresses the three goals of airport management, and the interests of the TAC. This alternative maintains runway/taxiway/apron pavement. This alternative considered that although the runway width exceeds design standards, the runway is currently used by the next category of aircraft, which would require a wider runway, thus maintaining the existing runway width. It provides for the future landside development identified earlier in this report, along with identifying other developable lands. The final element of this alternative is to install an approach lighting system on Runway 24 to increase the usability of the runway during poor weather conditions, by increasing the visibility of the airport.
 700' PASSERO ASSOCIATES RPZ www.passero.")
 COMMERCIAL TTF RUNWAY PROTECTION ZONE APPROACH SLOPE 20:1 500'")


96 LEGEND DESCRIPTION EXISTING RUNWAY SAFETY AREA () RUNWAY OBJECT FREE AREA () RUNWAY OBJECT FREE ZONE (ROFZ) ROFZ RUNWAY PROTECTION ZONE (RPZ) Architecture Engineering TOFA TAXIWAY OBJECT FREE AREA (TOFA) 700' PASSERO ASSOCIATES RPZ AIRPORT PAVEMENT AIRPORT REFERENCE POINT BUILDINGS AIRPORT PROPERTY LINE X FENCE GENERIC VISUAL GLIDE SLOPE INDICATOR AIRPORT BEACON AUTOMATED SURFACE OBSERVING SYSTEM PL EA MIDD WINDSOCK LE RO AD M ID 300' DL E THRESHOLD LIGHTS RO A D EA PL 1000' EXISTING POLE BARN EXISTING ASPHALT APRON X ROAD EASEMENT (EXISTING ) COMMERCIAL TTF RUNWAY PROTECTION ZONE APPROACH SLOPE 20:1 500' NON-AERONAUTICAL USE EXISTING BUILDING RO AD PVC TIN 8" M AR EA PL 150' 8" PVC BEACON CON TAN ARE K C. A 8" PVC EXISTING HANGARS SAN. EA P L EXISTING TERMINAL BUILDING EXISTING COUNTY BLDG. FUEL L PL PL EA LE R EL OA D Client: Chautauqua County 1000' 454 North Work Street Falconner, New York Passero Associates PL EA x 242 W. Main Street Rochester, NY AD PL EA EA P AD L Wayne B. Zian Revisions No. By Description LR Date EL UNAUTHORIZED ALTERATIONS OR ADDITIONS TO THIS DRAWING IS IN VIOLATION OF STATE EDUCATION LAW ARTICLE 145 SECTION 7209 AND ARTICLE 147 SECTION THESE PLANS ARE COPYRIGHT PROTECTED c HE RI D AN 1,000' PL TS 300' L Lisa Cheung Designed by W ES 500' EA P Wayne F.Wegman, P.E. Project Manager O PL NE W RO EA RT PO (585) Fax: (585) Principal-in-Charge EA AI R EA 150' PL DD MI W RUNWAY ,000' x 100' NE TAXIWAY A1 TAXIWAY B PL 300' VOR EA EXISTING A.R.P. Stamp: RUNWAY PROTECTION ZONE APPROACH SLOPE 34:1 300' EA P 1000' EA 3 PL PL 700' L 12 EA 500' EXISTING WIND CONE 150' EA P 150' 500' 700' T# 400' EXISTING SEGMENTED CIRCLE 300' NY TAXIWAY A RUNWAY ,000' x 100' PL EA TAXIWAY A ASOS EXISTING WIND CONE EXISTING ASPHALT APRON RUNWAY PROTECTION ZONE APPROACH SLOPE 20:1 FUEL AD x FP O x FUEL EA 8" PVC AUTO PARKING LOT x LR 8" PVC x SAN MH x TRANSFORMER 8" PVC EA PL EXISTING PAPI (TYP) Airfield Alternate 1 No Build RO AD Master Plan Update MAGNETIC NORTH 10 15W (2015) RUNWAY PROTECTION ZONE APPROACH SLOPE 34:1 TRUE NORTH Chautauqua County Dunkirk Airport 700' Town/City: Sheridan County: Chautauqua State: New York Project No Drawing No. 400' 0 200' SCALE 1" = 400' 400' Figure ' Date December 2015
97 x x x 8" PVC CONC. TANK AREA 8" PVC 8" PVC SAN MH 8" PVC 8" PVC FP x x TRANSFORMER 1,000' x LEGEND DESCRIPTION EXISTING OBSTRUCTION REMOVAL 700' RUNWAY SAFETY AREA () RUNWAY OBJECT FREE AREA () RUNWAY OBJECT FREE ZONE (ROFZ) RUNWAY PROTECTION ZONE (RPZ) TAXIWAY OBJECT FREE AREA (TOFA) AIRPORT PAVEMENT ROFZ RPZ TOFA PASSERO ASSOCIATES Engineering Architecture AIRPORT REFERENCE POINT BUILDINGS AIRPORT PROPERTY LINE FENCE X X EXISTING COUNTY BLDG. EXISTING TERMINAL BUILDING BEACON EXISTING BUILDING EXISTING HANGARS EXISTING POLE BARN 8" PVC SAN. 300' 500' 150' 1000' RUNWAY PROTECTION ZONE APPROACH SLOPE 20:1 EXISTING PAPI MIDDLE ROAD MARTIN ROAD ROAD GENERIC VISUAL GLIDE SLOPE INDICATOR AIRPORT BEACON AUTOMATED SURFACE OBSERVING SYSTEM THRESHOLD LIGHTS WINDSOCK EASEMENT (EXISTING) RPZ PROPOSED EASEMENT CTTF NON-AERONAUTICAL 700' OBSTRUCTION REMOVAL RUNWAY PROTECTION ZONE APPROACH SLOPE 20:1 1000' TAXIWAY A 300' 500' FUEL 79' 131' EXISTING ASPHALT APRON AIRPORT ROAD AUTO PARKING LOT FUEL EXISTING SEGMENTED CIRCLE BRL (35') 150' EXISTING WIND CONE VOR TAXIWAY B EXISTING PAPI ASOS EXISTING PAPI BRL (35') 300' 150' 4,000' x 100' RUNWAY EXISTING WIND CONE EXISTING A.R.P. BRL (35') TAXIWAY A1 TAXIWAY A BRL (35') NEWELL ROAD 150' RUNWAY 6-24 WINDSOCK 400' 6,000' x 100' EXISTING PAPI NYT # ' PROPOSED EASEMENT NEWELL ROAD 1000' 1000' OBSTRUCTION REMOVAL MIDDLE ROAD RUNWAY PROTECTION ZONE APPROACH SLOPE 34:1 1510' HELD 0.00' NORTH IRON PIN FOUND Stamp: Client: Chautauqua County 454 North Work Street Falconner, New York Passero Associates 242 W. Main Street Rochester, NY Principal-in-Charge Project Manager Designed by No. Revisions Date By Description (585) Fax: (585) Wayne F.Wegman, P.E. Lisa Cheung Wayne B. Zian 500' RUNWAY PROTECTION ZONE APPROACH SLOPE 34:1 OBSTRUCTION REMOVAL 300' 700' PROPOSED EASEMENT WEST SHERIDAN ROAD MAGNETIC NORTH 10 15W (2015) TRUE NORTH UNAUTHORIZED ALTERATIONS OR ADDITIONS TO THIS DRAWING IS IN VIOLATION OF STATE EDUCATION LAW ARTICLE 145 SECTION 7209 AND ARTICLE 147 SECTION THESE PLANS ARE COPYRIGHT PROTECTED Airfield Alternate 2 Obstruction Removal RDC-B-II County: Master Plan Update Chautauqua County Dunkirk Airport Town/City: Chautauqua Sheridan State: New York c Project No ' 0 200' 400' 800' Drawing No. Figure 5-2 SCALE 1" = 400' Date December 2015
98 x x x 8" PVC CONC. TANK AREA 8" PVC 8" PVC SAN MH 8" PVC 8" PVC FP x x TRANSFORMER 1,000' x LEGEND DESCRIPTION EXISTING OBSTRUCTION REMOVAL 700' RUNWAY SAFETY AREA () RUNWAY OBJECT FREE AREA () RUNWAY OBJECT FREE ZONE (ROFZ) RUNWAY PROTECTION ZONE (RPZ) TAXIWAY OBJECT FREE AREA (TOFA) AIRPORT PAVEMENT ROFZ RPZ TOFA PASSERO ASSOCIATES Engineering Architecture AIRPORT REFERENCE POINT BUILDINGS AIRPORT PROPERTY LINE FENCE X X 700' OBSTRUCTION REMOVAL RUNWAY PROTECTION ZONE APPROACH SLOPE 20:1 1000' (2) EXISTING COUNTY BLDG. EXISTING TERMINAL BUILDING BEACON TAXIWAY A EXISTING BUILDING EXISTING HANGARS FUEL EXISTING POLE BARN PROPOSED APRON PROPOSED 60' X 60' HANGAR PROPOSED 80' X 80' HANGAR PROPOSED NON-AERONAUTICAL USE 300' 500' EXISTING ASPHALT APRON 8" PVC SAN. AUTO PARKING LOT FUEL EXISTING SEGMENTED CIRCLE BRL (35') 150' DEVELOPABLE LAND ACRES AIRPORT ROAD TRANSFORMER EXISTING WIND CONE VOR TAXIWAY B EXISTING PAPI ASOS EXISTING PAPI RVZ RVZ BRL (35') 300' 300' 500' 150' 150' 4,000' x 100' RUNWAY EXISTING WIND CONE 1000' RUNWAY PROTECTION ZONE APPROACH SLOPE 20:1 EXISTING PAPI EXISTING A.R.P. BRL (35') RVZ TAXIWAY A1 MIDDLE ROAD TAXIWAY A RVZ BRL (35') DEVELOPABLE LAND ACRES NEWELL ROAD 150' MARTIN ROAD RUNWAY 6-24 WINDSOCK 6,000' x 100' EXISTING PAPI 400' NYT # ' PROPOSED EASEMENT ROAD GENERIC VISUAL GLIDE SLOPE INDICATOR AIRPORT BEACON AUTOMATED SURFACE OBSERVING SYSTEM THRESHOLD LIGHTS WINDSOCK EASEMENT (EXISTING) RPZ PROPOSED EASEMENT COMMERCIAL TTF NON-AERONAUTICAL USE NEWELL ROAD 1000' OBSTRUCTION REMOVAL 1000' MIDDLE ROAD RUNWAY PROTECTION ZONE APPROACH SLOPE 34:1 1510' HELD 0.00' NORTH IRON PIN FOUND Stamp: Client: Chautauqua County 454 North Work Street Falconner, New York Passero Associates 242 W. Main Street Rochester, NY Principal-in-Charge Project Manager Designed by No. Revisions Date By Description (585) Fax: (585) Wayne F.Wegman, P.E. Lisa Cheung Wayne B. Zian 500' WEST SHERIDAN ROAD RUNWAY PROTECTION ZONE APPROACH SLOPE 34:1 OBSTRUCTION REMOVAL 300' 700' MAGNETIC NORTH 10 15W (2015) TRUE NORTH UNAUTHORIZED ALTERATIONS OR ADDITIONS TO THIS DRAWING IS IN VIOLATION OF STATE EDUCATION LAW ARTICLE 145 SECTION 7209 AND ARTICLE 147 SECTION THESE PLANS ARE COPYRIGHT PROTECTED Airfield Alternate 3 Obstruction Removal and Economic Development RDC-B-II County: Master Plan Update Chautauqua County Dunkirk Airport Town/City: Chautauqua Sheridan State: New York c Project No ' 0 200' 400' 800' Drawing No. Figure 5-3 SCALE 1" = 400' Date December 2015
 RUNWAY OBJECT FREE AREA () RUNWAY OBJECT FREE ZONE")
99 x x x 8" PVC CONC. TANK AREA 8" PVC 8" PVC SAN MH 8" PVC 8" PVC FP x x TRANSFORMER 1,000' x LEGEND DESCRIPTION EXISTING OBSTRUCTION REMOVAL 700' RUNWAY SAFETY AREA () RUNWAY OBJECT FREE AREA () RUNWAY OBJECT FREE ZONE (ROFZ) RUNWAY PROTECTION ZONE (RPZ) TAXIWAY OBJECT FREE AREA (TOFA) AIRPORT PAVEMENT ROFZ RPZ TOFA PASSERO ASSOCIATES Engineering Architecture AIRPORT REFERENCE POINT BUILDINGS AIRPORT PROPERTY LINE FENCE X X 700' OBSTRUCTION REMOVAL RUNWAY PROTECTION ZONE APPROACH SLOPE 20:1 1000' (2) EXISTING COUNTY BLDG. EXISTING TERMINAL BUILDING BEACON TAXIWAY A EXISTING BUILDING EXISTING HANGARS FUEL EXISTING POLE BARN PROPOSED APRON PROPOSED 60' X 60' HANGAR PROPOSED 80' X 80' HANGAR PROPOSED NON-AERONATICAL USE 300' 500' EXISTING ASPHALT APRON 8" PVC SAN. AUTO PARKING LOT FUEL EXISTING SEGMENTED CIRCLE BRL (35') 150' DEVELOPABLE LAND ACRES AIRPORT ROAD TRANSFORMER EXISTING WIND CONE VOR TAXIWAY B EXISTING PAPI ASOS EXISTING PAPI RVZ RVZ BRL (35') 300' 300' 500' 150' 150' 4,000' x 100' RUNWAY EXISTING WIND CONE 1000' RUNWAY PROTECTION ZONE APPROACH SLOPE 20:1 EXISTING PAPI EXISTING A.R.P. BRL (35') RVZ TAXIWAY A1 MIDDLE ROAD TAXIWAY A RVZ BRL (35') DEVELOPABLE LAND ACRES NEWELL ROAD 150' MARTIN ROAD RUNWAY 6-24 WINDSOCK 6,000' x 100' EXISTING PAPI 400' PROPOSED ALS NYT # ' PROPOSED EASEMENT ROAD GENERIC VISUAL GLIDE SLOPE INDICATOR AIRPORT BEACON AUTOMATED SURFACE OBSERVING SYSTEM THRESHOLD LIGHTS WINDSOCK EASEMENT (EXISTING) RPZ PROPOSED EASEMENT COMMERCIAL TTF NON-AERONAUTICAL USE NEWELL ROAD 1000' OBSTRUCTION REMOVAL 1000' MIDDLE ROAD RUNWAY PROTECTION ZONE APPROACH SLOPE 34:1 1510' HELD 0.00' NORTH IRON PIN FOUND Stamp: Client: Chautauqua County 454 North Work Street Falconner, New York Passero Associates 242 W. Main Street Rochester, NY Principal-in-Charge Project Manager Designed by No. Revisions Date By Description (585) Fax: (585) Wayne F.Wegman, P.E. Lisa Cheung Wayne B. Zian 500' WEST SHERIDAN ROAD RUNWAY PROTECTION ZONE APPROACH SLOPE 34:1 OBSTRUCTION REMOVAL 300' 700' MAGNETIC NORTH 10 15W (2015) TRUE NORTH UNAUTHORIZED ALTERATIONS OR ADDITIONS TO THIS DRAWING IS IN VIOLATION OF STATE EDUCATION LAW ARTICLE 145 SECTION 7209 AND ARTICLE 147 SECTION THESE PLANS ARE COPYRIGHT PROTECTED Airfield Alternate 4 Obstruction Removal and Economic Development/ALS RDC-B-II County: Master Plan Update Chautauqua County Dunkirk Airport Town/City: Chautauqua Sheridan State: New York c Project No ' 0 200' 400' 800' Drawing No. Figure 5-4 SCALE 1" = 400' Date December 2015
Source: Chippewa Valley Regional Airport ASOS, Period of Record
 Chapter 1 Inventory Runway wind coverage is the percentage of time a runway can be used without exceeding allowable crosswind velocities. Allowable crosswind velocities vary depending on aircraft size
1.1.3 Taxiways. Figure 1-15: Taxiway Data. DRAFT Inventory TYPICAL PAVEMENT CROSS-SECTION LIGHTING TYPE LENGTH (FEET) WIDTH (FEET) LIGHTING CONDITION
 WIDTH (FEET) LIGHTING CONDITION") 1.1.3 Taxiways EWN has an extensive network of taxiways and taxilanes connecting the terminal, air cargo, and general aviation areas with the runways as listed in Figure 1-15. A 50-foot wide parallel taxiway
1.1.3 Taxiways EWN has an extensive network of taxiways and taxilanes connecting the terminal, air cargo, and general aviation areas with the runways as listed in Figure 1-15. A 50-foot wide parallel taxiway
Merritt Island Airport
 TABLE OF CONTENTS CHAPTER 1 INTRODUCTION... 1-1 INTRODUCTION AND PROJECT OVERVIEW... 1-1 General Guidelines... 1-1 Prior Planning Documentation... 1-2 Key Issues... 1-2 Goals and Objectives... 1-2 Regulatory
Table of Contents. Overview Objectives Key Issues Process...1-3
 Table of Contents Chapter One Introduction Overview...1-1 Objectives...1-1 Key Issues...1-2 Process...1-3 Chapter Two Inventory of Existing Conditions Airport Setting...2-1 Locale...2-1 Airport Surroundings...2-5
BELFAST MUNICIPAL AIRPORT OVERVIEW
 BELFAST MUNICIPAL AIRPORT OVERVIEW LOCATION AND HISTORY Belfast Municipal Airport (Federal Aviation Administration (FAA) airport code BST, International Civil Aviation Organization airport code KBST, FAA
DRAFT FINAL REPORT AIRPORT MASTER PLAN. Rifle Garfield County Airport Revised May 15, 2014
 DRAFT FINAL REPORT AIRPORT MASTER PLAN Rifle Garfield County Airport Revised May 15, 2014 As required by Paragraph 425.B(4) of FAA Order 5100.38C, Airport Improvement Program (AIP) Handbook: The preparation
DRAFT MASTER PLAN UPDATE
 DRAFT MASTER PLAN UPDATE CHAPTER VI: AIRPORT LAYOUT PLAN NARRATIVE DRAFT REPORT APRIL 2017 PREPARED BY: Table of Contents WESTCHESTER COUNTY AIRPORT 6 AIRPORT LAYOUT PLAN NARRATIVE REPORT... 6-1 6.1 AGIS
Chapter Three AIRPORT FACILITY REQUIREMENTS/ALTERNATIVES
 Chapter Three AIRPORT FACILITY REQUIREMENTS/ALTERNATIVES Airport Layout Plan Report In this chapter, existing components of the Airport are evaluated so that the capacities of the overall system are identified.
Hartford-Brainard Airport Potential Runway Closure White Paper
 Hartford-Brainard Airport Potential Runway 11-29 Closure White Paper June 2012 In recent years there has been discussion regarding the necessity of Runway 11-29 to the Hartford- Brainard Airport (HFD)
Airport Master Plan for. Brown Field Municipal Airport PAC Meeting #3
 Airport Master Plan for Brown Field Municipal Airport PAC Meeting #3 Public Meeting #1 > 8/24/17 from 5:30 to 8:00 pm > 41 attendees signed-in > Comments: > EAA area > Environmental constraints > Focus
The purpose of this Demand/Capacity. The airfield configuration for SPG. Methods for determining airport AIRPORT DEMAND CAPACITY. Runway Configuration
 Chapter 4 Page 65 AIRPORT DEMAND CAPACITY The purpose of this Demand/Capacity Analysis is to examine the capability of the Albert Whitted Airport (SPG) to meet the needs of its users. In doing so, this
FACILITY REQUIREMENTS SUMMARY OF KEY ISSUES OVERVIEW
 FACILITY REQUIREMENTS SUMMARY OF KEY ISSUES OVERVIEW This summary is intended to provide a brief overview of the key issues associated with conformance to FAA standards at Methow Valley State Airport.
CHAPTER 5 - FACILITY REQUIREMENTS
 CHAPTER 5 - FACILITY REQUIREMENTS This chapter identifies the requirements for airfield and landside facilities to accommodate the forecast demand level. Facility requirements have been developed for the
CHAPTER 1: INTRODUCTION
 CHAPTER 1: INTRODUCTION Purpose and Scope The information presented in this report represents the study findings for the 2016 Ronan Airport Master Plan prepared for the City of Ronan and Lake County, the
According to FAA Advisory Circular 150/5060-5, Airport Capacity and Delay, the elements that affect airfield capacity include:
 4.1 INTRODUCTION The previous chapters have described the existing facilities and provided planning guidelines as well as a forecast of demand for aviation activity at North Perry Airport. The demand/capacity
Agenda: SASP SAC Meeting 3
 Agenda: SASP SAC Meeting 3 Date: 04/12/18 Public Involvement Plan Update Defining the System Recommended Classifications Discussion Break Review current system Outreach what we heard Proposed changes Classification
CHAPTER 3 ALTERNATIVES CONSIDERED
 CHAPTER 3 ALTERNATIVES CONSIDERED 3.0 ALTERNATIVES The 2010 Stevensville Airport Master Plan contained five (5) airside development options designed to meet projected demands. Each of the options from
Airport Master Plan for Montgomery-Gibbs Executive Airport PAC Meeting #3
 Airport Master Plan for Montgomery-Gibbs Executive Airport PAC Meeting #3 Agenda > Introductions > Public Meetings Overview > Working Paper 3 - Facility Requirements > Working Paper 4 - Environmental Baseline
CHAPTER 1 BACKGROUND AND PROPOSED ACTION
 CHAPTER 1 BACKGROUND AND PROPOSED ACTION 1.0 INTRODUCTION An Environmental Assessment (EA) evaluates the effects of a proposed Federal action on the surrounding environment and is prepared in compliance
Executive Summary. MASTER PLAN UPDATE Fort Collins-Loveland Municipal Airport
 Executive Summary MASTER PLAN UPDATE Fort Collins-Loveland Municipal Airport As a general aviation and commercial service airport, Fort Collins- Loveland Municipal Airport serves as an important niche
Airport Master Plan. Brookings Regional Airport. Runway Runway 17-35
 Runway 17-35 Airport Master Plan Runway 12-30 Brookings Regional Airport Table of Contents Table of Contents Chapter 1: Master Plan Goals... 1-1 1.1. Introduction... 1 1.2. Objective 1 Identify improvements
CHAPTER 1 EXECUTIVE SUMMARY
 CHAPTER 1 EXECUTIVE SUMMARY 1 1 EXECUTIVE SUMMARY INTRODUCTION William R. Fairchild International Airport (CLM) is located approximately three miles west of the city of Port Angeles, Washington. The airport
1.0 Project Background Mission Statement and Goals Objectives of this Sustainable Master Plan
 TABLE OF CONTENTS CHAPTER 1 INTRODUCTION 10 Project Background 1-1 11 Mission Statement and Goals 1-1 12 Objectives of this Sustainable Master Plan 1-2 CHAPTER 2 INVENTORY 20 Airport Background 2-1 201
Chapter 9 - AIRPORT SYSTEM DESIGN
 Chapter 9 - AIRPORT SYSTEM DESIGN 9.01 GENERAL This chapter discusses the development program for Dutchess County Airport to the year 2020. This airport system design is based upon the airport's existing
CATCODE ] CATCODE
![CATCODE ] CATCODE](/thumbs/82/85644630.jpg "CATCODE ] CATCODE") Runways. FAC: 1111 CATCODE: 111111 OPR: AFCEC/COS OCR: AF/A3O-A 1.1. Description. The runway is the paved surface provided for normal aircraft landings and take offs. Runways are classified as either Class
Runways. FAC: 1111 CATCODE: 111111 OPR: AFCEC/COS OCR: AF/A3O-A 1.1. Description. The runway is the paved surface provided for normal aircraft landings and take offs. Runways are classified as either Class
Appendix C AIRPORT LAYOUT PLANS
 Appendix C AIRPORT LAYOUT PLANS Appendix C AIRPORT LAYOUT PLANS Airport Master Plan Santa Barbara Airport As part of this Airport Master Plan, the Federal Aviation Administration (FAA) requires the development
STUDY WORK GROUP MEETING No. 3. November 29, 2016
 STUDY WORK GROUP MEETING No. 3 November 29, 2016 Agenda Welcome and introductions Update project schedule Brief overview of previous SWG meeting Update on aviation forecasts Introduction to airfield demand/capacity
OVERVIEW BASIC DESIGN FACTORS. Demand Determinants
 3 Airfield Airfield Design Design OVERVIEW The basic configuration of the runway and taxiway system at Hanford Municipal Airport has changed moderately since the airport was constructed in 1950. These
Facility Requirements
 4. This chapter presents the airside and landside facility requirements necessary to accommodate existing and forecasted demand at Erie International Airport (ERI or the Airport) in accordance with Federal
STUDY OVERVIEW MASTER PLAN GOALS AND OBJECTIVES
 INTRODUCTION An Airport Master Plan provides an evalua on of the airport s avia on demand and an overview of the systema c airport development that will best meet those demands. The Master Plan establishes
Tallahassee International Airport Master Plan. Technical Advisory Committee Meeting #2 October 19, 2016
 Tallahassee International Airport Master Plan Technical Advisory Committee Meeting #2 October 19, 2016 Agenda Welcome / Introductions Master Plan Process and Project Status Forecast of Aviation Demand
4.0 AIRFIELD CAPACITY & FACILITY REQUIREMENTS
 4.0 AIRFIELD CAPACITY & FACILITY REQUIREMENTS A key step in the Airport Master Plan (AMP) process is determining future requirements for airport facilities that will allow for airside and landside development
AIRPORT MASTER PLAN UPDATE
 AIRPORT MASTER PLAN UPDATE PENSACOLA INTERNATIONAL AIRPORT Technical Advisory Committee Meeting #2 June 20, 2017 Agenda» Introduction» Facility Requirements Airside Terminal Landside General Aviation Cargo
TABLE OF CONTENTS. General Study Objectives Public Involvement Issues to Be Resolved
 TABLE OF CONTENTS Description Page Number LIST OF ACRONYMS... a CHAPTER ONE INTRODUCTION General... 1-1 Study Objectives... 1-1 Public Involvement... 1-2 Issues to Be Resolved... 1-2 CHAPTER TWO EXISTING
AIRSIDE CAPACITY AND FACILITY REQUIREMENTS
 AIRSIDE CAPACITY AND FACILITY REQUIREMENTS This Section investigates the capacity of the airport, its ability to meet current demand, and the facilities required to meet forecasted needs as established
Prepared By: Mead & Hunt, Inc Port Lansing Road Lansing, MI 48906
 Master Plan The preparation of this document was financed in part through a planning grant from the Federal Aviation Administration (FAA) as provided under Section 505 of the Airport and Airway Improvement
6.1 INTRODUCTION 6.2 AIRSIDE ALTERNATIVES NORTH PERRY AIRPORT MASTER PLAN UPDATE RUNWAY LENGTH REQUIREMENTS SECTION 6: ALTERNATIVES ANALYSIS
 6.1 INTRODUCTION In the previous chapter, facility needs for the 20-year planning horizon were identified. The next step in the planning process is to identify and evaluate the various ways certain facilities
R FAA
 Chapter Four Section 01 - Introduction Section 02 - Criteria for Determination of Facility Requirement Recommendations Section 03 - FAA Design Standards & Non-Standard Conditions Section 04 - Airfield
TABLE OF CONTENTS. Washington Aviation System Plan Update July 2017 i
 TABLE OF CONTENTS Chapter 1 Overview... 1-1 1.1 Background... 1-1 1.2 Overview of 2015 WASP... 1-1 1.2.1 Aviation System Performance... 1-2 1.3 Prior WSDOT Aviation Planning Studies... 1-3 1.3.1 2009 Long-Term
AERONAUTICAL SURVEYS & INSTRUMENT FLIGHT PROCEDURES
 AERONAUTICAL SURVEYS & INSTRUMENT FLIGHT PROCEDURES Current as of November 2012 ALASKA AVIATION SYSTEM PLAN UPDATE Prepared for: State of Alaska Department of Transportation & Public Facilities Division
Addendum - Airport Development Alternatives (Chapter 6)
") Bowers Field Addendum - Airport Development Alternatives (Chapter 6) This addendum to the Airport Development Alternatives chapter includes the preferred airside development alternative and the preliminary
Bowers Field Addendum - Airport Development Alternatives (Chapter 6) This addendum to the Airport Development Alternatives chapter includes the preferred airside development alternative and the preliminary
3 INTRODUCTION. Chapter Three Facility Requirements. Facility Requirements PEAKING CHARACTERISTICS
 Chapter Three Facility Requirements 3 INTRODUCTION This chapter identifies the long-range airfield and terminal area facilities needed to satisfy the 20-year forecast of aviation demand at Monett Municipal
TECHNICAL REPORT #7 Palm Beach International Airport Airport Layout Plan
 TECHNICAL REPORT #7 Palm Beach International Airport Airport Layout Plan Technical Report #7 Palm Beach International Airport Layout Plan Palm Beach International Airport Prepared for Palm Beach County
Current Airport Roles
 Chapter Four: Current Airport Roles Introduction Current airport roles are defined differently from national, state, and local perspectives. The Federal Aviation Administration (FAA) has established two
Technical Advisory Committee Meeting February 29, 2016
 Technical Advisory Committee Meeting February 29, 2016 Meeting Agenda Introduction Recap of Planning Process Project Status Goals and Objectives Forecasts of Aviation Demand Overview of Facility Requirements
APPENDIX C AIRSPACE PROCEDURES
 APPENDIX C AIRSPACE PROCEDURES This appendix is designed to provide the reader with an introduction to how aircraft operate in and around Cincinnati/Northern Kentucky International Airport (CVG), the facilities
Introduction DRAFT March 9, 2017
 Chapter Overview The City of Redmond (City) initiated an update to the Airport Master Plan ( Plan ) to assess the facility and service needs of the Redmond Municipal Airport ( the Airport ) throughout
C > Capacity Analysis and Facility Requirements
 Buchanan Field Buchanan Field Airport Master Planning Program C. CAPACITY ANALYSIS & FACILITY REQUIREMENTS C > Capacity Analysis and Facility Requirements INTRODUCTION. The capacity of an airfield is primarily
Preliminary Findings of Proposed Alternative
 Preliminary Findings of Proposed Alternative The attached drawing provides a schematic layout of the proposed alternative that will be discussed on July 27, 2010. A full report will follow and should be
Chapter 4 Airport Facility Requirements
 Chapter 4 Airport Facility Requirements Introduction CHAPTER 4 AIRPORT FACILITY REQUIREMENTS MAY 2013-1 Organization of Materials CHAPTER 4 AIRPORT FACILITY REQUIREMENTS MAY 2013-2 RPZ - ROAD RPZ - NON-AIRPORT
Airport Master Plan Open House Front Range Airport February 23, 2017
 Airport Master Plan Open House Front Range Airport February 23, 2017 MASTER PLAN PROCESS AND OVERVIEW MASTER PLAN ELEMENTS The Master Plan is a 20-year plan to understand the needs of current and future
Appendix B Ultimate Airport Capacity and Delay Simulation Modeling Analysis
 Appendix B ULTIMATE AIRPORT CAPACITY & DELAY SIMULATION MODELING ANALYSIS B TABLE OF CONTENTS EXHIBITS TABLES B.1 Introduction... 1 B.2 Simulation Modeling Assumption and Methodology... 4 B.2.1 Runway
Document prepared by MnDOT Office of Aeronautics and HNTB Corporation. MINNESOTA GO STATE AVIATION SYSTEM PLAN
 LAST UPDATE JULY 2013 Acknowledgements The preparation of this document was financed in part by a grant from the Federal Aviation Administration (Project No: 3-27-0000-07-10), with the financial support
Inventory of Existing Conditions.
 A Inventory of Existing Conditions. Fort Collins-Loveland Municipal Airport, jointly owned and operated by the Cities of Fort Collins and Loveland, is located in the heart of a region with a thriving economy,
50 Ways to Improve Your Airport: Engaging Airport Management on Key Issues
 50 Ways to Improve Your Airport: Engaging Airport Management on Key Issues Tuesday, November 17, 2015 1:00 p.m. 2:00 p.m. PRESENTED BY: Charles D. Lamb, P.E. Airfield Lighting Image Source: Delta Airport
Lopez Island Airport Master Plan Update. Public Meeting June 15, 2017
 Lopez Island Airport Master Plan Update Public Meeting June 15, 2017 Master Plan Update Team Reid Middleton/Everett, WA Shannon Kinsella, Project Manager Melania Haagsma, Project Engineer Mead & Hunt/Tulsa,
MetroAir Virtual Airlines
 MetroAir Virtual Airlines NAVIGATION BASICS V 1.0 NOT FOR REAL WORLD AVIATION GETTING STARTED 2 P a g e Having a good understanding of navigation is critical when you fly online the VATSIM network. ATC
3.1 Facility Requirements Overview Airfield Facility Requirements... 1
 Table of Contents 3.1 Overview... 1 3.2 Airfield... 1 Airspace Capacity...1 Airside Capacity... 2 Aircraft Mix Index... 3 Arrivals Percentage... 4 Touch-and-Go Percentage... 4 Taxiway Access Factors...
3.1 CRITICAL AIRCRAFT
 The purpose of the demand capacity analysis is to determine an airport s capacity and its ability to support the forecasted aviation demand. Facility requirements identify development, replacement, and/or
Navigation - Runways. Chap 2, Nolan
 Navigation - Runways Chap 2, Nolan 1 Runways Runways numbered to correspond to magnetic bearing Runway 27 has magnetic bearing 270 degrees Active Runway selected for headwind greater than 5 knots When
Table of Contents. Master Plan March 2014 TOC i Spokane International Airport
 Table of Contents Page Chapter 1 Inventory 1. Introduction... 1 1 1.1 Community Profile... 1 2 1.1.1 Location and Setting... 1 1 1.1.2 Climate... 1 2 1.1.3 Socioeconomic Conditions... 1 5 1.1.4 Area Land
CHAPTER FOUR AIRPORT ALTERNATIVES
 4.0 INTRODUCTION CHAPTER FOUR The goal of the master planning process is to provide the City of New Smyrna Beach with an assessment of the adequacy and capabilities of the Airport as well as to identify
1 DRAFT. General Aviation Terminal Services Aircraft Hangars Aircraft Parking Aprons Airport Support Facilities
 To properly plan for improvements at Dallas Executive Airport, it is necessary to translate forecast aviation demand into the specific types and quantities of facilities that can adequately serve the demand.
Chapter Six ALP Drawings. Tacoma Narrows Airport. Master Plan Update
 Chapter Six ALP Drawings Master Plan Update The master planning process for the (Airport) has evolved through efforts in the previous chapters to analyze future aviation demand, establish airside and landside
CHAPTER 1 INTRODUCTION AND BACKGROUND
 CHAPTER 1 INTRODUCTION AND BACKGROUND An Environmental Assessment (EA) evaluates the effects of a proposed Federal action on the surrounding environment and is prepared in compliance with the National
MASTER PLAN CONCEPT 1 DRAFT
 The Airport Master Plan Update for Dallas Executive Airport has included the development of aviation demand forecasts, an assessment of future facility needs, and the evaluation of airport development
CHAPTER D Capacity Analysis and Facility Requirements INTRODUCTION
 CHAPTER D Capacity Analysis and Facility Requirements INTRODUCTION The capacity of an airfield is primarily a function of the major aircraft operating surfaces that compose the facility and the configuration
Acronyms. Airport Layout Plan Report Appendix A A-1
 Appendix A Acronyms AC... Advisory Circular ADG... Airplane Design Group ADO... Airport District Office AGL... Above Ground Level AIM... Aeronautical Information Manual AIP... Airport Improvement Program
Lake Tahoe Airport Master Plan Public Meeting March 16, 2015
 Lake Tahoe Airport Master Plan Public Meeting March 16, 2015 What is an Airport Master Plan? a comprehensive study of an airport [that] usually describes the short, medium, and long term development plans
4.0 FACILITY REQUIREMENTS
 4.0 FACILITY REQUIREMENTS The purpose of this chapter of Master Plan is to identify the needs for additional facilities, or improvements to existing facilities over the planning period. By comparing current
chapter 5 Recommended Master Plan Concept airport master plan MASTER PLAN CONCEPT
 chapter 5 Recommended Master Plan Concept airport master plan The planning process for Coolidge Municipal Airport has included several analytical efforts in the previous chapters intended to project potential
Chapter 4 Airport Capacity Assessment and Identification of Facility Needs
 Chapter 4 Airport Capacity Assessment and Identification of Facility Needs 4.1 Introduction The purpose of the airport capacity assessment and identification of facility needs is to evaluate the single
Runway Length Analysis Prescott Municipal Airport
 APPENDIX 2 Runway Length Analysis Prescott Municipal Airport May 11, 2009 Version 2 (draft) Table of Contents Introduction... 1-1 Section 1 Purpose & Need... 1-2 Section 2 Design Standards...1-3 Section
Chapter Seven COST ESTIMATES AND FUNDING A. GENERAL
 Chapter Seven COST ESTIMATES AND FUNDING A. GENERAL This chapter delineates the recommended 2005 2024 Sussex County Airport Capital Improvement Program (CIP). It further identifies probable construction
CHAPTER 3 AIRPORT FACILITY REQUIREMENTS
 CHAPTER 3 AIRPORT FACILITY REQUIREMENTS 3.1 Introduction The existing runway and taxiway system at Skyhaven Airport provides more than adequate operational capacity to accommodate future peak hour and
Chapter 2: Existing Facilities
 Chapter 2: Existing Facilities This chapter describes the existing conditions at the airport and provides an inventory of existing facilities and infrastructure. It provides the baseline for future requirements,
GLOSSARY A.1 ABBREVIATIONS/ACRONYMS
 Appendices Glossary A A GLOSSARY A.1 ABBREVIATIONS/ACRONYMS AC ADF ADPM AGL AIP ALP ALS ALSF-1 ARC ARFF ARP ARTCC ASDA ASO ASR ASV ATC ATCT AVGAS BLI CBP CIP - Advisory Circular - Automatic Direction
Airport Layout Plan Narrative Report
 Airport Layout Plan Narrative Report Yuba County Airport Olivehurst, California Prepared for County of Yuba Prepared by Mead & Hunt, Inc. March 23, 2017 YUBA COUNTY AIRPORT AIRPORT LAYOUT PLAN NARRATIVE
Grants Pass Airport Master Plan & Airport Layout Plan Update
 Attendees: Grants Pass Airport Master Plan & Airport Layout Plan Update Meeting #3 January 26, 2010 Merlin Community Center 100 Acorn Street, Merlin 5:45 7:15 p.m. Josephine County Department of Airports:
Chapter 5. Facility Requirements
 Chapter 5 Facility Requirements Chapter 5 Facility Requirements INTRODUCTION The Baseline Forecast was used to determine facility requirements. Chapter 4 produced a forecast of traffic volumes expected
Chippewa-Eau Claire Metropolitan Planning Area Long Range Transportation Plan
 1.2.7 2010 Eau Claire County Comprehensive Plan According to Eau Claire County s most recent comprehensive plan, the County will limit land use development adjacent to EAU in order to preserve the ability
15 Precision Approach Path Indicator 33 None RSA 150 feet wide by 300 feet long 150 feet wide by 300 feet long
 The first (AMP) was completed in 1984 and updated in 2000. The current FAA approved Airport Layout Plan (ALP) is dated November 9, 2001. The FAA suggests updating the AMP every five year in accordance
Chapter 3 FACILITY REQUIREMENTS
 Chapter 3 FACILITY REQUIREMENTS Chapter Three Facility Requirements To properly plan for the future of Ryan Airfield, it is necessary to translate forecast aviation demand into the specific types and quantities
FACILITY REQUIREMENTS 5.1 Introduction
 Chapter 5 FACILITY REQUIREMENTS 5.1 Introduction The facility requirements section of this study defines the physical facilities needed to safely and efficiently accommodate the current and future aviation
Lake Tahoe Airport Master Plan
 Lake Tahoe Airport Master Plan City Council Briefing October 20, 2015 What is an Airport Master Plan? a comprehensive study of an airport [that] usually describes the short, medium, and long term development
AIRFIELD CAPACITY AND FACILITY REQUIREMENTS
 CHAPTER FOUR: AIRFIELD CAPACITY AND FACILITY REQUIREMENTS 4.1 INTRODUCTION A key step in the Airport Master Plan Update (AMPU) process is determining future requirements for airport facilities that will
AIRPORT MASTER PLAN. Newport State Airport. Draft. (Colonel Robert F. Wood Airpark) THE Louis Berger Group, INC. Prepared for: Prepared by:
 THE Louis Berger Group, INC. Prepared for: Prepared by:") Draft AIRPORT MASTER PLAN Newport State Airport () Prepared for: 2000 Post Road Warwick, Rhode Island 02886-1533 THE Louis Berger Group, INC. 20 Corporate Woods Boulevard Albany, New York 12211-2370 Prepared
Draft AIRPORT MASTER PLAN Newport State Airport () Prepared for: 2000 Post Road Warwick, Rhode Island 02886-1533 THE Louis Berger Group, INC. 20 Corporate Woods Boulevard Albany, New York 12211-2370 Prepared
Chapter 5 Facility Requirements
 Chapter 5 Facility Requirements 50 INTRODUCTION This chapter describes the airside and landside facility requirements necessary to accommodate existing and forecasted demand in accordance with Federal
Dallas Executive Airport Town Hall Meeting April 3, 2014
 Dallas Executive Airport Town Hall Meeting April 3, 2014 Background 1,040 acre general aviation facility owned and operated by the City of Dallas 150 based aircraft including business jets and helicopters,
Airport Master Plan. Hutchinson Municipal Airport Butler Field (HCD) Hutchinson, Minnesota. July 2015
 Hutchinson, Minnesota. July 2015") Airport Master Plan Hutchinson Municipal Airport Butler Field HCD) Hutchinson, Minnesota July 2015 Submitted by: Bolton & Menk, Inc. 12224 Nicollet Avenue Burnsville, MN 55337 P: 952-890-0509 Airport Sponsor:
Airport Master Plan Hutchinson Municipal Airport Butler Field HCD) Hutchinson, Minnesota July 2015 Submitted by: Bolton & Menk, Inc. 12224 Nicollet Avenue Burnsville, MN 55337 P: 952-890-0509 Airport Sponsor:
CHAPTER 3 FACILITY REQUIREMENTS
 CHAPTER 3 FACILITY REQUIREMENTS 3.1 INTRODUCTION To properly plan for the future requirements of Newport News/Williamsburg International Airport, it is necessary to translate the forecasts of aviation
Appendix D Project Newsletters. Tacoma Narrows Airport. Master Plan Update
 Appendix D Project Newsletters Tacoma Narrows Airport Master Plan Update This appendix contains the newsletters distributed throughout the project. These newsletters provided updates and information on
Airport Master Plan 1
 1 Aviation Demand AIRPORT PLANNING PROCESS FAA Design Standards Financial Resources Community Goals Environmental Requirements Serve Business Community This Advisory Circular (AC) provides guidance for
JOSLIN FIELD, MAGIC VALLEY REGIONAL AIRPORT DECEMBER 2012
 1. Introduction The Federal Aviation Administration (FAA) recommends that airport master plans be updated every 5 years or as necessary to keep them current. The Master Plan for Joslin Field, Magic Valley
Draft Concept Alternatives Analysis for the Inaugural Airport Program September 2005
 Section 10 Preferred Inaugural Airport Concept 10.0 Introduction The Preferred Inaugural Airport Concept for SSA was developed by adding the preferred support/ancillary facilities selected in Section 9
Chapter 4 Airport Facility Requirements. Introduction
 Chapter 4 Airport Facility Requirements Introduction The airport facility requirements analysis combines the results of the inventory and forecasts contained in Chapters Two and Three, and the applicable
AIRPORT FACILITY REQUIREMENTS
 4.1 INTRODUCTION Chapter 4 AIRPORT FACILITY REQUIREMENTS The major elements of the Airport, which were described in Chapter 3, Existing Airport Facilities must be analyzed individually and balanced in
TECHNICAL ADVISORY COMMITTEE MEETING 3 SEPTEMBER 10, Airport Master Plan
 TECHNICAL ADVISORY COMMITTEE MEETING 3 SEPTEMBER 10, 2018 Airport Master Plan WELCOME & INTRODUCTIONS Kimberly Moss, Doug Hammon (The Ohio State University) 2 Member Introduction Name Organization 3 MEETING
Chapter 8.0 Implementation Plan
 Chapter 8.0 Implementation Plan 8.1 Introduction This chapter is the culmination of the analytical work accomplished in the previous chapters. The result is a prioritized list of the essential projects.
Chapter The All-new, World-class Denver International Airport Identify Describe Know Describe Describe
 Chapter 10 The aerospace subject is very large and diverse. As seen in previous chapters, there are many subject areas. So far you have learned about history, weather, space and aerodynamics. Now you will