City and County of San Francisco
|
|
|
- Derick Francis Lloyd
- 6 years ago
- Views:
Transcription
1 City and County of San Francisco Office of the Controller City Services Auditor PARKS, STREETS, AND SIDEWALK MAINTENANCE ANNUAL REPORT Citywide Parks Rating Improves But Too Many Parks Still Score Low; Street and Sidewalk Standards Expanded in FY October 25, 2007
2 CONTROLLER S OFFICE CITY SERVICES AUDITOR The City Services Auditor was created within the Controller s Office through an amendment to the City Charter that was approved by voters in November Under Appendix F to the City Charter, the City Services Auditor has broad authority for: Reporting on the level and effectiveness of San Francisco s public services and benchmarking the city to other public agencies and jurisdictions. Conducting financial and performance audits of city departments, contractors, and functions to assess efficiency and effectiveness of processes and services. Operating a whistleblower hotline and website and investigating reports of waste, fraud, and abuse of city resources. Ensuring the financial integrity and improving the overall performance and efficiency of city government. The audits unit conducts financial audits, attestation engagements, and performance audits. Financial audits address the financial integrity of both city departments and contractors and provide reasonable assurance about whether financial statements are presented fairly in all material aspects in conformity with generally accepted accounting principles. Attestation engagements examine, review, or perform procedures on a broad range of subjects such as internal controls; compliance with requirements of specified laws, regulations, rules, contracts, or grants; and the reliability of performance measures. Performance audits focus primarily on assessment of city services and processes, providing recommendations to improve department operations. We conduct our audits in accordance with the Government Auditing Standards published by the U.S. Government Accountability Office (GAO). These standards require: Independence of audit staff and the audit organization. Objectivity of the auditors performing the work. Competent staff, including continuing professional education. Quality control procedures to provide reasonable assurance of compliance with the auditing standards. Project Team for Streets, Sidewalks, and Parks Maintenance Standards: Peg Stevenson, Director, City Services Auditor (CSA) Division Michael Wylie, Project Manager Claire Kramme, Performance Analyst Corey Marshall, Performance Analyst CSA Performance Analysts and Auditors
3 City and County of San Francisco Office of the Controller City Services Auditor Citywide Parks Rating Improves But Too Many Parks Still Score Low; Street and Sidewalk Standards Expanded in FY October 25, 2007 Purpose of the Report The City Services Auditor Charter Amendment requires that standards be established for parks, streets and sidewalk maintenance, and that the City Services Auditor (CSA) issue an annual report on performance under the standards. This report provides the results from inspections in FY , discusses other relevant efforts to parks and streets maintenance, and includes recommendations to improve the City s performance in this area. Highlights For the third year, the City is reporting on performance for parks and streets as measured against established standards. City parks performed somewhat better in this year s ratings. The citywide compliance rate reached 82 percent in FY , up 2 percent from last year. However, some districts in the City still have many parks with poor ratings, and many parks fluctuate in quality due to erratic maintenance. Streets maintenance standards were expanded this year. The City now has specific standards for sidewalk cleanliness, including trees and landscaping, in addition to existing standards for street cleaning, graffiti and trash receptacles. The Recreation and Park Department (Rec & Park) conducted two full rounds of inspections, reinforced training of evaluators to improve consistency and quality and developed internal protocols to check on staff schedule compliance. Street cleaning inspections showed most routes passing, with 33 out of 44 inspections meeting the standard. Average inspection scores did not meet the standard in districts 3, 9 and 11. Some areas consistently meet the standards. Graffiti prevention and removal remain a persistent problem for the City, especially non-department of Public Works (DPW) public property and private property. Average graffiti rates vary between routes, but no corridors passed all standards. Rec & Park has taken steps to implement previous recommendations. Accessibility of inspection information has improved, due to simpler report formats and posting of results within 30 days of evaluation. However, weaknesses remain, such as the lack of standardized follow-up on non-compliance and the absence of updated staff schedules. Recommendations The report includes four to five recommendations each to Rec & Park and DPW. These include: Use park inspection results to manage operations and redeploy staff. Streamline and reinforce the compliance program for park staffing schedules. Use the inspections and public opinion tools (surveys) to prioritize park capital investments. Create a weighted parks evaluation method to better reflect different parks and features. Reallocate DPW resources to high-need streets, away from routes that score well before and after street sweepings. Obtain in-depth information on perceptions of street cleanliness. Copies of the full report may be obtained at: Controller s Office City Hall, Room Dr. Carlton B. Goodlett Place San Francisco, CA or on the Internet at
4 Page intentionally left blank.
5 CITY AND COUNTY OF SAN FRANCISCO OFFICE OF THE CONTROLLER Ed Harrington Controller Monique Zmuda Deputy Controller October 25, 2007 Honorable Mayor Gavin Newsom Members of the Board of Supervisors 1 Dr. Carlton B. Goodlett Place City Hall, Room 200 and Room 256 San Francisco, CA Dear Mayor Newsom and Members of the Board of Supervisors: The City Services Auditor Charter Amendment (Charter Appendix F) requires that standards be established for parks, streets and sidewalk maintenance, and that the City Services Auditor (CSA) issue an annual report on the City s performance under the standards. This report provides the results and analysis from our park and street inspections in fiscal year , discusses other efforts to upgrade parks and streets maintenance and provides recommendations to improve the City s performance. In summary, we found that City parks performed somewhat better in this year s ratings. The citywide compliance rate, which indicates that an array of park features met basic standards for cleanliness, functionality, and maintenance, reached eighty-two percent (82%), up two percent from last year. But too many parks still score low, and many parks fluctuate widely due to erratic maintenance and staffing gaps. The report recommends the use of park inspection results to manage operations and allocate staff to areas of greatest need. Our street maintenance standards were expanded this year, adding sidewalk cleanliness and street trees to the existing standards for mechanical street sweeping, graffiti and trash collection and receptacles. Graffiti prevention and removal remain a persistent problem for the City. The report recommends the re-allocation of street cleaning resources to high-need areas. We thank the Recreation and Park Department and the Department of Public Works staff and managers for their work on implementing the standards and recommendations for improvement. San Francisco s citizens, leadership and staff all have a shared interest in improving the City s work in this area and we invite your ideas and comments. If you have any questions or comments on this report, please contact Peg Stevenson of my staff at (415) cc: Civil Grand Jury Budget Analyst Public Library City Hall 1 Dr. Carlton B. Goodlett Place Room 316 San Francisco CA FAX
6 Page intentionally left blank.
7 TABLE OF CONTENTS Introduction... 1 Chapter 1 Parks Standards Inspections Results Results Citywide... 7 Results by District Results by Park Feature Results by Individual Park Park Staff Schedules Staffing Levels and Inspection Results Recommendations Chapter 2 Streets and Sidewalks Maintenance New Standards CSA Inspection Results Community Corridor Partnership Mechanical Sweeping Study Recommendations Appendices Parks Appendix A: Park Inspection Ratings by Park... A-1 Appendix B: Park Inspection Ratings by Feature... B-1 Appendix C: Results of Staffing Analysis by Rec & Park... C-1 Appendix D: Volunteer Hours by Park in FY D-1 Appendix E: Rec & Park Department Response... E-1 Appendices Streets and Sidewalks Appendix F: CSA Street Inspections Citywide Results...F-1 Appendix G: CSA Street Inspections Results by District... G-1 Appendix H: Location of Community Partnership Corridors... H-1 Appendix I: DPW Department Response...I-1
8 LIST OF ACRONYMS CSA City Services Auditor DPW Department of Public Works FTE Full-Time Equivalent MNC Mission Neighborhood Centers NSA Neighborhood Services Area PROP C Proposition C (City Charter Amendment, Passed November 2003) REC & PARK Recreation and Parks Department
9 INTRODUCTION City Charter Requirements The City Services Auditor (CSA) Charter amendment passed in November 2003 (Proposition C) requires that: Quantifiable, measurable, objective standards for park and street maintenance must be developed in cooperation and consultation between the Controller s Office and the Recreation and Park Department (Rec & Park) and the Department of Public Works (DPW). Regular maintenance schedules for park and street maintenance must be established, implemented, and made available to the public. Staff schedule compliance reports must be posted on the departments websites. The Controller s Office must issue an annual report on the City s performance to the standards, with geographic detail. Background Parks A focused park survey was initiated in 2007 to collect 1300 park users experience in City parks In addition to the Proposition C mandate, the Controller s Office has been engaged in various projects related to city parks. The biannual City Survey conducted by the Controller s Office since 1998 has proven to be a useful tool to measure satisfaction of citizens with city parks. The 2007 results can be viewed at: This year, CSA also initiated a more focused survey effort to collect park users input and comments about their direct experiences in City parks. A detailed survey questionnaire was developed in partnership with the Rec & Park and the Public Research Institute. The survey was administered in selected parks in May 2007 by trained interviewers. Over 1,300 surveys were completed in 29 parks spread throughout the City. Results of this new park survey will be available on the Controller s website in the fall of These initiatives share the same overarching objectives: 1. Provide the community with an independent assessment of park conditions. 2. Help increase the City s decision makers knowledge of public opinion and expectations regarding neighborhood parks. 3. Reinforce accountability. Controller s Office 1
10 4. Help Rec & Park to better allocate resources towards parks with the highest needs. Scope and Methodology Parks Park maintenance standards were originally developed during FY by Rec & Park and CSA. The standards cover 14 broad features, ranging from lawns to restrooms. See Exhibit 1 for a summary. Each element of the standards has a pass/fail standard, in some cases using a threshold. For example, the cleanliness standard is met for restrooms if no more than three pieces of litter or debris are visible on the floor, wall or ceiling of the facility. Inspections FY The Controller s Office selected 18 low-performing parks and increased inspection frequency Using these standards, the Rec & Park staff evaluated all City parks twice and CSA staff evaluated all parks once in FY In addition to the annual citywide evaluation of parks, CSA selected a limited number of low-performing parks (18) and increased their frequency of inspection to once every two months. Each time, results were shared with Rec & Park within three weeks of inspection, in order for department management to have an opportunity to respond to findings before the next inspection. Individual reports on these 18 parks are available on the Controller s Office website at: The park maintenance standards manual, features, elements, and the rating methods are available at: This report uses two methods to report on park conditions, including converting percentages into letter grades For the FY results, two methods will be used in this report to show park conditions and to evaluate the extent to which standards were met in a given park. The first method consists of averaging the percentages of standards met for each element present in a park. Elements that are not applicable are not included in the calculation. The citywide average is calculated by dividing the sum of all standards met ( yes answers) by the total of all standards met and not met citywide ( yes and no answers). It is not an average of district averages. A district average is calculated by dividing the sum of individual park ratings in a particular district by the number of parks evaluated in that district. 2 Controller s Office
11 EXHIBIT 1 Park Maintenance Standards - Summary Park feature Elements examined under each park feature A. Landscaped and Hardscaped Areas 1. Lawns Cleanliness Color Density and spots Drainage/ flooded area 2. Ornamental Gardens, Shrubs, Cleanliness and Ground Covers Plant health 3. Trees Limbs Plant health 4. Hardscapes and Trails Cleanliness Drainage/flooded area Graffiti 5. Open Space Cleanliness B. Recreational Areas 6. Turf Athletic Fields (e.g., ball fields, soccer pitches) 7. Outdoor Athletic Courts (e.g., tennis and basketball courts) Cleanliness Color Drainage/flooded area Fencing Cleanliness Drainage/ flooded area Fencing Functionality of structures 8. Children s Play Areas Cleanliness Fencing Functionality of equipment Graffiti 9. Dog Play Areas Bag dispenser Cleanliness Drainage/ flooded area Height/ mowed C. Amenities and Structures 10. Restrooms Cleanliness Graffiti Functionality of structures Lighting Odor 11. Parking Lots and Roads ADA parking spaces Cleanliness Curbs 12. Waste and Recycling Receptacles Drainage/ flooded areas Cleanliness of receptacles Fullness Painting 13. Benches, Tables, and Grills Cleanliness Graffiti Painting 14. Amenities & Structures Exterior of buildings Drinking fountains Fencing Gates / locks Source: Park Maintenance Standards developed by CSA and Rec & Park, Edged Height/mowed Holes Pruned Weediness Vines Surface quality Weediness Functionality of structures Graffiti Height/ mowed Holes Graffiti Painting/striping Surface quality Integrity of equipment Painting Signage Surface quality Signage Surface quality Waste Receptacles Painting Signage Supply inventory Waste receptacles Graffiti Painting/ striping Signage Surface quality Structural integrity and functionality Structural integrity and functionality Retaining walls Signage Stairways Controller s Office 3
12 CSA is introducing a second method this year to facilitate comparison over years and between parks. Percentages were converted into grades as follows: A = 90 to 100 percent B = 80 to 89 percent C = 70 to 79 percent D = 60 to 69 percent F = Below 60 percent Background Streets Scope and Methodology Streets New Standards The standards were expanded this year to include sidewalks and trees In FY , DPW and CSA inspected streets in the City for three issues: (1) street cleanliness/litter; (2) graffiti on public and private property; and (3) cleanliness of City trash receptacles. In FY , new standards were added for sidewalk cleanliness and for trees/landscaping on City sidewalks. See Exhibit 2 for a summary with the expanded standards. Notably, the new standards represent expansion into features that are primarily the responsibility of private property owners. Private property owners are responsible for maintaining the cleanliness of any adjacent sidewalks to their property, including most trees and planters. DPW is responsible for enforcement of the cleanliness codes citywide. A full copy of the updated standards manual used by DPW and the Controller s is available at: Testing of proposed standards took place between October 2006 and February CSA started utilizing the finalized standards in March 2007 and did joint training in March 2007 with DPW. DPW s contractor for inspections, Mission Neighborhood Centers (MNC), started using the finalized standards in April CSA and DPW Inspections FY CSA inspections in the latter half of FY totaled 44 inspections, half of which were sampled from commercial corridors and half of which were strictly residential streets. Five sample blocks were evaluated during each inspection. CSA utilizes its own staff of analysts, auditors, and managers to conduct the evaluations. 4 Controller s Office
13 CSA covered different routes during spring 2007 in order to expand the sampling of city streets CSA deliberately covered different routes than DPW s new Community Corridors Partnership Program in the latter half of 2007 in order to expand the sampling of city streets. Because CSA inspections did not include the program s routes, which are picked for their high concentration of commercial activity, some of the most challenging commercial areas were not included in CSA inspections. EXHIBIT 2 Feature 1 Street Cleanliness 2 Sidewalk Cleanliness Streets and Sidewalks Maintenance Standards - Summary Standard Streets shall be free of litter and will be rated on a scale of 1.0 to = Acceptably clean, less than 5 pieces of litter per 100 curb feet examined 2.0 = Not acceptably clean, 5-15 pieces of litter per 100 curb feet examined 3.0 = Very dirty, over 15 pieces of litter per 100 curb feet examined An average rating under 2.0 must be attained to meet the standard for the route. Sidewalk shall be free of litter and will be rated on a scale of 1.0 to 3.0 (same scale as above) 90% of sidewalk shall be free of grime, leaks and spills 100% of sidewalk shall be free of graffiti 100% of sidewalk shall be free of illegal dumping 100% of sidewalk shall be free of feces, needles, glass, or condoms 3 Graffiti 100% of the street surface, public and private structures, buildings and sidewalks must be free of graffiti. The following categories will also be rated separately: DPW public property (street surfaces, City trash receptacles) Non-DPW public property (street signs, meters, mailboxes, etc.) Private property 4 Trash Receptacles 5 Trees and Landscaping Trash receptacle is clean and not overflowing The area around the receptacle must be free of litter (less than 5 pieces) The structure must have a uniform coat of paint The structure must be free of large cracks or damage that affect its use The door must be closed 90% of trees, tree wells and planters shall be free of litter 90% of trees are free of damage or hanging limbs; no tree is dead 90% of tree wells and planters are free of weeds and vines 90% of trees are maintained providing clearance to sidewalk and street Under the new Community Corridors Partnership started in October 2006, DPW is gathering data and conducting inspections. In March, DPW s contractor MNC tested the Controller s Office 5
14 draft (but not yet finalized) standards. Because of the high interest in the Community Partnership Corridor Program, some data from DPW s testing period is included in this report. CSA s Inspection Plans CSA inspections will be held at the midpoint of street cleanings, to better capture the public s perception during weekday daytime hours DPW Inspection Plans The Controller is prioritizing geographic coverage of the city; DPW is alternating between the Community Partnership program s routes and citywide routes As in the latter half of FY , inspections will be held at the mid-point of a route s mechanical sweeping. For example, a Monday/Wednesday/Friday route would be inspected on Tuesday or Thursday; a weekly route such as Tuesday morning-only would be inspected on a Friday. All inspections will occur between 8:00 a.m. and 5:00 p.m. to better capture the average citizen s perception during weekday daytime hours. DPW has contracted with the nonprofit community agency MNC to conduct Proposition C on its behalf. MNC began conducting preliminary inspections and testing of new standards from January to March In April, MNC began using the jointly-agreed-upon, expanded standards and collection tools. DPW s objective is to conduct inspections monthly, utilizing MNC to alternately inspect Clean Corridor routes one month and then other citywide routes the next month. Note that in FY , DPW wanted the Community Partnership route inspections to occur immediately before and after the block sweeper s schedule, as a means to evaluate the effectiveness of that program. CSA nevertheless recommends the mid-point timing it is employing. 6 Controller s Office
15 CHAPTER 1 PARK STANDARDS INSPECTIONS RESULTS Results Citywide Citywide level of compliance with standards is higher in FY : 86 percent as evaluated by Rec & Park (versus 82 percent in FY ) 82 percent as evaluated by CSA (versus 80 percent in FY ) EXHIBIT 3 Citywide Compliance With Parks Standards Ratings Are Higher Than in FY Score 98% 94% 90% Rec & Park CSA 86% 82% 78% 74% 70% FY05-06 FY06-07 Source: CSA and Rec & Park data, park inspections results FY and FY EXHIBIT 4 Compliance with Parks Standards - Controller s Office Ratings by Park in FY and FY Park Name District CON FY CON FY Percent Change From Prior Year 10TH AVE/CLEMENT MINI PARK 01 79% 56% -23% 24TH/YORK MINI PARK 09 76% 96% 20% 29TH/DIAMOND OPEN SPACE 08 0% 0% 0% ADAM ROGERS PARK 10 67% 74% 7% ALAMO SQUARE 05 95% 86% -9% ALICE CHALMERS PLAYGROUND 11 88% 83% -5% ALICE MARBLE TENNIS COURTS % 100% 0% Controller s Office 7
16 Park Name District CON FY CON FY Percent Change From Prior Year ALIOTO MINI PARK 09 98% 83% -15% ALLYNE PARK 02 79% 64% -15% ALTA PLAZA 02 89% 78% -11% ANGELO J. ROSSI PLAYGROUND 01 85% Closed N/A APTOS PLAYGROUND 07 Closed 100% N/A ARGONNE PLAYGROUND 01 76% Closed N/A BALBOA PARK 07 81% 72% -9% BAY VIEW PLAYGROUND 10 74% 80% 6% BEIDEMAN/O'FARRELL MINI PARK 05 65% 88% 23% BERNAL HEIGHTS RECREATION CENTER 09 89% 59% -30% BROADWAY TUNNEL EAST MINI PARK 03 40% 36% -4% BROADWAY TUNNEL WEST MINI PARK 03 63% 78% 15% BROOKS PARK 11 88% 98% 10% BROTHERHOOD/CHESTER MINI PARK 07 55% 95% 40% BUCHANAN STREET MALL 05 78% 67% -11% BUENA VISTA PARK 08 95% 38% -57% BUSH/BRODERICK MINI PARK 05 84% 85% 1% CABRILLO PLAYGROUND 01 88% 85% -3% CARL LARSEN PARK 04 60% 72% 12% CAYUGA PLAYGROUND 11 64% 64% 0% CAYUGA/LAMARTINE MINI PARK 11 50% 46% -4% CHESTNUT/KEARNY OPEN SPACE 03 60% N/A N/A CHINESE PLAYGROUND 03 78% N/A N/A CHINESE RECREATION CENTER 03 87% 86% -1% COLERIDGE MINI PARK 09 73% 74% 1% COLLIS P. HUNTINGTON PARK 03 97% 98% 1% CORONA HEIGHTS 08 68% 93% 25% COSO/PRECITA MINI PARK 09 75% N/A N/A COTTAGE ROW MINI PARK 05 85% 100% 15% COW HOLLOW PLAYGROUND 02 84% 100% 16% CROCKER AMAZON PLAYGROUND 11 73% 74% 1% DIAMOND/FARNUM OPEN SPACE % 100% 0% DOUGLASS PLAYGROUND 08 53% 66% 13% DUBOCE PARK 08 90% 78% -12% DUPONT COURTS 01 82% 82% 0% ESPRIT PARK 10 N/A 97% N/A EUREKA VALLEY PLAYGROUND 08 Closed 87% N/A EVERSON/DIGBY LOTS % 50% -50% EXCELSIOR PLAYGROUND 11 87% 80% -7% FATHER ALFRED E. BOEDDEKER PARK 06 72% 84% 12% FAY PARK 03 NA 97% N/A FERRY PARK 03 92% 100% 8% FILLMORE/TURK MINI PARK 05 55% 86% 31% FRANKLIN SQUARE 06 66% 71% 5% 8 Controller s Office
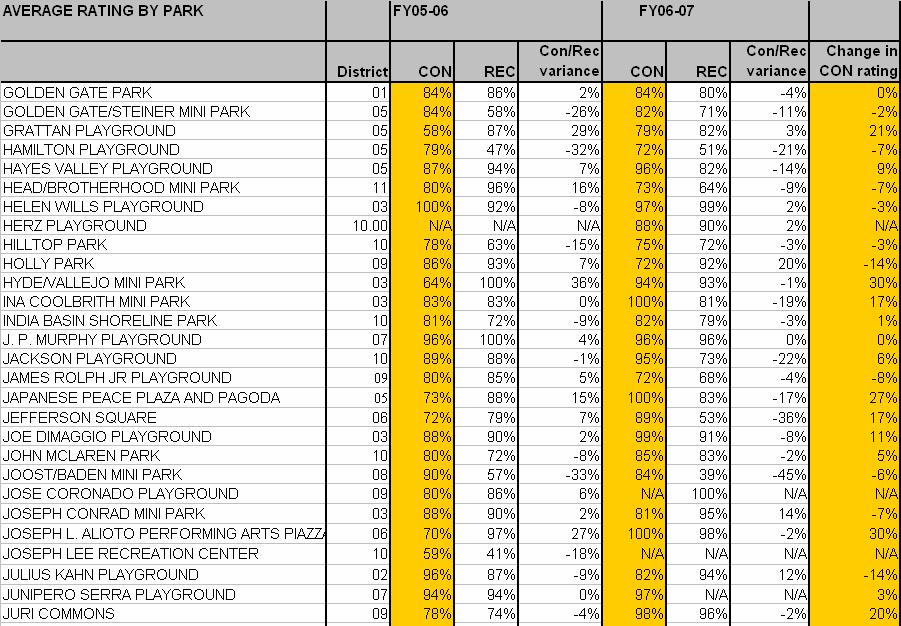
17 Park Name District CON FY CON FY Percent Change From Prior Year FULTON PLAYGROUND 01 95% 91% -4% GARFIELD SQUARE 09 61% 79% 18% GENEVA AVENUE STRIP 11 27% N/A N/A GEORGE CHRISTOPHER PLAYGROUND 08 86% 89% 3% GILMAN PLAYGROUND 10 80% 66% -14% GLEN PARK 08 77% 91% 14% GOLDEN GATE HEIGHTS PARK 07 87% 78% -9% GOLDEN GATE PARK 01 84% 84% 0% GOLDEN GATE/STEINER MINI PARK 05 84% 82% -2% GRATTAN PLAYGROUND 05 58% 79% 21% HAMILTON PLAYGROUND 05 79% 72% -7% HAYES VALLEY PLAYGROUND 05 87% 96% 9% HEAD/BROTHERHOOD MINI PARK 11 80% 73% -7% HELEN WILLS PLAYGROUND % 97% -3% HERZ PLAYGROUND 10 N/A 88% N/A HILLTOP PARK 10 78% 75% -3% HOLLY PARK 09 86% 72% -14% HYDE/VALLEJO MINI PARK 03 64% 94% 30% INA COOLBRITH MINI PARK 03 83% 100% 17% INDIA BASIN SHORELINE PARK 10 81% 82% 1% J. P. MURPHY PLAYGROUND 07 96% 96% 0% JACKSON PLAYGROUND 10 89% 95% 6% JAMES ROLPH JR PLAYGROUND 09 80% 72% -8% JAPANESE PEACE PLAZA AND PAGODA 05 73% 100% 27% JEFFERSON SQUARE 06 72% 89% 17% JOE DIMAGGIO PLAYGROUND 03 88% 99% 11% JOHN MCLAREN PARK 10 80% 85% 5% JOOST/BADEN MINI PARK 08 90% 84% -6% JOSE CORONADO PLAYGROUND 09 80% 85% 5% JOSEPH CONRAD MINI PARK 03 88% 81% -7% JOSEPH L. ALIOTO PERFORMING ARTS PIAZZA 06 70% 100% 30% JOSEPH LEE RECREATION CENTER 10 59% Closed N/A JULIUS KAHN PLAYGROUND 02 96% 82% -14% JUNIPERO SERRA PLAYGROUND 07 94% 97% 3% JURI COMMONS 09 78% 98% 20% JUSTIN HERMAN/EMBARCADERO PLAZA 03 73% 93% 20% KELLOCH VELASCO MINI PARK 10 82% 68% -14% KID POWER PARK 06 98% 98% 0% KOSHLAND PARK 05 88% 80% -8% LAFAYETTE PARK 02 74% 83% 9% LAKE MERCED PARK 07 85% 98% 13% LAUREL HILL PLAYGROUND 02 92% 87% -5% LESSING/SEARS MINI PARK 11 81% 87% 6% LINCOLN PARK 01 77% 66% -11% Controller s Office 9
18 Park Name District CON FY CON FY Percent Change From Prior Year LITTLE HOLLYWOOD PARK 10 94% 76% -18% LOUIS SUTTER PLAYGROUND 10 N/A 89% N/A LOWER GREAT HIGHWAY 04 NA 83% N/A MARGARET S HAYWARD PLAYGROUND 06 72% 89% 17% MCCOPPIN SQUARE 04 78% 85% 7% MCKINLEY SQUARE 10 53% 91% 38% MERCED HEIGHTS PLAYGROUND 11 67% 92% 25% MICHELANGELO PLAYGROUND 03 95% 89% -6% MIDTOWN TERRACE PLAYGROUND 07 91% 89% -2% MIRALOMA PLAYGROUND 07 69% 94% 25% MISSION DOLORES PARK 08 78% 72% -6% MISSION PLAYGROUND 08 78% 94% 16% MISSION RECREATION CENTER 09 93% 92% -1% MOSCONE RECREATION CENTER 02 89% 89% 0% MOUNTAIN LAKE PARK 02 75% 86% 11% MT OLYMPUS % 72% -28% MULLEN/PERALTA MINI PARK % 100% 0% MURIEL LEFF MINI PARK 01 90% 87% -3% NOE VALLEY COURTS 08 86% 75% -11% OCEAN VIEW PLAYGROUND 11 36% 71% 35% PAGE/LAGUNA MINI PARK 05 80% 80% 0% PALACE OF FINE ARTS 02 67% 91% 24% PALEGA RECREATION CENTER 09 84% 76% -8% PALOU/PHELPS PARK 10 94% 90% -4% PARK PRESIDIO BLVD 01 N/A 65% N/A PARKSIDE SQUARE 04 68% 83% 15% PARQUE NINOS UNIDOS 09 84% 95% 11% PATRICIAS GREEN IN HAYES VALLEY 06 93% 91% -2% PEIXOTTO PLAYGROUND 08 98% 88% -10% PINE LAKE PARK 04 54% 72% 18% PORTSMOUTH SQUARE 03 70% 63% -7% POTRERO DEL SOL PARK 10 68% 63% -5% POTRERO HILL RECREATION CENTER 10 71% 80% 9% PRECITA PARK 09 88% 82% -6% PRENTISS MINI PARK 09 81% 95% 14% PRESIDIO HEIGHTS PLAYGROUND 02 93% 96% 3% RANDOLPH/BRIGHT MINI PARK 11 63% 79% 16% RAYMOND KIMBELL PLAYGROUND 05 75% 75% 0% RICHMOND PLAYGROUND 01 91% 86% -5% RICHMOND RECREATION CENTER 01 98% 100% 2% RIDGETOP PLAZA 10 89% 83% -6% ROCHAMBEAU PLAYGROUND 01 88% 97% 9% ROLPH NICOL PLAYGROUND 07 52% 86% 34% SATURN STREET STEPS 08 79% 36% -43% 10 Controller s Office
19 Park Name District CON FY CON FY Percent Change From Prior Year SELBY/PALOU MINI PARK 10 75% 81% 6% SEWARD MINI PARK 08 42% 89% 47% SGT. JOHN MACAULAY PARK 06 79% 73% -6% SIGMUND STERN RECREATION GROVE 04 80% 80% 0% SILVER TERRACE PLAYGROUND 10 85% 91% 6% SOUTH OF MARKET RECREATION CENTER 06 80% 79% -1% SOUTH PARK 06 83% 70% -13% SOUTH SUNSET PLAYGROUND 04 70% 80% 10% ST. MARY'S PLAYGROUND 09 89% 92% 3% ST. MARY'S SQUARE 03 85% 85% 0% STATES STREET PLAYGROUND 08 61% 92% 31% SUNNYSIDE CONSERVATORY 08 37% 63% 26% SUNNYSIDE PLAYGROUND 07 74% 69% -5% SUNSET PLAYGROUND 04 79% 73% -6% TELEGRAPH HILL/PIONEER PARK 03 82% 89% 7% TENDERLOIN RECREATION CENTER 06 94% 93% -1% TOPAZ OPEN SPACE % 100% 0% TURK/HYDE MINI PARK 06 78% 73% -5% UNION SQUARE 03 92% 100% 8% UPPER NOE RECREATION CENTER 08 85% Closed N/A UTAH/18TH MINI PARK % 88% -12% VICTORIA MANALO DRAVES PARK 06 N/A N/A N/A VISITACION VALLEY COMMUNITY CENTER 10 81% 85% 4% VISITACION VALLEY GREENWAY 10 98% 80% -18% VISITACION VALLEY PLAYGROUND 10 86% 82% -4% WALTER HAAS PLAYGROUND 08 97% 95% -2% WASHINGTON SQUARE 03 84% 83% -1% WASHINGTON/HYDE MINI PARK 03 93% 100% 7% WEST PORTAL PLAYGROUND 07 70% 88% 18% WEST SUNSET PLAYGROUND 04 76% 68% -8% WILLIE WOO WOO WONG PLAYGROUND 03 NA 99% N/A WOH HEI YUEN PARK 03 75% 100% 25% YACHT HARBOR AND MARINA GREEN 02 80% 92% 12% YOUNGBLOOD COLEMAN PLAYGROUND 10 66% 87% 21% Source: CSA and Rec & Park data, park inspections results FY and FY Not only are the citywide averages higher in FY , but more individual parks received favorable grades ( A and B ) than in the previous year As described in the methodology section, we converted percentages to letter grades for the first time this year since the inspection program was launched. Letter grades tend to facilitate comparison over time and provide a more userfriendly picture of park conditions. Grades have been used by other jurisdictions such as New York City to report on park conditions, and to highlight major variances by Controller s Office 11
20 geographic area or by individual parks. As shown in the table below, the total number of favorable grades ( A and B ) has increased by 24 percent between the two fiscal years. The number of F grades dropped by almost fifty percent (47%). EXHIBIT 5 Compliance With Parks Standards - Controller s Office Grade Distribution in FY and FY Fiscal Year A B C D F Total Source: CSA and Rec & Park data, park inspections results FY and FY This overall improvement of parks conditions could be the result of various possible factors: The hiring of fourteen additional gardeners between December 2005 and January The reorganization of Neighborhood Services at Rec & Park, which seeks to increase decentralization and autonomy to manage resources within each of the nine supervision areas. A better knowledge of the standards manual and of the inspection process by both teams of evaluators. Results by District Controller s Office evaluators gave lower ratings than Rec & Park, but the difference is smaller than previous years As in FY , CSA evaluators tended to give lower ratings to City parks than Rec & Park evaluators. However, the difference between the two sets of ratings is less significant than in previous years, particularly when observed at a district or individual park level. 12 Controller s Office

21 EXHIBIT 6 District Rating Comparison Rec & Park and CSA in FY CSA tends to give lower ratings at a district level 95% 90% 85% 80% 75% 70% 65% Rec & Park CSA 60% District 1 District 2 District 3 District 4 District 5 District 6 District 7 District 8 District 9 District 10 District 11 Source: CSA and Rec & Park data, park inspections results FY and FY EXHIBIT 7 Compliance with Parks Standards By Supervisorial District Supervisor Districts Average Rating 75 to 80% 80 to 85% 85% to 90% Source: CSA data, park inspections results FY As shown in Exhibit 8, the lowest compliance ratings in FY were given to: District 5: 76 percent as rated by the Rec & Park (versus a 73 percent rating last year). Controller s Office 13
22 District 8: 75 percent as rated by CSA (versus a 67 percent lowest rating last year in district 11). EXHIBIT 8 Compliance with Parks Standards By Supervisorial District and Year Supervisorial District REC FY CSA FY REC FY CSA FY % 86.29% 84.09% 81.73% % 86.00% 91.41% 87.25% % 80.38% 87.87% 89.76% % 70.69% 81.58% 77.29% % 77.63% 75.91% 84.05% % 79.73% 86.62% 83.90% % 77.54% 86.05% 88.64% % 77.23% 83.65% 75.22% % 83.17% 89.99% 84.45% % 79.38% 80.53% 82.26% % 66.97% 76.75% 77.01% Citywide 81.94% 79.55% 85.73% 82.01% Note: Lowest Highest Source: CSA and Rec & Park data, park inspections results FY and FY District 8 had the highest number of parks rated F but also a high number of parks rated A District 8 saw the greatest deterioration of ratings. It also had the largest number of parks inspected in FY and is home to such heavily used parks as Mission Dolores Park, Buena Vista Park, Douglass, Noe Valley Courts, States Street and Duboce Park. The 2007 City Survey confirmed that district 8 has one of the highest percentages of residents visiting a park at least once a month compared to other districts (over 70 percent). Several of these highly-used parks were on the CSA s watch list, among the 18 parks that received additional inspections throughout the year. Many of them suffer from outdated and deteriorated infrastructure, which negatively impact park ratings regardless of maintenance efforts. Some of these parks are scheduled for capital improvements in the next few years. For instance, an upgraded children s playground at Noe Valley Courts will be opened to the public during the summer of Controller s Office


23 Pine Lake Park In contrast, district 4 stands out with a high percentage of improving parks (63 percent). However, since district 4 had the fewest number of parks inspected in FY , a positive change in rating of one or two parks tends to greatly impact the performance of the whole district. In particular, Pine Lake Park improved its compliance score from 54 percent in FY to 72 percent in FY This park is currently undergoing a significant capital improvement project including improvement of the recreation trail and the protection of the lake s sensitive natural resources. Grades in FY : 7 of 11 districts (70 percent) have more than 60 percent of their parks rated A or B by CSA As shown in Exhibit 9, district 8 has the highest number of F grades, approximately 20 percent of its parks. In contrast, district 3 shows the highest number (80 percent) of parks receiving an A or B grade. Five parks got a perfect score at 100 percent. This finding is reflected in the overall compliance score of district 3 which rose from 80 percent to almost 90 percent in FY District 11 has the lowest percentage (50 percent) of parks receiving favorable grades ( A or B ). This finding concurs with the results of the 2007 City Survey, which found that district 11 was the least likely to receive favorable grades from citizens with regards to park grounds. EXHIBIT 9 Compliance with Parks Standards Distribution of Letter Grade Results Number of Parks F D C B A Supervisorial District Source: CSA data, park inspections results FY Controller s Office 15

24 Results by Park Feature As shown in Exhibit 10, Rec & Park scored waste and recycling receptacles as the highest-rated feature at 92 percent, while the lowest score went to the dog play areas at 75 percent. Lafayette Park This year, CSA inspectors again rated trees as the best maintained park feature citywide at 92 percent, up from 89 percent in FY ; and dog play areas as the worst feature at 75 percent, up from 71 percent. The total number of official dog play areas in the City is 27, including four in Golden Gate Park and two in John McLaren Park. These are either open spaces designated by signage or fenced-in areas. The maintenance standards criteria for dog play areas include availability of bag dispensers, drainage, surface quality, signage and cleanliness (the latter being mostly the responsibility of dog owners and walkers). More details on park features ratings by supervisorial district can be found in Appendix B. EXHIBIT 10 Compliance with Parks Standards - Most Park Features Received a Similar or Higher Score in FY than in FY Park Feature REC FY CSA FY REC FY CSA FY Lawns 76% 74% 84% 81% Ornamental Gardens, Shrubs, and Ground Covers 70% 74% 79% 75% Trees 83% 89% 88% 92% Hardscapes and Trails 79% 80% 82% 80% Open Space 79% 79% 78% 76% Turf Athletic Fields 82% 74% 86% 76% Outdoor Athletic Courts 88% 85% 91% 90% Children s Play Area 85% 78% 84% 78% Dog Play Areas 76% 71% 75% 72% Restrooms 83% 79% 86% 85% Parking Lots and Roads 80% 85% 84% 86% Waste and Recycling Receptacles 89% 88% 92% 87% Benches, Tables, and Grills 84% 76% 86% 75% Amenities and Structures 84% 78% 87% 82% Note: Lowest Highest Source: CSA and Rec & Park data, park inspections results FY and FY Controller s Office
25 Results by Individual Park A snapshot of the 10 best and 10 worst parks is presented in Exhibit 11. In FY , Rec & Park inspectors gave 13 parks a perfect score of 100 percent (compared to 22 in FY ) while CSA gave a perfect score to 15 compared to 9 last year. Six parks received a perfect score by both departments (the first six listed in the table below). For individual park results by department, please refer to Appendix A. EXHIBIT 11 Compliance with Parks Standards Best-and Worst-Rated Parks Best-Rated Parks FY FY Cottage Row Mini Park 85% 100% Cow Hollow 84% 100% Diamond / Farnum Open Space 100% 100% Mullen Peralta Mini-Park 100% 100% Richmond Recreation Center 98% 100% Union Square 92% 100% Aptos N/A 100% Alice Marble Tennis Courts 100% 100% Ferry Park 92% 100% Ina Coolbrith Park 83% 100% Japanese Peace Plaza 73% 100% Worst-Rated Parks FY FY th / Diamond Open Space 0% 0% Broadway Tunnel East 40% 36% Buena Vista Park 95% 38% Cayuga Lamartine Mini Park 50% 46% Everson/Digby Lots 100% 50% 10 th Street/Clement Mini Park 79% 56% Bernal Heights Recreation Center 89% 59% Sunnyside Conservatory 37% 63% Potrero Del Sol 68% 63% Portsmouth Square 70% 63% Cayuga 64% 64% Source: CSA and Rec & Park data, park inspections results FY and FY Controller s Office 17
, newly renovated ones (Aptos ), high-profile properties (Union Square), facilities with less need of maintenance (Richmond Recreation")


26 The best rated group of parks changed little from last year. It includes brand new facilities (Alice Marble Tennis Courts), newly renovated ones (Aptos ), high-profile properties (Union Square), facilities with less need of maintenance (Richmond Recreation Center, two mini parks) and one open space for which the only evaluated criterion is cleanliness. Broadway Tunnel East Mini Park Regarding the worst rated parks, four are located in district 8 and four others have been continuously low-performing and received reinforced inspection by CSA this year: Broadway East Mini Park (district 3), Cayuga Lamartine Mini Park (district 11), Sunnyside Conservatory (district 8) and Potrero Del Sol Park (district 10). Sunnyside Conservatory Broadway Tunnel East Mini Park has been irregularly maintained by Rec & Park for years although DPW was the actual owner of the property. However, in 2007, as a capital improvement project was initiated and most of the park s elements were removed, only trash pick up has been done by either department. Potrero del Sol According to Rec & Park s capital improvement plan, Sunnyside Conservatory has been subject to deferred maintenance, vandalism and lack of funding, leading to extreme deterioration of the site. The site has been identified as a priority for capital investments but the project has been delayed due to funding shortage. Considering the safety issues noted in the park, CSA s recommendation has consistently been to close the park. Cayuga Lamartine Mini Park Potrero Del Sol was also identified as a priority site for renovation and was actually closed for renovation in early May The project includes renovations such as drainage improvements, security measures such as increased lighting and programs additions among which a skate park and a play area for toddlers. Finally, Cayuga Lamartine Mini Park low score illustrates a chronic lack of maintenance by staff combined with little care from the park s users. Cleanliness continues to be the primary issue in this tiny neighborhood park. Ocean View Among parks that were flagged last year as low performing, two have been closed for renovation since: Joseph Lee 18 Controller s Office
27 Recreation Center (district 10) and Ocean View (district 11). They are scheduled to reopen to the public during FY EXHIBIT 12 Parks with Significant Ratings Change Major Drop Park Supervisorial District FY FY Variance Buena Vista Park 8 95% 38% -57% Saturn Street Steps 8 79% 26% -43% Bernal Heights Recreation Center 9 89% 59% -30% 10 th Avenue/ Clement Mini Park 1 79% 56% -23% Little Hollywood Park 10 94% 76% -18% Allyne Park 2 79% 64% -15% Major Increase Park Supervisorial District FY FY Variance States Street 8 61% 92% 31% Rolph Nicol 7 52% 86% 34% Ocean View 11 36% 71% 35% McKinley Square 10 53% 91% 38% Brotherhood/Chester Mini Park 7 55% 95% 40% Seward Mini Park 8 42% 89% 47% Source: CSA data, park inspections results FY and FY We requested staffing information from Rec & Park in order to correlate large changes to concrete factors to the extent possible. All explanations provided in the next paragraph is according to the Neighborhood Service Areas managers in charge of these specific parks. Parks Where Conditions Have Deteriorated Allyne Park (district 2): Whereas a gardener was scheduled three times a week for a total of 10 hours in FY , a change in resource availability in the Marina area resulted in a reduction of hours devoted to this park this year. In addition, the park supervisor noted an increase in the presence of illegal campers, which has generated an increase in trash. 10th Avenue/Clement Street Mini Park (district 1): This neighborhood services area is severely understaffed, currently down to two staff, including only one gardener. In addition, this park is part of the Richmond Library, which was shut down for renovation. Therefore, Rec & Park made the decision to reallocate limited resources to higher-use Controller s Office 19
: Important improvements have been made since the last inspection including a thorough cleaning of the property, removal of broken or unsafe equipment,")
28 parks in this area. Bernal Heights Recreation Center (district 9): Important improvements have been made since the last inspection including a thorough cleaning of the property, removal of broken or unsafe equipment, painting of the recreation center and the delivery of four new large planters with trees. Bernal Heights was also recently assigned a full-time custodian. Saturn Street Steps and Buena Vista Park (district 8): This neighborhood services area has been short one fulltime gardener for the most recent period, which may have affected both ratings. Seward and State Streets (district 8): Staff in this particular was informed about the standards and what was evaluated which helped them refocus their maintenance efforts. Parks That Have Significantly Improved Brotherhood Chester Mini Park (district 7) and Ocean View (district 11): Several possible explanations were provided including: Re-emphasis of park standards and individual staff responsibilities; Upgrade of landscape equipment and materials; Re-investment of monthly work parties at understaffed areas; and Increased use of overtime. Rolph Nicol Other Major Findings Rolph Nicol (district 7): A neighboring church owns part of the fence surrounding the park. After the church repaired its portion in 2007, it made it more difficult for the high school kids to cut through the property. As a result, transit use of the park went down, making the park cleaner and better maintained. Additionally, two more hours of maintenance per week were allocated to the park. Of the 163 parks inspected by CSA in FY , over 50 percent (82) had restroom facilities. The distribution by district is provided in Exhibit Controller s Office

29 EXHIBIT 13 Restroom Availability and Rating in City Parks Restrooms (Y/N) Supervisorial District No Yes Grand Total Average Rating % % % % % % % % % % % Total Parks % Source: CSA data, park inspections results FY and FY Restroom availability remains a major issue in city parks as more than one third were closed at the time of inspection At the time of inspection, 60 percent of the restrooms were open and available to the public. Restroom availability has been a long-standing issue in City parks. Some have been permanently closed either due to staffing shortage (e.g., no custodian on site to unlock the restrooms) or to inappropriate and/or illegal use of the facilities. Douglass To address the issues of restroom availability and maintenance, Rec & Park has engaged in several actions in First it created a Restrooms Task Force to complete an assessment of processes, policies, and best practices related to the planning, design, construction, management and use of restrooms within the City. A review of other jurisdictions practices was also conducted, including cities such as Seattle, Portland, San Jose, Vancouver, San Diego and New York. Concurrently, Rec & Park developed a customer survey in partnership with the Neighborhood Park Council (NPC). This survey was administered in City parks in June The information collected should be used to gain a better understanding of the usage and problems associated with restrooms in the San Francisco parks and recreation facilities. Controller s Office 21

30 Homeless encampments are more likely to be found in regional and neighborhood parks Another element inspectors looked at while conducting their inspections was the presence of homeless encampments in the park. Based on the FY results, such encampments were found in 20 parks out of 163 that were inspected. Typically, encampments were spotted in regional parks (Golden Gate Park, Buena Vista Park) and large neighborhood parks (Duboce, Franklin Square, Mission Dolores, Mountain Lake or Potrero Del Sol). Potrero Del Sol Park Compliance with Park Staff Schedules In order to implement the CSA Charter requirements and to meet public demand for this information, Rec & Park has posted staff schedules for their gardeners and custodians who work in the neighborhood parks division on the Rec & Park website. Staff schedules for individual parks can be found at: Rec & Park did not update staff schedules regularly leading to reliability and accountability issues Whereas Rec & Park had initially committed to updating these staff schedules on a quarterly basis, no consistent updates were made in FY , which resulted in a lack of reliability of the information posted. This situation has consequences for both the public, which is not provided accurate information, and for the parks supervisors who lack the appropriate tool to manage their resources efficiently. In FY , CSA met several times with Rec & Park to ensure that corrective action would be taken. During FY , the department has committed to a bimonthly update of the schedules with each manager of the nine neighborhood services areas. In the meantime, Rec & Park has developed protocols to check compliance of staff on site in a more systematic manner. Results are posted on the department s website on a quarterly basis. While checking on compliance with schedules, CSA found that adherence to CSA checked on compliance with the schedules during FY During three sets of park inspections, CSA staff carried details of staff schedules and noted whether 22 Controller s Office
31 schedules was low, and lower than last year gardeners and/or custodians were on the premises whenever their work time and the CSA inspection times overlapped. Inspection times were from 8:00 a.m. to 5:00 p.m., and many gardeners and custodians begin in the early morning and end their shift by early afternoon. Inspection times and gardeners schedules overlapped 83 times during the three sets of inspections, which represents approximately 45 percent of the times controller s Office went out. In an additional 13 instances, no staff schedule was available and no staff was found on the premises. In August 2006, CSA evaluators saw a gardener 36 percent of the time. In November 2006, CSA evaluators saw a gardener 41 percent of the time. In January 2007, CSA evaluators saw a gardener 39 percent of the time. These scores are significantly lower than last year. Reasons for these results may include: Schedules were not up to date in several cases; Some of the parks are so large that it may be difficult to find the staff person. During the inspection, the gardeners or custodians are moving throughout the parks and so are the evaluators. However, all inspectors made multiple efforts during their inspection to locate those who were scheduled to be onsite; A staff person may be on leave. For some parks, Rec & Park may replace a worker on leave, but for many assignments the department does not have sufficient staff for replacements. As of April 2007, the citywide average for leave time from all sources (vacation, sick time, holidays) was 21.3 percent compared to 20.3 percent at Rec & Park. However this rate is typically higher for workers with jobs that are primarily physical labor (gardeners and custodians). Staffing Levels and Inspection Results As part of the FY budget submission process, Rec & Park prepared an analysis of gardener and custodian staffing estimates required in order to meet the park maintenance standards developed in cooperation with CSA. Controller s Office 23
32 Rec & Park Staffing Analysis Staffing estimates were tested at 11 parks Rec & Park completed this staffing analysis based upon published park maintenance tasks and time standards from the National Park and Recreation Association, as well as the city park standards and came up with a detailed estimate of staffing needs by park and by profile. Eleven sites (one in each supervisorial district) were selected to test these estimates and determine to what extent staffing levels could impact the performance of a park compared to other criteria such as capital investments or equipment availability. Criteria used by Rec & Park to select these parks included, among other, the current level of staffing, the park s visibility, its need for capital improvement as well as its size and location. EXHIBIT Parks Selected by Rec & Park to Test Staffing Recommendations CON Rating FY06-07 Estimated Hours / Week Actual Hours/ Week Newly Renovated Sites: Aptos 100% N/A 25 Esprit Park 97% 15 9 (gardener only) Patricia s Green in Hayes Valley 91% 11 4, (gardener only) currently maintained by Victoria Manolo Draves Park N/A 16 contractor Walter Haas 95% 46 8 (gardener only) Estimated Hours / Actual Hours/ CON Rating FY06-07 Older Sites Awaiting Capital Renovation: Week Week Notes Duboce Park 78% Franklin Square 71% Mc Coppin Square 85% (gardener only) Mission Dolores Park 72% South Park 70% (gardener only) Joseph L. Alioto Performing Arts Piazza 100% Notes: FTE information provided by Rec & Park, converted to # hours per week by CSA (1 FTE=40 hours) Source: Recreation and Park Department- SFStat- December Notes Volunteer Effort Volunteer hours make a difference and help meet the standards. Parks listed in Exhibit 15 were selected based on their high compliance with standards ( percent) despite a Rec & Park staffing shortfall. A detailed list of City parks benefiting from volunteer hours is available in Appendix D. 24 Controller s Office
33 EXHIBIT 15 Volunteer Hours and Compliance Rate REC staffing (Hours/Month) Estimated Hours Needed Actual Hours Variance Volunteer effort (Hours/Month) Average Nber of Donated Hours per Month Through March 2007 FY0607 Rating Park Stern Grove % Moscone recreation Center % Mountain Lake % Alamo Square % Joe Dimaggio % Lafayette Park % Mission % Cow Hollow % St Mary % Source: Rec & Park Volunteer Division; CSA inspection results FY Recommendations CSA and Rec & Park have met and discussed the results of the FY park inspections, schedule compliance, and the current content and status of the park standards themselves. The recommendations below confirm our understanding of the goals and next steps for these programs and should be implemented by Rec & Park in fulfillment of the Charter-mandated CSA requirements. 1. Create a weighting evaluation approach for different types of parks and for different features 2. Use the inspection results to manage operations and redeploy staff as needed. Based on the results of the staffing analysis conducted during this fiscal year, Rec & Park has a better knowledge of where gaps lie. The analysis identified a need for an additional 227 gardeners, including 45 for neighborhood parks, and 37 custodians. As a first step to reduce the gap, Rec & Park has obtained funding to hire an additional 15 gardeners and 35 custodians for FY Use the inspections and other public opinion tools (surveys) to prioritize capital investments. 4. Streamline and reinforce monitoring of the internal compliance program for staff schedules. Although protocols were put in place in FY and follow-up is usually done at the supervisors level, there is still a need for better consistency at the department level. 5. Continue to provide regular training to staff to maintain the quality level of inspections and ensure consistent understanding and application of the park standards by all staff. Controller s Office 25
34 Page intentionally left blank. 26 Controller s Office
")
35 CHAPTER 2 STREETS AND SIDEWALKS MAINTENANCE New Standards The standards were expanded this year to include sidewalks and trees CSA Street Inspection Results Street Cleanliness Clean street per standards manual Example: Residential and commercial streets inspected in district 3 frequently had 5 to 15 pieces of litter per 100- foot segment (Grant, Francisco, Battery, and Washington Streets) In consultation with DPW staff, new standards were developed and finalized in February In sum, new standards were added for sidewalk cleanliness and trees (see background for details). These are in addition to existing standards for street cleaning, graffiti, and the City s trash receptacles. Notably, in FY the standards were expanded into areas that are primarily the responsibility of private property owners (sidewalks and trees/landscaping). Property owners are responsible for maintaining the cleanliness of any adjacent sidewalks to their property. DPW is responsible for enforcement of cleanliness codes citywide. Inspections with the new standards were carried out in Quarter 3 of FY (March) and Quarter 4 (April). CSA inspected 44 segments, half of which were sampled from commercial corridors and half of which were strictly residential streets. Five sample blocks are usually evaluated during each inspection. Met the standard: Thirty-three out of the 44 separate inspections (75 percent) met the standard of an average score below 2.0 (a 1.0 score is less than 5 pieces of litter, a 2.0 score is five to 15 pieces of litter). On a supervisorial district basis, averaged scores in 9 out of 11 districts met the standard. Did not meet the standard: Eleven out of 44 inspections (25 percent) did not pass the standard and had an average score of 2.0 or higher. The areas not passing include: District 3 ( both commercial and residential) District 9 (residential only) District 11 (commercial only) Commercial vs. residential: Commercial corridors were usually dirtier than the residential routes (in 7 out of 11 supervisorial districts). Controller s Office 27
.")
36 EXHIBIT 16 Compliance With Street Maintenance Standards - Street Cleanliness CSA Inspections by Supervisorial District Note: Each score is an average of four inspections conducted per district. Source: CSA inspections conducted in March 2007 and April Sampled routes in certain areas consistently pass the street cleaning standard (before, as well as after, street sweeping). This demonstrates that street cleaning resources could be reallocated to areas with higher need (dirtier) As highlighted in the FY and FY inspection results, some routes and areas of the City consistently pass the street cleaning standards (both before as well as after sweeping). The streets sampled from the following areas again rated well. These areas were previously rated clean prior to street cleaning and recently attained clean scores (1.0 to 1.5) during mid-point inspections: Richmond (district 1) Marina (district 2) Parkside (district 4) Park Merced (district 7) 28 Controller s Office

37 These findings demonstrate that street cleaning frequency could be reduced on some routes in order to increase resources and sweeping frequency on routes with higher needs. Sidewalk Cleanliness Litter Clean sidewalk with no litter, grime, leaks, or spills Example: On Oakdale, between Bayshore and Selby, most 100-foot segments of sidewalk had over 15 pieces of litter. District 10 overall had a 2.03 average for sidewalk cleanliness (does not meet standard) Example: Fillmore Street between Union and Chestnut, swept on Tuesdays and Thursdays, had many 100- foot segments with over 15 pieces of litter when inspected on a Friday afternoon (district 2) FY was the first year implementing the sidewalk standards, which included five sidewalk elements. A full copy of the updated standards manual used by is available at: Most inspections conducted by CSA passed the standard for sidewalk litter (see map in Exhibit 18). This standard includes counting litter such as paper, food wrappers, newspapers, plastic bags, and cigarette butts on sidewalks per 100-foot segment of sidewalk. Met the standard: Twenty-eight out of the 44 separate inspections (64 percent) met the standard of an average score below 2.0. On a supervisorial district basis, average scores in 10 out of 11 districts met the standard. Did not meet the standard: Sixteen out of 44 inspections (36 percent) did not pass the standard. Those areas not passing this standard include: District 10 (both commercial and residential) District 2 and 7 (commercial only) Commercial vs. residential: Commercial routes were found to be dirtier than residential in 9 out of 11 districts. Controller s Office 29

38 EXHIBIT 17 Compliance With Street Maintenance Standards Sidewalk Cleanliness (Litter) CSA Inspections by Supervisorial District Notes: Each score is an average of four inspections conducted per district. Standards for sidewalk cleanliness include other elements in addition to litter score. Source: CSA inspections conducted in March 2007 and April Sidewalk Cleanliness Grime, Leaks and Spills Example: The commercial portion of Valencia Street from 23 rd Street to Duncan Street averaged 13 percent of the examined sidewalk area with grime, leaks, or spills (district 9) Nearly all sampled streets passed this standard, with 90 percent of the sidewalk free of grime, leaks, and spills. Most inspections saw less than 2 percent covered with these elements. Met the standard: Forty-three out of 44 inspections (98 percent). Did not meet the standard: One out of 44 inspections (2 percent). District 9 (commercial route) 30 Controller s Office
.")
39 Sidewalk Cleanliness Graffiti on Sidewalks Graffiti is now evaluated as a separate element within the sidewalk standards and most routes did not pass the standard (zero incidents). Met the standard: Thirteen out of 44 inspections (30 percent). Painted sidewalk graffiti Sidewalk Cleanliness- Illegal Dumping Example: On the residential Brazil Street between Mission and Edinburg, several instances of illegal dumping were found on the five blocks inspected (district 11) Sidewalk Cleanliness- Feces, Needles, Glass, and Condoms Did not meet the standard: Thirty-one out of 44 inspections (70 percent) showed at least some graffiti on sidewalks. However, the average number of incidents was usually less than one per block. Many routes met this standard, which does not allow any incidents of illegal dumping. However, there was a sizable number which did not. Met the standard: Thirty-one of 44 inspections (70 percent). Did not meet the standard: Thirteen of 44 inspections (30 percent). This new standard placed the most serious violations of sidewalk cleanliness into one category and allows zero incidents. While a majority did pass the new standard, many did not. Met the standard: Twenty-seven of 44 inspections (61 percent). Did not meet the standard: Seventeen of 44 inspections (39 percent). This means there was at least one sidewalk incident of feces, needles, broken glass, or condoms. Graffiti The graffiti standards include zero tolerance of graffiti, the City s official policy. By far most inspections did not meet the standard. Met the standard: No inspections met the standard for all three categories examined (DPW property, non-dpw public property, and private property). One segment passed in two of the categories (district 7) and five segments passed in one category only. Further discussion by property Controller s Office 31

40 category is included below. Did not meet the standard: Thirty-eight segments did not pass any of the three categories evaluated (DPW property, other non-dpw public property, and private property). Graffiti on public agency pole Graffiti prevention and removal continues to be a persistent challenge for the City. Only one area passed the standard for private property; no inspections met the standard for public property (non-dpw property) Graffiti on DPW property (street surfaces and City trash receptacles) is minimal in most districts. Example: The Valencia corridor between 23 rd Street and Duncan yielded the highest graffiti average -- nearly 28 incidents per block on private property. One segment with a vacant building contained 100 incidents (district 9). Example: Inspections on 24 th Street, Dolores, Market, and Noe Streets averaged a very low rate of graffiti, less than one or two graffiti incidents per block on both public property and private property (district 8). These results indicate how graffiti prevention and removal continues to be a persistent challenge for the City. Specifically, the City still struggles to meet its graffiti standard on private property and on public property not owned by DPW. DPW public property: DPW s work on its own property s graffiti shows good results. Graffiti on DPW property (street surfaces and city trash receptacles) is minimal in most districts. The average number of incidents per block is usually less than one for most inspections (37 of 44 inspections). Note that inspections are usually five blocks in length, and that that there are usually fewer DPW structures per block than private or non- DPW public structures. Non-DPW public property: These items include poles, parking signs, bus stops, and mailboxes. No inspections met the standard for this category. Only 6 out of 44 inspections had an average of less then one incident per block many had two to four incidents per block. Five inspections averaged over seven graffiti incidents per block. Private property: Only one area met the standard for private property on the inspected route: district 7 residential. In general, commercial routes have more incidents than residential (6 out of 11 supervisorial districts). Only 6 inspections out of 44 averaged less than one incident per block. Four inspections yielded more than seven incidents per block. One Mission district inspection yielded the highest average, with nearly 28 incidents per block (Valencia Street, between 23rd and Duncan). One segment alone contained 100 incidents. The City s Graffiti Ordinance establishes private property owners as responsible for abating graffiti 32 Controller s Office

41 on their property. The City's 311 service center is the clearinghouse for graffiti reports, and DPW responds to reports by investigating and sending notices to property owners to remove the graffiti or request a hearing within 30 days. If the graffiti is removed, the notice is closed. If the graffiti has not been removed, a second notice is sent to the property owner requesting authorization for DPW to remove the graffiti at the owner s expense. EXHIBIT 18 Compliance With Street Maintenance Standards Graffiti Incidents per Block CSA Inspections by Supervisorial District Notes: Each score is an average of four inspections conducted per district. Results above combine DPW property, other public property, and private property averages. Source: CSA inspections conducted in March 2007 and April Controller s Office 33

42 EXHIBIT 19 Compliance With Street Maintenance Standards Graffiti Incidents by Category CSA Inspections by Supervisorial District 20.0 Average # of Graffiti per Block DPW Non-DPW Private Supervisorial District Notes: Results are averages for DPW public property, other non-dpw public property, and private property. Source: CSA inspections conducted in March 2007 and April Trash Receptacles Met the standard: Only 6 of 44 inspections (14 percent) met the composite standard for this street feature (five out of six elements meeting 90 percent compliance). District 5 was the only district passing both commercial and residential routes. However, by individual element, the average results across all inspections show that most elements came close to passing between 80 percent and 91 percent compliance. Cleanliness immediately around the receptacle had the lowest average result (81 percent). See Appendix F for more detail. Clean City trash receptacle Did not meet the standard: Thirty-eight out of 44 inspections (86 percent) did not meet the composite standard. 34 Controller s Office
 Commercial vs.")

43 Example: On Mission Street between 1st and 4th Streets, five out of five City receptacles were not overflowing, had a good coat of paint, and did not have litter surrounding them. But two out of five had some kind of structural damage, and five out of five had open or broken doors (district 6) Commercial vs. residential: Receptacles in commercial routes met the standard more often than residential areas. This may be largely due to fewer receptacles in residential areas, which brings down ratings when averages are calculated. Illegal dumping is also more likely in the residential area routes. Trees Cleanliness and weediness in tree wells consistently does not meet the standard Example: Out of 19 trees inspected along Taraval Street between 19th and 24th Avenues, 17 passed in appearance and 18 passed in tree clearance. Only five out of 19 trees passed the cleanliness and weediness standards (district 4) Tree well meeting the cleanliness and weediness standard Of the four elements in this standard, tree appearance and tree clearance usually met the standard (inspected trees generally appear healthy and well-kept). On the other hand, the cleanliness and weediness in tree wells and containers is a challenge. Those elements of the standard were consistently not met. Met the standard: Only one inspection out of 44 met all four elements (district 11 residential route). Most inspections passed only one or two elements of the standard. However, by individual element, the average results across all inspections show that 95 percent of tree wells/planters met the tree appearance standard, and 93 percent met the tree clearance standard. Only 55 percent met the cleanliness standard. Sixty-nine percent met the weediness standard (see Appendix F for more detail). Did not meet the standard: Forty-three out of 44 inspections did not meet all four elements. Twelve out of 44 inspections did not meet three or four elements. Commercial vs. residential: These trends apply across the city, in both commercial and residential areas. Tree well not meeting the standards Controller s Office 35
44 Community Corridor Partnership In October 2006, the mayor launched the Community Corridor Partnership (partnership), a cleaning initiative in targeted San Francisco neighborhoods also known as Clean Corridors. Led by DPW, in coordination with other city and private agencies, the partnership covers 100 City blocks and concentrates on public education and increased maintenance. The stated goal of the pilot program (October 2006 to June 2007) is to demonstrate how San Francisco s neighborhoods and business districts can be welcoming and vibrant assets to your community when everyone does their part. The program was funded for the full year of FY Components of the Partnership: A block sweeper (Neighborhood Ambassador) who sweeps sidewalks and abates or report problems during peak hours (Thursday Monday, 11:00 a.m. 8:00 p.m.). Improved graffiti abatement through a private contractor and increased city maintenance. Increased City services through increased coordination (e.g., curb painting, tree basin maintenance, sidewalk repair). Better communication between residents, businesses and city agencies, working in coordination to make improvements. DPW s description of the partnership, including a copy of its street and sidewalk maintenance handbook, can be found at: Inspections: DPW has contracted with a nonprofit community agency to conduct inspections of the program s corridors. Mission Neighborhood Centers (MNC) began conducting preliminary inspections in January and February Allowing for a start-up/training period, data was collected and reported starting in March Those first data results are available in Exhibit 20. DPW s objective is to conduct inspections on the targeted corridors every other month. 36 Controller s Office
45 EXHIBIT 20 Compliance With Street Maintenance Standards DPW Inspections March Community Partnership Corridors BEFORE AFTER Criteria / feature % of Districts met the standard % of Districts met the standard 1.0 Street Cleanliness 1.1 Score (1.0, 2.0, or 3.0) 55% 100% 2.0 Sidewalk Cleanliness 2.1 Litter* (1.0, 2.0, or 3.0 score) 73% 100% 2.2 Grime, Leaks, Spills* 100% 100% 2.3 Graffiti * 45% 73% 2.4 Illegal Dumping ** 2.5 Feces, Needles, Glass, Condoms ** 3.0 Graffiti 3.1 DPW public property 64% 3.2 Non-DPW public property 9% 3.3 Private property 9% 4.0 Trash Receptacles 4.1 Fullness 91% 4.2 Cleanliness of trash receptacles 91% 4.3 Cleanliness around trash receptacles 91% 4.4 Painting 100% 4.5 Structural integrity & function 100% 4.6 Doors 100% Final Rating (5 out of 6) 91% 5.0 Trees and Landscaping 5.1 Cleanliness* 100% 5.2 Tree Appearance* 100% 5.3 Weediness* 100% 5.4 Clearance* 100% Notes: Percentage of supervisorial districts meeting the standard (out of 11). * The standards utilized for sidewalk cleanliness, and trees and landscaping. were preliminary and not the final adopted versions. ** Not all standards were utilized for before and after inspections. Joint training between CSA and MNC inspectors had not occurred as of these inspections. Inspections conducted by Mission Neighborhood Centers (MNC), contractor to DPW. Source: DPW/MNC inspections (March 2007). Mechanical Sweeping Study In previous annual reports, CSA has recommended that results be tracked so that DPW management can make informed changes to maintenance schedules and to reallocate resources to produce better results. Specifically, Controller s Office 37
46 CSA recommended at the end of FY that DPW analyze its mechanical sweeping schedules together with inspection results, and determine if changes should be made to increase or decrease frequency of sweeps. Following a Request for Proposal process, DPW contracted with a professional consultant (Short Elliot Hendrickson, Inc) in January 2007 to provide an analysis of street sweeping operations. The key tasks of this contract include an overview of current operations, collecting data including onsite observations, analysis of data and processes, comparison to industry standards, identifying opportunities for change including street sweeping frequency, equipment, crew hours, and routing effectiveness. The consultant will provide a draft and final report with recommendations for operational changes that could be implemented to improve sweeping effectiveness and cost efficiency. At the date of the writing of this report, the consultant s final report has not been submitted. DPW management is working with the consultant on the content and timing of the final draft report. Recommendations 1. DPW needs to conduct regular and consistent inspections. In order to have meaningful data to analyze on the revised standards, DPW needs to ensure: 1) inspections occur on a regular basis throughout FY , 2) the routes used for citywide inspections are expanded, and 3) the same data collection methods are used each time. 2. DPW should use mid-point inspections. CSA recommends DPW change the timing of their inspections to the mid-point between cleanings (halfway between scheduled mechanical sweepings). CSA has changed to this method for its inspections, which better captures a citizen s viewpoint during weekday hours and also maximizes inspection resources. 3. Reallocate DPW street sweeping resources. As highlighted in the FY and FY inspection results, some areas of the City consistently pass the street cleaning standards, both before and after sweeping. During the recent mid-point inspections by CSA (halfway between mechanical street sweepings), certain areas again rated well. This indicates street cleaning frequency could be reduced on 38 Controller s Office
47 some routes in order to increase frequency on others with higher needs. To date, DPW has initiated a consultant s review of mechanical street sweeping. Final recommendations have not been published as of this report. 4. Improve evaluation of Community Corridor Partnership Program. DPW should implement a planned and consistent evaluation of this program. To enable comparison with the assessments done at the beginning of the program ( deficiency lists), an updated evaluation should occur for each route using similar descriptions and coding. Additional categorization of the existing coding would assist with the results analysis. Evaluation results also should be electronically recorded in spreadsheets or database software to facilitate analysis. Proper documentation of the program s activities is critical to evaluation. Specifically, CSA recommends DPW document the techniques perceived as successful in the areas of public outreach and education. These components are critical to any long-term solution to the City s cleanliness, and lessons learned should be applied towards routes outside the program. 5. Obtain in-depth information on perceptions of street cleanliness. Similar to the current Park Intercept Survey, the goal of this effort would be to obtain detailed information on city resident perceptions of the cleanliness of streets and sidewalks. CSA proposes to work with DPW to develop a survey method (e.g., citizen survey, focus group) to gather this information. The results should be reviewed and used to prioritize maintenance tasks, as well as to inform the definitions of the street cleaning standards. Controller s Office 39
48 Page intentionally left blank. 40 Controller s Office


49 APPENDIX A: Park Inspection Ratings by Park Controller s Office A-1

50 A-2 Controller s Office
.")
51 The average rating is calculated by dividing the sum of all the standards met (Yes answers) by a given park by the total standards met and not met (Yes and No answers). Controller s Office A-3
52 Page intentionally left blank. A-4 Controller s Office
53 APPENDIX B: Park Inspection Ratings by Feature Park Feature District 01 District 02 District 03 District 04 District 05 District 06 District 07 District 08 District 09 District 10 District 11 CityWide Lawns 83% 81% 93% 77% 78% 88% 88% 73% 70% 78% 82% 81% Ornamental Gardens, Shrubs, and Ground Covers 87% 93% 87% 75% 70% 59% 82% 66% 76% 70% 67% 75% Trees 91% 90% 95% 94% 98% 91% 88% 89% 91% 99% 78% 92% Hardscapes and Trails 71% 82% 87% 71% 80% 86% 92% 71% 87% 76% 79% 80% Open Space 100% 100% 0% 83% 0% 0% 100% 67% 67% 50% 100% 76% Turf Athletic Fields 85% 82% 0% 66% 80% 86% 87% 65% 76% 78% 73% 76% Outdoor Athletic Courts 97% 93% 96% 90% 78% 94% 87% 86% 93% 91% 82% 90% Childrens Play Areas 69% 83% 85% 63% 77% 79% 83% 80% 85% 77% 71% 78% Dog Play Areas 0% 70% 0% 69% 63% 100% 60% 66% 100% 88% 63% 72% Restrooms 83% 88% 81% 70% 87% 74% 84% 87% 88% 91% 85% 85% Parking Lots and Roads 93% 88% 0% 88% 72% 0% 94% 67% 78% 88% 67% 86% Waste and Recycling Receptacle 94% 92% 91% 83% 76% 91% 96% 85% 89% 81% 77% 87% Benches, Tables, and Grills 65% 82% 89% 65% 76% 79% 84% 79% 69% 71% 64% 75% Amenities and Structures 79% 83% 91% 80% 85% 83% 87% 75% 79% 85% 66% 82% District Average 82% 87% 90% 77% 84% 84% 89% 75% 84% 82% 77% 82% Controller s Office B-1
54 Page intentionally left blank. B-2 Controller s Office
55 APPENDIX C: Results of Staffing Analysis by Rec & Park Total FTE Custodian Gardener Property Acreage Estimated Actual Variance Estimate Actual Variance Estimate Actual Variance NEIGHBORHOOD PARKS District TH AVE/CLEM ENT M INI Mini Park PARK ANGELO J. ROSSI Neighborhood Park or PLAYGROUND ARGONNE PLAYGROUND Neighborhood Park or CABRILLO PLAYGROUND Neighborhood Park or DUPONT COURTS Neighborhood Park or FULTON PLAYGROUND Neighborhood Park or MURIEL LEFF MINI PARK Mini Park PARK PRESIDIO BLVD Parkway RICHMOND PLAYGROUND Neighborhood Park or RICHMOND RECREATION Neighborhood Park or CENTER ROCHAMBEAU Neighborhood Park or PLAYGROUND District ALICE MARBLE TENNIS Neighborhood Park or COURTS ALLYNE PARK Neighborhood Park or ALTA PLAZA Neighborhood Park or COW HOLLOW Neighborhood Park or PLAYGROUND JULIUS KAHN PLAYGROUND Neighborhood Park or LAFAYETTE PARK Neighborhood Park or LAUREL HILL PLAYGROUND Neighborhood Park or MOSCONE RECREATION Neighborhood Park or CENTER MOUNTAIN LAKE PARK Neighborhood Park or PALACE OF FINE ARTS Civic Plaza or Square PRESIDIO HEIG HTS PLAYGROUND RUSSIAN HILL OPEN SPACE YACHT HARBOR AND MARINA GREEN Neighborhood Park or Neighborhood Park or Civic Plaza or Square Controller s Office C-1
56 Total FTE Custodian Gardener Property Acreage Estimated Actual Variance Estimate Actual Variance Estimate Actual Variance District BROADWAY TUNNEL EAST Mini Park MINI PARK BROADWAY TUNNEL WEST Mini Park MINI PARK CHESTNUT/KEARNY OPEN Mini Park SPACE CHINESE RECREATION Neighborhood Park or CENTER COLLIS P. HUNTINGTON Civic Plaza or Square PARK FAY PARK Neighborhood Park or FERRY PARK Neighborhood Park or HELEN WILLS PLAYGROUND Neighborhood Park or HYDE/VALLEJO MINI PARK Mini Park INA COOLBRITH MINI PARK Mini Park JOE DIMAGGIO Neighborhood Park or PLAYGROUND JOSEPH CONRAD MINI PARK Mini Park JUSTIN Civic Plaza or Square HERMAN/EMBARCADERO PLAZA MARITIME PLAZA Civic Plaza or Square 0.00 MICHELANGELO Neighborhood Park or PLAYGROUND PORTSMOUTH SQUARE Neighborhood Park or ST. MARY'S SQUARE Civic Plaza or Square TELEGRAPH HILL/PIONEER Civic Plaza or Square PARK UNION SQUARE Civic Plaza or Square WASHINGTON SQUARE Civic Plaza or Square WASHINGTON/HYDE MINI PARK WILLIE WOO WOO WONG PLAYGROUND WOH HEI YUEN PARK Mini Park Neighborhood Park or Neighborhood Park or C-2 Controller s Office
57 Total FTE Custodian Gardener Property Acreage Estimated Actual Variance Estimate Actual Variance Estimate Actual Variance District CARL LARSEN PARK Neighborhood Park or LOWER GREAT HIGHWAY Parkway MCCOPPIN SQUARE Neighborhood Park or PARKSIDE SQUARE Neighborhood Park or SOUTH SUNSET Neighborhood Park or PLAYGROUND SUNSET PLAYGROUND Neighborhood Park or WEST SUNSET Neighborhood Park or PLAYGROUND District ALAMO SQUARE Neighborhood Park or BEIDEMAN/O'FARRELL MINI Mini Park PARK BUCHANAN STREET MALL Neighborhood Park or BUSH/BRODERICK MINI PARK Mini Park COTTAGE ROW MINI PARK Mini Park FILLMORE/TURK MINI PARK Mini Park GOLDEN GATE/STEINER MINI Mini Park PARK GRATTAN PLAYGROUND Neighborhood Park or HAMILTON PLAYGROUND Neighborhood Park or HAYES VALLEY Neighborhood Park or PLAYGROUND JAPANESE PEACE PLAZA Civic Plaza or Square AND PAGODA KOSHLAND PARK Neighborhood Park or NATURAL Real Estate/ Admin AREAS/VOLUNTEERS PROGRAM Svcs PAGE/LAGUNA MINI PARK Mini Park RAYMOND KIMBELL Neighborhood Park or PLAYGROUND TANK HILL Neighborhood Park or Controller s Office C-3
58 Total FTE Custodian Gardener Property Acreage Estimated Actual Variance Estimate Actual Variance Estimate Actual Variance District FATHER ALFRED E. Neighborhood Park or BOEDDEKER PARK FRANKLIN SQUARE Neighborhood Park or JEFFERSON SQUARE Neighborhood Park or JOSEPH L. ALIOTO Civic Plaza or Square PERFORMING ARTS PIAZZA KID POWER PARK Neighborhood Park or MARGARET S HAYWARD PLAYGROUND Neighborhood Park or PATRICIAS GREEN IN HAYES Mini Park VALLEY SGT. JOHN MACAULAY PARK Mini Park SOUTH OF MARKET Neighborhood Park or RECREATION CENTER SOUTH PARK Neighborhood Park or TENDERLOIN RECREATION Neighborhood Park or CENTER TURK/HYDE MINI PARK Mini Park VICTORIA MANALO DRAVES Neighborhood Park or PARK District APTOS PLAYGROUND Neighborhood Park or BALBOA PARK Neighborhood Park or BROTHERHOOD/CHESTER Mini Park MINI PARK EDGEHILL MOUNTAIN Neighborhood Park or GOLDEN GATE HEIGHTS Neighborhood Park or PARK GRAND VIEW OPEN SPACE Neighborhood Park or GRAND VIEW PARK Neighborhood Park or HAWK HILL Neighborhood Park or INTERIOR GREEN BELT Neighborhood Park or C-4 Controller s Office
59 Total FTE Custodian Gardener Property Acreage Estimated Actual Variance Estimate Actual Variance Estimate Actual Variance District 07 (continued) J. P. MURPHY PLAYGROUND Neighborhood Park or JUNIPERO SERRA Neighborhood Park or PLAYGROUND MIDTOWN TERRACE Neighborhood Park or PLAYGROUND MIRALOMA PLAYGROUND Neighborhood Park or MT DAVIDSON PARK Neighborhood Park or ROCK OUTCROPPING Neighborhood Park or ROLPH NICOL PLAYGROUND Neighborhood Park or SUNNYSIDE PLAYGROUND Neighborhood Park or TWIN PEAKS Neighborhood Park or WEST PORTAL Neighborhood Park or PLAYGROUND District TH/DIAMOND OPEN SPACE Neighborhood Park or BERKELEY WAY OPEN Neighborhood Park or SPACE BILLY GOAT HILL Neighborhood Park or CORONA HEIGHTS Neighborhood Park or CRAGS COURT GARDEN Community Garden DIAMOND/FARNUM OPEN Neighborhood Park or SPACE DOROTHY ERSKINE PARK Neighborhood Park or DOUGLASS PLAYGROUND Neighborhood Park or DUBOCE PARK Neighborhood Park or DUNCAN/CASTRO OPEN Neighborhood Park or SPACE EUREKA VALLEY Neighborhood Park or PLAYGROUND EVERSON/DIGBY LOTS Neighborhood Park or Controller s Office C-5
60 Total FTE Custodian Gardener Property Acreage Estimated Actual Variance Estimate Actual Variance Estimate Actual Variance District 08(continued) FAIRMOUNT PLAZA Neighborhood Park or GEORGE CHRISTOPHER Neighborhood Park or PLAYGROUND JOOST/BADEN MINI PARK Mini Park KITE HILL Neighborhood Park or MISSION DOLORES PARK Neighborhood Park or MISSION PLAYGROUND Neighborhood Park or MT OLYMPUS Neighborhood Park or NOE VALLEY COURTS Neighborhood Park or NOE/BEAVER COMMUNITY Community Garden GARDEN PEIXOTTO PLAYGROUND Neighborhood Park or PORTOLA OPEN SPACE Mini Park ROOSEVELT/HENRY STEPS Mini Park SATURN STREET STEPS Mini Park SEWARD MINI PARK Mini Park STATES STREET Neighborhood Park or PLAYGROUND SUNNYSIDE Mini Park CONSERVATORY TOPAZ OPEN SPACE Neighborhood Park or UPPER NOE RECREATION Neighborhood Park or CENTER WALTER HAAS Neighborhood Park or PLAYGROUND District TH/YORK MINI PARK Mini Park ALIOTO MINI PARK Mini Park BERNAL HEIGHTS PARK Neighborhood Park or BERNAL HEIGHTS Neighborhood Park or RECREATION CENTER COLERIDGE MINI PARK Mini Park COSO/PRECITA MINI PARK Mini Park GARFIELD SQUARE Neighborhood Park or HOLLY PARK Neighborhood Park or C-6 Controller s Office
61 Total FTE Custodian Gardener Property Acreage Estimated Actual Variance Estimate Actual Variance Estimate Actual Variance District 09(continued) JAMES ROLPH JR Neighborhood Park or PLAYGROUND JOSE CORONADO Neighborhood Park or PLAYGROUND JURI COMMONS Mini Park MISSION RECREATION CENTER Neighborhood Park or MULLEN/PERALTA MINI PARK Mini Park PALEGA RECREATION Neighborhood Park or CENTER PARQUE NINOS UNIDOS Neighborhood Park or PRECITA PARK Neighborhood Park or PRENTISS MINI PARK Mini Park ST. MARY'S PLAYGROUND Neighborhood Park or District ADAM ROGERS PARK Neighborhood Park or BAY VIEW PARK Neighborhood Park or BAY VIEW PLAYGROUND Neighborhood Park or ESPRIT PARK Neighborhood Park or GILMAN PLAYGROUND Neighborhood Park or HERZ PLAYGROUND Neighborhood Park or HILLTOP PARK Neighborhood Park or HUNTER'S POINT Neighborhood Park or RECREATION CENTER INDIA BASIN SHORELINE Neighborhood Park or PARK JACKSON PLAYGROUND Neighborhood Park or JOSEPH LEE RECREATION Neighborhood Park or CENTER KELLOCH VELASCO MINI Mini Park PARK LITTLE HOLLYW OOD PARK Neighborhood Park or LOUIS SUTTER Neighborhood Park or PLAYGROUND MCKINLEY SQUARE Neighborhood Park or MONSTER PARK Concession PALOU/PHELPS PARK Neighborhood Park or Controller s Office C-7
62 Total FTE Custodian Gardener Property Acreage Estimated Actual Variance Estimate Actual Variance Estimate Actual Variance District 10(continued) POTRERO DEL SOL PARK Neighborhood Park or POTRERO HILL MINI PARK Mini Park 0.00 POTRERO HILL RECREATION Neighborhood Park or CENTER RIDGETOP PLAZA Neighborhood Park or SELBY/PALOU MINI PARK Mini Park SILVER TERRACE Neighborhood Park or PLAYGROUND UTAH/18TH MINI PARK Mini Park VISITACION VALLEY Neighborhood Park or COMMUNITY CENTER VISITACION VALLEY Neighborhood Park or GREENWAY VISITACION VALLEY Neighborhood Park or PLAYGROUND YOUNGBLOOD COLEMAN Neighborhood Park or PLAYGROUND District ALICE CHALMERS Neighborhood Park or PLAYGROUND BROOKS PARK Neighborhood Park or CAYUGA PLAYGROUND Neighborhood Park or CAYUGA/LAMARTINE MINI Mini Park PARK CROCKER AMAZON Neighborhood Park or PLAYGROUND EXCELSIOR PLAYGROUND Neighborhood Park or GENEVA AVENUE STRIP Mini Park HEAD/BROTHERHOOD MINI Mini Park PARK LAKEVIEW/ASHTON MINI Mini Park PARK LESSING/SEARS MINI PARK Mini Park MERCED HEIGHTS Neighborhood Park or PLAYGROUND OCEAN VIEW PLAYGROUND Neighborhood Park or RANDOLPH/BRIGHT MINI PARK Mini Park C-8 Controller s Office
63 APPENDIX D: Volunteer Hours by Park in FY (through March 2007) District Park Name Total Hours District 1 Golden Gate Park 8,567 Legion of Honor 1,031 Park Presidio Boulevard 135 District 2 Alta Plaza 297 Cow Hollow 66 Lafayette Park 821 Legion of Honor 100 Mountain Lake Park 447 Palace of Fine Arts 292 Moscone Rec. Center 172 District 3 Chinese Rec. Center 220 Huntington Park 94 Ina Coolbrith 42 Joe Dimaggio 120 Justin Herman Plaza 210 Pioneer Park 150 Portsmouth Square 493 Union Square 135 Washington Square 40 District 4 La Playa and Wawona 144 McCoppin Square 180 Rolph Nicol 18 Stern Grove 469 Wawona Clubhouse 12 West Sunset 24 District 5 Alamo Square 258 Bush Mini Park 70 Eureka Valley Rec Center 90 Fillmore Mini Park 38 Grattan 54 Hamilton Rec Center 245 Hayes Green 2 Hayes Valley Recreation Center 9 Japantown 36 Kimball 105 Koshland Park 231 Panhandle 17 Steiner Mini Park 36 Tank Hill 8 Controller s Office D-1
64 District Park Name Total Hours District 6 Boeddeker Park 540 Franklin Square 94 Hayward 90 Jefferson Square 20 Kid Power Park 34 Tenderloin 80 Turk and Hyde 30 District 7 Aptos 210 Balboa Park 110 Grandview Park 12 Harding Park 408 Lake Merced 2,130 Mt. Davidson 532 Rolph Nicol 204 Sheilds/Orizaba 18 District 8 Buena Vista Park 754 Christopher 57 Corona Heights 134 Dolores Park 502 Duboce Park 228 Eureka Valley Rec Center 60 Glen Canyon 822 Juri Commons 21 Kite Hill 2 Mission 483 Noe Courts 34 Sunnyside Conservatory 3 Upper Douglas 128 Noe Valley Courts 132 District 9 Alioto Park 48 Garfield Park 200 Holly Park 60 Juri Commons 252 Peralta Mini Park 90 Peralta Point 45 Peralta Point Mini Park 61 Precita Park 42 St Mary's 108 Rolph Nicol Park 225 D-2 Controller s Office
65 District Park Name Total Hours District 10 Adam Rogers 36 Esprit Park 60 Gilman 150 India Basin 45 Jackson 168 Little Hollywood 12 McKinley Square 40 McLaren Park 2,079 Palou Phelps 120 Silver Terrace 144 Visitacion Valley Greenway 1,117 District 11 Brooks Park 85 Crocker-Amazon 144 Ocean View Recreation Center 96 Sheilds/Orizaba 4 Cayuga Lamartine 36 Total Volunteer Hours 28,816 Source: RPD, Volunteer Division, Data FY06-07 as of March 31, Controller s Office D-3
66 Page intentionally left blank. D-4 Controller s Office
67 APPENDIX E: REC & PARK DEPARTMENT RESPONSE Controller s Office E-1
68 Page intentionally left blank. E-2 Controller s Office
69 APPENDIX F: CSA STREET INSPECTIONS CITYWIDE RESULTS Compliance with Street and Sidewalk Maintenance Standards CSA Inspections - Citywide Results with Averages Criteria / feature Citywide Avg Standard Met? (Yes/No) 1.0 Street Cleanliness 1.1 Score (1.0, 2.0, or 3.0) 1.66 Y 2.0 Sidewalk Cleanliness 3.0 Graffiti 4.0 Trash Receptacles 5.0 Trees & Landscaping 2.1 Litter (1.0, 2.0, or 3.0 score) 1.76 Y 2.2 Grime, Leaks, Spills (% of sidewalk) 2.6% Y 2.3 Graffiti (# on sidewalk) 0.31 N 2.4 Illegal Dumping (Yes/No) N N 2.5 Feces, Needles, Glass, Condoms (Y/N) N N 3.1 DPW (# of incidents) 0.87 N 3.2 Non-DPW (# of incidents) 4.09 N 3.3 Private (# of incidents) 4.23 N 4.1 Fullness 88.0% N 4.2 Cleanliness of trash receptacles 88.1% N 4.3 Cleanliness around trash receptacles 80.5% N 4.4 Painting 88.5% N 4.5 Structural integrity & function 90.4% Y 4.6 Doors 89.4% N Final Rating (5 out of 6 met) N N 5.1 Cleanliness 54.9% N 5.2 Tree Appearance 94.8% Y 5.3 Weediness 68.7% N 5.4 Clearance 92.7% Y * Note: Y=Yes standard met. N=No, standard not met These results reflect averaging of data across inspections. See individual district results. Source: CSA inspections (March and April 2007). Controller s Office F-1
70 Page intentionally left blank. F-2 Controller s Office
71 APPENDIX G: CSA INSPECTION RESULTS BY DISTRICT District 1 RESULTS BY COMMERCIAL VS. RESIDENTIAL ROUTES INSPECTED (2 INSPECTIONS EACH PER SUPERVISORIAL DISTRICT) Inspection Avg. Commercial Standard Met? (Y/N) Inspection Avg. Residential Standard Met? (Y/N) Criteria/feature 1.0 Street Cleanliness 1.1 Score (1.0, 2.0, or 3.0) 1.55 Y 1.34 Y 2.0 Sidewalk Cleanliness 2.1 Litter (1.0, 2.0, or 3.0) 1.88 Y 1.68 Y 2.2 Grime, Leaks, Spills (% of sidewalk) 0% Y 0% Y 2.3 Graffiti (# on sidewalk) 0.40 N 0.59 N 2.4 Illegal Dumping (Y/N) Y Y N N 2.5 Feces, Needles, Glass, Condoms (Y/N) N N Y Y 3.0 Graffiti 3.1 DPW public property 0.50 N 0.10 N 3.2 Non-DPW public property 3.40 N 4.90 N 3.3 Private property 7.80 N N 4.0 Trash Receptacles 4.1 Fullness 100% Y 25% N 4.2 Cleanliness of trash receptacles 100% Y 25% N 4.3 Cleanliness around trash receptacles 100% Y 25% N 4.4 Painting 100% Y 50% N 4.5 Structural integrity & function 100% Y 50% N 4.6 Doors 100% Y 50% N Final Rating (5 out of 6) Y N 5.0 Trees and Landscaping 5.1 Cleanliness 17% N 67% N 5.2 Tree Appearance 85% N 92% Y 5.3 Weediness 41% N 58% N 5.4 Clearance 66% N 83% N CONTINUED Controller s Office G-1
72 CSA INSPECTION RESULTS BY DISTRICT (CONT D) District 2 Inspection Avg. Commercial Standard Met? (Y/N) Inspection Avg. Residential Standard Met? (Y/N) Criteria/feature 1.0 Street Cleanliness 1.1 Score (1.0, 2.0, or 3.0) 1.65 Y 1.09 Y 2.0 Sidewalk Cleanliness 2.1 Litter (1.0, 2.0, or 3.0) 2.13 N 1.37 Y 2.2 Grime, Leaks, Spills (% of sidewalk) 1.0% Y 0.8% Y 2.3 Graffiti (# on sidewalk) 0.16 N 0.03 N 2.4 Illegal Dumping (Y/N) Y Y N N 2.5 Feces, Needles, Glass, Condoms (Y/N) Y Y N N 3.0 Graffiti 3.1 DPW public property 0.00 Y 0.10 N 3.2 Non-DPW public property 5.20 N 1.00 N 3.3 Private property 2.80 N 0.30 N 4.0 Trash Receptacles 4.1 Fullness 100% Y 0% N 4.2 Cleanliness of trash receptacles 100% Y 0% N 4.3 Cleanliness around trash receptacles 100% Y 0% N 4.4 Painting 67% N 0% N 4.5 Structural integrity & function 100% Y 0% N 4.6 Doors 100% Y 0% N Final Rating (5 out of 6) Y N 5.0 Trees and Landscaping 5.1 Cleanliness 37% N 72% N 5.2 Tree Appearance 95% Y 97% Y 5.3 Weediness 63% N 95% Y 5.4 Clearance 84% N 100% Y District 3 Inspection Avg. Commercial Standard Met? (Y/N) Inspection Avg. Residential Standard Met? (Y/N) Criteria/feature 1.0 Street Cleanliness 1.1 Score (1.0, 2.0, or 3.0) 2.20 N 2.33 N 2.0 Sidewalk Cleanliness 2.1 Litter (1.0, 2.0, or 3.0) 1.89 Y 1.88 Y 2.2 Grime, Leaks, Spills (% of sidewalk) 4.7% Y 1.6% Y 2.3 Graffiti (# on sidewalk) 0.05 N 0.34 N 2.4 Illegal Dumping (Y/N) N N N N 2.5 Feces, Needles, Glass, Condoms (Y/N) N N N N 3.0 Graffiti 3.1 DPW public property 0.17 N 0.40 N 3.2 Non-DPW public property N N 3.3 Private property 4.42 N 3.40 N 4.0 Trash Receptacles 4.1 Fullness 75% N 50% N 4.2 Cleanliness of trash receptacles 100% Y 50% N 4.3 Cleanliness around trash receptacles 100% Y 0% N 4.4 Painting 100% Y 50% N 4.5 Structural integrity & function 100% Y 50% N 4.6 Doors 100% Y 50% N Final Rating (5 out of 6) Y N 5.0 Trees and Landscaping 5.1 Cleanliness 11% N 25% N 5.2 Tree Appearance 50% N 96% Y 5.3 Weediness 45% N 61% N 5.4 Clearance 42% N 96% Y G-2 Controller s Office
73 CSA INSPECTION RESULTS BY DISTRICT (CONT D) District 4 Inspection Avg. Commercial Standard Met? (Y/N) Inspection Avg. Residential Standard Met? (Y/N) Criteria/feature 1.0 Street Cleanliness 1.1 Score (1.0, 2.0, or 3.0) 1.48 Y 1.13 Y 2.0 Sidewalk Cleanliness 2.1 Litter (1.0, 2.0, or 3.0) 1.42 Y 1.20 Y 2.2 Grime, Leaks, Spills (% of sidewalk) 1.2% Y 1.5% Y 2.3 Graffiti (# on sidewalk) 0.20 N 0.10 N 2.4 Illegal Dumping (Y/N) Y Y N N 2.5 Feces, Needles, Glass, Condoms (Y/N) Y Y Y Y 3.0 Graffiti 3.1 DPW public property 1.00 N 0.00 Y 3.2 Non-DPW public property 0.40 N 0.10 N 3.3 Private property 2.70 N 0.30 N 4.0 Trash Receptacles 4.1 Fullness 83% N 0% N 4.2 Cleanliness of trash receptacles 71% N 0% N 4.3 Cleanliness around trash receptacles 83% N 0% N 4.4 Painting 100% Y 0% N 4.5 Structural integrity & function 88% N 0% N 4.6 Doors 100% Y 0% N Final Rating (5 out of 6) N N 5.0 Trees and Landscaping 5.1 Cleanliness 63% N 100% Y 5.2 Tree Appearance 97% Y 88% N 5.3 Weediness 63% N 50% N 5.4 Clearance 95% Y 88% N District 5 Inspection Avg. Commercial Standard Met? (Y/N) Inspection Avg. Residential Standard Met? (Y/N) Criteria/feature 1.0 Street Cleanliness 1.1 Score (1.0, 2.0, or 3.0) 1.43 Y 1.47 Y 2.0 Sidewalk Cleanliness 2.1 Litter (1.0, 2.0, or 3.0) 1.73 Y 1.47 Y 2.2 Grime, Leaks, Spills (% of sidewalk) 2.1% Y 3.5% Y 2.3 Graffiti (# on sidewalk) 0.03 N 0.07 N 2.4 Illegal Dumping (Y/N) N N Y Y 2.5 Feces, Needles, Glass, Condoms (Y/N) N N N N 3.0 Graffiti 3.1 DPW public property 0.20 N 2.40 N 3.2 Non-DPW public property 0.20 N 1.50 N 3.3 Private property 0.50 N 1.60 N 4.0 Trash Receptacles 4.1 Fullness 100% Y 100% Y 4.2 Cleanliness of trash receptacles 100% Y 100% Y 4.3 Cleanliness around trash receptacles 90% Y 100% Y 4.4 Painting 100% Y 100% Y 4.5 Structural integrity & function 100% Y 100% Y 4.6 Doors 100% Y 100% Y Final Rating (5 out of 6) Y Y 5.0 Trees and Landscaping 5.1 Cleanliness 64% N 80% N 5.2 Tree Appearance 97% Y 91% Y 5.3 Weediness 87% N 76% N 5.4 Clearance 95% Y 96% Y Controller s Office G-3
74 CSA INSPECTION RESULTS BY DISTRICT (CONT D) District 6 Commercial Residential Inspection Avg. Standard Met? (Y/N) Inspection Avg. Standard Met? (Y/N) Criteria/feature 1.0 Street Cleanliness 1.1 Score (1.0, 2.0, or 3.0) 1.42 Y 1.55 Y 2.0 Sidewalk Cleanliness 2.1 Litter (1.0, 2.0, or 3.0) 1.95 Y 1.83 Y 2.2 Grime, Leaks, Spills (% of sidewalk) 0.0% Y 0.0% Y 2.3 Graffiti (# on sidewalk) 1.06 N 0.30 N 2.4 Illegal Dumping (Y/N) N N Y Y 2.5 Feces, Needles, Glass, Condoms (Y/N) N N N N 3.0 Graffiti 3.1 DPW public property 1.88 N 0.00 Y 3.2 Non-DPW public property 8.38 N 8.20 N 3.3 Private property 7.25 N 4.60 N 4.0 Trash Receptacles 4.1 Fullness 100% Y 50% N 4.2 Cleanliness of trash receptacles 90% Y 50% N 4.3 Cleanliness around trash receptacles 100% Y 50% N 4.4 Painting 100% Y 50% N 4.5 Structural integrity & function 70% N 50% N 4.6 Doors 50% N 50% N Final Rating (5 out of 6) N N 5.0 Trees and Landscaping 5.1 Cleanliness 40% N 54% N 5.2 Tree Appearance 100% Y 98% Y 5.3 Weediness 100% Y 73% N 5.4 Clearance 100% Y 96% Y District 7 Inspection Avg. Commercial Standard Met? (Y/N) Inspection Avg. Residential Standard Met? (Y/N) Criteria/feature 1.0 Street Cleanliness 1.1 Score (1.0, 2.0, or 3.0) 1.92 Y 1.44 Y 2.0 Sidewalk Cleanliness 2.1 Litter (1.0, 2.0, or 3.0) 2.33 N 1.12 Y 2.2 Grime, Leaks, Spills (% of sidewalk) 0.1% Y 0.0% Y 2.3 Graffiti (# on sidewalk) 0.11 N 0.33 N 2.4 Illegal Dumping (Y/N) Y Y Y Y 2.5 Feces, Needles, Glass, Condoms (Y/N) N N Y Y 3.0 Graffiti 3.1 DPW public property 0.60 N 0.00 Y 3.2 Non-DPW public property N 2.00 N 3.3 Private property 4.87 N 0.00 Y 4.0 Trash Receptacles 4.1 Fullness 100% Y 0% N 4.2 Cleanliness of trash receptacles 100% Y 0% N 4.3 Cleanliness around trash receptacles 33% N 0% N 4.4 Painting 50% N 0% N 4.5 Structural integrity & function 75% N 0% N 4.6 Doors 83% N 0% N Final Rating (5 out of 6) N N 5.0 Trees and Landscaping 5.1 Cleanliness 30% N 49% N 5.2 Tree Appearance 93% Y 50% N 5.3 Weediness 45% N 50% N 5.4 Clearance 85% N 43% N G-4 Controller s Office
75 CSA INSPECTION RESULTS BY DISTRICT (CONT D) District 8 Criteria/feature Inspection Avg. Commercial Standard Met? (Y/N) Inspection Avg. Residential Standard Met? (Y/N) 1.0 Street Cleanliness 1.1 Score (1.0, 2.0, or 3.0) 1.63 Y 1.44 Y 2.0 Sidewalk Cleanliness 2.1 Litter (1.0, 2.0, or 3.0) 1.63 Y 1.41 Y 2.2 Grime, Leaks, Spills (% of sidewalk) 1.1% Y 0.5% Y 2.3 Graffiti (# on sidewalk) 0.10 N 0.89 N 2.4 Illegal Dumping (Y/N) Y Y Y Y 2.5 Feces, Needles, Glass, Condoms (Y/N) N N N N 3.0 Graffiti 3.1 DPW public property 1.15 N 0.30 N 3.2 Non-DPW public property 1.20 N 0.60 N 3.3 Private property 0.75 N 0.40 N 4.0 Trash Receptacles 4.1 Fullness 94% Y 50% N 4.2 Cleanliness of trash receptacles 100% Y 50% N 4.3 Cleanliness around trash receptacles 88% N 100% Y 4.4 Painting 89% N 50% N 4.5 Structural integrity & function 100% Y 50% N 4.6 Doors 65% N 70% N Final Rating (5 out of 6) N N 5.0 Trees and Landscaping 5.1 Cleanliness 94% Y 78% N 5.2 Tree Appearance 99% Y 98% Y 5.3 Weediness 89% N 71% N 5.4 Clearance 95% Y 92% Y District 9 Criteria/feature Inspection Avg. Commercial Standard Met? (Y/N) Inspection Avg. Residential Standard Met? (Y/N) 1.0 Street Cleanliness 1.1 Score (1.0, 2.0, or 3.0) 1.98 Y 2.03 N 2.0 Sidewalk Cleanliness 2.1 Litter (1.0, 2.0, or 3.0) 1.92 Y 2.00 N 2.2 Grime, Leaks, Spills (% of sidewalk) 16.4% N 8.3% Y 2.3 Graffiti (# on sidewalk) 0.59 N 0.08 N 2.4 Illegal Dumping (Y/N) N N N N 2.5 Feces, Needles, Glass, Condoms (Y/N) N N N N 3.0 Graffiti 3.1 DPW public property 3.50 N 1.40 N 3.2 Non-DPW public property 3.75 N 0.10 N 3.3 Private property N 0.90 N 4.0 Trash Receptacles 4.1 Fullness 44% N 0% N 4.2 Cleanliness of trash receptacles 38% N 0% N 4.3 Cleanliness around trash receptacles 19% N 0% N 4.4 Painting 50% N 0% N 4.5 Structural integrity & function 50% N 0% N 4.6 Doors 50% N 0% N Final Rating (5 out of 6) N N 5.0 Trees and Landscaping 5.1 Cleanliness 31% N 26% N 5.2 Tree Appearance 100% Y 94% Y 5.3 Weediness 76% N 50% N 5.4 Clearance 100% Y 100% Y Controller s Office G-5
76 CSA INSPECTION RESULTS BY DISTRICT (CONT D) District 10 Criteria/feature Inspection Avg. Commercial Standard Met? (Y/N) Inspection Avg. Residential Standard Met? (Y/N) 1.0 Street Cleanliness 1.1 Score (1.0, 2.0, or 3.0) 1.83 Y 1.72 Y 2.0 Sidewalk Cleanliness 2.1 Litter (1.0, 2.0, or 3.0) 2.02 N 2.03 N 2.2 Grime, Leaks, Spills (% of sidewalk) 4.5% Y 1.0% Y 2.3 Graffiti (# on sidewalk) 0.21 N 0.25 N 2.4 Illegal Dumping (Y/N) N N N N 2.5 Feces, Needles, Glass, Condoms (Y/N) N N N N 3.0 Graffiti 3.1 DPW public property 0.00 Y 5.00 N 3.2 Non-DPW public property 2.75 N 3.50 N 3.3 Private property 4.46 N 2.20 N 4.0 Trash Receptacles 4.1 Fullness 100% Y 50% N 4.2 Cleanliness of trash receptacles 100% Y 50% N 4.3 Cleanliness around trash receptacles 100% Y 50% N 4.4 Painting 100% Y 50% N 4.5 Structural integrity & function 100% Y 50% N 4.6 Doors 100% Y 50% N Final Rating (5 out of 6) Y N 5.0 Trees and Landscaping 5.1 Cleanliness 51% N 36% N 5.2 Tree Appearance 92% Y 85% N 5.3 Weediness 72% N 29% N 5.4 Clearance 97% Y 95% Y District 11 Inspection Avg. Commercial Standard Met? (Y/N) Inspection Avg. Residential Standard Met? (Y/N) Criteria/feature 1.0 Street Cleanliness 1.1 Score (1.0, 2.0, or 3.0) 2.08 N 1.78 Y 2.0 Sidewalk Cleanliness 2.1 Litter (1.0, 2.0, or 3.0) 1.90 Y 1.87 Y 2.2 Grime, Leaks, Spills (% of sidewalk) 4.0% Y 4.3% Y 2.3 Graffiti (# on sidewalk) 0.50 N 0.37 N 2.4 Illegal Dumping (Y/N) N N N N 2.5 Feces, Needles, Glass, Condoms (Y/N) N N N N 3.0 Graffiti 3.1 DPW public property 0.13 N 0.25 N 3.2 Non-DPW public property 2.88 N 3.00 N 3.3 Private property 2.75 N 2.48 N 4.0 Trash Receptacles 4.1 Fullness 75% N 0% N 4.2 Cleanliness of trash receptacles 75% N 0% N 4.3 Cleanliness around trash receptacles 50% N 0% N 4.4 Painting 100% Y 0% N 4.5 Structural integrity & function 100% Y 0% N 4.6 Doors 100% Y 0% N Final Rating (5 out of 6) N N 5.0 Trees and Landscaping 5.1 Cleanliness 33% N 98% Y 5.2 Tree Appearance 92% Y 100% Y 5.3 Weediness 42% N 100% Y 5.4 Clearance 100% Y 98% Y G-6 Controller s Office

77 APPENDIX H: LOCATION OF COMMUNITY PARTNERSHIP CORRIDORS Controller s Office H-1
78 Page intentionally left blank. H-2 Controller s Office

79 APPENDIX I: DPW DEPARTMENT RESPONSE Controller s Office I-1
Individual Park Evaluation Summary by Region
 10TH AVENUE/CLEMENT MINI PARK PSA1 Mini Park CON 74.29 % 2/11/2014 PSA1 Mini Park REC 91.43 % 2/11/2014 24TH STREET/YORK MINI PARK PSA6 Mini Park REC 100.00 % 3/7/2014 ADAM ROGERS PARK PSA3 Neighborhood
Individual Park Evaluation Summary by Region
 10TH AVENUE/CLEMENT MINI PARK PSA1 Mini Park REC 97.14 % 12/3/2013 24TH STREET/YORK MINI PARK PSA6 Mini Park REC 100.00 % 12/5/2013 ADAM ROGERS PARK PSA3 Neighborhood Park or Playground REC 87.01 % 12/5/2013
Individual Park Evaluation Summary by Region
 10TH AVENUE/CLEMENT MINI PARK PSA1 Mini Park CON 82.86 % 3/5/2013 PSA1 Mini Park REC 94.29 % 3/11/2013 24TH STREET/YORK MINI PARK PSA6 Mini Park CON 96.97 % 3/13/2013 PSA6 Mini Park REC 97.06 % 3/15/2013
City and County of San Francisco
 City and County of San Francisco Office of the Controller City Services Auditor PARK STANDARDS 6-MONTH REPORT FY Park scores citywide increased through the first half of FY March 16, 2010 TROLLER S OFFICE
2000 Neighborhood Park Improvement Bond
 2000 Neighborhood Park Improvement Bond QUARTERLY STATUS REPORT PRESENTED TO THE Citizens General Obligation Bond Oversight Committee April 2018 PREPARED BY Antonio Guerra, Capital Finance Manager 415
2000 Neighborhood Park Improvement Bond
 2000 Neighborhood Park Improvement Bond QUARTERLY STATUS REPORT PRESENTED TO THE Citizens General Obligation Bond Oversight Committee As of April 2015 Minnie and Lovie Ward Rec Center - Children s Play
2000 Neighborhood Park Improvement Bond
 2000 Neighborhood Park Improvement Bond QUARTERLY STATUS REPORT PRESENTED TO THE Citizens General Obligation Bond Oversight Committee July 2014 Mission Dolores Playground Hamilton Pool Hamilton Pool Palace
Summary of a Survey of Childcare Providers Who Use City Park and Recreation Sites
 Summary of a Survey of Childcare Providers Who Use City Park and Recreation Sites During the summer of 2003, the San Francisco Childhood Lead Prevention Program sent a survey to 733 family childcare and
Inspire, Connect, Play EQUITY METRICS
 Inspire, Connect, Play EQUITY METRICS Operations Committee Recreation and Park Commission September 1, 2016 Charter Sec. 16.107(4)(h)(1) Equity Metrics The department shall develop a set of equity metrics
Inspire, Connect, Play EQUITY METRICS. Building a New Lens
 Inspire, Connect, Play EQUITY METRICS Building a New Lens SPUR October 11, 2016 Our Strategies Inspire Public Space Inspire Play Inspire Investment Inspire Stewardship Inspire Our Team 40.5% Water
2000 Neighborhood Park Improvement Bond Quarterly Report To the General Obligation Bond Oversight Committee October 2010
 2000 Neighborhood Park Improvement Bond Quarterly Report To the General Obligation Bond Oversight Committee October 2010 Hamilton Recreation Center Hamilton Pool Hamilton Playground Sunnyside Conservatory
Park Maintenance Standards Annual Report 2017
 Park Maintenance Standards Annual Report 2017 Hilltop Park Annual Report Park Maintenance Standards 2017 December 5, 2017 CITY PERFORMANCE City & County of San Francisco Office of the Controller City Services
An assessment of the recreation element is necessary to determine its condition relative to the 2010 ADA Standard. Name Activity Status
 San Francisco Recreation and Parks Site List for RFP Analysis RPD Capital Project Site Active Capital Projects Bond Reports (Historical information) Key to Status http://sfrecpark.org/park-improvements/
2000 Neighborhood Park Improvement Bond Quarterly Report To the General Obligation Bond Oversight Committee June 30, 2010
 2000 Neighborhood Park Improvement Bond Quarterly Report To the General Obligation Bond Oversight Committee June 30, 2010 Hamilton Recreation Center Hamilton Pool Hamilton Playground Sunnyside Conservatory
Failing Playgrounds Task Force Final Report
 Failing s Task Force Final Report 2012 San Francisco Clean & Safe Neighborhood Parks Bond December 18, 2014 In partnership with Acknowledgements The San Francisco Recreation and Park Department would like
City and County of San Francisco
 City and County of San Francisco Office of the Controller City Services Auditor RECREATION AND PARK DEPARTMENT: Concession Audit of Stow Lake Corporation March 3, 2009 CONTROLLER S OFFICE CITY SERVICES
City and County of San Francisco
 City and County of San Francisco Office of the Controller City Services Auditor AIRPORT COMMISSION: Asiana Airlines Paid All Landing Fees Due but Incurred $12,846 in Late Charges for 2010 Through 2012
RPD CAPITAL IMPROVEMENT MONTHLY EXPENDITURE REPORT FAMIS FUNDING SOURCES
 NPSF UA Bond Issuance Cost CRPNPBBC00 605,314-531,700-73,614 - - 605,314 - - - - - #VALUE! - BOND ISSUANCE COST Total Subtotal 605,314-531,700-73,614 - - 605,314 - - - - - #VALUE! - NPSF 1 GGP - Stanyan
PLANNING & CAPITAL DIVISION PROGRAM MANAGEMENT REPORT CAPITAL IMPROVEMENT PLAN
 PLANNING & CAPITAL DIVISION PROGRAM MANAGEMENT REPORT CAPITAL IMPROVEMENT PLAN FUNDED BY: PROPOSITION B 2012 SF CLEAN AND SAFE NEIGHBORHOOD PARKS BOND PROPOSITION A 2008 CLEAN AND SAFE NEIGHBORHOOD PARKS
PROGRAM STATUS REPORT
 PROGRAM STATUS REPORT CAPITAL PROGRAM STATUS DATE A $,02. Million Capital Improvement Program April 30, 206 RECREATION AND PARK DEPARTMENT CAPITAL PROGRAM MANAGER Dawn Kamalanathan BACKGROUND In March
CAPITAL IMPROVEMENT DIVISION PROGRAM MANAGEMENT REPORT CAPITAL IMPROVEMENT PLAN
 CAPITAL IMPROVEMENT DIVISION PROGRAM MANAGEMENT REPORT CAPITAL IMPROVEMENT PLAN FUNDED BY: PROPOSITION A 2000 NEIGHBORHOOD PARK BOND PROPOSITION C OPEN SPACE FUND STATE AND FEDERAL GRANTS PHILANTHROPIC
City of Durango 5.8 FUNDING TRAILS DEVELOPMENT
 5.8 FUNDING TRAILS DEVELOPMENT The City has been successful in establishing dedicated local funding sources as well as applying for grants to develop the City s trail system, having received nearly $2.4
2012 CLEAN & SAFE NEIGHBORHOOD PARKS BOND Request 3 rd 2012 Sale. Capital Planning Committee November 13, 2017
 2012 CLEAN & SAFE NEIGHBORHOOD PARKS BOND Request 3 rd 2012 Sale Capital Planning Committee November 13, 2017 CLEAN & SAFE NEIGHBORHOOD PARKS BOND Presentation Structure: - Update on Waterfront Parks component
Playground Report Card
 2012 eport ard Helen iller at olores Park, Opening ay on March 31, 2012 prepared by The eport ard: Project of the Initiative uboce Park s new Youth Play rea Every two years SP and P survey public playgrounds
YARTS ON-BOARD SURVEY MEMORANDUM
 YARTS ON-BOARD SURVEY MEMORANDUM Prepared for the Yosemite Area Regional Transportation System Prepared by LSC Transportation Consultants, Inc. This page left intentionally blank. YARTS On-Board Survey
MORGAN CREEK GREENWAY Final Report APPENDICES
 APPENDICES MORGAN CREEK GREENWAY Appendix A Photos of Existing Conditions in Trail Corridor Photos of existing conditions Main trail corridor - February 2009 Photos of existing conditions south bank Morgan
FINAL REPORT OF THE USOAP CMA AUDIT OF THE CIVIL AVIATION SYSTEM OF THE KINGDOM OF NORWAY
 ICAO UNIVERSAL SAFETY OVERSIGHT AUDIT PROGRAMME (USOAP) Continuous Monitoring Approach (CMA) FINAL REPORT OF THE USOAP CMA AUDIT OF THE CIVIL AVIATION SYSTEM OF THE KINGDOM OF NORWAY (16 to 20 November
Official Journal of the European Union L 7/3
 12.1.2010 Official Journal of the European Union L 7/3 COMMISSION REGULATION (EU) No 18/2010 of 8 January 2010 amending Regulation (EC) No 300/2008 of the European Parliament and of the Council as far
PIONEER PARK. City of Des Peres Parks Master Plan. SWT Design 46 INTRODUCTION
 PIONEER PARK INTRODUCTION Pioneer Park is a 7 acre neighborhood park located east of Interstate 270 and south of Manchester Road along Tallie Road. The park is situated in a residential neighborhood with
REPORT 2014/065 INTERNAL AUDIT DIVISION. Audit of air operations in the United. Nations Assistance Mission in Afghanistan
 INTERNAL AUDIT DIVISION REPORT 2014/065 Audit of air operations in the United Nations Assistance Mission in Afghanistan Overall results relating to the effective management of air operations in the United
2013 Business & Legislative Session Visitor Satisfaction Survey Results
 2013 Business & Legislative Session Visitor Satisfaction Survey Results Completed by Juneau Economic Development Council in partnership with The Alaska Committee August 2013 JEDC research efforts are supported
Executive Summary Downtown Park Fund Allocation HEARING DATE: MAY 5, 2016
 Executive Summary Downtown Park Fund Allocation HEARING DATE: MAY 5, 2016 Date: April 28, 2016 Case No.: 2016 004634CWP Project Name: Allocation of $4,000,000 from the Downtown Park Fund for the Renovation
Recreation and Park Commission, Capital Committee
 DATE: March 7, 2018 TO: THRU: FROM: RE: Recreation and Park Commission, Capital Committee Philip A. Ginsburg, General Manager Lisa Bransten, Director of Partnerships New Park at Francisco Reservoir Park
SAMTRANS TITLE VI STANDARDS AND POLICIES
 SAMTRANS TITLE VI STANDARDS AND POLICIES Adopted March 13, 2013 Federal Title VI requirements of the Civil Rights Act of 1964 were recently updated by the Federal Transit Administration (FTA) and now require
City of LA Valley Glen - North Sherman Oaks STUDY AREA PROFILE
 City of LA Valley Glen - North Sherman Oaks STUDY AREA PROFILE STUDY AREA ID #61 BASE MAP PARK METRICS WHERE ARE PARKS MOST NEEDED AMENITY QUANTITIES AND CONDITIONS PARK NEEDS FRAMEWORK PROJECT COST ESTIMATES
CHAPTER FOUR: PERCEIVED CONDITION AND COMFORT
 CHAPTER FOUR: PERCEIVED CONDITION AND COMFORT In order to see how Riverside Park could become a greater asset to the community, it is necessary to investigate and understand the community s perception
SAN FRANCISCO PARK EVALUATION PROGRAM EVALUATION FORM
 SAN FRANCISCO PARK EVALUATION PROGRAM EVALUATION FORM Generic evaluation form August 3, 2016 List of Features Athletic Fields Buildings & General Amenities Children s Play Areas Dog Play Areas Greenspace
Aviation Operating Administration/Executive
 Aviation Operating Administration/Executive To provide the executive and administrative support necessary to the Divisions within the Aviation Department to ensure continued efficiencies, effectiveness,
PREFACE. Service frequency; Hours of service; Service coverage; Passenger loading; Reliability, and Transit vs. auto travel time.
 PREFACE The Florida Department of Transportation (FDOT) has embarked upon a statewide evaluation of transit system performance. The outcome of this evaluation is a benchmark of transit performance that
Classifications, Inventory and Level of Service
 Classifications, Inventory and Level of Service Section 3 Kenmore Park, Recreation and Open Space Plan 1 P a g e Classifications and Inventory Park Classifications Kenmore classifies its parks based upon
City and County of San Francisco
 City and County of San Francisco Office of the Controller City Services Auditor AIRPORT COMMISSION: Administration of the SFO Shuttle Bus Company Contract Needs to Be Significantly Improved October 25,
INTERNAL AUDIT DIVISION REPORT 2017/051. Audit of the aviation safety programme in the African Union-United Nations Hybrid Operation in Darfur
 INTERNAL AUDIT DIVISION REPORT 2017/051 Audit of the aviation safety programme in the African Union-United Nations Hybrid Operation in Darfur There was a need to effectively address issues identified and
Trail # NW Tuesday, June DESIGN. Provide an Review the Provide an. Project Goals: System system. wayfinding
 I. Welcome / Introductions Bethany Creek Trail #2 Segment 3 Neighborhood Meeting #1 Bethany Presbyterian Church 15505 NW Springville Road, Portland, OR 97229 Tuesday, June 26, 2018 @ 6:00PM Meeting Minutes
San Francisco. Activities Resource List. For Ages 0-5 YEARS
 Activities Resource List For Ages 0-5 YEARS Prepared by: Child Care Health Project 30 Van Ness Avenue, Suite 260 CA 94102 1-800 - 300-9950 SEPTEMBER 2011 TABLE OF CONTENTS Parks, s and Movement Activities
COMMISSION IMPLEMENTING REGULATION (EU)
") 18.10.2011 Official Journal of the European Union L 271/15 COMMISSION IMPLEMENTING REGULATION (EU) No 1034/2011 of 17 October 2011 on safety oversight in air traffic management and air navigation services
18.10.2011 Official Journal of the European Union L 271/15 COMMISSION IMPLEMENTING REGULATION (EU) No 1034/2011 of 17 October 2011 on safety oversight in air traffic management and air navigation services
Chapter 3. Burke & Company
 Chapter 3 Burke & Company 3. WRTA RIDERSHIP AND RIDERSHIP TRENDS 3.1 Service Overview The Worcester Regional Transit Authority (WRTA) provides transit service to over half a million people. The service
SAN FRANCISCO MUNICIPAL TRANSPORTATION AGENCY
 THIS PRINT COVERS CALENDAR ITEM NO. : 10.2 DIVISION: Sustainable Streets BRIEF DESCRIPTION: SAN FRANCISCO MUNICIPAL TRANSPORTATION AGENCY Amending Transportation Code, Division II to prohibit parking on
REPORT 2014/111 INTERNAL AUDIT DIVISION. Audit of air operations in the United Nations Operation in Côte d Ivoire
 INTERNAL AUDIT DIVISION REPORT 2014/111 Audit of air operations in the United Nations Operation in Côte d Ivoire Overall results relating to the effective management of air operations in the United Nations
Madison Metro Transit System
 Madison Metro Transit System 1101 East Washington Avenue Madison, Wisconsin, 53703 Administrative Office: 608 266 4904 Fax: 608 267 8778 TO: FROM: SUBJECT: Plan Commission Timothy Sobota, Transit Planner,
Chapter 1 Introduction and Project Overview
 Chapter 1 Introduction and Project Overview Kittitas County in cooperation with the Federal Aviation Administration (FAA) is updating the Airport Master Plan for Bowers Field Airport (FAA airport identifier
COMMISSION OF THE EUROPEAN COMMUNITIES. Draft. COMMISSION REGULATION (EU) No /2010
 No /2010") COMMISSION OF THE EUROPEAN COMMUNITIES Brussels, XXX Draft COMMISSION REGULATION (EU) No /2010 of [ ] on safety oversight in air traffic management and air navigation services (Text with EEA relevance)
COMMISSION OF THE EUROPEAN COMMUNITIES Brussels, XXX Draft COMMISSION REGULATION (EU) No /2010 of [ ] on safety oversight in air traffic management and air navigation services (Text with EEA relevance)
Nova Southeastern University Joint-Use Library Agreement: Review of Public Usage
 Exhibit 1 Nova Southeastern University Joint-Use Library Agreement: Robert Melton, CPA, CIA, CFE, CIG County Auditor Audit Conducted by: Gerard Boucaud, CISA, Audit Manager Dirk Hansen, CPA, Audit Supervisor
Air Operator Certification
 Civil Aviation Rules Part 119, Amendment 15 Docket 8/CAR/1 Contents Rule objective... 4 Extent of consultation Safety Management project... 4 Summary of submissions... 5 Extent of consultation Maintenance
Aviation Operating Administration/Executive
 Administration/Executive To provide the executive and administrative support necessary to the Divisions within the Aviation Department to ensure continued efficiencies, effectiveness, and compliance with
National Passenger Survey Spring putting rail passengers first
 National Passenger Survey putting rail passengers first What is Passenger Focus? Passenger Focus is the independent national rail consumer watchdog. Our mission is to get the best deal for Britain s rail
Area Surrounding Maplewood Manor
 BAY CITY, MICHIGAN HOUSING COMMISSION Neighborhood Revitalization Plan Area Surrounding Maplewood Manor January 13, 2014 CITY COMMISSION DRAFT PLAN PRESENTATION BAY CITY, MICHIGAN 1 Planners Phil McKenna,
POLICY & STRATEGIES The Vancouver Park Board approves major changes in Vancouver parks, including the design and development of parks.
 September 8, 2017 TO: Park Board Chair and Commissioners FROM: General Manager Vancouver Board of Parks and Recreation SUBJECT: Brewers Park and Clinton Park Renewal Concept Plans RECOMMENDATION THAT the
City of Culver City Courtesy Notification
 City of Culver City Courtesy Notification Continued Discussion of the Permit-Only Restrictions on the 10700 Block of Farragut Drive, and Grace Evangelical Lutheran Church s Request to Change the Existing
Project Progress Report #1
 Project Progress Report #1 As of February 28, 2002 Sam M. McCall, CPA, CIA, CGFM City Auditor AirTran Transportation Services Agreement Report #0214 April 9, 2002 Summary On September 12, 2001, the City
Fixed-Route Operational and Financial Review
 Chapter II CHAPTER II Fixed-Route Operational and Financial Review Chapter II presents an overview of route operations and financial information for KeyLine Transit. This information will be used to develop
REVIEW OF THE STATE EXECUTIVE AIRCRAFT POOL
 STATE OF FLORIDA Report No. 95-05 James L. Carpenter Interim Director Office of Program Policy Analysis And Government Accountability September 14, 1995 REVIEW OF THE STATE EXECUTIVE AIRCRAFT POOL PURPOSE
March 4, Mr. H. Dale Hemmerdinger Chairman Metropolitan Transportation Authority 347 Madison Avenue New York, NY Re: Report 2007-F-31
 THOMAS P. DiNAPOLI STATE COMPTROLLER 110 STATE STREET ALBANY, NEW YORK 12236 STATE OF NEW YORK OFFICE OF THE STATE COMPTROLLER March 4, 2008 Mr. H. Dale Hemmerdinger Chairman Metropolitan Transportation
CHAPTER 5. Chapter 5 Recreation Element
 CHAPTER 5 Recreation Element Chapter 5 Recreation Element The Recreation Element of the Meyers Area Plan is a supplement to the Recreation Element of the TRPA Regional Plan and the El Dorado County General
INTERNATIONAL INSTITUTE FOR DEMOCRACY AND ELECTORAL ASSISTANCE
 INTERNATIONAL INSTITUTE FOR DEMOCRACY AND ELECTORAL ASSISTANCE TERMS OF REFERENCE 1. Background The International Institute of Democracy IDEA seeks proposals from qualified firms to provide consolidated
TRUCKEE TAHOE AIRPORT DISTRICT BOARD OF DIRECTOR STAFF REPORT
 AGENDA ITEM: 11 TRUCKEE TAHOE AIRPORT DISTRICT BOARD OF DIRECTOR STAFF REPORT AGENDA TITLE: MEETING DATE: January 24, 2018 PREPARED BY: NTPUD Agency Partnership Opportunity, Multi-Use Trailhead Access
OFFICE OF THE AUDITOR
 OFFICE OF THE AUDITOR DEPARTMENT OF AVIATION (FORMERLY AMERICAN TRANS AIR, INC.) REVENUE AND CONTRACT COMPLIANCE AUDIT JUNE 2006 Dennis J. Gallagher Auditor Dennis J. Gallagher Auditor City and County
WELCOME TO YOUR REGIONAL AIRPORT AUTHORITY MEETING OF THE CITY OF MERCED AGENDA
 WELCOME TO YOUR REGIONAL AIRPORT AUTHORITY MEETING OF THE CITY OF MERCED AUTHORITY MEMBERS Larry Morelock-Chair, Alvin Osborn-Vice-Chair, John Sundgren, Rodrigo Flores, Ryan Smith, and Michael Bodine.
RESOLUTION NO
 RESOLUTION NO. 2015-15 A RESOLUTION OF THE CITY COUNCIL OF THE CITY OF MARINA AUTHORIZING SUBMISSION OF A GRANT APPLICATION TO THE FEDERAL AVIATION ADMINISTRATION (FAA) FOR PARTICIPATION IN THE 2015 MILITARY
APPENDIX C: PARK AND FACILITY SCORECARDS
 APPENDI C: PARK AND FACILITY SCORECARDS 127 SCORECARD OVERVIEW Elmhurst Park District park lands and facilities are beloved and visible assets of the community. There are over 20 public park spaces within
Parks and Recreation Master Plan
 Emerging Themes Parks and Recreation Master Plan City of Mount Dora, Florida September 17, 2018- Revised October 1, 2018 Agenda Welcome & duction Master Plan The Inventory & Existing Community Overview
Community Input Meeting. Fairgrounds Master Planning Update. January 7, 2016, 7 pm
 Community Input Meeting Fairgrounds Master Planning Update January 7, 2016, 7 pm Fiesta Hall Santa Clara County Fairgrounds 355 Tully Road, San Jose, CA Tonight s Agenda 1) Board of Supervisors Direction
Financing Pier 70 Waterfront District Development Plan upon Board of Supervisors Approval
 Financing Pier 70 Waterfront District Development Plan upon Board of Supervisors Approval D Proposition D Shall the City provide funds to develop Pier 70, based on new City hotel and payroll expense tax
Unincorporated Quartz Hill -Lancaster- Palmdale STUDY AREA PROFILE
 Unincorporated Quartz Hill -Lancaster- Palmdale STUDY AREA PROFILE STUDY AREA ID #19 BASE MAP PARK METRICS WHERE ARE PARKS MOST NEEDED AMENITY QUANTITIES AND CONDITIONS PARK NEEDS FRAMEWORK PROJECT COST
Quarterly Performance Measurement Report
 Quarterly Performance Measurement Report Department: Aviation Section: Administration/Executive To provide the executive and administrative support necessary to the Divisions within the Aviation Department
1.0 BACKGROUND NEW VETERANS CHARTER EVALUATION OBJECTIVES STUDY APPROACH EVALUATION LIMITATIONS... 7
 New Veterans Charter Evaluation Plan TABLE CONTENTS Page 1.0 BACKGROUND... 1 2.0 NEW VETERANS CHARTER EVALUATION OBJECTIVES... 2 3.0 STUDY APPROACH... 3 4.0 EVALUATION LIMITATIONS... 7 5.0 FUTURE PROJECTS...
3.0 LEARNING FROM CHATHAM-KENT S CITIZENS
 3.0 LEARNING FROM CHATHAM-KENT S CITIZENS An important aspect in developing the Chatham-Kent Trails Master Plan was to obtain input from stakeholders and the general public. Throughout the course of the
2017 Citizen Satisfaction Survey
 2017 Citizen Satisfaction Survey CITY OF BRAMPTON TOPLINE SUMMARY SEPTEMBER 14, 2017 CITY OF BRAMPTON 2017 CITIZEN SATISFACTION SURVEY REPORT INTRODUCTION AND METHODOLOGY The City of Brampton commissioned
All Door Boarding Title VI Service Fare Analysis. Appendix P.3
 All Door Boarding Title VI Service Fare Analysis Appendix P.3 Metro Board Report Los Angeles County Metropolitan Transportation Authority One Gateway Plaza 3rd Floor Board Room Los Angeles,
COMMONWEALTH PORTS AUTHORITY
 REPORT ON COMPLIANCE AND INTERNAL CONTROL OVER COMPLIANCE WITH REQUIREMENTS APPLICABLE TO THE PASSENGER FACILITY CHARGE PROGRAM YEAR ENDED SEPTEMBER 30, 2015 Deloitte & Touche LLC P.O. Box 500308 Saipan,
DISTRICT 5 PARKS AND OPEN SPACE
 DISTRICT 5 PARKS AND OPEN SPACE District 5 is close to being the geographic center of San Francisco. Although it is far from rectangular, it stretches west to 19 th Avenue on the east to Van Ness, north
PARKING CAPACITY REQUIREMENTS
 PARKING CAPACITY REQUIREMENTS Presented to: Antaramian Development Corporation 365 5 th Avenue South Naples, Florida 34102 CONTENTS Page INTRODUCTION... 1 BACKGROUND... 2 EXISTING PARKING CONDITIONS...
Welcome to the future of Terwillegar Park a Unique Natural Park
 Welcome to the future of Terwillegar Park a Unique Natural Park 1 Introduction The Terwillegar Park Concept Plan study will develop an overall concept plan, management objectives and development guidelines
JUNEAU BUSINESS VISITOR SATISFACTION SURVEY RESULTS
 2018 JUNEAU BUSINESS VISITOR SATISFACTION SURVEY RESULTS Completed by the Juneau Economic Development Council in partnership with the Alaska Committee. JEDC research efforts are supported by core funding
NORTHWEST SECTION CONTENTS: CLEVELAND PARK FOLWELL PARK RYAN LAKE PARK VICTORY PRAIRIE DOG PARK VICTORY PARK
 NORTHWEST SECTION CONTENTS: CLEVELAND PARK FOLWELL PARK RYAN LAKE PARK VICTORY PRAIRIE DOG PARK VICTORY PARK LUCY LANEY COMMUNITY SCHOOL N 33RD AVE N 33RD AVE SINGLE-FAMILY RESIDENTIAL MULTI-USE DIAMOND
R E SEARCH HIGHLIGHTS
 Canada Research Chair in Urban Change and Adaptation R E SEARCH HIGHLIGHTS Research Highlight No. 12 June 2007 LOCATION OF PANHANDLING ACTIVITY IN WINNIPEG Introduction Panhandling activity in Winnipeg
Sevierville, TN. Technical Appendices
 Sevierville, TN Technical Appendices 2017 2955 Valmont Road Suite 300 777 North Capitol Street NE Suite 500 Boulder, Colorado 80301 Washington, DC 20002 n-r-c.com 303-444-7863 icma.org 800-745-8780 Contents
City of Sierra Madre STUDY AREA PROFILE
 City of Madre STUDY AREA PROFILE STUDY AREA ID #112 BASE MAP PARK METRICS WHERE ARE PARKS MOST NEEDED AMENITY QUANTITIES AND CONDITIONS PARK NEEDS FRAMEWORK PROJECT COST ESTIMATES PROJECT REPORTING FORM
RIVER ACCESS STRATEGY
 RIVER ACCESS STRATEGY The River Access Strategy is a 10-year plan the City of Edmonton is developing to inform future programming, operations and infrastructure improvements that support access to the
APPENDIX B. Arlington Transit Peer Review Technical Memorandum
 APPENDIX B Arlington Transit Peer Review Technical Memorandum Arlington County Appendix B December 2010 Table of Contents 1.0 OVERVIEW OF PEER ANALYSIS PROCESS... 2 1.1 National Transit Database...2 1.2
Office of Program Policy Analysis And Government Accountability
 THE FLORIDA LEGISLATURE Report No. 98-70 Office of Program Policy Analysis And Government Accountability John W. Turcotte, Director February 1999 Preliminary Review of the Suspension of the State Contract
Juneau Household Waterfront Opinion Survey
 Juneau Household Waterfront Opinion Survey Prepared for: City and Borough of Juneau Prepared by: April 13, 2004 TABLE OF CONTENTS Executive Summary...1 Introduction and Methodology...6 Survey Results...7
City of Signal Hill STUDY AREA PROFILE
 City of Signal Hill STUDY AREA PROFILE STUDY AREA ID #141 BASE MAP PARK METRICS WHERE ARE PARKS MOST NEEDED AMENITY QUANTITIES AND CONDITIONS PARK NEEDS FRAMEWORK PROJECT COST ESTIMATES PROJECT REPORTING
TRANSPORTATION SERVICE Actual
 PERFORMANCE REPORT-THIRD QUARTER VISION TO DELIVER REGIONAL MULTI-MODAL TRANSPORTATION SERVICES AND INFRASTRUCTURE IMPROVEMENTS THAT SIGNIFICANTLY AND CONTINUALLY INCREASE TRANSIT MARKET SHARE. MISSION
National Passenger Survey Autumn putting rail passengers first
 National Passenger Survey Autumn putting rail passengers first What is Passenger Focus? Passenger Focus is the independent national rail consumer watchdog. Our mission is to get the best deal for Britain
L 342/20 Official Journal of the European Union
 L 342/20 Official Journal of the European Union 24.12.2005 COMMISSION REGULATION (EC) No 2150/2005 of 23 December 2005 laying down common rules for the flexible use of airspace (Text with EEA relevance)
SAN FRANCISCO PARK EVALUATION PROGRAM PES15 EVALUATION FORM
 SAN FRANCISCO PARK EVALUATION PROGRAM PES15 EVALUATION FORM FY2015 Generic Park Evaluation Form ----- June 26, 2014 List of Features Athletic Fields Buildings & General Amenities Children s Play Areas
Great Wolf Lodge Fact Sheet & Frequently Asked Questions Potential Location in Gilroy, California 8/30/17
 WHAT? Great Wolf Resorts has identified Gilroy, California as a potential location for a new Great Wolf Lodge family resort and has entered into a 60-day period of exclusivity with the City and community
Mt. Hood National Forest
 United States Department of Agriculture Forest Service Mt. Hood National Forest Zigzag Ranger District 70220 E. Highway 26 Zigzag, OR 97049 503-622-3191 Fax: 503-622-5622 File Code: 1950-1 Date: June 29,
Longmont to Boulder Regional Trail Jay Road Connection DRAFT FINAL REPORT
 Longmont to Boulder Regional Trail Jay Road Connection DRAFT FINAL REPORT December 2018 Project Summary Boulder County, Colorado, in partnership with the City of Boulder, is evaluating options for multi-use
Wilderness Stewardship Plan Scoping Newsletter Winter 2013
 Olympic National Park National Park Service U.S. Department of the Interior Wilderness Stewardship Plan Scoping Newsletter Winter 2013 Dear Friends and Neighbors, The Olympic Wilderness was established