Crime Report for Southern California: 2013
|
|
|
- Damon Palmer
- 5 years ago
- Views:
Transcription
1 Crime Report for Southern California: 2013 Presented by the Irvine Lab for the Study of Space and Crime (ILSSC) School of Social Ecology University of California, Irvine January 2015


2 Crime Report for Southern California 2013 Authors: John R. Hipp Charis E. Kubrin Graduate Student Researchers: Michelle D. Mioduszewski Young-An Kim Christopher J. Bates Nicholas Branic Christopher Contreras Rupa Jose Rylan Simpson James C. Wo ii

3 ABOUT THE IRVINE LAB FOR THE STUDY OF SPACE AND CRIME (ILSSC) The Irvine Laboratory for the Study of Space and Crime (ILSSC) in the Department of Criminology, Law and Society at the University of California, Irvine is dedicated to researching the social ecology of crime at all levels of analysis including street segments, blocks, neighborhoods, cities, counties, and metropolitan areas. Together with our collaborators and community partners, our team seeks to generate high quality scientific research on the spacecrime nexus, and to foster intellectual exchange among faculty, graduate students, and undergraduate students at the University of California, Irvine, as well as members of the larger community. The team studies: 1) Foundational issues, including the dynamics of urban crime, the micro-environment of crime, and the role of local institutional resources for fighting crime; 2) Enduring challenges, including inequality, concentrated poverty and concentrated affluence, urban processes such as economic redevelopment and gentrification, and trends in immigration and other demographic population shifts; 3) Contemporary challenges, including the housing crisis and foreclosures, the spatial clustering of multiple social problems, and the continuous cycling of offenders in and out of prison and on and off of supervision. The ILSSC is a subsidiary of the Metropolitan Futures Initiative (MFI). iii
4 Table of Contents Chapter 1. Introduction... 1 Methodology... 1 Overview of results... 3 Chapter 2. Violent and property crime... 4 Top 10 cities with cities with highest violent or property crime rates in Top 10 cities with highest violent and property crime rates averaged over Top 10 cities with lowest violent or property crime rates in Top 10 cities with lowest violent and property crime rates averaged over Top 10 cities with biggest increases in violent crime in last 1, 5, and 10 years Top 10 cities with biggest increases in property crime in last 1, 5, and 10 years Top 10 cities with biggest decreases in violent crime in last 1, 5, and 10 years Top 10 cities with biggest decreases in property crime in last 1, 5, and 10 years Chapter 3. Crime by six specific types Top 10 cities with highest crime rates in Top 10 cities with highest crime rates averaged over Top 10 cities with lowest crime rates in Top 10 cities with lowest crime rates averaged over Top 10 cities with biggest increases in crime in last 1, 5, and 10 years Top 10 cities with biggest decreases in crime in last 1, 5, and 10 years Chapter 4. County-specific focus Los Angeles County Orange County Riverside County San Bernardino County San Diego County Ventura County Technical Notes Appendix iv
5 Los Angeles County: change in specific crime types over last 10 years Orange County: change in specific types of crime types over last 10 years Riverside County: change in specific crime types over last 10 years San Bernardino County: change in specific crime types over last 10 years San Diego County: change in specific crime types over last 10 years Ventura County: change in specific crime types over last 10 years v
6 Chapter 1. Introduction Methodology This is the first annual Crime Report for Southern California. In these annual reports, we use data from the FBI s Uniform Crime Reporting (UCR) program to describe the level of crime in cities located in the Southern California region. It is well-known that these data underestimate the actual amount of crime. This occurs because some crime events are not reported by citizens or detected by the police. The crime data can also be inaccurate if the police classify some non-crime events as crimes, or if they code some crime events as noncrimes. Despite these limitations, UCR data is generally recognized as the best data source available for tracking crime trends in U.S. cities. In our report, we examine the six most serious types of crime: homicide; aggravated assault; robbery; burglary; motor vehicle theft; and larceny. 1 For the analysis, we analyzed the level of crime for all cities in the region with a population size of at least 4,000. We use this value given that cities with very small populations can have excessive crime rates even with very few crime events. The Southern California region is an area that includes 196 cities in the following counties: 1) Los Angeles; 2) Orange; 3) Riverside; 4) San Bernardino; 5) San Diego; 6) Ventura; 7) Imperial. The region contains 21.7 million people. 1 We do not include rape in the analyses. Definitional differences, as well as policy differences, can lead to differences in the reported level of rapes across cities that do not represent true difference in the level of this type of crime. Other crimes are less dependent on such reporting decisions. We present results for cities with the top 10 levels of each crime type, cities with the bottom 10 levels of each crime type, and the top 10 increases and top 10 decreases in each crime type. The last part of the report presents results for each county one at a time. Throughout the report, we have standardized the crime rates to facilitate comparisons between cities within the Southern California region. We refer to these as adjusted crime rates. We first compute the crime rate by dividing the number of crimes by the most recent estimate of the population in the city. We standardize this value, and therefore a city that has a crime rate at the average value for the region as a whole will have an adjusted crime rate value of 100. Cities with adjusted crime rates greater than 100 are cities with crime rates greater than the average for the entire region; likewise, cities with adjusted crime rates less than 100 are cities with crime rates that are below the average of the region. For example, a city with a value of 150 for the adjusted aggravated assault rate measure has 50% more aggravated assaults than the average of the region in that year. And a city with a value of 60 has an aggravated assault rate that is only 60% as large as that of the average of the region (or, we might say their aggravated assault rate is 40% less than the average of the region). Violent crime combines aggravated assaults, robberies, and homicides. Property crime combines burglaries, motor vehicle thefts, and larcenies.
7 In several cases in the report, we computed the crime rate averaged over a 3- year period ( ). This is done to smooth out possible random year-to-year fluctuations in crime that might occur. While some year-toyear changes in crime reflect true change in the city, others can be due to idiosyncratic events in a particular year. These 3-year moving averages adjust for these fluctuations. For computing the change in overall violent or property crime rates, we compute the difference in these adjusted crime rates. For the six crime types (see Chapter 3), we employ a novel approach for calculating change that adjusts for the inherent problem of comparing changes in crime rates across cities of different sizes. The method is described in the technical notes portion of the report. In brief, the problem is this: if we were to compare cities based on the increase or decrease in the number of crime events, a large city would have an unfair advantage in that a large decrease in the number of crime events might not reflect a very large change in the crime rate, given the large population size. On the other hand, if we were to compare cities based on the increase or decrease in the crime rate, a small city would have an unfair advantage in that the rate can fluctuate quite a bit even with relatively small changes in the number of crimes, simply because of their small population size. Our approach corrects for these issues and provides a reasonable comparison across cities of different sizes. 2
8 Overview of results The main findings of the analysis are: Compton has the highest violent crime rate from Laguna Woods has the lowest violent crime rate from Commerce has the highest property crime rate from Imperial has the lowest property crime rate from Bell has the largest increase in violent crime from Hawaiian Gardens has the largest decrease in violent crime from Culver City has the largest increase in property crime from Desert Hot Springs has the largest decrease in property crime from
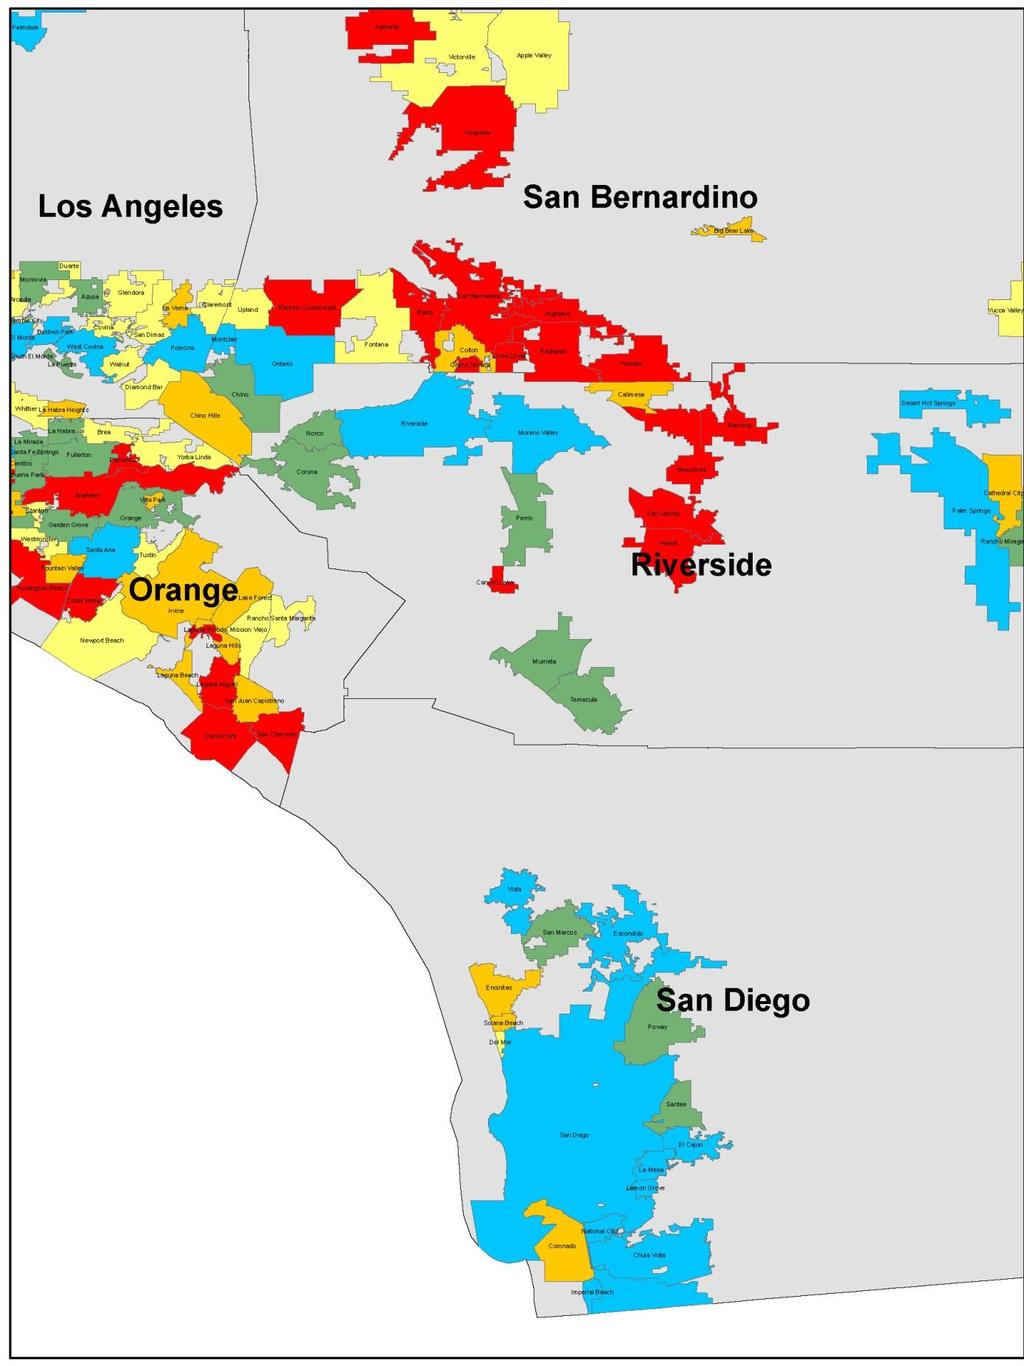
9 Chapter 2. Violent and property crime Top 10 cities with cities with highest violent or property crime rates in 2013 In 2013, the highest violent crime rate crime rates come from four of the six counties was in Compton. The adjusted violent crime in the region. Two cities appear in the top 10 rate of 362 indicates that whereas the average list for both violent and property crime: city in the region had a violent crime rate of Commerce and San Bernardino. 100, Compton s rate was 262% higher than the Below we present maps showing which average ( = 262). Big Bear Lake had the second highest violent crime rate, over cities have the highest or lowest adjusted 200% higher than the average city in the region. violent or property crime rates (averaged from ). In these maps, the cities with the Nine of the ten top violent cities were in either Los Angeles or San Bernardino counties. Below highest crime rates are shown in red, the we display the population of each city below to second highest are in orange, the third highest are in yellow, those with the second lowest are give a sense of the city size. shown in green, and those with the lowest are Santa Fe Springs had the highest shown in blue. property crime rate in 2013, with almost 150% more property crime than the average city in the region. The cities with the highest property 4
10 Top 10 cities with highest violent crime rate, 2013 City County Violent crime Population 1 COMPTON Los Angeles BIG BEAR LAKE San Bernardino DESERT HOT SPRINGS Riverside BARSTOW San Bernardino SAN BERNARDINO San Bernardino HAWTHORNE Los Angeles INGLEWOOD Los Angeles COMMERCE Los Angeles ADELANTO San Bernardino WEST HOLLYWOOD Los Angeles Top 10 cities with highest property crime rate, 2013 City County Property crime Population 1 SANTA FE SPRINGS Los Angeles COMMERCE Los Angeles PALM SPRINGS Riverside SIGNAL HILL Los Angeles HEMET Riverside EL CENTRO Imperial BRAWLEY Imperial PALM DESERT Riverside SAN BERNARDINO San Bernardino REDLANDS San Bernardino
11 Top 10 cities with highest violent and property crime rates averaged over These lists show the cities with the highest crime rates, averaged over the last three years ( ). This takes into account unusual yearly fluctuations. This list again shows that Compton had the highest violent crime rate, with 209% more violent crime than the average city in the region over the last three years. Commerce had the highest average property crime rate over the last three years, as well as one of the higher violent crime rates. Big Bear Lake and Desert Hot Springs also had some of the highest violent and property crime rates over the last three years. Top 10 cities with highest violent crime rate (based on average over ) City County Violent crime Population 1 COMPTON Los Angeles DESERT HOT SPRINGS Riverside SAN BERNARDINO San Bernardino BARSTOW San Bernardino WEST HOLLYWOOD Los Angeles BIG BEAR LAKE San Bernardino COMMERCE Los Angeles LYNWOOD Los Angeles HAWTHORNE Los Angeles INGLEWOOD Los Angeles Top 10 cities with highest property crime rate (based on average over ) City County Property crime Population 1 COMMERCE Los Angeles SANTA FE SPRINGS Los Angeles EL CENTRO Imperial BIG BEAR LAKE San Bernardino PALM SPRINGS Riverside SIGNAL HILL Los Angeles DESERT HOT SPRINGS Riverside HEMET Riverside BRAWLEY Imperial PALM DESERT Riverside
12 Figure 1. Average adjusted violent crime rate ( ) for Southern California cities 7
13 8
14 Top 10 cities with lowest violent or property crime rates in 2013 These lists show the 10 cities with lowest violent or property crime in Canyon Lake in Riverside County had the lowest violent crime rate (just 7.8% as high as the average city in the region). Several south Orange County cities had very low violent crime rates: Laguna Woods, Rancho Santa Margarita, and Irvine. Several south Orange County cities also had very low property crime rates: Laguna Woods, Rancho Santa Margarita, Laguna Niguel, Lake Forest, and Mission Viejo. Imperial had the lowest property crime rate in Several cities are among the lowest in both violent and property crime: Imperial, Palos Verdes Estates, Yorba Linda, Laguna Woods, Rancho Santa Margarita, and La Habra Heights. The only city with an over 100,000 person population on these lists was Irvine. Top 10 cities with lowest violent crime rate, 2013 City County Violent crime Population 1 CANYON LAKE Riverside LAGUNA WOODS Orange RANCHO SANTA MARGARITA Orange ROLLING HILLS ESTATES Los Angeles IMPERIAL Imperial PALOS VERDES ESTATES Los Angeles YORBA LINDA Orange CORONADO San Diego IRVINE Orange LA HABRA HEIGHTS Los Angeles Top 10 cities with lowest property crime rate, 2013 City County Property crime Population 1 IMPERIAL Imperial RANCHO SANTA MARGARITA Orange LAGUNA WOODS Orange LAGUNA NIGUEL Orange FILLMORE Ventura LA HABRA HEIGHTS Los Angeles LAKE FOREST Orange YORBA LINDA Orange MISSION VIEJO Orange PALOS VERDES ESTATES Los Angeles
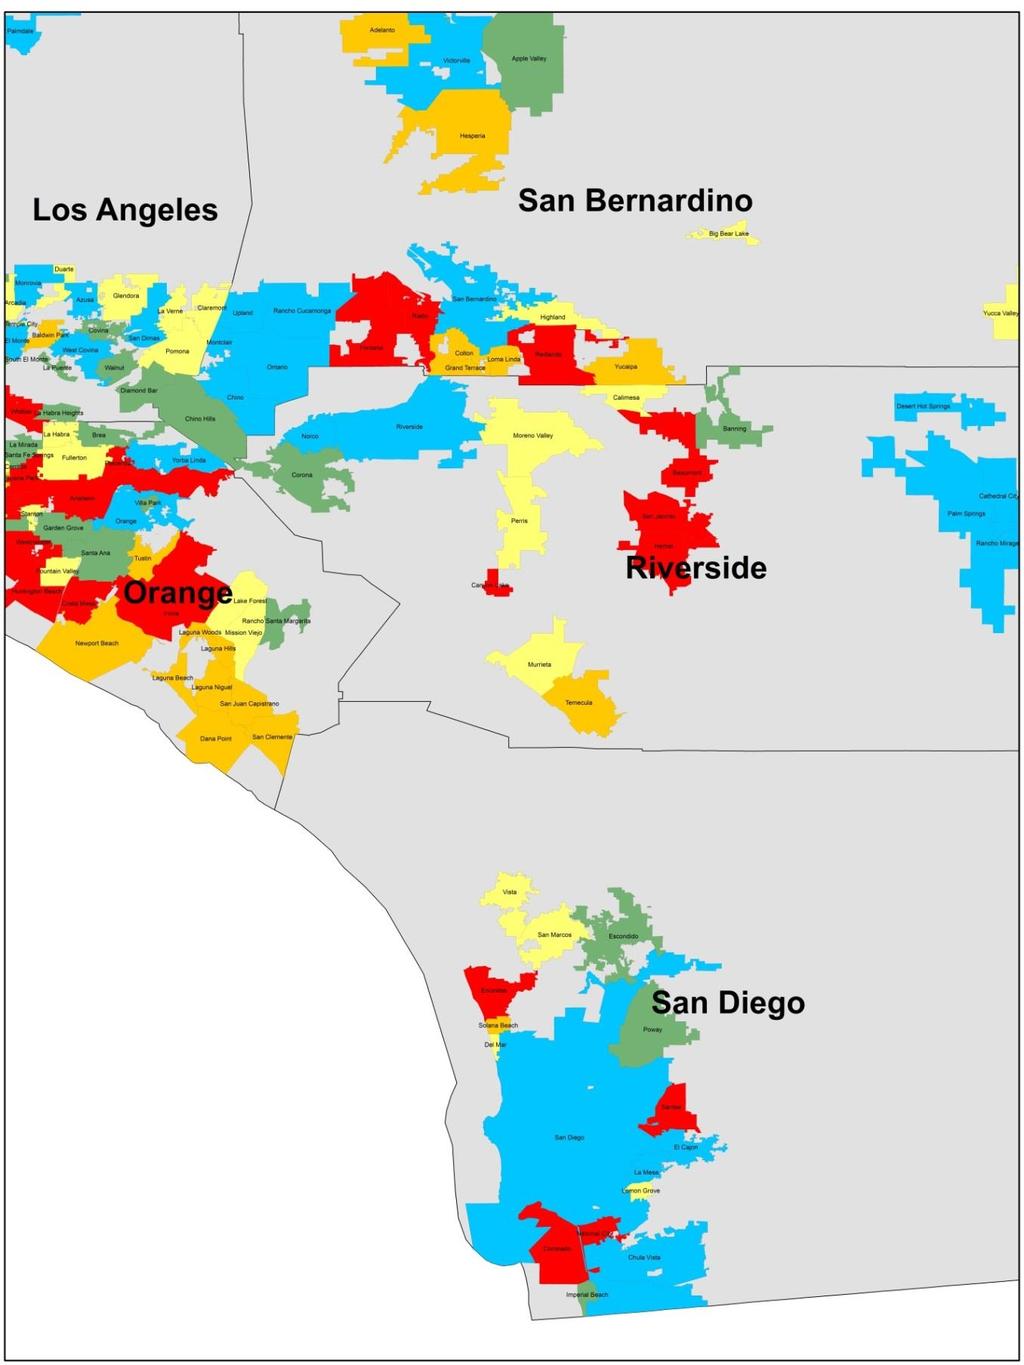
15 Top 10 cities with lowest violent and property crime rates averaged over These lists show the cities with the lowest violent and property crime rates averaged over the last three years. Laguna Woods, primarily a retirement community, had the lowest violent crime rate and the third lowest property crime rate. Irvine is by far the largest city on these lists with an over 200,000 person population. The city of Imperial had the lowest property crime rate over the last three years. Four cities are among the lowest in both violent and property crime: Imperial, Palos Verdes Estates, Laguna Woods, and Rancho Santa Margarita. Top 10 cities with lowest violent crime rate (based on average over ) City County Violent crime Population 1 LAGUNA WOODS Orange PALOS VERDES ESTATES Los Angeles IMPERIAL Imperial RANCHO SANTA MARGARITA Orange IRVINE Orange VILLA PARK Orange INDIAN WELLS Riverside LA CANADA FLINTRIDGE Los Angeles CALABASAS Los Angeles YORBA LINDA Orange Top 10 cities with lowest property crime rate (based on average over ) City County Property crime Population 1 IMPERIAL Imperial RANCHO SANTA MARGARITA Orange LAGUNA WOODS Orange PALOS VERDES ESTATES Los Angeles LA HABRA HEIGHTS Los Angeles MOORPARK Ventura LAGUNA NIGUEL Orange TEMPLE CITY Los Angeles SIERRA MADRE Los Angeles MAYWOOD Los Angeles
16 Figure 2. Average adjusted property crime rate ( ) for Southern California cities 11
17 12
18 Top 10 cities with biggest increases in violent crime in last 1, 5, and 10 years These tables focus on the cities showing the biggest increase in violent crime in recent years. We display three tables: 1) Top 10 with the biggest increase in the last year ( ; 2) Top 10 with the biggest increase in the last five years; 3) Top 10 with the biggest increase in the last ten years. We also present maps throughout this section, and the following section, showing which cities have experienced the largest changes in adjusted crime rates over the last five years. In these maps, the cities with the largest increases are shown in red, the second largest are in orange, the third largest are in yellow, those with the second largest decrease are shown in green, and those with the largest decreases are shown in blue. In the last year, Big Bear Lake experienced the largest increase in their violent crime rate. They went from double the regional average rate to triple the regional average rate in the last year. They also experienced the 2 nd largest increase over the last 5 years and the 6 th largest increase over the last 10 years. Compton also showed a large increase in the last year, but this was a change from recent years as they are not included in the list of cities experiencing large increases in the last 5 or 10 years. Bell experienced the largest increase over the last 5 years, and one of the larger increases over the last 10 years. 5 years ago they reported an average violent crime rate, but now have 70% more violent crime than an average city in the region. Barstow saw a very large increase in the last year and the biggest increase over the last 10 years. The largest increases in violent crime over the last 10 years have typically occurred in the Inland Empire. For example, six cities from San Bernardino County appeared on the list as having large increases in the last 10 years, including Barstow, Victorville, Hesperia, Big Bear Lake, Adelanto, and Highland. 13
19 Top 10 cities with largest increase in violent crime rate from City County Change First year This year Population 1 BIG BEAR LAKE San Bernardino BARSTOW San Bernardino COMPTON Los Angeles MALIBU Los Angeles INDIAN WELLS Riverside WESTLAKE VILLAGE Los Angeles LOMA LINDA San Bernardino GRAND TERRACE San Bernardino HEMET Riverside SIERRA MADRE Los Angeles Top 10 cities with largest increase in violent crime rate in last 5 years (based on three-year moving averages) City County Change First year This year Population 1 BELL Los Angeles BIG BEAR LAKE San Bernardino INDIO Riverside AZUSA Los Angeles CUDAHY Los Angeles HESPERIA San Bernardino DESERT HOT SPRINGS Riverside LOMA LINDA San Bernardino WEST HOLLYWOOD Los Angeles ADELANTO San Bernardino Top 10 cities with largest increase in violent crime rate in last 10 years (based on three-year moving averages) City County Change First year This year Population 1 BARSTOW San Bernardino VICTORVILLE San Bernardino AZUSA Los Angeles BELL Los Angeles HESPERIA San Bernardino BIG BEAR LAKE San Bernardino SOUTH GATE Los Angeles ADELANTO San Bernardino HOLTVILLE Imperial HIGHLAND San Bernardino
20 Figure 3. Change in average adjusted violent crime rate ( ) for Southern California cities 15
21 16
22 Top 10 cities with biggest increases in property crime in last 1, 5, and 10 years San Jacinto experienced large increases in property crime, with the largest increase in the last year, and the 2 nd largest over the last 10 years. In the last 10 years, they have gone from a low property crime city to one with an average level. And in the last year their property crime rate increased to 35% above the regional average. Culver City experienced the largest increase in the last 5 years, which continues a trend from the 5 years prior to that. Culver City went from about 30% below the average in 2003 to 30% above the average for property crime in the last 10 years. Redlands is another city that has experienced a large increase over the last 10 years to go from a below average level in 2003 to an above average level of property crime. El Centro has seen a steady increase in property crime over the last 10 years. They had the largest increase in property crime in the last 10 years, going from a city 10% below the average to one 60% above the average. 17
23 Top 10 cities with largest increase in property crime rate from City County Change First year This year Population 1 SAN JACINTO Riverside HEMET Riverside OXNARD Ventura SOUTH PASADENA Los Angeles LAMESA San Diego LOMA LINDA San Bernardino SAN GABRIEL Los Angeles PALM SPRINGS Riverside BANNING Riverside ARTESIA Los Angeles Top 10 cities with largest increase in property crime rate in last 5 years (based on three-year moving averages) City County Change First year This year Population 1 CULVER CITY Los Angeles BIG BEAR LAKE San Bernardino SIGNAL HILL Los Angeles BLYTHE Riverside REDLANDS San Bernardino WEST HOLLYWOOD Los Angeles RIALTO San Bernardino EL CENTRO Imperial BEAUMONT Riverside CALEXICO Imperial Top 10 cities with largest increase in property crime rate in last 10 years (based on three-year moving averages) City County Change First year This year Population 1 EL CENTRO Imperial SAN JACINTO Riverside CULVER CITY Los Angeles SANTA FE SPRINGS Los Angeles BRAWLEY Imperial REDLANDS San Bernardino COMMERCE Los Angeles NEEDLES San Bernardino LOS ALAMITOS Orange HEMET Riverside
24 Figure 4. Change in average adjusted property crime rate ( ) for Southern California cities 19
25 20
26 Top 10 cities with biggest decreases in violent crime in last 1, 5, and 10 years Coachella has seen the largest decrease in violent crime in the last year, going from 66% above the average to 22% below the average. However, that does not appear to be part of a longer lasting trend, as this decline does not appear over the last 5 or 10 years. Alternatively, Needles saw a large drop in the last year, continuing a 5 year trend in which they went from a high violent crime city to a city just below the average. Hawaiian Gardens experienced the largest decrease in violent crime over the last 5 years. Five years ago their violent crime rate was double the average, and now it is just above the average. Perris also has seen a steady decrease in their violent crime rate over the last 10 years, from almost 70% above the average to 20% below the average. Although Compton still has a high violent crime rate that is 3 times the average, they have experienced some of the largest decreases in the last 5 and 10 years. Likewise, Gardena has experienced a steady decrease in their violent crime rate over the last 10 years, going from twice the region average to just 17% above the average. Los Angeles experienced the largest decrease in violent crime over the last 10 years. Ten years ago Los Angeles had a violent crime rate 183% higher than the regional average, and now it is just 22% above the average. 21
27 Top 10 cities with largest decrease in violent crime rate from City County Change First year This year Population 1 COACHELLA Riverside WEST HOLLYWOOD Los Angeles LA QUINTA Riverside MAYWOOD Los Angeles COMMERCE Los Angeles HIGHLAND San Bernardino DESERT HOT SPRINGS Riverside NEEDLES San Bernardino CUDAHY Los Angeles HERMOSA BEACH Los Angeles Top 10 cities with largest decrease in violent crime rate in last 5 years (based on three-year moving averages) City County Change First year This year Population 1 HAWAIIAN GARDENS Los Angeles NEEDLES San Bernardino COMPTON Los Angeles PERRIS Riverside LANCASTER Los Angeles BARSTOW San Bernardino PARAMOUNT Los Angeles BELLFLOWER Los Angeles SIGNAL HILL Los Angeles GARDENA Los Angeles Top 10 cities with largest decrease in violent crime rate in last 10 years (based on three-year moving averages) City County Change First year This year Population 1 LOS ANGELES Los Angeles BLYTHE Riverside GARDENA Los Angeles EL CENTRO Imperial PERRIS Riverside COMPTON Los Angeles LANCASTER Los Angeles COMMERCE Los Angeles BRAWLEY Imperial LYNWOOD Los Angeles
28 Top 10 cities with biggest decreases in property crime in last 1, 5, and 10 years Big Bear Lake experienced the largest decrease in property crime in the last year, while Cathedral City, Rialto, and Ojai also have seen relatively sharp drops. When looking at longer-term trends, Desert Hot Springs has shown the most consistent downward trend in property crime. Although it still has a property crime rate 40% above the regional average, this city has had the largest decrease over the last 10 years, with most of the drop attributed to the more recent 5 years. Although it already had a low rate, Imperial also has seen a relatively large decrease in property crime in the last 5 years. Three cities in San Diego County have seen large decreases in property crime. Chula Vista, Lemon Grove, and El Cajon have all experienced drops over the last 10 years and are now well below the regional average for property crime. Four cities in Los Angeles County have experienced large drops in property crime. Three of those cities Hawaiian Gardens, San Fernando, and Los Angeles were already below the average 10 years ago, but have decreased further since then. And one Signal Hill is a former high property crime city that has seen sizeable decreases over the last 10 years. 23
29 Top 10 cities with largest decrease in property crime rate from City County Change First year This year Population 1 BIG BEAR LAKE San Bernardino CATHEDRAL CITY Riverside RIALTO San Bernardino OJAI Ventura EL CENTRO Imperial DUARTE Los Angeles DEL MAR San Diego YUCCA VALLEY San Bernardino HERMOSA BEACH Los Angeles COVINA Los Angeles Top 10 cities with largest decrease in property crime rate in last 5 years (based on three-year moving averages) City County Change First year This year Population 1 DESERT HOT SPRINGS Riverside IMPERIAL Imperial MONTCLAIR San Bernardino RANCHO MIRAGE Riverside EL CAJON San Diego LANCASTER Los Angeles HAWAIIAN GARDENS Los Angeles IMPERIAL BEACH San Diego LEMON GROVE San Diego CHULA VISTA San Diego Top 10 cities with largest decrease in property crime rate in last 10 years (based on three-year moving averages) City County Change First year This year Population 1 DESERT HOT SPRINGS Riverside HAWAIIAN GARDENS Los Angeles CHULA VISTA San Diego IMPERIAL Imperial SIGNAL HILL Los Angeles LEMON GROVE San Diego EL CAJON San Diego SAN FERNANDO Los Angeles ONTARIO San Bernardino LOS ANGELES Los Angeles
30 Chapter 3. Crime by six specific types Top 10 cities with highest crime rates in 2013 In this section, we display the Top 10 cities for each specific crime type. For example, the first table (Top 10 cities with highest aggravated assault rate) shows that Big Bear Lake had the highest aggravated assault rate in The adjusted aggravated assault rate of 423 indicates that whereas the average city in the region had an aggravated assault rate of 100, Big Bear Lake s rate was 323% higher than the average ( = 323). We also display the population of each city to give a sense of the city size. As evident in this table, Big Bear Lake is a very small resort city with a population of just over 5,000 residents according to the most recent Census. Across crime types, there are some notable similarities. For example, San Bernardino and Compton are the top two cities in both robbery and homicide rates in Santa Fe Springs and Commerce are the top two cities in auto theft and larceny in Across most crime types, cities from all counties were typically included on these top 10 lists. Exceptions were robbery in which cities from Los Angeles County dominated the list, and burglary in which cities from San Bernardino and Riverside County dominated the list. With a population of less than 5,000 residents, the small city of Needles in San Bernardino County had the highest burglary rate (297) and third highest homicide rate (519). For some crime types, the range among the top 10 cities is narrower (e.g., larceny crime rates ranged from 234 in Santa Fe Springs to 143). For other crime types, cities varied markedly in their crime rate and even in the average rate (i.e., 100). An example of this is in auto theft rates with Commerce having a rate of 972 or a rate 872% higher than the regional average rate and Montebello having a rate of 356 or a rate 256% higher than the regional average rate. It is worth keeping in mind that for crimes that are relatively rare, such as homicide, a single incident can significantly impact the statistics. An example is Seal Beach, in which a homicide event occurred in 2011, killing several people in a singular incident. Such a big event can strongly impact the city s homicide statistics. Thus, caution is necessary in interpreting the results for any given year, especially when considering homicide rates, which can be driven by relatively few incidents. Below, we present maps showing adjusted crime rates for the various crime types for cities in the region. In these maps, the cities with the highest crime rates are shown in red; the second highest are shown in orange; the third highest are shown in yellow; the second lowest are shown in green; and the cities with the lowest crime rate are shown in blue. 25
31 Top 10 cities with highest aggravated assault rate in 2013 City County Assault Population 1 BIG BEAR LAKE San Bernardino COMPTON Los Angeles DESERT HOT SPRINGS Riverside BARSTOW San Bernardino SAN BERNARDINO San Bernardino AZUSA Los Angeles ADELANTO San Bernardino INDIO Riverside WEST HOLLYWOOD Los Angeles IMPERIAL BEACH San Diego Top 10 cities with highest robbery rate in 2013 City County Robbery Population 1 SAN BERNARDINO San Bernardino COMPTON Los Angeles HAWTHORNE Los Angeles HUNTINGTON PARK Los Angeles COMMERCE Los Angeles INGLEWOOD Los Angeles LYNWOOD Los Angeles GARDENA Los Angeles LONG BEACH Los Angeles SOUTH GATE Los Angeles Top 10 cities with highest homicide rate in 2013 City County Homicide Population 1 COMPTON Los Angeles SAN BERNARDINO San Bernardino NEEDLES San Bernardino SANTA PAULA Ventura POMONA Los Angeles MAYWOOD Los Angeles YUCCA VALLEY San Bernardino BARSTOW San Bernardino INGLEWOOD Los Angeles ARTESIA Los Angeles
32 Figure 5. Average adjusted aggravated assault rate ( ) for Southern California cities 27
33 28
34 Top 10 cities with highest burglary rate in 2013 City County Burglary Population 1 NEEDLES San Bernardino DESERT HOT SPRINGS Riverside PALM SPRINGS Riverside BIG BEAR LAKE San Bernardino BARSTOW San Bernardino HEMET Riverside SAN BERNARDINO San Bernardino ADELANTO San Bernardino VICTORVILLE San Bernardino BRAWLEY Imperial Top 10 cities with highest auto theft rate in2013 City County Auto theft Population 1 COMMERCE Los Angeles SANTA FE SPRINGS Los Angeles SAN BERNARDINO San Bernardino HUNTINGTON PARK Los Angeles MONTCLAIR San Bernardino SOUTH GATE Los Angeles PARAMOUNT Los Angeles COACHELLA Riverside COMPTON Los Angeles MONTEBELLO Los Angeles Top 10 cities with highest larceny rate in 2013 City County Larceny Population 1 SANTA FE SPRINGS Los Angeles COMMERCE Los Angeles EL CENTRO Imperial SIGNAL HILL Los Angeles CULVER CITY Los Angeles BRAWLEY Imperial DEL MAR San Diego SANTA MONICA Los Angeles PALM DESERT Riverside WEST HOLLYWOOD Los Angeles
35 Top 10 cities with highest crime rates averaged over In the following set of tables, we show the Top 10 cities for each crime type based on the crime rate averaged over the last three years ( ). This averaged crime rate ensures that an atypical year with unusually high or low crime results in a less biased estimate. The highest reported average crime rate is for motor vehicle theft in Commerce (926). Commerce is also listed as a top 10 city for larceny and aggravated assault. On occasion, high crime rates do group in space. An example of this is found in the top 10 cities for robbery in which 9 out of the 10 are in Los Angeles County. San Bernardino is the exception as the only top 10 city for robbery outside of Los Angeles County. For most crime types, cities from Orange, Ventura, or San Diego County do not make the top
36 Top 10 cities with highest aggravated assault rate (based on average over ) City County Assault Population 1 DESERT HOT SPRINGS Riverside COMPTON Los Angeles BIG BEAR LAKE San Bernardino BARSTOW San Bernardino SAN BERNARDINO San Bernardino WEST HOLLYWOOD Los Angeles COMMERCE Los Angeles IMPERIAL BEACH San Diego LYNWOOD Los Angeles ADELANTO San Bernardino Top 10 cities with highest robbery rate (based on average over ) City County Robbery Population 1 HUNTINGTON PARK Los Angeles COMPTON Los Angeles SAN BERNARDINO San Bernardino COMMERCE Los Angeles HAWTHORNE Los Angeles LYNWOOD Los Angeles WEST HOLLYWOOD Los Angeles INGLEWOOD Los Angeles SOUTH GATE Los Angeles LONG BEACH Los Angeles Top 10 cities with highest homicide rate (based on average over ) City County Homicide Population 1 COMPTON Los Angeles SAN BERNARDINO San Bernardino DESERT HOT SPRINGS Riverside NEEDLES San Bernardino BIG BEAR LAKE San Bernardino POMONA Los Angeles INGLEWOOD Los Angeles SEAL BEACH Orange BELL GARDENS Los Angeles SANTA PAULA Ventura
37 Top 10 cities with highest burglary rate (based on average over ) City County Burglary Population 1 DESERT HOT SPRINGS Riverside NEEDLES San Bernardino BIG BEAR LAKE San Bernardino PALM SPRINGS Riverside BRAWLEY Imperial EL CENTRO Imperial HEMET Riverside VICTORVILLE San Bernardino RANCHO MIRAGE Riverside PALM DESERT Riverside Top 10 cities with highest motor vehicle theft rate (based on average over ) City County Auto theft Population 1 COMMERCE Los Angeles SANTA FE SPRINGS Los Angeles HUNTINGTON PARK Los Angeles SAN BERNARDINO San Bernardino SOUTH GATE Los Angeles MONTCLAIR San Bernardino PARAMOUNT Los Angeles COMPTON Los Angeles DOWNEY Los Angeles CALEXICO Imperial Top 10 cities with highest larceny rate (based on average over ) City County Larceny Population 1 SANTA FE SPRINGS Los Angeles COMMERCE Los Angeles CULVER CITY Los Angeles EL CENTRO Imperial DEL MAR San Diego SIGNAL HILL Los Angeles WEST HOLLYWOOD Los Angeles BIG BEAR LAKE San Bernardino PALM DESERT Riverside MONTCLAIR San Bernardino
38 Figure 6. Average adjusted robbery rate ( ) for Southern California cities 33
39 34
40 Top 10 cities with lowest crime rates in 2013 In this section, we display the Top 10 cities with the lowest rates of the following five crime types: aggravated assault, robbery, burglary, motor vehicle theft and larceny. We do not list the Top 10 cities with the lowest homicide rates, given that several cities had no homicides. The third table shows that Imperial, a city of 15,943 people located in Imperial County, had the lowest burglary rate in Imperial s adjusted burglary rate of 18.8 indicates that this city s rate was 81.2% less than the average burglary rate in the region ( = -81.2). The fifth table shows that Imperial also had the lowest larceny rate in In this case, Imperial s adjusted larceny rate of 15.9 indicates that this city s rate was 84.1% less than the average larceny rate in the region. As demonstrated by the case of Imperial, many cities which ranked in the list of Top 10 cities with the lowest rate of one crime type in 2013 also ranked in the list of Top 10 cities with the lowest rate of other crime types in For example, Rancho Santa Margarita, a city of 49,190 people located in Orange County, had one of the lowest rates of all five crime types displayed in this section. Similarly, Laguna Woods (another city located in south Orange County) had the lowest aggravated assault rate in 2013, as well as one of the lowest robbery, burglary and larceny rates in the region; while Palos Verdes Estates (located in Los Angeles County) had some of the lowest robbery, motor vehicle theft and larceny rates in the region. 35
41 Top 10 cities with lowest aggravated assault rate in 2013 City County Assault Population 1 LAGUNA WOODS Orange LA PALMA Orange RANCHO SANTA MARGARITA Orange CORONADO San Diego ROLLING HILLS ESTATES Los Angeles IRVINE Orange CANYON LAKE Riverside YORBA LINDA Orange SEAL BEACH Orange CLAREMONT Los Angeles Top 10 cities with lowest robbery rate in 2013 City County Robbery Population 1 PALOS VERDES ESTATES Los Angeles CANYON LAKE Riverside VILLA PARK Orange LA HABRA HEIGHTS Los Angeles LAGUNA WOODS Orange IMPERIAL Imperial YORBA LINDA Orange SIERRA MADRE Los Angeles ROLLING HILLS ESTATES Los Angeles RANCHO SANTA MARGARITA Orange
42 Figure 7. Average adjusted burglary rate ( ) for Southern California cities 37
43 38
44 Top 10 cities with lowest burglary rate in 2013 City County Burglary Population 1 IMPERIAL Imperial LAGUNA WOODS Orange LAGUNA NIGUEL Orange RANCHO SANTA MARGARITA Orange MISSION VIEJO Orange FILLMORE Ventura MAYWOOD Los Angeles LAKE FOREST Orange MOORPARK Ventura OJAI Ventura Top 10 cities with lowest motor vehicle theft rate in2013 City County Auto theft Population 1 VILLA PARK Orange SAN MARINO Los Angeles RANCHO SANTA MARGARITA Orange CALABASAS Los Angeles PALOS VERDES ESTATES Los Angeles LA HABRA HEIGHTS Los Angeles MISSION VIEJO Orange LAGUNA NIGUEL Orange LA CANADA FLINTRIDGE Los Angeles LAKE FOREST Orange Top 10 cities with lowest larceny rate in 2013 City County Larceny Population 1 IMPERIAL Imperial LA HABRA HEIGHTS Los Angeles RANCHO SANTA MARGARITA Orange MAYWOOD Los Angeles LAWNDALE Los Angeles LA PUENTE Los Angeles SIERRA MADRE Los Angeles LAGUNA WOODS Orange TWENTYNINE PALMS San Bernardino PALOS VERDES ESTATES Los Angeles
45 Top 10 cities with lowest crime rates averaged over In this section, we display the Top 10 cities with the lowest level of each of the following five crime types based on the crime rate averaged over : aggravated assault, robbery, burglary, motor vehicle theft and larceny. This allows for the smoothing of unusual events that might occur in a single year. The fourth table shows that San Marino, a city of 13,308 people in Los Angeles County, had the lowest motor vehicle theft rate when averaged over the last three years. Similarly, the second table shows that Villa Park, a city of 5,959 people located in Orange County, had the lowest robbery rate when averaged over the last three years. In the section where crime types are averaged over the last three years, the positions of several cities differ compared to the previous section looking only at crime rates in For example, Imperial still had the lowest burglary and larceny rates when averaged over the last three years, and Laguna Woods still had the lowest aggravated assault rate when averaged over the last three years. However, Villa Park, which had the lowest motor vehicle theft rate in 2013, was now replaced by San Marino when averaging over three years. Such observations provide support for the inclusion of averaged crime rates as a means to smooth out particular years that experience disproportionately high or low numbers of certain crime types. 40
46 Top 10 cities with lowest aggravated assault rate (based on average over ) City County Assault Population 1 LAGUNA WOODS Orange LA PALMA Orange IRVINE Orange RANCHO SANTA MARGARITA Orange PALOS VERDES ESTATES Los Angeles CALABASAS Los Angeles TEMECULA Riverside CLAREMONT Los Angeles INDIAN WELLS Riverside WESTLAKE VILLAGE Los Angeles Top 10 cities with lowest robbery rate (based on average over ) City County Robbery Population 1 VILLA PARK Orange PALOS VERDES ESTATES Los Angeles CANYON LAKE Riverside LA HABRA HEIGHTS Los Angeles IMPERIAL Imperial SIERRA MADRE Los Angeles YORBA LINDA Orange RANCHO SANTA MARGARITA Orange CORONADO San Diego IRVINE Orange
47 Top 10 cities with lowest burglary rate (based on average over ) City County Burglary Population 1 IMPERIAL Imperial LAGUNA WOODS Orange RANCHO SANTA MARGARITA Orange FILLMORE Ventura MISSION VIEJO Orange LAGUNA NIGUEL Orange MOORPARK Ventura LAKE FOREST Orange CUDAHY Los Angeles THOUSAND OAKS Ventura Top 10 cities with lowest motor vehicle theft rate (based on average over ) City County Auto theft Population 1 SAN MARINO Los Angeles RANCHO SANTA MARGARITA Orange VILLA PARK Orange CALABASAS Los Angeles LAGUNA WOODS Orange MISSION VIEJO Orange LAGUNA NIGUEL Orange PALOS VERDES ESTATES Los Angeles SIERRA MADRE Los Angeles LA HABRA HEIGHTS Los Angeles Top 10 cities with lowest larceny rate (based on average over ) City County Larceny Population 1 IMPERIAL Imperial LA HABRA HEIGHTS Los Angeles MAYWOOD Los Angeles RANCHO SANTA MARGARITA Orange LAWNDALE Los Angeles PALOS VERDES ESTATES Los Angeles TEMPLE CITY Los Angeles LA PUENTE Los Angeles LAGUNA WOODS Orange WALNUT Los Angeles

48 Figure 8. Average adjusted motor vehicle theft rate ( ) for Southern California cities 43
49 44
50 Top 10 cities with biggest increases in crime in last 1, 5, and 10 years These tables focus on the cities showing the biggest increase in crime in recent years. For each crime type we display three tables: 1) Top 10 with the biggest increase in the last year; 2) Top 10 with the biggest increase in the last five years; 3) Top 10 with the biggest increase in the last ten years. These are grouped by particular crime type (e.g., aggravated assault, etc.). It is possible that a city with a large drop in crime can appear to have a higher adjusted crime rate in the more recent time period. This is because the adjusted crime rates compare the city to all other cities in that same year. If the overall level of crime is dropping in the entire region, this can affect the adjusted rates in individual years, regardless of the amount of change for individual cities. We also present maps throughout this section, and the following section, showing which cities have experienced the largest changes in adjusted crime rates over the last five years. In these maps, the cities with the largest increases are shown in red, the second largest are in orange, the third largest are in yellow, those with the second largest decrease are shown in green, and those with the largest decreases are shown in blue. Some key results: Increases in the last year: Compton experienced the largest increase in aggravated assault in the last year, going from a rate about 200% higher than the average in the region to one almost 300% higher. They also experienced the largest increase in their homicide rate. Despite their already high aggravated assault rate, Big Bear Lake had the second largest increase but did not experience similar increases in other crime types. Barstow experienced large increases in aggravated assault, homicide, and burglary. Indio experienced large increases in aggravated assaults and motor vehicle thefts. Hemet experienced sizeable increases in robberies, motor vehicle thefts, and larcenies. Maywood experienced large increases in homicides and motor vehicle thefts. Riverside and Anaheim experienced the largest increases in motor vehicle thefts. Oxnard, despite its relatively low larceny rate, experienced the largest increase. Increases in the last five years: Over the last five years, Chino has seen the largest increase in aggravated assaults. Formerly a city with a rate only half that of the regional average, now it is at the average rate. They also have experienced a large increase in homicides. Bell experienced large increases in aggravated assaults and robberies. Hesperia has seen large increases in aggravated assaults and burglaries. Culver City experienced large increases in aggravated assaults and larcenies. Yucaipa and Loma Linda have seen large increases in aggravated assaults and robberies. 45
51 Rancho Cucamonga has the largest burglary rate increase in the last five years, going from a city with a burglary rate less than half the regional average to one above the regional average. Hemet experienced large increases in burglaries and motor vehicle thefts. Anaheim experienced large increases in motor vehicle thefts and larcenies. Huntington Beach experienced the largest increase in larcenies. Increases in the last ten years: Victorville has experienced the largest increase in robberies, burglaries and aggravated assaults over the last ten years. They have gone from 30% below the regional average in aggravated assaults to 30% above the average. They also experienced large increases in homicides and motor vehicle thefts. Hesperia experienced one of the largest increases in aggravated assaults, robberies, burglaries, and motor vehicle thefts. Desert Hot Springs experienced one of the largest increases in aggravated assaults, homicides, and motor vehicle thefts. Highland experienced a large increase in aggravated assaults and burglaries. Adelanto experienced a large increase in aggravated assaults, robberies, burglaries, and motor vehicle thefts. Although Calexico has relatively low crime rates, it experienced one of the larger increases in aggravated assaults and larcenies. Hemet experienced large increases in robberies, motor vehicle thefts, and larcenies. Coachella experienced large increases in robberies and motor vehicle thefts. San Jacinto experienced large increases in robberies, homicides, and all property crimes. Indio has seen large increases in robberies and larcenies. Needles experienced large increases in homicides and motor vehicle thefts. Beaumont experienced large increases in motor vehicle thefts and larcenies. 46
52 Biggest increase in aggravated assault rate from City County Change Last year This year Population 1 COMPTON Los Angeles BIG BEAR LAKE San Bernardino HUNTINGTON PARK Los Angeles BARSTOW San Bernardino LAGUNA HILLS Orange AZUSA Los Angeles LOMA LINDA San Bernardino INDIO Riverside PALM DESERT Riverside LANCASTER Los Angeles Biggest increase in aggravated assault rate in last 5 years (based on three-year moving averages) City County Change First year This year Population 1 CHINO San Bernardino BELL Los Angeles AZUSA Los Angeles HESPERIA San Bernardino INDIO Riverside SOUTH GATE Los Angeles CULVER CITY Los Angeles YUCAIPA San Bernardino LOMA LINDA San Bernardino DESERT HOT SPRINGS Riverside Biggest increase in aggravated assault rate in last 10 years (based on three-year moving averages) City County Change First year This year Population 1 VICTORVILLE San Bernardino AZUSA Los Angeles HESPERIA San Bernardino DESERT HOT SPRINGS Riverside HIGHLAND San Bernardino SOUTH GATE Los Angeles ADELANTO San Bernardino BARSTOW San Bernardino YUCAIPA San Bernardino CALEXICO Imperial
53 Biggest increase in robbery rate from City County Change Last year This year Population 1 HEMET Riverside PALMDALE Los Angeles MONTEREY PARK Los Angeles GRAND TERRACE San Bernardino EL CENTRO Imperial AGOURA HILLS Los Angeles ARCADIA Los Angeles MONTCLAIR San Bernardino SAN JACINTO Riverside MONTEBELLO Los Angeles Biggest increase in robbery rate in last 5 years (based on three-year moving averages) City County Change First year This year Population 1 BELL Los Angeles GRAND TERRACE San Bernardino ADELANTO San Bernardino YUCCA VALLEY San Bernardino YUCAIPA San Bernardino GLENDORA Los Angeles LA QUINTA Riverside LOMA LINDA San Bernardino OJAI Ventura FILLMORE Ventura Biggest increase in robbery rate in last 10 years (based on three-year moving averages) City County Change First year This year Population 1 VICTORVILLE San Bernardino HEMET Riverside COACHELLA Riverside ADELANTO San Bernardino SAN JACINTO Riverside HESPERIA San Bernardino VENTURA Ventura LA QUINTA Riverside INDIO Riverside ESCONDIDO San Diego
54 Figure 9. 5-year change in adjusted aggravated assault rate (from 2008 to 2013) for Southern California cities 49
55 50
56 Biggest increase in homicide rate from City County Change Last year This year Population 1 COMPTON Los Angeles POMONA Los Angeles SANTA PAULA Ventura YUCCA VALLEY San Bernardino CORONA Riverside BARSTOW San Bernardino MAYWOOD Los Angeles SANTA MONICA Los Angeles VENTURA Ventura ONTARIO San Bernardino Biggest increase in homicide rate in last 5 years (based on three-year moving averages) City County Change First year This year Population 1 SEAL BEACH Orange SAN JACINTO Riverside SANTA PAULA Ventura ORANGE Orange BLYTHE Riverside REDONDO BEACH Los Angeles CHINO San Bernardino CORONADO San Diego BANNING Riverside LAWNDALE Los Angeles Biggest increase in homicide rate in last 10 years (based on three-year moving averages) City County Change First year This year Population 1 SEAL BEACH Orange DESERT HOT SPRINGS Riverside NEEDLES San Bernardino SAN JACINTO Riverside CORONADO San Diego ORANGE Orange VICTORVILLE San Bernardino LAWNDALE Los Angeles LOMITA Los Angeles IMPERIAL BEACH San Diego
57 Biggest increase in burglary rate from City County Change Last year This year Population 1 WALNUT Los Angeles ROSEMEAD Los Angeles BARSTOW San Bernardino SAN DIEGO San Diego TEMECULA Riverside TEMPLE CITY Los Angeles AGOURA HILLS Los Angeles SOUTH PASADENA Los Angeles CLAREMONT Los Angeles OXNARD Ventura Biggest increase in burglary rate in last 5 years (based on three-year moving averages) City County Change First year This year Population 1 RANCHO CUCAMONGA San Bernardino MONTEBELLO Los Angeles LONG BEACH Los Angeles SAN BERNARDINO San Bernardino HEMET Riverside HESPERIA San Bernardino HIGHLAND San Bernardino RIALTO San Bernardino VICTORVILLE San Bernardino CERRITOS Los Angeles Biggest increase in burglary rate in last 10 years (based on three-year moving averages) City County Change First year This year Population 1 VICTORVILLE San Bernardino MONTEBELLO Los Angeles RANCHO CUCAMONGA San Bernardino SAN JACINTO Riverside MORENO VALLEY Riverside RIALTO San Bernardino HESPERIA San Bernardino ADELANTO San Bernardino BRAWLEY Imperial HIGHLAND San Bernardino
58 Figure year change in adjusted homicide rate (from 2008 to 2013) for Southern California cities 53
59 54
60 Biggest increase in motor vehicle theft rate from City County Change Last year This year Population 1 RIVERSIDE Riverside ANAHEIM Orange MAYWOOD Los Angeles BANNING Riverside INDIO Riverside HEMET Riverside PALM SPRINGS Riverside ONTARIO San Bernardino OXNARD Ventura HIGHLAND San Bernardino Biggest increase in motor vehicle theft rate in last 5 years (based on three-year moving averages) City County Change First year This year Population 1 ANAHEIM Orange SIGNAL HILL Los Angeles HEMET Riverside LA PALMA Orange WESTLAKE VILLAGE Los Angeles HERMOSA BEACH Los Angeles NEEDLES San Bernardino PALOS VERDES ESTATES Los Angeles VILLA PARK Orange ROLLING HILLS ESTATES Los Angeles Biggest increase in motor vehicle theft rate in last 10 years (based on three-year moving averages) City County Change First year This year Population 1 COACHELLA Riverside HEMET Riverside PERRIS Riverside SAN JACINTO Riverside HESPERIA San Bernardino ADELANTO San Bernardino VICTORVILLE San Bernardino NEEDLES San Bernardino DESERT HOT SPRINGS Riverside BEAUMONT Riverside
61 Biggest increase in larceny rate from City County Change Last year This year Population 1 OXNARD Ventura HEMET Riverside SAN JACINTO Riverside PALM SPRINGS Riverside BRAWLEY Imperial PASADENA Los Angeles LAMESA San Diego CALEXICO Imperial TEMECULA Riverside EL CAJON San Diego Biggest increase in larceny rate in last 5 years (based on three-year moving averages) City County Change First year This year Population 1 HUNTINGTON BEACH Orange CULVER CITY Los Angeles RIALTO San Bernardino BEAUMONT Riverside ANAHEIM Orange SANTA MONICA Los Angeles EL CENTRO Imperial COSTA MESA Orange CALEXICO Imperial REDLANDS San Bernardino Biggest increase in larceny rate in last 10 years (based on three-year moving averages) City County Change First year This year Population 1 EL CENTRO Imperial SAN JACINTO Riverside HUNTINGTON BEACH Orange CULVER CITY Los Angeles BEAUMONT Riverside FONTANA San Bernardino HEMET Riverside INDIO Riverside CALEXICO Imperial PICO RIVERA Los Angeles
62 Figure 1. 5-year change in adjusted motor vehicle theft rate (from 2008 to 2013) for Southern California cities 57
63 58
64 Top 10 cities with biggest decreases in crime in last 1, 5, and 10 years These tables focus on the cities showing the biggest decrease in crime in recent years. For each crime type we display three tables: 1) Top 10 with the biggest decrease in the last year; 2) Top 10 with the biggest decrease in the last five years; 3) Top 10 with the biggest decrease in the last ten years. A few notable trends in crime decreases: Over the last one, five, and ten year periods, the city of Los Angeles has seen substantial and consistent decreases in aggravated assaults, robberies, homicides, and motor vehicle thefts. Over the past ten years in Los Angeles, aggravated assaults and robberies in particular decreased dramatically compared to the cities with the second greatest declines: San Diego (aggravated assaults) and Inglewood (robberies). Over the past one, five, and ten years, the greatest declines in violent crime occurred most consistently across Los Angeles County: for all but one of the top ten lists reviewing aggravated assaults, robberies, and homicides; cities in Los Angeles County occupied at least 6 of the 10 slots. The cities of San Diego and Huntington Park showed continued decreases in motor vehicle thefts over the past one, five, and ten years. Across the top ten lists for crime declines over the past ten years, the city of Los Angeles demonstrated the greatest crime drops for all crime types. In the past year, Long Beach has been among the top ten Southern California cities with declining aggravated assaults, robberies, motor vehicle thefts, and larcenies. Over the past year and past five years, Palm Desert and Palm Springs have been among the top ten cities in declining burglary rates. In the past one, five, and ten years, Chula Vista has consistently been among the top ten cities in declining rates of motor vehicle theft. In the past year, Calexico has been among the top ten cities in declining burglaries and motor vehicle thefts. In the past year, Rialto has been among the top ten cities with decreasing rates of motor vehicle theft and larceny theft. In the past year, the city of Highland has been among the top ten cities with decreasing rates of aggravated assault, robbery, and burglary. 59
65 Biggest decrease in aggravated assault rate from City County Change Last year This year Population 1 COACHELLA Riverside CARSON Los Angeles LOS ANGELES Los Angeles LONG BEACH Los Angeles LA QUINTA Riverside WEST HOLLYWOOD Los Angeles HIGHLAND San Bernardino DESERT HOT SPRINGS Riverside POMONA Los Angeles LYNWOOD Los Angeles Biggest decrease in aggravated assault rate in last 5 years (based on three-year moving averages) City County Change First year This year Population 1 LOS ANGELES Los Angeles COMPTON Los Angeles EL MONTE Los Angeles LANCASTER Los Angeles SANTA ANA Orange LONG BEACH Los Angeles RIVERSIDE Riverside ONTARIO San Bernardino BARSTOW San Bernardino PARAMOUNT Los Angeles Biggest decrease in aggravated assault rate in last 10 years (based on three-year moving averages) City County Change First year This year Population 1 LOS ANGELES Los Angeles SAN DIEGO San Diego COMPTON Los Angeles LYNWOOD Los Angeles BLYTHE Riverside RIALTO San Bernardino RIVERSIDE Riverside SAN BERNARDINO San Bernardino LONG BEACH Los Angeles ONTARIO San Bernardino
66 Figure 2. 5-year change in adjusted robbery rate (from 2008 to 2013) for Southern California cities 61
67 62
68 Biggest decrease in robbery rate from City County Change Last year This year Population 1 LOS ANGELES Los Angeles WEST HOLLYWOOD Los Angeles ONTARIO San Bernardino COMPTON Los Angeles POMONA Los Angeles FONTANA San Bernardino HUNTINGTON PARK Los Angeles BURBANK Los Angeles LONG BEACH Los Angeles HIGHLAND San Bernardino Biggest decrease in robbery rate in last 5 years (based on three-year moving averages) City County Change First year This year Population 1 LOS ANGELES Los Angeles SAN DIEGO San Diego GARDENA Los Angeles SANTA ANA Orange HUNTINGTON PARK Los Angeles RIVERSIDE Riverside INGLEWOOD Los Angeles LAKEWOOD Los Angeles COMPTON Los Angeles BELLFLOWER Los Angeles Biggest decrease in robbery rate in last 10 years (based on three-year moving averages) City County Change First year This year Population 1 LOS ANGELES Los Angeles INGLEWOOD Los Angeles SANTA ANA Orange GARDENA Los Angeles SANTA MONICA Los Angeles COMPTON Los Angeles ONTARIO San Bernardino BELLFLOWER Los Angeles TORRANCE Los Angeles LONG BEACH Los Angeles
69 Biggest decrease in homicide rate from City County Change Last year This year Population 1 LYNWOOD Los Angeles LOS ANGELES Los Angeles DESERT HOT SPRINGS Riverside SOUTH GATE Los Angeles SAN FERNANDO Los Angeles CORONADO San Diego BELLFLOWER Los Angeles HESPERIA San Bernardino FILLMORE Ventura MONTEREY PARK Los Angeles Biggest decrease in homicide rate in last 5 years (based on three-year moving averages) City County Change First year This year Population 1 LOS ANGELES Los Angeles COMPTON Los Angeles INGLEWOOD Los Angeles CARSON Los Angeles LYNWOOD Los Angeles RIALTO San Bernardino SANTA ANA Orange PARAMOUNT Los Angeles COVINA Los Angeles CUDAHY Los Angeles Biggest decrease in homicide rate in last 10 years (based on three-year moving averages) City County Change First year This year Population 1 LOS ANGELES Los Angeles COMPTON Los Angeles INGLEWOOD Los Angeles LYNWOOD Los Angeles LONG BEACH Los Angeles COMMERCE Los Angeles RIALTO San Bernardino LA PUENTE Los Angeles PARAMOUNT Los Angeles HUNTINGTON PARK Los Angeles
70 Figure 3. 5-year change in adjusted burglary rate (from 2008 to 2013) for Southern California cities 65
71 66
72 Biggest decrease in burglary rate from City County Change Last year This year Population 1 EL CENTRO Imperial VICTORVILLE San Bernardino CATHEDRAL CITY Riverside RANCHO MIRAGE Riverside PALM SPRINGS Riverside LA QUINTA Riverside CALEXICO Imperial PALM DESERT Riverside BIG BEAR LAKE San Bernardino HIGHLAND San Bernardino Biggest decrease in burglary rate in last 5 years (based on three-year moving averages) City County Change First year This year Population 1 LOS ANGELES Los Angeles LANCASTER Los Angeles SAN DIEGO San Diego DESERT HOT SPRINGS Riverside BARSTOW San Bernardino SANTA FE SPRINGS Los Angeles PALM DESERT Riverside VISTA San Diego PALM SPRINGS Riverside MURRIETA Riverside Biggest decrease in burglary rate in last 10 years (based on three-year moving averages) City County Change First year This year Population 1 LOS ANGELES Los Angeles SAN DIEGO San Diego VISTA San Diego GLENDALE Los Angeles EL CAJON San Diego ANAHEIM Orange SANTA PAULA Ventura LEMON GROVE San Diego SOUTH GATE Los Angeles GARDENA Los Angeles
73 Biggest decrease in motor vehicle theft rate from City County Change Last year This year Population 1 BARSTOW San Bernardino CHULA VISTA San Diego CALEXICO Imperial LONG BEACH Los Angeles SAN DIEGO San Diego POMONA Los Angeles LOS ANGELES Los Angeles DOWNEY Los Angeles RIALTO San Bernardino HUNTINGTON PARK Los Angeles Biggest decrease in motor vehicle theft rate in last 5 years (based on three-year moving averages) City County Change First year This year Population 1 SAN DIEGO San Diego LOS ANGELES Los Angeles CHULA VISTA San Diego EL CAJON San Diego NATIONAL CITY San Diego HUNTINGTON PARK Los Angeles DESERT HOT SPRINGS Riverside LYNWOOD Los Angeles BALDWIN PARK Los Angeles SANTA ANA Orange Biggest decrease in motor vehicle theft rate in last 10 years (based on three-year moving averages) City County Change First year This year Population 1 LOS ANGELES Los Angeles SAN DIEGO San Diego ONTARIO San Bernardino LONG BEACH Los Angeles SANTA ANA Orange CHULA VISTA San Diego RIVERSIDE Riverside EL CAJON San Diego HUNTINGTON PARK Los Angeles NATIONAL CITY San Diego
74 Figure 4. 5-year change in adjusted larceny rate (from 2008 to 2013) for Southern California cities 69
75 70
76 Biggest decrease in larceny rate from City County Change Last year This year Population 1 SAN BERNARDINO San Bernardino RIALTO San Bernardino HUNTINGTON BEACH Orange LONG BEACH Los Angeles WESTMINSTER Orange POMONA Los Angeles CORONA Riverside COVINA Los Angeles RANCHO CUCAMONGA San Bernardino SANTA ANA Orange Biggest decrease in larceny rate in last 5 years (based on three-year moving averages) City County Change First year This year Population 1 SAN DIEGO San Diego MONTCLAIR San Bernardino PALM SPRINGS Riverside UPLAND San Bernardino PALM DESERT Riverside LOS ANGELES Los Angeles RANCHO MIRAGE Riverside PASADENA Los Angeles LANCASTER Los Angeles NORCO Riverside Biggest decrease in larceny rate in last 10 years (based on three-year moving averages) City County Change First year This year Population 1 LOS ANGELES Los Angeles SAN DIEGO San Diego ONTARIO San Bernardino SAN BERNARDINO San Bernardino PALM SPRINGS Riverside SANTA ANA Orange RIVERSIDE Riverside TORRANCE Los Angeles EL CAJON San Diego MONTEBELLO Los Angeles
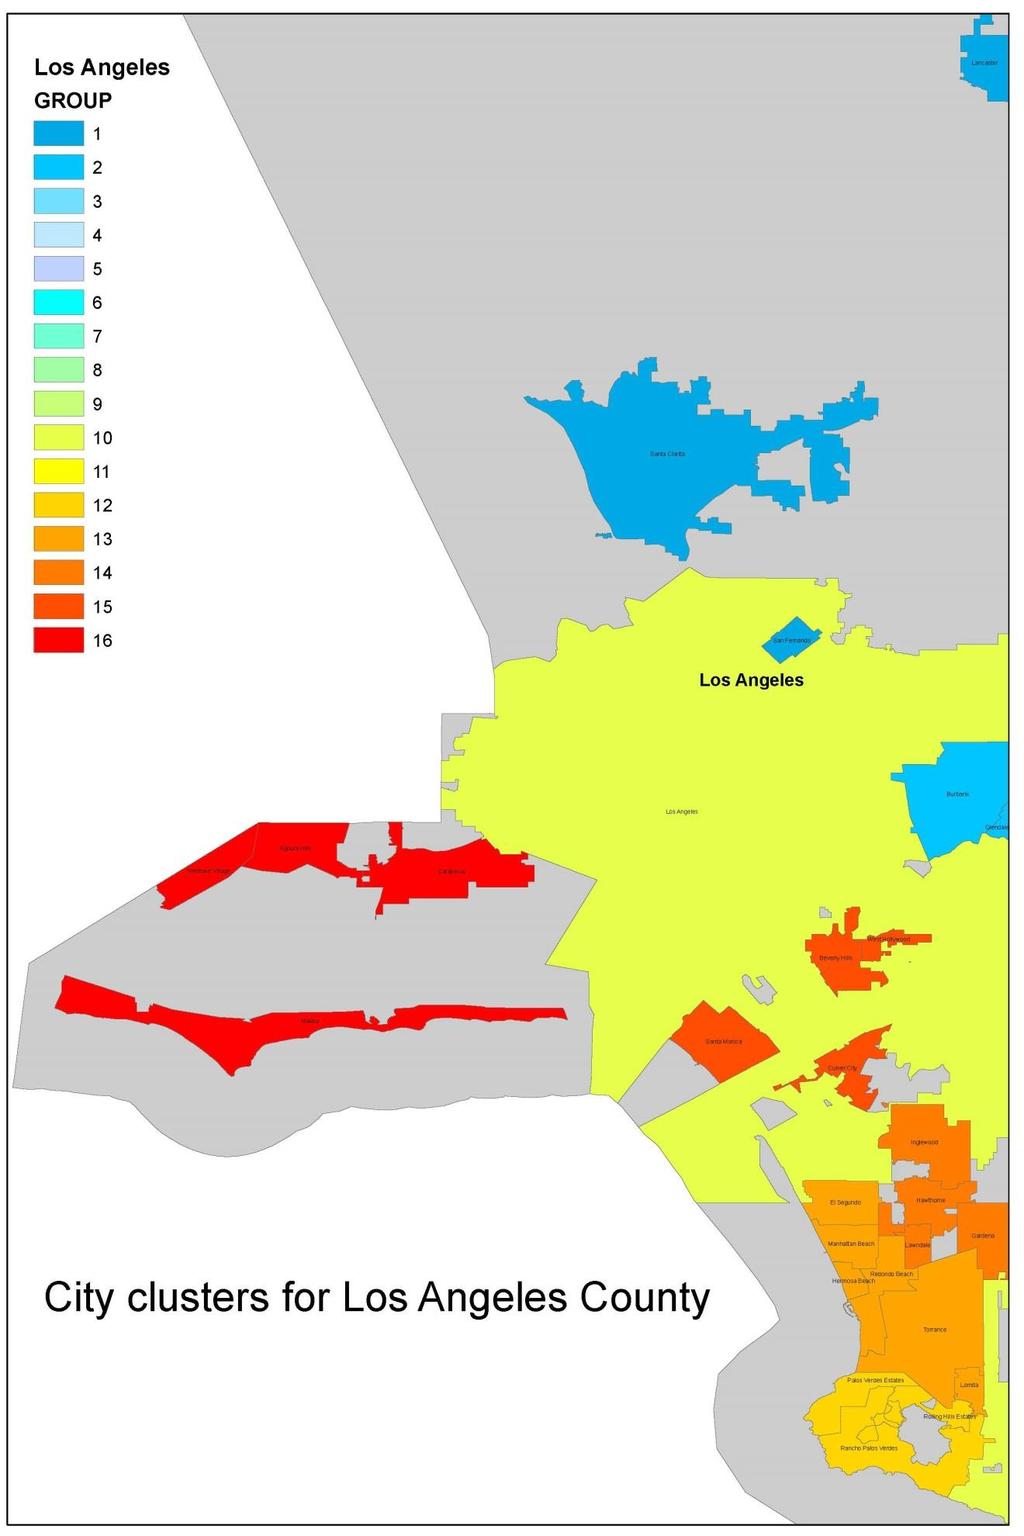
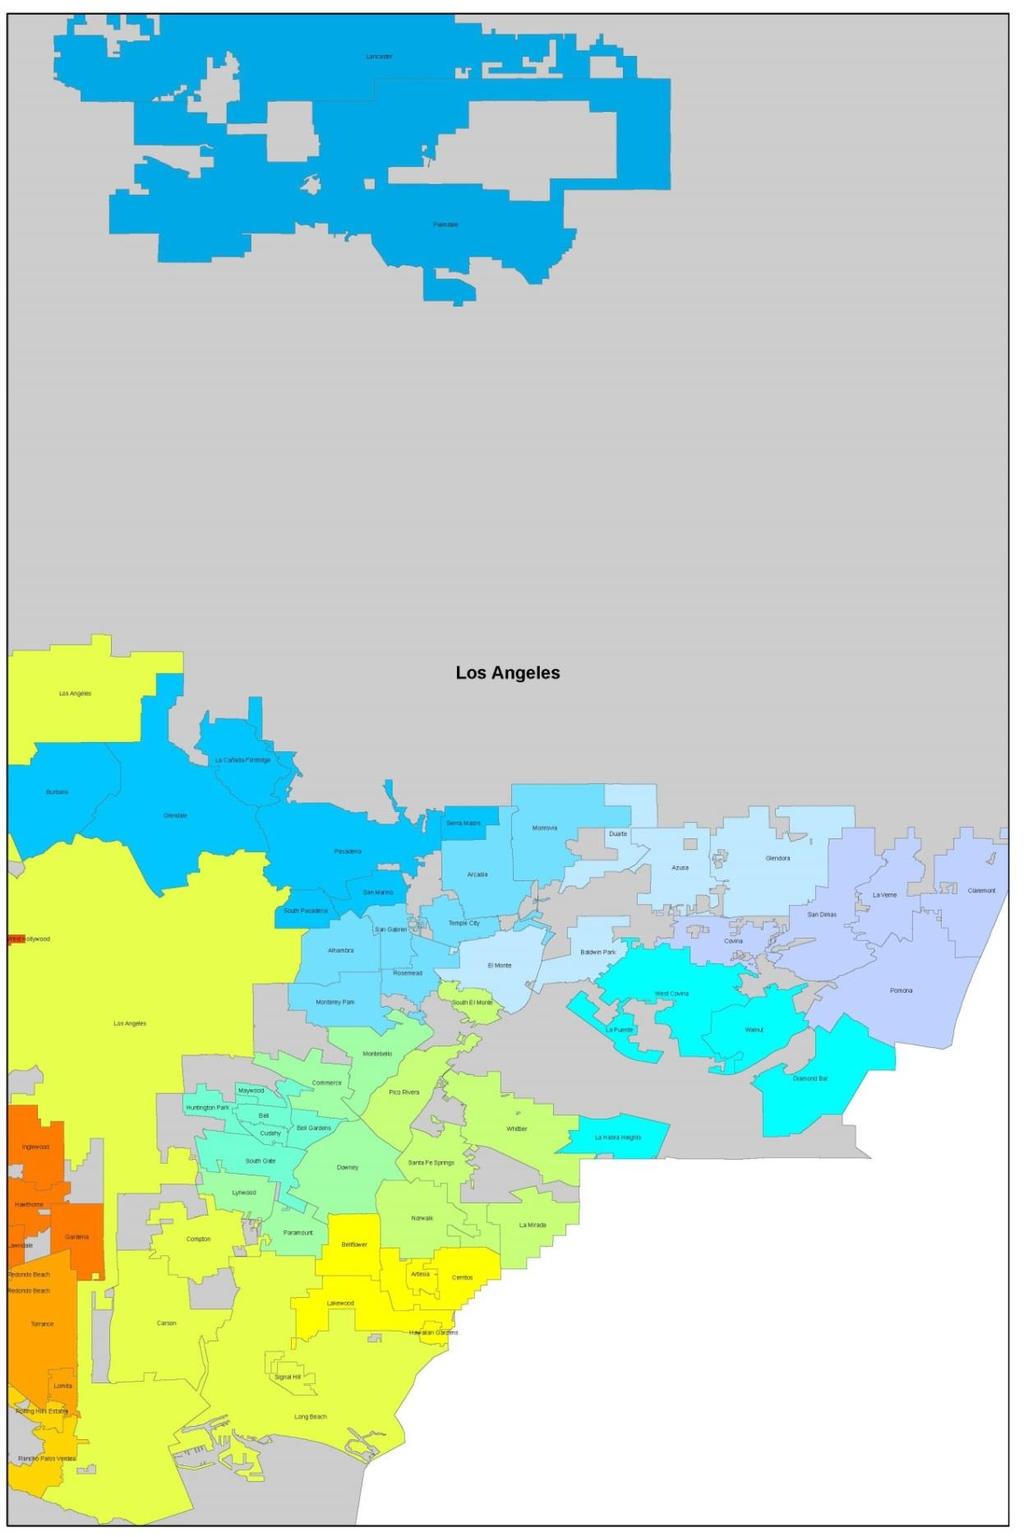
77 Chapter 4. County-specific focus In this section, we display the adjusted crime rates for all cities in each of the six major counties in the region. We present the results for each county separately, beginning with Los Angeles County. The first table for each county shows the adjusted crime rate in the most recent year (2013) for all cities in the county. The second table shows the average adjusted crime rate over the three most recent years ( ) for all cities in the county. After the two tables, we then display Figures showing the 10 year trajectory of the violent crime rate for the cities in the county. Each Figure presents the trajectories for a geographic cluster of cities. A map in each section shows the geographic clustering of cities for these figures. For each Figure, the scale is typically from 0 to 400. Thus, the bottom value is a city with no violent crime, whereas 400 indicates a city with a violent crime rate 300% higher than the regional average ( = 300). For a few of the Figures, we had to extend the scale if certain cities had particularly high violent crime rates. To understand how to interpret the tables, note that in the first table for Los Angeles County, the city of Bell has an adjusted aggravated assault rate of 154.2, indicating that in 2013 their aggravated assault rate was 54.2% higher than the average city in the region. The robbery rate in Bell was 115.1% higher than the average city in the region ( = 115.1). Bell had no homicides in 2013, thus the adjusted homicide rate is 0. However, their property crime rate was below the average of the region, as the burglary rate was 57.4% of the regional average, motor vehicle theft was just below the average, and larceny was about 60% of the regional average. 72
78 Los Angeles County Adjusted crime rates for cities in Los Angeles County, 2013 City Assault Robbery Homicide Burglary Auto Theft Larceny Pop 1 AGOURA HILLS ALHAMBRA ARCADIA ARTESIA AZUSA BALDWIN PARK BELL BELL GARDENS BELLFLOWER BEVERLY HILLS BURBANK CALABASAS CARSON CERRITOS CLAREMONT COMMERCE COMPTON COVINA CUDAHY CULVER CITY DIAMOND BAR DOWNEY DUARTE EL MONTE EL SEGUNDO GARDENA GLENDALE GLENDORA HAWAIIAN GARDENS HAWTHORNE HERMOSA BEACH HUNTINGTON PARK INGLEWOOD LA CANADA FLINTRIDGE LA HABRA HEIGHTS LA MIRADA LA PUENTE LA VERNE LAKEWOOD LANCASTER
79 41 LAWNDALE LOMITA LONG BEACH LOS ANGELES LYNWOOD MALIBU MANHATTAN BEACH MAYWOOD MONROVIA MONTEBELLO MONTEREY PARK NORWALK PALMDALE PALOS VERDES ESTATES PARAMOUNT PASADENA PICO RIVERA POMONA RANCHO PALOS VERDES REDONDO BEACH ROLLING HILLS ESTATES ROSEMEAD SAN DIMAS SAN FERNANDO SAN GABRIEL SAN MARINO SANTA CLARITA SANTA FE SPRINGS SANTA MONICA SIERRA MADRE SIGNAL HILL SOUTH EL MONTE SOUTH GATE SOUTH PASADENA TEMPLE CITY TORRANCE WALNUT WEST COVINA WEST HOLLYWOOD WESTLAKE VILLAGE WHITTIER
80 Adjusted crime rates for cities in Los Angeles County, average from City Assault Robbery Homicide Burglary Auto Theft Larceny Pop 1 AGOURA HILLS ALHAMBRA ARCADIA ARTESIA AZUSA BALDWIN PARK BELL BELL GARDENS BELLFLOWER BEVERLY HILLS BURBANK CALABASAS CARSON CERRITOS CLAREMONT COMMERCE COMPTON COVINA CUDAHY CULVER CITY DIAMOND BAR DOWNEY DUARTE EL MONTE EL SEGUNDO GARDENA GLENDALE GLENDORA HAWAIIAN GARDENS HAWTHORNE HERMOSA BEACH HUNTINGTON PARK INGLEWOOD LA CANADA FLINTRIDGE LA HABRA HEIGHTS LA MIRADA LA PUENTE LA VERNE LAKEWOOD LANCASTER
81 41 LAWNDALE LOMITA LONG BEACH LOS ANGELES LYNWOOD MALIBU MANHATTAN BEACH MAYWOOD MONROVIA MONTEBELLO MONTEREY PARK NORWALK PALMDALE PALOS VERDES ESTATES PARAMOUNT PASADENA PICO RIVERA POMONA RANCHO PALOS VERDES REDONDO BEACH ROLLING HILLS ESTATES ROSEMEAD SAN DIMAS SAN FERNANDO SAN GABRIEL SAN MARINO SANTA CLARITA SANTA FE SPRINGS SANTA MONICA SIERRA MADRE SIGNAL HILL SOUTH EL MONTE SOUTH GATE SOUTH PASADENA TEMPLE CITY TORRANCE WALNUT WEST COVINA WEST HOLLYWOOD WESTLAKE VILLAGE WHITTIER
82 77
83 78
84 Adjusted violent crime rate Adjusted violent crime rate Adjusted violent crime rates for cities in Los Angeles County - last 10 years 400 Adjusted violent crime rates over the last 10 years: North Los Angeles County LANCASTER PALMDALE SAN FERNANDO SANTA CLARITA Adjusted violent crime rates over the last 10 years: Northwest San Gabriel Valley BURBANK GLENDALE LA CANADA FLINTRIDGE PASADENA SAN MARINO SOUTH PASADENA SIERRA MADRE
85 Adjusted violent crime rate Adjusted violent crime rate 400 Adjusted violent crime rates over the last 10 years: North central San Gabriel Valley ALHAMBRA ARCADIA MONROVIA MONTEREY PARK ROSEMEAD SAN GABRIEL TEMPLE CITY Adjusted violent crime rates over the last 10 years: Central San Gabriel Valley AZUSA BALDWIN PARK DUARTE EL MONTE GLENDORA
86 Adjusted violent crime rate Adjusted violent crime rate 400 Adjusted violent crime rates over the last 10 years: East Los Angeles County COVINA CLAREMONT LA VERNE POMONA SAN DIMAS Adjusted violent crime rates over the last 10 years: South San Gabriel Valley DIAMOND BAR LA HABRA HEIGHTS LA PUENTE WALNUT WEST COVINA
87 Adjusted violent crime rate Adjusted violent crime rate 400 Adjusted violent crime rates over the last 10 years: Central Los Angeles County BELL BELL GARDENS CUDAHY HUNTINGTON PARK MAYWOOD SOUTH GATE Adjusted violent crime rates over the last 10 years: Central Los Angeles County COMMERCE DOWNEY LYNWOOD MONTEBELLO PARAMOUNT
88 Adjusted violent crime rate Adjusted violent crime rate 400 Adjusted violent crime rates over the last 10 years: Central east Los Angeles County LA MIRADA NORWALK PICO RIVERA SANTA FE SPRINGS SOUTH EL MONTE WHITTIER Adjusted violent crime rates over the last 10 years: South central Los Angeles County CARSON COMPTON LONG BEACH LOS ANGELES SIGNAL HILL
89 Adjusted violent crime rate Adjusted violent crime rate 400 Adjusted violent crime rates over the last 10 years: East central Los Angeles County ARTESIA BELLFLOWER CERRITOS HAWAIIAN GARDENS LAKEWOOD Adjusted violent crime rates over the last 10 years: Palos Verdes PALOS VERDES ESTATES RANCHO PALOS VERDES ROLLING HILLS ESTATES
90 Adjusted violent crime rate Adjusted violent crime rate 400 Adjusted violent crime rates over the last 10 years: South Bay EL SEGUNDO HERMOSA BEACH LOMITA MANHATTAN BEACH REDONDO BEACH TORRANCE Adjusted violent crime rates over the last 10 years: West-central Los Angeles GARDENA HAWTHORNE INGLEWOOD LAWNDALE
91 Adjusted violent crime rate Adjusted violent crime rate 400 Adjusted violent crime rates over the last 10 years: Westside Los Angeles BEVERLY HILLS CULVER CITY SANTA MONICA WEST HOLLYWOOD Adjusted violent crime rates over the last 10 years: Western Los Angeles County AGOURA HILLS CALABASAS MALIBU WESTLAKE VILLAGE
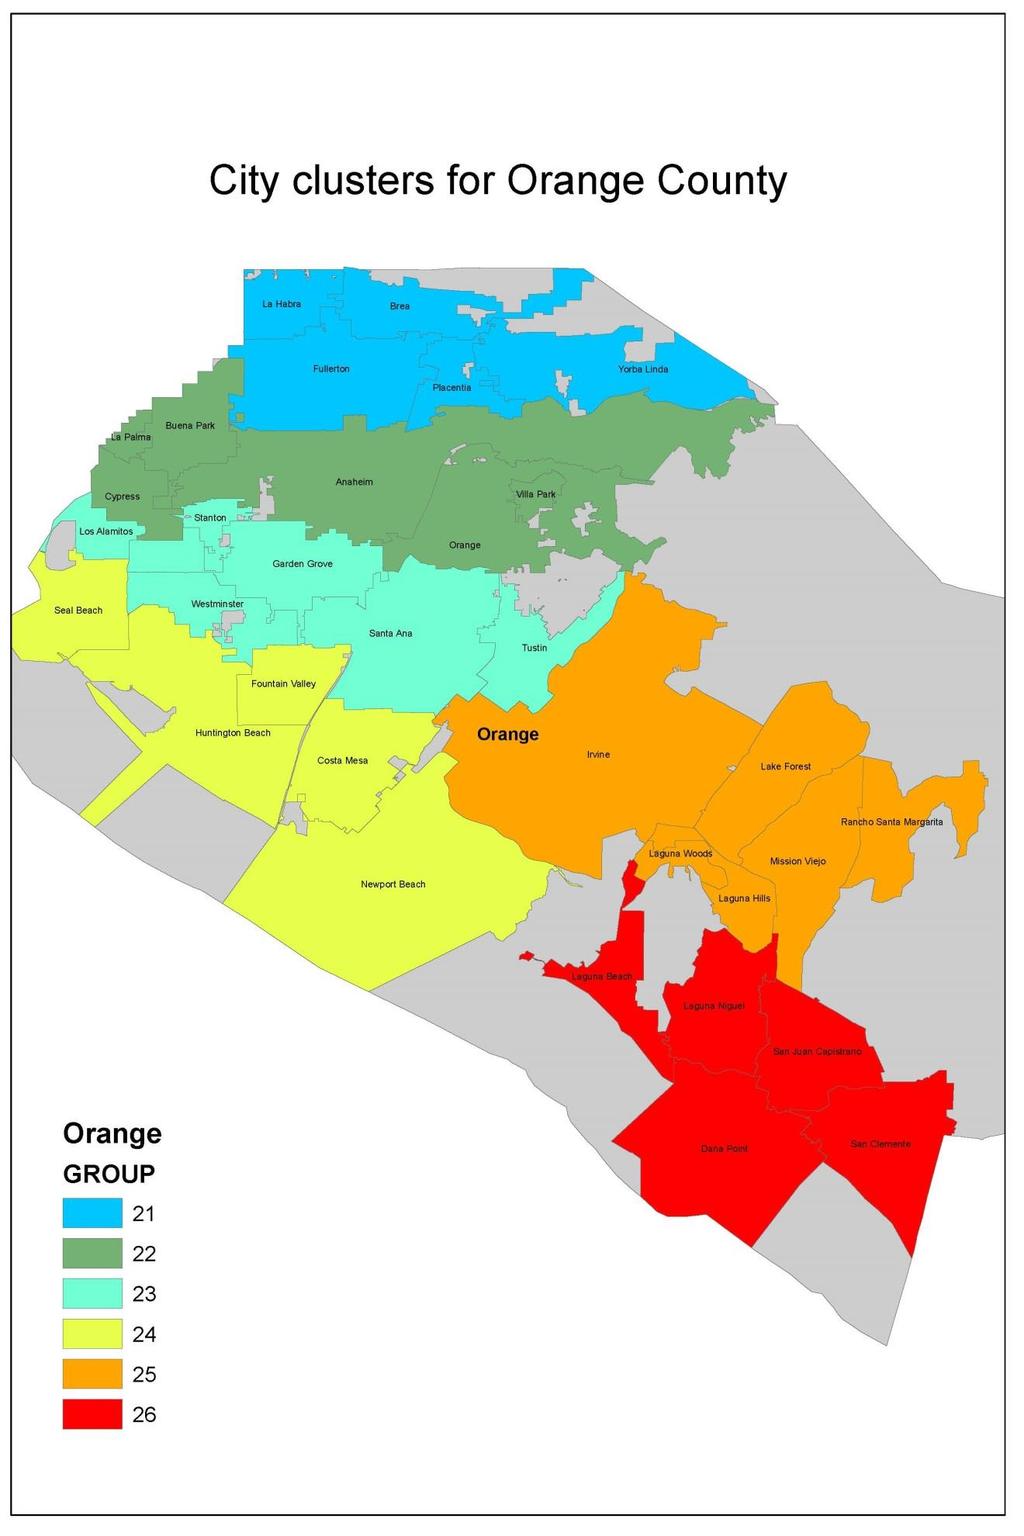
92 Orange County This section shows the crime rate trends for Orange County cities. The first table shows the adjusted crime rate in the most recent year (2013) for all cities. The second table shows the average adjusted crime rate over the three most recent years ( ) for all cities. After the two tables, we then display Figures showing the 10 year trajectory of the violent crime rate for the cities in the county. These cities are clustered geographically into city clusters, and the map shows the clustering of cities for these figures. For each Figure, the scale is typically from 0 to 400. Thus, the bottom value is a city with no violent crime, whereas 400 indicates a city with a violent crime rate 300% higher than the regional average ( = 300). For a few of the Figures, we had to extend the scale if certain cities had particularly high violent crime rates. 87
93 Adjusted crime rates for cities in Orange County, 2013 City Assault Robbery Homicide Burglary Auto Theft Larceny Pop 1 ANAHEIM BREA BUENA PARK COSTA MESA CYPRESS DANA POINT FOUNTAIN VALLEY FULLERTON GARDEN GROVE HUNTINGTON BEACH IRVINE LA HABRA LA PALMA LAGUNA BEACH LAGUNA HILLS LAGUNA NIGUEL LAGUNA WOODS LAKE FOREST LOS ALAMITOS MISSION VIEJO NEWPORT BEACH ORANGE PLACENTIA RANCHO SANTA MARGARITA SAN CLEMENTE SAN JUAN CAPISTRANO SANTA ANA SEAL BEACH STANTON TUSTIN VILLA PARK WESTMINSTER YORBA LINDA
94 Adjusted crime rates for cities in Orange County, average from City Assault Robbery Homicide Burglary Auto Theft Larceny Pop 1 ANAHEIM BREA BUENA PARK COSTA MESA CYPRESS DANA POINT FOUNTAIN VALLEY FULLERTON GARDEN GROVE HUNTINGTON BEACH IRVINE LA HABRA LA PALMA LAGUNA BEACH LAGUNA HILLS LAGUNA NIGUEL LAGUNA WOODS LAKE FOREST LOS ALAMITOS MISSION VIEJO NEWPORT BEACH ORANGE PLACENTIA RANCHO SANTA MARGARITA SAN CLEMENTE SAN JUAN CAPISTRANO SANTA ANA SEAL BEACH STANTON TUSTIN VILLA PARK WESTMINSTER YORBA LINDA
95 90
96 Adjusted violent crime rate Adjusted violent crime rate Adjusted violent crime rates for cities in Orange County - last 10 years 400 Adjusted violent crime rates over the last 10 years: North Orange County FULLERTON BREA LA HABRA PLACENTIA YORBA LINDA Adjusted violent crime rates over the last 10 years: Central Orange County ANAHEIM LA PALMA BUENA PARK ORANGE CYPRESS VILLA PARK
97 Adjusted violent crime rate Adjusted violent crime rate 400 Adjusted violent crime rates over the last 10 years: West-central Orange County SANTA ANA GARDEN GROVE WESTMINSTER TUSTIN LOS ALAMITOS STANTON Adjusted violent crime rates over the last 10 years: North beaches Orange County SEAL BEACH HUNTINGTON BEACH FOUNTAIN VALLEY NEWPORT BEACH COSTA MESA
98 Adjusted violent crime rate Adjusted violent crime rate 400 Adjusted violent crime rates over the last 10 years: South Orange County IRVINE LAGUNA HILLS LAKE FOREST MISSION VIEJO RANCHO SANTA MARGARITA LAGUNA WOODS Adjusted violent crime rates over the last 10 years: South Orange County beaches SAN CLEMENTE SAN JUAN CAPISTRANO DANA POINT LAGUNA BEACH LAGUNA NIGUEL
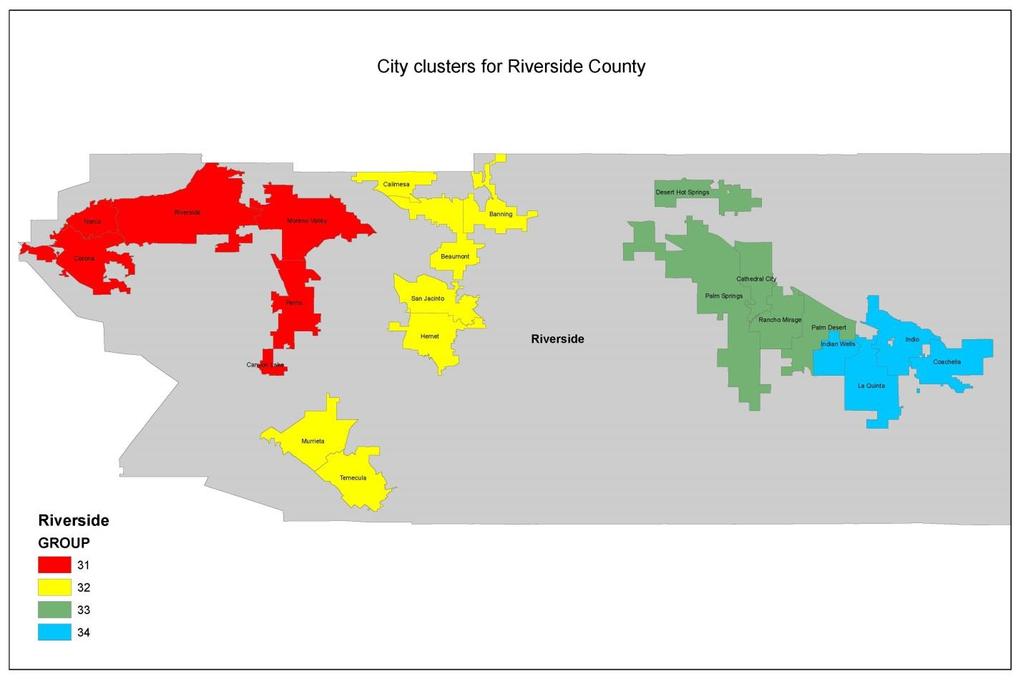
99 Riverside County This section shows the crime rate trends for Riverside County cities. The first table shows the adjusted crime rate in the most recent year (2013) for all cities. The second table shows the average adjusted crime rate over the three most recent years ( ) for all cities. After the two tables, we then display Figures showing the 10 year trajectory of the violent crime rate for the cities in the county. These cities are clustered geographically into city clusters, and the map shows the clustering of cities for these figures. For each Figure, the scale is typically from 0 to 400. Thus, the bottom value is a city with no violent crime, whereas 400 indicates a city with a violent crime rate 300% higher than the regional average ( = 300). For a few of the Figures, we had to extend the scale if certain cities had particularly high violent crime rates. 94
100 Adjusted crime rates for cities in Riverside County, 2013 City Assault Robbery Homicide Burglary Auto Theft Larceny Pop 1 BANNING BEAUMONT BLYTHE CABAZON CALIMESA CANYON LAKE CATHEDRAL CITY COACHELLA CORONA DESERT HOT SPRINGS ELSINORE HEMET INDIAN WELLS INDIO LA QUINTA MORENO VALLEY MURRIETA NORCO PALM DESERT PALM SPRINGS PERRIS RANCHO MIRAGE RIVERSIDE SAN JACINTO TEMECULA
101 Adjusted crime rates for cities in Riverside County, average from City Assault Robbery Homicide Burglary Auto Theft Larceny Pop 1 BANNING BEAUMONT BLYTHE CABAZON CALIMESA CANYON LAKE CATHEDRAL CITY COACHELLA CORONA DESERT HOT SPRINGS ELSINORE HEMET INDIAN WELLS INDIO LA QUINTA MORENO VALLEY MURRIETA NORCO PALM DESERT PALM SPRINGS PERRIS RANCHO MIRAGE RIVERSIDE SAN JACINTO TEMECULA
102 97
103 Adjusted violent crime rate Adjusted violent crime rate Adjusted violent crime rates for cities in Riverside County - last 10 years 400 Adjusted violent crime rates over the last 10 years: North-western Riverside County CANYON LAKE CORONA MORENO VALLEY NORCO PERRIS RIVERSIDE Adjusted violent crime rates over the last 10 years: South-western Riverside County BANNING BEAUMONT CALIMESA HEMET MURRIETA SAN JACINTO TEMECULA
104 Adjusted violent crime rate Adjusted violent crime rate 400 Adjusted violent crime rates over the last 10 years: West-central Riverside County CATHEDRAL CITY DESERT HOT SPRINGS PALM DESERT PALM SPRINGS RANCHO MIRAGE Adjusted violent crime rates over the last 10 years: East-central Riverside County BLYTHE COACHELLA INDIAN WELLS INDIO LA QUINTA
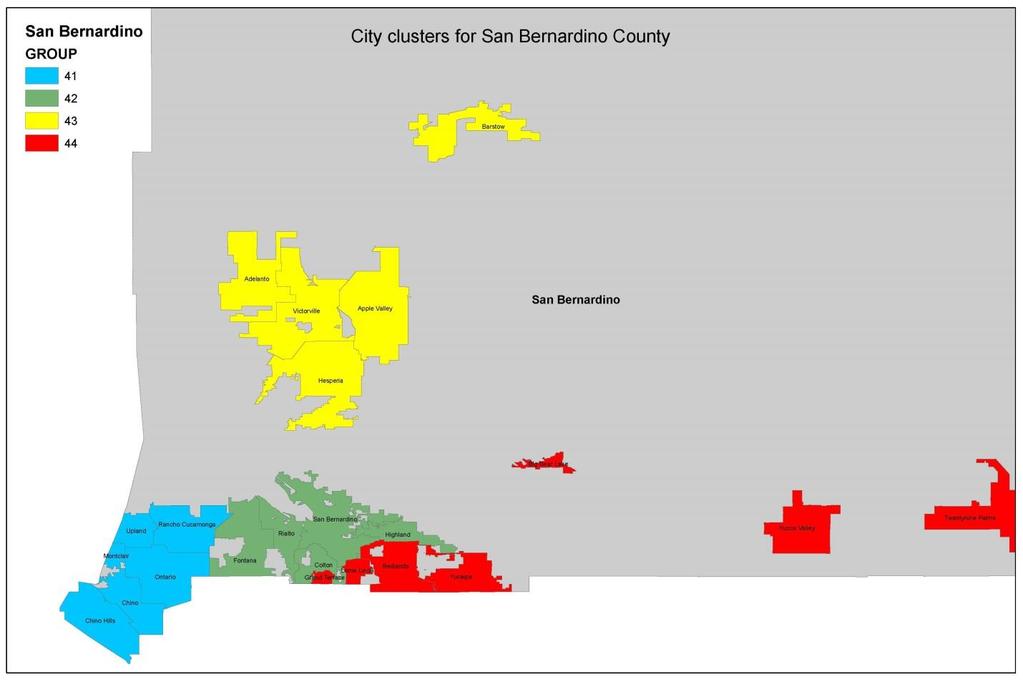
105 San Bernardino County This section shows the crime rate trends for San Bernardino County cities. The first table shows the adjusted crime rate in the most recent year (2013) for all cities. The second table shows the average adjusted crime rate over the three most recent years ( ) for all cities. After the two tables, we then display Figures showing the 10 year trajectory of the violent crime rate for the cities in the county. These cities are clustered geographically into city clusters, and the map shows the clustering of cities for these figures. For each Figure, the scale is typically from 0 to 400. Thus, the bottom value is a city with no violent crime, whereas 400 indicates a city with a violent crime rate 300% higher than the regional average ( = 300). For a few of the Figures, we had to extend the scale if certain cities had particularly high violent crime rates. 100
106 Adjusted crime rates for cities in San Bernardino County, 2013 City Assault Robbery Homicide Burglary Auto Theft Larceny Pop 1 ADELANTO APPLE VALLEY BARSTOW BIG BEAR LAKE CHINO CHINO HILLS COLTON FONTANA GRAND TERRACE HESPERIA HIGHLAND LOMA LINDA MONTCLAIR NEEDLES ONTARIO RANCHO CUCAMONGA REDLANDS RIALTO SAN BERNARDINO TWENTYNINE PALMS UPLAND VICTORVILLE YUCAIPA YUCCA VALLEY
107 Adjusted crime rates for cities in San Bernardino County, average from City Assault Robbery Homicide Burglary Auto Theft Larceny Pop 1 ADELANTO APPLE VALLEY BARSTOW BIG BEAR LAKE CHINO CHINO HILLS COLTON FONTANA GRAND TERRACE HESPERIA HIGHLAND LOMA LINDA MONTCLAIR NEEDLES ONTARIO RANCHO CUCAMONGA REDLANDS RIALTO SAN BERNARDINO TWENTYNINE PALMS UPLAND VICTORVILLE YUCAIPA YUCCA VALLEY
108 103
109 Adjusted violent crime rate Adjusted violent crime rate Adjusted violent crime rates for cities in San Bernardino County - last 10 years 400 Adjusted violent crime rates over the last 10 years: South-west San Bernardino County CHINO CHINO HILLS MONTCLAIR ONTARIO RANCHO CUCAMONGA UPLAND Adjusted violent crime rates over the last 10 years: South-central San Bernardino County COLTON FONTANA HIGHLAND RIALTO SAN BERNARDINO
110 Adjusted violent crime Adjusted violent crime rate 400 Adjusted violent crime rates over the last 10 years: North San Bernardino County ADELANTO APPLE VALLEY BARSTOW HESPERIA NEEDLES VICTORVILLE Adjusted violent crime rates over the last 10 years: North San Bernardino County BIG BEAR LAKE GRAND TERRACE LOMA LINDA REDLANDS TWENTYNINE PALMS YUCAIPA YUCCA VALLEY
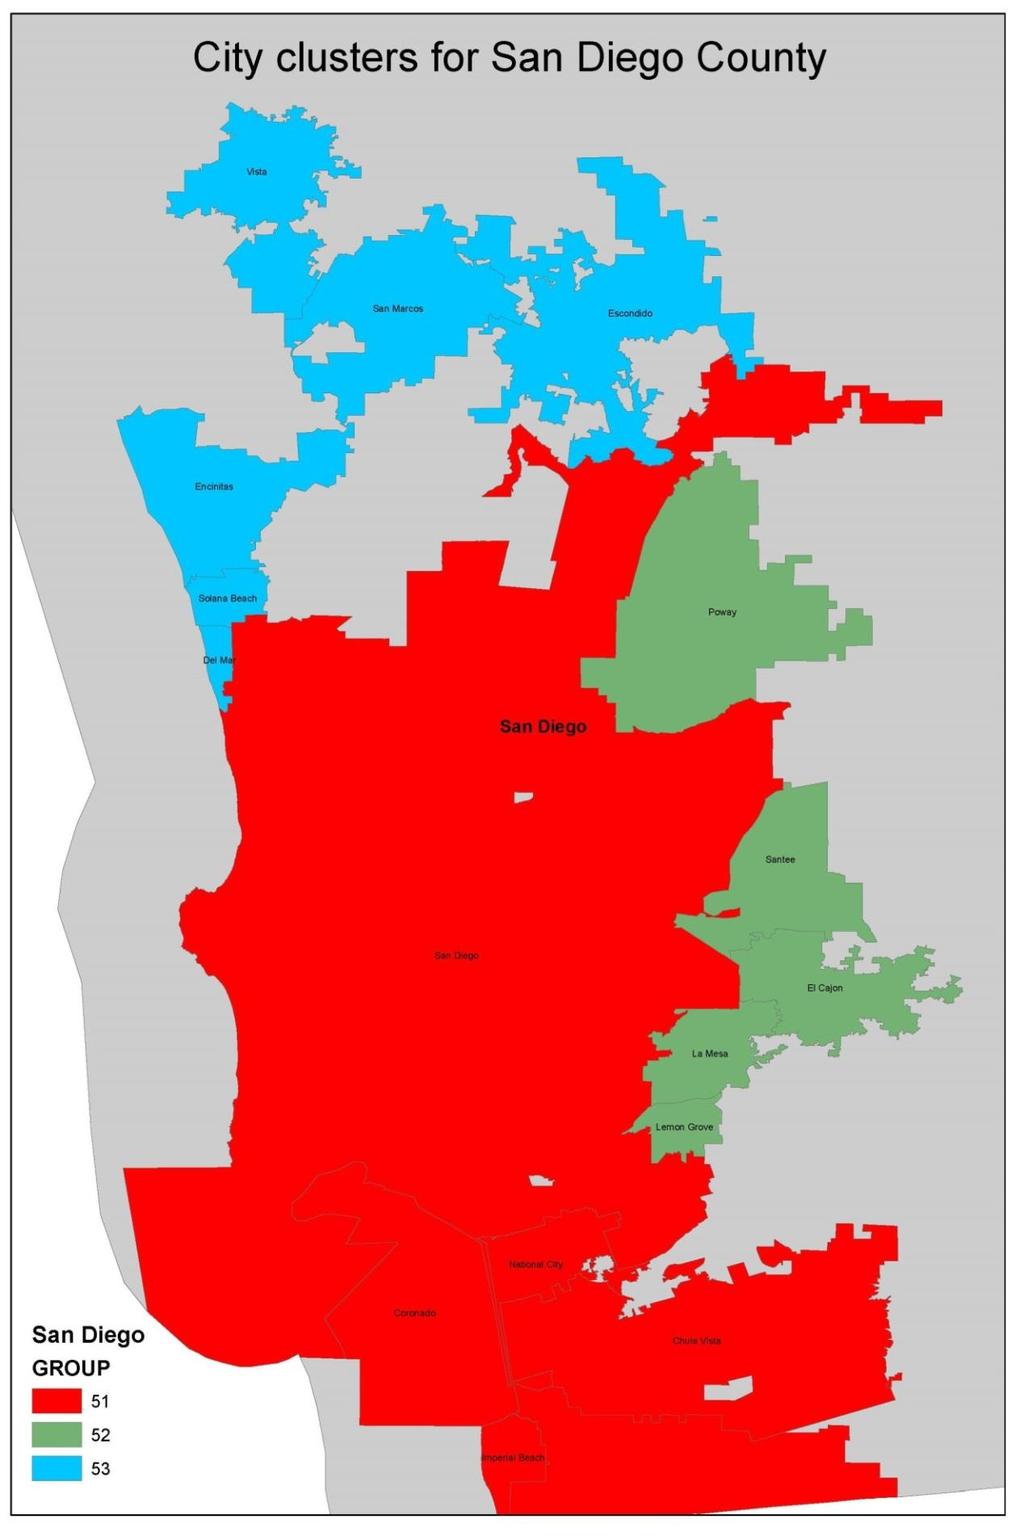
111 San Diego County This section shows the crime rate trends for San Diego County cities. The first table shows the adjusted crime rate in the most recent year (2013) for all cities. The second table shows the average adjusted crime rate over the three most recent years ( ) for all cities. After the two tables, we then display Figures showing the 10 year trajectory of the violent crime rate for the cities in the county. These cities are clustered geographically into city clusters, and the map shows the clustering of cities for these figures. For each Figure, the scale is typically from 0 to 400. Thus, the bottom value is a city with no violent crime, whereas 400 indicates a city with a violent crime rate 300% higher than the regional average ( = 300). For a few of the Figures, we had to extend the scale if certain cities had particularly high violent crime rates. 106
112 Adjusted crime rates for cities in San Diego County in 2013 City Assault Robbery Homicide Burglary Auto Theft Larceny Pop 1 CARSLBAD CHULA VISTA CORONADO DEL MAR EL CAJON ENCINITAS ESCONDIDO IMPERIAL BEACH LAMESA LEMON GROVE NATIONAL CITY POWAY SAN DIEGO SAN MARCOS SANTEE SOLANA BEACH VISTA
113 Adjusted crime rates for cities in San Diego County, average from City Assault Robbery Homicide Burglary Auto Theft Larceny Pop 1 CARSLBAD CHULA VISTA CORONADO DEL MAR EL CAJON ENCINITAS ESCONDIDO IMPERIAL BEACH LAMESA LEMON GROVE NATIONAL CITY POWAY SAN DIEGO SAN MARCOS SANTEE SOLANA BEACH VISTA
114 109
115 Adjusted violent crime rate Adjusted violent crime rate Adjusted violent crime rates for cities in San Diego County - last 10 years 400 Adjusted violent crime rates over the last 10 years: South-west San Diego County CHULA VISTA CORONADO IMPERIAL BEACH NATIONAL CITY SAN DIEGO Adjusted violent crime rates over the last 10 years: Eastern San Diego County EL CAJON LAMESA LEMON GROVE POWAY SANTEE
116 Adjusted violent crime rate 400 Adjusted violent crime rates over the last 10 years: North-west San Diego County CARSLBAD DEL MAR ENCINITAS ESCONDIDO SAN MARCOS SOLANA BEACH VISTA
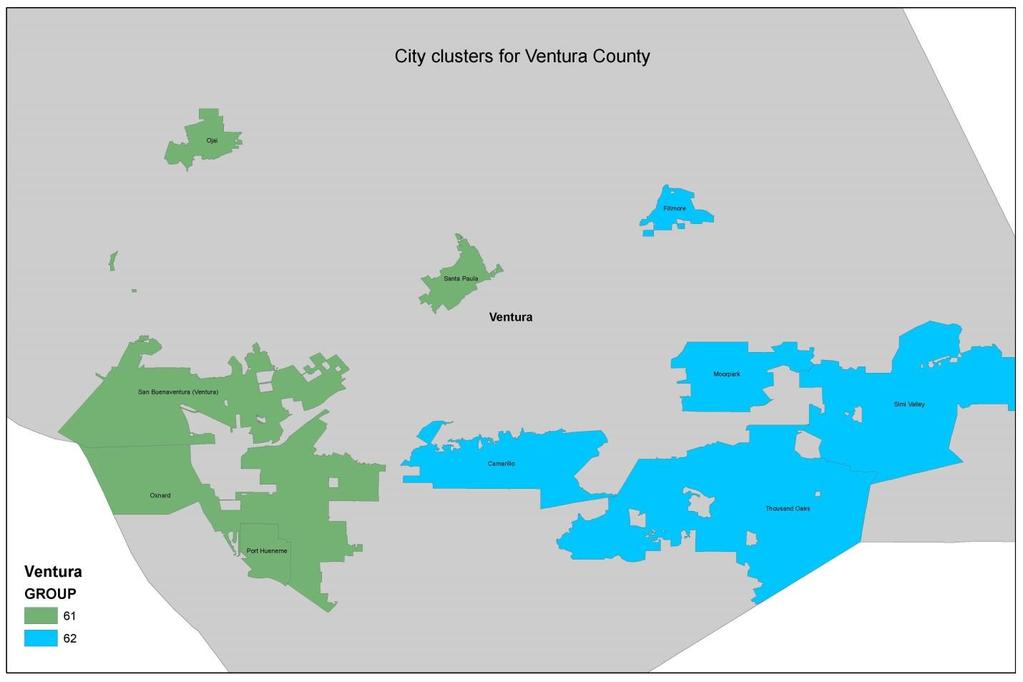
117 Ventura County This section shows the crime rate trends for Ventura County cities. The first table shows the adjusted crime rate in the most recent year (2013) for all cities. The second table shows the average adjusted crime rate over the three most recent years ( ) for all cities. After the two tables, we then display Figures showing the 10 year trajectory of the violent crime rate for the cities in the county. These cities are clustered geographically into city clusters, and the map shows the clustering of cities for these figures. For each Figure, the scale is typically from 0 to 400. Thus, the bottom value is a city with no violent crime, whereas 400 indicates a city with a violent crime rate 300% higher than the regional average ( = 300). For a few of the Figures, we had to extend the scale if certain cities had particularly high violent crime rates. 112
118 Adjusted crime rates for cities in Ventura County, 2013 City Assault Robbery Homicide Burglary Auto Theft Larceny Pop 1 CAMARILLO FILLMORE MOORPARK OJAI OXNARD PORT HUENEME CITY SANTA PAULA SIMI VALLEY THOUSAND OAKS VENTURA Adjusted crime rates for cities in Ventura County, average from City Assault Robbery Homicide Burglary Auto Theft Larceny Pop 1 CAMARILLO FILLMORE MOORPARK OJAI OXNARD PORT HUENEME CITY SANTA PAULA SIMI VALLEY THOUSAND OAKS VENTURA
119 114
120 Adjusted violent crime rate Adjusted violent crime rate Adjusted violent crime rates for cities in Ventura County - last 10 years 400 Adjusted violent crime rates over the last 10 years: West Ventura County OXNARD PORT HUENEME CITY OJAI SANTA PAULA VENTURA Adjusted violent crime rates over the last 10 years: East Ventura County CAMARILLO FILLMORE MOORPARK SIMI VALLEY THOUSAND OAKS
121 Technical Notes We use a novel approach for calculating changes in crime over time for the six individual crime types (aggravated assault, robbery, homicide, burglary, motor vehicle theft, and larceny). This is used to overcome the challenges of comparing changes for different sized cities. For example, if we were to compare cities based on the increase or decrease in the number of crime events, a large city would have an unfair advantage in that a large decrease in the number of crime events might not reflect a very large change in the crime rate, given the large population size. On the other hand, if we were to compare cities based on the increase or decrease in the number of crime rate, a small city would have an unfair advantage in that the rate can change quite a bit even with relatively small changes in the number of crimes simply because of the small population size. We therefore adopt a novel approach in which we compute the Bayesian probability of observing this sized change in the rate of crime. The approach is as follows. We first get the number of crime events at the two time points for all cities. We then compute the variance of each of these variables, and use this information to compute the standard error of the difference across the two time points. Next, we compute the difference in the number of crime events across the two time points for each city and divide this difference by the standard error. This results in a computed z-score. Finally, we divide the z-score value by the city population to make this a rate variable. 116
122 Appendix In this Appendix, we present tables showing all cities in each of the counties. Each table displays the results for a different type of crime. In each table the first column shows the adjusted rate 10 years ago (2003), the second column shows the adjusted rate 5 years ago (2008), then 3 years ago (2010), 2 years ago (2011), last year (2012), and this year (2013). The seventh column shows the change over the last year ( ), the eighth column shows the change over the last 5 years ( ), the ninth column shows the change over the last 10 years ( ), and the final column shows the population. 117
123 Los Angeles County: change in specific crime types over last 10 years Adjusted aggravated assault rates for cities in Los Angeles County - last 10 years 10 years 5 years 3 years 2 years Last This 1 year 5 year 10 year City ago ago ago ago year year change change change Pop 1 AGOURA HILLS ALHAMBRA ARCADIA ARTESIA AZUSA BALDWIN PARK BELL BELL GARDENS BELLFLOWER BEVERLY HILLS BURBANK CALABASAS CARSON CERRITOS CLAREMONT COMMERCE COMPTON COVINA CUDAHY CULVER CITY DIAMOND BAR DOWNEY DUARTE EL MONTE EL SEGUNDO
124 26 GARDENA GLENDALE GLENDORA HAWAIIAN GARDENS HAWTHORNE HERMOSA BEACH HUNTINGTON PARK INGLEWOOD LA CANADA FLINTRIDGE LA HABRA HEIGHTS LA MIRADA LA PUENTE LA VERNE LAKEWOOD LANCASTER LAWNDALE LOMITA LONG BEACH LOS ANGELES LYNWOOD MALIBU MANHATTAN BEACH MAYWOOD MONROVIA MONTEBELLO MONTEREY PARK NORWALK PALMDALE PALOS VERDES ESTATES PARAMOUNT PASADENA PICO RIVERA POMONA RANCHO PALOS VERDES REDONDO BEACH
125 61 ROLLING HILLS ESTATES ROSEMEAD SAN DIMAS SAN FERNANDO SAN GABRIEL SAN MARINO SANTA CLARITA SANTA FE SPRINGS SANTA MONICA SIERRA MADRE SIGNAL HILL SOUTH EL MONTE SOUTH GATE SOUTH PASADENA TEMPLE CITY TORRANCE WALNUT WEST COVINA WEST HOLLYWOOD WESTLAKE VILLAGE WHITTIER
126 Adjusted homicide rates for cities in Los Angeles County - last 10 years 5 10 years years 3 years 2 years Last 1 year 5 year 10 year City ago ago ago ago year This year change change change Pop 1 AGOURA HILLS ALHAMBRA ARCADIA ARTESIA AZUSA BALDWIN PARK BELL BELL GARDENS BELLFLOWER BEVERLY HILLS BURBANK CALABASAS CARSON CERRITOS CLAREMONT COMMERCE COMPTON COVINA CUDAHY CULVER CITY DIAMOND BAR DOWNEY DUARTE EL MONTE EL SEGUNDO
127 26 GARDENA GLENDALE GLENDORA HAWAIIAN GARDENS HAWTHORNE HERMOSA BEACH HUNTINGTON PARK INGLEWOOD LA CANADA FLINTRIDGE LA HABRA HEIGHTS LA MIRADA LA PUENTE LA VERNE LAKEWOOD LANCASTER LAWNDALE LOMITA LONG BEACH LOS ANGELES LYNWOOD MALIBU MANHATTAN BEACH MAYWOOD MONROVIA MONTEBELLO MONTEREY PARK NORWALK PALMDALE PALOS VERDES ESTATES PARAMOUNT PASADENA PICO RIVERA POMONA RANCHO PALOS VERDES REDONDO BEACH
128 61 ROLLING HILLS ESTATES ROSEMEAD SAN DIMAS SAN FERNANDO SAN GABRIEL SAN MARINO SANTA CLARITA SANTA FE SPRINGS SANTA MONICA SIERRA MADRE SIGNAL HILL SOUTH EL MONTE SOUTH GATE SOUTH PASADENA TEMPLE CITY TORRANCE WALNUT WEST COVINA WEST HOLLYWOOD WESTLAKE VILLAGE WHITTIER
129 Adjusted burglary rates for cities in Los Angeles County - last 10 years 10 years 5 years 3 years 2 years Last This 1 year 5 year 10 year City ago ago ago ago year year change change change Pop 1 AGOURA HILLS ALHAMBRA ARCADIA ARTESIA AZUSA BALDWIN PARK BELL BELL GARDENS BELLFLOWER BEVERLY HILLS BURBANK CALABASAS CARSON CERRITOS CLAREMONT COMMERCE COMPTON COVINA CUDAHY CULVER CITY DIAMOND BAR DOWNEY DUARTE EL MONTE EL SEGUNDO
130 26 GARDENA GLENDALE GLENDORA HAWAIIAN GARDENS HAWTHORNE HERMOSA BEACH HUNTINGTON PARK INGLEWOOD LA CANADA FLINTRIDGE LA HABRA HEIGHTS LA MIRADA LA PUENTE LA VERNE LAKEWOOD LANCASTER LAWNDALE LOMITA LONG BEACH LOS ANGELES LYNWOOD MALIBU MANHATTAN BEACH MAYWOOD MONROVIA MONTEBELLO MONTEREY PARK NORWALK PALMDALE PALOS VERDES ESTATES PARAMOUNT PASADENA PICO RIVERA POMONA RANCHO PALOS VERDES REDONDO BEACH
131 61 ROLLING HILLS ESTATES ROSEMEAD SAN DIMAS SAN FERNANDO SAN GABRIEL SAN MARINO SANTA CLARITA SANTA FE SPRINGS SANTA MONICA SIERRA MADRE SIGNAL HILL SOUTH EL MONTE SOUTH GATE SOUTH PASADENA TEMPLE CITY TORRANCE WALNUT WEST COVINA WEST HOLLYWOOD WESTLAKE VILLAGE WHITTIER
132 Adjusted motor vehicle theft rates for cities in Los Angeles County - last 10 years 10 years 5 years 3 years 2 years Last This 1 year 5 year 10 year City ago ago ago ago year year change change change Pop 1 AGOURA HILLS ALHAMBRA ARCADIA ARTESIA AZUSA BALDWIN PARK BELL BELL GARDENS BELLFLOWER BEVERLY HILLS BURBANK CALABASAS CARSON CERRITOS CLAREMONT COMMERCE COMPTON COVINA CUDAHY CULVER CITY DIAMOND BAR DOWNEY DUARTE EL MONTE EL SEGUNDO
133 26 GARDENA GLENDALE GLENDORA HAWAIIAN GARDENS HAWTHORNE HERMOSA BEACH HUNTINGTON PARK INGLEWOOD LA CANADA FLINTRIDGE LA HABRA HEIGHTS LA MIRADA LA PUENTE LA VERNE LAKEWOOD LANCASTER LAWNDALE LOMITA LONG BEACH LOS ANGELES LYNWOOD MALIBU MANHATTAN BEACH MAYWOOD MONROVIA MONTEBELLO MONTEREY PARK NORWALK PALMDALE PALOS VERDES ESTATES PARAMOUNT PASADENA PICO RIVERA POMONA RANCHO PALOS VERDES REDONDO BEACH
134 61 ROLLING HILLS ESTATES ROSEMEAD SAN DIMAS SAN FERNANDO SAN GABRIEL SAN MARINO SANTA CLARITA SANTA FE SPRINGS SANTA MONICA SIERRA MADRE SIGNAL HILL SOUTH EL MONTE SOUTH GATE SOUTH PASADENA TEMPLE CITY TORRANCE WALNUT WEST COVINA WEST HOLLYWOOD WESTLAKE VILLAGE WHITTIER
135 Adjusted larceny rates for cities in Los Angeles County - last 10 years 10 years 5 years 3 years 2 years Last This 1 year 5 year 10 year City ago ago ago ago year year change change change Pop 1 AGOURA HILLS ALHAMBRA ARCADIA ARTESIA AZUSA BALDWIN PARK BELL BELL GARDENS BELLFLOWER BEVERLY HILLS BURBANK CALABASAS CARSON CERRITOS CLAREMONT COMMERCE COMPTON COVINA CUDAHY CULVER CITY DIAMOND BAR DOWNEY DUARTE EL MONTE EL SEGUNDO
136 26 GARDENA GLENDALE GLENDORA HAWAIIAN GARDENS HAWTHORNE HERMOSA BEACH HUNTINGTON PARK INGLEWOOD LA CANADA FLINTRIDGE LA HABRA HEIGHTS LA MIRADA LA PUENTE LA VERNE LAKEWOOD LANCASTER LAWNDALE LOMITA LONG BEACH LOS ANGELES LYNWOOD MALIBU MANHATTAN BEACH MAYWOOD MONROVIA MONTEBELLO MONTEREY PARK NORWALK PALMDALE PALOS VERDES ESTATES PARAMOUNT PASADENA PICO RIVERA POMONA RANCHO PALOS VERDES REDONDO BEACH
137 61 ROLLING HILLS ESTATES ROSEMEAD SAN DIMAS SAN FERNANDO SAN GABRIEL SAN MARINO SANTA CLARITA SANTA FE SPRINGS SANTA MONICA SIERRA MADRE SIGNAL HILL SOUTH EL MONTE SOUTH GATE SOUTH PASADENA TEMPLE CITY TORRANCE WALNUT WEST COVINA WEST HOLLYWOOD WESTLAKE VILLAGE WHITTIER
138 Orange County: change in specific types of crime types over last 10 years Adjusted aggravated assault rates for cities in Orange County - last 10 years 10 years 5 years 3 years 2 years Last This 1 year 5 year 10 year City ago ago ago ago year year change change change Pop 1 ANAHEIM BREA BUENA PARK COSTA MESA CYPRESS DANA POINT FOUNTAIN VALLEY FULLERTON GARDEN GROVE HUNTINGTON BEACH IRVINE LA HABRA LA PALMA LAGUNA BEACH LAGUNA HILLS LAGUNA NIGUEL LAGUNA WOODS LAKE FOREST LOS ALAMITOS MISSION VIEJO NEWPORT BEACH ORANGE PLACENTIA RANCHO SANTA MARGARITA SAN CLEMENTE SAN JUAN CAPISTRANO SANTA ANA SEAL BEACH
139 29 STANTON TUSTIN VILLA PARK WESTMINSTER YORBA LINDA
140 Adjusted homicide rates for cities in Orange County - last 10 years 10 years 5 years 3 years 2 years Last This 1 year 5 year 10 year City ago ago ago ago year year change change change Pop 1 ANAHEIM BREA BUENA PARK COSTA MESA CYPRESS DANA POINT FOUNTAIN VALLEY FULLERTON GARDEN GROVE HUNTINGTON BEACH IRVINE LA HABRA LA PALMA LAGUNA BEACH LAGUNA HILLS LAGUNA NIGUEL LAGUNA WOODS LAKE FOREST LOS ALAMITOS MISSION VIEJO NEWPORT BEACH ORANGE PLACENTIA RANCHO SANTA MARGARITA SAN CLEMENTE SAN JUAN CAPISTRANO SANTA ANA SEAL BEACH STANTON
141 TUSTIN VILLA PARK WESTMINSTER YORBA LINDA
142 Adjusted burglary rates for cities in Orange County - last 10 years 10 years 5 years 3 years 2 years Last This 1 year 5 year 10 year City ago ago ago ago year year change change change Pop 1 ANAHEIM BREA BUENA PARK COSTA MESA CYPRESS DANA POINT FOUNTAIN VALLEY FULLERTON GARDEN GROVE HUNTINGTON BEACH IRVINE LA HABRA LA PALMA LAGUNA BEACH LAGUNA HILLS LAGUNA NIGUEL LAGUNA WOODS LAKE FOREST LOS ALAMITOS MISSION VIEJO NEWPORT BEACH ORANGE PLACENTIA RANCHO SANTA MARGARITA SAN CLEMENTE SAN JUAN CAPISTRANO SANTA ANA SEAL BEACH STANTON
143 30 TUSTIN VILLA PARK WESTMINSTER YORBA LINDA
144 Adjusted motor vehicle theft rates for cities in Orange County - last 10 years 10 years 5 years 3 years 2 years Last This 1 year 5 year 10 year City ago ago ago ago year year change change change Pop 1 ANAHEIM BREA BUENA PARK COSTA MESA CYPRESS DANA POINT FOUNTAIN VALLEY FULLERTON GARDEN GROVE HUNTINGTON BEACH IRVINE LA HABRA LA PALMA LAGUNA BEACH LAGUNA HILLS LAGUNA NIGUEL LAGUNA WOODS LAKE FOREST LOS ALAMITOS MISSION VIEJO NEWPORT BEACH ORANGE PLACENTIA RANCHO SANTA MARGARITA SAN CLEMENTE SAN JUAN CAPISTRANO SANTA ANA SEAL BEACH STANTON
145 30 TUSTIN VILLA PARK WESTMINSTER YORBA LINDA
146 Adjusted larceny rates for cities in Orange County - last 10 years 10 years 5 years 3 years 2 years Last This 1 year 5 year 10 year City ago ago ago ago year year change change change Pop 1 ANAHEIM BREA BUENA PARK COSTA MESA CYPRESS DANA POINT FOUNTAIN VALLEY FULLERTON GARDEN GROVE HUNTINGTON BEACH IRVINE LA HABRA LA PALMA LAGUNA BEACH LAGUNA HILLS LAGUNA NIGUEL LAGUNA WOODS LAKE FOREST LOS ALAMITOS MISSION VIEJO NEWPORT BEACH ORANGE PLACENTIA RANCHO SANTA MARGARITA SAN CLEMENTE SAN JUAN CAPISTRANO SANTA ANA SEAL BEACH STANTON
147 30 TUSTIN VILLA PARK WESTMINSTER YORBA LINDA
148 Riverside County: change in specific crime types over last 10 years Adjusted aggravated assault rates for cities in Riverside County - last 10 years 10 years 5 years 3 years 2 years Last This 1 year 5 year 10 year City ago ago ago ago year year change change change Pop 1 BANNING BEAUMONT BLYTHE CABAZON CALIMESA CANYON LAKE CATHEDRAL CITY COACHELLA CORONA DESERT HOT SPRINGS ELSINORE HEMET INDIAN WELLS INDIO LA QUINTA MORENO VALLEY MURRIETA NORCO PALM DESERT PALM SPRINGS PERRIS RANCHO MIRAGE RIVERSIDE SAN JACINTO TEMECULA
149 Adjusted homicide rates for cities in Riverside County - last 10 years 10 years 5 years 3 years 2 years Last This 1 year 5 year 10 year City ago ago ago ago year year change change change Pop 1 BANNING BEAUMONT BLYTHE CABAZON CALIMESA CANYON LAKE CATHEDRAL CITY COACHELLA CORONA DESERT HOT SPRINGS ELSINORE HEMET INDIAN WELLS INDIO LA QUINTA MORENO VALLEY MURRIETA NORCO PALM DESERT PALM SPRINGS PERRIS RANCHO MIRAGE RIVERSIDE SAN JACINTO TEMECULA
150 Adjusted burglary rates for cities in Riverside County - last 10 years 10 years 5 years 3 years 2 years Last This 1 year 5 year 10 year City ago ago ago ago year year change change change Pop 1 BANNING BEAUMONT BLYTHE CABAZON CALIMESA CANYON LAKE CATHEDRAL CITY COACHELLA CORONA DESERT HOT SPRINGS ELSINORE HEMET INDIAN WELLS INDIO LA QUINTA MORENO VALLEY MURRIETA NORCO PALM DESERT PALM SPRINGS PERRIS RANCHO MIRAGE RIVERSIDE SAN JACINTO TEMECULA
151 Adjusted motor vehicle theft rates for cities in Riverside County - last 10 years 2 10 years 5 years 3 years years Last This 1 year 5 year 10 year City ago ago ago ago year year change change change Pop 1 BANNING BEAUMONT BLYTHE CABAZON CALIMESA CANYON LAKE CATHEDRAL CITY COACHELLA CORONA DESERT HOT SPRINGS ELSINORE HEMET INDIAN WELLS INDIO LA QUINTA MORENO VALLEY MURRIETA NORCO PALM DESERT PALM SPRINGS PERRIS RANCHO MIRAGE RIVERSIDE SAN JACINTO TEMECULA
152 Adjusted larceny rates for cities in Riverside County - last 10 years 10 years 5 years 3 years 2 years Last This 1 year 5 year 10 year City ago ago ago ago year year change change change Pop 1 BANNING BEAUMONT BLYTHE CABAZON CALIMESA CANYON LAKE CATHEDRAL CITY COACHELLA CORONA DESERT HOT SPRINGS ELSINORE HEMET INDIAN WELLS INDIO LA QUINTA MORENO VALLEY MURRIETA NORCO PALM DESERT PALM SPRINGS PERRIS RANCHO MIRAGE RIVERSIDE SAN JACINTO TEMECULA
153 San Bernardino County: change in specific crime types over last 10 years Adjusted aggravated assault rates for cities in San Bernardino County - last 10 years 2 10 years 5 years 3 years years Last This 1 year 5 year 10 year City ago ago ago ago year year change change change Pop 1 ADELANTO APPLE VALLEY BARSTOW BIG BEAR LAKE CHINO CHINO HILLS COLTON FONTANA GRAND TERRACE HESPERIA HIGHLAND LOMA LINDA MONTCLAIR NEEDLES ONTARIO RANCHO CUCAMONGA REDLANDS RIALTO SAN BERNARDINO TWENTYNINE PALMS UPLAND VICTORVILLE YUCAIPA YUCCA VALLEY
154 Adjusted homicide rates for cities in San Bernardino County - last 10 years 10 years 5 years 3 years 2 years Last This 1 year 5 year 10 year City ago ago ago ago year year change change change Pop 1 ADELANTO APPLE VALLEY BARSTOW BIG BEAR LAKE CHINO CHINO HILLS COLTON FONTANA GRAND TERRACE HESPERIA HIGHLAND LOMA LINDA MONTCLAIR NEEDLES ONTARIO RANCHO CUCAMONGA REDLANDS RIALTO SAN BERNARDINO TWENTYNINE PALMS UPLAND VICTORVILLE YUCAIPA YUCCA VALLEY
155 Adjusted burglary rates for cities in San Bernardino County - last 10 years 5 10 years years 3 years 2 years Last This 1 year 5 year 10 year City ago ago ago ago year year change change change Pop 1 ADELANTO APPLE VALLEY BARSTOW BIG BEAR LAKE CHINO CHINO HILLS COLTON FONTANA GRAND TERRACE HESPERIA HIGHLAND LOMA LINDA MONTCLAIR NEEDLES ONTARIO RANCHO CUCAMONGA REDLANDS RIALTO SAN BERNARDINO TWENTYNINE PALMS UPLAND VICTORVILLE YUCAIPA YUCCA VALLEY
156 Adjusted motor vehicle theft rates for cities in San Bernardino County - last 10 years 10 years 5 years 3 years 2 years This 1 year 5 year 10 year City ago ago ago ago Last year year change change change Pop 1 ADELANTO APPLE VALLEY BARSTOW BIG BEAR LAKE CHINO CHINO HILLS COLTON FONTANA GRAND TERRACE HESPERIA HIGHLAND LOMA LINDA MONTCLAIR NEEDLES ONTARIO RANCHO CUCAMONGA REDLANDS RIALTO SAN BERNARDINO TWENTYNINE PALMS UPLAND VICTORVILLE YUCAIPA YUCCA VALLEY
157 Adjusted larceny rates for cities in San Bernardino County - last 10 years 10 years 5 years 3 years 2 years Last This 1 year 5 year 10 year City ago ago ago ago year year change change change Pop 1 ADELANTO APPLE VALLEY BARSTOW BIG BEAR LAKE CHINO CHINO HILLS COLTON FONTANA GRAND TERRACE HESPERIA HIGHLAND LOMA LINDA MONTCLAIR NEEDLES ONTARIO RANCHO CUCAMONGA REDLANDS RIALTO SAN BERNARDINO TWENTYNINE PALMS UPLAND VICTORVILLE YUCAIPA YUCCA VALLEY
158 San Diego County: change in specific crime types over last 10 years Adjusted aggravated assault rates for cities in San Diego County - last 10 years 10 years 5 years 3 years 2 years Last This 1 year 5 year 10 year City ago ago ago ago year year change change change Pop 1 CARSLBAD CHULA VISTA CORONADO DEL MAR EL CAJON ENCINITAS ESCONDIDO IMPERIAL BEACH LAMESA LEMON GROVE NATIONAL CITY POWAY SAN DIEGO SAN MARCOS SANTEE SOLANA BEACH VISTA
159 Adjusted homicide rates for cities in San Diego County - last 10 years 10 years 5 years 3 years 2 years Last This 1 year 5 year 10 year City ago ago ago ago year year change change change Pop 1 CARSLBAD CHULA VISTA CORONADO DEL MAR EL CAJON ENCINITAS ESCONDIDO IMPERIAL BEACH LAMESA LEMON GROVE NATIONAL CITY POWAY SAN DIEGO SAN MARCOS SANTEE SOLANA BEACH VISTA
160 Adjusted burglary rates for cities in San Diego County - last 10 years 10 years 2 5 years 3 years years Last This 1 year 5 year 10 year City ago ago ago ago year year change change change Pop 1 CARSLBAD CHULA VISTA CORONADO DEL MAR EL CAJON ENCINITAS ESCONDIDO IMPERIAL BEACH LAMESA LEMON GROVE NATIONAL CITY POWAY SAN DIEGO SAN MARCOS SANTEE SOLANA BEACH VISTA
161 Adjusted motor vehicle theft rates for cities in San Diego County - last 10 years 10 years 5 years 3 years 2 years Last This 1 year 5 year 10 year City ago ago ago ago year year change change change Pop 1 CARSLBAD CHULA VISTA CORONADO DEL MAR EL CAJON ENCINITAS ESCONDIDO IMPERIAL BEACH LAMESA LEMON GROVE NATIONAL CITY POWAY SAN DIEGO SAN MARCOS SANTEE SOLANA BEACH VISTA
162 Adjusted larceny rates for cities in San Diego County - last 10 years 10 years 5 years 3 years 2 years Last This 1 year 5 year 10 year City ago ago ago ago year year change change change Pop 1 CARSLBAD CHULA VISTA CORONADO DEL MAR EL CAJON ENCINITAS ESCONDIDO IMPERIAL BEACH LAMESA LEMON GROVE NATIONAL CITY POWAY SAN DIEGO SAN MARCOS SANTEE SOLANA BEACH VISTA
163 Ventura County: change in specific crime types over last 10 years Adjusted aggravated assault rates for cities in Ventura County - last 10 years 10 years 5 years 3 years 2 years Last This 1 year 5 year 10 year City ago ago ago ago year year change change change Pop 1 CAMARILLO FILLMORE MOORPARK OJAI OXNARD PORT HUENEME CITY SANTA PAULA SIMI VALLEY THOUSAND OAKS VENTURA Adjusted homicide rates for cities in Ventura County - last 10 years 10 years 5 years 3 years 2 years Last This 1 year 5 year 10 year City ago ago ago ago year year change change change Pop 1 CAMARILLO FILLMORE MOORPARK OJAI OXNARD PORT HUENEME CITY SANTA PAULA SIMI VALLEY THOUSAND OAKS VENTURA
164 Adjusted burglary rates for cities in Ventura County - last 10 years 10 years 5 years 3 years 2 years Last This 1 year 5 year 10 year City ago ago ago ago year year change change change Pop 1 CAMARILLO FILLMORE MOORPARK OJAI OXNARD PORT HUENEME CITY SANTA PAULA SIMI VALLEY THOUSAND OAKS VENTURA Adjusted motor vehicle theft rates for cities in Ventura County - last 10 years 10 years 5 years 3 years 2 years Last This 1 year 5 year 10 year City ago ago ago ago year year change change change Pop 1 CAMARILLO FILLMORE MOORPARK OJAI OXNARD PORT HUENEME CITY SANTA PAULA SIMI VALLEY THOUSAND OAKS VENTURA
165 Adjusted larceny rates for cities in Ventura County - last 10 years City 10 years ago 5 years ago 3 years ago 2 years ago Last year This year 1 year change 5 year change 10 year change Pop 1 CAMARILLO FILLMORE MOORPARK OJAI OXNARD PORT HUENEME CITY SANTA PAULA SIMI VALLEY THOUSAND OAKS VENTURA
166 NOTES
167 162

168 School of Social Ecology Discover Engage Transform The School of Social Ecology is dedicated to interdisciplinary, problem-driven scholarship, teaching, and outreach in the public s interest. Social Ecology s unique focus and expertise has made it a national leader in applying basic theory and empirical research to address complex societal problems. Since 1970, Social Ecology has grown from a few dozen students to more than 2,500, with over 20,000 graduates working in fields as diverse as health care, human services, planning, education, law and public policy. The School is home to three highly ranked departments - Criminology, Law and Society; Planning, Policy and Design; and Psychology and Social Behavior - that share a commitment to research that understands human behavior in larger social and institutional contexts, moves beyond traditional disciplinary boundaries, and reaches a diverse and broad audience. UC Irvine School of Social Ecology 5300 Social & Behavioral Sciences Gateway, Irvine, CA secomm@uci.edu
County City Fee Schedule
 Bellow is a list of serviceable cities. Unless otherwise mentioned, delivery crew is one person and doing standard installation only. All hookups, stairways and pathways must be clear and standard. Failure
LOS ANGELES COUNTY SALES TAX ALLOCATION TOTALS - 1Q COMPARISON. Agoura Hills
 Agoura Hills Point-of-Sale 773,910 823,770 County Pool 110,205 106,730 State Pool (501) 16 883,615 930,517 (49,859) 3,475 (517) (46,902) -6.05% 3.26% -3142.67% -5.04% Alhambra Point-of-Sale 3,412,637 3,359,041
Voter Counts for City and City Council Districts
 CITY OF AGOURA HILLS 14,105 6,343 CITY OF ALHAMBRA 40,843 16,213 CITY OF ALHAMBRA 1ST COUNCIL 8,627 3,531 CITY OF ALHAMBRA 2ND COUNCIL 7,700 3,241 CITY OF ALHAMBRA 3RD COUNCIL 7,340 3,040 CITY OF ALHAMBRA
50 Largest U.S. Metropolitan Areas
 America s Racially : Opportunities and Challenges 50 rgest U.S. Metropolitan Areas Community types in the 50 largest metropolitan areas 39,333,003 26% 14,533,326 16,983,337 9% 10% 47,406,687 49,199,197
SCE Qualifying Zip Codes
 90022 EAST LOS ANGELES 90201 BELL GARDENS 90209 BEVERLY HILLS 90211 BEVERLY HILLS 90212 BEVERLY HILLS 90220 COMPTON 90221 COMPTON 90222 COMPTON 90224 COMPTON 90239 DOWNEY 90240 DOWNEY 90241 DOWNEY 90242
ZIP Codes/Territories In Numerical Order By ZIP Code ZIP Code. ZIP Code
 CODES 90001-90080 s/territories In Numerical Order By 90001 LOS ANGELES 111 90041 LOS ANGELES 101 90002 LOS ANGELES 111 90042 LOS ANGELES 109 90003 LOS ANGELES 111 90043 LOS ANGELES 115 90004 LOS ANGELES
Southern California & Phoenix, AZ Submarket Reference Guide
 Southern California & Phoenix, AZ Los Angeles County LOS ANGELES- CENTRAL / SOUTHEAST DOWNTOWN LOS ANGELES Greater Downtown LOS ANGELES- CENTRAL / SOUTHEAST CENTRAL LOS ANGELES Central Los Angeles Ind
Sewage Overflow Calls During Business Hours Utilities Department (626)
") Phone Numbers for Local Sewer Lines If you see or suspect an overflow in your neighborhood, it probably involves a local sewer. Please call the phone number for your city listed below to report the overflow.
Phone Numbers for Local Sewer Lines If you see or suspect an overflow in your neighborhood, it probably involves a local sewer. Please call the phone number for your city listed below to report the overflow.
2016 SCE Reliability Review. November 27 th, 2017 Irwindale, California
 2016 SCE Reliability Review November 27 th, 2017 Irwindale, California 1 Meeting agenda Overview of SCE Reliability definition and measurement SCE s 2016 Reliability performance How to obtain local reliability
Store Address City State Zip Miles
 Store Address City State Zip Miles 3068 800 EAST VALLEY BOULEVARD ALHAMBRA CA 91801 19.2 2869 1088 N STATE COLLEGE BLVD ANAHEIM CA 92806 16.2 3067 2072 LINCOLN AVENUE ANAHEIM CA 92806 16.8 2954 2245 WEST
LAWestVectorControl 2.GLAVectorControl 3.SGVVectorControl 4.AntelopeValeyVectorControl
 12-19-17 1.LAWestVectorControl 2.GLAVectorControl 3.SGVVectorControl 4.AntelopeValeyVectorControl 90001 Los Angeles 2 9/26/17 90002 Watts 3 8/8/17 90003 Los Angeles 2 8/22/17 90004* Los Angeles 1 9/26/17
Assistant Superintendents, Business Directors/Managers, Business P-2 Attendance Reports
 May 2, 2013 TO: FROM: Assistant Superintendents, Business Directors/Managers, Business Rosalee Hormuth Manager, Business Services SUBJECT: 2012-13 P-2 Attendance Reports Enclosed for your information is
LOS ANGELES COUNTY, CALIFORNIA AND INCORPORATED AREAS
 LOS ANGELES COUNTY, CALIFORNIA AND INCORPORATED AREAS VOLUME 4 OF 4 Community Name Community Community Name Number Community Community Number Number Community Community Number Name Community Number LOS
ZIPCODES WITHIN THE SOUTH COAST AIR QUALITY MANAGEMENT DISTRICT
 90001 Firestone Park LA 90001 Los Angeles LA 90002 Watts LA 90002 Los Angeles LA 90003 Los Angeles LA 90004 Los Angeles LA 90004 Oakwood LA 90005 Los Angeles LA 90005 Sanford LA 90006 Los Angeles LA 90007
Dos Pueblos cs * Corona del Mar. * Lutheran/ Orange vs Corona del Mar Lutheran/ Orange Automatic Lutheran/ Orange vs * Foothill
 DIVISION 1 Semifinal Round - 2/21 @ Wm. Woollett Jr. Aquatic Center Consolation Round - 2/20 @ Home Sites Dos Pueblos cs * Corona del Mar Dos Pueblos vs * Foothill Foothill Automatic * Lutheran/ Orange
2007 SCHEDULED ELECTIONS (AS OF SEPTEMBER 21, 2007)
") COUNTY OF LOS ANGELES REGISTRAR-RECORDER/COUNTY CLERK COORDINATION SECTION 2007 SCHEDULED S (AS OF SEPTEMBER 21, 2007) JANUARY 9 INGLEWOOD CITY (RUNOFF) 1006 DECEMBER 26*** FEBRUARY 27 BURBANK CITY PRIMARY
COUNTY OF LOS ANGELES REGISTRAR-RECORDER/COUNTY CLERK COORDINATION SECTION 2007 SCHEDULED S (AS OF SEPTEMBER 21, 2007) JANUARY 9 INGLEWOOD CITY (RUNOFF) 1006 DECEMBER 26*** FEBRUARY 27 BURBANK CITY PRIMARY
Circuit Reliability Review
 Circuit Reliability Review Los Angeles District 3 January 2018 Building a Smarter Grid for Southern California Southern California Edison is developing an electric grid to support California s transition
May 27, Very truly yours,
 Stacie Schaffer Attorney stacie.schaffer@sce.com May 27, 2008 Re: Southern California Edison Company s Application for Increase in Electric Revenues, A.08-05-026 To Whom It May Concern: On May 15, 2008,
Pre-Flips will be conducted Sunday, November 5
 DIVISION 1 Quarter Finals Round - 11/12 *Loyola vs El Toro Loyola vs *Newport Harbor *Los Osos vs El Toro *Los Osos vs Newport Harbor Corona del Mar vs *Lutheran/ Orange Corona del Mar vs *San Marcos *Mira
2012 CALIFORNIA JAG ALLOCATIONS
 2012 CALIFORNIA JAG ALLOCATIONS Listed below are all jurisdictions in the state that are eligible for FY 2012 JAG funding, as determined by the JAG formula. If your jurisdiction is listed with another
Circuit Reliability Review
 Circuit Reliability Review Los Angeles District 2 January 2018 Building a Smarter Grid for Southern California Southern California Edison is developing an electric grid to support California s transition
BEFORE THE PUBLIC UTILITIES COMMISSION OF THE STATE OF CALIFORNIA ) ) ) ) )
 ) ) ) )") BEFORE THE PUBLIC UTILITIES COMMISSION OF THE STATE OF CALIFORNIA In the Matter of the Application of Southern California Edison Company (U 338-E) for Approval of its 2012-2014 California Alternative Rates
BEFORE THE PUBLIC UTILITIES COMMISSION OF THE STATE OF CALIFORNIA In the Matter of the Application of Southern California Edison Company (U 338-E) for Approval of its 2012-2014 California Alternative Rates
Circuit Reliability Review
 Circuit Reliability Review Los Angeles District 4 January 2018 Building a Smarter Grid for Southern California Southern California Edison is developing an electric grid to support California s transition
BEFORE THE PUBLIC UTILITIES COMMISSION OF THE STATE OF CALIFORNIA
 BEFORE THE PUBLIC UTILITIES COMMISSION OF THE STATE OF CALIFORNIA Application Of Southern California Edison Company (U 338-E) For Approval Of Its Forecast 2017 ERRA Proceeding Revenue Requirement. Application
Water Efficient Landscape Ordinance 12/15/2016 2:55 PM
 Water Efficient Landscape Ordinance MWELO Implementation-Reporting Agencies Agoura Hills, City of Alameda, City of Alameda, County of Alhambra, City of Aliso Viejo, City of Anaheim, City of Antioch, City
BEFORE THE PUBLIC UTILITIES COMMISSION OF THE STATE OF CALIFORNIA ) ) ) NOTICE OF APPLICATION IN COMPLIANCE WITH RULE 3.2(B)
 ) ) NOTICE OF APPLICATION IN COMPLIANCE WITH RULE 3.2(B)") BEFORE THE PUBLIC UTILITIES COMMISSION OF THE STATE OF CALIFORNIA Application of Southern California Edison Company (U 338-E) for Authorized Cost of Capital for Utility Operations for 2008. ) ) ) A.07-05-003
BEFORE THE PUBLIC UTILITIES COMMISSION OF THE STATE OF CALIFORNIA Application of Southern California Edison Company (U 338-E) for Authorized Cost of Capital for Utility Operations for 2008. ) ) ) A.07-05-003
BEFORE THE PUBLIC UTILITIES COMMISSION OF THE STATE OF CALIFORNIA ) ) ) ) ) ) )
 ) ) ) ) ) )") BEFORE THE PUBLIC UTILITIES COMMISSION OF THE STATE OF CALIFORNIA Joint Application of Southern California Edison Company (U 338-E) and San Diego Gas & Electric Company (U 902-E) to Find the 2014 SONGS
BEFORE THE PUBLIC UTILITIES COMMISSION OF THE STATE OF CALIFORNIA Joint Application of Southern California Edison Company (U 338-E) and San Diego Gas & Electric Company (U 902-E) to Find the 2014 SONGS
BEFORE THE PUBLIC UTILITIES COMMISSION OF THE STATE OF CALIFORNIA
 BEFORE THE PUBLIC UTILITIES COMMISSION OF THE STATE OF CALIFORNIA Application of Pacific Gas and Electric Company for Approval of 2013-2014 Statewide Marketing, Education and Outreach Program and Budget
(818) (310)
 (310)") COUNTY OF LOS ANGELES FIRE DEPARTMENT 1320 NORTH EASTERN AVENUE LOS ANGELES, CALIFORNIAA 90063-3294 DARYL L. OSBY FIRE CHIEF FORESTER & FIRE WARDEN (818) 508-5205 (310) 317-1802 November 5, 2015 Tony Coroalles,
COUNTY OF LOS ANGELES FIRE DEPARTMENT 1320 NORTH EASTERN AVENUE LOS ANGELES, CALIFORNIAA 90063-3294 DARYL L. OSBY FIRE CHIEF FORESTER & FIRE WARDEN (818) 508-5205 (310) 317-1802 November 5, 2015 Tony Coroalles,
Circuit Reliability Review
 Circuit Reliability Review Los Angeles District 5 January 2018 Building a Smarter Grid for Southern California Southern California Edison is developing an electric grid to support California s transition
Southern California Nevada Conference OCWM - Per Capita - Special Offerings
 40010 ALPINE COMMUNITY CHURCH ALPINE, CA 1,536.00 724.00 685.00 275.00 200.00 310.00 40020 COMMUNITY CHURCH ALTADENA, CA 828.00 12,670.00 1,497.00 1,280.00 3,570.29 40040 CONGREGATIONAL ARCADIA, CA 768.00
Renovations Under Way! See Pg. 3 for more details.
 FOR LEASE > ±48,326 SF INDUSTRIAL MANUFACTURING FACILITY Renovations Under Way! See Pg. 3 for more details. 10605SPRING VALLEY CA Jamacha Blvd Tucker Hohenstein, SIOR +1 760 930 7966 tucker.hohenstein@colliers.com
Table of School Districts by SALARIES. $127, yrs. $105,742 in 19. $118, yrs. $96,370 in 19 posted for. $105, yrs.
 In Column 1, Unified School districts or uni high school districts are regular type. In Column 1, ELEMENTARY school districts in Italics In Column 1, South Bay s are highlighted in BLUE As of 6/16/2018
SERVICE OF NOTICE OF APPLICATION
 EXHIBIT E Exhibit E-1 Page 1 of 3 SERVICE OF NOTICE OF APPLICATION In accordance with Rule 3.2(b), Applicant will mail a notice to the following, stating in general terms its proposed change in rates.
Surprised, Embarrassed, Confused, Afraid, Nervous, Angry or all of the above?
 Surprised, Embarrassed, Confused, Afraid, Nervous, Angry or all of the above? Parent Orientation (by Isabella Corbett, age 5) These are emotions described by parents involved with DCFS. They are certainly
Los Angeles. Los Angeles. LA area real estate prices flat in third quarter of Quarterly Report 3Q Los Angeles Metropolitan Region
 TM Quarterly Report 3Q 2006 A Review of the Metropolitan Real Estate Market Metropolitan Region LA area real estate prices flat in third quarter of 2006 The real estate market for the -Riverside-Orange
2014 Access Triennial Findings. December 16, 2014
 2014 Access Triennial Findings December 16, 2014 What is a Triennial Review? Triennial review of federal grantees Access participates annually Ensure grantees and contractors are compliant with federal
Food and Drug Branch. California Retail Distribution List Recall: Gel Spice, Inc. EXPANDED (Ground Turmeric)
") State of California Health and Human Services Agency California Department of Public Health Food and Drug Branch http://www.cdph.ca.gov/healthinfo/pages/fdbfr.aspx California Retail Distribution List BIG
State of California Health and Human Services Agency California Department of Public Health Food and Drug Branch http://www.cdph.ca.gov/healthinfo/pages/fdbfr.aspx California Retail Distribution List BIG
STADIUM LANDING E. Howell Avenue, Anaheim, CA. ±550 SF - ±8,600 SF Multi-Tenant Units For Lease
 STADIUM LANDING 2020-2120 E. Howell Avenue, Anaheim, CA ±550 SF - ±8,600 SF Multi-Tenant Units For Lease SITE PLAN HOWELL AVENUE 2100 East Howell Avenue 2120 East Howell Avenue C 111 112 113 B 416-417
2017 GIRLS SOCCER PRE-FLIPS DIVISION 1 Second Round - Tuesday, February 21 *DENOTES HOME TEAM
 DIVISION 1 Second Round - Tuesday, February 21 * JSerra vs Wilson/ Long Beach JSerra vs * Los Osos Los Osos Automatic * Dana Hills vs Wilson/ Long Beach Dana Hills Automatic Dana Hills vs * Los Osos Palos
ASSOCIATE MEMBERSHIP PROGRAM & 56 th Annual Municipal Seminar Sponsorship Opportunities
 2015-2016 ASSOCIATE MEMBERSHIP PROGRAM & 56 th Annual Municipal Seminar Sponsorship Opportunities (Indian Wells, CA) 11027 Downey Avenue Downey, CA 90241 562 622 5533 cccainfo@contractcities.org March
Los Angeles County Land Use Maps on Slides: Finding Aid. Online items available
 http://oac.cdlib.org/findaid/ark:/13030/c82f7qrt Online items available Finding aid prepared by Diann Benti. Rare Books Department The Huntington Library, Art Collections, and Botanical Gardens 1151 Oxford
ACCREDITED HOME HEALTH SERVICE AREA (updated Aug. 8, 2016)
") 90001 Florence/South Centeral 90002 Watts 90003 South Central 90004 Hancock Park X 90005 Koreatown X 90006 Pico Heights X 90007 South Central 90008 Baldwin Hills/Crenshaw/Leimert Park X 90009 Airport Worldway
90001 Florence/South Centeral 90002 Watts 90003 South Central 90004 Hancock Park X 90005 Koreatown X 90006 Pico Heights X 90007 South Central 90008 Baldwin Hills/Crenshaw/Leimert Park X 90009 Airport Worldway
36th Annual Woodbridge Cross Country Classic September 16-17, 2016
 Academy Charter White A Castle Rock CO Agoura Gold A Agoura Hills CA Alhambra White A Alhambra CA Aliso Niguel (boys) Blue B Aliso Viejo CA Alta Loma Red B Rancho Cucamonga CA Ambassador White A Torrance
QUALIFIED OPPORTUNITY ZONE Investment and/or User Asset
 QUALIFIED OPPORTUNITY ZONE Investment and/or User Asset TROY AVE. San Gabriel Valley / Los Angeles Vacant & Paved Land 206 Troy Ave. South El Monte, CA 9730 JEFF BETHEL Senior Vice President Lic. # 008766
STADIUM LANDING E. Howell Avenue, Anaheim, CA. ±550 SF - ±8,600 SF Mul -Tenant Units For Lease
 STADIUM LANDING 2020-2120 E. Howell Avenue, Anaheim, CA ±550 SF - ±8,600 SF Mul -Tenant Units For Lease Building Address Unit SF Office SF AVAILABILITIES Warehouse SF GL Doors Asking Base Rent - Gross
What is a SPA? >> providing services through Department of Health Services clinics and community partners
 What is a SPA? Los Angeles County is divided into eight "Service Planning Areas" (SPA's) for health care planning purposes. Each SPA has an Area Health Office that is responsible for planning public health
ONTARIO (RIVERSIDE), CALIFORNIA
, CALIFORNIA") ONTARIO (RIVERSIDE), CALIFORNIA A HIGH-PROFILE OPPORTUNITY Ontario Mills is located in San Bernardino County, the fifth largest county in California with over 2.1 million residents. Ontario Mills is well
ONTARIO (RIVERSIDE), CALIFORNIA A HIGH-PROFILE OPPORTUNITY Ontario Mills is located in San Bernardino County, the fifth largest county in California with over 2.1 million residents. Ontario Mills is well
BREA (LOS ANGELES), CALIFORNIA
, CALIFORNIA") BREA (LOS ANGELES), CALIFORNIA OIL, ORANGES & OPPORTUNITIES Brea Mall is located in the heart of North Orange County, California, a few miles from California State University, Fullerton and their approximately
BREA (LOS ANGELES), CALIFORNIA OIL, ORANGES & OPPORTUNITIES Brea Mall is located in the heart of North Orange County, California, a few miles from California State University, Fullerton and their approximately
BEFORE THE PUBLIC UTILITIES COMMISSION OF THE STATE OF CALIFORNIA
 BEFORE THE PUBLIC UTILITIES COMMISSION OF THE STATE OF CALIFORNIA Order Instituting Rulemaking Regarding Policies, Procedures and Rules for Regulation of Physical Security for the Eletric Supply Facilities
Surprised, Embarrassed, Confused, Afraid, Nervous, Angry or all of the above?
 Surprised, Embarrassed, Confused, Afraid, Nervous, Angry or all of the above? Parent Orientation (by Isabella Corbett, age 5) These are emotions described by parents involved with DCFS. They are certainly
A B C D E F G H I J K L A-B C-E (H-G)/G C*I C+J F+K
/G C*I C+J F+K") ALAMEDA COUNTY $115,717,217 $115,717,217 $106,936,949 $8,780,268 $148,967,679,386 $162,544,107,483 9.11367362% $10,546,089 $126,263,306 $135,043,574 Alameda 4,743,787 $475,059 4,268,728 4,013,210 255,518
ALAMEDA COUNTY $115,717,217 $115,717,217 $106,936,949 $8,780,268 $148,967,679,386 $162,544,107,483 9.11367362% $10,546,089 $126,263,306 $135,043,574 Alameda 4,743,787 $475,059 4,268,728 4,013,210 255,518
CSU Local Admission and Service Areas
 CSU Local Admission and Service Areas CSU Local Admission Areas Service Areas Campus First-Time Freshman Upper-Division Transfer Outreach, Recruitment, EAP Bakersfield State of California State of California
Store # Street1 City State Zip W. Sierra Hwy Acton CA HWY 395, SUITE 3A ADELANTO CA Kanan Road, #7
 Store # Street1 City State Zip 18929 3820 W. Sierra Hwy Acton CA 93510 39979 14148 HWY 395, SUITE 3A ADELANTO CA 92301 51586 5801 Kanan Road, #7 Agoura CA 91301 46228 700 Lindero Canyon Road, #702 Agoura
Funding is paid back through property taxes over time. WRCOG initiated the HERO Program in December 2011 for its members.
 Background The HERO Program provides financing to property owners to improve their homes and businesses with energy efficient, renewable energy, and water conserving improvements. Funding is paid back
59,230 Sq. Ft. on 3.03 Acre Land Site
 FOR SALE High Image Corporate HQ/R&D Building 9,230 Sq. Ft. on 3.03 Acre Land Site 1642 Millikan Ave., CA PROPERTY FEATURES High Image, with Extensive Two-Story Glassline +20,000 SF Two-Story Corporate
AZUSA CENTER. REALTY
 www.ctazusacenter.com AZUSA CENTER CT Azusa Center is located in the City of Azusa, California. The project is a 8.35 acres development consisting of 3 state-of-the-art industrial buildings totaling 185,273
2019 CaFCP OEM Priority Hydrogen Station Location Recommendations. Hydrogen Station Developers and Interested Stakeholders
 February 11, 2019 Hydrogen Station Developers and Interested Stakeholders The California Air Resources Board requested CaFCP OEM members to provide a collective response to identify fuel cell electric
MONTEBELLO, CALIFORNIA
 MONTEBELLO, CALIFORNIA THE HEART OF THE COMMUNITY Only ten miles east of downtown Los Angeles, The Shops at Montebello is a community-based mall with a loyal customer following. Montebello is a dense market.
LOS ANGELES COUNTY, CALIFORNIA AND INCORPORATED AREAS
 VOLUME 1 OF 4 LOS ANGELES COUNTY, CALIFORNIA AND INCORPORATED AREAS Community Community Community Community Community Community Community Community Name Number Name Number Name Number Name Number LOS ANGELES
MONTEBELLO, CALIFORNIA
 MONTEBELLO, CALIFORNIA THE HEART OF THE COMMUNITY Only ten miles east of downtown Los Angeles, The Shops at Montebello is a community-based mall with a loyal customer following. Montebello is a dense market.
Coin Flip. Coin Flip. *Mission Viejo vs. Chaminade Mission Viejo vs. *Lutheran/Orange *Servite vs. Chaminade Servite vs.
 DIVISION 1 Second Round Mater Dei vs. *Poly/Long Beach Mater Dei vs. *JSerra *Vista Murrieta vs. Poly Long Beach Vista Murrieta vs. *JSerra *Mission Viejo vs. Chaminade Mission Viejo vs. *Lutheran/Orange
Aircraft Noise Comment Report
 Monthly Comparisons Period : June 218 Aircraft Noise Comment Report This report summarizes comments received from individuals regarding LAX aircraft noise. Comments are submitted via the Noise Comment
County of Los Angeles CHIEF EXECUTIVE OFFICE 713 KENNETH HAHN HALL OF ADMINISTRATION LOS ANGELES, CALIFORNIA (213)
") County of Los Angeles CHIEF EXECUTIVE OFFICE 713 KENNETH HAHN HALL OF ADMINISTRATION, CALIFORNIA 90012 (213) 974-1101 http://ceo.lacounty.gov WILLIAM T FUJIOKA Chief Executive Offcer October 9, 2007 Ms.
County of Los Angeles CHIEF EXECUTIVE OFFICE 713 KENNETH HAHN HALL OF ADMINISTRATION, CALIFORNIA 90012 (213) 974-1101 http://ceo.lacounty.gov WILLIAM T FUJIOKA Chief Executive Offcer October 9, 2007 Ms.
SOUTHERN CALIFORNIA DRUG BENEFIT FUND 2220 HYPERION AVENUE LOS ANGELES, CALIFORNIA 90027
 SOUTHERN CALIFORNIA DRUG BENEFIT FUND 2220 HYPERION AVENUE LOS ANGELES, CALIFORNIA 90027 TEL (323) 666-8910 FAX (323) 663-9495 WWW.UFCWDRUGTRUST.ORG Date: To: Re: All Active Participants in CA - except
Chapter 16. Crime. Source: New York City Police Department. Borough Table 16-1 Property and Violent Crime, 2002
 Chapter 16. Crime The New York City Police Department, from which the data in this chapter were directly obtained, collects data on a variety of crimes based on submitted reports. New York City is divided
South Lake Tahoe. Central Sierra (4.67) Mammoth Lakes. Bishop. Fresno. Visalia. Tulare. San Joaquin Valley (3.84) (3.
 Mammoth Lakes. Bishop. Fresno. Visalia. Tulare. San Joaquin Valley (3.84) (3.") CALIFORNIA: WHAT THE HUMAN DEVELOPMENT INDEX REVEALS MAP 1 Human Development Index by Economic Region Eureka Redding Northern California (4.26) Susanville Chico Fort Bragg Santa Rosa Bay Area (6.80) Fremont
CALIFORNIA: WHAT THE HUMAN DEVELOPMENT INDEX REVEALS MAP 1 Human Development Index by Economic Region Eureka Redding Northern California (4.26) Susanville Chico Fort Bragg Santa Rosa Bay Area (6.80) Fremont
2017 OFFICIAL RESULTS Finish Order
 2:46:19 PM, 10/9/2017 1 / 6 1 1 04:52:38 LAPD DEPARTMENT TEAM Open 12:52:38 2 2 05:03:57 LASD COUNTY WIDE Open 13:03:57 3 6 05:14:04 BELIZE NATIONAL POLICE Open 13:14:04 4 4 05:15:10 CHP STATEWIDE Open
REDONDO AVE
 FOR SALE 6,673 SF INDUSTRIAL BUILDING 1345-1347 REDONDO AVE LONG BEACH, CALIFORNIA 90804 The information has been furnished from sources which we deem reliable, but for which we assume no liability. Any
Organization Name Address City State Zip Code Phone Fax Fenton Avenue LLC Fenton Avenue Sylmar CA
 13333 Fenton Avenue LLC 13333 Fenton Avenue Sylmar CA 91342 818-367-1033 818-367-1394 13400 Sherman Way LLC 13400 Sherman Way North Hollywood CA 91605 818-983-0103 818-503-4438 5648 East Gotham Street
2245 W VALLEY BOULEVARD COLTON, CA
 W VALLEY BOULEVARD COLTON, CA Co-Listing with O Gorman Pacific Realty Colliers International 2855 E Guasti Road Suite 401 Ontario, CA 91761 United States colliers.com Riverside Avenue OFFERING MEMORANDUM
91116 PASADENA LOS ANGELES PASADENA LOS ANGELES SAN MARINO LOS ANGELES PASADENA LOS ANGELES PASADENA LOS ANGELES 91124
 ZIPCODE CITY COUNTY 91116 PASADENA LOS ANGELES 91117 PASADENA LOS ANGELES 91118 SAN MARINO LOS ANGELES 91121 PASADENA LOS ANGELES 91123 PASADENA LOS ANGELES 91124 PASADENA LOS ANGELES 91125 PASADENA LOS
OFFICE SPACE FOR LEASE 4010 Watson Plaza Drive Lakewood, CA 90712
 PROPERTY FEATURES 1,769 SF Available at $1.95 FSG Adjacent to Douglas Park - Long Beach s New 4 Million SF+ Business Community Local Amenities - Long Beach Airport, Lakewood Country Club, Restaurants,
SPA 1: Antelope Valley
 SPA 1: Antelope Valley Diane Grooms dvgrooms@gmail.com Outreach Supervisor Jared Dyson jdyson@mhala.org Senior Case Manager Nick Matthews nmatthews@avdvc.org Case Conferencing Meetings: 1st and 3rd Fridays,
INDUSTRIAL BUILDING FOR SALE OR LEASE
 INDUSRIAL BUILDING FOR SALE OR LEASE 1037 S. MELROSE SREE PLACENIA, CA 92870 17,500 SF industrial building Divisible to two (2) units (8,775 & 8,725 SF) Sale Price - $3,675,000 ($210.00 per SF) 2.00/1,000
No online items
 http://oac.cdlib.org/findaid/ark:/13030/kt958038mf No online items Finding aid prepared by Katie Richardson The processing of this collection and the creation of this finding aid was funded by the generous
5128 N FIGUEROA STREET
 FOR SALE 2,093 SF BUILDING ON 12,994 SF OF LAND 128 N FIGUEROA STREET LOS ANGELES, CALIFORNIA 90042 The information has been furnished from sources which we deem reliable, but for which we assume no liability.
154 DMV INVESTIGATIONS
 START TIME 08.00 1 2 3 4 5 6 7 8 9 10 11 12 13 14 15 16 17 18 19 20 21 22 23 24 25 26 27 154 DMV INVESTIGATIONS 500In 20.18 260 KERN CO DIST ATTORNEY 500In 19.30 269 FRESNO CO. DIST ATT 500In 22.00 3 FONTANA
Results posted on
 1 150 19 1 CULVER CITY PD 14:41:50 P 5 3.4b 15 16 2 NEWPORT BEACH PD 15:15:40 26 40 3 ORANGE P.D. 15:35:33 43 70 4 FULLERTON POLICE 16:06:04 P 5 4.5 72 188 5 LOS ANGELES PORT PD 17:02:55 132 284 6 COSTA
2018 OFFICIAL RESULTS Finish Order
 3:21:11 PM, 3/18/2018 1 / 6 1 1 04:37:29 LAPD DEPARTMENT TEAM Open 12:37:29 2 3 04:59:10 BELIZE NATIONAL POLICE Open 12:59:10 3 2 05:10:26 LASD COUNTY WIDE Open 13:10:26 4 4 05:34:45 CHP TEAM METER 800
780 INLAND CENTER DRIVE OFFERING MEMORANDUM. 780 Inland Center Drive, San Bernardino, CA Offered At: $2,575,000
 780 INLAND CENTER DRIVE OFFERING MEMORANDUM 780 Inland Center Drive, San Bernardino, CA 92408 Offered At: $2,575,000 PRESENTED BY MIKE LIN Retail Specialist 9471 Haven Avenue, Suite 110 Rancho Cucamonga,
Full-Time Faculty Salary Comparisons in the California Community Colleges
 Full-Time Faculty Salary Comparisons in the California Community Colleges 2017-18 Full-Time Faculty Salary Comparisons in the California Community Colleges 2017-18 Table of Contents OBJECTIVE AND METHODOLOGY
CALIFORNIA. California Pro-Life Pregnancy Centers (Alphabetically By City)
") Nightlight Christian Adoptions 4430 E Miraloma Ave Suite B Anaheim Hills, CA 92807 714-693-5437 Tree of Life PSC 7730 Morro Rd, Suite 106 Atascadero, CA 93422 805-461-3420 Bakersfield Pregnancy Center
Nightlight Christian Adoptions 4430 E Miraloma Ave Suite B Anaheim Hills, CA 92807 714-693-5437 Tree of Life PSC 7730 Morro Rd, Suite 106 Atascadero, CA 93422 805-461-3420 Bakersfield Pregnancy Center
4-Story, 30,000 to 250,000 SF Office Campus Available for Lease
 4-Story, 30,000 to 250,000 SF Office Campus Available for Lease Overview Institutional Quality Office Campus 4-Story, 30,000 to 250,000 SF Available 5/1,000 Parking Ratio with new Parking Structure Solar-Powered
Los Angeles County One Gateway Plaza 213.gzz.2000 Tel I Metropolitan Transportation Authority Los Angeles, CA metro.net
 Los Angeles County One Gateway Plaza 213.gzz.2000 Tel I Metropolitan Transportation Authority Los Angeles, CA 90012-2952 metro.net SUBJECT: NATIONAL TRANSIT DATABASE (NTD) - 9166 REPORTING ACTION: RECEIVE
Discovery Gateway Spectrum - Phase II
 JOHN ERICKSON LICENSE NO. 00977578 661 253 5202 john.erickson@colliers.com COLLIERS INTERNATIONAL 27200 Tourney Road Suite 300 Valencia, CA 91355 www.colliers.com Unit Features > > New construction > >
NOTICE OF AVAILABILITY
 BEFORE THE PUBLIC UTILITIES COMMISSION OF THE STATE OF CALIFORNIA In the matter of the Application of the GOLDEN STATE WATER COMPANY (U 133 W) for an order authorizing it to increase rates for water service
List of Commanderies in California
 Name Charter Location List of Commanderies in California (San Francisco #1) *1853/1858 San Francisco California #1 name changed to California #1 8-11-1858 Sacramento #2 *1854/1858 Sacramento Pacific #3
POLLWORKERS IN SHORT SUPPLY THIS ELECTION Dozens of Communities Experiencing Shortages for Presidential Primaries (ATTACHMENT)
") FOR IMMEDIATE RELEASE May 23, 2012 POLLWORKERS IN SHORT SUPPLY THIS ELECTION Dozens of Communities Experiencing Shortages for Presidential Primaries (ATTACHMENT) With fewer than two weeks before the Statewide
FOR IMMEDIATE RELEASE May 23, 2012 POLLWORKERS IN SHORT SUPPLY THIS ELECTION Dozens of Communities Experiencing Shortages for Presidential Primaries (ATTACHMENT) With fewer than two weeks before the Statewide
2018 TRACK AND FIELD DIVISION PLACEMENT
 2018 TRACK AND FIELD DIVISION PLACEMENT DIVISION 1-2018 Track and Field Enrollment School Name DIV D-1: 105 schools 2511 ALHAMBRA 1 (4942-2421) 3057 ALISO NIGUEL 1 (12/4/17) 2530 ALTA LOMA 1 2956 ANAHEIM
Proposed Metro Service Changes. Proposed changes to Metro Bus Services effective June 29, 2008 or later. Union Station / Gateway February 9, 2008
 Proposed Metro Service Changes Proposed changes to Metro Bus Services effective June 29, 2008 or later. Union Station / Gateway February 9, 2008 Metro San Gabriel Valley Service Sector Proposed changes
List of Commanderies in California
 Name Charter Location List of Commanderies in California (San Francisco #1) *1853/1858 San Francisco California #1 name changed to California #1 8-11-1858 Sacramento #2 *1854/1858 Sacramento Pacific #3
Enrollment Figures For use in the School Year -(Rev 5/3/18)
") DIVISION 1-2018 Track and Field 2016-17 CBEDS Enrollment School Name DIV D-1: 105 schools 2511 ALHAMBRA 1 (4942-2421) 3057 ALISO NIGUEL 1 2530 ALTA LOMA 1 2956 ANAHEIM 1 3388 ARCADIA 1 2680 ARROYO VALLEY
DIVISION 1-2018 Track and Field 2016-17 CBEDS Enrollment School Name DIV D-1: 105 schools 2511 ALHAMBRA 1 (4942-2421) 3057 ALISO NIGUEL 1 2530 ALTA LOMA 1 2956 ANAHEIM 1 3388 ARCADIA 1 2680 ARROYO VALLEY
Institution/Branch Name Location ID Chtr Class Ent Type AMERICAN PLUS BK NA ARCADIA, CA NAT 20 11/1/2008 8/8/2007 $327,835 $253,082
 Skip to Content Release dates Current release Other formats: ASCII PDF (51 KB) AMERIN CONTINENTAL BK, ARDIA BR ARDIA, 4580694 3/31/2015 9/23/2013 AMERIN CONTINENTAL BK, CHINO HILLS BR CHINO HILLS, 4201690
WORKFORCE DEVELOPMENT, AGING AND COMMUNITY SERVICES 2018
 LOS ANGELES COUNTY WORKFORCE DEVELOPMENT, AGING AND COMMUNITY SERVICES 2018 NOTE: The list of Cooling Centers on the following pages are listed alphabetically by City. This information is also available
SOUTHERN CALIFORNIA DRUG BENEFIT FUND 2220 HYPERION AVENUE LOS ANGELES, CALIFORNIA 90027
 SOUTHERN CALIFORNIA DRUG BENEFIT FUND 2220 HYPERION AVENUE LOS ANGELES, CALIFORNIA 90027 TEL (323) 666-8910 FAX (323) 663-9495 Date: (Website Copy) To: Re: All Active Participants in CA - except Kaiser
LEASE 14,953 SF 6570 TELEGRAPH ROAD COMMERCE, CALIFORNIA INDUSTRIAL FOR. Team-Cline.com LOCAL EXPERTISE. INTERNATIONAL REACH. WORLD CLASS.
 FOR LEASE 14,93 SF INDUSTRIAL B U I L D I N G Team-Cline.com LOCAL EXPERTISE. INTERNATIONAL REACH. WORLD CLASS. PROPERTY HIGHLIGHTS Great Retail Exposure Freeway Frontage Large Fenced/Yard Parking PROPERTY
DESERT HILLS PREMIUM OUTLETS
 DESERT HILLS PREMIUM OUTLETS THE SIMON EXPERIENCE WHERE BRANDS & COMMUNITIES COME TOGETHER More than real estate, we are a company of experiences. For our guests, we provide distinctive shopping, dining
Appendix B CSTAN Arterial List. Los Angeles County Strategic Arterial Plan January, 2015
 Appendix B CSTAN Arterial List Los Angeles County Strategic Arterial Plan January, 2015 CSTAN Arterials sorted by City 1 Alhambra Atlantic Blvd 34 Bell Atlantic Ave 67 Carson 223rd St 2 Alhambra Fremont
California Community College Libraries: hours (all respondents)
") California Community College Libraries: hours (all respondents) Regular term hours District College Credit 1 Chaffey Chaffey 15,891 87.0 2 Santa Barbara Santa Barbara 14,505 75.0 3 Los Rios Sacramento
California Community College Libraries: hours (all respondents) Regular term hours District College Credit 1 Chaffey Chaffey 15,891 87.0 2 Santa Barbara Santa Barbara 14,505 75.0 3 Los Rios Sacramento