Chapter 2 THE PLANNING ENVIRONMENT
|
|
|
- Shanon Newman
- 5 years ago
- Views:
Transcription

1 Chapter 2 THE PLANNING ENVIRONMENT The present and future utilization of the city s land resources is and shall be shaped by external and internal factors affecting the City s development. In order to influence the future extent and intensity of preferred uses, these factors and their implications need to be considered in the analysis of the planning area. Such analyses and appreciation will lead to the surfacing of key policy issues, physical development potentials and limitations, socio-economic trends, and institutional conditions an understanding of which can facilitate the realization of the plan that shall be formulated. This Chapter discusses external and internal factors the former being those policies, events or physical conditions over which the city has no power to control, regulate or influence despite their implications on its development conditions. Such factors give rise to opportunities that should be identified and grabbed to facilitate its pursuit of its long term vision. Threats can also arise from such externalities and their identification can be used in determining courses of action or the adoption of policy alternatives that can diminish their negative influences over the city s development path. Strengths and weaknesses of the City of San Fernando can be surfaced through the analyses of its internal conditions or factors over which the City has a direct influence. A. External Factors that may affect CSFP s Land Uses 1. Capital City of the Province of Pampanga Being the capital city of the Province of Pampanga, the City of San Fernando hosts the seat of the provincial government. As such, it plays a significant role in the movement of people from all over the province. The natural tendency of the people from all component municipalities to regularly visit the City has made it into a bustling commercial area and 5 P a g e


2 service provider. It has also become a government service center for the whole province. The natural concentration of people in the city which we may conclude to happen during daytimes of workdays, may have become the key factor in the establishment of secondary and tertiary economic activities in the city. Such growth in economic activities also resulted to expansion of built-up areas that is apparent in the land use maps in three different times shown overleaf. The eruption of Mt. Pinatubo in 1991 did not diminish the attractiveness of the City to people although the direction of urban expansion was influenced by the series of lahar flow events and the subsequent flooding regimes resulting from the clogging of drainage ways especially the San Fernando River. The population of the City grew overnight when families in lahar affected areas in neighboring municipalities moved in relocation sites the most notable of which is in Bulaon. Since then Bulaon has become a major population center in the mid eastern part of the City. 6 P a g e

3 As the provincial capital city of Pampanga, it has become the second most populous LGU second to Angeles City. This is apparent in the hierarchy of settlements mapped in Figure 6 using the results of the August 2007 Census of Population. The attractiveness of the City to population is expected to continue as levels of services available increase over time. 2. Located in the Upper Low-lying Areas of Pampanga River Basin The City of San Fernando lies within the northern and higher part of the floodplains of Pampanga Basin, which has an extensive catchment area of one million hectares as may be seen in Figure 7 below. A bigger portion of the City area has higher elevation although its southern area is part of Pampanga River Basin s floodplains. Thus, floodwaters pose a real threat to the City s physical development as may be apparent in succeeding discussions on land use trends. The bigger threat from the slopes of Mt. Pinatubo was addressed through the construction of the FVR Mega Dike that contained lahar flows within the Pasig-Potrero River System. Figure 7 Elevation Zones in the Pampanga River Basin Source: JICA & NWRB P a g e
4 Within Pampanga River Basin can be found three sub-basins, namely: (1) the Main Pampanga River Basin (has the largest catchment area of 7,978km 2 and the longest channel length of 265km); (2) Pasac River Basin; and, (3) Angat River Basin. Pampanga River originates in Caraballo Mountains on the north of the study area, and flows into Pantabangan storage dam. The upstream stretch of the river above the dam is often called as Pantabangan River. After passing the dam, the river further flows southward meeting with several tributaries and finally emptying into Manila Bay. Pasac river basin covers various river channels running on the eastern slope of Mt. Pinatubo, such as Abacan-San Fernando River, Pasig-Potrero River and Porac-Gumain River. All the rivers originate in Mt. Pinatubo, and flow into Manila Bay. The total catchment area of the river basin is about 1,371km 2. In the lower reaches, the river system is connected to the Pampanga Main River by Bebe-San Esteban Cutoff Channel. The morphologies of Pasac River have been much affected by the eruption of Mt. Pinatubo in The river alignments have changed due to the mudflow produced by the eruption and serious sediment deposit in the river channel is still in progress up to the present. Angat river basin originates in Sierra Madre Mountains and flows into Angat storage dam meandering through a narrow valley. In the lower reaches of the dam, the river flows westward and finally empties into Manila Bay through Labangan Floodway. There is a small connecting channel with Pampanga River, which is called Bagbag River. The total length of the main stream of Angat River is 153km and the total catchment area is about 1,085km 2. The threat of flooding in the southern portion of the City has been minimized with the on-going implementation of Phase 3B of the Pinatubo Hazard Urgent Mitigation Project (PHUMP 3B). Started in 2008, the project, once completed in April 2015, shall increase the capacity of rivers, creeks and drainage systems including that of San Fernando River thereby reducing the flood occurences in said area. The construction of PHUMP 3B (summarized in Figure 8) aims to reduce damages to properties from perennial flooding by reducing flood level and flooding duration in the City of San Fernando and the adjacent towns of Mexico and Santo Tomas. Though countermeasures for flood control and storm drainage improvement have been conducted for the last 10 years, frequency of flooding and inundation are still high. This can be attributed to inadequate capacity of existing drainage systems to accommodate excess run off from Angeles-Mexico areas and the change of topography as a result of the eruption and post eruption of Mount Pinatubo. 8 P a g e

5 Figure 8 Development Plan of PHUMP 3B The most recent flooding event that submerged the low-lying areas of Bulacan and Pampanga from Typhoon Pedring attested to the efficacy of the project as floodwaters receded quickly in some areas of San Fernando while the other parts that were historically flooded were not submerged. 3. National and Regional Development Initiatives Externalities to San Fernando s physical development arise from regional and national government policies and initiatives in pursuit of regional and national development focused on inclusive growth, poverty alleviation and sustainable development. The City s role in regional development is heightened by its being the regional center and host to regional government agency offices. The latter is a major cause of population movement into the City. Its role in Central Luzon s development priorities may be appreciated through its interaction with the special development areas of Subic Bay Freeport Zone, Clark Special Economic Zone and Hacienda Luisita in Tarlac. This is further complemented by the City s being at the crossroad of the 9 P a g e
 Corridor Conceptual Land Use Plan prepared by the SCAD Council in 2009, the City of San Fernando is an integral part of the")
6 major north-south (NLEx and MacArthur Highway) and east-west (Gapan- San-Fernando-Olongapo Road) transport links. In the final report of the Subic Clark Alliance for Development (SCAD) Corridor Conceptual Land Use Plan prepared by the SCAD Council in 2009, the City of San Fernando is an integral part of the Metro Clark Area which forms the core of the tripolar corridor development. Together with Mabalacat, Bamban and Angeles City, it supports the development of the air hub of the corridor. As such it is expected to serve as the geographical and economic center of the Corridor, of Pampanga and of Central Luzon. It shall also provide higher order urban functions and services such as political-administrative, commercial-business, institutional, educational-cultural, transportation-utility center, among others. The current and emerging role of the City of San Fernando vis-à-vis the SCAD Corridor makes it, hence, imperative to identify areas for expansion of higher order land uses such as commercial, residential, institutional and industrial with due consideration of ecological integrity and other sustainable land use principles. Figure 9 Google Earth Satellite Image of Pampanga overlay with municipal and city boundaries, major roads and extent of built-up areas as of P a g e
7 4. Strategic Location and Accessibility The City of San Fernando is strategically located at the heart of Central Luzon. One has to pass through the City to be able to go to any provinces from all directions, be it north to Tarlac and Pangasinan, west to Bataan and Zambales, east to Nueva Ecija and south to Bulacan and onwards to Metro Manila. Thus, it has established its role as the regional growth center, the center of commerce and trade in the region. The City also plays a pivotal role in the evolution of Central Luzon because of its strategic location and high-competitive indices. The City of San Fernando will be the major catalyst in the mega-region where the convergence of competencies, opportunities and resources will symbiotically catapult the city into the socio-economic limelight of the country. With the City s inherent role as a major economic and service center of Central Luzon together with its emerging role with the Metro Clark area, it is not surprising that its day time population is much greater than its night time population. However, its attraction as a settlement center does not diminish but continues to increase with the development of the CSEZ because of proximity, presence of tertiary services and facilities, and a relatively well-developed infrastructure and utilities backbones. The increasing demand for lands to be used for higher order land uses to support the above trend is a major issue that the CLUP needs to contend with. 5. Disaster Risks and Climate Change Scientists and experts say climate change is now happening as manifested by the increasing frequency of higher intensity climatic events worldwide. In the case of San Fernando, resiliency to climate change and its impacts is a major concern of the local government considering its location and large number of residents and visitors, the high value of physical capital within its territory, and the potential impact of climate change on regional economic development. 11 P a g e

8 The recent study conducted by the Mines and Geosciences Bureau (MGB) of the Department of Environment and Natural Resources (DENR) through the READY Project identified the flooding susceptible areas in the City in three categories as shown in Figure 10 above. As expected, the southern portion of the City is highly susceptible including those within the vicinity of natural drainage ways such as streams and creeks. However, there are extensive areas with flooding susceptibilities that are moderate or low. Around 30 percent of the total land area of the City is prone to flooding and even all-season roads are not spared. Despite the improvement in the drainage canals along McArthur Highway, during rainy season, the floodwaters coming from Angeles City and Bacolor and flowing down southward continuously pose as hazards to motorists forcibly slowing down vehicular motion. The situation slows down economic activities, leads to economic losses including loss of life and limbs attributed to vehicular accidents. As earlier mentioned, San Fernando River at the southern end is the main drainage way for surface runoff and flood waters in the City. This is fed by four creeks namely St. Jude, Maimpis, Calulut, and Mapalad Creek. 12 P a g e
9 Schematically, the network of creeks in the City is depicted in the following diagram: Calulut Creek Figure 11 Network of Four Creeks Baliti Creek St. Jude Creek Sindalan Creek Sn Isidro Creek Maglima n Creek Sto Cristo Creek Maimpis Creek City Boundary Del Carmen River San Fernando River At first glance, one may easily conclude that the City is well-drained by the network of four creeks. However, as may be seen in the diagram above, the flow of these four creeks captured on a 7,000-hectare drainage area converge at San Fernando River which may be found traversing the lower portions at the south of the City. It is worth noting that the headwaters of Calulut Creek which is a major tributary of Del Carmen River originate from Angeles City and passes through an extensive high density urban built up area of the City before it enters the bounds of San Fernando City. It is no wonder that during heavy rains, the resulting high volume flow in Calulut Creek is accompanied by solid wastes and other debris as may be seen in the picture below. 13 P a g e


10 The southern part of the City serves as a catch basin for all runoff falling within the four mini watersheds shown in Figure 12. This would mean that if all of the rain that falls within the watersheds is conveyed through the drainage network, every inch of rainfall would result to volume of run-off of some 1.7 million cubic meters that shall accumulate at the southern portion of the City assuming that the run-off shall not be drained out. This is the main reason that the same areas are susceptible to siltation and flooding either recurrent or floods that last for less than a week. 14 P a g e
11 Much against the will of the City officials and its people, CSF is a natural recipient of floodwater generated from sources outside of the City s political boundaries. Natural causes wrought by the Pinatubo-sourced lahars exacerbated the flooding problem in mid Greater variation in natural elevation between and among CSF and its neighbors particularly Bacolor and Angeles City carry with it not only floodwater but even solid wastes and other debris which the City has to address. To add insult to injury, public disregard of the Ecological Solid Waste Management Act leads to using the existing drainage canals of the City as sewers for their wastes. This has been impairing the integrity of even the City s newly built canals and may aggravate the flooding problem. The City s changed natural landscape and the consequences of climate change are areas needing greater focus. The City is at the forefront of the concern to win over or mitigate the anticipated ill-effects of disasters. The challenge is not only to mainstream Disaster Risks Reduction (DRR) in planning but to ensure that what has been determined as disaster-risks reducing Projects shall be given budgetary support. B. Internal Conditions that Bear on CSFP s Land Uses 1. CSFP s Development Vision, Goals and Development Directions Habitat of Human Excellence The end-state of all development initiatives of the City of San Fernando by year 2030 is a place of domicile for people who have attained a level of dignity and who have achieved freedom to privately appropriate goods and services and productive resources with little or no interference from government. The same people are cut above the rest as borne out by their high family incomes, free access to quality health and education services and productive assets and can freely decide on their unique contributions to the general welfare. They are a people whose independent exercise of political and civil rights is guaranteed primarily by their decent socio-economic status protected by a credible legal framework. Global Gateway In pursuing the end state, the City shall have become a global gateway by 2020 and has appreciated and knowingly used the opportunities opened by its proximity and easy access to the Subic Clark Alliance for Development Corridor. Thus, during this time, tertiary level services and facilities are readily accessible to residents of San Fernando and the influence area of SCAD Corridor. Aside from that, the international business processes outsourcing community prefers the services of the City s 15 P a g e
12 labor force due to high interconnectivity, dependability, high quality and the presence of responsive support services. The City is physically connected to the international port of Subic and bustling international airport of Clark through a network of roads and rapid railways transport network with levels of service that keeps pace with the increasing demand. Gateway to North Philippines, Regional Center of Central Luzon, and Champion of Good Urban Governance... In the immediate to the medium term, the City shall endeavor to be effective in its role in regional development as a gateway to North Philippines and seat of the regional government. At the same time, it shall have instituted governance systems and processes that support the provision of effective services to its people and clientele. San Fernando s strategic location being on a major north-south and eastwest crossroad makes it a natural gateway to all four directions of the Central Luzon. This role was a consideration in the recent approval of the widening of the Jose Abad Santos Avenue sections that traverses the city. The high traffic volume that passes through the MacArthur highway between Barangays Dolores and Telabastagan was also a key in the implementation of its widening to six lanes. However, to date, the widening project was stalled because of some environmental issues raised against the cutting of century old trees along the road right of way especially between the Baliti-Telabastagan section. The City s initiatives in improving governance systems has already earned it several major national and international awards in recognition of their trailblazing and effectiveness in bringing the local government nearer to the people. 2. Land Area and Political Boundaries The City is subdivided into thirty five barangays with a total land area of some 6,800 hectares (Please refere to Table 1 below for land areas for each barangay as provided by the City Assessor s Office). It is a component city that was founded in 1755 that originally included the present day towns of Bacolor and Mexico and became the capital of Pampanga in San Fernando became the 99 th City of the Republic of the Philippines on February 4, 2001 by virtue of Republic Act P a g e
13 Table 1 Barangays of City of San Fernando by Land Area Barangay Area (has.) Barangay Area (has.) Barangay Area (has) Alasas 127 Lourdes 51 San Isidro 140 Baliti 198 Magliman 138 San Jose 322 Bulaon 166 Maimpis 254 San Juan 241 Calulut 475 Malino 168 San Nicolas 80 Del Carmen 309 Malpitic 131 San Pedro 224 Del Pilar 71 Pandaras 167 Sta. Lucia 87 Del Rosario 165 Panipuan 436 Sta. Teresita 81 Dela Paz 170 Pulung Bulu 104 Sto. Niño 136 Norte Dela Paz 157 Quebiawan 234 Sto. Rosario 85 Sur (Poblacion) Dolores 256 Saguin 105 Sindalan 327 Juliana 52 San Agustin 295 Telabastagan 191 Lara 335 San Felipe 296 TOTAL 6,774 Source: CLUP Despite the seeming completeness of barangay political boundaries, there are several barangays that are not satisfied with the current delineations. In the on-going STAR Barangay project where barangays development plans are prepared by stakeholders with the city planning office providing a catalytic role, boundary disputes have been identified as a major issue that needs to be addressed in order to sustain cooperation between and among adjacent barangays. As an example, the boundary dispute between Barangays Calulut and Sindalan has been a source of strain in inter-barangay relations. 17 P a g e

14 Population and Demographics Population Level and Distribution. The analyses of the population of the City of San Fernando were based on results of the National Census of Population in May 1, 2000 and August 1, The urban characteristic of the City calls for a spatial distribution analyses focused on the built-up areas using estimates from the NAMRIA topographic map 2007 edition that shows high density and low density residential areas including major buildings and infrastructures. In terms of population movement, barangay level analyses were conducted using data from the local civil registrar to account for natural population components. In August 2007, there were some 269,365 persons residing in the City of San Fernando. This represents around 14 percent of Pampanga s population and 2.8 percent of Central Luzon. In the same year and using the same census data, two out of every three residents belong to the economically active age group resulting to an economic dependency ratio of around 57 percent (Table 2). This heightens the need for higher order economic activities to generate employment for those in the economically active age group. 18 P a g e
. The extensive resettlement site of Bulaon after the eruption of Mt. Pinatubo is the sole reason for its very high population.")

15 Figure 14 Population by Barangay, 2007 and 2000 Population levels in 2007 by Barangay show a centrality of four barangays which recorded more than 15,000 residents each (Sindalan, San Agustin, Dolores and Bulaon). The extensive resettlement site of Bulaon after the eruption of Mt. Pinatubo is the sole reason for its very high population. Through the years, it became the highest populated barangay in the City. On the other hand, the high population levels of the other three Table 2 Population by Age Group and Dependency Ratio, August 2007 Particulars Both Population by Sexes Age Group Male Female 0 to 14 86,712 44,657 42, to ,729 85,618 85, and above 10,536 4,407 6,129 Dependency Ratio (%) Source: 2007 Census of Population, NSO barangays may be attributed to voluntary location and their strategic location. Dolores and Sindalan are in cross roads while San Agustin is very proximate to them. (Figure 14) Fourteen other barangays have population levels between 5,000 and 15,000 persons. Barangays in and around the old town center compose the core of these barangays. 19 P a g e


16 Population Density. As may be seen in Figure 15 there is a wide variation in the densities across barangays. The five most densely populated barangays, are: Bulaon, Lourdes, Sta. Teresita, San Nicolas and Juliana. Except for Bulaon, these barangays are part of the cluster of old town center barangays. Between 2000 and 2007, except for three barangays (Del Pilar, Malino and San Jose) all registered increases in densities. San Nicolas registered the highest increase in population density. There is an observed clustering of the mediumdensities in barangays that have recently experienced built-up expansion resulting from the land use adjustments in response to the post Mt. Pinatubo eruption in After the eruption of Mt. Pinatubo in 1991, the built-up area expanded on both sides of MacArthur Highway. Businesses opened up along the stretch of this main road going towards Angeles City. The improvements of the intersection of Olongapo- Gapan Road (now Jose Abad Santos Avenue) with MacArthur highway further served as a magnet to private investments as new 20 P a g e

17 businesses including financing institutions located on the corridor. The Dolores intersection became a business node. Other complementary land uses such as residential, service establishments, and entertainment expanded from this node. This resulted to the development of the present high population density built-up areas as may be seen in Figure 16. Population Growth Components. Household population of three barangays decreased between 2000 and 2007 as may be seen in Figure 17 which is consistent with the observed decrease in densities earlier. It should be noted that the fastest growing barangays are found in the peripheries at the west and east of MacArthur highway while the medium growth barangays are adjacent. With the exception of Barangay Pulungbulu that was created only in 2002, eight barangays registered population increases of more than 2,000 persons each (Barangays Calulut, Lara, Panipuan, Quebiawan, San Agustin, San Pedro, Sindalan and Telabastagan). 21 P a g e
18 In an effort to better appreciate the components of the population changes by barangay, the migration trends were estimated by deducting the population natural increase from the changes in population by barangay between 01 May 2000 and 01 August The results are summarized in Figure 18. Twelve of the City s 35 barangays have lost residents through migration. The biggest net outmigration barangays are Del Pilar, San Jose, Malino, Dolores and Bulaon. The high net outmigration from Bulaon may either be a trend among those resettled from other places to be returning to their original places twenty years after the eruption of Pinatubo. It may also be an indication of economically active population going to other places in search for jobs and other opportunities. The high net outmigration from Dolores may be a result of the recent resettlement of families living informally along the right of way of the Philippine National Railways into the Northville resettlement. In the case of San Jose, the high outmigration maybe a response to economic pressures as more families need employment and livelihood opportunities. Figure 19 Migration by Barangay, 01 May 2000 to 01 August 2007 In contrast, the high net inmigration into Telabastagan may be a result of its being a receiver of development spillovers of Angeles City. It has become a favored area for built development since the completion of the Telabastagan-Friendship Road was completed. It is also located adjacent to Angeles City s private industrial parks and a desired route to the built development of Bacolor. The case of Barangay Panipuan may be a result of the location of manufacturing and agri-industrial companies in the Panipuan-Baliti area. The same may be true with Barangay Lara as new manufacturing and agriindustries have located in the vicinity of Saguin, Dela Paz Norte and Sur. Barangay Quebiawan is strategically located adjacent to the San Miguel 22 P a g e


19 Corporation plant and other manufacturing industries. It is also accessible to the commercial areas of San Fernando Population Projections. The planning team estimates that assuming the current trend of population growth shall continue until 2020, about 381,335 persons shall be residing in the City. The chart in Figure 20 shows that Bulaon shall continue to be the most populated barangay followed by San Agustin, Dolores, Sindalan, San Pedro and Quebiawan. Should the outmigration issues be reversed Barangay Dolores shall be the second most populated followed by San Agustin, Sindalan, and San Jose that shall have more than 20,000 residents each. 4. Land Resources and Physical Characteristics Topography and Slope. The whole coverage of the City of San Fernando has almost flat topography with no distinct natural landmark except for the San Fernando River that crosses the width at the southern end. It is shaped like a rectangle (around 4 kilometers wide by 12 kilometers long) that is inclined by 45 degrees from a southnorth line. It is around 14 kilometers southwest of Mt. Arayat, the most pronounced landform in the Central Plains of Central Luzon, and adjacent to 23 P a g e
20 the southeast of Angeles City. On its western side is the east Mega Dike that was built after lahar flows threatened the City in The City is relatively in a flatland area with elevations between 70 and 5 meters above mean sea level (Figure 21) and an average slope of 0.54 percent. Water Supply Services. The provision of adequate, clean and affordable water is one of the most important services of local governments. It falls under their responsibility through the local water districts. However, in cases where public water supply is inadequate, it is augmented by private individual sources. In other cases, commercial establishments, large industries and/or private housing subdivisions usually install their own independent systems to ensure water supply availability. San Fernando has a population of about 270,850. At present, the City of San Fernando Water District (CSFWD) has its water service facilities available in 35 barangays with 28,994 total number of active connectors as of February 1, Most of the areas served by the system enjoy 24-hour water supply. Table 3. No. of Connections, Average Consumption Type of Consumer No. of Connections Average Water Consumption Domestic 27, L/Hr Commercial 1, L/Hr Industrial 0 0 Others 140 (Gov t) Total 28,994 Source: CSFWD CSFWD supplies water to its concessionaires from various sources located in Moras Dela Paz, Sto. Tomas and San Matias, Sto. Tomas. Its spring sources could be found in Brgy. Dolores. There are pumping stations and booster pumps distributed within the City proper and various barangays. Water is distributed through a pipeline network with pipe sizes ranging from 4 inches to 12 inches in diameter. The system also includes water storage facilities. Existing Land Uses and Land Classifications. The existing land uses in 2010 was derived by updating the land classification map prepared for the previous CLUP of San Fernando through a combination of overlaying with Google earth satellite images and field validation. The resulting existing land use map is presented as Figure 22. It shows the trend of built development on both sides of MacArthur Highway while manufacturing and agri-industries are found in areas accessible through the same highway. The agricultural lands are on the peripheries east and west of MacArthur 24 P a g e

21 Highway in addition to those in the southern part of the City. Commercial development is observed to be following immediately on both sides of the same highway. The commercial development is interspersed with institutional uses the biggest of which is the 18-hectare regional government center in Barangay Maimpis. Figure 22 Existing Land Use Map 25 P a g e

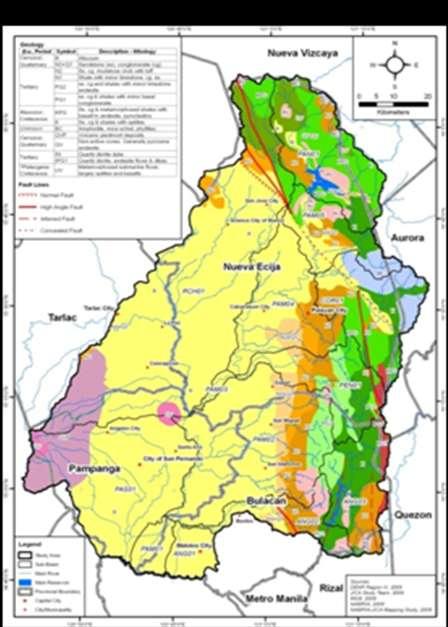
22 Soils. The Soil Map shown in Figure 23 highlights the extensive sandy areas in the City. The internal drainage of the soil is excellent and thus may not be conducive to the production of crops that require submerged conditions such as rice. Silt loam can be found in the southern portion of the City, the same area that serves as catch basin of surface runoff flowing in the San Fernando River. The soil condition is ideal for built development although the subsoil conditions may prove otherwise. Studies conducted by the National Water Resources Board (NWRB) and the Japan International Cooperation Agency (JICA) in 2010 reveal that extensive areas in the City may not be able to support high rise building development. Geology. Figures 24, 25 and 26 shows that the underlying geologic formation in San Fernando is alluvium. The City is on top of productive aquifer. However, a study conducted in 2008 reveal that groundwater in the area is at high risk despite the present good qualities of water from various pumping stations. Transportation and Traffic. Transport development directly contributes to the improvement in the standard of living. Roads provide access to various institutions and connect people and resources. Urban mass transit saves time and expense. Inter-city passenger transport makes more convenient for people to travel either for business or recreation. In addition, transport development can immediately spur economic growth, i.e., by reducing the costs of doing business. 26 P a g e


23 27 P a g e

24 Roads. There are two interregional arterial roads and one major eastwest lateral connection passing through the City of San Fernando, namely: MacArthur Comprehensive Land Use Plan of the City of San Fernando, Pampanga Table 4. Inventory of Roads as of October 2010 Total Road Surface (in kms.) Administrative Length Classification Concrete Asphalt Gravel/ Earth % of Unpaved /Total (in kms.) National Provincial City Barangay Total Source: Engineering Office, CSFP. Highway or Manila North Road (MNR), North Luzon Expressway (NLEx) and the Jose Abad Santos Avenue (JASA) formerly known as Gapan San Fernando-Olongapo (GSO) road respectively. Table 4 shows the road inventory of the City of San Fernando as of October The City has a total road length of kilometers with classified National accounting for 13.8 percent, Provincial 2.0 percent, City 1.2 percent and Barangay 83.1 percent. Except for the remaining kms. of barangay roads, almost all of these roads are already paved, either concrete or asphalt. The local roads are regularly maintained by the City Government in coordination with the Department of Public Works and Highways (DPWH). Figure 27. Road Network Map P a g e
25 The road density of the City was computed at 4.14 kms. of road per km 2. of land which is way above the national standard of 1.00 km. per km 2. There are a total 33 bridges within San Fernando. Per latest assessment of the City Engineer s Office, six needs rehabilitation while another five are being proposed for construction. Despite the high road density, it may be seen from Figure 27 and Table 4 that the road network is mainly composed of barangay roads and these have limited carriageways and often road rights of way. The built development has been concentrated on a corridor on both sides of MacArthur Highway and the barangays and other local roads connect the built-up areas to it. Jose Abad Santos Avenue is the only major road on an east-west direction despite the 12-kilometers length of MacArthur Highway. The level of service of MacArthur Highway has increased with the recent completion of its widening from Dolores up to Baliti. The proposed widening from Baliti onwards to Angeles City was held in abeyance due to the opposition of some environmentalists as the project entails the cutting of some century-old acacia trees. Running almost parallel east of MacArthur is the Del Carmen-Bulaon- Calulut-Baliti-Panipuan road. This road serves as an alternate north-south road although its level of service is limited by its narrow carriageway and pot hole riddled road surface. Ingress and egress to this alternate road is only through three roads in Sampaloc, Sindalan and Baliti. These access roads themselves have very limited carriageways except for the MacArthur- Baliti road which has been widened due to high volume of truck traffic. Road Transportation Services and Facilities. The mode of public transport in the City of San Fernando is purely road-based consisting largely of jeepneys for primary routes, tricycles, pedicabs and kalesas for feeder routes. Buses are available for long-distance travels. There are bus companies serving the City inward to other destinations such as Victory Liner Inc., Genesis Transport Service, Inc., Bataan Transit Co., Inc. (BTCI) among others. The buses load and unload passengers in the city central terminal and in the parking area of Robinson s Starmalls (for Victory Liner buses) and the Mexico side parking area of SM Mall. Taxi service is not that well-established, however, there are some groups operating independently. The City also serves as a terminus for jeeps plying routes from the rest of Pampanga such as Lubao-Guagua-Bacolor, Apalit, Arayat-San Juan- Mexico, Angeles, and Dau, and from neighboring provinces such as Bataan (Balanga-Hermosa-Dinalupihan), Nueva Ecija (Cabanatuan-Gapan-Cabiao), Tarlac (Tarlac City-Capas-Bamban). 29 P a g e
26 The initial attempt by the city government to centralize all these intermunicipal traffic in the city central terminal was met with opposition not only from the operators of the public transport utilities but more so from the general public who raised the additional fare that costs them. Thus, the terminals of these inter-municipal jeepney routes were spread. Sidewalks are in relatively good condition. The City Government has succeeded in its drive to clear them of various obstructions e.g., illegal vendors, particularly in the Poblacion area. Previously, with sidewalks occupied, pedestrians had to walk on roads although there are overhead pedestrian bridges built in some areas. Traffic lights are installed in various intersections. Traffic rules or regulations are usually enforced by the Traffic Management Unit (TMG) a national support unit of the Philippine National Police (PNP), also under the LGU. Traffic management offices are scattered in different key areas of the City. Rail. One project that will benefit the City of San Fernando once completed is the Manila Clark Rapid Railway System (MCRRS) or the North Rail. A major undertaking of the national government, the North Rail project aims to build a fast, reliable and an efficient railway system in Central and Northern Luzon. Its implementation is undertaken in several phases (I-IV). Phase I of the Project is an 82-kilometer rail line between Caloocan City in Metro Manila and the Clark Special Economic Zone (CSEZ) in Pampanga. Other phases of the project are: Phase II - Branch line to Subic Economic Freeport Zone; Phase III - Extension to Bonifacio Global City; and, Phase IV - Extension to San Fernando, La Union. Three multi-modal stations or terminals provided with park-and-ride facilities are planned to encourage car owners to use the mass transit system, namely: CSEZ, Guiguinto, Bulacan and Bonifacio Global City. There will also be in-line stations to be built in various cities/municipalities i.e., Section 1- Caloocan, Valenzuela, Marilao, Bocaue, Guiguinto and Malolos; Section 2 - Calumpit, Apalit, City of San Fernando, Dau or Angeles City and Clark/ Mabalacat. Telecommunications Facilities. The City of San Fernando is advance in terms of telecommunication services. Communication links are sufficient. Most of the leading telecommunication companies in the country have facilities within the City like the Philippine Long Distance Telephone Co. (PLDT Co.), Digital Telecommunications Phils. (Digitel), Globe Telecom, and Smart Communications. They have vital transmission towers located in San Fernando. With regard to internet service, there are several Internet Service Providers (ISPs) offering dial-up, dedicated and DSL types of service. Over a hundred internet cafés are available in strategic areas. Availability of 30 P a g e
27 inexpensive broadband access infrastructure is significant in developing a widespread information economy and facilitative of e-commerce. There are four TV stations namely KTV Channel 12, Infomax Channel 8, CLTV 36 and ABS-CBN TV46 Pampanga. There are also two radio stations, RW 95.1 of the Radio World Broadcasting Corporation of the Philippines and the Power 92.7 of the Love Radio Network. Several local newspapers are published in the City which includes SunStar Pampanga, The Probe, Coffee Punch, Pampanga Times and the Observer. Power. Energy, power or electricity is a necessity for everyday life, that every activity requires it. The question is how one can utilize it in a sustainable way. San Fernando s electricity supply is provided mainly by the San Fernando Electric Light & Power Company, Inc. (SFELAPCO). SFELAPCO has four power distribution substations namely Table 5. Electricity Coverage as of October 31, 2010 Served with Total Coverage Electricity % Barangay Household 52,504 52, Source: SFELAPCO; Socio Economic Panorama , CSFP Note: * does not include household served by Angeles Electric Magdalena, Greenville, Lourdes Heights and Basa Sub-Stations with a combined capacity of MVA. It is the seventh largest privately-owned electricity distributor in the country. It procures energy from the government-owned National Power Corporation TransCo (NPC-TransCo) and from Hedcor, Inc., - a hydroelectric firm of the Aboitiz Group. Thirty four out of the 35 barangays of the City are served by SFELAPCO. Due to its proximity to Angeles City, Barangay Pulung Bulu and some portions of Telabastagan are served by the Angeles Electric Corporation. In terms of household, per account of the SPELAFCO, by February 2010, about 50,000 households in San Fernando had access to electric power service, consuming an average 10 million kilowatt-hours per month. Solid Waste Management Facilities. Past efforts of the City government focused on ensuring that the increased economic activity will not pose serious ecological problems in the City. Thus, solid waste management and other environmental protection measures were implemented so as not to, says Mayor Oca, create a serious disequilibrium between the people and their habitat. In a serious effort to implement the provisions of the Ecological Solid Waste Management Act of 2003, the government remained vigilant in maintaining the City s cleanliness and enforced proper garbage disposal in its barangays. The conversion of the City s open dumpsite into a controlled 31 P a g e


28 one delivered the strong message of importance of garbage segregation and the consequential penalties arising from non-compliance with the law. Information and education campaigns stressed the public s role in the successful implementation of the law. The environment conservation sector of the City were mobilized to support efforts to rehabilitate San Fernando River not only as a flood control measure but also as proud part of Fernandinos heritage. In coordination with the Manila Bay Site Coordinating Committee, the water quality of the river and its tributary creeks is constantly being monitored to ensure elimination of water pollution. 5. The City s Economy Economic and political dynamics in the City of San Fernando are fast altering the City s economic landscape and causing it to shed some old skin. With the changes come the pressure or challenge to face up to the demands presented by the opportunities brought about by said changes, and in harnessing its potentials as well as addressing the barriers to creating the desired change. The City s economy has taken the turn from a predominantly agricultural economy (35 years ago during Mr. Arturo Tangco s era as Agriculture Head) to one oriented toward Industry and Services. In the survey conducted by the University of the Assumption (UA) on the socioeconomic make-up of the City, employment is shown to concentrate in the Services Sector with about 75 percent of the City s labor force accounted here. The Industry sector comes in second in employment share with 36 percent, while Agriculture, Fishery and Forestry (AFF) accounts for the least share with 9 percent. Trading represents the single biggest share of the employed with about 18 percent, followed by Manufacturing with 15 percent, and Transportation, Communication and Storage (TCS) with 13 percent. This structural pattern of the economy mirrors that of the country, the region and the province of Pampanga. The direction of the City s economy is essentially influenced by its being the seat of government at the regional level and transit hub for travels north, west, east and south of the region. This pattern of growth 32 P a g e
29 may well be the City s imprint in the future even as the City is taking a facelift that would encourage further investments because of the spike in real estate development. And as the City is the heart and center of the region and the province, its role would have to be as source of the services and assistance needed by the other sectors (industry and agriculture) that are the base of the other municipalities surrounding it. Yet, even if services are shaping the local economy, the City is also known for its thriving local industries such as lantern-making, processed meat, sweets and delicacies and handicrafts. Said industries have consumers extending beyond the City s borders making these industries therefore the City s economic base along with services. Nevertheless, micro-enterprises make up for the bulk of the City s business establishments. Sustaining these businesses so that they will continue to be viable and provide employment to local labor, that otherwise could not be employed in other industries, is a challenge that the City must attend and respond to in addition to attracting investments with high potential for expanding the local economy and creating jobs. The City of San Fernando, however, is at the threshold of urban and industrial development, with population growth taking on a bigger turn along with non-agricultural activities. As regional capital and center, the City has been drawing people and economic activities that are now causing the city s facelift from predominantly agricultural to one that is strongly urban with a dominant service industry as economic base. Agriculture. The City s agricultural activities while still occupying a good portion of the city s land area are now relegated in its peripheries those parallel the megadike and the North Luzon Expressway and areas at the southern end of the City. These remaining agricultural areas are mainly planted to rice, sugarcane and HVCC, which are interspersed with livestock and poultry production and fish farming. In some areas though, especially those adjacent to populated areas, encroachment of settlements into livestock/poultry farm areas is becoming an issue because of environmental concerns. Out of the City s 35 barangays, 26 are engaged at varying degrees in agricultural production. As per record of the agriculture office in 2010 about 35 percent of the City s total land area is agricultural land. However, based on actual area planted report of the same office, crop area accounts for 25 percent of the City s land area, while livestock and poultry for two percent. Among crops, rice and sugarcane make up for the largest land use of the 33 P a g e
30 City s crop area, with 37 percent for rice and 43 percent for sugarcane. Major crop areas in terms of extent of land use and share of barangay land area are Barangays Panipuan (53%), Malino (48%), Dela Paz Sur (45%), Del Rosario (33%), Maimpis (31%), Malpitic (26%), San Isidro (21%) and Calulut (20%) for sugarcane; Magliman (43%), San Felipe (33%), Quebiawan (20%), Del Carmen (20%), Calulut (15%), Bulaon (14%), Del Rosario (10%) and San Pedro (8%) for rice; and Barangays Dela Paz Sur (29%), Bulaon (19%), and Calulut (6%) for HVCC. Figure 29 (below) shows the crop area distribution by barangay Fig. 1. Barangay Crop Area Distribution, CSFP Figure 29 Barangay Crop Area Bulaon Dolores San Agustin Sindalan San Jose San Nicolas Calulut* Telebastagan Quebiawan San Pedro San Isidro Del Pilar Santa Lucia Santo Nino Maimpis Saguin Panipuan* Baliti Lourdes Pulung Bulu Del Rosario San Juan Del Carmen Dela Paz Norte Malino* Magliman Juliana San Felipe Lara** Malpitic Alasas Fig. 1. Barangay Crop Area Distribution, CSFP Bulaon Dolores San Agustin Sindalan San Jose San Nicolas Calulut* Telebastagan Quebiawan San Pedro San Isidro Del Pilar Santa Lucia Santo Nino Maimpis Saguin Panipuan* Baliti Lourdes Pulung Bulu Del Rosario San Juan Del Carmen Dela Paz Norte Malino* Magliman Juliana San Felipe Lara** Malpitic Alasas Dela Paz Sur* Pandaras Santa Teresita Santo Rosario Dela Paz Sur* Pandaras Santa Teresita Santo Rosario Rice (Irrig) Rice (Non-irrig) The City of San Fernando is also actively engage in livestock and poultry production, with numerous commercial livestock and poultry farms present in the City. The sector covers about 113 hectares or about 2 percent of the City s total land area and 33 commercial farms (11 for livestock and 22 for poultry). Said areas are dispersed in 13 out of the 35 barangays (Figure 30), with six barangays serving as major sites, namely, Dela Paz Sur, Malino, Lara, Calulut, Panipuan and San Juan. Said barangays have livestock and poultry farms covering areas from 10 to 26 hectares or 3 to 24 percent of the barangay land areas. Commercial poultry farms are also present, although at a lesser extent, in thickly populated barangays such as Bulaon and San Agustin. Sustaining therefore said farms in these areas would require the installation of pollution-mitigating measures that would keep farm wastes from causing undue environmental and health risk to the surrounding population. Failure to address said concern may erupt into a land use issue and possibly threaten the operation and existence of said farms, leading to settlements occupying the once agricultural areas. Corn Rice (Irrig) Rice (Non-irrig) Sugarcane Corn HVCC Sugarcane HVCC Root Crops Root Crops Legumes Leafy Veg Leafy Veg Fruit Veg Fruit Veg 34 P a g e
31 Fish production, however, a minor sector is another of the land using activities of the City of San Fernando. Said sector produced in 2010 only about 68 metric tons with the yield coming from a total of 57 hectares covering 11 barangays, Fig. 2. Livestock namely: and Poultry Bulaon, Distribution Calulut, by Barangay, del Rosario, CSFP Lara, Maimpis, Bulaon Dolores San Agustin Sindalan San Jose San Nicolas Calulut* Telebastagan Quebiawan Figure 30 Livestock and Poultry Distribution by Barangay Distribution Figure 30 Livestock and Poultry Distribution by Barangay San Pedro San Isidro Del Pilar Santa Lucia Santo Nino Maimpis Saguin Panipuan* Baliti Lourdes Pulung Bulu Del Rosario San Juan Del Carmen Dela Paz Norte Malino* Magliman Juliana San Felipe Lara** Malpitic Alasas Dela Paz Sur* Pandaras Santa Teresita Santo Rosario Livestock Poultry Pandaras, Panipuan, San Pedro, Sta. Lucia, San Juan and San Felipe. About 73 percent of the City s fish output comes from Barangays Pandaras, Sta. Lucia and San Juan. Only San Juan and San Felipe are with swampy areas and therefore a more stable site for fish production. Similarly, as it is largely agricultural, Pandaras may well continue as a fish production site, while the other barangays with small-volume producers may find themselves more prone to conversion especially those with large settlements. Prone as the City is to urban and industrial transformation, there are, however, rural barangays, by virtue of their being flood-prone are less vulnerable to conversion. Barangays Pandaras and San Felipe have the largest rice production areas, but are also the most prone to flooding and siltation. Unless interventions that would modify the vulnerability of these areas to said natural disturbances are taken, these areas then would have to remain serving their agricultural function so much so if population growth in these barangays remains at current levels. This means less pressure from population to use the land for settlement and other economic uses. Access is another constraint to growth in this area, particularly Barangay Pandaras because of the absence of road that would connect the barangay to the City s commercial and financial district. On the other hand, barangays with a good percentage of their areas utilized for agricultural production but are densely populated may, because of pressure from population, face conversion of said production areas to other uses. Barangay Bulaon is one such area having the largest population of all barangays and also the densest. Based on CAO s record, Bulaon has about 34 percent of its land area used for rice, HVCC and poultry production, while the rest is built-up area or settlement. Its adjoining barangay Calulut is similarly situated with population taking on an upward 35 P a g e
Airport Planning Area
 PLANNING AREA POLICIES l AIRPORT Airport Planning Area LOCATION AND CONTEXT The Airport Planning Area ( Airport area ) is a key part of Boise s economy and transportation network; it features a multi-purpose
Parkland County Municipal Development Plan Amendment Acheson Industrial Area Structure Plan
 Parkland County Municipal Development Plan Amendment Acheson Industrial Area Structure Plan New Plan Acheson Industrial Area Structure Plan Amendment Parkland County Municipal Development Plan Board Reference
Provincial Development and Physical Framework Plan Province of Capiz
 3.2.3 Protection Areas Protection areas (Map 11) which include areas under the categories of NIPAS, Non-NIPAS, environmentally constrained and the military reservations are described as follows: a) NIPAS
Laguna. There are two trunklines connecting the province of Laguna with Metro Manila. These are:
 TECHNICAL REPORT No. 3: URBAN / TRANSPORTATION DEVELOPMENT CONDITION IN ADJOINING AREAS Laguna There are two trunklines connecting the province of Laguna with Metro Manila. These are: The South Luzon Expressway
Rule Governing the Designation and Establishment of All-Terrain Vehicle Use Trails on State Land
 Rule Governing the Designation and Establishment of All-Terrain Vehicle Use Trails on State Land 1.0 Authority 1.1 This rule is promulgated pursuant to 23 V.S.A. 3506. Section 3506 (b)(4) states that an
Gold Coast. Rapid Transit. Chapter twelve Social impact. Chapter content
 Gold Coast Rapid Transit Chapter twelve Social impact Chapter content Social impact assessment process...235 Existing community profile...237 Consultation...238 Social impacts and mitigation strategies...239
SUTTER COUNTY. General Plan Update Technical Background Report
 SUTTER COUNTY General Plan Update Technical Background Report February 2008 SUTTER COUNTY GENERAL PLAN UPDATE TECHNICAL BACKGROUND REPORT PREPARED FOR: SUTTER COUNTY PREPARED BY: PBS&J IN PARTNERSHIP
Figure 1.1 St. John s Location. 2.0 Overview/Structure
 St. John s Region 1.0 Introduction Newfoundland and Labrador s most dominant service centre, St. John s (population = 100,645) is also the province s capital and largest community (Government of Newfoundland
The City s Strategic Economic Support Projects
 INTEGRATED FOOD TERMINAL The Integrated Food Terminal is envisioned as a strategic location of wholesale agricultural produce marketing facility with separate hog and cattle/goat/sheep abattoirs and a
Other Principle Arterials Minor Arterial Major Collector Minor Collector Local
 CHAPTER 10 TRANSPORTATION Introduction The system of public roads in East Pikeland Township is decidedly rural in character. Since the 1984, the road network has remained much the same, with the addition
PERMANENT MISSION OF BELIZE TO THE UNITED NATIONS
 PERMANENT MISSION OF BELIZE TO THE UNITED NATIONS 675 Third Ave. Suite 1911 New York, New York 10017 Tel: (212) 986-1240/(212) 593-0999 Fax: (212) 593-0932 E-mail: blzun@belizemission.com STATEMENT DELIVERED
2. Introduction to Kurunegala Area : 2.1 Location and History : 2.2 Regional Aspects :
 2. Introduction to Kurunegala Area : 2.1 Location and History : Kurunegala town is the capital of Kurunegala district as well as the capital of North Western Province (Fig 2.1). It has been administered
SUMMER VILLAGE OF SILVER SANDS. Municipal Development Plan
 SUMMER VILLAGE OF SILVER SANDS Municipal Development Plan Bylaw 253-2014 Adopted August 22, 2014 Summer Village of Silver Sands Municipal Development Plan Bylaw No. 253-2014 Page 2 1 INTRODUCTION 1.1 SETTING
DRAFT GENERAL IMPLEMENTATION PLAN AND SPECIFIC IMPLEMENTATION PLAN MIDDLETON MUNICIPAL AIRPORT MOREY FIELD. Revised 12/12/03
 DRAFT GENERAL IMPLEMENTATION PLAN AND SPECIFIC IMPLEMENTATION PLAN MIDDLETON MUNICIPAL AIRPORT MOREY FIELD Revised 12/12/03 As recommended for approval by the Plan Commission General Project Description
NATIONAL AIRSPACE POLICY OF NEW ZEALAND
 NATIONAL AIRSPACE POLICY OF NEW ZEALAND APRIL 2012 FOREWORD TO NATIONAL AIRSPACE POLICY STATEMENT When the government issued Connecting New Zealand, its policy direction for transport in August 2011, one
MONTEREY REGIONAL AIRPORT MASTER PLAN TOPICAL QUESTIONS FROM THE PLANNING ADVISORY COMMITTEE AND TOPICAL RESPONSES
 MONTEREY REGIONAL AIRPORT MASTER PLAN TOPICAL QUESTIONS FROM THE PLANNING ADVISORY COMMITTEE AND TOPICAL RESPONSES Recurring topics emerged in some of the comments and questions raised by members of the
Sales Associate Course
 Sales Associate Course Chapter Nineteen Planning, Zoning and Environmental Hazards Copyright Gold Coast Schools 1 Government Planning Planning in U.S. dates back to the colonial period Government did not
A. CONCLUSIONS OF THE FGEIS
 Chapter 11: Traffic and Parking A. CONCLUSIONS OF THE FGEIS The FGEIS found that the Approved Plan will generate a substantial volume of vehicular and pedestrian activity, including an estimated 1,300
The implementation of this Master Plan will be undertaken in logical stages to meet passenger and workforce demands.
 The implementation of this Master Plan will be undertaken in logical stages to meet passenger and workforce demands. Connecting People Building Opportunities 198 Brisbane Airport Corporation CHAPTER 10
CHAPTER 4 -- THE LAND USE PLAN: DESCRIPTIONS AND POLICIES FOR THIRTEEN PLANNING AREAS
 CHAPTER 4 -- THE LAND USE PLAN: DESCRIPTIONS AND POLICIES FOR THIRTEEN PLANNING AREAS NORTH CENTRAL CAC AREA LITTLE VALLEY ROAD TO JUG HANDLE CREEK PLANNING AREA This planning area includes Cleone, Noyo,
Module 1 Educator s Guide: Representative Discussion Points Investigation 3
 Module 1 Educator s Guide: Representative Discussion Points Investigation 3 Ethiopia and Eritrea Our combined population is 59,578,171 people. We have just emerged from a long period of civil war and famine.
RAY YENKANA Willowbrook Cr, Dawson Creek BC Canada $2,847,000
 1716 Willowbrook Cr, Dawson Creek BC Canada For SALE $2,847,000 This is a rare find, 32 townhomes in Dawson Creek, BC. Excellent investment in a single title multi family complex. Vendor has upgraded this
3. COLTA / HUGA CONNECTIONS - PRELIMINARY
 9 3. COLTA / HUGA CONNECTIONS - PRELIMINARY 3.1 COLTA The Chain of Lakes Trail Association (COLTA) trail, formerly identified as the Chester Spur Line, was completed and opened for use in June 2011. The
THRESHOLD GUIDELINES FOR AVALANCHE SAFETY MEASURES
 BRITISH COLUMBIA MINISTRY OF TRANSPORTATION & INFRASTRUCTURE AVALANCHE & WEATHER PROGRAMS THRESHOLD GUIDELINES FOR AVALANCHE SAFETY MEASURES British Columbia Ministry of Transportation & Infrastructure
STATUS OF DOT-DPWH CONVERGENCE PROJECTS AS OF JULY 31, 2015
 STATUS OF DOT-DPWH CONVERGENCE PROJECTS AS OF JULY 31, 2015 CY 2011-2012 PROJECT 1. Improvement of Pantabangan-Canili Bypass Road Phase 1, Aurora Province KO 195+717 to KO 196+640.15 with exception 2.
Town of Oakfield Agricultural and Farmland Protection Plan
 SECTION III COMMUNITY OVERVIEW A. Regional Setting / Location The Town of Oakfield is located in the northwestern portion of Genesee County. Located west of New York's Finger Lakes, the Town is uniquely
"ST. KLIMENT OHRIDSKI FACULTY OF GEOLOGY AND GEOGRAPHY
 SOFIA UNIVERSITY "ST. KLIMENT OHRIDSKI FACULTY OF GEOLOGY AND GEOGRAPHY APPLICATION OF THE MODEL "DRIVING FORCES PRESSURE STATE - RESPONSE FOR ASSESSMENT OF FLOOD RISK RADOSTINA BORISOVA DOCHEVA Bachelor
N4 Carrick-on-Shannon to Dromod Road Project. 2.1 Introduction
 Chapter 2 Need for the Scheme 2.1 Introduction The National Primary Route N4, Dublin to Sligo is a strategic corridor from Dublin to the northwest and border counties (See RCSR 101 in Volume 2). The National
STATUS OF PPP PROJECTS AS OF 05 OCTOBER 2011
 1. Daang Hari SLEx Link Project P 1.956 B ROW P 177.3 M Publication of Invitation to Participate and Bid July 20, 27 $ 43.5 M IC P 10.635 M and August 3, 2011 New 4 kilometer, 4-lane paved toll road that
5 Rail demand in Western Sydney
 5 Rail demand in Western Sydney About this chapter To better understand where new or enhanced rail services are needed, this chapter presents an overview of the existing and future demand on the rail network
STAGE MAP. Quezon City - Palayan City km Sunday 20 May 2018 PALAYAN CITY QUEZON CITY. Maria Aurora. San Jose City. Science City of Muñoz
 STAGE MAP Quezon City - Palayan City 157.15 km Sunday 20 May 2018 Gerona KOM COURSE FEATURES TYPE SPRINT START DRINK START FEED ZONE FINISH COURSE COURSE NEUTRAL ZONE Tarlac City Guimba Science City of
Tourism Impacts and Second Home Development in Coastal Counties: A Sustainable Approach
 Tourism Impacts and Second Home Development in Coastal Counties: A Sustainable Approach Brunswick, Currituck and Pender Counties, North Carolina (Funded by North Carolina Sea Grant) Center for Sustainable
TOWN PLANNING SUBMISSION TO THE GREATER SYDNEY COMMISSION LANDS AT ARTARMON
 TOWN PLANNING SUBMISSION TO THE GREATER SYDNEY COMMISSION LANDS AT ARTARMON March 2017 TABLE OF CONTENTS 1.0 INTRODUCTION 3 2.0 THE SUBJECT SITE 4 3.0 STRATEGIC PLANNING CONTEXT 6 4.0 SUMMARY AND CONCLUSIONS
PPCR/SC.4/5 October 9, Meeting of the PPCR Sub-Committee Washington, D.C. October 28, REVIEW OF ON-GOING WORK OF THE MDBs IN DJIBOUTI
 PPCR/SC.4/5 October 9, 2009 Meeting of the PPCR Sub-Committee Washington, D.C. October 28, 2009 REVIEW OF ON-GOING WORK OF THE MDBs IN DJIBOUTI Proposed Sub-Committee Decision The Sub-Committee reviewed
Section 61 Recreational Vehicle Park / Campground (Bylaw No. 2012/10)
") Part 7 General Regulations Section 61 Recreational Vehicle Park / Campground (Bylaw No. 2012/10) 61.1 A comprehensive site plan shall be provided to the satisfaction of the Development Authority that shows
Part 7 General Regulations Section 61 Recreational Vehicle Park / Campground (Bylaw No. 2012/10) 61.1 A comprehensive site plan shall be provided to the satisfaction of the Development Authority that shows
HOUSEHOLD TRAVEL SURVEY
 HOUSEHOLD TRAVEL SURVEY Household Travel Survey i TABLE OF CONTENTS Page 1.0 INTRODUCTION... 1 2.0 SUMMARY OF TRAVEL... 2 2.1 All-Day Travel Patterns... 2 2.1.1 Automobile Availability... 2 2.1.2 Trip
BUNKHOUSE ASSESSMENT REPORT
 FEBRUARY 2014 EXECUTIVE SUMMARY As a response to the need to provide temporary shelters for the victims of Typhoon Haiyan, the Philippine government through the DSWD and the DPWH decided to build bunkhouses.
2008 DEKALB COUNTY TRANSPORTATION PLAN (UPDATE)
") 2008 DEKALB COUNTY TRANSPORTATION PLAN (UPDATE) TABLE OF CONTENTS Introduction 1 Transportation Planning Activities 2 Identification of Problem Areas and Recommended Solutions 7 DeKalb County Projects
2008 DEKALB COUNTY TRANSPORTATION PLAN (UPDATE) TABLE OF CONTENTS Introduction 1 Transportation Planning Activities 2 Identification of Problem Areas and Recommended Solutions 7 DeKalb County Projects
The Challenges for the European Tourism Sustainable
 The Challenges for the European Tourism Sustainable Denada Olli Lecturer at Fan S. Noli University, Faculty of Economy, Department of Marketing, Branch Korça, Albania. Doi:10.5901/mjss.2013.v4n9p464 Abstract
THE ALBERTA GAZETTE, SEPTEMBER
 VILLAGE OF CEREAL Order No. 16915 IN THE MATTER OF THE "Municipal Government Act": File No. 241(A)3 AND IN THE MATTER OF an application by the Council of the Village of Cereal, in the Province of Alberta,
The Government s Aviation Strategy Transport for the North (TfN) response
 response") The Government s Aviation Strategy Transport for the North (TfN) response Transport for the North Background Good transport links are a crucial part of a strong economy supporting labour markets and delivering
The Government s Aviation Strategy Transport for the North (TfN) response Transport for the North Background Good transport links are a crucial part of a strong economy supporting labour markets and delivering
Tourism Impacts and Second Home Development in Pender County: A Sustainable Approach
 Tourism Impacts and Second Home Development in Pender County: A Sustainable Approach (Funded by North Carolina Sea Grant) Center for Sustainable Tourism Division of Research and Graduate Studies East Carolina
HEATHROW COMMUNITY NOISE FORUM
 HEATHROW COMMUNITY NOISE FORUM 3Villages flight path analysis report January 216 1 Contents 1. Executive summary 2. Introduction 3. Evolution of traffic from 25 to 215 4. Easterly departures 5. Westerly
Foregone Economic Benefits from Airport Capacity Constraints in EU 28 in 2035
 Foregone Economic Benefits from Airport Capacity Constraints in EU 28 in 2035 Foregone Economic Benefits from Airport Capacity Constraints in EU 28 in 2035 George Anjaparidze IATA, February 2015 Version1.1
Ex-Ante Evaluation (for Japanese ODA Loan)
") Japanese ODA Loan 1. Name of the Project Ex-Ante Evaluation (for Japanese ODA Loan) Country: The Republic of Peru Project: Amazonas Rural Development Project Loan Agreement: January 9, 213 Loan Amount:
Japanese ODA Loan 1. Name of the Project Ex-Ante Evaluation (for Japanese ODA Loan) Country: The Republic of Peru Project: Amazonas Rural Development Project Loan Agreement: January 9, 213 Loan Amount:
SOUTH INTERCHANGE AREA
 Santaquin City General Plan 1 Location and Characteristics The South Interchange Area of Santaquin is located west of Interstate 15 and south of 500 South (Figure 1). It includes properties already annexed
HELLENIC REPUBLIC Voluntary National Review on the Implementation of the 2030 Agenda for Sustainable Development. 16 July 2018
 HELLENIC REPUBLIC Voluntary National Review on the Implementation of the 2030 Agenda for Sustainable Development 16 July 2018 1 HELLENIC REPUBLIC Voluntary National Review on the Implementation of the
STRATEGY OF DEVELOPMENT 2020 OF THE CCI SYSTEM IN UKRAINE
 STRATEGY OF DEVELOPMENT 2020 OF THE CCI SYSTEM IN UKRAINE CONTENTS 1. Preconditions of formation of the Strategy of development of the CCI system...4 2. Conceptual grounds of the Strategy...5 3. Mission,
SAMTRANS TITLE VI STANDARDS AND POLICIES
 SAMTRANS TITLE VI STANDARDS AND POLICIES Adopted March 13, 2013 Federal Title VI requirements of the Civil Rights Act of 1964 were recently updated by the Federal Transit Administration (FTA) and now require
21.07 ECONOMIC DEVELOPMENT AND EMPLOYMENT 19/03/2015 C323 Proposed C Key issues and influences. Economic Role and Function
 21.07 ECONOMIC DEVELOPMENT AND EMPLOYMENT 19/03/2015 C323 Proposed C347 21.07-1 Key issues and influences 14/10/2010 C168 Economic Role and Function Geelong is the largest regional city in Victoria and
REDD+ IN YUCATAN PENINSULA
 REDD+ IN YUCATAN PENINSULA JOINING FORCES TO PRODUCE AND PRESERVE 2 3 Campeche, Yucatan, and Quintana Roo combat deforestation together in the Yucatan Peninsula and build a new path for growth A peninsular
CHAPTER FIVE PROSPECTS FOR FUTURE ECONOMIC DEVELOPMENT
 CHAPTER FIVE PROSPECTS FOR FUTURE ECONOMIC DEVELOPMENT 5.1 GENERAL The recommended type and location of future land uses in Alpine should, in part, consider potential opportunities for future economic
URBAN DESIGN REPORT. Proposed Residential Development, Old Church Road, Caledon East
 Proposed Residential Development, Old Church Road, Caledon East TABLE CONTENTS: 1.0 DEVELOPMENT 1.1 Introduction-Analysis of Guiding Principles and Documents 1.2 Community Design and Architectural Design
AGENDA ITEM 5 D WAKULLA ENVIRONMENTAL INSTITUTE (WEI) TRAIL FEASIBILITY STUDY
 TRAIL FEASIBILITY STUDY") March 19, 2018 AGENDA ITEM 5 D WAKULLA ENVIRONMENTAL INSTITUTE (WEI) TRAIL FEASIBILITY STUDY TYPE OF ITEM: Action STATEMENT OF ISSUE The Wakulla Environmental Institute (WEI) Trail is one of several trails
March 19, 2018 AGENDA ITEM 5 D WAKULLA ENVIRONMENTAL INSTITUTE (WEI) TRAIL FEASIBILITY STUDY TYPE OF ITEM: Action STATEMENT OF ISSUE The Wakulla Environmental Institute (WEI) Trail is one of several trails
EAST DON TRAIL ENVIRONMENTAL ASSESSMENT. Community Liaison Committee Meeting #3 July 15, :30 to 8:30 pm Flemingdon Park Library
 EAST DON TRAIL ENVIRONMENTAL ASSESSMENT Community Liaison Committee Meeting #3 July 15, 2013 6:30 to 8:30 pm Flemingdon Park Library Agenda 1. Welcome 2. Housekeeping and Updates a) Housekeeping b) CLC
Kilometres. Blacktown. Penrith. Parramatta. Liverpool Bankstown. Campbelltown
 0 5 10 15 20 Kilometres Penrith Blacktown Parramatta Liverpool Bankstown Campbelltown accessibility outcomes Legend Outcomes targeted in Western Sydney are: public transport that is accessible throughout
REGULATORY POLICY SEMINAR ON LIBERALIZATION POLICY AND IMPLEMENTATION PORT OF SPAIN, TRINIDAD AND TOBAGO, APRIL, 2004
 REGULATORY POLICY SEMINAR ON LIBERALIZATION POLICY AND IMPLEMENTATION PORT OF SPAIN, TRINIDAD AND TOBAGO, 27-29 APRIL, 2004 JAMAICA S EXPERIENCE WITH AIR TRANSPORT LIBERALIZATION INTRODUCTION Today, the
Ex-Ante Evaluation (for Japanese ODA Loan)
") Ex-Ante Evaluation (for Japanese ODA Loan) 1. Name of the Project Country: The People s Republic of Bangladesh Project: Hazrat Shahjalal International Airport Expansion Project (I) Loan Agreement: June
Ex-Ante Evaluation (for Japanese ODA Loan) 1. Name of the Project Country: The People s Republic of Bangladesh Project: Hazrat Shahjalal International Airport Expansion Project (I) Loan Agreement: June
CHAPTER 1 INTRODUCTION MORENO VALLEY GENERAL PLAN 1. INTRODUCTION. 1.1 What is a General Plan?
 1. INTRODUCTION 1.1 What is a General Plan? A General Plan is a comprehensive long-term strategy for the physical development of a city. It determines how land may be used and the infrastructure and public
LYNDHURST NEW URBAN DEVELOPMENT AREA STRUCTURE PLAN. Lyndhurst New Urban Development Area Structure Plan OUTCOMES AND PERFORMANCE STANDARDS
 APPENDIX 15.1-3 LYNDHURST NEW URBAN DEVELOPMENT AREA STRUCTURE PLAN Purpose of the Structure Plan Lyndhurst New Urban Development Area Structure Plan OUTCOMES AND PERFORMANCE STANDARDS LSP-P1 The District
Promoting Tourism as an Engine of Inclusive Growth and Sustainable Growth in Africa. Egyptian Minister of Tourism YEHIA RASHED
 Promoting Tourism as an Engine of Inclusive Growth and Sustainable Growth in Africa Egyptian Minister of Tourism YEHIA RASHED JULY 21, 2016 International tourism highlights (2015): Introduction: Tourism
Air Routes as Economic Development Levers. John D. Kasarda, PhD
 Routes News October 2008 Air Routes as Economic Development Levers John D. Kasarda, PhD In his influential recent book, The World Is Flat, Thomas Friedman makes it clear that an increasingly fast-paced,
UGANDA S URBAN DEVELOPMENT; A SCRUTINY OF TRANSPORT PLANNING AND MOBILITY IN TOWNS AND CITIES
 UGANDA S URBAN DEVELOPMENT; A SCRUTINY OF TRANSPORT PLANNING AND MOBILITY IN TOWNS AND CITIES BY Mutabazi Sam Stewart Executive Director Uganda Road Sector Support Initiative (URSSI) P.O Box 11110 Kampala,
SHIP MANAGEMENT SURVEY* July December 2015
 SHIP MANAGEMENT SURVEY* July December 2015 1. SHIP MANAGEMENT REVENUES FROM NON- RESIDENTS Ship management revenues dropped marginally to 462 million, following a decline in global shipping markets. Germany
3. Proposed Midwest Regional Rail System
 3. Proposed Midwest Regional Rail System 3.1 Introduction The proposed Midwest Regional Rail System (MWRRS) will operate in nine states, encompass approximately 3,000 route miles and operate on eight corridors.
VI. ALTERNATIVES TO THE MASTER PLAN C. RENOVATED EAST BUILDING ALTERNATIVE
 VI. ALTERNATIVES TO THE MASTER PLAN C. RENOVATED EAST BUILDING ALTERNATIVE INTRODUCTION The Renovated East Building Alternative would include the continued use of the renovated West Building and the renovation
Chapter 4.0 Alternatives Analysis
 Chapter 4.0 Alternatives Analysis Chapter 1 accumulated the baseline of existing airport data, Chapter 2 presented the outlook for the future in terms of operational activity, Chapter 3 defined the facilities
JOINT CORE STRATEGY FOR BROADLAND, NORWICH AND SOUTH NORFOLK EXAMINATION MATTER 3C EASTON/COSTESSEY
 Matter 3C Easton/Costessey Representor No. 8826 JOINT CORE STRATEGY FOR BROADLAND, NORWICH AND SOUTH NORFOLK EXAMINATION MATTER 3C EASTON/COSTESSEY SUBMISSION ON BEHALF OF TAYLOR WIMPEY DEVELOPMENTS AND
REGION OF WATERLOO INTERNATIONAL AIRPORT AIRPORT MASTER PLAN EXECUTIVE SUMMARY MARCH 2017
 REGION OF WATERLOO INTERNATIONAL AIRPORT AIRPORT MASTER PLAN EXECUTIVE SUMMARY MARCH 2017 Contact: Chris Wood, Airport General Manager cwood@regionofwaterloo.ca (519) 648-2256 ext. 8502 Airport Master
Chapter V Comparative Analysis
 Chapter V Comparative Analysis This chapter will explore/explain analysis comparison about the sustainable tourism development in small islands, with the case of Malta and Indonesia, represents by Morotai
II. THE BOULDER CREEK DRAINAGE BASIN
 II. THE BOULDER CREEK DRAINAGE BASIN This section provides an overview of the watersheds and flood hazards associated with Boulder Creek and South Boulder Creek including descriptions of the drainage basins,
Non-Motorized Transportation
 Non-Motorized Transportation Non-motorized facilities are important components to the transportation system. They provide an environmentally-friendly, low-cost mode of travel. Some of the facilities can
Part Three : COMMUNITY PLAN AREAS AND SPECIAL STUDY AREAS SACRAMENTO 2030 GENERAL PLAN. Introduction
 Special study Areas Part Three : COMMUNITY PLAN AREAS AND SPECIAL STUDY AREAS SACRAMENTO 2030 GENERAL PLAN Introduction Beyond the boundaries of the 2030 General Plan, the City has defined Special Study
Biosphere Reserves of India : Complete Study Notes
 Biosphere Reserves of India : Complete Study Notes Author : Oliveboard Date : April 7, 2017 Biosphere reserves of India form an important topic for the UPSC CSE preparation. This blog post covers all important
Xaman-Ha city, an answer to the poor growth and spread population
 Xaman-Ha city, an answer to the poor growth and spread population Global aspect In The Mexican Republic we can found three zones with an important tourist movement; the metropolitan area of Mexico City,
East Lancashire Highways and Transport Masterplan East Lancashire Rail Connectivity Study Conditional Output Statement (Appendix 'A' refers)
") Report to the Cabinet Member for Highways and Transport Report submitted by: Director of Corporate Commissioning Date: 1 June 2015 Part I Electoral Divisions affected: All East Lancashire Highways and
Report to the Cabinet Member for Highways and Transport Report submitted by: Director of Corporate Commissioning Date: 1 June 2015 Part I Electoral Divisions affected: All East Lancashire Highways and
12, 14 and 16 York Street - Amendments to Section 16 Agreement and Road Closure Authorization
 REPORT FOR ACTION 12, 14 and 16 York Street - Amendments to Section 16 Agreement and Road Closure Authorization Date: April 27, 2018 To: Toronto and East York Community Council From: Senior Strategic Director,
CITY OF LYNDEN STORMWATER MANAGEMENT PROGRAM REPORT MARCH 1, 2016
 CITY OF LYNDEN STORMWATER MANAGEMENT PROGRAM 2015 WATER QUALITY MONITORING REPORT CITY OF LYNDEN 300 4 TH STREET LYNDEN, WASHINGTON 98264 PHONE (360) 354-3446 MARCH 1, 2016 This document serves as an attachment
Presented by: Ms. Kanageswary Ramasamy Department of Statistics, Malaysia February 2017
 Presented by: Ms. Kanageswary Ramasamy Department of Statistics, Malaysia 14-16 February 2017 1 INTRODUCTION 2 HISTORICAL DEVELOPMENT OF TOURISM SATELLITE ACCOUNT 3 THE IMPORTANCE OF TOURISM SATELLITE
WELLINGTON $422 MILLION $614 MILLION $83 MILLION 22% SPEND $1.9 BILLION
 WELLINGTON WELLINGTON $1.9 BILLION FORECAST TOTAL WELLINGTON INVESTMENT The Wellington region s transport challenges are dominated by the region s concentration of population in the metropolitan cities,
STATEMENT OF PROBLEMS OF THE PROJECT
 Strategic planning and the development of Vladivostok city local economic policy Andrey Velichko (Far Eastern State University, Vladivostok city, Russia) the presenter Alexandr Abramov, Yuriy Avdeev, Denis
Policy PL Date Issued February 10, 2014
 Subject RENEWABLE ENERGY ON CROWN LAND Compiled by Renewable Energy Program, Biodiversity Branch Replaces Policy Directives Waterpower Site Release Crown Land Onshore Windpower Development - Crown Land
Chapter 2: El Dorado County Characteristics and Demographics
 Chapter 2: El Dorado County Characteristics and Demographics 2.1 Geographic Area and Demographics El Dorado County comprises 1,805 square miles with over half of the area in the Eldorado National Forest
Bear Creek Habitat Improvement Project
 06/10/10 Bear Creek Habitat Improvement Project El Paso County, Colorado Pike National Forest and Colorado Springs Utilities Owned Land Report prepared by: Eric Billmeyer Executive Director Rocky Mountain
SALVADOR DECLARATION. Adopted in the city of Salvador de Bahia on 16 November 2009 by the XVIII ACI LAC Annual General Regional Assembly
 SALVADOR DECLARATION Adopted in the city of Salvador de Bahia on 16 November 2009 by the XVIII ACI LAC Annual General Regional Assembly 1 IN CONSIDERATION: That the Airports Council International for Latin
Lake Erie Commerce Center Traffic Analysis
 LOCATION: East of NYS Route 5 at Bayview Road Town of Hamburg Erie County, New York PREPARED BY: Wendel Companies 140 John James Audubon Parkway Suite 200 Amherst, New York 14228 January 2012 i ii Table
SECTION 3 GENERAL DESCRIPTION OF THE RIVER BASIN
 SECTION 3 GENERAL DESCRIPTION OF THE RIVER BASIN SECTION 3 GENERAL DESCRIPTION OF THE RIVER BASIN River basin description. A general description of the river basin or subbasin, as appropriate, in which
Dr. Dimitris P. Drakoulis THE REGIONAL ORGANIZATION OF THE EASTERN ROMAN EMPIRE IN THE EARLY BYZANTINE PERIOD (4TH-6TH CENTURY A.D.
 Dr. Dimitris P. Drakoulis THE REGIONAL ORGANIZATION OF THE EASTERN ROMAN EMPIRE IN THE EARLY BYZANTINE PERIOD (4TH-6TH CENTURY A.D.) ENGLISH SUMMARY The purpose of this doctoral dissertation is to contribute
ARTICLE 7 MOBILE HOME AND RECREATIONAL VEHICLE PARKS AND CAMPGROUNDS
 ARTICLE 7 MOBILE HOME AND RECREATIONAL VEHICLE PARKS AND CAMPGROUNDS Section 701. APPLICABILITY Where a municipality has no subdivision or land development ordinance the provisions of this article shall
The Sunshine Coast is part of the global community and generates wealth through export, high-value industries and new investment.
 3.2 Strategic intent 3.2.1 Shaping growth an overview In 2031, the Sunshine Coast is renowned for its vibrant economy, ecological values, unique character and strong sense of community. It is Australia
Department of Agricultural and Resource Economics, Fort Collins, CO
 June 2007 EDR 07-15 Department of Agricultural and Resource Economics, Fort Collins, CO 80523-1172 http://dare.colostate.edu/pubs OF WINE AND WILDLIFE: ASSESSING MARKET POTENTIAL FOR COLORADO AGRITOURISM
Saginaw Charter Township Master Plan
 Saginaw Charter Township Master Plan Overview of Draft & Public Hearing August 20, 2014 230 South Washington Avenue Saginaw Michigan 48607 (989) 754-4717 www.spicergroup.com Saginaw Charter Township Master
Presented by: Ms. Kanageswary Ramasamy Department of Statistics, Malaysia February 2017
 Presented by: Ms. Kanageswary Ramasamy Department of Statistics, Malaysia 14-16 February 2017 1 INTRODUCTION 2 INTERNATIONAL RECOMMENDATIONS ON TOURISM STATISTICS (IRTS) 2008 3 RECOMMENDED METHODOLOGICAL
5.1 Traffic and Transportation
 5.1 When it opens in 2009, the Bellevue Nickel Improvement Project will increase the number of vehicles able to travel through the study area, improve travel speeds, and improve safety by reducing the
Lansdowne Wetton BRT Public Transport Corridor Trunk Route: Planning Analysis
 Lansdowne Wetton BRT Public Transport Corridor Trunk Route: Planning Analysis 1. Introduction The purpose of this report is to detail the planning evaluation for the trunk route alignment alternatives
CRITICAL FACTORS FOR THE DEVELOPMENT OF AIRPORT CITIES. Mauro Peneda, Prof. Rosário Macário AIRDEV Seminar IST, 20 October 2011
 CRITICAL FACTORS FOR THE DEVELOPMENT OF AIRPORT CITIES Mauro Peneda, Prof. Rosário Macário AIRDEV Seminar IST, 20 October 2011 Introduction Airports are becoming new dynamic centres of economic activity.
Bartlett Square Welcome. Investment Framework. London Airport Ltd
 1 Welcome Welcome to Luton s public exhibition on proposals for the (formerly known as Stirling Place) project which will comprise 2.5 acres of commercial development, providing up to 2,000 jobs for local
Hydrological study for the operation of Aposelemis reservoir Extended abstract
 Hydrological study for the operation of Aposelemis Extended abstract Scope and contents of the study The scope of the study was the analytic and systematic approach of the Aposelemis operation, based on
POPULATION INTRODUCTION
 POPULATION INTRODUCTION The socio-economic data available at the time of this writing is a conglomeration of data provided by the Kentucky State Data Center, OKI Regional Council of Governments, 2010 U.S.
CAMPER CHARACTERISTICS DIFFER AT PUBLIC AND COMMERCIAL CAMPGROUNDS IN NEW ENGLAND
 CAMPER CHARACTERISTICS DIFFER AT PUBLIC AND COMMERCIAL CAMPGROUNDS IN NEW ENGLAND Ahact. Early findings from a 5-year panel survey of New England campers' changing leisure habits are reported. A significant