1 S T M A R C H FULL-YEAR RESULTS
|
|
|
- Darrell Hood
- 6 years ago
- Views:
Transcription


1 1 S T M A R C H FULL-YEAR RESULTS
 (+) Cost of debt down to 2.0% (+) Release of provisions and tax charges (+ 2.8m) (-) Significant impairment of Banimmo participation (- 8.2m) EPRA EARNINGS UP BY +52.6% CHANGE IN PORTFOLIO (+11.")
2 AFFINE FY17 KEY TAKEAWAYS NET PROFIT GS UP AT 9.1M (+66.7%) (+) Slight increase in net rental income (+0.5%) (+) Net capital gains on disposals of 1.9m (=) Stability of fair values (+0.6%) (+) Cost of debt down to 2.0% (+) Release of provisions and tax charges (+ 2.8m) (-) Significant impairment of Banimmo participation (- 8.2m) EPRA EARNINGS UP BY +52.6% CHANGE IN PORTFOLIO (+11.6%) 90.7m of acquisitions, developments and refurbishments 32.6m of disposals 39m of committed investments and controlled operations (pipeline) EPRA NAV PER SHARE: 20.5 EPRA NNNAV PER SHARE: 22.7 DIVIDEND OF 1.0 PER SHARE (*) (*) Subject to vote of the Annual General Meeting of 26 April

3 INVESTMENTS AND DISPOSALS 2


4 INVESTMENTS AND DISPOSALS A SUSTAINED INVESTMENT ACTIVITY 89m: Investments 33m: Disposals TREMBLAY-EN-FRANCE MEUDON TURNKEY PROJECT SIGNED IN 2016 LILLE HASHTAG # TURNKEY PROJECT EURONANTES KIBORI TURNKEY PROJECT LILLE EUROPE 11 TH FLOOR TRAPPES CLICHY COURBEVOIE SURESNES MARCHÉ VAUGIRARD BAGNOLET 39m: Commitments Turnkey and developement projects under construction and committed acquisition MONTIGNY 3
: Meudon, Nantes et Lille #hashtag 39m of")


5 INVESTMENTS AND DISPOSALS OVERVIEW OF THE INVESTMENTS INVESTMENTS IN 2017: More than 130m of realized or committed operations and controlled projects 92m of realized operations or turnkey projects under construction > Acquisition: Lilleurope, Clichy, Courbevoie, Suresnes, Vaugirard > Turnkey ( 35m accounted): Meudon, Nantes et Lille #hashtag 39m of committed operations and controlled projects > Turnkey ( 16m to come): Meudon, Nantes et Lille #hashtag > Refurbishment: Kremlin-Bicêtre, Nîmes > Acquisition signed: Sèvres 8.9m of gross rental income, 1.1m of which accounted in 2017 (corresponding to 3.7m of potential annual rent) IMPACT ON THE RENTS Building Location ERV ( 000 ) ERV /sqm Meudon Paris Métropole Nantes Kibori Région Lille Hashtag# Région Lilleurope 11 ème Région Clichy Mozart Paris Métropole Courbevoie Abreuvoir Paris Métropole Suresnes Marcel Monge Paris Métropole 1, Paris Marché Vaugirard Paris Métropole Sèvres Majolique Paris Métropole 1, Kremlin / Nîmes 524 Total

 24 floors: 20 office floors, 4 technical floors 265")

 Numerous bus")

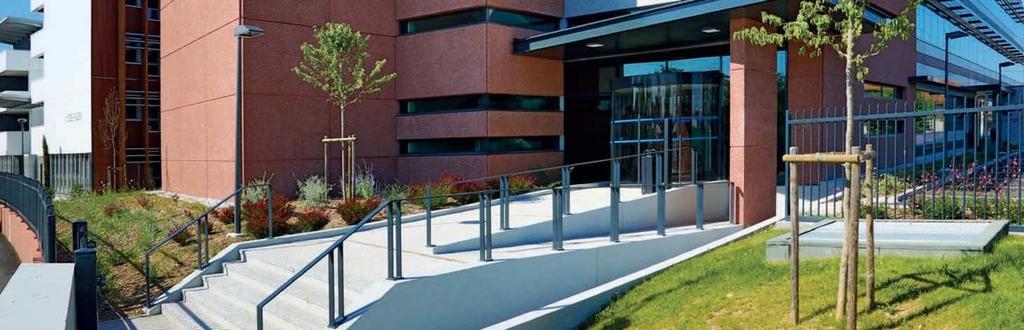
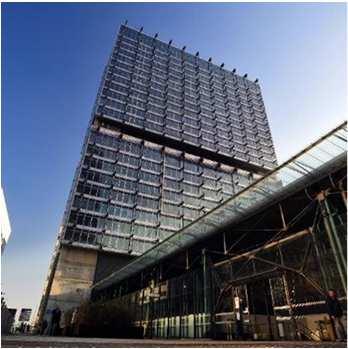
6 INVESTMENTS AND DISPOSALS LILLE LILLEUROPE TOWER AFFINE SOLE OWNER OF THE 25,000 SQM OFFICE TOWER June 2017: acquisition of the 11th floor (the last missing lot) Rental income of the building: 3.6m (i.e. 144/sqm) 24 floors: 20 office floors, 4 technical floors 265 underground parking lots Easy access Overlook the Lille-Europe station (Paris/Brussels/London c.1h) In the heart of Euralille business district Underground Lines 1 and 2 (stations Gare Lille Europe and Gare Lille Flandres) Numerous bus lines Gare TGV Lille Europe Euralille 2 Euralille 1 UPGRADING PROGRAM UNDER STUDY Enhance the signal and accessibility of the whole tower Renovate and refit common areas Optimize the use of the technical 12th floor 5
 Mixed Cross-Laminated Timber (CLT)/concrete/metal structure Market")


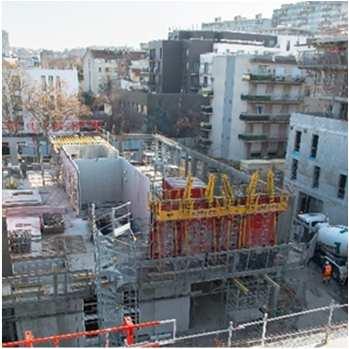
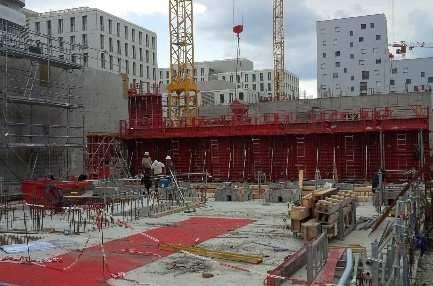
7 INVESTMENTS AND DISPOSALS NANTES EURONANTES KIBORI ACQUISITION OF 3,844 SQM OF OFFICES BREEAM 1 building with 33 underground parking lots 8 floors (Ground -1 to G+6) Mixed Cross-Laminated Timber (CLT)/concrete/metal structure Market rental income (ERV): 686,000 (i.e. 178/sqm) IN PARTNERSHIP WITH SOGEPROM April 2014: Launching of the call for tenders by the municipality January 2017: Acquisition signed Completion expected on H LOCATED IN THE EURONANTES RAILWAY STATION DISTRICT New major business district in 2020: 130,000 sqm of offices Close to the TGV station Excellent public transportation links Tramway Bus lines Kibori Euronantes TGV Station Video of the project on: 6
 March 2017: Acquisition signed Completion planned in 2 phases: H2 2018 and 2020 Market rental income (ERV): 873,000 (i.e. 165/sqm) LOCATED IN THE EURATECHNOLOGIES AREA Lille s")

8 INVESTMENTS AND DISPOSALS LILLE EURATECHNOLOGIES #HASHTAG ACQUISITION OF 5,280 SQM OF OFFICES BREEAM 2 buildings with 90 parking lots: 2,230 sqm across 5 levels (G+4) 3,050 sqm across 4 levels (G+3) March 2017: Acquisition signed Completion planned in 2 phases: H and 2020 Market rental income (ERV): 873,000 (i.e. 165/sqm) LOCATED IN THE EURATECHNOLOGIES AREA Lille s new area of excellence dedicated to Information and Communications Technology (ICT) 115,000 sqm business district around the Blan-Lafont building 2,800 jobs, 140 ICT companies: Capgemini, IBM Service Center, Microsoft and Tata Consultancy Services Excellent public transport links 2 métro stations 1 bus line 2 public bike stations Video of the project on: 7
:")
 LOCATED IN THE TERTIARY PARK ESPACE CLICHY Within the joint development zone André")
 > La Défense by the Quais de Seine > A15/A86 nearby By public")
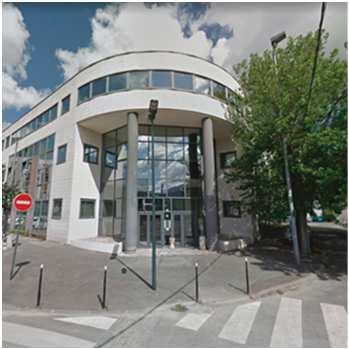
9 INVESTMENTS AND DISPOSALS CLICHY RUE MOZART ACQUISITION OF 3,400 SQM OF OFFICES Multi-tenant building 3 floors 58 parking lots 4 tenants Occupation rate of 82% Market rental income (ERV): 551,000 (i.e. 162/sqm) LOCATED IN THE TERTIARY PARK ESPACE CLICHY Within the joint development zone André Citroën (mixed zone retails, offices and residentials) Easy access By road > The ring road 10 min away (Porte de Clichy) > La Défense by the Quais de Seine > A15/A86 nearby By public transportation > Bus line 341 > Close to RER C and metro station 13 > Subway extension for the line 14 from
")

 Easy access By road > The ring road 10")
10 INVESTMENTS AND DISPOSALS COURBEVOIE RUE DE L ABREUVOIR ACQUISITION OF 2,068 SQM OF OFFICES Multi-tenant building 4 floors 38 parking lots 4 tenants (In Extenso: 70%) Occupation rate of 100% Market rental income (ERV): 555,000 (i.e. 268/sqm) LOCATED IN THE BUSINESS DISTRICT LA DEFENSE AREA Mixed zone (retail, offices, residential) Easy access By road > The ring road 10 min away (Porte Maillot) > La Défense by the Quais de Seine By public transportation > Close to the Tramway T2 and metro station 1 > Bus lines 175 and 176 9


11 INVESTMENTS AND DISPOSALS SURESNES RUE MARCEL MONGE ACQUISITION OF 6,346 SQM OF OFFICES Multi-tenant building 8 floors 170 parking lots 157 of which are underground 3 tenants (Sogitec Industries: 80%) Occupation rate of 97% Market rental income (ERV): 1.68m (i.e. 264/sqm) IN THE HEART OF A TERTIARY SECTOR, ALONG THE SEINE Within a 60,000 sqm property complex Easy access By road > The ring road 10 min away (Porte de Passy) > La Défense by the Quais de Seine > A13 and A14 nearby By public transportation > Tram T2 > Transilien Lines L and U > Bus line


 to Falguière Street (residential)")
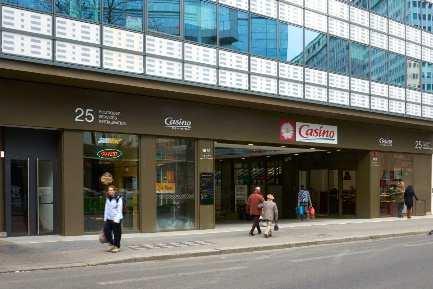
12 INVESTMENTS AND DISPOSALS PARIS MARCHÉ VAUGIRARD ACQUISITION OF 2,136 SQM OF RETAIL PREMISES Shopping mall around a Casino supermarket 25 neighborhood stores Occupation rate of 96% 20 parking lots Renovation work completed Market rental income (ERV): 754,000 (i.e. 353/sqm) IN THE HEART OF A DYNAMIC AND MIXED ENVIRONMENT Mall connecting Boulevard Vaugirard (offices) to Falguière Street (residential) Easy access Montparnasse s rail station Underground lines 4, 6, 12 and 13 Numerous bus lines Velib (public bike) and Autolib (public car) stations 11

 Easy access By road > Ring road (Porte de Saint-Cloud) and Quais de la Seine > Main roads (A86,")

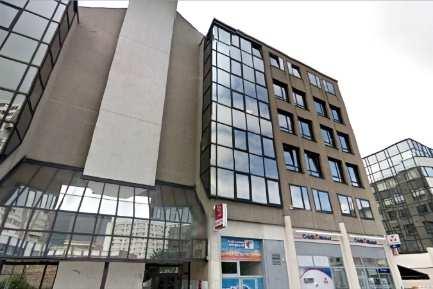
13 INVESTMENTS AND DISPOSALS SÈVRES LE MAJOLIQUE UNDERGOING ACQUISITION OF 5,800 SQM OF OFFICES Multi-tenant building G+9 with 113 underground parking lots on 2 underground levels Occupation rate of 100% Rental income of the building : 1.2m (i.e. 202/sqm) Acquisition closed: 1Q 2018 A CHANGING DISTRICT In the heart of the Boucle Sud market (Boulogne-Billancourt, Issy-les- Moulineaux) Easy access By road > Ring road (Porte de Saint-Cloud) and Quais de la Seine > Main roads (A86, D910, D7, N118) By public transportation > Underground line 9 and tramway T2 > Numerous bus lines BENEFITING LATER FROM THE GREATER PARIS In the horizon 2022, station «Pont de Sèvres» will be served by the line 15 connecting Saint-Denis to Villejuif 12

14 PERFORMANCE OF THE PORTFOLIO 13
15 PERFORMANCE OF THE PORTFOLIO PROPERTIES FAIR VALUE UP 11.6% CHANGE IN FAIR VALUE EXCLUDING TRANSFER TAXES ( M) /12/2016 Disposals Net capital gain FV change (P&L) Capex Acquisitions 31/12/2017 CONTRIBUTION OF THE FAIR VALUE CHANGE TO THE P&L (+0.6%): Market rent effect (ERV): +0.5% Cap rate effect: +3.4% Miscellaneous: -3.3% (works, reversion, internal adjustements ) 14
16 PERFORMANCE OF THE PORTFOLIO OCCUPANCY RATE FINANCIAL OCCUPANCY RATES (EPRA) 90.9% 90.2% 85.8% 87.5% 87.0% Total 87.0% Offices 92.4% Retail Warehouses and industrials 77.7% 81.9% Paris Métropole Other Ile-de-France Other French Regions 92.4% 82.0% 83.9% Impact Logistics ptf disposal -2.1 pt Paris Métropole: Paris + Hauts-de-Seine + Seine-Saint-Denis + Val-de-Marne 15
17 PERFORMANCE OF THE PORTFOLIO HEADLINE RENTS CHANGE IN HEADLINE RENTS ANNUALIZED ( M) 35.9 (1.9) (3.6) /12/2016 Disposal Like-for-like Investment 31/12/2017 Total headline rents change: - 1.9m On like-for-like, a 3.6m decrease of the headline rent (Montigny-le-Bretonneux, Thouars, Saint-Germain-en-Laye, Saint-Etienne) A 1.7m increase of the headline rent due to portfolio changes 16
18 PERFORMANCE OF THE PORTFOLIO SCHEDULE IN RENTS ACCORDING TO LEASE DURATION ( M) Dec-17 Dec-18 Dec-19 Dec-20 Dec-21 Dec-22 Dec-23 Dec-24 Dec-25 Dec-26 End of lease Fixed term Average lease term to next break option: 2.5 years (vs 2.9 as at 31/12/2016) Average lease term to lease expiry: 4.6 years (vs 5.1) 14 new leases ( 1.1m) + 0.5m and + 0.6m in 2017 and departures ( 4.7m) - 1.7m and - 3.0m in 2017 and renegociated leases ( 2.0m vs 1.9m) + 0.1m and + 0.0m in 2017 and 2018 Portfolio change (+ 1.6m) - 0.2m and + 1.8m in 2017 and terminated leases ( 1.4m) - 0.8m in 2018 Impact 2017 : - 1.3m 2018 : - 0.6m 17


19 DISCONTINUED OPERATION BANIMMO IN 2017 REPOSITIONNING PROPERTY COMPANY Portfolio: 14 buildings; Gross rental income: 4.0m; value: 208m KEY EVENTS Disposal of an office building for 13.2m in Anvers Disposal of the Halle Secrétan for 27.8m in Paris Disposal of the Marché Vaugirard for 11.7m in Paris Continuing of the Vilvoorde site change of use Signature of the temporary occupation agreement for 55 years in Paris La Défense for the Table Square project Awarding of public contract for the revitalisation project of the Halle de la Gare Sud in Nice Continuing of the Verpantin works Filing of the revised building permit for the vertical scission of North Plaza building Signing of the Banimmo France purchase agreement RESULTS Real estate operating result: 15.5m vs 68.8m Operating result: - 4.0m vs 42.9m Net result: - 3.9m vs m More details on 18


20 CONSOLIDATED ACCOUNTS 19
21 CONSOLIDATED EARNINGS CONSOLIDATED EARNINGS ( m) Gross rental income Net rental income Other income 1.2 (0.1) 0.8 Corporate expenses (7.9) (8.6) (8.8) Current EBITDA Current operating profit Other income and expenses (0.4) (0.4) 0.8 Net financial cost (9.1) (7.0) (6.9) Taxes 0.5 (0.7) 0.4 Miscellaneous (0.5) Associates and Discontinued operations (4.3) (4.7) (6.1) Net current profit group share Value adjustments of properties & profit on disposals (3.4) (0.4) 2.9 Fair value adjustments of hedging instr Adjustements for associates & Discontinued operations (11.4) (1.7) 2.2 Others (o/w Banimmo shares depreciation) (0.1) (0.6) (7.7) Net non-current profit group share (12.8) (1.6) (1.7) Net profit group share Net profit group share(excl. Banimmo) EPRA Earnings (Net current profit group share) EPRA Earnings (excl. Banimmo)
22 CONSOLIDATED EARNINGS A 2.3% DECREASE OF THE NET ASSET VALUE ( m) 31/12/15 31/12/16 31/12/17 Shareholders equity(before allocation) PSL adjustment (73.2) (73.1) (73.3) Fair value adjustments to hedging instr Net deferred tax (4.1) (1.0) 0.3 EPRA NAV (excluding transfer tax) EPRA NNNAV (excluding transfer tax) EPRA NAV (excluding transfer tax) per share( ) EPRA NNNAV (excluding transfer tax) per share( ) ( m) Excluding PSL (TSDI) (13.2) (3.7) Others*: interest on convertibles and PSL Convertibles, Banimmo non cash items, etc 31/12/2016 Dividends paid FV properties FV FI EPRA earnings Others* 31/12/ per share 20.5 per share Based on the average share price of Banimmo over decembre 2017 ( 3.3 per share) NAV per share after dilution from convertibles 21


23 FINANCING 22


24 FINANCING LTV AND DECREASE OF THE FINANCING COST LTV EVOLUTION ( M) % 50.8% 45.5% 46.8% 49.3% 46.6% 46.4% 52.3% % 100% 80% 60% 40% 20% 0% Value Loan LTV Net debt: 337m (excl. lease financing) LTV: 52.3% DECREASE OF THE FINANCING COSTS: 2.0% VS 2.3% 23
 300 250 200 150 100 50 0 2017 2018 2019 2020 2021 Fixed rate")

 Micro hedging (by loan):")
25 FINANCING AN INTEREST RATE RISK LARGELY HEDGED CHANGE IN HEDGING ( M) Fixed rate Swap Cap Unhedged Average Cap rate (RHS) 1.5% 1.0% 0.5% 0.0% Normative debt excluding financing lease deemed at 300m Macro hedging (global): 150m of cap at 1% for 6 years signed up in September 2016 (maturity Sept 2022) Micro hedging (by loan): represents c. 50% of the debt 24
26 FINANCING DEBT PROFILE UNDER CONTROL AMORTISATION OF DEBT ( M) Contractual amortisation Repayment at maturity Early repayment A financing policy aiming at smoothing the amortization (around 19m p.a. on average) Average duration of the debt: 5.8 years Short term confirmed credit lines of 21m FINANCING IN 2017 Financing / Refinancing: 172m Amortisation: 120m 25


27 STRATEGY & OUTLOOKS 26
28 STRATEGY & OUTLOOKS OUR STRATEGY [1/2] CONCENTRATION OF INVESTMENTS: Geographic: On Paris Métropole And regional cities (Bordeaux, Lille, Lyon, Marseille, Nantes, Toulouse) benefitting from good national and international transport network and a strong demographic and economic momentum Type: Focus on offices And retail premises in city center more opportunistically Open to mixed and innovative urban projects 48% 34% 29% 24% 25% 31% 35% 39% 27% 35% 36% 37% Others Regional cities Paris Métropole BREAKDOWN OF THE PORTFOLIO IN ASSET VALUE 8.7% 22.7% 68.7% Offices Retail Warehouses and industrial 27
![STRATEGY & OUTLOOKS OUR STRATEGY [2/2] CONTINUATION OF THIS POLICY ACCORDING TO 3 CRITERIA: 1) Renew the portfolio by looking for buildings, New (turnkey) or recent, preferably with green](/docs-images/76/73783518/images/29-0.jpg "certification Of an unit size between 10m to 30m Containing a potential for value creation by their location or rental situation to streamline it By selling mature, small or isolated assets And")
 Integrate new technological developments")
29 STRATEGY & OUTLOOKS OUR STRATEGY [2/2] CONTINUATION OF THIS POLICY ACCORDING TO 3 CRITERIA: 1) Renew the portfolio by looking for buildings, New (turnkey) or recent, preferably with green certification Of an unit size between 10m to 30m Containing a potential for value creation by their location or rental situation to streamline it By selling mature, small or isolated assets And logistics assets and in making the most of our land reserve 2) Increase significantly the rents by: Investing in buildings with a good yield and good location Making the improvement of the OR a strong goal Optimizing daily management through an efficient information system Co-investing with partners in bigger projects that meet our strategy policy 3) Integrate new technological developments of the property sector Tenant services (virtual concierge services, pickup station ) Electronic document signing (lease, mandate ) New uses of workplace 28


30 CONTACTS CONTACTS AFFINE Maryse Aulagnon Chairman Alain Chaussard CEO Matthieu Evrard Co-CEO Frank Lutz Deputy CFO frank.lutz@affine.fr LIQUIDITY CONTRACT: INVEST SECURITIES WEBSITE: 29

31 APPENDIX 30


32 APPENDIX AFFINE PORTFOLIO IN SOME KEY FIGURES 616m (transfer tax included) 45 buildings 332,400 sqm BORDEAUX JARDINS DES QUAIS RETAIL/OFFICE 25,530 SQM PARIS TRAVERSIÈRE TOWER OFFICE 7,780 SQM LILLE EURALILLE TOWER OFFICE 25,000 SQM PARIS AUBER OFFICE 2,280 SQM TOULOUSE LES AMARANTESI & II OFFICE 5,760 SQM LYON TANGRAM OFFICE 5,910 SQM GENNEVILLIERS PLUS INDUSTRIAL 15,220 SQM 31

 1,610 sqm across 4 levels (G+3) Completed in January 2018 LOCATED IN THE BUSINESS DISTRICT AREA")

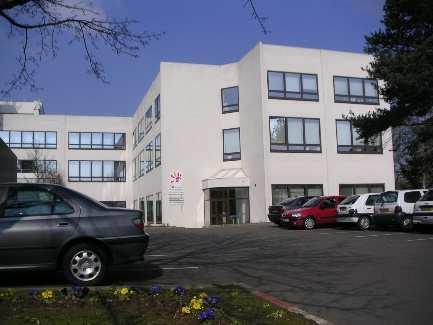
33 APPENDIX MEUDON GREEN OFFICE EN SEINE Green Office buildings ACQUISITION IN 2016 OF 5,400 SQM OF OFFICES Potential rent: 1.9m BEPOS Effinergie and HQE 650 sqm of rooftop solar panels 2 buildings with 113 underground parking lots: 3,800 sqm across 4 levels (G+3) 1,610 sqm across 4 levels (G+3) Completed in January 2018 LOCATED IN THE BUSINESS DISTRICT AREA OF BOULOGNE, ISSY-LES-MOULINEAUX, SÈVRES AND MEUDON A dynamic economic environment 400 companies and nearby: Gemalto and Global Mail Excellent public transportation links Tram T2 and Bus 389 RER C and the train SNCF N In front of the Seine Musicale, music and performing arts center Video of the project on: 32

34 APPENDIX EVOLUTION OF THE EMPLOYED POPULATION AGED 15 TO 64 BY URBAN AREA OF RESIDENCE FROM 2008 TO 2013 Source: Insee, census of the population, 2008 and 2013, France Stratégie calculation 33
35 APPENDIX CONSOLIDATED CASH-FLOW ( m) 31/12/15 31/12/16 31/12/17 Funds from operations Funds from operations (excluding cost of debt and tax) Change in WCR (3.2) 0.2 (0.0) Taxes paid (0.6) (0.0) (0.7) Discontinued operations Operating cash flow Acquisitions & Investments (43.2) (22.6) (84.8) Disposals Others Discontinued operations Investment cash flow 50.8 (2.2) (38.5) New loans Loan repayments (101.8) (56.8) (120.0) Interest (9.3) (7.1) (6.4) Others (of which dividends) (9.1) (4.8) (15.6) Discontinued operations - - (3.3) Financing cash flow (76.8) (18.5) 27.1 Change in cash position Net cash position
36 APPENDIX CONSOLIDATED BALANCE SHEET ( m) 31/12/15 31/12/16 31/12/17 Properties of which investment properties of which property held for sale Equity holdings Equity affiliates Cash Discontinued operations Other assets Shareholders equity (before allocation) of which Non-controlling interest of which convertibles of which PSL Bank debt Discontinued operations Other liabilities Total Balance Sheet
37 APPENDIX PORTFOLIO GROSS YIELD RETURN BY ASSET TYPE Portfolio Headline Potential Split in value Yield Yield Offices 68.7% 5.1% 5.5% Retail 22.7% 5.7% 7.2% Warehouses & Industrials 8.7% 8.1% 9.9% Total 100.0% 5.5% 6.2% RETURN BY LOCATION Portfolio Headline Potential Split in value Yield yield Paris Métropole 44.0% 4.5% 4.8% Other Ile-de-France 5.3% 8.1% 9.5% Other French Regions 49.2% 6.0% 7.1% Total 100.0% 5.5% 6.2% 36
38 APPENDIX SHARE PRICE ( ) AND AVG TRANSACTION VOL. (000) 19 Affine Eur onext IEIF SIIC France EPRA Europe janv.-17 mars-17 mai-17 juil.-17 sept.-17 nov.-17 janv janv.-17 mars-17 mai-17 juil.-17 sept.-17 nov.-17 janv
39 APPENDIX LTV (NET DEBT / PORTFOLIO VALUE) ( m) 31/12/15 31/12/16 31/12/17 LOAN Net financial debt Debt allocated to lease financing (10) (8) (5) Debt for investment properties VALUE Value of properties (incl. TT) Property companies on equity basis VEFA & Fixed assets adjustments Adjusted portfolio value incl. taxes LTV (net debt on portfolio value) 46.6% 46.4% 52.3% 38


40 APPENDIX A DIVERSIFIED RISK ON TENANTS A DIVERSIFIED PORTFOLIO OF CUSTOMER BREAKDOWN OF RENTS 11% 347 Leases 4% 4% 3% 3% TOP 5 SNCF Mairie Corbeil-Essonnes Sogitec Industries Inseec 75% Sas Filter Others < 3% 39
 30 25 20 Cash 20.6 Share 15 10 12.")


41 APPENDIX DIVIDEND AFFINE, HIGH YIELD PROPERTY COMPANY ( M) Cash 20.6 Share A 6.1% yield based on the share price of 31/12/2017 ( 16.48) 40

 Reallocation to new")

42 APPENDIX REMINDER: DISPOSAL OF A WAREHOUSES PORTFOLIO IMPACT* LOGISTICS PLATFORMS: 72.1M OR: 100% as at 30/06/2015 Surface area: 172,500 sqm FINANCIAL STRUCTURE Debt: - 42m Cash: + 30m Drop in LTV (-6 points) Reallocation to new investments OPERATIONAL Gross rental income decrease: - 7.0m EPRA earnings: - 3.3m for 2016 Improving the quality of cash-flow (Vacancy and capex risks) Occupancy rate: -2.2 point Yield: - 32 bps * On a full year basis 41
 for an amount of 54m (equity: 20m and mezzanine loan: 34m) for 3 commercial centre projects in Namur,")
 ; new mezzanine loan of 12m (of")
 December 2014 Depreciation of the remaining stake ( 4m) December 2015 Depreciation of 21m of the mezzanine loan (out of a total of 45m) April 2016 Judicial")
43 APPENDIX BANIMMO STAKE IN URBANOVE August 2010 Banimmo took a 42.5% stake in Citymall (former Foruminvest in Belgium) for an amount of 54m (equity: 20m and mezzanine loan: 34m) for 3 commercial centre projects in Namur, Charleroi and Verviers December2013 Partial depreciation of the stake for 15m May 2014 Banimmo purchased the company holding the ground lease in Charleroi for 5m November 2014 Takeover of the Namur and Verviers projects by Urbanove (44% Banimmo; 56% Walloon region + Besix + Degroof) ; new mezzanine loan of 12m (of which Banimmo: 9.9m) December 2014 Depreciation of the remaining stake ( 4m) December 2015 Depreciation of 21m of the mezzanine loan (out of a total of 45m) April 2016 Judicial Reorganization Procedure (PRJ) of Urbanove to reorganize the financial structure of the two projects extended until November 2016 December 2016 Disposal of the 2 projects: Amortisation of the remaining outstanding mezzanine loan representing 27.7m 42

 SIIC TROPHY Request for proposal won in")

44 APPENDIX BANIMMO 2 SUCCESSFUL DEVELOPMENTS DISPOSAL OF THE MARCHÉ SAINT GERMAIN (PARIS 6 ÈME ) Acquisition in 2009: 30m Eviction, work and financing costs: c. 40m Commercial centre increased from 3,200 sqm to 4,400 sqm Doubling rents to 4.3m Completion by Q Opening and disposal late 2016 at a price of 130m OR: 100% - Apple, Nespresso, Uniqlo, Marks & Spencer, Desnoyers, etc AGREEMENT OF SALE OF THE MARCHÉ DE LA HALLE SECRÉTAN (PARIS 19 ÈME ) SIIC TROPHY Request for proposal won in April 2011 Ground lease for 70 years Project cost: c. 15m Increase threefold the surface area to 3,800 sqm Rent: 1.25m Opening in October 2015 Agreement for sale signed in October 2016 Property sold in July 2017 for 27.8m OR: 100% - Les 5 fermes, Camaïeu, Neoness, Desnoyers, etc 43
45 APPENDIX SHAREHOLDING SHAREHOLDING Annualised float turnover rate of 113% Annualised capital turnover rate of 46% 31.0% 8.5% 41.3% 31.7% 45.4% 6.0% 21.0% 15.0% Holdaffine SMABTP* La Tricogne Free float Capital Voting rights (net) AFFINE IS LISTED ON EURONEXT PARIS 31 december2017 Number of shares 10,056,071 Share price Market capitalisation 165.7m Change in % EPRA earnings per share (excl. Banimmo) 1.29 Ticker (Bloomberg / Reuters) IML FP / BTPP.PA 44
Full-Year Results Presentation 03 March 2017
 Full-Year Results 2016 Presentation 03 March 2017 0 Full-Year results 2016 2016 Key takeaways Affine.NET PROFIT UP TO 5.5M (+) Like-for-like rents increase (+1.0%) (-) Impact of disposals (rents: -11.2%)
FULL-YEAR RESULTS. Presentation of 23 February 2012
 FULL-YEAR RESULTS 2011 Presentation of 23 February 2012 KEY FIGURES Affine EPRA earnings per share ( ) EPRA Net Asset Value ( m) 1.33 1.45 1.60 284.4 281.9 287.6 2009 2010 2011 2009 2010 2011 Dividend
BUSINESS REVIEW 2017
 BUSINESS REVIEW 2017 PROFILE PROPERTY COMPANY SPECIALISED IN COMMERCIAL REAL ESTATE Affine is a property company established in early 1990, present more specifically in the office and retail sectors. Its
Le Floria - Fontenay Q May Strong Letting Activity. Percier - Paris Citroën Paris 17
 Le Floria - Fontenay Q1 2013 14 May 2013 Strong Letting Activity Percier - Paris Citroën Paris 17 1- Positioning 2- Letting Activity 3- Portfolio 4- Financing 5- Q1 2013 Revenues 6- Key Takeways Le Divo
Press release February 21, 2014
 Press release February 21, 2014 2013 earnings Recurrent ent net income per share up +1.2%, with NAV per share growth of +1.7% Significant improvement in the financial occupancy rate and rental margin Recurrent
2005 year-end results presentation March 2006
 2005 year-end results presentation March 2006 2005 Key Points Twofold increase in portfolio and share capital Execution of business plan Commitments in first half 2005 : 105 M Acquisition of Locafimo in
Act 2. Analyst Meeting 27 July 2016
 Act 2 Analyst Meeting 27 July 2016 1 Contents 1. Highlights Page 3 2. Portfolio Page 10 3. Finance Page 26 2 Highlights July 2016 3 Highlights Main financial indicators Gross Rental Income +11% EBITDA
Investor presentation FY 2011 results
 Investor presentation FY 2011 results Recent highlights Itakeskus refurb & extension scaled up extension 11.000 sqm in total; anchor tenant will relocate (to Piazza); investment volume 90m, YoC 6.0-6.5%
2018 HALF-YEAR FINANCIAL INFORMATION
 2018 HALF-YEAR FINANCIAL INFORMATION CONTENTS - 1. Half-year management report at 30 June 2018.. p. 3-2. Condensed consolidated financial statements at 30 June 2018. p. 23-3. Statutory Auditors' report
Cisco Issy les Moulineaux. 3M 2014 Revenues. May 6, A good start to the year. Citroën Paris 17
 Cisco Issy les Moulineaux 3M 2014 Revenues May 6, 2014 A good start to the year Citroën Paris 17 CB 21, La Défense Le Patio - Villeurbanne 1 Key events of the period 2 Operating performance 3 Key takeaways
GROWTH(S) Revenue: +26.1%, million Recurring net result (FFO): +25.5%, million 2017 targets confirmed
 Revenue: +26.1%, million Recurring net result (FFO): +25.5%, million 2017 targets confirmed") Press release 2017 Half-year results Paris, 27 July 2017, 5:45 pm GROWTH(S) Revenue: +26.1%, 912.3 million Recurring net result (FFO): +25.5%, 115.4 million 2017 targets confirmed Excellent half-year in
Press release 2017 Half-year results Paris, 27 July 2017, 5:45 pm GROWTH(S) Revenue: +26.1%, 912.3 million Recurring net result (FFO): +25.5%, 115.4 million 2017 targets confirmed Excellent half-year in
FIRST HALF RESULTS SFAF MEETING, 27 SEPTEMBER 2017
 FIRST HALF RESULTS SFAF MEETING, 27 SEPTEMBER 2017 2017 CONTENTS 1. Patrimoine & Commerce Pursuing development over the 1 st half of 2017 2. Patrimoine & Commerce Reinforcing value-oriented SIIC status
Revenue for the first 9 months of 2018 up 20% Sustained activity across all business lines
 Press release Paris, 16 October 2018, 5:45 pm Revenue for the first 9 months of 2018 up 20% Sustained activity across all business lines Large mixed-use projects Major progress at Issy Cœur de Ville, Toulouse
Business at September 30, 2017
 Press release October 19, 2017 Business at September 30, 2017 2017 guidance raised following Eurosic s integration At least +6% recurrent net income growth expected excluding healthcare (vs. -5% to -6%
Positive rental reversions in Hong Kong portfolio. Rising contribution from Singapore office portfolio. Strong performance from Residential business
 2012 Review The Group performed well in 2012 Positive rental reversions in Hong Kong portfolio Rising contribution from Singapore office portfolio Strong performance from Residential business 2 Highlights
Q3 Results. September 21, 2005» 1
 Q3 Results September 21, 2005» 1 Financial results 9-month highlights» Significant growth in net income» Sharp improvement in gross margin» Strong increase in housing backlog in value terms» 3 9-month
9-month 2016 Revenues: Outlook revised upwards. 3 November 2016
 9-month 2016 Revenues: Outlook revised upwards 3 November 2016 CONTENTS > A SUCCESSFUL LETTING ACTIVITY > STRONG INVESTMENT ACTIVITY > KEY TAKEAWAYS > APPENDIX FONCIÈRE DES RÉGIONS 2 1 A successful letting
2013 full-year earnings
 2013 full-year Paris, February 21, 2014 Bernard Michel Chairman Philippe Depoux CEO Nicolas Dutreuil CFO Contents 1. STRATEGY & CSR 2. GECINA S PERFORMANCE ON OFFICES & RETAIL 3. GECINA S PERFORMANCE ON
2018 full-year results
 2018 full-year results 01 Message from Chairman & CEO 02 FY 2018 Results 03 Business drivers 04 Outlook 02 FY 2018 financial results Key figures Revenue 2.85 Bn ROP 115 M Net debt 252 M Free cash flow
Analyst Presentation 9 March 2017
 Analyst Presentation 9 March 2017 Contents 01 2016 - P.3 Highlights Strategy 02 PORTFOLIO - P.15 Heritage Core 03 Finance - P.36 04 Conclusion - P.47 2 01 2016 HIGHLIGHTS - YEAR 2016 STRATEGY 3 An intensive
2016 Half-Yearly Results
 Presentation 29th July 2016 2016 Half-Yearly Review Underlying profit down 6% Commercial portfolio benefited from higher occupancy Steady contribution from mainland China residential business Profit attributable
Results presentation. December 2012
 Results presentation December 2012 1 Introduction A Romanian focused property investment company Distribute dividends (or return of capital & share subscription) on a semi-annual basis Focus on properties
SPEAKER: REDOUANE ZEKKRI DATE: 09 / 11 / 2017
 SPEAKER: REDOUANE ZEKKRI DATE: 09 / 11 / 2017 2004 THE START Redouane ZEKKRI MOTIVATION 2 2008 22 CLUBS 22 clubs in Belgium 3 2010 66 CLUBS +26 CLUBS 40 clubs in Belgium 4 2011 CONVERSIONS OF THE LESS
Annual Results for the year ended 28 February 2015
 Annual Results for the year ended 28 February 2015 AGENDA OVERVIEW PROPERTY UNITED KINGDOM PROPERTY DEVELOPMENT AFRICA FINANCIAL SERVICES FINANCIAL REVIEW LOOKING AHEAD Q & A ANNUAL RESULTS FOR THE YEAR
Full go towards year end
 Beni Stabili: 9-month 2017 rents Full go towards year end Milan: October 24 th, 2017 Growth in operating metrics 1.5% L-f-L rental growth excl. TI assets 95.5% financial occupancy 93.1% excluding TI portfolio
Great Portland Estates Trading Update Strong Operational Performance
 Press Release 6 July 2017 Great Portland Estates Trading Update Strong Operational Performance Great Portland Estates plc ( GPE ) today publishes its trading update for the quarter to 30 June 2017. Continued
Summary of Results for the First Three Quarters FY2015/3
 Summary of Results for the First Three Quarters FY2015/3 February 10, 2015 Tokyu Corporation (9005) http://www.tokyu.co.jp/ Contents Ⅰ.Executive Summary 2 Ⅱ.Conditions in Each Business 5 Ⅲ.Details of Financial
SIAM FUTURE DEVELOPMENT PUBLIC CO., LTD. Corporate Presentation Q4-15
 SIAM FUTURE DEVELOPMENT PUBLIC CO., LTD. Corporate Presentation Q4-15 Overview Financial Summary Project Update 2 Overview Founded: 1994 Staff: 80 Centers: 22 Vision Unlike other developers, we create
Preliminary Figures FY 2016
 February 14, 2017 Preliminary Figures FY 2016 Capital Markets Day 2017 Tom Blades (CEO) Disclaimer This presentation has been produced for support of oral information purposes only and contains forwardlooking
An improvement in first-half results relative to the year-earlier period, driven by growth in tourism revenue.
 Paris, 30 May 2018 An improvement in first-half results relative to the year-earlier period, driven by growth in tourism revenue. I. Main events during H1 2017/2018 Financing operations In order to refinance
Investment Highlights
 Third Quarter 2014 Investment Highlights 1 Mexican airport portfolio positioned to take full advantage of global growth. 2 Diversified business model contributing to earnings resilience. 3 Well-defined
I. Main events during H1 2016/2017
 Paris, 30 May 2017 First-half results affected by heightened seasonal factors in the tourism and property development businesses and costs associated with the delivery of Villages Nature; Target confirmed
Analyst and Investor Conference Call Q Ulrik Svensson, CFO and Member of the Executive Board
 Analyst and Investor Conference Call Q2 2017 Ulrik Svensson, CFO and Member of the Executive Board Frankfurt, 2 August 2017 Disclaimer The information herein is based on publicly available information.
2015, a year boosted by an excellent 2 nd half-year
 Ufly CD92/Olivier Ravoire The Hauts-de-Seine Office Market Newsletter no. 9 - March 2016 2015, a year boosted by an excellent 2 nd half-year Following a first half-year contraction, activity picked up
HALF YEAR RESULTS TO 30 SEPTEMBER 2017
 HALF YEAR RESULTS TO 30 SEPTEMBER 2017 1 AGENDA ONE RESULTS HIGHLIGHTS Gerald Kaye TWO FINANCIALS Tim Murphy THREE PORTFOLIO HIGHLIGHTS Matthew Bonning-Snook FOUR OUTLOOK Gerald Kaye FIVE Q&A 2 RESULTS
Forward-Looking Statements Statements in this presentation that are not historical facts are "forward-looking" statements and "safe harbor
 2017 Annual Meeting of Shareholders Presentation May 2017 Forward-Looking Statements Statements in this presentation that are not historical facts are "forward-looking" statements and "safe harbor statements"
Summary o f Results for the First Half of FY2018
 Summary o f Results for the First Half of FY2018 November 9, 2018 (9005) https://www.tokyu.co.jp/ Contents Ⅰ.Executive Summary 2 Ⅱ.Conditions in Each Business 6 Ⅲ.Details of Financial Results for the 13
Ramsay Health Care Limited Results Briefing Half Year ended 31 December 2018
 Ramsay Health Care Limited Results Briefing Half Year ended 31 December 2018 Craig McNally, Group Managing Director & Bruce Soden, Group Finance Director 28 February 2019 ramsayhealth.com Agenda Group
Indiabulls Real Estate Limited (CIN : L45101DL2006PLC148314)
") Indiabulls Real Estate Limited (CIN : L45101DL2006PLC148314) Earnings Update Audited Financial Results FY 2013-14 April 23, 2014 Safe Harbor Statement This document contains certain forward looking statements
Indiabulls Real Estate Limited (CIN : L45101DL2006PLC148314) Earnings Update Audited Financial Results FY 2013-14 April 23, 2014 Safe Harbor Statement This document contains certain forward looking statements
FY RESULTS ROADSHOW PRESENTATION
 1 FY RESULTS 2014 ROADSHOW PRESENTATION FY 2014 HIGHLIGHTS FOCUS ON EXECUTION 2 Strong financial performance Revenues: 61 bn, +5% vs. 2013 EBIT* before one off: 4.1 bn, +15% vs. 2013 EPS: 2.99, +61% vs.
Execution of WIN2016 programme currently underway, confirmation of underlying operating margin target of 5-6% for 2015/2016
 Press Release Results for the year ending 30 September 2013 Paris, 4 December 2013 Note: this press release presents consolidated 2013/2013 earnings established under IFRS accounting rules, currently being
Aéroports de Paris 2007 consolidated annual results. Dividend proposal to be submitted to the Annual General Meeting: 1.
 Paris, 13 March 2008 Aéroports de Paris 2007 consolidated annual results Dividend proposal to be submitted to the Annual General Meeting: 1.63 euro per share Strong growth in all of the Group's business
Analyst Presentation Schiphol Group 2006 Interim Financial Results
 Analyst Presentation Schiphol Group 2006 Interim Financial Results 24 August 2006 Interim Results Disclaimer This release may contain certain forward-looking statements with respect to the financial condition,
Presentation Results. 4th March 2016
 Presentation 4th March 2016 2015 Review Sound result in 2015 Continued strong performance from commercial portfolio Entry into Shanghai with prime mixed-use site Stable asset values 1 Highlights 2014 2015
Heathrow (SP) Limited
 Limited") Draft v2.0 10 Feb Heathrow (SP) Limited Results for year ended 31 December 2013 24 February 2014 Strong operational and financial performance in 2013 Passenger satisfaction at record high and over 72 million
Draft v2.0 10 Feb Heathrow (SP) Limited Results for year ended 31 December 2013 24 February 2014 Strong operational and financial performance in 2013 Passenger satisfaction at record high and over 72 million
Heathrow (SP) Limited
 Limited") 28 April 2014 Heathrow (SP) Limited Results for three months ended 31 March 2014 Strong operational and financial performance at the outset of the new regulatory period Highest ever passenger satisfaction
28 April 2014 Heathrow (SP) Limited Results for three months ended 31 March 2014 Strong operational and financial performance at the outset of the new regulatory period Highest ever passenger satisfaction
MGM Resorts International Reports Second Quarter Financial Results
 NEWS RELEASE MGM Resorts International Reports Second Quarter Financial Results 8/5/2014 Consolidated Adjusted EBITDA Increased 8%, Led By 10% Growth In Wholly Owned Domestic Resorts MGM China Declares
Operational activities
 Interim statement of the Statutory Management Company 31 March 2015 Increased rental income of 11.6 mln (2014: 9.1 mln) Value real estate portfolio, including development projects: 751.1 mln Start construction
Copa Holdings Reports Net Income of $57.7 million and EPS of $1.36 for the Third Quarter of 2018
 Copa Holdings Reports Net Income of $57.7 million and EPS of $1.36 for the Third Quarter of 2018 November 14, 2018 PANAMA CITY, Nov. 14, 2018 /PRNewswire/ -- Copa Holdings, S.A. (NYSE: CPA), today announced
Management Presentation. March 2016
 Management Presentation March 2016 Forward looking statements This presentation as well as oral statements made by officers or directors of Allegiant Travel Company, its advisors and affiliates (collectively
Fourth Quarter 2015 Financial Results
 Fourth Quarter 2015 Financial Results AerCap Holdings N.V. February 23, 2016 Disclaimer Incl. Forward Looking Statements & Safe Harbor This presentation contains certain statements, estimates and forecasts
Bordeaux portfolio: venues for premium shopping. Benjamin Blossier, Director Asset management & Investments 1 October 2013
 Bordeaux portfolio: venues for premium shopping Benjamin Blossier, Director Asset management & Investments 1 October 2013 1 Bordeaux in a nutshell: a perfect fit for our high street portfolio Bordeaux:
Goodman Property Trust. 30 & 31 October 2018 NAB First Look USPP Conference, Sydney
 Goodman Property Trust 30 & 31 October 2018 NAB First Look USPP Conference, Sydney Contents Presented by: Andy Eakin Chief Financial Officer James Spence Director Investment Management GMT overview 3 Auckland
Unlocking potential SALES TEAM BRIEFING. Kaupthing Singer & Friedlander Capital Markets Ltd. Great Portland Estates plc Toby Courtauld Chief Executive
 Unlocking potential Unlocking potential SALES TEAM BRIEFING Kaupthing Singer & Friedlander Capital Markets Ltd Great Portland Estates plc Toby Courtauld Chief Executive Robert Noel Property Director 8
Growth in first-half earnings
 Paris, 25 May 2016 Growth in first-half earnings Current operating result up 14.5% 1, driven by a significant improvement in the contribution from tourism activities (+20%), Net result up 14.5% Sharp decline
Finnair Q Result
 Finnair Q2 2015 Result 14 August 2015 CEO Pekka Vauramo, Interim CFO Mika Stirkkinen 1 Market environment shows signs of improvement There were signs of a recovery in the demand for consumer and business
P esent n atio i n o n f or o H alf l Y e Y ar E n E d n e d d d 31 D ecemb m e b r 2 008
 Queensland WA & QLD Report Summary Strong revenue growth of 61.8% to $234.5m Strong cash flow from operations of $20.9m Net debt to equity 23.2% Underlying net profit of $8.2m (before goodwill impairment
2017 Half-Yearly Results
 2017 Half-Yearly Results Presentation 4th August 2017 Agenda Speakers: Robert Wong, Chief Executive & Simon Dixon, Chief Financial Officer 1. 2017 Half-Yearly Highlights 2. Investment Properties 3. Development
The Property Franchise Group
 The Property Franchise Group Capital Markets Event 22 October 2015 This afternoon s agenda 2 15:15 Welcome Richard Martin, Chairman 15:20 Introduction to MartinCo PLC Ian Wilson, Chief Executive Officer
Lead pic. Report on the first quarter of 2018
 Lead pic. Report on the first quarter of 2018! Operational Highlights Purchase and sale of properties in Budapest - Acquisition of B52 Office - Sale of Ülloi land plot Early redemption of convertible bonds
OPERATING AND FINANCIAL HIGHLIGHTS
 Copa Holdings Reports Financial Results for the Fourth Quarter of 2015 Excluding special items, adjusted net income came in at $31.7 million, or EPS of $0.73 per share Panama City, Panama --- February
1 st Quarter Results FY
 1 st Quarter Results FY 2004-05 05 Q1 Highlights p Context 8Improving economic context 8Strong economic growth in Americas and Asia 8Modest economic recovery in Europe 8Soaring fuel prices 8IPE Brent up
Finnair Q Result
 Finnair Q1 2015 Result 7 May 2015 CEO Pekka Vauramo, Interim CFO Mika Stirkkinen 1 Turbulent market environment The weakness of the Finnish economy continued to be reflected in the demand in the first
Property Tour 26 June 2013
 Property Tour 26 June 2013 Successful Strategy is Delivering 1. Profitable developments - Completed 2 schemes - 100% pre-let - 51% profit on cost - Started 2 schemes - 12/14 New Fetter Lane, EC4 pre-let
VR Group s result for 2018 was excellent rail traffic volumes increased
 Press release 1 (5) VR Group s result for 2018 was excellent rail traffic volumes increased Financial details for 2018 presented in this press release are unaudited FAS figures. The figures in brackets
Copa Holdings Reports Net Income of $136.5 million and EPS of $3.22 for the First Quarter of 2018
 Copa Holdings Reports Net Income of $136.5 million and EPS of $3.22 for the First Quarter of 2018 May 9, 2018 PANAMA CITY, May 9, 2018 /PRNewswire/ -- Copa Holdings, S.A. (NYSE: CPA), today announced financial
I. Main events of the year
 Paris, 21 November 2018 This press release presents consolidated results established under IFRS accounting rules, currently being audited and closed by the Pierre et Vacances SA Board of Directors on 20
Highlights from the Annual Results December 2007
 Highlights from the Annual Results December 2007 Disclaimer The information in this document is taken from the BAA 2007 Annual Results ( the Results ) which were published on 11 March 2008 and other public
Summary of Results for the First Quarter of FY2015/3
 Summary of for the First Quarter of FY2015/3 August 8, 2014 Tokyu Corporation (9005) http://www.tokyu.co.jp/ Contents Ⅰ.Executive Summary 2 Ⅱ.Conditions in Each Business 4 Ⅲ.Details of Financial for the
For personal use only
 THE GPT GROUP ANNOUNCES 29 October 2014 September Quarter Operational Update Key Highlights 2014 earnings guidance upgraded to at least 4 per cent earnings per security (EPS) growth Strong leasing momentum
Investor Presentation
 TUI Group Investor Presentation WestLB Deutschland Conference 2010 17 November 2010 TUI AG Investor Relations Seite 1 Future-related related statements This presentation contains a number of statements
Finnair Q Result
 17 August 2016 CEO Pekka Vauramo CFO Pekka Vähähyyppä Finnair Q2 2016 Result 1 Highlights of the second quarter The seventh consecutive quarter of profit improvement Fukuoka & Guangzhou route openings
Copa Holdings Reports Net Income of $49.9 million and EPS of $1.18 for the Second Quarter of 2018
 Copa Holdings Reports Net Income of $49.9 million and EPS of $1.18 for the Second Quarter of 2018 Panama City, Panama --- Aug 8, 2018. Copa Holdings, S.A. (NYSE: CPA), today announced financial results
Investment Highlights
 Second Quarter 2014 Investment Highlights 1 Mexican airport portfolio positioned to take full advantage of global growth. 2 Diversified business model contributing to earnings resilience. 3 Well-defined
Management Presentation. November 2011
 Management Presentation November 2011 Forward looking statements This presentation as well as oral statements made by officers or directors of Allegiant Travel Company, its advisors and affiliates (collectively
OPERATING AND FINANCIAL HIGHLIGHTS. Subsequent Events
 Copa Holdings Reports Net Income of $103.8 million and EPS of $2.45 for the Third Quarter of 2017 Excluding special items, adjusted net income came in at $100.8 million, or EPS of $2.38 per share Panama
1.3% millionn euros. Net debt of 5.4 improvement. euros to. Financial Year. the Air. operating. equipped. ness and. also focus on.
 25 th July 2014 Financial Year 2014: First Half results SECOND QUARTER Revenues of 6.45 billion euros, upp 1.7% like-for-like; passenger unit revenue up 1.3% at constant currency thanks to strict capacity
01 Amadeus at a glance
 01 Amadeus at a glance 7 Amadeus Annual Report 2011 1.1 Company s origins and development Most people associate the birth of electronic commerce distribution with the arrival of the internet. In fact,
SIAM FUTURE DEVELOPMENT PUBLIC CO., LTD. Corporate Presentation 2016
 SIAM FUTURE DEVELOPMENT PUBLIC CO., LTD. Corporate Presentation 2016 Overview Financial Summary Project Update 2 Overview Founded: 1994 Staff: 78 Centers: 22 Vision Unlike other developers, we create a
OPERATING AND FINANCIAL HIGHLIGHTS
 Copa Holdings Reports Financial Results for the Fourth Quarter of 2018 Excluding special items, adjusted net profit came in at $44.0 million, or Adjusted EPS of $1.04 Panama City, Panama --- February 13,
Cathay Pacific Airways Interim Results 04 August Cathay Pacific Airways Interim Results 6 August 2008
 Cathay Pacific Airways 2010 Interim Results 04 August 2010 Cathay Pacific Airways 2008 Interim Results 6 August 2008 Interim Result 1H 2010 1H 2009 Group Profit/(Loss) HK$6,840m HK$812m Group Turnover
FIRST QUARTER RESULTS 2017
 FIRST QUARTER RESULTS 2017 KEY RESULTS In the 1Q17 Interjet total revenues added $4,421.5 million pesos that represented an increase of 14.8% over the income generated in the 1Q16. In the 1Q17, operating
9-month consolidated revenues up 14.5% 1 to 1,090.7 million
 Paris, November 13, 2012, 5:45 pm Press release Q3 2012 Revenues and business performance 9-month consolidated revenues up 14.5% 1 to 1,090.7 million Retail Shopping centers: Rental income posted solid
FOURTH QUARTER RESULTS 2017
 FOURTH QUARTER RESULTS 2017 KEY RESULTS In the 4Q17 Interjet total revenues added $5,824.8 million pesos that represented an increase of 10.8% over the revenue generated in the 4Q16. In the 4Q17, operating
GATWICK AIRPORT JOINS VINCI AIRPORTS December 2018
 GATWICK AIRPORT JOINS VINCI AIRPORTS December 2018 Asset presentation Gatwick is the 2 nd largest airport in the UK and the 8 th busiest in Europe with 46 mpax Key features 46 mpaxin FY18, in the wealthiest
Copa Holdings Reports Record Earnings of US$41.8 Million for 4Q06 and US$134.2 Million for Full Year 2006
 Copa Holdings Reports Record Earnings of US$41.8 Million for 4Q06 and US$134.2 Million for Full Year 2006 Panama City, Panama --- March 7, 2007. Copa Holdings, S.A. (NYSE: CPA), parent company of Copa
TUI Group Investor Presentation
 TUI Group Investor Presentation WestLB Deutschland Conference Frankfurt, 18-19 November 2009 TUI AG Investor Relations Seite 1 Agenda I. Group overview II. Financials III. Outlook 2009 IV. Financing update
CROWN ANNOUNCES 2019 HALF YEAR RESULTS
 ASX / MEDIA RELEASE FOR IMMEDIATE RELEASE 20 February 2019 CROWN ANNOUNCES 2019 HALF YEAR RESULTS MELBOURNE: Crown Resorts Limited (ASX: CWN) ( Crown ) today announced its results for the half year ended
OPERATING AND FINANCIAL HIGHLIGHTS SUBSEQUENT EVENTS
 Copa Holdings Reports Financial Results for the Third Quarter of 2016 Excluding special items, adjusted net income came in at $55.3 million, or adjusted EPS of $1.30 per share Panama City, Panama --- November
Air China Limited Annual Results. March Under IFRS
 Air China Limited 21 Annual Results Under IFRS March 211 Agenda Part 1 Highlights Part 2 Business Overview Part 3 Financial Overview Part 4 Outlook 2 Part 1 Highlights Steady Economic Growth; Asia Pacific
CONTACT: Investor Relations Corporate Communications
 NEWS RELEASE CONTACT: Investor Relations Corporate Communications 435.634.3200 435.634.3553 Investor.relations@skywest.com corporate.communications@skywest.com SkyWest, Inc. Announces Second Quarter 2017
Interim Report 3m Bilfinger Berger SE, Mannheim May 10, 2012 Joachim Müller, CFO
 Interim Report 3m 2012 Bilfinger Berger SE, Mannheim May 10, 2012 Joachim Müller, CFO Bilfinger Berger SE Interim report 3m 2012 May 10, 2012 Page 1 3m 2012: Highlights Growth in output volume and orders
Fourth Quarter and Full Year 2009
 Investor and analyst meeting: Fourth Quarter and Full Year 29 25 th February 21 2 The views expressed here contain some information derived from publicly available sources that have not been independently
TUI Group Investor Presentation
 TUI Group Investor Presentation Commerzbank, German Investment Seminar New York, 11 12 January 2010 TUI AG Investor Relations Seite 1 Agenda I. Group overview II. Financials & Financing update III. Outlook
Norwegian Air Shuttle ASA
 Norwegian Air Shuttle ASA Q1 2018 Presentation 26 April 2018 Highlights Q1 2018 Successfully completed private placement of NOK 1.3 billion Added two 737-800s and six 787-9s to operations Launched interline
Fact Sheet for Q and H July 21, 2016
 Fact Sheet for Q2 2016 and H1 2016 July 21, 2016 Contents Daimler Group Stock Market Information 3 Earnings and Financial Situation 4-13 Information for Divisions Mercedes-Benz Cars 14-17 Daimler Trucks
Year ended December 31, 2012
 Consolidated Earnings Report - Supplementary Information Consolidated Results ( ) 1. Consolidated Financial Highlights 2. Major Sales Sales Volume Data 3. Condensed Consolidated Statements of Income Condensed
Fact Sheet for Q3 and January-September 2017 October 20, 2017
 Fact Sheet for Q3 and January-September 2017 October 20, 2017 Contents Daimler Group Stock Market Information 3 Earnings and Financial Situation 4-12 Information for Divisions Mercedes-Benz Cars 13-16
CROWN ANNOUNCES 2017 FULL YEAR RESULTS
 ASX / MEDIA RELEASE FOR IMMEDIATE RELEASE 4 August 2017 CROWN ANNOUNCES 2017 FULL YEAR RESULTS MELBOURNE: Crown Resorts Limited (ASX: CWN) ( Crown ) today announced its results for the full year 30 June
SAS Q1 2017/2018. Q1 in Summary: Improved earnings CHANGE VS. Q1 FY17
 SAS 2017/2018 27.02.2018 in Summary: Improved earnings POSITIVES + Passenger revenue up 1% (FX adj.) + Cargo and EB-point sale revenue increased MSEK 109 + Efficiency program delivered MSEK 165 + Positive