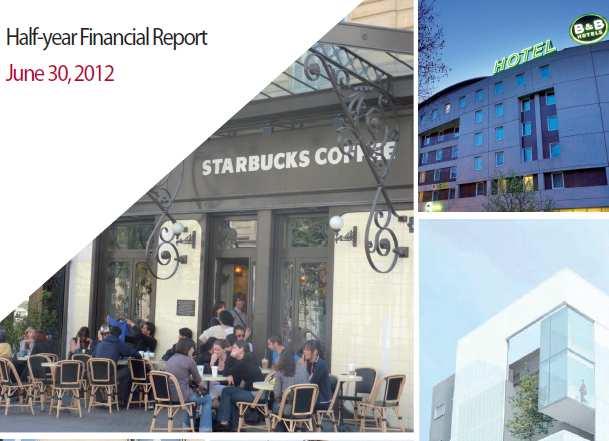
Investor Presentation First Half Results
|
|
|
- Cecily Bishop
- 6 years ago
- Views:
Transcription
1 Investor Presentation 2012 First Half Results 1
2 Disclaimer This document has been prepared by ANF Immobilier SA ( ANF Immobilier ) solely for the use of presentations made to investorsor analysts. ANF Immobilier makes no representations or warranties that the information contained herein is accurate, correct or complete. The information set out herein is provided as of the date of the presentation and ANF Immobilier is under no obligation to keep current the information contained in this presentation. However, this information is subject to completion and/or revision and ANF Immobilier has the right to change the content hereof, in its sole discretion, at any time without prior notice. This document may contain information regarding current or future transactions as well as pro forma information to show ANF Immobilier as it would be after said transactions have been completed. These forward-looking statements are provided for information purposes only and are not guarantees of future performance. No information provided on this document constitutes, or should be used or considered as, an offer to sell or a solicitation of any offer to buy the securities or services of ANF Immobilier or any other issuer in any jurisdiction whatsoever. Aug

3 Image 3
4 2012 First Half Highlights On-going sale process B&B portfolio Negotiation with a consortium made of La Francaise AM & Foncière des Régions for all portfolio Lyon Assets Negotiation with Grosvenor for a significant part of the assets Strong demand in Lyon city-center leads to record high prime rent Retail new leases signed at 2,650/sqm New arrival : Paul, Claire s Offices new leases signed at 260/sqm Residential reached 20.00/sqm in Mansardes projet /sqm on average Significant progress into Marseille rental values Retail new leases signed at 800/sqm New arrival : Monop, Brioche Dorée Higher footfall in 3 rd segment Offices new leases signed at 220/sqm High success of Place Sadi Carnot renovation Residential stable at /sqm 4
5 Image 5
6 Balanced Asset Mix Able to Seize Growth in Attractive Locations 2012 H1 Gross Rental Income = 38.5M +6% like-for-like 56% from growth rents from city-center portfolio B&B City-center % 56% City-center Recurring Rents = 21.5M +8% like-for-like Retail 10.4M +9% Lyon 6.0M +13% Marseille 4.4M +4% Residential 5.0M +3% 48% City-Center Rents = 21.5M +8% like-for-like Lyon +12% Marseille +4% Lyon 1.6M +20% Marseille 3.5M+1% Offices 5.1M +8% Lyon 2.2M+6% Marseille 2.9M+9% 23% 24% 6
7 H Figures, Delivery on Growth M 2012 Change * Consolidated Accounts (IFRS) like-for- H1 Reported like H1 H1 Gross Rental Income % B&B % 2.8% City-center % 7.8% Recurring GRI % 5.6% EBITDA % % margin 79.5% 84.7% 80.6% Recurring EBITDA % % margin 79.5% 81.5% 80.6% Cash Flow % Recurring cash flow % RCF per share % Average # of shares Capex Change in fair value (incl KG on disp) Net Income M Reported Reported Reported 30/06/ /12/ /12/2010 Real Estate portfolio 1,685 1,650 1,573 B&B City-center 1,173 1,137 1,081 Net Debt NAV per share (1) Triple Net NAV (1) LTV 32.2% 29.2% 29.2% (1)The change in fair value includes the proceeds from asset disposals (2) Average number of shares adjusted for bonus issue of 1 share for every 20 held in 2 7
8 8

9 Solid Portfolio Value = 1,685M Appraisal = 1,685M Cap rate stability over all asset types and locations Over all cap rate stability on hotels portfolio : average cap rate = 6.54% (vs. 6.58%) (in k) 30/06/ /12/2011 Change 2,000 1,800 1,600 1,400 1,200 1, Marseille 233 Lyon Marseille 275 Lyon Marseille 409 Lyon 248 1,392 B&B 460 Marseille 581 Lyon 351 1,543 B&B 466 Marseille 627 1,504 B&B 474 Marseille B&B 492 Marseille Acquisitions 13 B&B 513 Marseille Acquisitions 21 B&B 512 Marseille 694 Lyon Lyon Lyon Lyon Lyon DEC 04 DEC 05 DEC 06 DEC 07 DEC 08 DEC 09 DEC 10 DEC 11 JUN 12 Lyon % Marseille % City-center properties % Undergoing development % City-center portfolio 1,151 1, % B&B Hotel properties disposed 487 B&B Hotel properties kept % Undergoing Development, no change in perimeter Restructuring: TAT, Plot 20 Dames, Pavillon Vacon, Rive Neuve New construction: Rabatau, Plot 34, Desbief Fauchier, Forbin and Plot 25 as city-center properties New Acquisitions % ANF Immobilier 1,685 1, % 9


10 Image 10
11 Comfortable financing structure One of the Lowest Geared Company in Sector Loan-to-Value= 32% Net financial debt = 542.1M (as 30/06/11) Cash & equivalent = 15.8M (as 30/06/11) Conservative strategy Financing balanced between available types of debt Sources of debt mixed of local and global banks Debt sources breakdown ( M) Gross Debt = 558M Unsecured (corporate) 300 Leasing 3 Secured (mortgage) M available financing 3 credit facilities available from 3 different French banks 2012 & 2013 investment program financing secured No refinancing until % of credit lines fully hedged by plain vanilla swaps Cost of debt = 4.09% (vs. 4.38%) Outlook Current pipeline financed with debt Internal discipline not to exceed 35% LTV (covenant =50%) 11


12 Marseille, some ANF retailers 12
13 Net Asset Value = 41.2/share (excluding fair value of hedging instruments) n NAV (June 11) 3n NAV (Dec 11) Dividend NAV Dec 11 post div Cap Increase Cash Flow FV Properties FV Swaps 3n NAV (Jun 12) (per share) 31/12/10 30/06/11 31/12/11 30/06/12 Var 6 m Var 12 m NAV % +1.7% NNNAV % +0.3% 13


14 Image 14
15 Improved Stock Liquidity June 2011 : Distribution of 7% block by Eurazeo March 2012 : Inclusion in the EPRA Index Current liquity c. 8,000 shares/day Approx. 275,000 a day On average in August 2012 figures 45,000 Volumes 40,000 35,000 30,000 25,000 20,000 15,000 10,000 5,000 - ANF Immobilier shareholding structure Generali 5% CNP 5% CEPAC + BPCE 5% Free float 34% Eurazeo 51% Number of shares 27,774, Jan 6-Jan 11-Jan 16-Jan 21-Jan 26-Jan 31-Jan 5-Feb 10-Feb 15-Feb 20-Feb 25-Feb 1-Mar 6-Mar 11-Mar 16-Mar 21-Mar 26-Mar 31-Mar 5-Apr 10-Apr 15-Apr 20-Apr 25-Apr 30-Apr 5-May 10-May 15-May 20-May 25-May 30-May 4-Jun 9-Jun 14-Jun 19-Jun 24-Jun 29-Jun 4-Jul 9-Jul 14-Jul 19-Jul 24-Jul 29-Jul 3-Aug 8-Aug 13-Aug 18-Aug EPRAIndex inclusion 2012 volumes 2010 volumes
16 >About the Transaction 16
17 Why a disposal? Rents Valuation Lyon High value creation on Lyon portfolio since 2005 on Lyon portfolio : almost 3x value Assets now at maturity level 31 déc déc déc juin 2012 B&B ANF Contribution B&B Rents ANF Contribution B&B 12 3 Cash Flow B&B assets played their cash flow catalyst role since 2007 No disposal possible until November déc déc déc déc
18 On Going Disposal Negotiation HOTELS PROPERTIES LYON PORTFOLIO Sale impossible until November properties acquired in extra 7 properties bought afterwards Disposal of significant part of Lyon properties Mature properties ANF keep value-added assets : TAT, MilkyWay, Carlton, 2 buildings Offer from a Consortium «La Française AM + Foncière des Murs» at 503.5M Offer value Dec Capex adjustments 1-for- 1 Conditions precedent Concentration control Financing Real estate (pre-emption, financial lease, ) Closing expected in November 2012 Repayment of the mortgage debt associated Offer from Grosvenor at 313.1M Offer value Dec Capex adjustments 1-for- 1 On going due-diligence No condition on financing Closing expected in November
19 Two Offers Summary 52% of assets disposed 5% discount on appraisal 1, Bordeaux 21 Discount 7 Bordeaux 21 B&B 512 B&B 506 Includes 2.1 M capex committed at 2012 H1, and valued at 30/06/12 appraisal Discount 35 Lyon 457 Lyon 319 Includes 5.7 M capex committed at 2012 H1, and valued at 30/06/12 appraisal Lyon 104 Marseille 694 Marseille /06/2012 Offers Post Op Value at 31/12/11 ( M) Appraisal Bid Discount Lyon % B&B % Total % ANF Appr. 1, % assets 52.1% 19
20 Disposal Impact on Rents ( M) Budget 2012 B&B Disposal Lyon Disposal Budget 2012 proforma Budget 2013 proforma Gross Rental Income 78,975-32,252-16,022 30,701 38,817 Real Estate Expenses 4, ,771 3,780 Net Rental Income 74,767-32,575-15,262 26,930 35,037 95% 88% 90% Non retraité de l impact des cessions 20

21 Image 21
22 Disposals Impact on Accounts ( M) B&B Disposal Lyon Disposal Total IFRS Net Result on Disposal Fair Value * Expenses Financial Instrument Fair Value** Cash Flow Change IFRS Total Impact on Results * Fair value change on B&B accounted in June accounts ** No impact on equity or Triple Net Asset Value ANNUAL ACCOUNTS Capital Gain Expenses Provision for Financial Instrument Cash Flow Change Annual Accounts Total Impact Revaluation Reserve
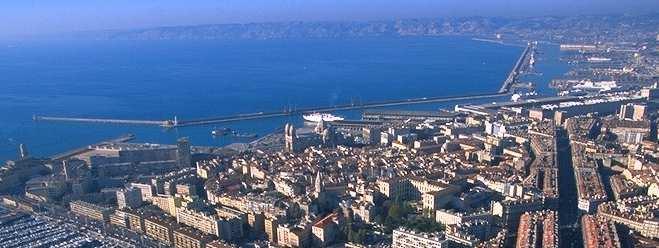
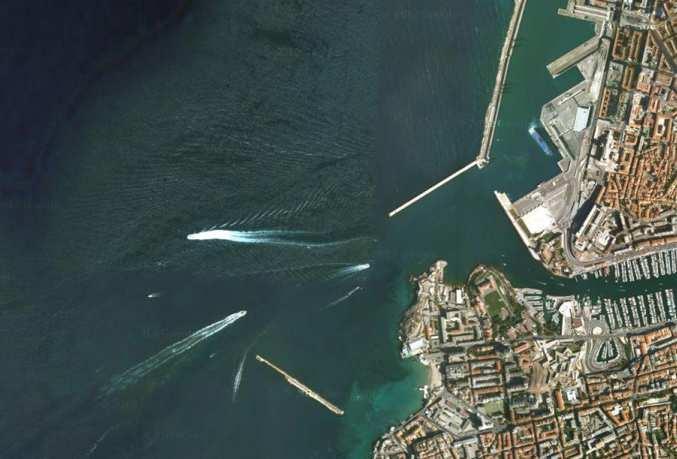
23 Disposal Impact on NAV 100% distributed 30/06/2012 Transaction Post Valuation 30/06/12 ( M) Lyon Marseille B&B Bordeaux + MW Discount Total 1, Bordeaux + MW 1% B&B 31% Lyon 27% Marseille 41% Gross Debt ( M) Centre-ville B&B Total Other assest & liabilities ( M) Net Asset Value NAV ( M) 1, NAV per share ( ) Bordeaux + MW 3% Lyon 13% B&B 2% Cash & equivalent ( M) Net Debt ( M) Loan To Value 32.2% 35.8% Marseille 82% 23
24 From a diversify SIIC to a Growth Pure Player ANF Immobilier will retain significant resources to ensure its future developments Marseille Follow-on development on the portfolio toward maturity Developments: SNCM, Desbief, Montolieu Lyon Developments: TAT et MilkyWay Follow-on investments in Confluence area Bordeaux Follow-on investments in Bassins à Flots et Euratlantique areas 24
25 ANF Immobilier Target: 94% Growth Rents Over Four Years Following Initial Plan to Catalyze Value Creation Almost 2x Rents CAGR +16.2% E Recurring Rents Vacancy Reversion Index Developement Acquisitions Disposal 2016 Target 25
26 Appendices 26


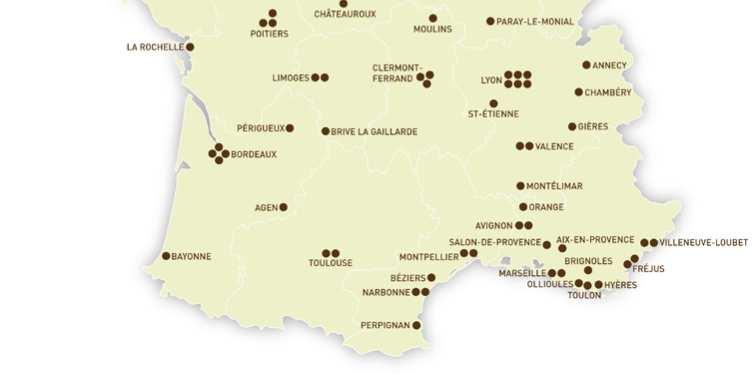
27 168 B&B Hotels 12,124 rooms 27
28 Opera Lyon Place des Cordeliers Place de la République Part-Dieu District Place Bellecour Rue de la République Perrache Train station Confluence 1 Confluence 2 Gerland District 28
29 Lyon : rue de la République Latest market rent evidence Retail : 2,200 2,600/sqm Offices : /sqm Residential: 11 13/sqm (month) Latest market rent evidence Retail : 600 1,000/sqm Offices : /sqm Residential: 11 13/sqm (month) ANF Immobilier Assets 29


30 EUROMED 2 Marseille EUROMED 1 Cité de la Méditerranée Place de la Joliette Saint-Charles Station Triangle d'or Rue de la République 30


31 Marseille, Euroméditerranée& ANF Immobilier E C I G B F A H ANF Immobilier A. Trinquet B. Fauchier C. Forbin D. Rive Neuve E. Ilot 34 F. Dames G. Ilot 25 H. Pavillon Vacon I. Desbief D 31
32 Marseille, rue de la République ANF Immobilier Assets Latest market rent evidence Retail : /sqm Offices : /sqm Residential : 11 13/sqm (month) Dames Mazenod Plot 25 Forbin Public Car Park 800 spaces Fauchier Desbief Trinquet Malaval Segment 1 Segment 2 Segment 3 32

 Rent: 160-175/sqm, excl. tax (excl.")
33 New acquisitions BordeauxLe Nautilus Bassin à Flot 12,800 sqmof office building Fully rented to C Discount (99.6% Casino subsidiary) 51 parking lots Financial terms Price = 27.4M ( 2,140/sqm) Rent: /sqm, excl. tax (excl. parking) Turn Key Contract Developer: Eiffage Atlantique Delivery Tranche 1 : Sept 2012 Tranche 2 : Sept
34 Performance boursière Volumes ANF EPRA SBF 250 CAC ,000 90,000 80,000 70,000 60,000 50,000 40,000 30,000 20, ,
35 Corporate Governance Half of Supervisory Board Independant Patrick Sayer (vice-président) Philippe Audouin Sébastien Bazin* Sabine Roux de Bézieux* Jean-Luc Bret Fabrice de Gaudemar Supervisory Board (12) Alain Lemaire*, President Executive Board (3) Bruno Keller, Chairman Xavier de Lacoste Lareymondie, COO Ghislaine Seguin Eric Le Gentil* Philippe Monnier* Jean-Pierre Richardson Isabelle Xoual* Théodore Zarifi Audit Committee Philippe Audouin, Théodore Zarifi, Eric Le Gentil* Remuneration and Selection Committee Philippe Monnier*, Sébastien Bazin*, Isabelle Xoual* Property Committee Patrick Sayer, Sébastien Bazin*, Jean-Luc Bret, Philippe Monnier* Headcount ANF Immobilier 56 Management 3 Property mgmt 20 Development 12 Accounting 13 Support 8 * Independent 35
36 About ANF Immobilier ANF Immobilier owns and manages a real-estate portfolio of 1.7 billion euros in the city centres of Lyon and Marseilles as well as a portfolio of 168 hotel properties in France, all operated by the B&B chain It is a real estate company with SIIC status, targeting residential and third party property rentals with significant operations in Lyon and Marseille city centres Listed on Eurolist B of NYSE EuronextParis, ANF Immobilier is included in the EPRA Index. Financial Calendar 2012 Q3 Revenue November 9, FY Results March 20, Q1 Revenue May 6, H1 Results August 28, 2013 Investor Relations Contact investorrelations@anf-immobilier.com Research on ANF Immobilier Exane: Valerie Guezi HSBC: Stéphanie Dossmann Invest Securities: Benoit Faure-Jarrosson, Paul Arkwright Tradition Securites: Laetitia d'eprémesnil Kepler: Samuel Henry-Diesbach Aurel BGC: Julien Guez ANF shares ISIN code: FR Bloomberg/Reuters: ANF FP, ANF.pa Listed on Euronext Eurolist B Indices: EPRA, CAC All Shares, IEIF SIIC France 27,771,170 shares in circulation Statutory threshold declarations 1% 36


37 37
2011 Annual Results. February 17th 2012 Paris
 2011 Annual Results February 17th 2012 Paris 1 Disclaimer This document has been prepared by ANF Immobilier SA ( ANF Immobilier ) solely for the use of presentations made to investorsor analysts. ANF Immobilier
Analyst Meeting. First Half 2013 Results
 Analyst Meeting First Half 2013 Results 1 Growth Image & Profitability Strong Pipeline of Investments 2 Contents Growth & Profitability Page 04 Strong Pipeline of Investments Page 11 Guidance Page 29 Appendix
Act 2. Analyst Meeting 27 July 2016
 Act 2 Analyst Meeting 27 July 2016 1 Contents 1. Highlights Page 3 2. Portfolio Page 10 3. Finance Page 26 2 Highlights July 2016 3 Highlights Main financial indicators Gross Rental Income +11% EBITDA
Analyst Presentation 9 March 2017
 Analyst Presentation 9 March 2017 Contents 01 2016 - P.3 Highlights Strategy 02 PORTFOLIO - P.15 Heritage Core 03 Finance - P.36 04 Conclusion - P.47 2 01 2016 HIGHLIGHTS - YEAR 2016 STRATEGY 3 An intensive
Investor Presentation. October 2009
 Investor Presentation October 2009 Investor Presentation October 2009 A. Diversified assets in prime locations B. High visibility on revenues C. No risk on developments D. A solid financial structure E.
Press release February 21, 2014
 Press release February 21, 2014 2013 earnings Recurrent ent net income per share up +1.2%, with NAV per share growth of +1.7% Significant improvement in the financial occupancy rate and rental margin Recurrent
FIRST HALF RESULTS SFAF MEETING, 27 SEPTEMBER 2017
 FIRST HALF RESULTS SFAF MEETING, 27 SEPTEMBER 2017 2017 CONTENTS 1. Patrimoine & Commerce Pursuing development over the 1 st half of 2017 2. Patrimoine & Commerce Reinforcing value-oriented SIIC status
Le Floria - Fontenay Q May Strong Letting Activity. Percier - Paris Citroën Paris 17
 Le Floria - Fontenay Q1 2013 14 May 2013 Strong Letting Activity Percier - Paris Citroën Paris 17 1- Positioning 2- Letting Activity 3- Portfolio 4- Financing 5- Q1 2013 Revenues 6- Key Takeways Le Divo
9-month 2016 Revenues: Outlook revised upwards. 3 November 2016
 9-month 2016 Revenues: Outlook revised upwards 3 November 2016 CONTENTS > A SUCCESSFUL LETTING ACTIVITY > STRONG INVESTMENT ACTIVITY > KEY TAKEAWAYS > APPENDIX FONCIÈRE DES RÉGIONS 2 1 A successful letting
2018 HALF-YEAR FINANCIAL INFORMATION
 2018 HALF-YEAR FINANCIAL INFORMATION CONTENTS - 1. Half-year management report at 30 June 2018.. p. 3-2. Condensed consolidated financial statements at 30 June 2018. p. 23-3. Statutory Auditors' report
Preliminary Figures FY 2016
 February 14, 2017 Preliminary Figures FY 2016 Capital Markets Day 2017 Tom Blades (CEO) Disclaimer This presentation has been produced for support of oral information purposes only and contains forwardlooking
Revenue for the first 9 months of 2018 up 20% Sustained activity across all business lines
 Press release Paris, 16 October 2018, 5:45 pm Revenue for the first 9 months of 2018 up 20% Sustained activity across all business lines Large mixed-use projects Major progress at Issy Cœur de Ville, Toulouse
Fourth Quarter and Full Year 2009
 Investor and analyst meeting: Fourth Quarter and Full Year 29 25 th February 21 2 The views expressed here contain some information derived from publicly available sources that have not been independently
2005 year-end results presentation March 2006
 2005 year-end results presentation March 2006 2005 Key Points Twofold increase in portfolio and share capital Execution of business plan Commitments in first half 2005 : 105 M Acquisition of Locafimo in
FONCIERE DES REGIONS
 FONCIERE DES REGIONS Co-créateur d histoires immobilières Activity at end-september 2017: a robust European dynamic 26 October 2017 Rental activity: 9 months of buoyant activity Nearly 90,000 m² secured
9-month consolidated revenues up 14.5% 1 to 1,090.7 million
 Paris, November 13, 2012, 5:45 pm Press release Q3 2012 Revenues and business performance 9-month consolidated revenues up 14.5% 1 to 1,090.7 million Retail Shopping centers: Rental income posted solid
Full go towards year end
 Beni Stabili: 9-month 2017 rents Full go towards year end Milan: October 24 th, 2017 Growth in operating metrics 1.5% L-f-L rental growth excl. TI assets 95.5% financial occupancy 93.1% excluding TI portfolio
First Quarter Results August 31 st, 2006
 First Quarter Results 2006-07 August 31 st, 2006 Key features of the First Quarter Market context Sustained global economic growth, and a recovery in Europe Average jet fuel price of 691 $/t, up 25% year-on-year
FULL-YEAR RESULTS. Presentation of 23 February 2012
 FULL-YEAR RESULTS 2011 Presentation of 23 February 2012 KEY FIGURES Affine EPRA earnings per share ( ) EPRA Net Asset Value ( m) 1.33 1.45 1.60 284.4 281.9 287.6 2009 2010 2011 2009 2010 2011 Dividend
Highlights from the Annual Results December 2007
 Highlights from the Annual Results December 2007 Disclaimer The information in this document is taken from the BAA 2007 Annual Results ( the Results ) which were published on 11 March 2008 and other public
GROWTH(S) Revenue: +26.1%, million Recurring net result (FFO): +25.5%, million 2017 targets confirmed
 Revenue: +26.1%, million Recurring net result (FFO): +25.5%, million 2017 targets confirmed") Press release 2017 Half-year results Paris, 27 July 2017, 5:45 pm GROWTH(S) Revenue: +26.1%, 912.3 million Recurring net result (FFO): +25.5%, 115.4 million 2017 targets confirmed Excellent half-year in
Press release 2017 Half-year results Paris, 27 July 2017, 5:45 pm GROWTH(S) Revenue: +26.1%, 912.3 million Recurring net result (FFO): +25.5%, 115.4 million 2017 targets confirmed Excellent half-year in
Analyst and Investor Conference Call Q Ulrik Svensson, CFO and Member of the Executive Board
 Analyst and Investor Conference Call Q2 2017 Ulrik Svensson, CFO and Member of the Executive Board Frankfurt, 2 August 2017 Disclaimer The information herein is based on publicly available information.
SAS Group Presentation Carnegie, May 22, 2012 Sture Stölen, Head of IR
 SAS Group Presentation Carnegie, May 22, 2012 Sture Stölen, Head of IR 1 This is the SAS Group 128 destinations 27,2 million passengers 28 new routes to be launched 2012 1,085 daily flights Revenues 2011,
H RESULTS BOLOGNA, SEPTEMBER 4 TH 2017
 H1 RESULTS BOLOGNA, SEPTEMBER 4 TH H1 GROUP 2 GROUP OVERVIEW STRONG GROWTH TRACK RECORD AND MOMENTUM STRATEGIC LOCATION AND WEALTHY CATCHMENT AREA H1 Among top 50 airports in Europe # 7 airport in Italy
Positive rental reversions in Hong Kong portfolio. Rising contribution from Singapore office portfolio. Strong performance from Residential business
 2012 Review The Group performed well in 2012 Positive rental reversions in Hong Kong portfolio Rising contribution from Singapore office portfolio Strong performance from Residential business 2 Highlights
BAA (SP) Limited Results for six months ended 30 June July 2011
 Limited Results for six months ended 30 June July 2011") BAA (SP) Limited Results for six months ended 30 June 2011 July 2011 Record Q2 Heathrow traffic Good overall service standards Strong financial results Successful dollar and sterling financings H1 2011
BAA (SP) Limited Results for six months ended 30 June 2011 July 2011 Record Q2 Heathrow traffic Good overall service standards Strong financial results Successful dollar and sterling financings H1 2011
Interim Report 6m 2014
 August 11, 2014 Interim Report 6m 2014 Investors and Analysts Conference Call on August 11, 2014 Joachim Müller, CFO Latest ad-hoc release (August 4, 2014) Reduction of forecast, primarily due to a further
Business at September 30, 2017
 Press release October 19, 2017 Business at September 30, 2017 2017 guidance raised following Eurosic s integration At least +6% recurrent net income growth expected excluding healthcare (vs. -5% to -6%
Investor presentation FY 2011 results
 Investor presentation FY 2011 results Recent highlights Itakeskus refurb & extension scaled up extension 11.000 sqm in total; anchor tenant will relocate (to Piazza); investment volume 90m, YoC 6.0-6.5%
2016 Half-Yearly Results
 Presentation 29th July 2016 2016 Half-Yearly Review Underlying profit down 6% Commercial portfolio benefited from higher occupancy Steady contribution from mainland China residential business Profit attributable
OPERATING AND FINANCIAL HIGHLIGHTS. Subsequent Events
 Copa Holdings Reports Net Income of $103.8 million and EPS of $2.45 for the Third Quarter of 2017 Excluding special items, adjusted net income came in at $100.8 million, or EPS of $2.38 per share Panama
An improvement in first-half results relative to the year-earlier period, driven by growth in tourism revenue.
 Paris, 30 May 2018 An improvement in first-half results relative to the year-earlier period, driven by growth in tourism revenue. I. Main events during H1 2017/2018 Financing operations In order to refinance
2013 HALF-YEAR RESULTS
 2013 HALF-YEAR RESULTS Financial meeting Monday 2 September 2013 2013 Half-year results THE SPEAKERS BRUSSELS 01 Jean-Philippe Roesch Managing Director Chief Executive Officer Chantal De Vrieze Country
1 st Quarter Results FY
 1 st Quarter Results FY 2004-05 05 Q1 Highlights p Context 8Improving economic context 8Strong economic growth in Americas and Asia 8Modest economic recovery in Europe 8Soaring fuel prices 8IPE Brent up
I. Main events during H1 2016/2017
 Paris, 30 May 2017 First-half results affected by heightened seasonal factors in the tourism and property development businesses and costs associated with the delivery of Villages Nature; Target confirmed
Execution of WIN2016 programme currently underway, confirmation of underlying operating margin target of 5-6% for 2015/2016
 Press Release Results for the year ending 30 September 2013 Paris, 4 December 2013 Note: this press release presents consolidated 2013/2013 earnings established under IFRS accounting rules, currently being
Forward-Looking Statements Statements in this presentation that are not historical facts are "forward-looking" statements and "safe harbor
 2017 Annual Meeting of Shareholders Presentation May 2017 Forward-Looking Statements Statements in this presentation that are not historical facts are "forward-looking" statements and "safe harbor statements"
TUI Group Investor Presentation
 TUI Group Investor Presentation Commerzbank, German Investment Seminar New York, 11 12 January 2010 TUI AG Investor Relations Seite 1 Agenda I. Group overview II. Financials & Financing update III. Outlook
Contemplated merger with Beni Stabili: A major step forward in European strategy and Group simplification
 PRESS RELEASE Paris, April 20 th 2018 Contemplated merger with Beni Stabili: A major step forward in European strategy and Group simplification Foncière des Régions and Beni Stabili, its 52.4% owned subsidiary
Q3 Results. September 21, 2005» 1
 Q3 Results September 21, 2005» 1 Financial results 9-month highlights» Significant growth in net income» Sharp improvement in gross margin» Strong increase in housing backlog in value terms» 3 9-month
Results 2Q17. August 9, 2017
 Results 2Q17 August 9, 2017 2Q17 Highlights Indicators 2Q17 Var. x 2Q16 ASK (BN) 10.4-3.0% Traffic (000) 7,261-1.3% RPK (BN) 8.1 +0.5% Load Factor 77.9% +2.7 p.p. Yield (R$ cents) 23.2 +4.8% Pax Revenue
Information meeting. 1 st September 2011
 Information meeting 1 st September 2011 Full Year 2010-11 key data April 2010-March 2011 Revenues in billions Operating result in millions 77% Passenger 18.10 +11.3% -44 +874 13% Cargo 3.16 +29.5% +69
Fourth Quarter 2015 Financial Results
 Fourth Quarter 2015 Financial Results AerCap Holdings N.V. February 23, 2016 Disclaimer Incl. Forward Looking Statements & Safe Harbor This presentation contains certain statements, estimates and forecasts
2017 Half-Yearly Results
 2017 Half-Yearly Results Presentation 4th August 2017 Agenda Speakers: Robert Wong, Chief Executive & Simon Dixon, Chief Financial Officer 1. 2017 Half-Yearly Highlights 2. Investment Properties 3. Development
Cebu Air, Inc. 4 th Quarter and Full Year 2017 Results of Operations. cebupacificair.com
 Cebu Air, Inc. 4 th Quarter and Full Year 2017 Results of Operations cebupacificair.com Disclaimer The information provided in this presentation is provided only for your reference. Such information has
Information meeting. 12 September 2011
 Information meeting 12 September 2011 Full Year 2010-11 key data April 2010-March 2011 Revenues in billions Operating result in millions 77% Passenger 18.10 +11.3% -44 +874 13% Cargo 3.16 +29.5% +69 +505
SGCIB Premium Review 2018
 SGCIB Premium Review 2018 29 November 2018 Christian Labeyrie Executive Vice-President and CFO Disclaimer This presentation may contain forward-looking objectives and statements about VINCI s financial
Operational activities
 Interim statement of the Statutory Management Company 31 March 2015 Increased rental income of 11.6 mln (2014: 9.1 mln) Value real estate portfolio, including development projects: 751.1 mln Start construction
Growth in first-half earnings
 Paris, 25 May 2016 Growth in first-half earnings Current operating result up 14.5% 1, driven by a significant improvement in the contribution from tourism activities (+20%), Net result up 14.5% Sharp decline
Megawide Construction Corporation FY 2016 Analysts Briefing 06 April 2017
 Megawide Construction Corporation FY 2016 Analysts Briefing 06 April 2017 FY 2016 CONSOLIDATED HIGHLIGHTS +14% P17.7B Revenue +19% P3.6B EBITDA +30% P1.9B Net Income 1 1 CONSOLIDATED INCOME STATEMENT 2
OPERATING AND FINANCIAL HIGHLIGHTS. Subsequent Events
 Copa Holdings Reports Net Income of US$113.1 Million and EPS of US$2.57 for the First Quarter of 2015 Excluding special items, adjusted net income came in at US$106.0 million, or EPS of US$2.41 per share
Presentation Results. 4th March 2016
 Presentation 4th March 2016 2015 Review Sound result in 2015 Continued strong performance from commercial portfolio Entry into Shanghai with prime mixed-use site Stable asset values 1 Highlights 2014 2015
EADS: New Stage of Maturity. Nathalie Errard VP Investor Relations
 EADS: New Stage of Maturity Nathalie Errard VP Investor Relations Lagardere Investor Day, June 1 st, 2006 1 Content Integration and Rise to Leadership 2005 Group Financials New Challenges, New Growth 2
FOURTH QUARTER RESULTS 2017
 FOURTH QUARTER RESULTS 2017 KEY RESULTS In the 4Q17 Interjet total revenues added $5,824.8 million pesos that represented an increase of 10.8% over the revenue generated in the 4Q16. In the 4Q17, operating
2013 full-year earnings
 2013 full-year Paris, February 21, 2014 Bernard Michel Chairman Philippe Depoux CEO Nicolas Dutreuil CFO Contents 1. STRATEGY & CSR 2. GECINA S PERFORMANCE ON OFFICES & RETAIL 3. GECINA S PERFORMANCE ON
Copa Holdings Reports Net Income of $136.5 million and EPS of $3.22 for the First Quarter of 2018
 Copa Holdings Reports Net Income of $136.5 million and EPS of $3.22 for the First Quarter of 2018 May 9, 2018 PANAMA CITY, May 9, 2018 /PRNewswire/ -- Copa Holdings, S.A. (NYSE: CPA), today announced financial
TUI Group Investor Presentation
 TUI Group Investor Presentation WestLB Deutschland Conference Frankfurt, 18-19 November 2009 TUI AG Investor Relations Seite 1 Agenda I. Group overview II. Financials III. Outlook 2009 IV. Financing update
Copa Holdings Reports Net Income of US$113.9 Million for the Fourth Quarter of 2013
 Copa Holdings Reports Net Income of US$113.9 Million for the Fourth Quarter of 2013 Panama City, Panama --- February 12, 2014. Copa Holdings, S.A. (NYSE: CPA), today announced financial results for the
Copa Holdings Reports Fourth Quarter and Full Year 2007 Results
 Copa Holdings Reports Fourth Quarter and Full Year 2007 Results Panama City, Panama --- February 21, 2008. Copa Holdings, S.A. (NYSE: CPA), parent company of Copa Airlines and Aero Republica, today announced
SAS Group Q2 2012/13. Q2 Restructuring programme moving KPIs in the right direction
 SAS Group Q2 2012/13 1 Q2 Restructuring programme moving KPIs in the right direction Operating revenues +1.6%* Yield improvement of +2.7%* Forceful implementation of 4XNG plan: Unit cost down by 10.7%
OPERATING AND FINANCIAL HIGHLIGHTS
 Copa Holdings Reports Financial Results for the Fourth Quarter of 2015 Excluding special items, adjusted net income came in at $31.7 million, or EPS of $0.73 per share Panama City, Panama --- February
Indiabulls Real Estate Limited (CIN : L45101DL2006PLC148314)
") Indiabulls Real Estate Limited (CIN : L45101DL2006PLC148314) Earnings Update Audited Financial Results FY 2013-14 April 23, 2014 Safe Harbor Statement This document contains certain forward looking statements
Indiabulls Real Estate Limited (CIN : L45101DL2006PLC148314) Earnings Update Audited Financial Results FY 2013-14 April 23, 2014 Safe Harbor Statement This document contains certain forward looking statements
Great Portland Estates Trading Update Strong Operational Performance
 Press Release 6 July 2017 Great Portland Estates Trading Update Strong Operational Performance Great Portland Estates plc ( GPE ) today publishes its trading update for the quarter to 30 June 2017. Continued
2018 full-year results
 2018 full-year results 01 Message from Chairman & CEO 02 FY 2018 Results 03 Business drivers 04 Outlook 02 FY 2018 financial results Key figures Revenue 2.85 Bn ROP 115 M Net debt 252 M Free cash flow
Management Presentation. March 2016
 Management Presentation March 2016 Forward looking statements This presentation as well as oral statements made by officers or directors of Allegiant Travel Company, its advisors and affiliates (collectively
MGM Resorts International Reports Second Quarter Financial Results
 NEWS RELEASE MGM Resorts International Reports Second Quarter Financial Results 8/5/2014 Consolidated Adjusted EBITDA Increased 8%, Led By 10% Growth In Wholly Owned Domestic Resorts MGM China Declares
Investor Briefings First-Half FY2016 Financial Results
 Cedar Woods Properties Limited Investor Briefings First-Half FY2016 Financial Results 26 February 2016 Cedar Woods Presentation 2 Snapshot of Achievements in FY2016 Extensive portfolio of residential estates
Information meeting. September 2011
 Information meeting September 2011 Full Year 2010-11 key data April 2010-March 2011 Revenues in billions Operating result in millions 77% Passenger 18.10 +11.3% -44 +874 13% Cargo 3.16 +29.5% +69 +505
The Property Franchise Group
 The Property Franchise Group Capital Markets Event 22 October 2015 This afternoon s agenda 2 15:15 Welcome Richard Martin, Chairman 15:20 Introduction to MartinCo PLC Ian Wilson, Chief Executive Officer
Financial Results 1 st Quarter Mar/2016 (FY2015) 30 July, 2015
 30 July, 2015") Financial Results Mar/2016 (FY2015) 30 July, 2015 Today s Topics P.2 P.3 P.15 1 Overview of FY Mar/2016 Financial Results Operating Revenue Operating Profit 320 307.0 +4.9Bn (+1.6%) 312.0 50 +17.6Bn (+94.6%)
Financial Results Mar/2016 (FY2015) 30 July, 2015 Today s Topics P.2 P.3 P.15 1 Overview of FY Mar/2016 Financial Results Operating Revenue Operating Profit 320 307.0 +4.9Bn (+1.6%) 312.0 50 +17.6Bn (+94.6%)
OPERATING AND FINANCIAL HIGHLIGHTS
 Copa Holdings Reports Financial Results for the Fourth Quarter of 2018 Excluding special items, adjusted net profit came in at $44.0 million, or Adjusted EPS of $1.04 Panama City, Panama --- February 13,
Cisco Issy les Moulineaux. 3M 2014 Revenues. May 6, A good start to the year. Citroën Paris 17
 Cisco Issy les Moulineaux 3M 2014 Revenues May 6, 2014 A good start to the year Citroën Paris 17 CB 21, La Défense Le Patio - Villeurbanne 1 Key events of the period 2 Operating performance 3 Key takeaways
Summary of Results for the First Three Quarters FY2015/3
 Summary of Results for the First Three Quarters FY2015/3 February 10, 2015 Tokyu Corporation (9005) http://www.tokyu.co.jp/ Contents Ⅰ.Executive Summary 2 Ⅱ.Conditions in Each Business 5 Ⅲ.Details of Financial
OPERATING AND FINANCIAL HIGHLIGHTS SUBSEQUENT EVENTS
 Copa Holdings Reports Net Income of US$6.2 Million and EPS of US$0.14 for the Third Quarter of 2015 Excluding special items, adjusted net income came in at $37.4 million, or EPS of $0.85 per share Panama
First Half 2013 Results. 16 mai 2013
 First Half 2013 Results 16 mai 2013 26 July 2013 Results Increasing effects of Transform 2015 Highlights of the First Half A difficult global economic environment Transform 2015 plan roll-out on track
OPERATING AND FINANCIAL HIGHLIGHTS
 Copa Holdings Reports Net Income of US$32.0 Million and EPS of US$0.72 for the Second Quarter of 2012 Excluding special items, adjusted net income came in at $58.6 million, or EPS of $1.32 per share Panama
Copa Holdings Reports Net Income of $49.9 million and EPS of $1.18 for the Second Quarter of 2018
 Copa Holdings Reports Net Income of $49.9 million and EPS of $1.18 for the Second Quarter of 2018 Panama City, Panama --- Aug 8, 2018. Copa Holdings, S.A. (NYSE: CPA), today announced financial results
Melco International Development Limited (Incorporated in Hong Kong with limited liability) Website : (Stock Code : 200)
 Website : (Stock Code : 200)") Hong Kong Exchanges and Clearing Limited and The Stock Exchange of Hong Kong Limited take no responsibility for the contents of this announcement, make no representation as to its accuracy or completeness
Hong Kong Exchanges and Clearing Limited and The Stock Exchange of Hong Kong Limited take no responsibility for the contents of this announcement, make no representation as to its accuracy or completeness
Results presentation. December 2012
 Results presentation December 2012 1 Introduction A Romanian focused property investment company Distribute dividends (or return of capital & share subscription) on a semi-annual basis Focus on properties
Launch of IPO of Aéroports de Paris
 Launch of IPO of Aéroports de Paris Paris, 31 May 2006 Aéroports de Paris today announced the launch of its initial public share offering on Eurolist by Euronext Paris SA, representing the opening of its
Third Quarter 2014 Results. 29 October 2014
 Third Quarter 2014 Results 29 October 2014 Highlights of the Third Quarter Operating environment Air France-KLM Economic environment remains weak Further currency volatility affecting revenues and results
FIRST QUARTER RESULTS 2017
 FIRST QUARTER RESULTS 2017 KEY RESULTS In the 1Q17 Interjet total revenues added $4,421.5 million pesos that represented an increase of 14.8% over the income generated in the 1Q16. In the 1Q17, operating
OPERATING AND FINANCIAL HIGHLIGHTS SUBSEQUENT EVENTS
 Copa Holdings Reports Financial Results for the Third Quarter of 2016 Excluding special items, adjusted net income came in at $55.3 million, or adjusted EPS of $1.30 per share Panama City, Panama --- November
Tiger Airways Holdings Limited FY11 Results
 Tiger Airways Holdings Limited FY11 Results May 2011 Financial Year Ended 31 March 2011 Disclaimer The information contained in this presentation (the "Information") is provided by Tiger Airways Holdings
SET Opportunity Day #3/2011
 SET Opportunity Day #3/2011 2Q11 & 1H11 Performance & Outlook 18 August 2011 The views expressed here contain some information derived from publicly available sources that have not been independently verified.
AGENDA. Group overview. Financial highlights. Operational highlights. Expansion plans
 1 AGENDA Group overview Financial highlights Operational highlights Expansion plans 2 3 CURRENT FOOTPRINT Kenya 12 stores 2 DCs Tanzania 2 stores Number of stores 31-Dec-16 31-Dec-17 Increase: Dec-16 to
OPERATING AND FINANCIAL HIGHLIGHTS. Subsequent Events
 Copa Holdings Reports Financial Results for the First Quarter of 2016 Excluding special items, adjusted net income came in at US$69.9 million, or EPS of US$1.66 per share Panama City, Panama --- May 5,
SIAM FUTURE DEVELOPMENT PUBLIC CO., LTD. Corporate Presentation Q4-15
 SIAM FUTURE DEVELOPMENT PUBLIC CO., LTD. Corporate Presentation Q4-15 Overview Financial Summary Project Update 2 Overview Founded: 1994 Staff: 80 Centers: 22 Vision Unlike other developers, we create
SAS AB:s Press Conference. Augusti 14 th 2008
 SAS AB:s Press Conference Augusti 14 th 2008 1 Weak second quarter due to unprecedented challenging market conditions Combination of record high fuel prices and economic slowdown probably largest industry
Heathrow (SP) Limited
 Limited") Draft v2.0 10 Feb Heathrow (SP) Limited Results for year ended 31 December 2013 24 February 2014 Strong operational and financial performance in 2013 Passenger satisfaction at record high and over 72 million
Draft v2.0 10 Feb Heathrow (SP) Limited Results for year ended 31 December 2013 24 February 2014 Strong operational and financial performance in 2013 Passenger satisfaction at record high and over 72 million
SAS Q1 2017/2018. Q1 in Summary: Improved earnings CHANGE VS. Q1 FY17
 SAS 2017/2018 27.02.2018 in Summary: Improved earnings POSITIVES + Passenger revenue up 1% (FX adj.) + Cargo and EB-point sale revenue increased MSEK 109 + Efficiency program delivered MSEK 165 + Positive
Ramsay Health Care Limited Results Briefing Half Year ended 31 December 2018
 Ramsay Health Care Limited Results Briefing Half Year ended 31 December 2018 Craig McNally, Group Managing Director & Bruce Soden, Group Finance Director 28 February 2019 ramsayhealth.com Agenda Group
SAS Q3 2017/ August 2018
 SAS Q3 2017/2018 31 August 2018 Strong earnings in peak season POSITIVES Record number of passengers Total revenue up MSEK 936 vs. LY Currency adjusted yield up 1.1% vs. LY EB point sale up 27% vs. LY
SHAPING A SUSTAINABLE FUTURE
 SHAPING A SUSTAINABLE FUTURE Full Year Results Year ended 31 March 2017 Analyst and Investor Presentation 8 June 2017 Agenda Introduction Christine Ourmieres-Widener Financial Review Philip de Klerk Performance
Finnair Group Interim Report 1 January 30 September 2008
 Finnair Group Interim Report 1 January 30 September 2008 1 31/10/2008 Presentation name / Author Airline industry at a historical turning point Expensive fuel price in the beginning of 2008 has dramatical
Goodman Property Trust. 30 & 31 October 2018 NAB First Look USPP Conference, Sydney
 Goodman Property Trust 30 & 31 October 2018 NAB First Look USPP Conference, Sydney Contents Presented by: Andy Eakin Chief Financial Officer James Spence Director Investment Management GMT overview 3 Auckland
Third Quarter Results
 1 Third Quarter 2010-11 Results Highlights of the Third Quarter Passenger business affected by significant disruptions Dynamic cargo activity Strong improvement in results Decline in ex-fuel unit costs
FY RESULTS ROADSHOW PRESENTATION
 1 FY RESULTS 2014 ROADSHOW PRESENTATION FY 2014 HIGHLIGHTS FOCUS ON EXECUTION 2 Strong financial performance Revenues: 61 bn, +5% vs. 2013 EBIT* before one off: 4.1 bn, +15% vs. 2013 EPS: 2.99, +61% vs.
SAS AB Analyst meeting
 SAS AB Analyst meeting London, August 9, 2001 2 2nd Quarter a tough Quarter The Marketplace Continued weak world economy Weaker Swedish economy SAS Weaker traffic growth and reduced passenger load factors
Record Retail Sales Drove Robust Performance. Wharf Real Estate Investment Company Limited 2018 Interim Results 7 Aug 2018
 Record Retail Sales Drove Robust Performance Wharf Real Estate Investment Company Limited 2018 Interim Results 7 Aug 2018 Highlights 999-year Land Leases Offer a Differentiation* HKIP & Hotel 6 Core Assets