HELSINKI COMMISSION HELCOM MARITIME 1/2003 Maritime Group First Meeting Rostock, Germany, February 2003
|
|
|
- Vivien Foster
- 6 years ago
- Views:
Transcription
1 HELSINKI COMMISSION HELCOM MARITIME 1/2003 Maritime Group First Meeting Rostock, Germany, February 2003 Agenda Item 6 Matters related to safety of navigation Document code: 6/2/INF Date: Submitted by: Secretariat STATISTICAL ANALYSES OF THE BALTIC MARITIME TRAFFIC The Meeting is invited to take note of the report Statistical Analyses of the Baltic Maritime Traffic, made by VTT as part of the HELCOM Project An updated assessment of the risk for oil spills in the Baltic Sea Area. The report can be viewed and printed from: The report consists of 152 pages. Note by Secretariat: FOR REASONS OF ECONOMY, THE DELEGATES ARE KINDLY REQUESTED TO BRING THEIR OWN COPIES OF THE DOCUMENTS TO THE MEETING Page 1 of 1
2 RESEARCH REPORT NO VAL Statistical Analyses of the Baltic Maritime Traffic Customer: Finnish Environment Institute Ministry of Traffic and Communications VTT TECHNICAL RESEARCH CENTRE OF FINLAND VTT INDUSTRIAL SYSTEMS
3 1 (152) Public X Registered in VTT publications register JURE Confidential until / permanently Internal use only Title Statistical Analyses of the Baltic Maritime Traffic Customer or financing body and order date/no. Finnish Environment Institute and Ministry of Traffic and Communications Project SEASTAT-1 Author(s) Research report No. VAL Project No. V1SU00072 No. of pages/appendices Jorma Rytkönen, Liisa Siitonen, Timo Riipi, Jukka Sassi, 110 /44 Juhani Sukselainen Keywords Baltic sea, oil transportation, maritime traffic, port development Summary The Baltic Sea, the largest brackish body of water in the world, has always been an important sea route connecting the Nordic countries and Russia to continental Europe. Surrounded by nine countries, it also has some of the densest maritime traffic in the world. In addition, the Baltic Sea has proved to be an important inter-modal link between various logistical chains, and moreover, a link to Russia. The Baltic Sea has also served a crucial role as a route for the gas pipeline from Russia to Europe. During recent decades, there has been a significant increase in maritime traffic, specifically in container vessel traffic throughout the world. The traffic in the Baltic area has not only increased, but the nature of the traffic has also changed rapidly. Today, many of the shipping routes consist of frequent traffic, where fast ships are running between seaports on a fixed timetable. There are also certain routes that have dense passenger traffic, e.g., Helsinki Stockholm and Helsinki Tallinn. Perhaps the most interesting development, however, has been the rapid development of Baltic and Russian seaports: old ports have been rehabilitated, new terminals and berths are under construction. One tendency has been the increase of oil transportation, especially in the Gulf of Finland (GOF). This report contains an analysis of the current maritime traffic of the Baltic Sea. A special attention is focused on the oil transportation and the forecast of the future development. The main ports and their basic development plans are also presented. The work was funded by the Finnish Environment Institute and the Finnish Ministry of Transport and Communications. Date Espoo 24 September, 2002 Harri Soininen Research Manager Jorma Rytkönen Research Scientist/Senior R. S. Checked Distribution (customers and VTT): Finnish Environment Institute 5 copies; Ministry of Traffic and Communications 5 copies; Maritime Administration 2 copies; VTT 5 copies. file: balticstatfinal2002.doc The use of the name of VTT in advertising, or publication of this report in part is allowed only by written permission from VTT. VTT TECHNICAL RESEARCH CENTRE OF FINLAND VTT INDUSTRIAL SYSTEMS Tekniikantie 12, Espoo Tel P.O. Box 1705, FIN VTT Fax FINLAND name.surname@vtt.fi Business ID
4 2 (152) Table of contents 1 Introduction Maritime transportation of the Baltic Sea General On the transport modes Transportation figures Existing and Future Traffic of the Gulf of Finland Overview on the Baltic Sea traffic Danish Straits and Kiel Canal Cargo turnover in harbors Oil handling Corridor development Tanker fleet Summary of the analyzed data Main Ports in the Baltic area Finland Port of Helsinki Sköldvik Port of Turku Naantali Kotka and Hamina Raahe Shipping statistics Russia General St. Petersburg Sea Port Kaliningrad Other Russian ports in the Gulf of Finland area Estonia The development of the Port of Tallinn Latvia General Ventspils Dry cargo terminals Riga Port of Liepaja Lithuania General...38
5 3 (152) Port of Klaipeda Poland Gdansk Gdynia Swinoujscie Port of Szczesin Germany Lübeck - Travemunde Hamburg Rostock Other ports Denmark The Danish ports Cargo transport at Danish ports Exports, imports, and national transport Aabenraa Port Aarhus Port Sweden Port of Gothenburg Other Harbors Total maritime transport and oil transportation in the Baltic Sea General The Gulf of Bothnia The Gulf of Finland Central part of the Baltic Sea Southern Baltic Sea Danish Straits Total seaborne traffic in Oil Transportation Oil production in Russia Future development Transportation development Oil tanker movements in Preliminary risk assessment for the Gulf of Finland Ship routing and mandatory reporting system of GOF Passenger traffic development General cargo transport development The maritime traffic development of the Gulf of Bothnia EU's contribution Development trends General development trends area perspective GDP development Oil production scenarios Middle Asian development...93
6 4 (152) 6.8 Impact scenarios Applicability of FSA-method in producing effective risk control options in order to reduce the risk of oil spills in the Baltic Sea area What is FSA FSA and the risk of oil spills in the Baltic Sea area The work performed in the UK Transportation risks in the Gulf of Finland Risk assessment - Estonian perspective Special measures to minimize risk in Poland Risk assessment in Sweden Conclusions References...105
7 5 (152) 1 Introduction The increased traffic and expected growth of oil transportation in the Gulf of Finland was the main reason the Finnish Environment Institute and the Finnish Ministry of Traffic and Communications decided to order an updated traffic survey. There were other facts, which pointed out the necessity to collect updated data on the transportation figures: - The older HELCOM risk assessment studies in 1996 and 1998 were partly based on older data without the known development of the Baltic ports and the Gulf of Finland oil transportation figures as has been observed today, - Some deductions and assumptions made in the COWI's research project of the Baltic Pipeline System did not give realistic view over the Gulf of Finland development (especially Primorsk, Muuga, Ust-Luga), - Finland, Estonia and Russia started in 2000 to discuss on the need of the VTMIS (Vessel Traffic Management and Information System) for the Gulf of Finland. The preliminary survey made by VTT pointed out the need for the updated traffic survey and - HELCOM has recently launched a project "an updated assessment of the risk for oil spills in the Baltic Sea area". Due to the fact HELCOM launched the new risk assessment the goal of the work was widened to cover not only the Gulf of Finland sea area, but the whole Baltic Sea area. Moreover, the preliminary survey on the possibility to use FSA techniques as a risk assessment tool was also started as described later in this paper. The basic goal of this work is to collect new seaborne transportation data including all the main groups of cargo. The prognoses on the development for the year 2010 will also be made. The main goal, however, is to define the oil transportation figures and main routes now and in the future. Due to the fact the parameterization of the oil transportation will not alone tell a lot of the total maritime safety development other important parameters will be collected and analyzed in the study. The parameterization and the risk assessment work will be carried out later, after the traffic inventory phase will be carried out. Other data to be collected in the study are: - Oil transportation figures and capacities of the ports and terminals, - Transportation modes, - Transportation units, especially the size and age of tankers and other relevant parameters such as single/double hull, need for ice classification, propulsion system, redundancy, - Other main transportation figures, main routes, - Approaches of the ports (one way, two way, difficult/easy), - Defined wind limits for tanker manoeuvres (separate report by VTT).
8 6 (152) 2 Maritime transportation of the Baltic Sea 2.1 General The strong economic development of trade in the Baltic Sea area is also reflected in the development of shipping. Consequently, when economies strengthen and trade increases, it is important that shipping and the transport system in general are not restricted by various barriers, bottlenecks and certain institutional differences. Development, however, is leaning to the more general trade with harmonized tools and legislation. The TEDIM (Telematics in Foreign Trade Logistics and Delivery Management) initiative of the Finnish Ministry of Transport and Communication is one example of this development, used to improve cross-border processes, such as fast and reliable customs services, intermodalisms and integrated information exchange. A precondition for a market economy is a functioning legal system with well-developed contract, association, business and trade and competition legislation. Through EU membership, Finland, Germany, Denmark, and Sweden are already subject to the common regulatory system of the EU. The EU s transport and shipping policy comprises the framework for the regulatory system that controls shipping and ports in these countries (Sjöfartsverket, 1999). Russian economy started to develop slowly after the collapse of the Soviet Union. The reform period started in the early 1990's, but it took several years until the new leadership and the support of the industry caused a new rehabilitation era for the Russian seaports in the Baltic Sea area. Due to the fact that the economic activity in Russia is primarily concentrated in major cities, the economic development elsewhere has been slow. The economic crisis in August 1998 further reduced economic activity in Russia, but exports from Russia survived through the crises better than imports did. Exports are dominated by raw materials, and are largely dependent on trends and world market prices. After the disintegration of the Soviet Union, there have been a lot of different harbor and terminal proposals for the Gulf of Finland area. The Baltic countries have also rapidly rehabilitated their old harbors and built up new capacity mainly for transit traffic. At this point in time, there are a lot of development activities under way in the Russian and Baltic ports. The most well known rehabilitation projects have been in St. Petersburg Harbor and Muuga Harbor in Tallinn. The oil transit traffic for the Port of Muuga was approximately 19 million tons in 2000, and after the railway connections from Russia to the port will be rehabilitated, that may increase. Totally new harbor construction sites have been taken place at Primorsk, Lomonosov, Batareinya and Ust-Luga on the Russian side of the Gulf of Finland. It has been estimated that maritime traffic will increase two-fold in Transportation of hydrocarbon products may even be three-fold compared to the existing figures. Port projects in the eastern Baltic are presented in Appendix 6. The first phase of the Primorsk oil terminal will be completed by the end of The government of the Russian Federation, however, has already given a new order to start up the second phase of the Primorsk oil terminal (order dated ), which will raise the proposed first stage annual oil flow by 6 million tons up to an annual level of 18 million tons. Russian oil companies are planning other terminals, and one of the newest plan is the Vysotsk oil terminal off the City of Vyborg. The Baltic States (Estonia, Latvia and Lithuania) have strong, growing structures for shipping and port activities. During Soviet rule, their ports were handling a significant amount of Soviet exports.
9 7 (152) After gaining their independence, the Baltic Countries have retained, and even strengthened their role as transit regions for Russia exports and imports. The development of the Port of Tallinn, and especially of the Muuga Oil terminal has been rapid and intense. The new capacity of the Gulf of Finland may cause the transit traffic of the Baltic States to decrease in the long term. The crude and raw materials market price, however, will, together with the need of western currency and political decisions inside and outside the EU influence the development. Here, the assumption is made that the new Russian capacity will not totally cut the traffic numbers for the Baltic States, decreasing development instead. The positive economic development of Russia and the Baltic States will influence maritime transport and speed up growth, which will then compensate for part of the existing transit. Russia will take care of a larger part of the shipping of its raw materials, but simultaneously new materials will be imported to Russia, which will keep the transit figure in balance, and even let it grow. For several historical reasons, the situation in Poland differs from that of the Baltic States. The reform period with a transition period has been longer, and new ferry lines and traffic routes have been established (Sjöfartsverket, 1999). Poland's maritime development has been characterized by continuity and its progress towards a market economy has been less drastic than that of the Baltic States and Russia. It is clear that from the regulatory viewpoint, the Baltic Sea is best protected both at the regional and national levels. The Helsinki Convention has provided the regional framework for co-operation in the Baltic for the last 25 years. It is evident (see the analysis in the report: Accidents, Prevention and Remediation in the Baltic Sea) that during this time, and particularly in the last 10 years of dramatic political and economic change, co-operation has developed and a regional legal framework has been agreed among the states concerned (COWI, 1998). This regional co-operation has developed on a two-fold basis as regards the BPS project. First, through the HELCOM Maritime Committee, a number of HELCOM Recommendations have been elaborated and agreed with the objective of improving the quality of shipping visiting Baltic ports and also by seeking co-operation for better enforcement and control. Second, through the HELCOM Combatting Committee, the response capabilities of Baltic States have been improved through the means of guidance and procedures laid down in the HELCOM Combatting Manual, joint exercises, exchanges of information, etc. At the national level, the Baltic Sea is well served by having half its riparian states at an advanced level of environmental management and supporting legislation. Denmark, Finland, Germany and Sweden have always been in the vanguard of environmental protection policies and their membership of the EU has contributed to the advancement of environmental protection and improved quality of shipping within the Community. The HELCOM countries in transition (Estonia, Latvia, Lithuania, Poland and the Russian Federation) have all made progress in the last decade. In particular, the 4 Baltic States which are trying to accede to the EU have made significant progress in updating their legislation and administrations in order to be able to comply with EU laws and considerable progress has been made in recent years to improve oil spill response capability, with the help of external donor support (COWI, 1998). A thorough description of HELCOM is given along with relations with other bodies (IMO, EU). Also the views of the Baltic Sea states on the effectiveness of HELCOM are given. There is no need to create a new environmental body to cover the Baltic Sea. The very real needs are already met - to the general satisfaction of the Baltic States - by the Helsinki Commission. The present tri-lateral framework - HELCOM, IMO and the EU - each body with its individual strengths, seems to be an adequate mechanism to achieve the goal of preventing accidents in the Baltic Sea area and reducing the environmental impacts when they do occur, Figure 1.
. 2.2 On the transport modes The basic maritime transport modes of the Baltic Sea Region are: - bulk or general cargo, semi-finished products.")
10 8 (152) Figure 1. Location of the 62 coastal and offshore areas nominated in 1995 for HELCOM's system of Baltic Sea Protection Areas (HELCOM, 2001). 2.2 On the transport modes The basic maritime transport modes of the Baltic Sea Region are: - bulk or general cargo, semi-finished products. Oil products, chemicals, minerals, metals, coal and fertilizers belong to this category, - high-value products, transported typically in containers or in packed form and - ferry transport including passenger transport, cars, trucks and rail wagons. The bulk type of cargo is still an important part of the sea transport in the Baltic region. For example in the Gulf of Finland area the oil transportation will form an important part of the total amount of cargo transported. Due to the new terminal construction works and rehabilitation of old harbors both in Russia and Estonia the oil transportation has increased and is increasing significantly. There are often environmental problems related to the shipping of low value cargo including risks of oil spills, chemicals or other pollutants into the Baltic Sea. The ships used for transport are usually older ones, and the cargo forms a potential source for environmental problems if an unwanted hazard will occur. Other problems may be related to passages of large vessels carrying hazardous goods through narrow passages, ice infested waters or fragile coastal areas as well as heavy transport on the "hot spot areas", i.e. in important crossings to the intermodal connections. Due to the fact Russia lost its main ports in the independence process of the Baltic countries, a lot of originally Russian, Ukrainian and Belorussian transito bulk products are transported via Baltic countries. Large projects are, however, currently being prepared in order to increase the capacity
11 9 (152) and modernize several ports including ports and terminals in Russia and Estonia. These rehabilitation works will cause major changes in the product transportation chains through Baltic and Russian ports, and influence to Finnish ports in the Gulf of Finland, too. The rise of the economy and the increase of the GDP in Russia will increase the transited cargo volume especially in the Gulf of Finland area, and the southern part of the Baltic Sea. For the high value cargo there are a set of items to illustrate the future development. The logistics requirements and the need to concentrate enough cargo with the organizational and commercial network development. Logistics systems must be an integral part of the business process rather than an independently supplied facility (Källström, L. & Ingo, S. 2000). The competition between ports will taken place with prizing, rapid handling, flexible opening hours and good service structure. 2.3 Transportation figures Existing and Future Traffic of the Gulf of Finland The Baltic Sea surrounded by nine countries is a sensitive sea area with intense maritime traffic. The Baltic Sea offers an important sea route for export and import both inside the Baltic region and outside of the area, through the Danish Strait or via the Russian inland canal network. Ports in the Baltic Sea are listed in Appendix 7. The disintegration of the Soviet Union changed the picture of the maritime traffic in the Baltic Sea area essentially. Russia lost some important ports after the independence of Latvia, Lithuania and Estonia. The growth of the maritime and port operations has been rapid in Estonia. Especially the Muuga terminal is now a major oil transit sit for Russian oil export in the Gulf of Finland. Due to the fact Russia lost a great deal of its Baltic ports there has been several proposals to improve existing ports and terminals and to build totally new ports. New port and terminal proposals have been familiar for the maritime world already several years (Rytkönen, 1994), but due to the lack of finance, legislation problems, etc the development has been slow so far. However, Russia is loosing a significant part of possible revenues as harbor fees especially for the Baltic countries, thus it is now investing to ports in its own territory. There are also several proposals to enhance existing ports and terminals. The best known new development sites are: - Lomonosov with the annual throughput of Mton, - Batareinya bay with plans of 15 Mton, - Ust-Luga with planned 35 Mton and - Primorsk for Mton of oil products - Vysotk oil terminal, proposed to be in operation in 2003 with the annual 10 Mton output. The latest news concerning the Russian port development in the eastern part of the Gulf of Finland indicate, that the Primorsk oil terminal's first phase is completed, and the first oil tanker left the terminal in the end of December in The planned volume of the first phase will be approximately 12 million tons. In the first phase, especially during the winter time, the smaller tankers may be used, but the master plan of the terminal uses dwt tankers as design ships.

12 10 (152) Figure 2 shows the situation in December 2000 in Primorsk when the construction works were underway. Note the base of the VTS tower in the middle of the picture. Primorsk terminal belongs to the Russian VTS system and has its own sub-station. Figure 2. Primorsk oil terminal under construction in autumn The St. Petersburg Sea port is also developing rapidly. The total cargo throughput of the St. Petersburg Sea port alone was 15.6 Mton in 1998, over 20.5 Mton in 1999 and will be over 24 Mton in The amount of oil products handled in 1999 amounted 5 Mton, in 2000 even more. The Batareinya port construction works seems to have been postponed. The Ust-Luga coal and fertilizer port, however, has received more funds for continuation of the works Overview on the Baltic Sea traffic The total number of port calls in the Baltic Sea Region by cargo vessels according to Lloyds Voyage Record was approximately during the second half of This figure does not include regular ferry traffic. Shipping services were performed by approximately cargo ships in foreign and combined traffic, excluding domestic traffic. Taking into account the port calls by international ferry traffic in the Baltic area, the total amount of calls on a yearly basis is close to (SMA, 1999). Nearly 40% of the vessels were older than 20 years, which equalled approximately 50% of the total number of calls. Table 1 shows the number of calls in the Baltic Sea area by vessel type and country for the second half of 1998 (SMA, 1999).
13 11 (152) Table 1. Number of port calls in the Baltic Sea, II/1998 (SMA, 1999). Country Bulk/ Tankers Gas Gen. Containeenger Reefers RoRo Pass- Others Total comb cargo Germany Denmark Estonia Finland Lithuania Latvia Norway Poland Russia Sweden TOTAL There are over 500 ports in the Baltic Sea with a total annual port throughput close to 700 million tons for 1997/98, nearly 600 million tons of which was cargo loaded or unloaded for export or import. The 1998 statistics for port throughput is shown in Table 2. Table 2. Maritime traffic through Baltic Ports in 1998 (SMA, 1999). Country Total number of calls Total loaded and unloaded [million of tons] Sweden Finland Russia/Baltic Estonia Latvia Lithuania Poland Germany/Baltic Denmark Norway TOTAL Total loaded and unloaded in the Baltic Sea area The Baltic Sea has very dense sea traffic. The total sea-borne traffic of the Baltic Sea area was estimated in a research project "Baltic Pipeline ERUS", funded by EU's Tacis (COWI, 1998). In 1995, the total volume was estimated to be close to 1.4 billion tons in the whole world. The percentage for the Baltic Sea was estimated to be approximately 15%. The annual growth of traffic as well as several growth scenarios were presented in the study mentioned above. Depending on the certain economical assumptions and development potentials, the annual growth of the maritime traffic was expected to vary from 3 8%. The average growth volume was estimated to be 4 5%, and the following estimation up to 2017 was thus achieved (Table 3).
14 12 (152) Table 3. Prognosis of the Baltic Sea maritime traffic from 1995 to 2017(COWI, 1998b). Commodity Volume in Baltic Sea (million tons) Estimated future volume in Baltic Sea (million tons) Break Bulk % Growth from 1995 to 2017 Dry Bulk % General Cargo % Liquid Bulk % Oil % Total % Source: COWI's estimate Based on Table 3 above, the sea-borne volume will roughly double. The general cargo and container traffic will even be three-fold. The increase in oil transportation will be 40%. However, the figures for oil transportation are not well defined. There exist certain uncertainties after Russia have built up the new oil terminal potential in the Baltic area. There are speculations that the new terminals will cut part of the oil transit flow of the Baltic countries. The development of the oil market price and the internal affairs of Russia, however, may influence this development scenario a lot. It is expected here that the total increase for the oil transport figures may take place after the new terminals have been constructed. Since new terminals will be built and old harbors rehabilitated in the eastern part of the Gulf of Finland, the increase will have a strong influence there. Table 4 describes one estimate of the development scenarios in the most important oil terminals of the Baltic Sea area. The development of Muuga and St. Petersburg can be clearly noted. Table 4. Oil transportation volumes of certain Baltic oil terminals in 1997 and in 2000 (G. Semanov/CNIIMF, 2001). Country/port/terminal In 2000 In 1997 Estonia/Muuga Finland/Hamina Finland/Porvoo (other 5) Latvia/Riga Latvia/Ventspils Latvia/Liepaja Lithuania/Klaipeda Lithuania/Butinge Russia/St. Petersburg Russia/Kaliningrad Total [10 6 tons] 79.8 million tons 54.5 million tons

. Figure 4.")
15 13 (152) The total amount of cargo through the Baltic ports is presented below in 1998 level (Figure 3). Number of port calls in Baltic Sea States in the second half of the 1998 is presented in Figure 4. Forecast of the throughput development in the Baltic is presented in Appendix 26. Figure 3. The total amount of cargo through the Baltic ports 1998 (Outlook 2000). Figure 4. Number of port calls in Baltic Sea States in the second half of the 1998 apportioned by vessel type. Passenger vessels not reported by Estonia. One port call = ship arrival and departure (HELCOM, 2001).
16 14 (152) Danish Straits and Kiel Canal The total traffic intensity in the Great Belt and in the Sound was according to (COWI, Dec 1998) practically unchanged in the period 1978 to 1990, and has increased 20 % from 1990 to The increase is a result of a dramatically increase of 50 % in the traffic intensity in the Sound and a decrease in the traffic intensity in the Great Belt. The traffic in the Sound has doubled over the last ten years. In the Little Belt traffic has decreased from around movements/year in 1998 to around 4000 in However a subsequent increase by 20 % in traffic is observed from 1990 to Seen together the Great Belt, the Sound and the Little Belt show an increase of 20 % from 1990 to (A/S Great Belt, 1996). The total traffic in the Kiel Canal has decreased over the past 7 years. The number of transit passages has decreased by 12 % from 1990 to 1995 and the tonnage has decreased by 15 % (Kiel, 1998; A/S Great Belt, 1996) Cargo turnover in harbors There is a little more than 200 commercial ports in the Baltic Sea. Approximately 60 of these each have an annual turnover of 1 million tons or more and represents 90 % of the total port turnover (EC 1997). The ten largest ports in the region have a turnover of more than 14 million tons. These are shown in Table 5. Table 5. Harbour cargo turnover and primary types of cargo in 1996 at the ten largest harbours in the Baltic Sea (EC 1997, Annual 1998) Harbor Country Turnover (million tons) Gothenburg / Brofjorden Main Cargo types Sweden 47.6 Bulk, general cargo, crude oil, oil products, containers and trailers Ventspils Latvia 35.7 Crude oil, oil products and bulk Lübeck / Travemunde Germany 21.9 Bulk general cargo, trailers and ferry cargo Rostock Germany 20.2 Bulk and general cargo Gdansk/Gdynia Poland 24.8 Bulk and general cargo Porvoo Finland 16.9 Oil and oil products Swinoujscie / Poland 16.3 Bulk and general cargo Szczecin St. Petersburg Russia 16.1 Bulk, general cargo, containers and trailers Klaipeda Lithuania 14.8 Bulk, oil products and general cargo Tallinn Estonia 14.1 Bulk, general Cargo and Trailers In recent years there has been an increase in the annual turnover of cargo in the harbors located on the eastern coast of the Baltic Sea. Figure 5 shows the development in cargo turnover.
17 15 (152) Cargo turnover in eastern Baltic Ventspils Klaipeda Rostock Riga Tallin St.Peterburg Gdynia Leipeja Hamina Kotka Sw inoujscie Gdansk Figure 5. Annual cargo turnover in Eastern Baltic Ports in the period 1992 to 1997 (COWI, 1998) Oil handling The data received from the harbors show an annual turnover of oil and oil products in the Baltic Sea of approximately 160 million tons. Harbors handling more than 1 million tons of oil or oil products per year are listed in Table 6. Table 6. The largest oil harbours in the Baltic Region (Annual 1998, HELCOM 1998) Harbor Million tons oil handled in 1997 Harbor Million tons oil handled in 1997 Ventspils 27 Hamina 3.2 Brofjorden 21 Copenhagen 2.9 Gothenburg 17 St.Petersburg* 2.0 Porvoo 16 Nynäshamn 1.9 Fredericia 11 Aarhus 1.6 Kalundborg 8.1 Stockholm 1.4 Muuga* 7.2 Norrköping 1.3 Naantali 5.7 Malmo 1.2 Gdansk 5.2 Riga 1.1 Rostock 4.3 Tallinn* 1.0 Klaipeda 3.5 Gävle 1.0 *shaded figures have had the most significant changes since 1997 level It can be seen here, that the table above do not reflect the current development stage of St. Petersburg and Tallinn. In 2000 the oil transportation figures both St. Petersburg and Tallinn were around 9 Mton and 20 Mton (Port of Muuga and other Tallinn ports), respectively. The new oil terminal Primorsk of the eastern part of the Gulf of Finland, will change the transportation figures of the Gulf of Finland. After the construction phase to be completed in December 2001, the first phase figure would be 12 million tons, soon expanded to 18 million tons. The largest crude oil terminals in the Baltic and in North Europe are listed in Appendices 27 and 28 respectively.
18 16 (152) 2.4 Corridor development The bridge connection across the Great Belt was opened to the traffic in June This link has increased the vehicle traffic, and the traffic prognosis forecasts that this link will attract % of the existing volume of private cars crossing Kattegat and the Baltic Sea. Discussions have also been carried out to construct a new railway tunnel between Helsingborg and Elisinore. The most important maritime traffic links of the Oresund area are: - Fyn/Zealand-Scania-Latvia/Lithuania, - Rödby Puttgarten, Bridges are also under design for the links both between Zealand in Copenhagen and the Hamburg in northern Germany and a link crossing the Fehmarn Belt between Denmark and Germany. Southern Baltic Sea region offers direct links between Finland and Germany. The important services for Finnish export and import, but also transit traffic to Russia. Other links are: - Lithuania/Latvia/Russia/Belarus Germany, - Oslo region Gothenburg Denmark (Scania) Rostock/Saanitz Southern Germany Austria - Italy, - Oslo Travemunde/Rostock Western Europe, - Oslo Poland/Swinoujscie/Gdynia/Warsaw South-Eastern Europe, From the middle part of Sweden links and corridors are well established to Scania, Rostock/Sassnitz via Italy and Austria or to Travemunde/Rostock via Western Europe or Poland. The central Baltic Sea region covers the main links between Leningrad area Southern Finland Aland Swedish part near Mälaren/Bergslagen and Gothenburg. The Mälaren area has also links to Belarus and Latvia, which is an old route with a certain potential for growth in the future. One interesting link is between Finnish and Russian inland waterways using river going-sea going fleet. The integration to the West and Central European inland river and canal network is one challenging task to be developed. The traffic flow through the Baltic countries linking Finland to the Baltic states and Kaliningrad and Poland is called the Via Baltica corridor. Finally, the main corridor in the Gulf of Bothnia is between the Northern part of Sweden, mainly Umeå/Sundsvall, and Vasa in Finland. Figure 6 represents the main links of the Baltic Sea area. Baltic railways network is presented in Appendix 24.

19 17 (152) Figure 6. Main sea-borne corridors in the Baltic Sea region (Källström, L. & Ingo, S. 2000). There has been a lot of EU funded Interreg II C Corridor development projects where more detailed description of the maritime links are presented. The Figure 7 shows a map based on these studies, thus giving a view over the corridor studies of the Interreg program.
. 2.5 Tanker fleet The inquiry of the existing oil tankers was sent to the main oil terminals, and ports in the Baltic Sea.")
20 18 (152) Figure 7. A map showing an overview of links studied in various Interreg II C projects (Källström, L. & Ingo, S. 2000). 2.5 Tanker fleet The inquiry of the existing oil tankers was sent to the main oil terminals, and ports in the Baltic Sea. The calls concerning the data on the tankers for one month period was asked from St. Petersburg, Muuga, Sköldvik, Ventspils and Klaipeda. The following parameters were asked: - main characteristics, - hull (single hull or double hull), - name of the ship, - IMO number for further analyses, - owner, - destination (in & out), - cargo (degree of loading). Simultaneously the tanker data in the Baltic Sea was analyzed using the data of Lloyds for May The tanker data of the four weeks period in May 2001 was studied and the results are shown in Appendices 1-5.
21 19 (152) Summary of the analyzed data Table 7 below summarizes the defined tanker data and the average age of the tankers in the selected ports and terminals. When comparing with the data shown in Figure 8 (COWI, 1998) no essential development has been taken place since Table 7. A comparison between the main oil terminals of the Baltic Sea. Terminal August 2000 May/June 2001 Age (average) DH DB SH DH DB SH in years Muuga (Estonia) 39 % 22 % 39 % 48 % 17 % 35 % > 15 St. Petersburg 48 % 14 % 38 % 11 (Russia) Sköldvik (Finland) 42 % 27 % - 13 Klaipeda (Lithuania) not analyzed 20 % 13 % 67 % > 19 Ventspils (Latvia) not analyzed 37 % 23 % 40 % 13.2 DH means double hull, DB means double bottom, SH means single hull. Year of build for oil tankers, Figure 8. The distribution of tanker age according to (COWI; 1998).
22 20 (152) 3 Main Ports in the Baltic area 3.1 Finland In Finland the annual growth rate of GDP is expected to be in the order of 2.5 %, which will ensure the maritime growth rate will follow this figure. In the 1990s domestic waterborne cargo traffic has been around 7 million tons annually, and no major changes to this volume are expected. The total projected maritime cargo transport would be over 100 million tons in 2010 and will be near 130 million tons in The main international traffic routes are the Baltic Sea Route, the Nordic Triangle, The Corridor No. 9A (Helsinki St. Petersburg- Moscow) and the Via Baltica (Corridor No 1). The Baltic Sea Route is the basic sea route for Finnish industry, due to the fact almost all the transit traffic through Finland uses the sea route. About 90 % of Finnish seaborne transport is inside the EU countries. Roughly 58 % of import have its origin inside the Baltic Sea area, and 40 % of export the destination ports are in the Baltic Sea area. Biggest commodity groups in export have been paper, paperboard, sawn wood, general cargo and mineral oil while in import mineral oils, general cargo, coal, coke, ore and concrete. The annual development rate of the seaborne trade in Finland has been about 3.3. % in the All Finnish ports are ice-bound in normal winter. Northern ports in the Gulf of Bothnia are icebound approximately six months and ports along the Gulf of Finland for about three months. There are around 50 ports having international trade, and 23 of them are kept open throughout the winter by icebreakers. The inland ports are closed for traffic usually from the middle of January up to middle of March. Largest ports are Sköldvik, Helsinki, Kotka, Naantali, Rautaruukki, Rauma, Hamina, Pori, Turku and Kokkola. Sköldvik and Naantali are Fortum's oil terminals, thus important ports for the import of mineral oils. Helsinki is the largest container port, where the share between import and export are almost %. Helsinki is a large multipurpose port with handling of the unitized cargo. Rautaruukki handles ores and metals, and mainly serves the Finnish Rautaruukki steel company. Kokkola handles ores, minerals (fertilizers) and chemicals. Rauma and Pori handle mostly export of forest products. Kotka and Hamina were earlier known as transito ports, but aro also handling a lot of forest products, minerals and chemicals. The oil transito has been declined due to the oil transito boom in Estonia. There are a lot of expectations for the growth of the Kotka-Hamina ports, not only due to the new Mussalo Harbour in Kotka Port of Helsinki The Port of Helsinki is Finland's largest general cargo port and passenger harbor.it's market share is 39 % of Finland's imports and 18 % of exports. It is also Finland's largest container port, accounting for 54 % of incoming and 40 % of outgoing units. There was around calls in 2000 and the total transport has been over 10 million tons annually during the recent years. There are four harbors, and the maximum draught of the approaching fairway is 11.0 m. Three of the four harbors (West Harbor/cargo terminals, North Harbor and Laajasalo Oil Terminal) will move to the new Vuosaari harbor in The entire South Harbor and the ferry terminals of West Harbor will remain in their current locations.
23 21 (152) Sköldvik Fortum's oil harbour Sköldvik locates around 50 km east of the Port of Helsinki, and is the largest port in Finland, in terms of cargo turnover. The volume of the port has annually varied between 12 to 15 million tonnes, but exceeded 16,2 million tonnes in the year This was due to the increased import of the crude oil mainly. Of the total throughput, 3,2 million tonnes were shipped in coastal traffic (Sjöström, P, 2002) Port of Turku The Port of Turku is like the Port of Helsinki a multipurpose port. Passenger traffic and unitized cargo are the main issues. RoRo-traffic represents around 90 % of the freight ( TEU or million tons annually). The amount of passengers is around 4.0 million annually. The port contains ferry-, RoRo, Container and passenger terminals. The Train Ferry harbor is also close to the city, in Pansio. Approaching fairways are 10.0 m draught to the passenger harbor, and 9.0 m to the train ferry harbor. A new fairway "the Örö fairway" is under design and EIA process Naantali The capacity of the port of Naantali was utilized to its full extent in The total cargo volume reached close to 7 million tonnes, being 8 % larger than in the year Outgoing cargo went up by 15 % and incloming by 4 %. The entrance channel of the Naantali port will be deepened to the depth of 15, 3 m, thus the large tankers can enter the port in fully laden after the dredging works have been completed in Kotka and Hamina The ports of Kotka and Hamina are located in the south-eastern coastline of Finland near the Russian border. Kotka and Hamina were during the Soviet time known both as transito ports and export ports for forest products. After the disintegration of the Soviet Union the transito has decreased temporarily, but is assumed to grow again based on the forecasts of the growth of container traffic and forest products. Kotka is concentrated on exporting Finnish forest products. The total traffic volume of the Port of Kotka LtD grew almost 15,7 % in 2001 compared to the year The total cargo throughput was near 8,1 million tonnes, whileas the container traffic exceeded TEU. The main part of the port operations were shifted to the newest harbour, the Mussalo harbour: Its terminals accounted 55 % of the traffic volume in The new container terminal of Mussalo started in January 2001, having the annual capacity for TEU in the first stage and later around TEU. Almost all of the container traffic goes now through the Mussalo harbour (Sjöström, P, 2002). The approaching channels have draught of 10.0 m for the inner harbors and 15.3 m for the Mussalo Deepwater terminal. Port of Hamina is located 25 km east of Kotka, and is representing around 5.5. million tons annually. It is concentrated on ferry- and RoRo traffic, container traffic, liquid bulk transport and LPG. The approaching channel has a minimum draught of 10.0 m. The plans to widen the container handling capacity are underway. The construction of a new rail ferry terminal and the new approaching fairway with the draught of meters are also listed including to the ports investment plans until 2010.
24 22 (152) Raahe The municipal port of Raahe and the industrial port owned by Rautaruukki totalled 6,2 million tons in The increase compared to the year 2000 was 2,1 %. The deepening of the entrance channel to ten meters belong to the governments new fiarway masterplan, and is scheduled to the years Shipping statistics The term shipping statistics is used for statistical returns on the transport of cargo and passengers by sea between Finland and foreign countries as well as statistics on vessels in international traffic calling at Finnish ports. The Finnish Maritime Administration has produced shipping statistics since The purpose of the statistics is to serve the makers of shipping policy as efficiently as possible by generating statistical information for their use in planning, monitoring, supervision and decision-making. Industry, trade, research and the shipping industry also need statistical data on shipping. The shipping statistics cover all cargo that is loaded or unloaded in Finnish ports, including transit cargo en route to third countries (Table 8). Cargo loaded in vehicles and containers is reported also separately. Statistics on pure transit traffic are also given separately. The statistics on passenger traffic cover all passenger movements on passenger vessels and passenger/car ferries as well as passengers travelling on cargo vessels that regularly carry passengers. Passengers on cruise liners that call at Finnish ports are counted as both arriving in and departing from Finland. The tonnage of the vessels in the vessel traffic statistics is given in net figures as most navigation charges (including fairway charges, pilotage and harbor dues) are set according to the net tonnage. Finnish Maritime Administration collects data and maintains shipping statistics according to law on Finnish Maritime Administration 1248/1997. Table 8. International cargo traffic through Finnish ports in 2001 [tons](sjöström, 2002 and Finnish Maritime Administration). Port Throughput 2001 In Out Total Hamina 1,072,334 3,150,737 4,223,071 Kotka 2,035,263 5,968,687 8,003,950 Loviisa 407, ,751 1,135,053 Isnäs Tolkkinen 134, , ,754 Sköldvik 8,460,379 4,569,184 13,029,563 Helsinki 5,583,200 5,036,098 10,619,298 Kantvik 479,179 28, ,717 Inkoo 1,252, ,141 1,573,334 Pohjankuru 132, ,321 Lappohja 3, , ,879 Koverhar 977, ,864 1,103,577 Hanko 803,276 1,383,032 2,186,308 Turku 2,005,967 1,681,853 3,687,820
25 23 (152) Taalintehdas , ,388 Kemiö 42,895 13,206 56,101 Parainen 602,563 57, ,430 Naantali 4,278,748 1,397,706 5,676,454 Marienhamn 72,399 46,948 19,347 Färjsund 20,686 89, ,180 Uusikaupunki 496, ,449 1,209,84 Rauma 1,359,260 3,943,767 5,303,027 Eurajoki 84,221 94, ,754 Pori 3,135,990 1,571,407 4,707,397 Merikarvia 4,800 4,800 Krisiinankaupunki 531,500 11, ,460 Kaskine 455, ,938 1,105,210 Vaasa 1,011, ,693 1,266,299 Pietarsaari 408, ,243 1,027,516 Kokkola 1,197,477 1,749,873 2,947,350 Rahja 40, , ,385 Rautaruukki 4,499, ,056 5,253,576 Raahe 7, , ,866 Oulu 810, ,488 1,554,018 Kemi 946,324 1,254,420 2,220,744 Tornio 310, , ,919 Other seaports 230,477 38, ,856 Lappeenranta 498, , ,640 Joutseno 126, , ,662 Imatra 58, , ,868 Savonlinna 19,638 1,418 21,056 Varkaus 194, , ,619 Kuopio 20,685 46,018 66,703 Kitee 10,925 69,342 80,267 Joensuu 20, , ,186 Other lake Saimaa 55,518 9,491 65,009 Grand total 44,903,642 39,637,782 84,541,424 Whenever a Finnish or foreign vessel engaged in international shipping arrives at or leaves a Finnish port, its captain or, as is more often the case, its agent is obliged to supply the Finnish Maritime Administration with information on the vessel and its cargo according to the ports where it was loaded or unloaded. The information is given as an EDI-message or on an arrival/departure notification form. These data are supplemented by reports sent in by the port authorities. Currently the data is collected within the framework of the nation-wide Portnet system. In all 84, 5 million tonnes of cargo were carried by ships between Finland and other countries in This was 3,9 million tnonnes more than in year The export through Finnish Ports was 39, 6 million tonnes. If the transito traffic will be excluded, the export rate was around 35,6 million tonnes, thus showing small decrease compared to the year The Import mode totaled 44,9 million tons including transit. The total amount of the transito traffic totaled 5,7 million tonnes in 2001, which was the highest annual figure in Finland so far. The increase was more than 2,3 million tonnes compared to the year 2000.

26 24 (152) 3.2 Russia General The total throughput of the Russian ports was 120 million tons in The share of the Russia's main Baltic ports, St. Petersburg and Kaliningrad, was about 22 %, whereas the ports in the Black Sea represented more than 50 %, Far Eastern ports 18 % and the rest were due to the Far Northern ports, around 8 % of the cargo. Taking into account the large figures of the Russian transito handled by the Baltic States, it is evident, that in spite of the apparent larger volume through the Black Sea, the Baltic Sea has a great importance for the Russian trade and transport. Russia will increase the oil production to approximately 340 million tons in 2001 (Figure 9). In 2000 the oil production rate of Russia was million tons, 5.9 % more than in 1999 (Interfax, ). Figure 9. The development of the Russian net oil export in (Arentz, 2002a) St. Petersburg Sea Port The Port of St. Petersburg is divided into four areas: - Gutuevsky Kovsh along the Neva River, - Sea Channel & Barochny Basin, - Lesnoy Mole and - Coal Harbor. Dry bulk and general cargo are handled in the Gutuevsky Kovsh Harbor, while cellulose, paper and fertilizers are handled in the Harbor along the Sea Channel. Lesnoy Mole is the main container terminal, which also handles general cargo, coal and metals. Coal harbor is also handling a significant amount of oil products. In 2000 the figures of oil transportation of St. Petersburg Sea Port exceeded 8 million tons (Figure 10). The total port throughput in 1999 was 28 million tons, 31 % more compared to the year 1998 (Table 9).
27 25 (152) Table 9. Cargo Traffic in St. Petersburg in 1999 (St. Petersburg Port Authority, 2000). Oil products 7,354 Million tons, 27 % Metals 6,520 Million tons, 23 % Timber 1,930 Million tons, 7 % Container 2,835 Million tons, 10 % Reefer 1,214 Million tons, 4 % Bulk cargo 3,233 Million tons, 11 % Chemicals 3,757 Million tons, 13 % Others 1,331 Million tons. 5 % TOTAL 28,174 Million tons. 100 % The draught of the approaching fairway is 11.0 m. There are plans to widen and deepen the fairway. Other major investments will be the new container terminal on berth 101 of the Coal Harbor, handling complex for universal and food goods, reefer terminal and modernization of container terminal of the Area 3, fertilizer terminal reconstruction and reconstruction of roads of the port area. A new fertilizer terminal has been constructed in St. Petersburg Sea Port. The Baltic Bulker Terminal has a projected capacity of 5-7 million tons per year. The storage capacity for potassium warehouse is tons, and the nitrogen-phosphate warehouse is tons. The new export pipeline to the Primorsk port will be constructed in together with the new oil product export terminal. (Reuters, ). The new km long pipeline have a capacity of 10 million tons of oil gas per year. Russia exported 60,82 million tons of oil products (excluding crude oil) in In 2001, however, the total oil product export figure was 70,43 million tons. There are also proposals to start produce oil off the Kaliningrad. The Russian oil company Lukoil has published a plan to open a new oil field having the estimated crude oil capacity of 21, 5 million tons. The annual production rate would be tons per year during the first years. Lukoil has also started design phase of a new oil terminal of Vysotsk harbor. The new terminal under design will have the capacity of 10 million tons in the first phase with the design tanker of dwt. The fairway leading to the port, however, is narrow and shallow, thus the fairway maintenance works would require a lot of work to reach the required safety aspects for the safe tanker traffic. Moreover the sea area off the harbor is affected by the ice ridges during the winter time, which will cause additional harm for the traffic management. The new oil terminal would be opened for the traffic in the late Primorsk oil terminal accepts vessels meeting following requirements: draft max 15.0 m, LOA max 307 m and beam max 50 m. All the ships must have double hull and segregated ballast water tanks. In certain cases double-bottom tankers are allowed to enter with obligatory tug assistance from Rodsher Island to the port. Furthermore there are a set of other rules concerning the winter navigation, pilotage and routing. The main port of Eastern GoF is St.Petersburg Sea Port ( Figure 11). In 2000 there were 9771 ships calling out St. Petersburg Sea Port. The port handled 32.1 million tons of cargo in 2000, which was 14 % more than in 1999, and 49 % more compared to The port handled more than 8 million tons of oil products. River Neva connects the inland water system with sea. 40 % of vessel passes observed on St.Petersburg approach channel are the
28 26 (152) sea-river ships which are bound for West Europe ports. This quantity includes approximately 750 of sea going inland tankers. The annual volume of ship movements is approximately cruise vessels visited St. Petersburg in Main stevedoring companies in St.Petersburg are presented in Table 10 below. Table 10. Main Stevedoring Companies in St. Petersburg Sea Port (St. Petersburg Port Authority, 2000). Name Holding JSC "Sea Port of Saint Petersburg" Close JCS "First Stevedoring Company" FirSteCo Close JSC "Second Stevedoring Company" Close JSC "First Container Terminal" Close JSC "Fourth Stevedoring Company "FStC Close JSC "Stevedoring Timber Company" CJC "Neva Metal" Private Stevedoring Company "Barbaletta" Open JSC "Baltic Ship Mechanical Plant" Stevedoring Company "Nevsky Gates" Petrolesport (Timber Port) CPSU Plant with VIKAN ltd. JSC St. Petersburg Oil Terminal Note largest company, more than 20 million tons annually. berths 14-41, metals, fertilizers, paper, containers, bulk & reefer berths 1313 m, draft 9.8 m and 11.0 m, 23 cranes handles 33 % of the containers arriving Russia via Baltic Ports. Berths Deep water berths 102&103 at Coal Harbor. bulk cargoes, coal, scrap metal, potash, fertilizers.. Berths 67,69 and 70 on Timber Harbor. handling capacity m3 per day of round timber. berths on Timber harbor. Ferrous metals. since 1993, two deep water berths, sea cargo & refrigerated goods construction and repair of vessels Berths 16 and 17, general cargoes, food, containers over 100 hectares, sawngoods, sheet goods, paper, cellulose, containers, reefer cargoes, scrap metals, chemicals 380 m berth, draught 7.5 m. foods, non-foods m3 storage capacity. pipeline connections to "Kirishinefteorsyntez" Nowadays the port has 53 berths, with the total length of 8393 m, and can accommodate vessels not exceeding the following dimensions: 260 m length, 40 m width, 11 m draught in fresh water. The port operates 24 hours a day the year round. In winter, when the Gulf of Finland is covered with ice, pilotage is effected by icebreakers. The port of St.Petersburg is managed by the Maritime Port Administration (MPA), a state body attached directly to the Maritime Administration of the Russian Ministry of Transport. There are 28 stevedoring companies licensed to handle the cargo in St. Petersburg. The approaches to the port of St.Petersburg stretch for the Eastern part of the Gulf of Finland. The Gulf is limited with islands and shallows at close distances to ship routes. Essential features of the Gulf are the stormy winds, fog and precipitation in autumn, the snowfall and ice in winter. Environmental vulnerability of the region is strengthened with the presence of the Nuclear Electric Power Station (NEPS) in Sosnovyi Bor town (100 km from St.Petersburg) which is situated in the vicinity of the main fairway.


29 27 (152) Figure 10. The oil terminal of St. Petersburg sea port. Figure 11. Plan of the St. Petersburg sea port (Port Authority). Main development plans of the near future are: - dredging works of the approaching fairway, - reconstruction of berths No for metal and fertilizers, throughput 1.4 million tons annually, - reconstruction of berth No. 70 for metal handling, - fertilizer terminal, berth No. 107, 2 million tons annually, - oil terminal construction with throughput of 9.6 million tons annually, - container terminal, berth 101 with throughput of TEU, - berths 42/43 of perishable cargo with the annual throughput of tons and
30 28 (152) - development of safety system for navigation, VTS. The cargo operations in St. Petersburg sea port are going year round. During the open water season, (May November) river-sea going tankers of dwt can transport oil along the Neva river. These tanker will be unloaded to the dwt tankers. In 1999 the number of seariver tankers was 818 of which sea tankers corresponded 150. For the year 2000 the amount of 4 million tons of mazute oil was planned to export. The total amount of oil products in 2000 exceeded 8.1 million tons in St. Petersburg, and the throughput of the oil terminal only (Emelkina, 2000) Kaliningrad The Port of Kaliningrad (formerly Königsberg) was opened for the international vessel traffic in the beginning of 1990s. The port areas are connected to the Baltic Sea by a 42 km long channel. Kaliningrad's annual throughput, around 5 million tons, consist of break bulk (49%), general cargo (35 %), timber (18 %) and grain (7 %). Containerization has in rapid growth, and exceeded already TEU in 1998.The total capacity of the Port is varying according to different sources between million tons, thus there is a lot of reserve for the growth. Optimistic scenarios have made forecast up to million throughput in the near future. Maximum draught to the port is 8.0 m. The location of Kaliningrad, some 400 kilometers from Russia and near the Port of Klaipeda of Lithuania has been a complex issue in politics. The Kaliningrad needs a land route to Russia, which goes via Belarus and Lithuania Other Russian ports in the Gulf of Finland area The Ports of Vyborg (Appendix 20) and Vysotsk (Appendix 21) are situated around 60 km to the east from the Finnish border. Both ports are export oriented; Vysotsk with coal and iron pellets, Vyborg with scrap metal, paper and timber. Altogether these ports equals around million tons annually. New plans to build up new chemical terminals and deepening the approaching fairways, the throughput will be increased by one million ton each. Primorsk oil terminal (Appendix 18) was opened to the traffic in late December in The first construction phase consisted of a berth for two dwt tankers and storage capacity. The second phase was started officially in to increase the first phase capacity 12 million tons annually to 18 million tons. The Russian plan is to widen the terminal area up to 2010 so, that the oil export will be 45 million tons annually. According to the Russian future plans the terminal area will also consist of terminals for trans-shipment of bulk, general cargo with the designed capacity of 5.3 million tons. The second stage of the Baltic Pipeline system (BPS) will increase the capacity up to million tons annually. The new 720 mm diameter oil pipeline is 245 km including three pumping stations. The pipeline will be modernized in Yaroslavl Kirishi. The tank capasity is m 3 (Interfax, ) in Primorsk. After completion of all the project phases the annual output of the Primorsk oil terminal is expected to be 36 million tons annually (Ria Oreanda, ). The Primorsk oil terminal will later to be extended by other terminals. Russian ZAO (severnij gazopererabativajushij zavod) has published general plan to build up a gas terminal to the southern bank of the Jermilov Bay, around 2 km south from the Primorsk oil terminal. The new gas pipeline would be led to the terminal, and its first phase will cover one million tons of gas annually. The
31 29 (152) plan includes also an ammonia terminal of one million tons capacity in the first phase (Delavoi Petersburg ). After the Primorsk Oil terminal has been constructed discussions have started in Russia to build up the second oil terminal to Batareinya bay (Appendix 23). This proposal has been presented already ten years ago, with the planned capacity in the first phase 7.5 million tons and after completed 15 million tons annually. The first phase of oil export would be taken care by rails, and later by pipeline. The Ust-Luga Coal Port has been under construction for few years already and a part of the planned activities have been started. The design throughput is 35 million tons of cargo per year, mainly consisting of coal export but also chemicals, sugar, timber and grain and container handling. New harbors will be built in Lomonosov and in Luzhskaja Guba. The draft lay-outs of these ports are shown in Appendices 19 and 22 respectively. 3.3 Estonia The development of maritime transport in Estonia has been rapid. For example from 1995 to 1999 the increase of the annual transport rate was doubled. More than 90 % of the transit via Estonia and a major part of the cargo imported to or exported from Estonia goes through the Estonian seaports, and most of this cargo is handled in ports of the Port of Tallinn ltd. In 1999 more than 32 million tons of cargo was handled in Estonia. The international corridors affecting of the development of the Estonian maritime transport are the Crete Corridor No.1 of the Pan-European Network with its East-West branches 1A and 1B running through Estonia. There are certain national objectives defined in the Transport Development Plan for The increase of the Gross Domestic Product is one of the main item, which will raise the competitiveness of the economy (Moppel, 2000). The export of transport services plays here an important role. In Estonia the most intense traffic is concerted in the Tallinn region. The total number of vessel movements in the Tallinn bay is around 60 per day. Majority of the vessels are small ones < 500 GRT and medium size vessels 500<GRT< Other significant groups are fast ferries and passenger ferries. Old City port handles about 65 % of all traffic in numbers of ships. In Paldiski there are no plans to unite any ports, which has been the development trend for example in Bekker harbor in Tallinn. The rapidly developing Paldiski South harbor falls under the Port of Tallinn. In 2001 the Oil Company Alexela opened oil terminal there, and this year a ro-ro terminal will be completed (Vitismann, A. 2002a). The northern part of Paldiski needs a lot of investments. There has been speculations this part of the port to be concentrated on the export of fertilizers and shale oil and timber. In Tallinn, the timber stacks in ports are the smallest. The Vene-Balti port mainly serves the needs of fuel transit. In the Loksa harbor, timber is also just a side activity, as they mostly tend to the needs of the Loksa shipyard, as can be seen from the Table 11.
32 30 (152) Table 11. Cargo turnover at Estonian port in 2001 (Vitismann, A. 2002a). Port Ships Cargo Passengers Pärnu sadam Pärnu shipyard Roomassaare Virtsu Lehtma Heltermaa Rohuküla Paldiski South harbour Paldiski Northern harbour Bekkeri Vene-Balti Paljassaare Tallinn City Port Old City Port Miiduranna Muuga Loksa Kunda Despite the fact that large operators are located in Muuga, oil is also loaded in Tallinn's Vene-Balti, Paljassaare, Miiduranna and Paldiski South Harbour. Miiduranna port handled more than 1,6 million tons of oil in 2000 which was nearly 70 % of the total cargo turnover of the port. The Port of Aseri, close to the the Russian border will be build for transit of oil, too. A port handling oil, chemicals and containers with a projected total business of 10 million tons is planned to be built in Sillamäe (Vitismann, M. 2002a). A new passenger port is also under design at the Narva Jõesuu close to the Russian Border, too. The calls in Kopli Bay are approximately 20 per day. Vene-Balti takes 45 % of the traffic (bigger vessels), Meeruse Port about 43 % (small vessels) and Bekkeri port the rest 12 %, mainly smaller vessels The development of the Port of Tallinn The Port of Tallinn is one of Estonia's largest enterprises. It accounts for 78 % of the total volume of business in Estonia. However, the state-owned public limited company, Port of Tallinn, owns just two of the four ports in Tallinn the Paljassaare Harbour and the Old City Harbour. Together with the associating partner companies it contributes around a fifth of the national gross product and plays a significant role in securing economic development of the entire country. The Port of Tallinn consists of four harbors. The largest harbors are the Old City harbor dedicated for the passenger liners, and the Port of Muuga, a large oil and fertilizer harbor. Muuga harbor includes six oil terminals, dry bulk and general cargo terminals, a Ro/Ro and container terminal, reefer terminal and storage areas for vehicles and timber.
. The area is of 56.6 ha. The harbor water basin area is 35.9 ha.")
33 31 (152) The Old City Harbor is the main passenger terminal, but also provides RoRo and LoLo services, and has a container and general cargo terminals. The Old City harbor has 23 berths, four passenger terminals, general cargo and container terminal (Appendix 8). The area is of 56.6 ha. The harbor water basin area is 35.9 ha. The passenger rate was near 6 million passenger in 2000, Moreover, there is a special fast catamaran link between Helsinki and Tallinn. Last summer there were more than 30 calls of passenger vessels each day from the Port of Helsinki to Tallinn. Half of these vessels are high-speed craft having a maximum speed up to knots. The fastest one has a top speed of 55 knots. Muuga Harbor (Appendix 9) handles liquid and dry bulk, general and reefer cargo, and has a new RoRo terminal with container handling capacity. It also has storage areas for vehicles and timber. Paljassaare harbor has terminals for liquid and dry bulk and general cargo, including reefer complex. Smaller harbors are Paljassaare Harbor and Paldiski South Harbor. The Paldiski South harbor lies westwards of the Old City area, as shown in Figure 12. Paldiski harbor has an area of 55.2 ha. It is a former Soviet naval base, which was incorporated into the port complex of the Port of Tallinn in Today Paldiski harbor handles mainly metal, fertilizers, peat and RoRo cargo. It has a regular liner connection to Sweden. It has 5 berths and a potential to increase the cargo turnover to 3 million tons per year. Its warehouse area is m 2 and the open storage area m 2. Paljassaare harbor, located on Paljassaare peninsula was originally built for the Estonian fishing fleet. Today it is a cargo port specialized in handling mixed cargo, coal and oil products, as well timber and perishables. the storage capacity of the port contains warehouse area m 2, open storage area m 2, oil tank capacity m 3 and reefer warehouse area m 2. Inside the Tallinn Bay there are a large groups of ports with different business fields: Vanasadam, Piritasadam, Aegna, Patareisadam for passenger traffic, Miiduranna, Merivälja kai, Lennusadam, Peetri sadam, Paljassaare for merchant, Miinisadam for Navy and Hundipea for ENMB hydrography. Figure 12. The location of the Tallinn main harbors (Port Authority).
34 32 (152) The fourth port in the Tallinn port area is the Vene-Balti. The principal dimensions of these four ports are presented in Table 12 below. Table 12. The main ports and the maximal ship dimensions in Tallinn. Port length [m] max beam [m] max draft [m] Muuga Paljassaare Tallinn Bay Vene-Balti The total transportation rate in 1999 was around 34 million tons. The amount of oil exported was around 20 million tons. The Muuga harbor represented alone near 13 millions tons of oil (export) and tons of oil import. Other ports, i.e. Miiduranta, Paljassaari and Kopli equaled around 5 million tons. New oil terminals are under the planning phase in Sillamae, Aser and Kunda. The oil tanker size in Muuga harbor has increased from the average tons in 1998 to tons in 1999 and was already over dwt in May, The Muuga harbor handles 70 % of the total cargo through the Port of Tallinn, and more than 90 % of the transito traffic. In 2000, 20,4 million tons of cargo was handled in Muuga of which 15.9 million tons was oil products. In 2001, the amount of oil products was already 18,6 million tons (Ympäristöministeriö, 2002). There are six oil terminals in the Muuga port and new terminal with the annual 4 million tons increment is under design. Furthermore, Muuga port includes dry bulk and general cargo terminals, a RoRo (Figure 13) and container terminal, reefer terminal, grain terminal and storage areas for vehicles and timber. The territory of Muuga harbor is 367,3 ha with the water basin of 752 ha. The size of the oil terminal is 40 ha. In 2000 the cargo handled in Muuga was 20,4 million tons of which petroleum and oil products consisted of 15.9 million tons. The largest oil terminal in Muuga is Pakterminal, which handled around 8.5 million tons of oil products in Other oil terminals are Oiltanking in Muuga which handles light products, E.O.S in Muuga and ScanTrans in Paljassaare (heavy fuel), Eurodek in Muuga and its subsidiary Dekoil in the Vene-Balti handling both crude oil and heavy fuel oil, Milstrand in the Miiduranda port with diesel oil and Neste and Nybit which are only importing fuels (Arentz, 2002a).

35 33 (152) Figure 13. New pier for the RoRo terminal of the Port of Muuga under construction, summer The total number of movements in Muuga bay are near 30 per day. A large number of vessels are > GRT cargo vessels and tankers. Estonia and Russia are also exporting paper-wood to the Swedish paper industry which is mainly located along the coastline. The annual transport rate is close to the 5 million tons by small coastal ships and barges. In 2000, the Tallinn port handled 29.4 million tons of cargo, from which transit (21.9 million tons) constituted the main part. Compared to 1999, the throughput has increased by 10.8%. By the increase of total cargo throughput the Port of Tallinn holds one of the leading positions in the Baltic Sea region. This serves as a confirmation of the favorable geographical location of the port in relation to the Russian raw materials market and of the competitiveness of our service as compared to the other ports of the region. Liquid bulk presented 60.7% of the cargo volume passing through the Port of Tallinn in Compared to the previous year, the handling of liquid cargo has increased by 22.8% - by 3.3 million tons. The share of break bulk was 27.3% and dry bulk 11.6%. The volume of containerized cargo reached TEU, which is 17% more than in In 2000, noticeable increase was observed in the export of peat (51.6%) and transit of coal (69.5%). By cargo direction transit constituted 74.8 %, export 14.9% and import 10%. Compared to 1999, the volume of transit cargo increased 8.4%, export 28.4% and import 10.9% ( The Port of Tallinn handled 32,32 million tons in 2001 which was more than 10 % larger than in The number of containers handled in 2001 was TEU. Most of the cargo turnover was taken care of the Muuga Harbor. According to the pessimistic forecast of the Port of Tallinn the total cargo turnover will reach 38 million by 2010, while the optimistic forecast predicts over 70 million tonnes. The amount of passengers will stay in the current level of near 6.5 million or drop slightly (Figure 14).
36 34 (152) Passenger traffic FIN-EST departures arrivals Figure 14. The development of passenger traffic between Finland and Estonia. 3.4 Latvia General The main transit flows through Latvia are in the east-west direction. The three main sea ports are Ventspils, Liepaja and Riga. These have a good railway connections to Estonia (Tartu), Russia (Pskov, St. Petersburg, Moscow), Belarus (Vicebck) and Lithuania (Siauliai, Panevezys, Vilnus). They also have special economic conditions of free ports and free economic zones, which have encouraged the investors to develop port infrastructures. More than 80 % of the cargo is going in the east-west direction. In the North-South direction the traffic is mainly going through the Crete Corridor No 1, i.e. Corridor Via Baltica. Transport and communications sector is one of the priority sectors of the Latvia's government. In 1997 it accounted for 16.8 % of GDP, and 35 % of direct international investment. The National Program on Transport Development for the period is based on the sustainable development, but in the short term development the main emphasis is put on the modernization of the domestic transport infrastructure. Due to the fact Russia is building up new oil terminals (Primorsk, Batareinyaya) and reconstructing existing ports, the role of the Baltic ports as main transito links may be endangered: part of the current transito may be handled in the Russian own ports and terminals in the future. However, the special economic conditions, modern facilities and advantageous climate for investments may keep the business running ahead. The Port of Ventspils do not see Russian new oil terminals in the Gulf of Finland as a threat to the oil transito business. The growing oil production rates in Russia, especially in the Caspian area, keep the port authority confident in the future. Furthermore, Ventspils has lowered the transito fees in order to maintain the competitiveness (Finnish Embassy, 2002). Ventspils port is trying to maintain its position as one of the leading ports in the Baltic Sea and is investing to the new container terminal having the capacity of TEU annually. Also the oil transito will be supported by expanding the oil throughput capacity by a new company JSC "Western Pipeline System".
37 35 (152) The Latvian Marine Administration has considered the problem of increased tanker traffic which would result from the Primorsk terminal and have identified the following environmental concerns: an increase in legal discharges of operational wastes from tankers and the probability of failure of on-board pollution prevention equipment; the probability of an increased incidence of illegal discharges of oily sludge and oil cargo residues, including supposedly segregated ballast water contaminated with oil cargo due to leakage; the potential hazards of polyaromatic hydrocarbons and emissions of volatile organic compounds; threats from the transportation of heavy fuel oil and persistent oils. Owing to the prevailing wind direction (north and north-west), Latvia's coast and related interests are particularly susceptible to any incidents occurring off its coastline. There are also proposals in Latvia to have a new oil terminal in Riga to be in operation in This proposal made of the Latvian Dinaz oil company has a design capacity of 10 million tons of refined oil annually. The development of the Port of Riga is very closely dependent on Russia. The cargo turnover of the Freeport Riga was 13, 5 million tonnes in 2000, but rose over 14,8 million tons in 2001 as can be seen from Table 13. The total throughput of the Latvian ports was more than 56 million tonnes in It is expected, that especially the passenger figures of the Port of Riga will be increased in the future. In 2002 new lines were started to Nynäshamn and Helsinki, and new lines are planned to Saaremaa and Germany. Table 13. Cargo turnover at Latvian ports in 2001 (Vitismann,M. 2002b). Port Ship Calls Cargo [ton] Passengers Liepaja Pavilosta Ventspils Roja Mersrags Engure Lielupe Riga Skulte Salacgriva TOTAL Ventspils The ice-free port of Ventspils is the leading export port on the Baltic Sea. The transit cargo turnover of the port was 34,1 million tons in 1999 which ranks Ventspils Free Port among the 15 leading European ports. In 2001 the cargo turnovers was 37 million tons.the traffic capacity of the port is more than 80 million tons. 15 % of the total volume of oil and oil products exported from Russia are transshipped through the port of Ventspils. Twenty per cent of world potash, 10 per cent of the ammonia and 14 per cent of Russian oil exports have gone through the Ventspils port annually. Oil forms around 80 % of the total throughput of the cargo, which is the reason for Ventspils Nafta being the largest port operator (Vitismann, M. 2002b).
38 36 (152) The cargo turnover of the Port of Ventspils has already reached 35 million tonnes annually during the last six years. Pulp wood has decreased by a fifth in one year in 2001, wood ships, however, have tripled. The total capacity of the Ventspils port might be even 60 million tonnes annually, but due to the Russian new terminal developments this figure is a very unlikely to be reached. Over two thirds of Latvia's cargo is going through Ventspils. The "Law of Ventspils Free Port" was established in 1997, which have given the exemptions for certain companies of customs duty, tax and VAT. Ventspils is mainly the transito port for oil products. In 1998 more than 72 % of the total throughput of 36.5 million tons was oil. Other main products are bulk cargoes (14.4 %), general cargoes (9.5 %) and liquid cargoes (3.5 %). Ventspils takes part of 15 % of Russian Crude oil and can take large tanker up to dwt to the port. There are 60 berths in the port, and the maximum draught of the ship is 15.0 m (Appendix 11). In 1998 almost calls per year. Enormous changes have taken place in the port during the last years. After the completion of the reconstruction and modernization works, the services and equipment of the port correspond to modern technical, safety and environmental protection standards. After the completion of the dredging works in the sea entrance channel and the port area, the largest vessels capable of entering the Baltic Sea can be accepted by the port. The Ventspils Free Port development program plans to increase the port capacity up to million tons per annum by the year The crude oil and oil product transshipment terminals form the largest terminal complex on the Baltic Sea. There are six berths for the transshipment of crude oil and oil products with maximum capacity of 65 million tons per annum. The maximum permissible vessel draft at the oil product berths is 15 m. The transshipment takes place at the jetties where simultaneous loading of six tankers of DWT can be done. The total tank farm capacity exceeds m 3. There are 5 railway platforms, the local pipeline network of the terminal complex, pump stations and many other auxiliaries that ensure an effective servicing of tankers. The companies Ventspils Nafta and Ventbunkers operating within the terminal complex can annually transship approximately 30 million tons of crude oil and oil products. The liquid chemical transshipment terminal is the largest of its kind in the Baltic Sea Region. The company Ventamonjaks operates in the terminal. There are three berths of 12.5 m maximum permissible vessel draft for the transshipment of liquid chemicals. The total throughput capacity of the berths is 2.7 million tons. 1.4 million tons of liquid chemicals were transshipped in The common carrier pipeline system within Latvia, operated by the Latvian-Russian joint venture LatRosTrans, is the most important component of the Latvian Oil Transit Route. The pipeline system is an interdependent, high technology network with integrated maintenance, telecommunications, and fire-safety systems. Three pipelines two for crude oil and one for petroleum products cross Latvia. - The Polotsk-Ventspils pipeline was put into operation in The total length of the pipeline is km of which 334 km are in Latvia. The capacity of the pipeline is 16 million tons annually or 45.7 tons per day. - The second pipeline, Polotsk-Birzai-Mazeikiai, was constructed to supply the Mazeikiai oil refinery. The capacity of the pipeline is 16 million tons annually. The pipeline runs parallel to the Polotsk-Ventspils pipeline along the Polotsk-Birzai segment.
39 37 (152) -The oil product pipeline, that runs parallel to the Polotsk-Ventspils crude oil pipeline, was put into operation in The capacity of the pipeline is 4.03 million tons per year. Ventspils has seen tremendous changes during the last years and the city has regained its historical role as a leading east-west transit centre. The Ventspils of today is a world class port and the leading port on the Baltic Sea Dry cargo terminals The potash transshipment terminal is the second largest in the world, through which 20 % of the world potash trade is shipped. The terminal is leased to the company Kalija Parks. There is one berth of 14.1 m maximum permissible vessel draft. Capacity of the terminal is 5.5 million tons per annum and with the completion of reconstruction works the capacity will reach 7.5 million tons. 5.2 million tons were transshipped through the terminal in The general cargo terminals have 14 berths of m depth. The terminals occupy a territory of 260 ha. The companies Ventspils Tirdzniecibas Osta, Ventplac, Enkurs, Kalija Parks, Nord Natie Ventspils terminal, operating in the terminals transship metal, wood and timber, fruit, sugar, frozen products etc Riga The port of Riga represents around 13 million tons throughput of which 62 % was general cargo, 38 % dry bulk and 16 % liquid bulk. Port of Riga is the main port of Latvia for the general cargo. The port is specialized on ferry and RoRo traffic and bulk transports. The amount of containers was more than TEU in The approaching channel has a minimum draught of 10.0 m. The approaching channel will be widened and dredging projects are under construction to deepen certain terminal areas. The Riga port is located along a 15-kilometer stretch on both shores of the Daugava River (Appendix 10). The port covers a total territory of 1,036 hectares. The total length of the port's berths is 12,662 meters. The port is open for shipping throughout the year and in all seasons. Approximately 80% of cargo turnover at the Riga port involves the shipment of transit freight to and from the countries of the CIS. More than 30 stevedore companies offer their services at the Riga port. The main types of cargo are general cargo, containers, various metals, wood, coal, mineral fertilizers, chemical cargoes, oil products and food products. A planned reconstruction of the port will allow the port to handle up to 20 million tons of cargo each year. The Riga port is a member of the European Sea Ports Organization (ESPO) Port of Liepaja The Port of Liepaja (Appendix 12) is part of the Liepaja free zone, where 13 stevedore companies and 11 vessel agents operate. It was a former military port during the Soviet time, but has rapidly transferred to the business oriented port. It is growing fast due to the status as a special economic zone. The cargo throughput of the port has gradually increased exceeding the 3 million tonnes of level in the year Largest items are metals, timber and liquid cargo. The share of grain and wood chips has also increased substantially The port has RoRo connections to Sweden, Denmark and Germany. There are a lot of investment plans in a long period: to dredge the approaching
40 38 (152) channel deeper (i.e. from 8.5 m to 11.0 m), reconstruct the road network, which in this very moment is rather poor, establish new terminals for bulk and containers, railway improvements and general port improvements. In March 1997, the law about Liepajas Special Economic Zone (SEZ) was accepted. Nucleus of the SEZ is the port, which becomes a Freeport. SEZ also includes the most important industrial areas and transport junctions - railway, international airport, and warehouses. Consequently, considerable tax allowances and simplified customs procedures are available. It should be stressed, that operation of Liepaja port as a commercial port is being formed from the start, therefore it is unknown for many of potential partners. Yet it is possible to provide the prospective partners with the most suitable and efficient specialization. Owing flexible organization the port will be convenient also for the companies forwarding small amounts of cargo. In Latvia the maritime transport figures are expected to double between the end of 1990s and Especially the Port of Liepaja is expected to grow significantly, up to 14 million tons in National forecast for the transport figures of the Ventspils oil terminal show up to 75 million tons annually in However, due to the new Russian oil terminal constructions, it is likely that the amount of oil handled in Ventspils will not grow so rapidly, even if more capacity will be designed and constructed. 3.5 Lithuania General Lithuanias main ports are Klaipeda and Butinge's oil terminal. It is bordered by Latvia, Belarus, Poland and Kaliningrad area. Klaipeda has good links to highways, to Via Baltica and Crete Corridor 9 and good railway connections. The main policy of the port authority is to link the port well to the existing European transport network. The east-west traffic corresponds 85 % of the total transport. Butinge oil terminal was opened in July It is located near the Latvia-Lithuania border. The terminals loading principle is the loading buoy, which has proofed to be sensitive for oil spills: two major hazards have been taken place, the latest in the end of Butinge oil terminal had the throughput of 3 million tons of oil in 2000, and has the capacity of 8 million tons annually. In Lithuania, the strongest development will take place in Klaipeda port. The port authority expects the port will handle more than 31 million tons cargo in 2010, and nearly 40 million tons in The prognoses of the Butinge oil terminal is not so clear due to the other significant oil terminal construction projects in the Baltic Sea area Port of Klaipeda The Klaipeda State Oil terminal (Figure 15) was constructed in 1959 for export of heavy fuel oil to western countries. The original design capacity was 4.5 million tons, and after reconstruction plan in 1993 (Tebodin & Pramprojektas, 1993) the annual capacity was increased to 6.6. million tons for heavy fuel oil and diesel oil.
. General cargo represents 60 % of the total freight.")

41 39 (152) Figure 15. The Port of Klaipeda (Port Authority). More than 65 % of the Port of Klaipeda's throughput is transito, mainly from Russia. The total throughput in 1998 was 15 million tons of which export represented roughly 80 % and import 20 % (Figure 17). General cargo represents 60 % of the total freight. Other important cargo groups are dry bulk, 21 % and liquid bulk, 19 % (Figure 19). Metals and fertilizers represented together more than 7 million tons in There have been a lot of new investments and investment proposals in the Port of Klaipeda. The turnover development is presented in Figure 18. The new container terminal has a capacity of TEU and new RoRo terminal has been constructed too. Other new investments are a dry bulk terminal, passenger terminal, and fairway deepening works to deepen the existing m fairway to meters in front of entrance (Figure 16). A Baltic seaport, Klaipeda is situated in a narrow strait called the "Sea Canal" on the Eastern Baltic Seashore. The port is open for navigation all the year round. Figure 16. The Port of Klaipeda entrance. Lat: 55 43'N Lon: 21 07'E. The width of the approaching channel to the port is 100 m and depth 11.5 m. The entrance of the sea canal protected by the Northern and Southern moles. The length of the fairway from the port entrance up to the Kiaulies Nugara shoal at the entrance to the Kurshiu Marios gulf is 4 miles, width varies from 180 m to 300 m and the depths are from 6 m to 9 m at the mean water level. The permissible drafts for vessels navigating along the Sea Canal are 10.6 m to 8.0 m from the Canal entrance up to the Winter Harbor, further up to the Klaipeda's Smelte Company and Ferry Terminal - not more than 7.5 m. The layout of the port is shown in Appendix 13.


42 40 (152) Figure 17. Ship traffic development of Klaipeda port in Figure 18. The turnover development of Klaipeda in Figure 19. Cargo distribution of Klaipeda in 2000.
43 41 (152) Klaipeda State port will soon become a freeport. A law relating to this change has been passed, but regulations for its implementation have not yet been prepared. Lithuania's two largest ports, Klaipeda and Butinge made more than 22,2 million tonnes turnover in Klaipeda alone corresponded 17,2 million tonnes with ship calls more than Two oil operators take care of one half of the total supply of goods. The Lithuanian-American company Klaipedos Nafta in Klaipeda has recently completed the renovations of the terminal. Its capacity has been improved to seven million tonnes. The other company, Mazheikiu Nafta, holds the loading terminal in Butinge with the total planned capacity of 8 million tons. A 22 inch diameter oil pipeline connects the Mazheikiu oil plant with Butinge, and the loading platform at the distance of few hundred meters offshore allowing large tankers to be served. Largest vessel thus far visiting the port has been the dwt tanker loading tonnes of crude oil (Vitismann, M. 2002b). In the year vessels visited Butinge oil terminal corresponding slightly over 5 million tons of crude oil share. Butinge mainly serves Russian oil companies such as Yukos, Tatneft and Slavneft. Klaipedos Nafta loaded 5,1 million tonnes of oil products in 2001, including 3 million tonnes of fuel oil and one million tons of diesel oil. The other important item is fertilizers having the share of almost three million tonnes in Lithuania's importance to Russia will become important, especially after Lithuania has joined the European Union. There has been already now plans to develop Klaipeda and the Russian Kaliningrad together, and to avoid competition by dividing flow of goods between these two ports. The important issue will be the general development of the railway tariff-policy of Russia which will influence on the development of these ports significantly. Kaliningrad has also a crude oil terminal and handling around 2 million tons per year. 3.6 Poland Poland and Estonia are to be found in the first applicants of the EU membership, which might be realized before Poland main ports are characterized by two twin-ports, i.e. Ports of Szczecin and Swinoujscie and Ports of Gdansk and Gdynia. The former two ports are run be the same port authority, but the latter two ports are in direct competition to each other (Ingo, S. 1999). The Polish seaborne cargo transport (Table 14) is also expected to nearly double by the year The most significant development will take place in the port of Gdansk, which is expected to have near 50 million tons volume in Table 14. Cargo turnover in Polish Ports in 2001 [million tons] (Szymanski, L. 2002). Port Total Coal Ore Grain Timber Oil Bulk General Calls (x1000) Gdansk 47,7 15,8 2,7 2,5 0,75 8,0 7,9 10, Gdynia 8,4 1,7 0,01 0,7 0,02 0,4 1,3 4, Szczecin 10,3 3,9 0,5 1,1 0,04 0,3 2,1 2, Swinoujscie 8,9 4,1 2,1 0,1-0,2 0,3 2, Police 2,0 0,04 0, ,9-688
44 42 (152) Gdansk The Port of Gdansk is the largest port of Poland. In 1998 the throughput was 20.5 million tons and the development can be seen in Table 15 and Figure 20. It has two separate ports: the Inland Port along the Vistula River and the Northern Port. Inland Port is specialized on the container handling. Moreover there are terminals (Eastern River bank) for sulfur, salts, soda, chemicals, fertilizers, coal, grain etc. Inland port also has the general cargo and container terminals in the Western River bank, and the ferry connections to Scandinavia. The draught of the inner port is 10.2 m. The Northern (outer) port has a channel depth of 17 meters and can be accessed large vessels up to dwt fully laden. Two main terminals are the coal terminal having the daily handling capacity of tons and the Fuel Terminal having the daily capacity of tons. Its current annual capacity is 18 million tons, but will be increased to 30 million tons annually. Handling is focused on bulk goods with a capacity of ten million tones of coal per year, 34 million tons of oil and other petroleum products and 0.5 million tons of gas per year (Szymanski, L. 2002). The inner port has 36 berths on 10 km of quays for vessels having the maximum draught of 10,2 meters and the maximum deadweight of tons. The layout of the port is shown in Appendix 15. The investment proposals include a lot of new terminals mainly in the large reserved land areas of the Northern Port: liquid and gas terminal, chemical terminal, ore and container terminals and further development of existing fuel terminals. There are also plans to establish a duty free zone for investment attractions. However, after Poland has became the member state of the EU, the general policy of duty free regulations, taxes and VAT's should follow the EU's policy. Table 15. Cargo Handling in The Port of Gdansk [in thousand tons] ( Coal Ore Grain Liquid Fuels Other bulk cargo General cargo TOTAL Containers [TEU]
 locates to the north west of Gdansk, on the Bay of Gdansk.")
45 43 (152) GDANSK t tonnes Coal Ore Grain Liquid Fuels Other bulk cargo General cargo Figure 20. Cargo handled in Gdansk Gdynia The Port of Gdynia ( Figure 21, Figure 22 and Table 16) locates to the north west of Gdansk, on the Bay of Gdansk. This modern port is specialized on the container handling. Figure 21. Entrance to the port.

46 44 (152) Figure 22. Gnydia Port map. 1 Yacht basin 2 Tourist area 3 Fisheries Harbor 4 Ship Repair Yard 'Nauta' 5 LPG terminal - SEMGAZ 6 Baltic Bulk Terminal BBM 7 Reclaimed land 8 Maritime Bulk Terminal 9 Fruit terminal * 10 Liquid Fuels Terminal ** 11 Development area 12 General cargo terminal *) in progress **) temporary 13 Liquid products t. WESTWAY 14 Grain terminal 15 Fodder terminal * 16 RoRo Terminal * 17 Bulk cement t. - SCANCEM 18 Ferry terminal 19 Container terminal 20 Depot terminal 21 BCT back-up facilities 22 Development area 23 Baltic Auto Center 24 Ship Yard 'Gdynia' 25 Naval Ship Yard 26 Naval Harbor Table 16. General info about Gdynia Total site area : 240 hectares Total quay length: 10 km Water depth at quays: m Number of berths: 40 Cranes: Fixed, mobile, floating with lifting capacity up to 100 tons Warehouses: 230,000 sq. m (including cold storage space) Open storage: 400,000 sq. m The main harbor entrance is 150 meters wide and has a water depth of 14.1 meters. The outer breakwater extends for 2.5 km. Two main deep-water channels provide safe approach to Port Gdynia. The roadstead is protected by the Hel Peninsula ensuring safe anchorage throughout the year. Fine compact sand in the roadstead provides safe anchorage ground. The layout of the port is shown in Appendix 14. Gdynia is a non-tidal port with no currents or high waves although water levels can rise up to 60 cm during strong westerly winds and fall 60 cm when subjected to strong easterly winds. The port is essentially ice-free. The terminals are described in Table 17. Pilotage is compulsory for vessels over 40 meters LOA. Pilots board at roadstead. Towage is compulsory for all vessels over 90 meters and from 70 meters for vessels carrying hazardous goods. Shipping agents can be contacted on Channel 7. Pilot station can be contacted on VHF channel 12. Port Gdynia is a 24-hours-a-day gateway. The port operates around-the-clock on a three-shift system. Table 18 presents tonnage in Gdynia The cargo distribution is presented in Figure 23.
47 45 (152) Table 17. Terminal operators. Baltic Container Terminal Number of quays: 2 Total quay length: 980 m Water depth at quays: 8-10m Cranes: Max. capacity of 55t Warehouses: 23,000 sq. m Open storage: 210,000 sq. m Maritime Bulk Terminal Number of quays: 4 Total quay length: 2,000 m Water depth at quays: m Cranes: Max. capacity 16 tons Total storage area: 102,000 sq. m Baltic General Cargo Terminal Number of quays: 7 Total quay length: 4.3 km Water depth at quays: m Cranes: Fixed, mobile floating with max capacity of 100t Warehouses: 165,000 sq. m Open storage: 160,000 sq. m Baltic GrainTerminal Number of quays: 1 Total quay length: 275 m Water depth at quay: 11.10m Silo cap: 26,000 tons The Bulk Terminal Ltd. Number of quays: 1 Total quay length: 713m Water depth at quay: 10.5m Storage capacity: t Table 18. Tonnage in thousand tons in Port of Gdynia ( ) Coal & Coke ,5 1753,9 Iron Ore ,7 11,3 Grain & fodder ,2 510,4 Other Bulk Cargo , ,6 Timber ,1 27,7 General Cargo , ,7 Oil Products ,4 333,5 Total
48 46 (152) GDYNIA Coal & Coke Iron Ore 3000 Grain & fodder Other Bulk Cargo 2000 Timber General Cargo Oil Products Figure 23. Cargo handled in Gdynia Swinoujscie The Port of Swinouwijcie is located at the mouth of River Swina and can handle larger vessel the Port of Szczecin can not take due to the draft restrictions. The port has more than 8,8 million tons of throughput in 2001, and a terminals for coal, chemicals and raw materials. The number of calls in 2001 was It also has links for passengers, cars, trains and ferry services to Germany, Denmark, Sweden and Finland. Cargo statistics are presented in Table 19 and Table 20. The connections to the road and railway network exist, and a link to German inland waterway systems via River Odra. Port of Swinouwijcie has a modern oil terminal and modernized ferry terminal. Table 19. Cargo turnover in 2000 ( thousand tons % export ,63 import ,96 transit ex ,30 transit imp ,11 Total ,0 Table 20. Main types of cargo reloaded ( thousand tons % Coal 4 058,58 61,30 Ore 2 031,37 39,67 Aggregate 61,03 0,92 Other dry bulk 106,9 51,62 Grain 185,4 72,79 Steel prod. 161,32 2,43 Liquid pitch 17,59 0,27
49 47 (152) Total 6 622,31 100, Port of Szczesin The Port of Szczecin is located 65 km from the open sea, along the River Odra. The navigation channel along the river is 90 m wide and the depth of entrance is 9.5 m. The low water level has caused temporary problems to the port (River Odra). The port corresponds around 10 million tons cargo per year (10, 324 million tons in 2001), and has connections to road and railway accesses. The number of calls in 2001 was Port is also connected to the German inland waterway network up to vessels having the loading capacity of tons. There are several modernization projects of port facilities underway, and new terminal construction for unitized cargo. The layout of the port is shown in Appendices 16 and Germany German ports are specialized to certain commodities or to certain type of sea transport. Hamburg and Bremerhaven are the biggest ports. Hamburg alone is representing around 75 million tons annually, Bremerhaven representing around 33 million tons. Other large ports are Rostock, Lubeck/Travemunde, Puttgarden, Kiel and Sassnitz. The German maritime transport figures is estimated to grow to million tons by the year 2010 (Venäläinen & Viitanen, 2001). In the German Baltic Sea ports the expected handling rate is around 64 million tons in The main driving forces in Germany's port development are the general growth rate in the Baltic area with Scandinavian and Baltic countries and Russia, improvements of hinterland connections of Mecklenburg - Vorpommenr ports, infrastructure investments in the ports, location of the industry near the main ports. Hamburg and Bremerhaven are large container ports, Rostock and Lubeck-Travemunde are ferry ports and ports for general cargo, Puttgarden and Kiel are ferry ports. The former railway link of Puttgarden has declined after the completion of the Great Belt Bridge. The annual number of containers in Hamburg and Bremen Ports were in 1998 over 3.5 million TEU and 1.8 million TEU, respectively. The average annual growth of the seanborbe cargo of the main German ports has also been quite large: in 1990s the average annual growth rate of Hamburg was 3.2, and 2.6 for the Bremenhaven. Rostock and Lubeck-Travemunde increased their transportation figure even more, 5.0 and 6.4, respectively. There is a marked difference between the maritime traffic that passes through the North Sea and that which traverses the Baltic Sea. The reunification of Germany has resulted in a longer Baltic coastline and the German authorities are improving aids to navigation in their Baltic ports. This is being achieved through the positioning of additional buoys and lighthouses; by traffic radar; and by the establishment of a VTS at Rostock.There is not continuous coastal radar the length of the Baltic coastline. The regulations of the Shipping and Waterways Administration is enforced by the Coast Guard on a 24-hour basis. A primary concern of the German authorities is the difference in the standard of tankers using the North Sea and the Baltic Sea. In practice, ship charterers are setting the standards in advance of the development of international rules. North Sea operators require higher technical standards because of the adverse weather conditions and difficult terminal operations. Although weather conditions in the Baltic are less extreme, the environmental sensitivity of the Baltic Sea is higher than the North Sea. Both sea areas are designated as Special Areas for the purpose of MARPOL Annex I (oil). The
50 48 (152) German response authorities fear that the lower standard of tankers using the Baltic terminals could increase the risk of oil pollution incidents (COWI, 2000) Lübeck - Travemunde In 1999, the total turnover of the ports of Lübeck was 25.2 million tons. In 1998, the turnover reached 24.9 million tons and in 1997, a total of 24.4 million tons were handled. Lübeck has liner services at the terminal Skandinavienkai and at the city ports (a total of more than 110 per week to 16 destinations in the entire area of the Baltic Sea) and has good hinterland-connections. (saksa\luebeck\stat00.htm). Cargo throughput is presented in Table 21. The Port of Lubeck- Travemunde consists of five different port terminals. The main transportation modes are RoRo and ferry traffic, paper and forest products, general cargo, fruits, break bulk, automobiles, passenger ferries and cruise liners. Table 21. The cargo throughput in the Port of Lübeck (saksa\luebeck\stat00.htm). Total handling of the LHG (in Mio. t) Import Export Total ,428,100 10,182,082 23,610, ,123,708 10,161,492 23,285, Piece goods Paper 2,806,512 3,188,471 (in Mio. t) Cellulose 275, ,6 Means of loading Trucks accompanied 302, ,096 (in units) Trucks not 330, ,419 accompanied Container 56,489 64,204 Railcars 26,848 18,931 Cars 159, ,634 Travelling Traffic Passengers 573, ,189 (in units) Passenger cars 117, ,758 LHG-Terminals Terminal 15,143,598 15,011,299 (in Mio. t) Skandinavienkai Terminal Nordlandkai 5,249,705 5,481,163 Terminal Konstinkai 1,818,194 1,783,341 Terminal Schlutup 1,150,715 1,185,919 Integrated Harbor Logistic System (IHS) is put into practice at the LHG terminals in Schlutup, Konstinkai, Nordlandkai and Skandinavienkai. Further implementation of this system is planned at the Seelandterminal and for the 50% LHG subsidiary CBT (Cross Baltic Terminal Operator) in Szczecin (Stettin). The main functions of the Integrated Harbor Logistic System are the administration of the lots for trailers, containers, railcars and RoRo-units by means of data-radio set. All loading procedures on the ships or on the ground are also conducted by data-radio set. Completely parametrically communication intersurfaces to the shippers, forest-product companies, automobile companies as well as to port authorities (also linking different countries) allow an efficient transfer of data. Modules, permitting a process-oriented gathering of data of the different
51 49 (152) kinds of performances at the port and of the application of personnel and equipment, are used for a better steering at the terminals. A gate system, connectable to any desired technical videochecksystems is also part of the IHS. Further, the IHS contains a complete storage administration program, administering approx. 200,000 m² in more than 40 sheds within the LHG. The integration into the international business standard SAP R/3 has already been realized. Numerous statistics and reports are available for the operational and administrative steering of the terminals Hamburg Hamburg is the largest universal seaport of Germany and the eighth biggest container handler in the world. The throughput was more than 92 million tons in 2001 and is expected to be near 100 million tons in The container throughput was 4,7 million TEU in the year Hamburg can easily handle more containers, thus its annual container capacity has been estimated to be near 9 million TEU. Moreover, the further deepening of River Elbe to 14, 5 meters will soon enable Hamburg to take large container ships of up to TEU (Todd, T. 2002). The Port of Hamburg forms the most important gateway for the exchange of the EU and Eastern European cargos. Nordic countries represent a significant part of the total throughput of the port. From its annual 75 million tons cargo approximately half is bulk cargo and the rest general cargo, mainly in containers. The amount of liquid cargo has been in million tons annually, depending on the year. Hamburg is also investing to the new Altenwerder container terminal getting additional area of 215 ha giving additional capacity of 1200 million TEU in 2001 and 1900 million TEU in Other improvements are several extensions of container terminals, dredging works to get better access for large container vessels in the Elbe River, railroad and road improvements Rostock The Port of Rostock has become a modern ferry port having still a strong reputation of a bulk port. Main ferry routes goes to Trelleborg in Sweden, Gedser in Denmark and during the open water season Helsinki in Finland (Silja Line GTS Finnjet). Rostock has connection to the central motorways and links with Berlin. The fairway approaching the Rostock Port is 3.6 nautical miles long and has a draught of 14.5 m. The port is currently enlarged to get easier access for larger vessels. There are 42 berths for ships to enter. The throughput of the port was 16.8 million tons in Other ports Puttgarden is located on the island Ferhman and has ferry links to Denmark (Rödby). The amount of passengers in 1998 was 5.85 million and cargo handled has exceeded 5 million tons annually (5.8 million in 1997). The Port of Kiel is an important ferry port and has links to Norway and Sweden. It is also the beginning of the Kiel Canal, which links the Baltic Sea to the River Elbe. There are 9 different terminals. Due to the centralization and new fixed bridge link between Denmark and Sweden the transport figures have been decreased slightly since The annual amount of cargo has been in the order of million tons, and the number of passengers million.
52 50 (152) The ferry port of Sassnitz (Mukran) is located on the island of Rugen. It is a former military port, but has been transformed to a ferry port. It has links to Trelleborg, Klaipeda, Swinoujscie and Rönne. It also has a rail ferry connection with Klaipeda serving the East European rail network. The future investments are directed to improve the links between the hinterland and the mainland. The North-Sea port of Hamburg is the 6th largest port worldwide. The overseas container volumes are concentrated to Hamburg and to Bremerhaven. Hamburg has two large container operators, HHLA and Eurokai. The management behind Eurokai is also managing and operating Bremen and Bremerhaven and their container terminals. Hamburg is also an important gateway for the Eastern Europe due to the good intermodal railway connections with the East European hinterland. The relatively high tonnage in Wilhelmshaven is due to the oil and oil products. Rostock and Lübeck-Travemünde are both ferry ports and ports for general cargo from Scandinavia and Finland. Rostock has also oil product facilities and is a ferry port. Brünsbuttel and Bützfleth are bulk ports in the industrial region of the lower Elbe (SWA, 1999). Emden is a bulk port but is also used by Volkswagen for shipping cars. Puttgarden is a ferry port only, but has lost the railway volumes due to the opening of the Great Belt bridge link. Nordenhamn and Brake are bulk ports on the river Weser. 3.8 Denmark According to the (COWI, 2000) the Danish authorities are not concerned by the increased tanker traffic which would be engendered by the Baltic Pipeline-project, i.e. due to the realization of the Primorsk oil terminal. The construction of the bridges across the Great Belt has resulted in better routing of ships' traffic and improved navigation aids such as buoys and lighthouses. All large traffic will pass under the main bridge, which has an open span of 1650 m. However, the former Erika accident followed by the ship collision in March 2001 has changed this view remarkably. HELCOM arranged a ministerial meeting in September 10, initiated by Denmark; to discuss on all the possible measures to improve maritime safety and to avoid oil spills. Ships are required to inform the center at Aarhus when entering Danish waters (the Ship Position System (SHIPPOS) as required by IMO). Access to the system is free of charge and masters can hear on the radio about ship traffic movements in the Sound. This SHIPPOS has been reinforced by a Vessel Traffic Service (VTS) introduced for the Great Belt. The VTS center is located at the Korsoer naval base. The VTS gives guidance to ships' masters if they are not following the traffic schemes and, if necessary, control vessels can go out and intercept ships, which are off course. A temporary VTS for the Sound has been dismantled now that the construction works have been completed. There is no provision for mandatory pilots. At the request of the Danish Parliament, in 1991 Denmark made proposals in HELCOM that all laden tankers above 20,000 DWT should be required to take on pilots when navigating the Danish Straits. However, the proposal received little support and was withdrawn after 4 years. However, in accordance with IMO Resolution A.620 (15) adopted in 1987, all ships with a draught of 13 meters or more are recommended to use the pilotage services. The recommendation is generally well followed with only about a dozen vessels a year failing to take on board pilots; the Danish Maritime Authority informs the flag state authorities of the vessel concerned in such cases and this avoids repetition of the circumstances.

53 51 (152) The Danish ports Denmark has a total have about 130 cargo and ferry ports distributed throughout the country. These ports differ considerably in terms of size and profile. Owing to the geography of Denmark, large proportions of these ports are small ferry ports. In 1999 a total of 572,500 calls were made at Danish ports to load/unload cargo or passengers. 95% of these were ferry calls. Between 1998 and 1999 the number of calls made by ships at Danish ports fell by about 17,000 (3%), which must be attributed primarily to the opening of the Great Belt Bridge. The Danish ports are shown on the map in Figure 24. Figure 24. Danish ports 1. The map shows all the Danish ports included in Danmarks Statistik's summary of shipping in Denmark. 1 Comprising Danish "traffic" ports and separate ferry berths outside such ports. Marinas and fishing ports are not included. The most noticeable thing is that the fishing ports at Thorsminde and Hvide Sande on the west coast of Jutland are not marked. Ferry ports that no longer have regular ferry crossings are not included either (e.g. the ferry berth at Lohals on Langeland).

54 52 (152) Cargo transport at Danish ports The total volume of cargo 2 transported via Danish ports grew steadily in the period to more than 100 million tons. However, the tendency has changed since the opening of the Great Belt Bridge and the total volume of cargo fell by 15% from 101 million tons in 1997 to 85 million tons in Figure 25 shows the total volume of cargo passing one or more Danish port in the transport chain. Some of this cargo may have been unloaded and/or loaded in several Danish ports, but is only registered once. The statistics mention that "national (loaded)" cargo is not included. Figure 25. Cargo transported via Danish ports (source: Danmarks Statistik). However, to investigate the level of activity at Danish ports - i.e. the total volume of cargo unloaded and loaded in all the ports - "national (loaded)" cargo should also be included. This would give an all-round picture of cargo turnover at the ports. Cargo turnover at Danish ports in 1999 amounted to more than 97 million tons. This is 22% lower than in 1997 prior to the opening of the Great Belt Bridge. In particular, the reduction has affected former ferry ports like Nyborg and Korsør. In some of the small Danish ports cargo turnover has actually stopped completely. Among the major Danish ports, ferry ports such as Kalundborg have been particularly hard hit by the opening of the bridge. The Danish ports predict further losses of cargo turnover owing to the opening of the Øresund Bridge to Sweden. Each year Danmarks Statistik publishes detailed statistics on ports with a cargo turnover of more than 1 million tons. In 1999 the 19 largest ports turned over more than 78 million tons of cargo, corresponding to almost 80% of total cargo turnover at Danish ports. Measured in terms of total cargo turnover (all cargo types), the Port of Fredericia is Denmark's largest cargo port with an annual turnover of 14.5 million tons (1999). The major proportion of cargo turnover at the Port of Fredericia consists of oil. Crude oil from the Danish oil fields in the North Sea is conveyed through a pipeline across Jutland to the Fredericia terminal. Here the oil is 2 Total volume of cargo loaded and unloaded in Danish ports for both import and export.
55 53 (152) dispatched by sea or sent to the Shell Re-finery in Fredericia, where it is refined. In most cases finished products are also dispatched from the Port of Fredericia. 82% of cargo turnover at the Port of Fredericia in 1999 consisted of tanker consignments. The Port of Copenhagen has Denmark's second-largest cargo turnover (9.4 million tons). One-third of this is transported via the many ferry routes sailing to and from Copenhagen. Denmark's thirdlargest cargo port is the Statoil Port (8.8 million tons), which is only used for oil. The fourth largest is the Port of Århus with a turnover of 7.7 million tons - 10% of which is by ferry. Cargo turnover in Danish ports, Table 22. Table 22. Cargo turnover in Danish ports (Bakka, D. 2002). Port Turnover in 2001 Containers [TEU] Fredericia/Nyborg 16,0 Århus 10, Koepenhagen 8, Esbjerg 4,6 Kalundborg 3,9 Frederikshavn 2,9 Alborg 2, Kolding 1,3 Rönne 1,2 Aabenraa 1,1 Randers 1,0 Köge 0,8 Nästved 0,5 Horsens 0,5 Almost half of the product carriers had the capacity of dwt, while around 13 % os the tankers were larger than dwt. The age of the ship goes well with the size of the ship: more older the ship more smaller the ship. The amount of refined oil products transported by ships in Europe was around 150 million tons, and gave contracts for 180 ships having the size of dwt. Chemical tankers had a size scale of dwt. The Europa's internal chemical transport rate was around 10 million tons of chemicals in Table 23 shows cargo turnover categorized by cargo type. On a national scale cargo was divided more or less equally in 1999 between liquid bulk (32%), solid bulk (32%) and general cargo (36%). Naturally, it is noticeable that the ferry ports only handle general cargo (Helsingør, Sjællands Odde, Ebeltoft and Frederikshavn).
56 54 (152) Table 23. Cargo turnover categorized by cargo type, 1999 (source: Danmarks Statistik) Exports, imports, and national transport The total volume of cargo handled at the major Danish ports is categorized by Danmarks Statistik according to its point of origin and point of destination respectively, as well as being categorized as "national" or "international" cargo. This makes it possible to divide the cargo at each of the major Danish ports into 4 categories: exports (cargo loaded for export), imports (cargo unloaded for import), national (unloaded) cargo, and national (loaded) cargo. Total cargo turnover at the Danish ports can be divided as follows: 43% imports, 32% exports, and 12-13% national transport between Danish ports Aabenraa Port The Aabenraa Port (Figure 26) is situated at a position 55 02'5 N '7 E at the deep Aabenraa Fjord. The port is composed of 3 basins, Nyhavn Gammelhavn and Sydhavn and of the Sønderjyllandsquay and the RoRo terminal. Further to that there are the tankship piers 1 and 2. The waterdepths vary from 4 to 11 m. From the Aabenraa Fiord an approx m long and 11 m deep dredged channel leads to the port. The minimum width of the channel is 120 meters. There are no significant tidal ranges, but northeasterly/easterly gales can result in high waterlevel on occasions, and southwesterly/westerly gales can result in low water level on occasions. The water level in the port is recorded at the Danish Meteorological Institute. The Aabenraa Port can accommodate drycargo vessels of up to 250 m length, and tankvessels up to 200 m length. The port is lighted and is accessible for navigation day and night. The port is kept open during eventual ice-winters. 3 Differences in the freight statistics between national (unloaded) cargo, apart from dredged stone, sand and gravel, and national (loaded) cargo are due among other things to the transport of oil to vessels at sea or to ferry berths outside port areas; and to the transport of construction material for bridge building.

.")
57 55 (152) Figure 26. The Aabenraa port (Port Authority). The Aabenraa Port's total turnover is about 18 Mio DKK, and origins mainly from harbordues and cargofees, together with rent for port space, cranes and machines. The income is mainly used for administration, maintenance of cranes, machines and facilities, depreciation, and payment of interests of the port's debts. The annual cargo turnover is about 1.1 Mio tons and is composed of liquid products, such as oil and molasses, together with bulkgoods, such as cement, limestone, broken stones and split, foodstuffs, grain and fertilizers (Figure 27). Furthermore the port handles general cargo, iron, wood products and trailers. Approximately 700 ships per year call the port (Figure 28). Figure 27. Goods transported during [tons].

58 56 (152) Figure 28. Visits in port Aabendraa by shiptype year Aarhus Port Since the first basins, the Port of Aarhus (Figure 29) has been extended significantly and is today one of the largest in Denmark and within most areas the largest. The infrastructure of the port is now fully developed inside the existing breakwaters and has a capacity of 11 million tons and 450,000 TEUs and 600,000 containers. The Port of Aarhus has in recent 5 years invested DKK 600 million in port installations and equipment. The budget is DKK 200 million in Quays measure a total of 13 kilometers with a water depth of up to 14 meters. Future plans for the development include a doubling of the harbor's cargo-handling capacity, requiring an investment of additional two billion Danish crowns over the next 25 years. All types of commodity are handled by the harbor. The total amount of cargo handled corresponds to almost 10 million tons annually. Just less than 3 million tons of cargo are handled via the container services. The ferries to Zealand carry more than 2 million tons of cargo. The oil terminal handles more than 2 million tons. The remaining 2.5 million tons include, in particular, bulk goods such as foodstuffs and coal. The Port of Aarhus employs its own pilots who assist the ships upon arrival and departure. The harbor officials command the pilot boats, provide mooring services and supervise the harbor area. Ships that cannot moor on their own can request assistance from the harbor's tugboats.

59 57 (152) Figure 29. Port of Aarhus (Port Authority). 3.9 Sweden According to the Swedish national transport forecast, the total goods volumes transported by all modes are expected to grow by 27 % from 1997 to 2010, which equals an average annual growth rate near 1.9 %. The expectations for the maritime transport is slightly smaller, around 20 % between 1997 and There are a large number of ports in Sweden, 52 public ports mainly owned by local municipalities. The ferry traffic in concentrated to few ports 5 largest ferry ports are holding 90 % of the truck traffic and passenger volume. Biggest ports are Gothenburg, Brofjorden, Helsingborg and Trellborg. The container traffic is mainly concentrated to Gothenburg and Helsingborg. They handle together more than 70 % of the total volume. The oil traffic is also concentrated to Gothenburg and Brofjorden where the oil refinery facilities exist. The share of the oil products of the total ship-borne transport is around %. Machines, and general cargo equals around 15 %, forest products 13 %, unprocessed minerals and goods manufactured from these mineral 11 % and rest 23 %. Geographically, around 50 % of the total volume is transported via port of the West Coast. Slightly more than 10 % through the ports of the South Coast, 20 % through ports on the Baltic Coast and rest trough ports along the Northern Coast. Most common flag of the ship is Russian (16 % of the number of ships), while the Swedish flags dominate in the oil tanker, special-type tanker and RoRotraffic.
60 58 (152) Port of Gothenburg The port of Gothenburg is the largest port of the Nordic region of the Baltic Sea. The cargo turnover comprises almost 60 % oil and almost 40 % general cargo. It serves the whole northern part of the Baltic Sea area. There are good connections with railways and motorways. The port has nine different harbors specialized on different functions: Northern side of the port, i.e. Skandia Harbor, is the container harbor and passenger and car terminal. The Älvsborg Harbor is RoRo harbor with trailers and the Free port handles bulk cargo. Three other harbors on the north side handle with oil, and on the south side there are three harbors along the riverside with freight and passenger terminals. There are two main approaching channels to the port: Torshamnsleden for large vessels having draught between meters and Böttöleden with the depth of 10 meters. The River Göta fairway has a depth of 5.4 meters to Gothenburg's inner harbor Other Harbors Helsingborg located in the very southern part of Sweden has four separate harbors: West harbor for unitized cargo, North harbor for ferry traffic, South Harbor having more diversified operations and the Bulk Harbor. The minimum water depth offered for the ships is 9.0 meters. Trelleborg is also situated in the southern part of Sweden, around 85 km of the German border. It is the third largest port in Sweden, almost all the share coming from the ferry traffic. Passenger ferry services are operating to Sassnitz, Rostock and Travemunde. Sweden's largest port in the Gulf of Bothnia is the port of Luleå, a largest bulk port of Sweden. Nearly 70 % of the total cargo is iron ore for export, nearly 30 % coal, steel, chalk stone and oil are imported. Luleå's main fairways, Sandöleden and Sandgrönnleden are 12.2 m and 9.8 m deep, respectively. Some of the ports are listed in Table 25. The cargo traffic through the Swedish ports in 2000 was million tons, divided into the groups shown in Table 24. The passenger traffic exceeded 33.5 million passenger having the densest traffic between Denmark and Sweden, near 20 million passengers. The corresponding figures between Finland-Sweden and Germany-Sweden were 8.52 million and 2.62 million, respectively. The cargo throughputs (in and out) in Swedish ports in 2000 and 2001 are shown in Appendix 29. Table 24. Cargo transport through the Swedish ports (source: SIKA/SCB). Cargo item Volume [x 1000 tons] foreign trade oil and oil products timber & forestry metals & ore others internal (domestic) all items Total
61 59 (152) Table 25. Largest ports of Sweden in 2000 on the basis of the volume handled (Svensk Sjöfarts Tidning, Port Cargo handled [x 1000 ton] Note Gothenburg Biggest port in the Scandinavia. Fullservice port, concentrated to bulk traffic Brofjorden crude oil and refined oil terminal Trelleborg ferry terminal Helsingborg fullservice port with a large ferry terminal Luleå bulk, ore, coal and liquid cargo Malmö fullservice port, mainly oil, general cargo, ferry traffic Stockholm altogether three harbors: Stockholm, Nynäshamn and Kapellskär. All types of cargo, ferry terminals Oxelösund fullservice port, mainly raw materials for the steel industry and oil Karlshamn fullservice port and bulk Norrköping fullservice port, oil and forest products The total amount of cargo handled via Swedish ports was 159, 3 million tons in 2000, which was three million tons more than in 1999.
62 60 (152) 4 Total maritime transport and oil transportation in the Baltic Sea 4.1 General In order to update the former statistics of the maritime transport a Lloyd's database was analyzed. The traffic season May 2000 was selected to represent the basic database of ship movements in the Baltic Sea area. The database consisted of all the port calls, and was modified in order to get understanding on the intra regional ship movements and especially on the oil tanker movements of the area. Other statistics were used as support. Here the www-pages of different ports, information received from ports directly, other data bases supported the analyses carried out played an important role. The Baltic Sea area was divided into five categories, roughly: Area I. The Gulf of Bothnia, Area II. The Gulf of Finland, Area III. The Central Baltic Sea area between Sweden and the Baltic States, Area IV. The Southern Baltic Sea and Area V. The Danish Straits. The traffic statistics were divided into two groups: first the oil tanker traffic was analyzed. Tables were performed where the destinations and origins were listed with the data concerning the ship and the cargo. The main ports of the Baltic Sea area for the analyses were selected using the port distribution figure shown in (COWI, 1998b) in order to understand better the development. This Figure 30 is enclosed below. However, more ports were added to get better coverage over the selected areas.
63 61 (152) Selected Harbours Luleå Kemi Oulu Umeå Kokkola Hernösand Vaasa Rauma Oslo Gävle Naant ali Porvoo Turku Helsinki Kotka Hamina Primorsk St ockholm Muuga StPetersburg Nynashamn Paldiski Tallinn Arendal Brof jorden Gothenburg Skagen Kalmar Aalborg Karlshamn Aarhus Kalundborg Fredericia Copenhagen Aabenraa Ventspils Liepaja Klaipeda Riga Flensburg Kiel Lübeck Rost ock Swinoujscie Gdynia Gdansk Kaliningrad Figure 30. Selected harbors in the Baltic Sea. Harbors marked with blue handle more than 3 million tons of oil per year (COWI, 1998b). Finally the movements of ships were plotted to the map, and schematic figures and columns were attached as shown below. Note: the figures do not include the ferry traffic of the Baltic sea area. 4.2 The Gulf of Bothnia The new railway and improved road connections to the North Western side of Russia may increase the shipping and transito traffic of the ports of the Gulf of Bothnia. New railway short cut between Kostamus and Kotskoma in Russia will shorten the transportation distance from Kola to the Bothnian ports by 500 km. There are a lot of sawmills and mines who might need transito services in the future. Logistically the distance to the European market area is even shorter from the Botnian ports than elsewhere from Baltic ports. Furthermore the Bothnian ports have a lot of free capacity to be used for transito. Figure 31 represents the number of oil tankers in the Area I, i.e. in the Gulf of Bothnia in The left-hand side columns represent the ship movements with the selected ports, and the right hand side columns of all the tanker traffic.
64 62 (152) Figure 32 represents the movements of tankers in the Gulf of Bothnia. Numbers near the selected ports represents tanker calls of the ports. There are two figures presented in the end of the arrow summarizing the amount of traffic going outside of the area. The figure in parenthesis represent the ship movements between the selected ports and the area outside the selected Area I. These two figures represent the yearly passages of the tankers in the boarder-line between Area I and Area III. Thus they represent both movement into the port and outside the port. This presentation has been selected for the other figures due to the fact it describes well the real traffic density of the selected boarder-line areas. In the point of view of the maritime safety issues, it is more realistic to have the number of ship passages in a certain points as the weight of the cargo transported. These transport rates are well presented elsewhere in this report. Tankers per year (estimated 2000) Selected Ports All Ports Calls Outside Area Inside Area Figure 31. Estimated tanker movements in the Gulf of Bothnia in Figure 32. The tanker traffic of the Gulf of Bothnia in 2000.
65 63 (152) 4.3 The Gulf of Finland The curves and columns below represent the maritime transportation figures in the Gulf of Finland area. First the total transport rate in 2000 is presented due to the fact the most intensive maritime development in 1990s has been in the GOF area, Figure 33. Certain selected ports have two numbers: figures in parenthesis include the movements inside the port area. these movements may include loading of the ship in a certain berth and the movement of the ship into another berth of the port. Thus these numbers are bigger than the figures without parentheses. Then, in Figure 34 and Figure 35, the future oil tanker movements in the GoF are estimated. It must be noted, that Figure 33 represent selected ports, thus the passages near the mouth of the GOF is smaller than the total number of passages which was in 2000 near Figure 33. The total figures of the maritime transport in the Gulf of Finland in 2000 in selected ports. The Gulf of Finland : Tankers per years (estimated 2000) Selected Ports All Ports Calls Outside area Inside area Figure 34. The columns representing oil tanker movements with the selected ports and all the ports (terminals in the Gulf of Finland) in 2000.
66 64 (152) Figure 35. The oil tanker movements in the Gulf of Finland in Central part of the Baltic Sea The tanker movements of the area III is presented in Figure 36 and Figure 37. Near Gotland : Tankers per year (estimated 2000) Selected Ports 288 Calls Outside Area Inside Area Figure 36. Oil tanker traffic in area III in Figure 37. Tanker traffic in the Area III in 2000.
67 65 (152) 4.5 Southern Baltic Sea The oil tanker traffic in the area IV, i.e. in the southern part of the Baltic Sea is presented in Figure 38 and in Figure 39. Bornholm - Kattegat : Tankers per year (estimated 2000) Selected Ports 4488 Calls Outside Area Inside Area Figure 38. Oil tanker movements. Total calls, calls outside the area and internal traffic in Figure 39. The oil tanker movements in the southern part of the Baltic Sea in 2000.
68 66 (152) Danish Straits In Figure 40 and Figure 41, the oil tanker movements between Kattegat and Skagerrak are presented (estimation). Kattegat - Skagerrak : Tankers per year (estimated2 2000) Selected Ports Calls Outside Area Inside Area Figure 40. Oil tanker movements in Danish Straits in Figure 41. Oil tanker movements in area V in 2000.
69 67 (152) Total seaborne traffic in 2000 The total movements of ships in 2000 is shown in Figure 42. The figure consists of all the ports excluding the ferry traffic. Numbers in the projections are listed in. Figure 42. The total transport figures of the Baltic Sea in Point v Table 26. Numbers in the six projections.
70 68 (152) 5 Oil Transportation Worlds oil production in 2000 was near million tons. OPEC countries corresponded 42 % of this figure. Russia's product rate today is near 395 million tons, while the largest production takes place in the Middle East (31 %). More than million tons was transported by tankers, and 420 million tons of this figure were refined oil products. The know oil reserves of the world have been near 140 billion tons since 1993, which corresponds around 40 years consumption with the current production level (Sjöfartens bok. 2002). In beginning of year 2000 the world's tanker fleet consisted approximately crude oil tankers having the capacity of 255 million dwt. Furthermore there was around 255 combi-tankers with the total capacity of 15 million dwt. These ships have the possibility to carry oil or ore or other bulk. The amount of tankers for refined oil products was around with the total capacity of 44 million tons. Furthermore there were more than chemical tankers and ships for gas transportations, such as LNG ships (Svensk sjöfarts tidning, 2001). The North European oil transport market is typically a medium or short haul area where for example Aframax type of tankers comes to fit into its own. The fleet of Aframax size tankers world wide is around 45 million dwt, but its share of the total tanker fleet has increased by 2,5 percent in the past ten years to a good 20 per cent (Arentz, 2002c). It is also younger than the average and the share of double hull vessels is a healthy 45 %. Based on fleet data the 24,1 % of the Aframax fleet are five years old or less and around 21,4 % are between six and ten years. 27,7 %, nearly all of which are single hull are 21 years old or older. The current average age is twelve years and it will get younger quite fast. The Aframax delivery and order book world wide shows 34 vessels for the year 2002 and 57 ships having the total 6 million dwt capacity in 2003 (Arentz, 2002c). Comparison with number of harbor calls A spot check on selected harbors where annual number of calls in 1997 is shown in Table 27 below (COWI, 1998b). Table 27. Comparison of the number of harbour calls in selected harbours (COWI, 1998b). Harbor Oil tankers Total calls Model Reported Model Reported Fredericia Kalundborg Göteborg Klaipeda Gdansk Rostock Aabenraa Helsinki Muuga Hamina
71 69 (152) The oil transportation development of the proper Baltic can be divided into two main areas: The Gulf of Finland and the Danish Straits. Due to the fact Russia is reconstructing the existing ports and terminals of the Eastern part of the Gulf of Finland, and building new terminals the most dynamic development is going on there. Also the development of Muuga may still continue, depending on the oil price development and the policy of the Russian oil companies. A new company will soon start reconstruction works of the new oil terminal behind the existing oil terminal area, and the oil transportation rate of the first phase is expected to be around 3 million tons annually. In 1997, oil tanker movements were distributed as presented below in Figure 43. Table 28 on the other hand shows the proportion of sea borne traffic in the Baltic Sea Figure 43. Distribution of oil tanker movements in 1997 (COWI, 1998b).
72 70 (152) Table 28. Proportion of sea borne traffic in the Baltic Sea (COWI, 1998b). Data in Commodity Total volume of trade (Mio tons) Volume in Baltic Sea (Mio tons) Percentage Break Bulk % Dry Bulk % General Cargo % Liquid Bulk % Oil % Total % Source: Eurostat 1995 numbers and COWI's estimate. Eurostat includes the following information: Imports to the EC countries from a number of countries and Exports from the EC countries to a number of countries Table 29 shows that the total amount of seaborne traffic was approximately 1.4 billion tons in 1995 of which roughly 15% is estimated to be carried fully or partly through the Baltic Sea. The above result on the volume of trade in the Baltic Sea is in accordance with formerly published EU figures. Table 29. The development of the Gulf of Finland oil transportation between (Semanov,2001). Country/Port /terminal year 2000 year 1997 Estonia / Muuga Finland/Hamina Porvoo (other 5) Latvia / Riga Ventspils Liepaja Lithuania/Klaipeda Butinge Russia / St. Petersburg Kaliningrad TOTAL
73 71 (152) OIL TRANSPORTATION IN THE GULF OF FINLAND THROUGH MAIN OIL PORTS OIL TRANSPORTATION IN YEARS AND ESTIMATED DEVELOPMENT Million Tons Tallinn Ust Luga Batareynaja St.Petersburg Primorsk Figure 44. Estimated development of oil transportation in the Gulf of Finland (FEI, 2000). The most significant oil export terminals are located in Norway and in Baltic countries. The Transneft's pipeline network covers NIC countries and reach the Baltic countries (Ventspils). Ventspils represents around 15 % of Russia's export outside the NIC countries. Klaipeda and Butinge in Lithuania are smaller oil terminals in spite the fact the Klaipeda has temporarily exceeded bpd exports rate in 1990's. In the Gulf of Finland, the future is estimated as presented above in Figure 44. The largest refineries on the Baltic area are Kirishi in Russia, Plock in Poland and Mazeikiai in Lithuania, Figure 45. The refinery capacity of Porvoo in Finland is near bpd, i.e. around 12 million tons annually. Germany's refinement capacity is around 2.2 billion bpd, Norway's is bpd and Sweden's around bpd (Lausala & Varjonen, 2001).
, Sköldvik (5.1 million tons), Muuga (2.")
74 72 (152) Figure 45. The largest oil refineries in the Baltic Sea region (Lausala & Varjonen, 2001). In 1997 approximately 77 million tons was transported in the Baltic with shipments. The largest part, million tons, came from the east, originally from Russia. The largest oil export terminals were Ventspils (18.4 million tons), Sköldvik (5.1 million tons), Muuga (2.7 million tons), Klaipeda ( 1.7 million tons), Hamina (1.0 million tons) and Tallinn (1.0 million tons) (SSPA, 1996). When considering the amount of oil handling, the Sköldvik's oil volume rose up to million tons while Venspils stayed near 19 million tons annually. Gdansk handled 6.8 million tons of oil, Muuga 3.3. million tons and Naantali in Finland 3.0 million tons. 5.1 Oil production in Russia The crude oil production of Russia was 323,28 million ton in 2000 based on the official announcement of the Russian Ministry of Energy (Figure 46). The production figure was 5,97 % higher than in 1999 (305,06 million ton). The export rate of crude oil was 142,41 million ton in 2001 which includes some amount of crude produced in Azerbaidzhan, Kazakstan and Turkmenstan (Mannerjalustatyöryhmä, 2001). Other oil producers, 112 enterprises 4,8 % Lukoil 19,2 % Jukos 15,4 % Surgutneftegaz 12,6 % Tatneft 7,5 % Tjumen's oil company 7,3 % Other integrated companies, 6 enterprises 23,3 % Joint Ventures, 48 enterprises 6,6 % Non-spezialized Governemental enterprises 3,3 %
75 73 (152) Russian Oil Production in 2000 Lukoil 5 % 19 % Jukos 23 % Surgutneftegaz Tatneft 3 % 15 % Tjumen's oil company Joint Ventures, 48 enterprises 7 % 7 % 8 % 13 % Non-spezialized Governemental enterprises Other integrated companies, 6 enterprises Other oil producers, 112 enterprises Figure 46. Russian oil production in 2000, total 323,2 million tons. The Russian oil company Jukos and Williams of USA made a contract with the Lithuanian government in 2001 on the holding of the Mazeiku Nafta oil company. According to the preliminary contract Jukos should also invest to the modernization of the refinery station and quarantee oil delivery rate of 4 million tons annually for the following ten years for the Nafta refinery. Additional 4 million tons annually should be delivered to the Butinge oil terminal for the following ten years period, too (Mannerjalustatyöryhmä, 2001). The second phase of the oil terminal construction will require a construction of the new parallel oil pipeline of 245 km, three new pumping stations and additional storage capacity of m 3. The second phase will increase the annual capacity of the terminal from the current 12 million tons up to 18 million tons. The second phase will be terminated by the end of The proposed future capacity can be near 30 million tons. The Caspian Pipeline Consortium's (CPC) new pipeline from Tengitz to Novorossiisk was finalized in The new pipeline is 1580 km long and has a capasity of 28, 2 million tons in the first phase. The capacity will be gradually increased up to 67 million tons annually. The design tankers to transport oil from the Russian oil terminals in Black Sea are large oil tankers of Novoship and Sovkomflot. The CPC try to decrease the oil transportation risks by using douple hull tankers (Suezmax) and having pilotage through the Bhospor strait. Additional transit fees of the Turkish Government to use the Bhosphor Strait may rise the transportation fees, thus other more economical transport alternatives are under studies. Proposals to construct a pipeline from Romanian Constanta to Trieste in Italy has been discussed in this connection (Mannerjalustatyöryhmä, 2001). Another major oil transportation route can be the proposed oil pipeline from Nenets oil fields to Indiga (Barents Sea area). This pipeline in the northern Russia may have the transfer capasity of 30 million tons.the proposed schedule of the project is complete the first phase in The transport capacity will be 10 million tons in The full capacity of 30 million tons would be in operation in Another proposal in the North Western area is LukOIl's new terminal proposal near Murmansk.. LukOil has already a terminal in Varandein.
76 74 (152) Russian government approved the new programme to exploit natural resources in August According to the programme the annual oil production rates of Hanti-Mansi and Jamal-Nenets will be 220 million tons up to the year The annual oil production rate of Nenets, Barents and Kara Sea offshoe fields will be 40 million tons, and Sakhalin area around 20 million tons. There are also proposals to start offshore oil production in the Baltic Sea area. The known offshore oil reserves near Kaliningrad are 24 million tons. This (Kratsovskoye) oil field locates around 40 km offshore from Kaliningrad in the water depth of 30 m. The Port of Ust Luga is free of ice around 250 days per year. The entrance channel will de deepened to 14.0 m which enables the use of dwt bulkers fully loaded. The new ferry line between Ust-Luga and German ports are under design. This new line will be financed by the EBRD Bank. The Russian Railroads Ministry and Oil Company LUKoil have signed a cooperation agreement stipulating the delivery of crude oil inside railroad tankers to an oil-export terminal on Vysotsk island. Plans are in place to use this terminal for exporting oil to the Western Europe and the United States. Five million tons of oil will be delivered to Vysotsk from Siberia over the period. The total annual capacity will be million tons by the year 2005 (Russian Economic News, ). The Primorsk oil terminal's location in the eastern part of the Gulf of Finland requires special arrangements for the winter time. Already the first oil tanker (MT Petrokrepost) visiting Primorsk oil terminal in December 2001 needed a lot of icebreaking assistance after loaded and starting her voyage from the port. The departure scenario included also an impressive and expensive icebreaker convoy (Kroutikhin, 2002). Ice cover for 120 days per year, shallow waters and abundance of small islands along the approaches to the terminal make Primorsk a challenging location for large tankers. There has been a lot of speculations on the economics of the Primorsk terminal. The main argument is the transito money Russia is now paying to the Baltic counties will remain in Russia. The fact is the maximum loading fee at Primorsk plus the port dues made $ 4,58 per ton in December The corresponding figure for Ventspils was $ 4,7 per ton. In spite of the apparent benefit, the other expenses tip the scales in favour of the Latvian route: Shipping costs are more expensive and the need for ice breaking assistance during the winter time is higher in Primorsk. However, now also LUKOil is building up a new terminal, Vysotsk, to the end of the Gulf of Finland. here the favourable rail tansport fees might be one part of the story the other part being the getting an independent oil route. It should be remembered, that a special additional tariff of $ 1,43 for each ton oil shipped via Transneft's pipelines was launched by the Government in order to finance the Baltic Pipeline System's pipeline (Kroutikin, 2002). LUKoil's new terminal in Varandei will also give some advantage to the oil company. The costs of delivery to Rotterdam for example from varandei is according to LUKoil $ 18 per ton if dwt tankers are used, and only $ 11 in the case of shipping oil in dwt tankers. On average, this is only 40 % of transportation costs via the BPS or Ventspils. Thus, it is likely, that economics may change the develeopment scnenarios a lot in a longer term. Currently the Varandei terminal is capable of exporting 1,2 million tons per year, but LUKoil is planning to expand it by 2005 to accomodate up to 7,5 million tons of Timan-Pechora crude oil (Kroutikhin, 2002). The estinated costs to reach 7.5 million tons boarder line is $ 200 million, and upgrading Varandei's annual loading capacity to 30 million tons requires another $ 1,5 billion.
77 75 (152) LUKoil is also recently published new plans to build up a terminal near Murmansk for loading oil intgo ocean-going tankers. This plan has encountered a positive reaction of oil producers in northern Russia. However, this proposal faces competition from Gazprom, which advocates a similar terminal in Pechenga (Zhuravlev, M. & Simonenko, R. 2002). The new Russian oil terminals and designed rehabilitation projects of exisisting ports will affect on the main oil transport routes also in the Baltic Sea area. Surgutneftegaz is building the oil terminal in Batareinya, the St. Petersburg Sea port is expanding its capacity to handle petroleum products, Ust-Luga and Primorsk oil terminals are in operations and expanding, new Vysotsk terminal will be in operation in Furthermore Varandei and other possible new terminals in the North-western Russia may change the view a lot. Even the Kandalaksha port in the White Sea may have more importance when transporting gasoline, diesel oil and furnace oil from Russia and Kazakhstan. In a long term The Russian new transport and loading capacity will decrease the transito oil traffic through the Baltic countries. However, here the Baltic ports can compete with the port dues and loading tariffs. It is also fact, that now larger export capacities are alrfeady impacting Russia. two year ago producers were able to export roughly 35 % of their oil and had to sell rest at the domestic market at low market prices. In 2001 they could sell up to % of production abroad, and even more in the future. Thus, if the annual production rate will still incease by 10 % and the markets to export oil are favourable the scenario where also the Baltic transito terminals keep their current volumes up to 2010 is possible. This scenario means the main oil routes in the Gulf of Finland and in the Danish Strait will be more crowded than expected in this report. This increase may by more than 20 % in connection of the oil transportation and the number of ships passing certain points under discussion. The oil production development of the Caspian area may and will also influence on the Baltic Sea development. Table 30 and Table 31 show the forecasts for the Caspian offshore oil production development and the total export rate of the area up to These development figures are huge and may dampen the expected increase of the oil transportations along the Baltic Sea area. Table 30. Oil [million tons] and gas [bln m3] production rates at Caspian offshore (Gribov,S. 2002) oil gas oil gas oil gas Table 31. Forecast of the exported oil in million tons from the Caspian region (Gribov,S. 2002). Country Azerbaijan Kazakhstan Turkmenistan
78 76 (152) There are a lot of different scenarios, which all have slightly different assumptions on the development trends and the future oil transportation rate. The past Baltic Oil Pipeline project (BOPS) consisted of the construction of the Primorsk oil terminal, pipeline alternatives bringing an additional million tons of Russian oil to the markets. The project included also an analyses to continue the oil pipeline from Primorsk to Sköldvik in Finland to be further transported as transito oil. An other project parallel to BOPS was the Western Pipeline Network (WPN) to build up a new pipeline from Polotsk of Belarus to Ventspils. The new pipeline connection will increase the capacity by 18 million tons. if constructed this would increase the Ventspils capacity up to 57 million tons annually. The objectives of the Northen Gateway Project, NGP is to construct oil pipeline network and the terminals to the Pechora coastline, in order to pump the oil of the Timan-Petchora region to the markets. The sea transport would be arranged by ice strengthened tankers of dwt. For the overseas transport the oil will further upload into the dwt tankers. A suitable unloading/uploading place would be the Pechanga Bay near Murmansk which is open bay also during the winter area (Jolma, 1999). Perhaps the most urgent construction or rehabilitation need exists with the poor condition of the main pipelines. The main pipelines go in east-west direction from the Siberia to the eastern part of Europe. The main pipeline "Druzhba" had a capacity of million tons annually. The sub pipeline to Ventspils can carry million tons, and the southern sub line leads to the Black Sea terminals, Novorossiik and Tuapse, and furthermore to Odessa in Ukraine (Jolma, 1999).
79 77 (152) 6 Future development 6.1 Transportation development There have been published several forecasts on the transport development of the Baltic Sea area. The general trend, i.e. the growth of the maritime traffic is expected to continue, as stated in (COWI, 1998b) and presented in Table 32. Table 32. Expected growth in volume of trade in the Baltic Sea from 1995 to 2017 (COWI, 1998b). Commodity Volume in Baltic Sea (Mio tons) Estimated future volume in Baltic Sea (Mio tons) Growth from 1995 to 2017 Break Bulk % Dry Bulk % General Cargo % Liquid Bulk % Oil % Total % Source: COWI's estimate Table 33 shows that the volume of maritime traffic is expected to double in average, with a growth by a factor of three for general cargo and break bulk. Oil transport is only estimated to grow approximately 40 %. This might be a slight underestimation, since the trade with oil from Russia may potentially grow even more. Table 33. Average annual growth rates (COWI, 1998b). Cargo Type Average Annual Increase (%) General Cargo, container, Reefer, RoRo 4.7% Bulk 2.2% Bulk/Oil, Oil, Gas 1.4% During there has been an average annual growth rate of 8% in the eastern harbors of the Baltic Sea. According to Ref (COWI, 1998b)this large growth is assumed to moderate over the coming years and the growth rates shown above seem plausible for the Baltic region as a whole. In order to understand the possible development trends some of the main factors affecting on the development are discussed below.
80 78 (152) Prognosis for the following decade up to 2015 The average number of calls in Finnish ports (Hamina, Kotka, Loviisa, Helsinki, Inkoo and Hanko) has been estimated to be per year in If the capacity of Russian seaports will then reach 100 million tons, and Estonia million tons, the rough estimate for the Gulf of Finland would then be port calls per year, i.e., calls per day. Due to the fact that traffic is not evenly distributed throughout the year, there will be days when the traffic density of the Gulf of Finland may easily be more than calls per day. It is a fact that tanker size has increased for oil transportation; for example, the average tanker size visiting the port of Muuga was tons in 1998, but in 1999, it was already tons. This year (May 2001), the average tanker size was already tons, and will probably increase even further, which is why a new pier for two dwt tankers is being designed. If the average annual growth rate varies between 2 7%, the following statistics can be calculated, based on the statistics of Table 34. Here it has been assumed that the average long-term growth rate for Finland, Sweden and Germany is 2%, for the Baltic countries and Poland 4%, and for Russia 7%. The Russian growth rate is mainly based on expectations for oil transportation. Table 34. Prognosis for maritime traffic in the Baltic Sea area in 2015 (VTT, 2001). Country Total loaded and Total loaded and unloaded [million unloaded in the ton] Baltic Sea area Sweden (2%) Finland (2%) Russia/Baltic (7%) Estonia (4%) Latvia (2%) Lithuania (4%) Poland (4%) Germany/Baltic (2%) Denmark (2%) Norway (2%) TOTAL Oil tanker movements in 2015 The forecast of oil tanker movements in 2015 is shown in Figure 47. The general assumption has been made, that the maritime transport development will continue as stated in Table 34. Thus the annual growth rates vary between 2 and 7 % depending on the country or port under survey. The most rapid growth of the oil tanker traffic is assumed to take place in Russia and in Baltic Countries. It is also assumed, that due to the increased demands for energy in all the baltic countries, the oil transportation will increase in all the Baltic Countries, at least in the minimum level of 2 % annually.
81 79 (152) Also it has been assumed, that 40 % of the new Russian oil transportation will stay inside the Baltic Sea area, and 60 % will go outside the area. The proposed increase of the oil transportation of the new oil terminals is based on the following assumptions: - Primorsk oil terminal will reach 24 million tons in 2015, - Batareinya oil terminal will be in operation in 2015 with the annual throughput of 6 million tons, - St Petersburg Sea port will have only moderate growth of oil transito, increment arround 2 million tons in 2015 compared to the level 2001, - Port of Muuga will grow in spite of the Russian own terminals. The new terminal proposal (seventh terminal of the area) will bring 2-4 million tons of oil additionally to the figures of 2001, thus it is more likely the Muuga Port may still have a growth, but later the development will slow down. The increment up to the 2015 has assumed to be 6 million tons compared to the current situation, - Riga, Ventspils and Liepaja will have increments of the annual oil throughput of 2.2 and 0.4 million tons, respectively and - Klaipeda and Butinge will have 3.0 and 5.5 million tons increments cmpared to the current situation. Figure 47. Forecast of the oil tanker movements in 2015.
82 80 (152) For oil transportation in certain ports the following prognosis can be presented for up to 2015, Table 35: Table 35. Prognosis for the oil transportation volumes of certain Baltic oil terminals in 2000 and Country/port/terminal In 2000 In 2015 Estonia/Muuga/Miiduran da/etc Finland/Hamina Finland/Porvoo Latvia/Riga Latvia/Ventspils Latvia/Liepaja Lithuania/Klaipeda Lithuania/Butinge Russia/St. Petersburg Russia/Primorsk Russia/Batareinya Russia/Kaliningrad Total [10 6 tons] 79.8 million tons million tons As can be seen, the annual oil transportation volume should exceed 130 million tons in Preliminary risk assessment for the Gulf of Finland The marine traffic between Finland and Estonia has grown significantly during recent years. The figures for passenger traffic increased in the period of by 23-fold. For example, there were more than 6 million passengers between Finland and Estonia in Also the longitudinal traffic along the Gulf of Finland is great, and will increase during the next years, after the new terminals and port rehabilitation have been completed both in Russia and Estonia. An interesting feature of the development has been the new fast catamarans and hydrofoils together with the traditional car ferries. The fast catamarans only run during open water season. They cannot be used in ice conditions or in heavy weather, even in open water season. There are, however, more than 30 port calls a day between Helsinki and Tallinn in summer. The intense sea traffic may decrease, at least temporarily, when Estonia enters the European Union. The free capacity of the transportation vehicles may then be transferred to other routes, for example, to other Baltic or Russian ports.
83 81 (152) Another feature that has changed the traffic image of the central part of the Gulf of Finland is the sea-borne traffic between Sweden and Tallinn. During recent years, the increase in traffic has been significant; in 1980, turnover was over 3 million tons; in 1997, it was already at 9 million tons. It has been estimated that this rapid growth will continue, but it will stop soon and reach a level of 6 9% of the total marine transportation volume for Sweden. This would equal approximately million tons annually (VTT; 2001). After the accident of MT Erika near the French coastline, followed by a chemical tanker accident, and later the ship collision in March 2001 (Baltic Carrier's oil spill), a strong debate has been carried out in the EU to find out methods of improving maritime safety and protecting the environment against oil spills. The Union's traffic ministers, for example, discussed safety matters on the tighter control of classification societies, ship structural matters and port state control 28 March in Brussels. The establishment of the European Maritime Safety Agency is also under progress, and at the HELCOM level, the safety issues were discussed in the special ministerial meeting in September Ship routing and mandatory reporting system of GOF The design work has been completed as a joint technical working group between Russia, Estonia and Finland. The Finnish work has been coordinated by the Ministry of Traffic and Communications. The Finnish Maritime Administration appointed two working groups to finalize the plan according to the Finnish point of view. The work will be presented to the international working group in November After the international working group has evaluated and studied the proposal, the proposal will be left to IMO in February 2002 for further measures. The new routing and mandatory reporting system should come into force in 2004, after which all ships of 300 gross tonnage or over on voyage to GOF ports or on voyage between GOF ports through the reporting area (Figure 48) must report to the authorities. The contracting states will agree on the information requested. The eastbound vessel traffic will report to Tallinn VTS Centrer and the westbound traffic to Helsinki Traffic Center. The reporting format contains basically the same data that can be accessed later on from AIS, which will be an acceptable means of giving the report. The System will cover the international waters of the GOF eastward from ' E. HELCOM's Extra-Ordinary Ministerial meeting 10 September in Hamburg pointed out the importance of creating a ship routing and mandatory reporting system to improve maritime safety. The new system will enhance the safety of navigation by reducing the risk of collision or grounding and thus protect the fragile ecosystems of the Gulf of Finland.

84 82 (152) Figure 48. The mandatory routing system proposed for the Gulf of Finland starting in The routing system is part of the VTMIS system for the Gulf of Finland. 6.2 Passenger traffic development The main routes for the passenger traffic have been traditionally between Finland Åland, Finland Sweden and Finland Estonia (especially after the disintegration of Soviet Union) and Denmark Germany and Denmark Sweden. The Great Belt bridge may change the water borne passenger traffic figures between Sweden and Denmark in the future, as has been happened in the traffic between UK and France after the Eurotunnel. A new fast Ropax line has been opened between Germany and Finland (Hanko) recently. In 1998 level more than 40 million tones of cargo are transported on the main international ferry routes. This means approximately 1.8 million trucks and trailers and railway wagons. Also more than 50 million passenger are using international ferry lines annually. For example the ferry lines between Helsinki Stockholm and Helsinki Tallinn represent around 10 million and 6 million passengers annually, respectively. Other main passenger links are Denmark Sweden and Denmark Germany. These main links together with the Finland Sweden Tallinn represents around 40 million passengers annually. The busiest link has been the Öresund area between Sweden and Denmark around 18,9 million passengers in Other passenger links are Gothernburg Fredrikshavn and Varberg Grenå. Between Denmark and Germany main route is between Rödby Puttgarten or Gedser Rostock, around 9 million passengers annually. Swedish German traffic is concentrated in the ports of Trelleborg, Gothenburg and Malmö in Sweden and Rostock, Travemunde and Sassnitz in Germany (Ingo, S et al. 1999). Depending on the distance of the sea link, ferries vary in size and type. Car ferries between Helsinki and Stockholm or Turku and Stockholm are luxurious ships with a lot of cabins, restaurants and attractions for passengers. Simultaneously these ships can transport a lot of cars and trucks. Also the new Ro-Pax type vessels between Hanko in Finland and Rostock in Germany have much more room for the passenger comfort compared to the ships of older generation. The changes in regulations concerning duty free sales or bridges are the main driving forces affecting on the
85 83 (152) passenger traffic. The bridge over the Great Belt was opened in July 2000, and a lot of traffic and cargo which before was transported via ferries are now going by trucks over the bridge. The EU duty free rules have also led to the development that passenger ferry traffic in the Gulf of Bothnia has decreased a lot. The link between Vasa Umeå was even closed, but has been reopened with a certain subsidization of the governments of Sweden and Finland. Other threatened or already closed ferry links have been Halmstadt Grenå, Skellefteå Jacobstad, Bagenkop Kiel and Gothenburg Copenhagen (Ingo, S. et al. 1999). Traffic to the non-eu countries has been continuos and the duty free sales has given a big deal of the share of the shipping companies. Due to the new regulations the formerly direct links between Sweden and Finland are routed via the Åland Islands. New ferry routes having a good forecast for more intensive traffic are Stockholm Riga, Karlshamn Liepaja, Frederica Klaipeda and Århus Klaipeda routes. Expansion with the existing routes from Sweden to Poland is also expected. Ingo et al has made an estimate that the passenger traffic will decrease in the near future. The figures of the southern Baltic and Öresund have already declined slightly since the beginning of The abolition of the duty free sales will decrease the total passenger volume of the Baltic Sea from the level 96 million passengers to the level 75 million in However, if the duty free-sales would continue the traffic figures can stay in current level. In other words, if the shipping companies can find compensating routes for the ex-duty free lines, the passenger traffic will not decrease as stated in the forecast above. Last year the passenger traffic between Tallinn and Helsinki was around 6 million passenger. This figure is not expected to grow anymore. After Estonia would be the member of EU, the passenger traffic will decrease due to the disappearance of tax free shopping. However, in a short term this apparent decrease on the passenger traffic will be transferred to other routes, i.e. to other Baltic Countries and Russia. Passenger ferries transport also a large amount of lorries and trucks with high value goods. A ferry is more expensive to operate than a conventional RoRo-vessel, which in turn is more expensive than a LoLo-vessel. When the distance increases the competition with the airlines or even longer land routes increase. Ferries usually sail according to a certain timetable where the arrival and departure times have been fixed to suit well for the customers, both passengers and the truck traffic. Due to the fact the statistical presentation above does not include passenger traffic (car ferries), the following chapter will highlight this side of the traffic development: The two main routes for passenger traffic have been the links between Finland and Sweden and Finland and Estonia. The amount of passengers from the ports of Turku and Helsinki to Stockholm and Kapellskär was nearly 10 million passengers in In the route Helsinki Tallinn the figure has been around 6 million in These figures are not expected to grow anymore. By the year 2004 the allowed amount of alcohol imported by the passengers is lifted in Finland to the same level of other countries, and as a result the sale income of the passenger ships may be cut. Ref. (Venäläinen & Viitanen, 2001) suggest even % decrease in shipping capacity, which may be realistic after Estonia after joining EU will loose the tax free sales. The greatest share of a passenger ship's gross income consists of sales income from restaurants and shops. This fact combined with new taxation policy will encourage shipping companies to establish new routes between EU countries and other Baltic countries and Russia. Thus it is expected, that the passenger traffic volume in Finland will remain in its current level also in the future.
86 84 (152) In Estonia the EU membership and good relationship with Russia can increase the passenger traffic figure significantly in the future. All the scenarios presented in (Venäläinen & Viitanen, 2001) show growth figures 120 % up to 300 % up to year Other Baltic countries will have more moderate growth figures than Estonia. The most intensive growth will be taken place in Riga in Latvia where the 0.5 million passenger rate in 1998 is expected to rise up to 1.4 million passengers in This might be underestimated, especially when Estonia will join EU, and the ferry companies will find out alternative routes to keep their competitiveness as good as possible. In the southern Baltic the most intensive growth rate of the passenger traffic is expected to take place in Poland, where the passenger traffic is forecast to more than double by the year Both Gdansk and Gdynia is expected to get more importance as passenger ports. The 1.6 million passenger level in 1998 is expected to exceed 2 million in 2010 and to reach 2.4 million passengers in General cargo transport development The total traffic forecast for Sweden is expected to be 27 % from 1997 to 2010, which gives the average annual growth rate around 1.9 %. The biggest growth is expected to be in road transportation, while railway transportation growth is assumed to be lowest. The maritime transport is expected to grow by around 20 % between 1997 and 2010, thus the annual growth rate near 2 % is well supported also by the Ref (Venäläinen & Viitanen, 2001). Reference (Venäläinen & Viitanen, 2001) estimates Finnish maritime transport to reach the level 110 million tons annually in 2010 and to be close 130 million tons in Latvian maritime transports are forecasted to double by the year 2020, which would equal around 120 million tons by the year 2020.However, the prognoses presented in (Venäläinen & Viitanen, 2001) expect, that the Ventspils oil terminal will increase its throughput significantly, in spite of the new Russian oil terminal developments. Ventspils oil terminal of the 22.1 m tons in 1998 is expected to reach 55 million tons in 2010 and 75 m tons in This might be overestimated due to the Russian own terminal and port developments. However, Riga and Liepaja will have a good potential for a higher growth rate due to the following reasons: - free territories will attract investors, - rehabilitation and modernization of infrastructure, - new terminals, - passenger and cargo development in Riga, - good geographical location and - advantageous conditions for industry. As in Latvia the expected maritime transport rate is expected to increase significantly. Ref (Venäläinen & Viitanen, 2001) propose the Klaipeda port will double its transport compared to the year Thus the cargo transport rate would be around 35 million tons in 2015 and over 40 million tons in Poland seaborne cargo transport development as presented in (Venäläinen & Viitanen, 2001) is shown in Table 36.
87 85 (152) Table 36. Forecast for the maritime cargo transport development in Poland. (Venäläinen & Viitanen, 2001). Poland / main port Poland (main ports) 50,6 76,5 94,5 Gdansk 20,6 40,0 50,0 Gdynia 8,0 11,0 12,5 Szczecin - Swinoujscie 22,0 25,5 32,0 In Germany the growth is expected to follow the foreign trade development of Scandinavia, Baltic countries and Russia (Table 37). The infrastructure development in Mecklenburg Vorpommern area will eliminate current transport bottlenecks, thus the competitiveness of ports will be increased. Most advantageous prospects for the future development in German Baltic Sea ports have been put to Wismar, Rostock and Sassnitz. Table 37. Forecast of the main German ports development and their capacity in 2015 in million tons (ISL. 2000). Port Throughput 1998 Throughput in 2015 Capacity in 2015 min max Kiel 4,13 5,44 6,48 7,55 Puttgarten 6,23 8,91 8,45 Lubeck 24,69 38,67 39,28 39,87 Wismar 1,85 3,22 3,01 Rostock 18,49 32,78 31,76 32,37 Stralsund 0,60 0,75 0,93 Sassnitz 5,54 11,47 11,46 12,48 Total 61,90 101,24 101,36 104,56 The prognoses of the Baltic Sea traffic, i.e. the ship passages in 2015 has been shown in Figure 49. The numerical values are also shown in Table 38.
88 86 (152) Figure 49. Forecast for the ship movements in Note: the passenger traffic is excluded. Point v.2000 v Table 38. Traffic volumes in Figure The maritime traffic development of the Gulf of Bothnia Export shipments through the Finnish ports in Bay of Bothnia are forecast to grow to 7.5 million tons by the year In tonnage the largest increases will come from exports of paper and metals. The average growth rate will be 2.4 % annually for the basic industry export. This is based on the industrial investment of the area carried out during the recent years and proposed new investments (Iikkanen, 1999).

89 87 (152) Seaborne import through the Finnish ports of the Bay of Bothnia is assumed to grow to 9.9 million tons by the year The largest increases will be in the import of ores, concentrates, coal and coke. Large investment have been carried out in Tornio and Raahe which will support the expectations for the increased need of raw materials. The import of minerals required in the paper and chemical industries is also assumed to grow. The annual growth rate will equals the export rate, i.e. 2.5 % per year. The export and import through the Finnish Ports of the Bay of Bothnia is shown graphically in 1981 up to 2010 in Appendix 25. The annual growth rate of 2.5 % for the export and import is in balance with other forecasts, i.e. inside the range of % for the general annual growth rate of the seaborne traffic. Later, however, a growth rate of 2.0 % is used due to the following reasons: The road network to the Northern Russia s is poor, without significant investment and reconstruction the link through the bay of Bothnia is not attractive. The present economic situation of the Russia s northern economic area is still poor, which also will decrease the economy. Sea area is ice bound six months per year which will increase transportation costs. Most of the cargo is raw materials with low added value of industrial products and finally the population centers of the Northern area are small and scarce. Thus the 2.0 % annual growth rate is even an optimistic forecast. However, if the oil and gas resources of the northern part of the Russia will be exploited in larger scale, the proposed Barents and Archangel Corridors may cause rapid increase of port throughput in the Bothian Bay area. The uncertainties of the Russian legislation do not encourage foreign investors to develop the huge oil and gas resources, which would be the prerequisite for the fast development. there are railway proposal as connections between Ledmozero / Kockoma, Salla - Alakurtti and Karpogory - Vendiga between Finland and northwest Russia which can turn the development to the better growth rate, Figure 50. Figure 50. Itineraries between the Northern Finland and NW Russia (Viatek, 1996).
90 88 (152) 6.5 EU's contribution European Union has regulations related to maritime sector. Main EU regulations concerning the competition in the maritime sector are 4055/86, 4056/86, 4057/86, 4058/86 and 3577/92 (Perälä, H. & Venäläinen, P. 2001). Free competition is one of the main issues and following aspects must be fulfilled in port operations: - no discriminatory aids, - no abuse of dominant position, - no anti-competitive arrangements, - essential facilities and an operation of such facility may not, without a objectively valid reason, refuse to supply a service. EU has principles concerning the pricing in transport sector. The Green paper on Towards fair and efficient pricing in transport policy (EU 1995) emphasizes the user pays principle. More recent the White Paper on Fair Payment for Infrastructure Use (EU 1998) recognizes the relatively low infrastructure costs of shipping and external costs with the other transport modes. The paper proposes environmentally differentiated fuel or fairway charges. However, there are a lot of different fees and dues of the ports, such as fairway and lighthouse dues, pilotage fees, port, vessel and cargo dues etc. Usually ports may have published tariffs of their services, but in practice the pricing is more often based on negotiated rates than the tariff. EU is also controlling subsidizing measures in the maritime sector, and is against such politics. However, at the moment there are no agreements on the application of competition rules for maritime transport, including restriction of national aid schemes. The Community Guidelines on state aid to maritime transport (97/C205/05) states that in principle operating aid should be exceptional, temporary and digressive (Perälä, H. & Venäläinen, P. 2001). The outflagging of merchant fleets has been widely used operation also among the Countries of the Baltic Sea area. The main reasons for outflagging are usually high crew costs, bureaucracy, high compliance costs with the requirements of the domestic flag, unavailability of skilled labor and fiscal reasons. Table 39 shows the outflagging rate of the Baltic Sea region. Table 39. Fleet controlled by the shipowners of the Baltic Sea area according to countries of domicile as January 1 st Ships 1000 GT and more (ISL, 1999). Country Number of ships controlled 1000 dwt Foreign flag dwt % share Sweden % Finland % Russia % Estonia % Latvia % Lithuania % Poland % Germany % Denmark % TOTAL %
91 89 (152) 6.6 Development trends Sea transport plays an important role in the Baltic Sea region where around one hundred million people live around a common water basin (Källström & Ingo, 2000). Throughout the centuries sailing has been the base for trade and contacts. There have been long periods of significant maritime cooperation, e.g. during the Hansa period, but also periods of hard competition. Most of the ships are only calling at ports inside the Baltic Sea. Ports in northern Germany have been and continue to be important centers of trade in this area. The role of Poland is increasing together with the intense development of Baltic countries. There are several trends describing the future development of the Baltic Sea area. Trade and the development of human capital are the most important prerequisites for the economic growth. The development of the waterborne transport has consequences for land use and infrastructure while ferry transport also has a structuring impact in the Baltic Sea area. These flows have a tendency to be part of transport corridors linking urban centers in a network of road and rail (multimodalism) on land with a sea transportation meeting all kinds of needs for commercial and non-commercial activities (Källström & Ingo, 2001). The estimated trends may relate to manufactured goods with a comparatively high value. However, many ports make their living from handling of low value bulk cargo, as the typical transito ports. These transport systems are not so complex than the systems for finished and semi-finished products. Oil transportation will form one interesting trend affected by the changing world market price changes and the oil exploitation development of the whole market area. The most probable trends affecting on the logistics will be product specialization and the production development requiring frequent deliveries and smaller consignments. The frequent traffic and new RoRo-connections reflect this development. The adaptation of the new information and telematic systems, for example internet, will influence on the maritime traffic logistics, too. Internationalization and new alliances will also change the geographical pattern of transport demand. Globalization and realignment of supply chains will taken place. It is also likely, that the strong development of containerization will continue together with the inter-modal transport to reduce the transport costs. New technologies and changes in regulations have also a considerable effect on the sea transport. New generation vessels have offered better economics, faster transport ability and more competitive routes. Also in the winter time traffic certain new hull forms and operational concepts may offer advance operations in the future (for example the DAS concept). European Commission promotes the introduction of a European policy towards more efficient ports and improved maritime infrastructure through their integration in a multimodal trans-european network including the main network of the neighboring regions (Källström & Ingo, 2001). The measures supporting the short-sea shipping and ports with multimodalism are supported by EC. One of the issues to be mentioned is how to create a fair transport pricing system covering all transport modes.

92 90 (152) General development trends area perspective Geographically, the future water borne traffic of the Baltic sea area can be divided into three main areas: - the Central Baltic Sea, mainly due to the rapid development of the Baltic countries and Russian sea ports and new terminals, - southern parts of the Baltic Sea, mainly due to the proposed traffic links between Poland, Latvia, Lithuania, Kaliningrad and - the Øresund area where the development of the former eastern Germany, bridges and proposed new infrastructure development will promote the growth and new links. Trade in the Baltic Sea is dominated by the exchange with Germany. In 1996 the value of Swedish trade with the Baltic countries, Poland and Russia was less than the Swedish Finnish trade. According to (Outlook, 2000) the total seaborne trade was estimated 425 million tons, 40 % which is intra-regional. Almost 80 % of the ships making a call in a NBSR port are either coming from or going to another Baltic Sea area's port. Depending on the ship type the following table can be drawn (Figure 51). It can be noted, that passenger ferries have the largest part of their voyages inside the Baltic Sea area (around 90 %) while the share of gas and container vessels in the Baltic Sea area is around 60 %. The dominance of tank and bulk in the ports was clear, as can be seen from Figure 52. Figure 51. Share of intra Baltic Sea region based on the ship types (Source: Outlook, 2000).


93 91 (152) Figure 52. Estimated waterborne cargo distribution in the Nordic Baltic Sea Range GDP development Thew long-term growth expectations of the GDP for the Baltic countries is shown in Figure 53. The figure presents the GDP development forecast for three periods, i.e , and The figures presented show the average annual growth as percentage based on the foreign trade model of the Swedish national model system for goods transports (Venäläinen & Viitanen, 2001). Figure 53. The long-term GDP growth [%] of the Baltic countries.
94 92 (152) The figures show rather high growth rates for Russia, Poland and Baltic countries. There are other published forecasts which indicate smaller growth rates for Russia, i.e annually (Ocean Shipping Consultants 1999). According to this reference, EU's growth rate up to year 2009 has been estimated to vary between annually. Another forecast for the GDP development is shown in Table 40 below. As can be seen the latter forecast gives slightly smaller figures for Finland and Baltic countries in 2010 and The general development trends, however, are close each other. Table 40. GDP development which is one good measure to evaluate the future maritime transport development (Källström, L. & Ingo, S. 2000). GDP Development Sweden 2,1 2,1 Norway 2,6 2,4 Denmark 2,5 2,5 Finland 2,4 2,2 Germany 2,2 2,0 Russia 2,5 4,0 Poland 4,0 5,0 Lithuania 3,0 4,0 Latvia 3,0 4,0 Estonia 4,0 5,0 6.7 Oil production scenarios During the Soviet Union time the annual oil production rate was over 600 million tons (12 million bpd in the mid-eighties). In 1992 the supply collapsed in the former Soviet republics, and the production rate of Russia collapsed, too. The lowest rate has been around 300 million tons, but has been increased around 20 million tons annually, and exceeded already 340 million tons last year (4 million barrels per day). Russian oil companies have also made contracts in Iraq and Iran, thus strengthening their positions compared to Saudi Arabia and other producers (Mitchell, A, ). Western oil companies are preparing to invest $45 billion to the development of Sakhalin oil field to serve China, India, Korea and other parts of Asia (Fulford, B, ). Shell alone has already invested more than $2 billion and plans to use an additional $9 billion to develop Sakhalin II. The proven reserves of Sakhalin II are 20 trillion cubic feet of gas and 1 billion barrels of oil. Exxon is the leading western oil company in Sakhalin I. Other factors affecting to the Baltic development is the new oil pipeline to pump Kazakhstan oil across southern Russia to the Black sea. Russia' share of the world oil market is currently around 10 percent in terms of export volume and a little more than 6 percent by value. OPEC's market share is today around 40 percent. The unused capacity of OPEC countries is roughly 4.5 bpd.
95 93 (152) If the oil price will increase it will not be so beneficial for Russia than the low oil market price. A $1 drop in oil prices means an increase in GDP growth rate of about 0.9 percent. A lot of new jobs could be preserved, as happened in the period During the last low oil price period (September 1998 April 1999) industrial growth was 18 percent in Russia with machine building growth by 50 % and light industry by 52 %. When oil price rose to $20 per barrel, industrial growth slowed to 9 %, and later from October 2000 to June 2001 with a very high oil price, industrial growth fell to 2 %, and some months ceased completely (Ilarionov, A. 2001). The low oil price will slow down the growth of the budget revenues in dollars, but the decrease will no be a catastrophe in Russia. However, Russian economy remains very sensitive to changes in the oil price. There has been discussions originally initiated by the OPEC countries to reduce the Russian exports of crude by barrels per day from January However, there have been similar discussion in the past, but Russia has continued to export oil as much it can do to help to repay the $140 billion foreign debt (Zhdannikov, D ). First pipeline to pump out Kazakhstan oil has been built. The aim is to deliver 3 million bpd in the following 15 years to the markets. Pipeline was built by the 11 member Caspian Pipeline Consortium. The capacity of the pipeline will be later 1.3 million bpd, which will easily handle the current output of the Tengiz oil field around bpd. The output of the Tengiz field is expected to rise up to bpd by the end of this decade (Pala, C. 2001) Middle Asian development The oil and gas resources of the Middle Asian are under a severe competition of national oil companies, foreign investors and enterprises. The new oil findings of the Caspian Sea and Afghanistan have raised the interest of European, American, Russian, Chinese and Iranian capital to invest on the giant project plans of the area. The resources have been estimated huge: It has been estimated, that Kazakhstan can produce more than two million barrels oil per day in Also the new pipe line proposal of Azerbaidzhan could increase the oil production by 1.5 million barrel per day (Kankare, 2001). It may be realistic to assume, that Kazakhstan and Azerbaidzhan can sel oil in around four million barrels per day. Furthermore the new oil findings of the Kashagan area in Kazakhstan may even rise these speculations. The Kashagan oil field has been estimated to be larger than 30 million barrels. However, it is the largest oil field found for decades. The exploitation of these resources can change the oil transportation development of the Baltic Sea area. The oil companies will invest to the Middle Asian oil & gas production in the following five years more than 15 billion dollars, which may affect on the main oil and gas transportation routes to Europe too.
96 94 (152) 6.8 Impact scenarios The most important impacts of the Baltic Oil Pipeline project, i.e. the execution of the new oil terminals of the Gulf of Finland will be according to the Ref.(COWI, 1998) : The probability of a sensitive area being affected by oil due to BPS is highest in Danish waters, the Western Baltic south of Sweden and the Gulf of Finland west of Porvoo. The long time average amount of oil spilled into the Baltic will increase by approximately 10% (~170 t/year) compared to the expected "background" spill in the year In the Gulf of Finland this increase will be approximately 20% (~24 t/year). The risk for spills smaller than 10,000 tons in the Baltic Sea is not changed significantly. The risk for spills between 10,000 and 100,000 tons is increased from 1/75 years to 1/50 years for the Baltic region in the year 2017 due to the BPS project. The risk for a spill of this large size increases by 35% for the entire Baltic Sea and by 100% for the Gulf of Finland. Compared to alternatives the Baltic Sea route is the best prepared for coping with an increase in tanker traffic regarding background environmental organizations, legal framework and oil spill response capabilities, nationally and in the region. The most noticeable effect of BPS is an increase of more than a factor of 7 in oil tanker traffic larger than 100,000 DWT in the Gulf of Finland. The effect is down to a factor of 1.6 in the Great Belt (COWI, 1998). The total volume passing through the Gulf of Finland will increase markedly. The effects of BPS are smaller when the increased traffic is related to the total traffic increase in the Baltic Sea.
97 95 (152) 7 Applicability of FSA-method in producing effective risk control options in order to reduce the risk of oil spills in the Baltic Sea area 7.1 What is FSA Shipping is governed by several rules. The safety-related rules of today are predominantly prescriptive, quite often derived as a reaction to a disaster at sea. Thus, the traditional way of rulemaking has lead to a multitude of rules. The cost-effectiveness of a new rule and its coherence with other rules have probably not been the leading thoughts in the rule-making process. As a result of public pressure and haste to make a change, the new rule may not be an optimal solution to the problem. The effects of some rules may be even questionable. In this respect, a new, more scientific way of thinking, i.e. a formal methodology supporting the regulatory process, might be more useful. FSA (Formal Safety Assessment) is a method which is recommended by the IMO to be used in the regulatory process IMO, FSA is a risk-based, systematic and sturdy approach to safety management. It is a rather new methodology for rule-making, which applies a scientific approach of thinking. If correctly applied, FSA applications are transparent, traceable and repeatable. FSA acts in a pro-active way: it should put emphasis not only on risks which have lead to accidents, but also on risks which may have severe consequences. FSA consists of the following five steps (Figure 54): 1. Identification of hazards 2. Assessment of risks 3. Generation of risk control options 4. Cost benefit assessment of the risk control options 5. Decision making recommendations concerning the options available The first step, identification of hazards, should give a comprehensive answer to the question: "What can go wrong?" The result of this phase is a list of all relevant accident scenarios. The purpose of the second step in the FSA process, risk assessment, is to quantify the distribution of risk, i.e. to make the risk measurable or, at least comparable to other risks. This step gives an answer to the questions: "How likely is the event?" and "What consequences might it have?" In the third step of FSA different kind of risk control measures should be sought by considering systematically the possibilities of prevention, mitigation, active and passive, technical and procedural etc. alternatives. The third step should give an answer to the question "What can be done in order to avoid the event?" The fourth step of FSA is an established technique, which makes it possible to find what are the most effective measures that are available to reduce the risks. This involves assigning a monetary value to the change of risk as well as to the costs of the risk control option. The fourth step gives an answer to the questions "How much do different risk control options cost?" and "How effective are the risk control options considered for the regulatory process?"
98 96 (152) The fifth step of the FSA is the recommendations for decision making and it should give an answer to the question "What should the regulator do?" FSA has to be considered as a tool for decision making, not a decision maker by itself. All the information generated in steps 1-4 should be used to help in decision making. The risks, costs and benefits may affect differently on the various persons, groups of persons or organizations in the context. Thus, all relevant aspects connected to the risk control option(s) under consideration have to be thoroughly considered, when performing the final stage of FSA. The different groups of stakeholders should always be identified at the outset of each FSA procedure, and to some extent be included in the expert panel, to ensure comprehensive views in those FSA-analysis' steps that rely on expert opinion. This is also the most important way of building up commitment to and understanding of the decisions made. All the information gathered during the previous steps of FSA should be reviewed to identify the preferred regulatory option(s) in general, and then in more detail in order to reach a sufficient equability for each relevant stakeholder. Figure 54. The block diagram of the FSA-procedure. 7.2 FSA and the risk of oil spills in the Baltic Sea area The FSA-studies performed so far have concentrated on some ship type and on some details in the ship to improve the safety. Application of FSA to minimize the risk of oil spills is more complex: In addition to the characteristics of the oil tankers the matters related to the fairways and ship operations should be considered. In the following some examples of the objects of the risk control options to be considered for oil transports on the Baltic Sea area are listed. Objects of risk control options related to oil tankers: - double hull, - ice strengthening, - azimuth propulsion vs. conventional rudder-propeller construction,
99 97 (152) - redundancy of the navigation, propulsion and steering systems and - loading and unloading systems. Objects of risk control options related to fairways: - one-way vs. two-way fairways, - difficult fairway legs, - crossing fairways and - consideration of different ice conditions on the fairways. Objects of risk control options related to ship operations: - the extent of piloting and VTS, - escort towing, - icebreaker assistance vs. sufficient ice performance for autonomous passage and - traffic restrictions. The results of the work performed by VTT Manufacturing Technology to update the statistics of the sea transports on the Baltic Sea can be used for the FSA analysis as for: - ship traffic densities on different fairways, - characteristics of the oil tankers, - amounts of transported oil on different fairways and - characteristics of the entrance fairways of the oil terminals. The amount of stakeholders of the regulatory process considering the minimization of the risk of oil spills in the Baltic Sea area is very large. For example in all the countries around the Baltic Sea the people working in oil tankers, the shipping and oil companies, the maritime administrators etc. The experts panels needed in the different steps of the FSA process could include experts as follows: - from shipping and oil companies, - from maritime and environment authorities, - from ship crews, - from VTS, - from piloting, - from shipbuilding and - from rescue personnel. At least in some phase of the FSA process representatives of all the countries around the Baltic Sea should be included in the expert panel. 7.3 The work performed in the UK The work performed in the UK to identify the Marine Environmental High Risk Areas (MEHRA s) in the UK (MEHRA, 1999) could be applied also in risk assessment for the Baltic Sea area. The referred document presents the assessment carried out by Safetec UK Ltd. to assist the UK Department of the Environment, Transport and the Regions identify potential Marine Environmental High Risk Areas (MEHRA s) in UK waters. The concept of MEHRA s was to identify comparatively limited areas of high environmental sensitivity, which are also at risk from shipping (i.e. marine pollution). Once MEHRA s were formally identified, the location of these sites could be brought to the attention of ship owners and insurers to encourage shipping to plan routeing to avoid these sites and hence reduce the risk of pollution.
100 98 (152) The assessment was carried out by identifying the environmental sensitivity of the UK coastline and coastal waters based on a number of different sensitivity features (e.g. wildlife, landscape, amenity/economy, geology and fishing). The different sensitive features were mapped on a Geographical Information System (GIS) and a scoring methodology applied to rank sensitivity of both coastal and sea areas. The marine pollution risks were estimated using the most up to date shipping traffic data in the UK (COAST database) as well as recognized accident models which were calibrated against historical incidents in UK waters. As with the environmental sensitivity, the risk results generated were mapped on a GIS system that presents a transparent means for the assessment process. The pollution and environmental sensitivity results were combined to identify potential MEHRA s. The procedure of the performed work is presented in Figure 55 and the map of MEHRA s in the UK is presented in Figure 56. It should be noted that the this procedure doesn't include all the steps of the FSA procedure but only the first two ones. However, this is the first time when the environmental risks are assessed in more detail. Figure 55. Scheme of the procedure used to determine the MEHRA s.

101 99 (152) Figure 56. Potential Marine Environmental High Risk Areas (MEHRA s) ranking for the UK coastline. It combines the results of the pollution risk from shipping in UK waters as well as the environmental sensitivity of the coastline. 7.4 Transportation risks in the Gulf of Finland The concerns of the Finnish environmental authorities can be summarized as follows: sub-standard ships being allowed to collect oil from the terminal at Primorsk; ships entering the Baltic Sea for the first time; the vulnerability of single hull tankers in severe weather conditions; the heavy vessel traffic in the Gulf of Finland; the escort service. The Finnish authorities require mandatory pilotage for all vessels carrying oil or other dangerous cargoes entering Finnish ports (COWI, 2000). Pilots are taken on board at the Archipelago Sea in Finland's western borders. The question arises as to whether there should be compulsory pilotage for all vessels entering the Gulf of Finland, requirements which could be limited to the season (e.g. in winter only), or to the size of vessel or the cargo carried.
102 100 (152) Although Finnish legislation allows for single hull tankers to visit Finnish ports, the levy is double that for double hull tankers. In practice, all ships visiting the Fortum's oil terminal at Porvoo are required to have double bottoms (not double hulls) according to Neste's own regulations. In fact, most product tankers have usually double hull. During the winter the ice cover in the eastern end of the Gulf of Finland can reach cm thickness. However, a bigger problem is shifting pack ice which can be as much as 10 m high. The Board of Navigation operates 9 ice breakers to keep the coastal waters clear but only 2 are suitable for open sea conditions. They do not operate in the Gulf of Finland properly. The Gulf of Finland experiences an average of 100 vessel movements per 24 hours, with a minimum of 60 vessels. Although much of this is concerned with traffic to and from the port of St. Petersburg, there is a large cross-gulf traffic between Finland and Estonia. Finland would agree that oil terminals should contribute to the State's Tier Two oil spill capability. In Finland there is a fund levied on the transport of oil, the proceeds of which are used to build up the national Tier Two and Tier Three requirements without resorting to tax payers' money. The fund was established in 1976 and receives about 30 million Finnmarks (FMK) per year based on a levy of 2.2 FMK per ton/oil. The Finnish authorities acknowledge that the oil spill response capability in the Gulf of Finland is generally too low, especially in the East. This also applies to Finnish capability as well as inadequate resources in both Russia and Estonia. A study by VTT Manufacturing Technology predicts enormous growth in maritime traffic to the year 2010 as a result of which the authorities could expect 6 significant spills per annum. If realized, this would represent a significant increase in the spill frequency in the Gulf of Finland compared with the record of the past 30 years (Rytkönen, 1999). Another recent study has shown the incidence of the 70 cm depth of pack ice which showed a high prevalence in the southern part of the Gulf of Finland comparable to that in the extreme north of the Gulf of Bothnia. These ice conditions would pose a severe problem to the movement of large (140,000 DWT) tankers because most ice breakers do not have sufficient width to open a large enough navigation channel. Concerning the requirements for tankers visiting Primorsk, the Finnish authorities emphasized the importance of double bottom tankers. There have been two recent incidents in Finland (MT Natura and MT Ekturus) where large (80,000 ton) tankers have grounded but, owing to double bottoms, no oil has been spilled. It was important to note that the northern part of the Gulf of Finland (including the Primorsk area) generally has a rocky bottom compared with the sandy shores of the south. Concerning environmental safety and the reduction of risk, the Finnish authorities believe that a lot will depend on whether the Russian authorities will allow tankers based on the old Soviet system or will insist on modern, international standards. The Finnish authorities also favor the use of Porvoo in winter conditions. They consider this to be a better solution with less risk for the environment and an economic study has shown that this could be a feasible option even if low oil prices persisted for six months. The Finnish authorities strongly favor the use of multi-purpose vessels rather than specific oil recovery vessels. Finland has 12 such vessels, eight managed by the Maritime Administration, two by the Navy and two by the Coast Guard. In the case of the Primorsk terminal, it could be useful to think of ice breakers being made available for multi-purpose functions and fitted with a sweeping arm system for oil spill recovery. Such vessels could also be used for escorting purposes in the open sea when ice conditions are not prevalent.
103 101 (152) The Finnish authorities confirmed that they would assist Russia in a Tier Two or Tier Three response but there would be no Finnish assistance for a Tier One spill. The Finnish authorities also strongly favor a requirement that tankers should be escorted into Primorsk. They acknowledge that no legislation exists, either nationally or internationally, to insist upon escort service. Nevertheless, the Finnish experience which now requires tankers entering Porvoo to be escorted has proved beneficial. 7.5 Risk assessment - Estonian perspective Although Estonia's neighbors recognize that the Estonian response capability has been much improved, the Estonian Oil Combating authorities remains concerned about the lack of oil spill combating equipment outside the Tallinn area. Local ice conditions can also cause problems during the winter time. Estonia itself has an oil trade of approximately million tons per annum. The draft Estonian National Contingency Plan has not yet been approved. The matter has been deferred following elections earlier in There remain many problems with the budget. Currently the responsibility for oil combating was given to the Coast Guard, thus the reorganising and rearrangements of the operations would require some time. The Estonian authorities consider that the construction of a terminal at Primorsk will present them with a heightened oil spill risk. All tankers would pass very near to the Estonian coast line and, depending on the weather conditions and northerly winds, oil spilled would arrive on the Estonian coast within two-three hours. The clean-up operations would be mostly manual. The Estonian authorities would therefore welcome any recommendations (such as double bottom tankers and escorting vessels into Primorsk) which would reduce the oil spill risk. 7.6 Special measures to minimize risk in Poland In order to minimize the risk of pollution incidents in special areas, the Polish authorities have designated the following coastal areas where oil tankers are excluded: Mierzeja Wislana, Kepa Redlowska, Zatoka Pucka, Slowinski Pakt Narodowy, Lawica Slupska and Wolinski Park Narodowy. The Polish authorities are concerned about the increased tanker traffic which would be generated by a new terminal at Primorsk. They support the HELCOM forum as the most suitable for establishing appropriate rules for the Baltic Sea. Appropriate measures which could be considered in the views of the Polish authorities are: a ceiling on the size of tankers using the Baltic (e.g. 14 m draught); the establishment of more traffic separation zones and specific routes for tankers away from shallow waters; measures to avoid the use of vessels which, although within legal limits, are on the verge of acceptability.
104 102 (152) 7.7 Risk assessment in Sweden The Swedish Coast Guard expressed in general terms its view that the environmental hazards arising from ship traffic in the Baltic Sea may be expected to increase. Sea traffic in the Baltic Sea is increasing, and so is oil transported by ship. The reasons for the Coast Guard's concern are that the oil transport tends to be provided by substandard ships, sailed by crews with too little environmental knowledge and a lack of environmental concern among the crew. Generally there is a connection between low standard ships and lack of environmental concern among the crew. It was expected, furthermore, that the increased handling of oil will lead to extensions of terminals, refineries and single buoy moorings. A typical picture envisaged by the Swedish authorities is of substandard tankers awaiting good selling options while sheltering in coastal areas. This would lead to increased risk of oil spills in sensitive areas which often are sheltered and near shore. Statistics reporting the number of flight observation hours and the number of recorded oil spills (deliberate discharges, not accidents) over the last 20 years or so support the Coast Guard's general concerns. Until recently, the fluctuations in the number of flight observation hours and the number of reported oil spills were in agreement, reflecting the fact that many flight hours lead to observation of many oil spills. However, during the last two to four years, fewer flight hours have led to the observation of more oil spills indicating a higher rate of spills. Though these statistics relate to deliberate discharges, the Swedish authorities believe that it is reasonable to assume a corresponding increase in the number of accidental spills.
105 103 (152) 8 Conclusions Maritime transportation between the countries bordering the Baltic Sea is an essential element in the region's trading patterns. More than 500 million tons of cargo are transported across the Baltic Sea each year. Approximately 50 ferries have fixed routes between the Baltic Ports, and approximately more than bigger ships, including cargo carriers, oil tankers and ferries are at sea in the Baltic at any given time. Moreover, the general trend of the growth rate of the maritime traffic shows a steady increase. The expected growth rate of the oil transportation, however, is assumed to be much larger in the Baltic, and especially in the Gulf of Finland area. Russian oil export is expected to increase by percent. Old terminals are under rehabilitation, and new terminals have been constructed and under design. More than 36 % of the Russian export oil is shipped in tankers through the Baltic Sea. At the same time the Baltic States have increased their oil transito traffic significantly. Also the import of oil to the eastern Baltic region is increasing from countries other than Russia, and this oil will mainly be transported by sea (Crockford, 2001). The domestic crude oil price at below 30 % of the world prices Russia has a certain interest to produce more oil to the western markets. In spite of the agreements with OPEC to cut certain part of the production, the market experts believe more oil will be transported from Russia to the markets. This added export rate will mainly go to the European countries. With a suitable price, the production would be 20 million tons higher every year as stated in (Scandinavian Shipping Gazette, January 2002). The Primorsk oil terminal 's first phase was completed in the end of Soon the production rate will be raised to 18 million tons annually, i.e. to bbl/day. The modernization of the Yaroslav - Kirishi pipeline is under construction and will add the capacity after the work completion (Arentz, 2002a). The prognoses for the Baltic Sea area shows the annual growth rate of 4.2 % for general cargo, 3.6 % for bulk and 1,6 % for oil. The oil growth rate here defined by COWI is underestimated due to the Baltic and Russian terminal development: The general Baltic Sea oil transportation rate will increase by 2-3 %, but geographically the rise is much larger. The heaviest growth rate of oil transportation is expected to be in the Gulf of Finland, in the Baltic proper the tankers passing the Gotland island and in the Danish Strait. Thus it is more likely, that the sea-borne volume will roughly double. The general cargo and container traffic will even be three-fold. The increase in oil transportation will be 40%. The maritime traffic of the Gulf of Finland is growing fast together with the general trend observed in logistics. The annual growth rate is 2 7% depending on the freight mode and the development trends of each country and port. The passenger traffic of Baltic Sea is intensive, and will generally grow slightly in the future. The accurate forecast is difficult as it involves several desicion-makers compared to cargo transport. Ref (Ocean Shipping Consultants, 1999) estimates, that passenger volumes in the Baltic Sea will reach 75 million passenger limit in 2005.
106 104 (152) The two main routes for passenger traffic have been the links between Finland and Sweden and Finland and Estonia. The amount of passengers from the ports of Turku and Helsinki to Stockholm and Kapellskär was nearly 10 million passengers in In the route Helsinki Tallinn the figure has been around 6 million in These figures are not expected to grow anymore. By the year 2004 the allowed amount of alcohol imported by the passengers is lifted in Finland to the same level with other countries, and as a result the sale income of the passenger ships may be cut. Ref. (Venäläinen & Viitanen, 2001) suggest even % decrease in shipping capacity, which may be realistic after Estonia joining EU will loose the tax free sales. The new taxation policy will probably encourage ferry companies to establish new routes between EU countries and other Baltic countries and Russia. Thus it is expected, that the passenger traffic volume in Finland will remain in its current level also in the future. In Estonia, the EU membership and good relationships with Russia can increase the passenger traffic figure significantly in the future. All the scenarios presented in (Venäläinen & Viitanen, 2001) show all growth figures 120 % up to 300 % up to year Other Baltic countries will have more moderate growth figures than Estonia. The most intensive growth will be taken place in Riga of Latvia where the 0.5 million passenger rate in 1998 is expected to rise to 1.4 million passengers in This might be underestimated, especially when Estonia will join EU, and the ferry companies will find out compensatory routes to keep their competitiveness as good as possible. In the southern Baltic the most intensive growth rate of the passenger traffic is expected to take place in Poland, where the passenger traffic is forecast to more than double by the year Both Gdansk and Gdynia is expected to get more importance as passenger ports. The 1.6 million passenger level in 1998 is expected to exceed 2 million in 2010 and to reach 2.4 million passengers in The main trends in logistics will be: - restructuring the logistic system, - realigning the supply chains, - rescheduling product flow, - changing management transport resources, - changing transport policy trends, - changing product configuration and design. In order to improve maritime safety and to keep the risk of oil or ship accident as minimal as possible, new actions are required. The risk analyses as defined with the FSA method have been understood to be one of the most valuable tools to find out what is necessary for improving maritime safety. The new ship reporting system and traffic separation scheme for the Gulf of Finland will represent those required actions.
107 105 (152) References Arentz, P. 2002a. Increased Russian Oil Shipments through the Baltics. Scandinavian Shipping Gazette. April, P. 17. Arentz, P. 2002b. North European Crude oil Terminals. Scandinavian Shipping Gazette. June P. 63. Arentz, P. 2002c. Aframax the North Sea mainstay. Scandinavian Shipping Gazette. June P. 13. Bakka, D Denmark: At the Baltic crossroads. Scandinavian Shipping Gazette. June P Barrat M.J. & van der Tak C.,1993. "European Traffic Databank", British Maritime Technology Limited, Iso-Britannia. COWI, Non-Technical Summary. Baltic Pipeline System. Tacis, DG 1A COWI, 1998b. Existing and Future Shipping through the Baltic Sea. Tacis, DG 1a p. Crockford, T Baltic Shipping - A risky Business. Darft Article. Delavoi Petersburg Emelkina, E Increase of oil pollution risk due to transportation. Seminar in the framework of international exercise "Balex Delta 2000". EU, Survey on ongoing Port Development Activities in the Baltic Region. EU/Directorate General 1. Prepared by the Port & Transport Consulting N.V. and Plant Location International N.V. September p. Finnish Embassy in Moscow, Press report FMA, Shipping between Finland and Foreign Countires. Finnish Maritime Administration. Statistics 4/ p. Fulford, B, ) ( Gribov, S New Policy: xenophobic hard liners gain inside-support from Kazakh goverment. Rus Energy. Iikkanen, P Demand forecast for Finnish ports on the Bay of Bothnia and current unitised cargo traffic in the northern economic region of Russia (in Finnish). Publications of the Finnish Maritime Administration 2/99. ISBN p. llarionov, A,
108 106 (152) Ingo, S. et al Sea Transport in the Baltic Sea Region. Input to the Interreg II projects Matros, Urban Systems and Urban Networking in the BSR and the Baltic Palette. 54 p + attachment "The major ports and their characteristics", 58 p. Interfax, IMO.1997 Interim guidelines for the application of formal safety assessment (FSA) to the IMO rule-making process. MSC/Circ.829. MEPC/Circ November ISL, Entwicklung der deutchen Ostseehäfen bis zum Jahr 2015 (Kapitel 9). Jolma, K Torjuntavalmius 2005 ja Suomen ympäristökeskus.76 s. + liit. Kankare, M Sota syttyy öljystä (War breaks up of the oil. in Finnish) Talouselämä No 33, P Kroutikhin, M The Northwestern Passage: Oil Exporters Stand to Gain from Competition between Baltic Terminals. Källström, L. & Ingo, S Sea Transports in the Baltic Sea. Trends and consequences for urban structure and regional development in the Baltic Sea region. EU's Interreg II C project Matros. Report, June p. Larsen, Henrik. Ministry of Environment and Energy, Spatial Planning Department. The Danish cargo and ferry ports. Matros - inventory work, Danish contribution. September Lausala, T. & Varjonen, J Energiasektori ja pohjoinen ulottuvuus. Mannerjalustatyöryhmä, Mannerjalustatyöryhmän uutiset MEHRA, Department of the Environment, Transport and the Regions. Identification of Marine Environmental High Risk Areas (MEHRA s) in the UK. Doc.No.: ST-8639-MI-1-Rev 01. December Mitchell, A, ) ( Moppel, A Main Directions of Estonian National Transport Policy. Nordic/Baltic Transport Research Conference April 2000, Riga, Latvia. 7 pp. Ocean Shipping Consultants, World Container Port Markets to Pala, C Perälä, H. & Venäläinen, P Organisations & Institutions in the Decision Making Process. Inventory Report of the Sub/Project 2. MATROS Programme p. Ria Oreanda, Russian Economic News,
109 107 (152) Rytkönen, J Suomenlahden meriliikenne ja satamatoiminta nyt ja tulevaisuudessa (Maritime traffic of the Gulf of Finland now and in the future - in Finnish). VTT Manufacturing Technology. Research Report VALB p + 14 app. Rytkönen J., Nyman, T. & Jolma, K., FSA Analyses as a Risk Analysis Tool for Arctic and Sub-Arctic Maritime Environment. Joint EU-Russia-Canada-US Arctic Workshop. October 25-27, Brussels. Proceedings, P Rytkönen, J Development of Marine Oil Transportation in the Baltic Sea. International Seminar on Combating Marine Oil Spills in Ice and Cold / Arctic Conditions. November 20-22, Helsinki Finland. Rytkönen, J. & Sassi, J. Defining Wind Limits in European ports. Questionnaire Survey. Research Report BVAL VTT Industrial Systems. 14 p + 18 app. Seaborne transports between Finland and foreign countries , Seaborne trade between Finland and foreign countries in 1999, Shipping between Finland and foreign countries by type of cargo, , SIKA; A Common Strategic Framework. Maritime Transport in the Baltic Sea Region form a spatial development perspective (MATROS). Swedish Institute for Transport and Planning, Sweden. Draft Report p. Sjöfartsverket, Handlingsplan för sjöfart i Östersjöregionen ( in Swedish). 81 p. Sjöfartens bok Olja och tanksjöfart. Svensk Sjofarts Tidning 25, P Sjöström, P. Finland: All time high in seaborne trade. Scandinavian Shipping Gazette, June 14, 2002.P SSPA, Transportation of oils in the Baltic Sea Area Helsinki Commission. Inventory on transportation and risk estimation of oils carried in the Baltic Sea Area. SWA, Baltic Maritime Outlook Swedish Maritime Administration. November Swedish Maritime Administration, Action Plan for Maritime Transport in the Baltic Sea Region. Report. September p + app. Svensk Sjöfarts Tidning, Sjöfartens Bok Svensk Sjöfarts Tidning Ett Krympande år för hamnarna. Issue No P St. Petersburg Port Authority, (in Russian). Szymanski, L Status quo in Polish ports but new major project planned. Scandinavian Shipping Gazette. June P
110 108 (152) Tebodin & Pramprojektas, Klaipeda Oil Terminal Reconstruction. Project Definition. Report 18700, December p. Todd, T Hamburg sets sights on magic 100 million ton mark. Scandinavian Shipping Gazette. June P Transit traffic through Finnish ports, , Venäläinen, P. & Viitanen, M Demand Projections, Scenarios and Driving Forces for Maritime Transport in the BSR. MATROS, development of spatial planning and transport infrastructure planning methods for an integrated maritime transport system in the Baltic Sea Region. Sub-Project p Viatek, The ports of northern Gulf of Bothnia as part of developing network between northern Finland and North-West Russia. 4 pp. Vitismann, M. 2002a. Smaller Estonian ports cannot rely on just timber. Scandinavian Shipping Gazette. June P Vitismann, M. 2002b. Latvia: Eastern cooperation necessary. Scandinavian Shipping Gazette. June 14, P World Bank, 2000, Transport Sector Restructuring in the Baltic States. Proc of a seminar held in Riga on November 16-17, The Latvian Ministry of Transport and the World Bank. 75 p. VTT, Suomenlahden satamahankkeiden ekologiset ja ympäristönsuojelulliset säännökset (in Finnish). VTT Manufacturing Technology. Research Report VAL p + 6 app. VTT, The implementation of the VTMIS system for the Gulf of Finland. Formal Safety Assessment study. VTT Industrial Systems. Research Report VAL p app Ympäristöministeriö,asiantuntijaryhmän, muistio Tallinnan Muugan sataman ympäristövaikutukset. Zhdannikov, D ) ( Zhuravlev, M & Simonenko, R Murmansk vs. Pechenga. LUKOIL and Gazprom Propose Conflicting Versions of Oil Export Hubs. RusEnergy, Åsub, Sea Transport in the Baltic Sea Region. Rapport 1999:15. Ålands statistik- och utredingsbyrå ( in Swedish). 56 p + app + bilaga (The Major Ports and Teir Characteristics) 58 p.
111 109 (152) Appendices Appendix 1. The analyses of tanker structure and age in Muuga (Estonia) in 2000 and 2001 Appendix 2. The analyses of tanker structure and age in Sköldvik (Finland) in 2001 Appendix 3. The analyses of tanker structure and age in St.Petersburg (Russia) in 2001 Appendix 4. The analyses of tanker structure and age in Klaipeda (Lithuania) in 2001 Appendix 5. The analyses of tanker structure and age in Ventspils (Latvia) in 2001 Appendix 6. Port projects in the eastern Baltic Sea Appendix 7. Baltic Sea Ports Appendix 8. Tallinn City Port Appendix 9. Port of Muuga Appendix 10. Port of Riga Appendix 11. Port of Ventspils Appendix 12. Port of Liepaja Appendix 13. Port of Klaipeda Appendix 14. Port of Gdynia Appendix 15. Port of Gdansk Appendix 16. Port of Szcecin (southern part) Appendix 17. Port of Szcecin (northern harbors) Appendix 18. Port of Primorsk Appendix 19. Port of Lomonosov Appendix 20. Port of Vyborg Appendix 21. Port of Vysotsk Appendix 22. Port of Luzhskaja Guba Appendix 23. Port of Batareinya Appendix 24. Baltic railways network Appendix 25. Exports and imports through the Finnish Ports in the Gulf of Bothnia in Appendix. 26. Forecast of the throughput development in Baltic up to 2015 Appendix 27. Largest crude oil terminals in the Baltic Sea area Appendix 28. North European crude oil terminals Appendix 29. Cargo throughput in Swedish ports in
112 110 (152) APPENDIX 1. The analyses of tanker structure and age in Muuga (Estonia) in 2000 and The Port of Muuga The statistical data of the Port of Muuga contained data of August 2001 (71 calls, 49 different ships)and May 2001 (23 ships). The number of double hull tankers is clearly increased from 39 % to 48 %. Another trend is the increasing size of the tankers. The oil tanker size of the Port of Muuga was about tons in 1998, and tons in Now, the average size in August was a dwt tanker and dwt tanker in May The comparison of the hull and size of the 2000 and 2001 data is presented below. The increase of the size of tankers will continue in Muuga. The port authorities are considering a new jetty for dwt tankers. Muuga hull type 8/2000 Single hull 39 % Double bottomed 22 % Double hulled 39 % The distribution of the double hull, double bottom and single hull tankers in August 2000 in the Port of Muuga. Hull type Muuga 5/2001 Single hull 35 % Double bottomed 17 % Double hulled 48 % The distribution of the double hull, double bottom and single hull tankers in May 2001 in the Port of Muuga.
113 111 (152) % 8/2000 and 5/2001 Muuga % Double bottomed Double hulled other (single hull) The short-term development of the tankers in the port of Muuga between August 2000 and the end of May DWT and LIQ Muuga 8/2000 and 5/ AVERAGE formula DWT Average DWT Average LIQ [m3] The increase of the tanker size in the port of Muuga. The average size of the oil tankers increased by 31 %. When analyzing the age of the tankers it could be noted, that around half of the tankers are older than 15 years. The percentage of over 20 years old tankers was both in August 2000 and may 2001 near %. The corresponding value for over 15 years old tankers was 43 %.
114 112 (152) Percentage of ships older than x yrs Age [yrs] The distribution of the age of the tankers in Muuga (May, 2001).
115 113 (152) APPENDIX 2. The analyses of tanker structure and age in Sköldvik (Finland) in The Harbour of Sköldvik The ships' bottom structure of TCH, TTA and GGC types of vessels during four week period expired 1 July 2001 (Source: w w w.lmis.com) Number of vessels: % 27 % Double bottomed Double hulled Not mentioned 42 % The distribution of TCH, TTA and GGC types of vessels in Sköldvik in 1 June - 1 July 2001 (source: The Harbour of Sköldvik The number and age of TCH, TTA and GGC types of vessels during four week period expired 1 July 2001 (Source: ww w.lm is.com ) Total number of vessels: 26 Average age of vessels: 13 years 5 4 Number of vessels Year built The age of TCH, TTA and GGC types of vessels in Sköldvik in 1 June - 1 July 2001 (source:
116 114 (152) APPENDIX 3. The analyses of tanker structure and age in St. Petersburg Sea Port (Russia) in Altogether 29 tanker visited St. Petersburg Sea port in the four week period in May - June Most part of the vessels were TTA tank type-vessels (80 %). The amount of TCH-type chemical tankers was 14 %, and the rest were CBO-bulk/oil and COO- ore/oil bulkers. The age distribution of all analyzed tankers, shows the average age of the ship was 11 years. Only four of these vessels were Russian ships, all constructed between , and double hulled. The structural analyses shows that 48 % of all the vessels were double hulled, 14 % double bottomed, and the rest single hull vessels. The Harbour of St. Petersburg The ships' bottom structure of TCH, TTA, CBO and COO types of vessels during the four week period expired 12 June 2001 (Source: Total number of vessels: % 38 % Double bottomed Double hulled Not mentioned 48 % The distribution of oil tankers visiting St. Petersburg in 12 May -12 June The Harbour of St. Petersburg The number and age of TCH, TTA, CBO and COO types of vessels during the four week period expired 12 June 2001 (Source: Total number of vessels: 29 Average age of vessels: 11 years Number of vessels Year built The age of tankers visiting St. Petersburg Sea Port in 12 May - 12 June 2001.
117 115 (152) APPENDIX 4. The analyses of tanker structure and age in Klaipeda (Lithuania) oil terminal in The ships visiting Klaipeda oil terminal in May 2001 consisted 111 ships. The average age of the ships visiting Klaipeda in May 2001 was 19 years. Two third of the ships were single hull vessels. The percentage of double hull and double bottom vessels were 20 % and 13 %, respectively. The ships were classified into the following classes: - TCH, chemical tanker - TTA, tanker - CBO, bulk/oil - GGC, general cargo - OTB, tank barge The Harbour of Klaipeda The ships' bottom structure of TCH, TTA, CBO, OTB and GGC types of vessels during the four week period expired 16 June 2001 (Source: Total number of vessels: % 20 % Double bottomed Double hulled Not mentioned 67 % The distribution of tanker types in Klaipeda in May The harbour of Klaipeda The number and age of TCH, TTA, CBO, OTB and GGC types of vessels during the four week period expired 16 June 2001 (Source: Total number of vessels: 111 Average age of vessels: 19 years Number of vessels Year built The age of the tankers visiting Klaipeda in May 2001.
118 116 (152) APPENDIX 5. The analyses of tanker structure and age in Ventspils (Latvia) oil terminal in The amount of ships visiting Ventspils in May 2001 was % of the vessels were single hull ships, the rest of the ships being double bottom or double sided ships. The average age of the ships in May 2001 was 13 years. The oldest ships was constructed in The Harbor of Ventspils The ships' bottom structure of TCH, TTA, CBO, OTB and GGC types of vessels during the four week period expired 16 June 2001 (Source: Total number of vessels: % 37 % Double hulled Double bottomed Double sided Not mentioned 2 % 23 % The distribution of ship types in Ventspils in May, The harbour of Ventspils The number and age of TCH, TTA, CBO, OTB and GGC types of vessels during the four week period expired 16 June 2001 (Source: Total number of vessels: 52 Average age of vessels: 13 years Number of vessels Year built The age of the tankers visiting Ventspils in May 2001.

119 APPENDIX 6. Port projects in the eastern Baltic Sea. 117 (152)
120 118 (152) APPENDIX 7. Baltic Sea Ports Baltic Sea Ports, Denmark. Name Country Area Latitude Longitude Type Denmark DNK SCN Bornholm DNK SCN Land area Ronne DNK SCN 55 6 N E Port Nekso DNK SCN 55 4 N 15 9 E Port Svaneke DNK SCN 55 8 N 15 9 E Port Gudhjem DNK SCN N E Port Allinge DNK SCN N E Port Hammerhavn DNK SCN N E Port Hammeren DNK SCN N E Port Vang DNK SCN N E Port Hasle DNK SCN N E Port Stege DNK SCN N E Port Praesto DNK SCN 55 7 N 12 2 E Port Fakse Ladeplads DNK SCN N E Port Stevns Pier DNK SCN N E Port Koge DNK SCN N E Port Dragor DNK SCN N E Port Kastrup DNK SCN N E Port Copenhagen DNK SCN N E Port Tuborg Havn DNK SCN N E Port Elsinore DNK SCN 56 2 N E Port Hundested DNK SCN N E Port Frederiksvaerk DNK SCN N 12 1 E Port Frederikssund DNK SCN N 12 3 E Port Ostby DNK SCN Port Kyndby DNK SCN N E Port Holbaek DNK SCN N E Port Nykobing DNK SCN N E Port Nykobing(Sjaelland) DNK SCN N E Port Odden DNK SCN N E Port Sjaellands Odde DNK SCN Land area Kalundborg DNK SCN N 11 5 E Port Asnaesvaerkets Havn DNK SCN N 11 5 E Port Halsskov DNK SCN N 11 6 E Port Korsor Roads DNK SCN Anchorage Korsor DNK SCN N 11 8 E Port Skaelskor DNK SCN N E Port Stigsnaesvaerkets Havn DNK SCN N E Port Gulfhavn DNK SCN N E Port Karrebaeksminde DNK SCN N E Port Naestved DNK SCN N E Port
121 119 (152) Masnedsund DNK SCN 55 0 N E Port Masnedo DNK SCN 55 0 N E Port Vordingborg DNK SCN 55 0 N E Port Falster DNK SCN Land area Orehoved DNK SCN N E Port Stubbekobing DNK SCN N 12 2 E Port Gedser DNK SCN N E Port Nykobing(Falster) DNK SCN N E Port Bandholm DNK SCN N E Port Nakskov DNK SCN N 11 8 E Port Rodbyhavn DNK SCN N E Port Sakskobing DNK SCN N E Port Guldborg DNK SCN N E Port Rudkobing DNK SCN N E Port Bagenkop DNK SCN N E Port Marstal DNK SCN N E Port Aeroskobing DNK SCN N E Port Soby DNK SCN N E Port Svendborg DNK SCN 55 3 N E Port Sprogo DNK SCN N E Port Nyborg DNK SCN N E Port Kerteminde DNK SCN N E Port Odense DNK SCN N E Port Lindo DNK SCN N E Port Bogense DNK SCN N 10 5 E Port Strib DNK SCN N 9 46 E Port Middelfart DNK SCN N 9 44 E Port Assens DNK SCN N 9 54 E Port Faaborg DNK SCN 55 6 N E Port Kolby Kaas DNK SCN N E Port Ballen DNK SCN N E Port Jutland DNK SCN Land area Graasten DNK SCN N 9 37 E Port Egernsund DNK SCN N 9 36 E Port Sonderborg DNK SCN N 9 47 E Port Katholm DNK SCN N 9 50 E Port Augustenborg DNK SCN N 9 52 E Port Enstedvaerkets Havn DNK SCN 55 1 N 9 26 E Port Aabenraa DNK SCN 55 2 N 9 26 E Port Aarosund DNK SCN N 9 43 E Port Haderslev DNK SCN N 9 30 E Port Kolding DNK SCN N 9 30 E Port Skaerbaek DNK SCN N 9 37 E Port Lyngs Odde DNK SCN N 9 45 E Port Fredericia DNK SCN N 9 45 E Port Vejle DNK SCN N 9 33 E Port Juelsminde DNK SCN N 10 1 E Port Horsens DNK SCN N 9 52 E Port
122 Aarhus DNK SCN 56 9 N E Port Studstrup DNK SCN N E Port Ebeltoft DNK SCN N E Port Glatved DNK SCN N E Port Lyngsbaek Bridge DNK SCN N E Port Grenaa DNK SCN N E Port Kattegat DNK SCN Water area Anholt DNK SCN N E Port Randers DNK SCN N 10 3 E Port Kongsdal DNK SCN N 10 4 E Port Mariager DNK SCN N 9 59 E Port Hobro DNK SCN N 9 48 E Port Hadsund DNK SCN N 10 7 E Port Aalborg DNK SCN 57 3 N 9 55 E Port Norresundby DNK SCN 57 4 N 9 55 E Port Hals DNK SCN N E Port Aggersund DNK SCN 57 1 N 9 17 E Port Laeso DNK SCN N E Port Saeby DNK SCN N E Port Understed DNK SCN N E Port Asa DNK SCN 57 9 N E Port Frederikshavn DNK SCN N E Port Skagen DNK SCN N E Port 120 (152)
123 Baltic Sea Ports, Sweden Name Country Area Latitude Longitude Type Iddefjord+Kattegatt SWE SCN Water area Stromstad SWE SCN N E Port Grebbestad SWE SCN N E Port Fjallbacka SWE SCN N E Port Hunnebostrand SWE SCN N E Port Ramsvik SWE SCN N E Port Smogen SWE SCN N E Port Kungshamn SWE SCN N E Port Ryxo SWE SCN N E Port Brofjorden SWE SCN N E Port Stensjo SWE SCN N E Port Lysekil SWE SCN N E Port Munkedalhamn SWE SCN N E Port Skredsvik SWE SCN N E Port Uddevalla SWE SCN N E Port Gustavsberg SWE SCN N E Port Edshultshall SWE SCN Port Stenungsund SWE SCN 58 5 N E Port Mossholmen SWE SCN N E Port Wallhamn SWE SCN 58 0 N E Port Ronnang SWE SCN 58 5 N E Port Skarhamn SWE SCN N E Port Marstrand SWE SCN N E Port Gothenburg SWE SCN N E Port Ockero SWE SCN N E Port Agnesberg SWE SCN N 12 0 E Port Surte SWE SCN N 12 1 E Port Bohus SWE SCN N 12 2 E Port Nol SWE SCN N 12 8 E Port Lodose SWE SCN 58 2 N 12 9 E Port Gota SWE SCN 58 6 N 12 9 E Port Trollhattan SWE SCN N E Port Lilla Edet SWE SCN Port Stallbacka SWE SCN N E Port Vargon SWE SCN N E Port Kungsbacka SWE SCN N 12 5 E Port Ringhals SWE SCN Port Varberg SWE SCN 57 6 N E Port Falkenberg SWE SCN N E Port Halmstad SWE SCN N E Port Angelholm SWE SCN N E Port Bastad SWE SCN N E Port Hoganas SWE SCN N E Port Helsingborg SWE SCN 56 3 N E Port Kopparverkshamn SWE SCN 56 1 N E Port Raa SWE SCN N E Port 121 (152)
124 Backviken SWE SCN N E Port Landskrona SWE SCN N E Port Lomma SWE SCN N 13 4 E Port Malmo SWE SCN N 13 0 E Port Limhamn SWE SCN N E Port Klagshamn SWE SCN N E Port Trelleborg SWE SCN N 13 9 E Port Ystad SWE SCN N E Port Simrishamn SWE SCN N E Port Ahus SWE SCN N E Port Solvesborg SWE SCN 56 3 N E Port Elleholm SWE SCN N E Port Karlshamn SWE SCN N E Port Ronneby SWE SCN N E Port Torko SWE SCN 56 9 N E Port Karlskrona SWE SCN N E Port Bergkvara SWE SCN N 16 5 E Port Kalmar SWE SCN N E Port Oskarshamn SWE SCN N E Port Simpevarp SWE SCN N E Port Oland Is. SWE SCN Land area Borgholm SWE SCN N E Port Farjestaden SWE SCN N E Port Morbylanga SWE SCN N E Port Degerhamn SWE SCN N E Port Byxelkrok SWE SCN N 17 2 E Port Gotland Is. SWE SCN Land area Visby SWE SCN N E Port Klintehamn SWE SCN N E Port Ronehamn SWE SCN N E Port Slite SWE SCN N E Port Furillen SWE SCN N 19 0 E Port Bungenas SWE SCN N 19 5 E Port Farosund SWE SCN N 19 4 E Port Straa SWE SCN N 19 2 E Port Ar SWE SCN N E Port Storugns SWE SCN N E Port Kappelshamn SWE SCN N E Port Vestervik SWE SCN N E Port Gamleby SWE SCN N E Port Kallvik SWE SCN N E Port Valdemarsvik SWE SCN N E Port Mem SWE SCN N E Port Braviken SWE SCN Water area Norrkoping SWE SCN N E Port Soderkoping SWE SCN N E Port Marsviken SWE SCN N E Port Oxelosund SWE SCN N 17 7 E Port Nykoping SWE SCN N 17 1 E Port 122 (152)
125 Studsvik SWE SCN N E Port Sodertalje SWE SCN N E Port Stora Vika SWE SCN N E Port Landsort SWE SCN N E Port Nynashamn SWE SCN N E Port Dalaro SWE SCN 59 8 N E Port Vesteras SWE SCN N E Port Enkoping SWE SCN N 17 5 E Port Balsta SWE SCN N E Port Uppsala SWE SCN N E Port Stockholm SWE SCN N 18 3 E Port Liljeholmsviken SWE SCN N 18 0 E Port Loudden SWE SCN N 18 8 E Port Stocksund SWE SCN N 18 3 E Port Hogmarso SWE SCN N E Port Furusund SWE SCN N E Port Kapellskar SWE SCN N 19 0 E Port Norrtalje SWE SCN N E Port Grisslehamn SWE SCN 60 6 N E Port Hallstavik SWE SCN 60 3 N E Port Hargshamn SWE SCN N E Port Oregrund SWE SCN N E Port Forsmark SWE SCN N E Port Skutskar SWE SCN N E Port Gefle SWE SCN N E Port Gulf of Bothnia SWE SCN Water area Norrsundet SWE SCN N E Port Soderhamn SWE SCN N 17 6 E Port Aresund SWE SCN Port Iggesund SWE SCN N 17 6 E Port Hudiksvall SWE SCN N 17 7 E Port Sundsvall SWE SCN N E Port Hernosand SWE SCN N E Port Ornskoldsvik SWE SCN N E Port Rundvik SWE SCN N E Port Hornefors SWE SCN N E Port Umea SWE SCN N E Port Sikea SWE SCN 64 8 N E Port Kallviken SWE SCN N E Port Backfors SWE SCN N E Port Burea SWE SCN N E Port Skelleftea SWE SCN N E Port Ronnskar SWE SCN N E Port Kagehamn SWE SCN N 21 2 E Port Haraholmen SWE SCN N E Port Munksund SWE SCN N E Port Lulea SWE SCN N E Port Kalix SWE SCN N 23 8 E Port Seskaro Is. SWE SCN N E Port 123 (152)
126 124 (152) Baltic Sea Ports, Germany Name Country Area Latitude Longitude Type Ueckermunde DEU SCN N E Port Greifswald DEU SCN 54 6 N E Port Wolgast DEU SCN 54 3 N E Port Vierow DEU SCN Port Ladebow DEU SCN 54 6 N E Port Sassnitz DEU SCN N E Port Kroslin DEU SCN 54 8 N E Port Lauterbach DEU SCN N E Port Mukran DEU SCN N E Port Stralsund DEU SCN N 13 6 E Port Barth DEU SCN N E Port Rostock DEU SCN 54 9 N 12 6 E Port Warnemunde DEU SCN N 12 5 E Port Wismar DEU SCN N E Port Lubeck DEU SCN N E Port Travemunde DEU SCN N E Port Gromitz DEU SCN 54 9 N E Port Neustadt DEU SCN 54 6 N E Port Puttgarden DEU SCN N E Port Burgstaaken DEU SCN N E Port Fehmarn Is. DEU SCN Land area Orth DEU SCN N 11 3 E Port Heiligenhafen DEU SCN N E Port Laboe DEU SCN N E Port Kieler Forde DEU SCN Water area Kiel DEU SCN N 10 8 E Port Holtenau DEU SCN N 10 9 E Port Rendsburg DEU SCN N 9 40 E Port Eckernforde DEU SCN N 9 51 E Port Schleswig DEU SCN N 9 34 E Port Olpenitz DEU SCN Port Kappeln DEU SCN N 9 56 E Port Gelting DEU SCN N 9 54 E Port Gelting Bay DEU SCN Water area Flensburg DEU SCN N 9 26 E Port
127 125 (152) Baltic Sea Ports, Finland Name Country Area Latitude Longitude Type Finland FIN SCN Tornio FIN SCN N 24 9 E Port Roytta FIN SCN N 24 9 E Port Kemi FIN SCN N E Port Veitsiluoto FIN SCN N E Port Martinniemi FIN SCN N E Port Oulu FIN SCN 65 0 N E Port Raahe FIN SCN N E Port Lapaluoto FIN SCN N E Port Kalajoki FIN SCN N E Port Rahja FIN SCN N E Port Kokkola FIN SCN N 23 8 E Port Pietarsaari FIN SCN N E Port Vaasa FIN SCN 63 6 N E Port Kronvik FIN SCN 63 3 N E Port Kaskinen FIN SCN N E Port Kristinestad FIN SCN N E Port Nyhamn FIN SCN N E Port Merikarvia FIN SCN N E Port Pori FIN SCN N E Port Mantyluoto FIN SCN N E Port Olkiluoto FIN SCN N E Port Rauma FIN SCN 61 8 N E Port Uusikaupunki FIN SCN N E Port Kustavi FIN SCN N E Port Naantali FIN SCN N 22 1 E Port Tupavuori FIN SCN N 22 4 E Port Turku FIN SCN N E Port Parainen FIN SCN N E Port Mjosund FIN SCN N E Port Perno FIN SCN Port Frojdbole FIN SCN 60 9 N E Port Vartsala FIN SCN N 23 1 E Port Salo FIN SCN N E Port Kokkila FIN SCN N E Port Stromma FIN SCN N E Port Dalsbruk FIN SCN 60 2 N E Port Koverhar FIN SCN N E Port Lappohja FIN SCN N E Port Hanko FIN SCN N E Port Skogby FIN SCN N E Port Gulf of Finland FIN SCN Water area Lappvik FIN SCN N E Port Tammisaari FIN SCN N E Port Skuru FIN SCN 60 6 N E Port
128 126 (152) Inkoo FIN SCN 60 3 N 24 1 E Port Kantvik FIN SCN 60 5 N E Port Helsinki FIN SCN N E Port Svartback FIN SCN N E Port Skoldvik FIN SCN N E Port Tolkkinen FIN SCN N E Port Isnas FIN SCN N 26 0 E Port Valkom FIN SCN N E Port Loviisa FIN SCN N E Port Kotka FIN SCN N E Port Hamina FIN SCN N E Port Saimaa Canal FIN SCN Canal Suikki FIN SCN Port Lauritsala FIN SCN 61 5 N E Port Mustola FIN SCN 61 4 N E Port Joutseno FIN SCN 61 8 N E Port Lappeenranta FIN SCN 61 4 N E Port Kaukas FIN SCN 61 4 N E Port Imatra FIN SCN N E Port Kaukopaa FIN SCN N E Port Puhos FIN SCN 62 6 N E Port Ristiina FIN SCN N E Port Savonlinna FIN SCN N E Port Varkaus FIN SCN N E Port Joensuu FIN SCN N E Port Kuopio FIN SCN N E Port Siilinjarvi FIN SCN 63 5 N E Port Rapasaari FIN SCN Port
129 127 (152) Baltic Sea Ports, Poland Name Country Area Latitude Longitude Type Elblag POL SCN N E Port Tczew POL SCN 54 5 N E Port Gdansk POL SCN N E Port Gdynia POL SCN N E Port Wladyslawowo POL SCN N E Port Puck POL SCN N E Port Ustka POL SCN N E Port Darlowo POL SCN N E Port Kolobrzeg POL SCN N E Port Niechorze POL SCN 54 6 N 15 4 E Port Swinoujscie POL SCN N E Port Stepnica POL SCN N E Port Szczecin POL SCN N E Port Police POL SCN N E Port Baltic Sea Ports, Russia Name Country Area Latitude Longitude Type Vysotsk RUS SCN N E Port Vyborg RUS SCN N E Port Primorsk RUS SCN N E Port Lomonosov RUS SCN N E Port Kanonerskiy Is. RUS SCN N E Port Kronshtadt RUS SCN 60 0 N E Port St. Petersburg RUS SCN N E Port Priozersk RUS SCN 61 1 N 30 8 E Port Novgorod RUS SCN N E Port Shlisselburg RUS SCN N 31 8 E Port Petrodvorets RUS SCN N E Port Ust-Luga RUS SCN N E Port Kirovsk RUS SCN N E Port Baltiysk RUS SCN N E Port Svetlyy RUS SCN N 20 9 E Port Kaliningrad RUS SCN N E Port
130 128 (152) Baltic Sea Ports, Estonia Name Country Area Latitude Longitude Type Narva Joesuu EST SCN N 28 3 E Port Prangli Is. EST SCN N 25 0 E Port Muuga EST SCN N E Port Miiduranna EST SCN N E Port Tallinn EST SCN N E Port Paljassaare EST SCN N E Port Paldiski EST SCN N 24 3 E Port Loksa EST SCN N E Port Dirhami EST SCN N E Port Forby EST SCN 59 0 N E Port Lehtma EST SCN 59 3 N E Port Kunda EST SCN N E Port Heltermaa EST SCN N 23 4 E Port Kuivastu EST SCN N E Port Saaremaa Is. EST SCN Land area Roomassaar EST SCN N E Port Veere EST SCN N 22 3 E Port Virtsu EST SCN N E Port Haapsalu EST SCN N E Port Rohukula EST SCN N E Port Parnu EST SCN N E Port Baltic Sea Ports, Latvia Name Country Area Latitude Longitude Type Salacgriva LVA SCN N E Port Skulte LVA SCN N E Port Riga LVA SCN N 24 6 E Port Engure LVA SCN N E Port Mersrags LVA SCN N 23 8 E Port Ventspils LVA SCN N E Port Labrags LVA SCN N E Port Liepaja LVA SCN N 21 1 E Port Pavilosta LVA SCN N E Port Baltic Sea Ports, Lithuania Name Country Area Latitude Longitude Type Butinge Term. LTU SCN N E Terminal Klaipeda LTU SCN N 21 8 E Port

131 APPENDIX 8. Tallinn City Port 129 (152)
132 APPENDIX 9. Port of Muuga 130 (152)
133 APPENDIX 10. Port of Riga 131 (152)
134 APPENDIX 11. Port of Venspils 132 (152)

135 APPENDIX 12. Port of Liepaja 133 (152)

136 APPENDIX 13. Port of Klaipeda 134 (152)
137 APPENDIX 14. Port of Gnydia 135 (152)
138 APPENDIX 15. Port of Gdansk 136 (152)

139 APPENDIX 16. Port of Szcecin (southern part) 137 (152)
140 APPENDIX 17. Port of Szcecin (northern harbours) 138 (152)

141 APPENDIX 18. Port of Primorsk 139 (152)
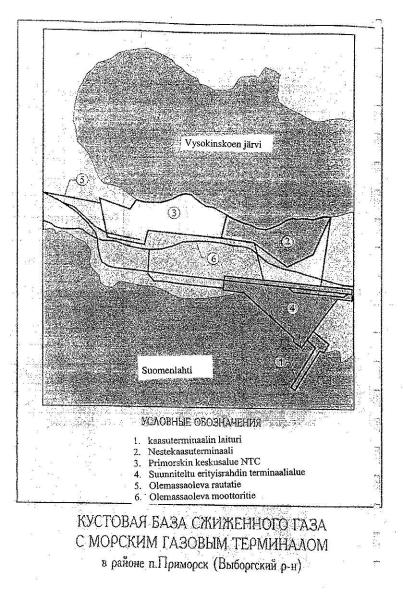
142 140 (152)

143 APPENDIX 19. Port of Lomonosov 141 (152)
144 APPENDIX 20. Port of Vyborg 142 (152)
145 APPENDIX 21. Port of Vysotsk 143 (152)

146 APPENDIX 22. Port of Luzhskaja Guba 144 (152)

147 APPENDIX 23. Port of Batareinya 145 (152)
148 APPENDIX 24. Baltic railways network 146 (152)

149 APPENDIX 25. Exports and imports through the Finnish ports in Gulf of Bothnia in (152)
150 APPENDIX 26. Forecast of the throughput development in Baltic up to The prognoses has been made in 1993, and is underestimating the Russian and Estonian developments. 148 (152)
151 149 (152) APPENDIX 27. Largest crude oil terminals in the Baltic Sea area (Arentz, 2002b). Country/location Terminal Discharge / loading Max. length Max. DWT Loading rate m 3 /hour Germany Rostock oil harbour berth 3 disc/load / Brunsbuttel Elbehafen oil section discharge 400 m Hamburg Kattwykhafen discharge Wilhemshaven North-West oelleitung, berth 4 discharge Standerstand St Catalina Island oil terminal discharge 230 m Poland Gdansk North Port liq. terminal disc/load 300 m /4 150 Denmark Kalundborg Statoil Oil terminal discharge 262 m Aabenraa Oil terminal, berth1 disc/load 350 m Stignäsvärkets Oil jetty discharge Fredericia Fredericia disc/load 275 m Gulfhavn Kuwait refinery discharge 280 m Sweden Brofjorden Brofjorden discharge Nynäshamn Nynäshamn discharge 300 m Gothenburg Torshamnen berth 801 discharge 300 m Finland Porvoo/Sköldvik Fortum Oil Harbour discharge 330 m Naantali Fortum Oil harbour discharge 250 m Estonia Muuga Crude oil loading berth load ( ) Latvia Ventspils Ventspils load 225 m Lithuania Klaipeda Butinge marine terminal disc/load Russia Primorsk load

152 150 (152) APPENDIX 28. North European crude oil terminals Source: Scandinavian Shipping Gazette; June 14, 2002.

153 Source: Scandinavian Shipping Gazette; June 14, (152)
Baltic Port Market. BPO Conference Riga, RECIENT FACTS & FIGURES. dr Maciej Matczak
 Baltic Port Market RECIENT FACTS & FIGURES BPO Conference Riga, 3-4.09.2015 Schedule TOTAL CARGO TURNOVER Trends of the last decade 2005-2014 First half of 2015 preliminary results MAIN TYPES OF CARGO
DEVELOPMENT OF TRAFFIC VOLUMES IN BALTIC SEA
 DEVELOPMENT OF TRAFFIC VOLUMES IN BALTIC SEA Tõnis Segerkrantz WINTER PERIOD PORT CALL DATA Real port call statistics were acquired from Finnish, Estonian and Russian maritime administrations and port
PORT OF HELSINKI ALL OF FINLAND WITHIN YOUR REACH
 PORT OF HELSINKI ALL OF FINLAND WITHIN YOUR REACH PORT OF THE ENTIRE FINLAND One of the strengths of the Port of Helsinki is its excellent location at the heart of Finnish production, population and consumption.
Increasing Maritime Transport, Impacts on Maritime Safety
 Increasing Maritime Transport, Impacts on Maritime Safety Int. Seminar on Baltic Maritime Safety Co operation St. Petersburg, Russia, 5. 6.June. 2007 Jorma Rytkönen Contents Maritime Safety Trends and
BRISK Sub-regional risk of spill of oil and hazardous substances in the Baltic Sea
 BRISK Sub-regional risk of spill of oil and hazardous substances in the Baltic Sea Part-financed by the European Union Photo: Nikolay Vlasov / HELCOM Maritime traffic in the Baltic The Baltic Sea today
Report on shipping accidents in the Baltic Sea area during 2010
 HELSINKI COMMISSION Baltic Marine Environment Protection Commission Report on shipping accidents in the Baltic Sea area during 2010 Photo by Maritime office in Gdynia Table of contents 1 Introduction...
Report on shipping accidents in the Baltic Sea area during Introduction
 HELSINKI COMMISSION Baltic Marine Environment Protection Commission Report on shipping accidents in the Baltic Sea area during 2009 Introduction Reports on shipping accidents in the Baltic Sea area have
Baltic Marine Environment Protection Commission
 Baltic Marine Environment Protection Commission Maritime Working Group St. Petersburg, Russia, 10-12 October 2017 MARITIME 17-2017 Document title 2017 HELCOM Overview on Port Reception Facilities (PRF)
Port of Tallinn Estonia s Biggest Maritime Gateway
 Port of Tallinn Estonia s Biggest Maritime Gateway Margus Vihman Chief Commercial Officer/ Member of the Management Board Organization The company in a nutshell State-owned limited liability company Port
HELCOM Ministerial Declaration on the implementation of the HELCOM Baltic Sea Action Plan
 HELCOM Ministerial Declaration on the implementation of the HELCOM Baltic Sea Action Plan 20 May 2010, Moscow The document Roadmap for upgrading the availability of port reception facilities for sewage
New opportunities for cargo logistics in Baltic region
 New opportunities for cargo logistics in Baltic region Māra TapiĦa Director of the Land Transport department Ministry of Transport of the Republic of Latvia Latvia as a natural bridge in EuroAsia traffic
Tour of Finland s Maritime Community
 Tour of Finland s Maritime Community Ports of Vuosaari, Kotka, and Turku Saimaa Canal Tallinn, Estonia September 7-12, 2008 Tour Participants Dr. Richard Stewart, Co-Director Stacey Carlson, Associate
FINEST LINK WP2 Appendix 2. Passenger volume estimation
 FINEST LINK WP2 Appendix 2. Passenger volume estimation Content Objectives and approach 3 9 Present situation 10 14 Preliminary train operating concept and land use projections 15 17 Trip type analysis
Femern Belt Fixed Link
 Femern Belt Fixed Link Impact on Baltic turntable function of Lübeck 5th BeltLogistics Workshop Felix Klingbiel, Vice Head of Marketing & Sales Lübecker Hafen-Gesellschaft mbh Femern Belt, 29 January 2015
VINTERSJÖFARTSFORSKNING. TRAFFIC RESTRICTIONS TO FINNISH AND SWEDISH PORTS Setting the Restrictions based on Ice Thickness and Distance Sailed in Ice
 STYRELSEN FÖR VINTERSJÖFARTSFORSKNING WINTER NAVIGATION RESEARCH BOARD Research Report No 58 Patrick Eriksson, Kaj Riska and Jouni Vainio TRAFFIC RESTRICTIONS TO FINNISH AND SWEDISH PORTS Setting the Restrictions
Innovation based development of Klaipeda Port technologies
 Discover a proven way! Innovation based development of Klaipeda Port technologies Mr. Artūras Drungilas Marketing and Corporate Affairs Director Klaipeda State Seaport Authority PortofKlaipeda.lt 1 Management
Unitised Goods Transport via Danish Ports 2004
 A project within the Interreg IIIB North Sea Programme Unitised Goods Transport via Danish Ports 2004 Annex 1.2.7 to the Final Report May 2007 Department of Development and Planning PREFACE This paper
Compulsory pilotage areas and pilot boarding areas
 1 (37) Date of issue: 6 March 2018 Entry into force: 15 March 2018 Legal basis: Pilotage Act (940/2003), section 21(3) Validity: indefinitely Modification details: Repeals Finnish Transport Safety Agency
Polish Ports in 2017 February 2018
 Polish Ports in 2017 February 2018 Summary and future outlook Summary: Polish port sector with another record-breaking result of cargo handling. Annual cargo turnover amounted 87.3 million tones, what
Economical Impact on. Container Transport Market. Erik Ringmaa, Chief Commercial Officer Port of Tallinn
 Economical Impact on Container Transport Market Erik Ringmaa, Chief Commercial Officer Port of Tallinn 2008 1 Background Since the beginning of 2000's container logistic companies have enjoyed rapid growth
The MAGALOG Project LNG-fueled shipping in the Baltic Sea
 The MAGALOG Project LNG-fueled shipping in the Baltic Sea The project is supported by: 1 MAGALOG WP4.1 Study of ship and transport volumes in the Baltic Sea, the North Sea and on Inland waterways in Europe
THE M/S MEGASTAR BUNKERING EXPERIENCE. Tallinn
 THE M/S MEGASTAR BUNKERING EXPERIENCE Tallinn 16.05.2018 CONTENTS 1. Eesti Gaas in brief. 2. Bunkering of M/S Megastar. 3. Lessons learned. 4. First year bunkering results 5. Conclusion. 6. Development
VINTERSJÖFARTSFORSKNING
 STYRELSEN FÖR VINTERSJÖFARTSFORSKNING WINTER NAVIGATION RESEARCH BOARD Research Report No 84 Leena Vedenpää OBSERV OBSERVATIONS OF SHIP ICE PERFORMANCE IN THE BALTIC Winter 2012 Finnish Transport Safety
Discover a proven way! PORT of KLAIPEDA. Klaipeda Port Extensive Business Opportunities Artūras Drungilas. Marketing and Corporate Affairs Director
 Discover a proven way! PORT of KLAIPEDA Klaipeda Port Extensive Business Opportunities Artūras Drungilas Marketing and Corporate Affairs Director Klaipeda Port Advantages of Klaipėda Port Convenient geographical
 16 March 2004 HELCOM RECOMMENDATION 25/7 on the SAFETY OF WINTER NAVIGATION IN THE BALTIC SEA AREA having regard to Article 13, Paragraph b) of the Helsinki Convention was adopted on 2 March 2004 in Helsinki
Baltic Marine Environment Protection Commission
 Baltic Marine Environment Protection Commission Group of Experts on Safety of Navigation Copenhagen, Denmark, 3 December 2014 SAFE NAV 5-2014 Document title Revision of HELCOM Recommendation 25/7 Safety
Baltic Sea Sewage Port Reception Facilities
 HELCOM Maritime HELCOM Overview 2018 Baltic Sea Sewage Port Reception Facilities Shipping helcom.fi Baltic Marine Environment Protection Commission 2018 Published by: HELCOM Baltic Marine Environment Protection
Baltic Marine Environment Protection Commission
 Baltic Marine Environment Protection Commission Revised HELCOM RECOMMENDATION 25/7 Adopted 2 March 2004 having regard to Article 13, Paragraph b) of the Helsinki Convention Revised 4 March 2015 and 10
SHIP ACCIDENTS IN THE BALTIC SEA AREA
 COMPILATION ON SHIP ACCIDENTS IN THE BALTIC SEA AREA 1989-1999 FINAL REPORT PREPARED BY THE MINISTRY OF ENVIRONMENT PROTECTION AND REGIONAL DEVELOPMENT OF THE REPUBLIC OF LATVIA MARINE ENVIRONMENT BOARD
AIS ship movements analysis for CBSS, Riga, 19 Sept 2012 Torbjörn Rydbergh, M.Sc., Nav. Arch. Managing Director & Owner
 Torbjörn Rydbergh, M.Sc., Nav. Arch. Managing Director & Owner www.marinebenchmark.com Subjects for presentation Company background Movements analysis AIS Cruise ships in Baltic Sea Balitic Sea 2012 Q1&Q2
Half-yearly Report 2013
 Half-yearly Report 2013 Financial result unchanged PORT OF ROTTERDAM THROUGHPUT DECREASED SLIGHTLY Throughput in the port of Rotterdam in the first half of the year decreased by 0.9% compared to the first
Accommodation statistics 2016
 Transport and Tourism 2017 Accommodation statistics 2016 Demand for accommodation services grew by 3 per cent in 2016 In 2016, accommodation in Finland recorded 203 million overnight stays, of which domestic
Baltic Marine Environment Protection Commission
 Baltic Marine Environment Protection Commission Group of Experts on Safety of Navigation Copenhagen, Denmark, 7 September 218 SAFE NAV 9-218 Document title Draft Annual HELCOM report on shipping accidents
Visit Finland Visitor Survey 2017
 Visit Finland Visitor Survey 2017 Visit Finland Studies 9 Business Finland, Visit Finland Helsinki 2018 Foreign visitors in Finland in 2017 Contents Abstract 5 Introduction 7 Trips to Finland 10 Day and
The Baltic Palette: Infrastructure Connecting Urban Systems Sea Transport Corridors
 EU Interreg III b Project The Baltic Palette: Infrastructure Connecting Urban Systems Sea Transport Corridors Final report September 2004 EU Interreg IIIb Project MariTerm AB tel +46 31 122030 www.mariterm.se
I The shipping market contents ISL
 Comment - Charts and Tables concerning The Shipping Market World Merchant Fleet Tanker Market Bulk Carrier Market Tab. 1 Additions/Reductions by Ship Types 2014-2016 and up to June 2017... III Tab. 2 Size
Measuring economic effects of cruise tourism - Port of Tallinn perspective
 Measuring economic effects of cruise tourism - Port of Tallinn perspective Sirle Arro, Port of Tallinn at the Workshop Measurement of regional economic effects caused by cruise tourism, Gdansk Gdansk /
EXPERIENCE THE BUNKERING OF M/S MEGASTAR. Bergen
 EXPERIENCE THE BUNKERING OF M/S MEGASTAR Bergen 10.04.2018 CONTENTS 1. Eesti Gaas in brief. 2. Bunkering of M/S Megastar. 3. Lessons learned. 4. Results of the first year of bunkering 5. Conclusion. EESTI
Survey on Employment in European Shipbuilding Countries. - Selected Results -
 AgS-Monitoring Shipbuilding Survey on Employment in European Shipbuilding Countries - Selected Results - Sector Committee Shipbuilding 04.05.2015 - Brussels Thorsten Ludwig Industry Related Developments
The explanations of other terms used throughout the tables are contained in the section on Definitions immediately following the tables.
 FOREWORD 1 CONTENT 1.1 UK Airports - Annual Statements of Movements, Passengers and Cargo is prepared by the Civil Aviation Authority with the co-operation of the United Kingdom airport operators. The
HUTCHISON PORTS STOCKHOLM
 HUTCHISON PORTS STOCKHOLM A NEW CONTAINER TERMINAL OPENING 2020 2 THE ONLY DEEP-WATER FACILITY ON THE EAST COAST OF SWEDEN 3 SCHEDULED PHASE 1 TO OPEN THE FIRST PHASE IN MAY 2020. 4 ON PHASE 1 COMPLETION:
Unitised goods via Danish ports in 2004 and the North Sea Region
 Downloaded from vbn.aau.dk on: januar 28, 2019 Aalborg Universitet Unitised goods via Danish ports in 2004 and the North Sea Region Johannsen, Hans Henrik Winther; Hansen, Leif Gjesing; Kristiansen, Jørgen;
SHIP-GENERATED WASTE MANAGEMENT
 SHIP-GENERATED WASTE MANAGEMENT Ellen Kaasik, Head of Quality and Environmental Management Department, Port of Tallinn at the Workshop Green Cruise Port Innovative Waste Management and Reception Facilities
Demand, Supply & Capacity in the Shipbuilding Industry
 Demand, Supply & Capacity in the Shipbuilding Industry million dwt Ship completions by region 120 100 80 60 Other Europe Japan Korea China "Europe" includes Russia SOURCE: IHS-Fairplay 40 20 42.3 0 0.4
Foreign Overnights in Finland 2016
 Foreign Overnights in Finland 2016 June 14, 2017 First name Last name 2 Positive outlook for Finland growing flows of visitors from several markets FOREIGN OVERNIGHTS 2016 5.8 million +4.7% growth 2016
NORD STREAM 2 STUDY ON COMMERCIAL SHIPS PASSING THE LAY BARGE IN THE FINNISH EEZ
 Intended for Nord Stream 2 AG Date October, 2016 Document number W-PE-EIA-POF-REP-805-060400EN-01 NORD STREAM 2 STUDY ON COMMERCIAL SHIPS PASSING THE LAY BARGE IN THE FINNISH EEZ NORD STREAM 2 Study on
Responses in Northern Europe to the New Silk Road
 Responses in Northern Europe to the New Silk Road By Ulf Sandmark Your Excellencies, Ladies and Gentlemen, Now you have heard about the potentials in the U.S. for a positive response to the New Silk Road
G. Glukhov The State Scientific Research Institute of Civil Aviation, Mikhalkovskaya Street, 67, building 1, Moscow, Russia
 International Journal of Civil Engineering and Technology (IJCIET) Volume 10, Issue 04, April 2019, pp. 1486 1494, Article ID: IJCIET_10_04_155 Available online at http://www.iaeme.com/ijmet/issues.asp?jtype=ijciet&vtype=10&itype=4
Baltic Marine Environment Protection Commission
 Baltic Marine Environment Protection Commission Cooperation Platform on Special Area According to MARPOL Annex IV (CP PRF) Hamburg, Germany, 13 September 2017 CP PRF 7-2017 Document 1 CLIA Europe Baltic
HELCOM - and oil handling in the Baltic Sea.
 Thomas Fagö INTERSPILL 2004 Chairman HELCOM RESPONSE HELCOM - and oil handling in the Baltic Sea. Development in the nineties. Export of oil is a major source of income for Russia. The Russian part of
Petrofin Research Greek fleet statistics
 Petrofin Research 2 nd part of Petrofin Research : Greek fleet statistics In this 2 nd part of Petrofin research, the Greek Fleet Statistics, we analyse the composition of the Greek fleet, in terms of
National Report of Finland
 National Report of 1. Finnish Hydrographic Office The Finnish Hydrographic Office (FHO) is responsible for nautical charting over the Finnish sea area and the most important inland water bodies. This covers
Helcom Maritime October CLIA Europe Baltic Exercise on Sewage. CLIA Europe 10 October 2017
 Helcom Maritime 17 10 October 2017 CLIA Europe Baltic Exercise on Sewage CLIA Europe 10 October 2017 The Baltic as a key market 3rd market by destination in the world 2.1% growth last year 353 MLN spending
SHIP MANAGEMENT SURVEY. July December 2017
 SHIP MANAGEMENT SURVEY July December 2017 INTRODUCTION The Ship Management Survey is conducted by the Statistics Department of the Central Bank of Cyprus and concentrates primarily on transactions between
Overview of tourism trends in Tallinn. First quarter report in 2018
 Overview of tourism trends in Tallinn First quarter report in 2018 Visits of foreign residents to Tallinn, January - March 2018 Residents of foreign countries made 780 338 visits to Tallinn, which means
SHIP MANAGEMENT SURVEY. January June 2018
 CENTRAL BANK OF CYPRUS EUROSYSTEM SHIP MANAGEMENT SURVEY January June 2018 INTRODUCTION The Ship Management Survey (SMS) is conducted by the Statistics Department of the Central Bank of Cyprus and concentrates
CLEANSHIP. Clean Baltic Sea Shipping. 3.1 Air pollution from ships in the partner ports
 CLEANSHIP Clean Baltic Sea Shipping 3.1 Air pollution from ships in the partner ports Organisation name of lead contractor for this deliverable: Klaipeda University Air pollution from ships research laboratory
Port dues strategies and incentives for cruise line companies for using green port features Jakub Piotrowicz, Maritime Institute in Gdańsk
 Port dues strategies and incentives for cruise line companies for using green Jakub Piotrowicz, Maritime Institute in Gdańsk at the Green Cruise Port Workshop Measurement of regional economic effects caused
Accommodation statistics
 Transport and Tourism 2018 Accommodation statistics 2018, January Nights spent by foreign tourists in Finland grew by 6.6 per cent in January 2018 Corrected on 8 March 2018. The corrected number is indicated
Belt and Road Initiative (BRI) in Belarus - assessment from an economic perspective
 in Belarus - assessment from an economic perspective") Policy Briefing Series [PB/06/2018] Belt and Road Initiative (BRI) in Belarus - assessment from an economic perspective Jörg Radeke, Dmitry Chervyakov Berlin/Minsk, September 2018 Structure 1. Introduction
Policy Briefing Series [PB/06/2018] Belt and Road Initiative (BRI) in Belarus - assessment from an economic perspective Jörg Radeke, Dmitry Chervyakov Berlin/Minsk, September 2018 Structure 1. Introduction
Over 2017, FPC s domestic passenger traffic grew by 1.4%. MACROECONOMIC ENVIRONMENT. Indicators 2017
 MARKET OVERVIEW 1 Over, FPC s domestic passenger traffic grew by 1.4%. MACROECONOMIC ENVIRONMENT Key economic growth indicators, ( % year-on-year) Indicators GDP 101.5 Consumer Price Index 103.7 Investment
Project Data Sheet BASIC PROJECT DATA
 BASIC PROJECT DATA Full project title: Short project title: (acronym) Improvement of navigation in the joint Bulgarian-Romanian section of the Danube river from km 530 to km 520 Batin and from km 576 and
Finnish Housing Markets and Housing Policy. Tommi Laanti Senior Analyst Ministry of the Environtment
 Finnish Housing Markets and Housing Policy Tommi Laanti Senior Analyst Ministry of the Environtment tommi.laanti@ymparisto.fi Housing Stock Right of occupancy is a form of co-operative housing, where resident
Russia 12% Russia 24% Foreign overnight stays 31% Domestic overnight stays 69% 8.3 MILLION FOREIGN VISITORS IN FINLAND IN 2017
 TOURISM IS A GROWING SOURCE OF EXPORT REVENUE AND A SIGNIFICANT EMPLOYMENT PROVIDER IN FINLAND TOURISM HAS A MULTIPLIER EFFECT ON OTHER SECTORS. 1 EURO IN TOURISM ADDS 56 CENTS VALUE TO THE OTHER SECTORS.
The economic impact of ATC strikes in Europe Key findings from our updated report for A4E
 pwc.com The economic impact of ATC strikes in Europe Key findings from our updated report for A4E Prepared for A4E Updates to our analysis since June 2016 Since releasing our Preliminary Findings in June
Natsuhiko OTSUKA North Japan Port Consultant Ltd./Hokkaido University )
") Japan-Norway Arctic Science and Innovation Week 216 Sessions : Arctic Maritime Operations and Societal Needs 216-6-3 at 1:: Natsuhiko OTSUKA North Japan Port Consultant Ltd./Hokkaido University ) This
Japan-Norway Arctic Science and Innovation Week 216 Sessions : Arctic Maritime Operations and Societal Needs 216-6-3 at 1:: Natsuhiko OTSUKA North Japan Port Consultant Ltd./Hokkaido University ) This
HELSINKI COMMISSION HELCOM TRANSIT ROUTE EWG 13/2008 Expert Working Group on Transit Routeing 13th Meeting Helsinki, Finland, 7-8 October 2008
 HELSINKI COMMISSION HELCOM TRANSIT ROUTE EWG 13/2008 Expert Working Group on Transit Routeing 13th Meeting Helsinki, Finland, 7-8 October 2008 Agenda Item 2 Overview of the current situation/follow up
HELSINKI TOURISM IN 2008
 Record year 2008 in brief 3.1 million bednights at accommodation establishments domestic visitors 41% of nights foreign visitors 59% of nights top markets Russia, Germany, Britain, Sweden, the United States
Ohio Freight Conference Great Lakes Commercial Navigation
 Ohio Freight Conference Great Lakes Commercial Navigation Roger E. Haberly Regional Economist Buffalo New York 13 September 2013 US Army Corps of Engineers Presentation Overview 1. GL Physical System Description
Tourism in Tallinn 2008
 Tourism in Tallinn 28 In 28, 2.38 million tourists stayed in Estonian accommodation establishments, 5% of whom stayed in Tallinn. Arrivals in Tallinn: 1,189, (+4%)1 Bednights in Tallinn: 2,97, (%) Total
The Ice Season
 The Ice Season 2006-2007 Author: Jouni Vainio 1 Co-authors: Simo Kalliosaari 1, Natalija Schmelzer 2, Torbjörn Grafström 3, Giedrius Ezerskis 4, Evgeni Komissarov 5, P. Soloshchuk 5, N. Fedorenko 5 and
Maritime ports freight and passenger statistics
 Maritime ports freight and passenger statistics Statistics Explained Data from March 2018. Planned update: January 2019. This article presents the latest statistical data on freight handling and passenger
Investor Update Issue Date: April 9, 2018
 Investor Update Issue Date: April 9, 2018 This investor update provides guidance and certain forward-looking statements about United Continental Holdings, Inc. (the Company or UAL ). The information in
IGI Wallcoverings Sales Statistics. Operations in Report to Member Companies. 15 July Contents. Introduction 3
 IGI Wallcoverings Sales Statistics Operations in 2013 Report to Member Companies 15 July 2014 Contents Introduction 3 Summary of results for 2013 5 Sales by type of wallcovering 9 Sales by category of
HELCOM-VASAB Maritime Spatial Planning Working Group Eleventh Meeting Riga, Latvia, 30 September-1 October 2015
 HELCOM-VASAB Maritime Spatial Planning Working Group Eleventh Meeting, 30 September-1 October 2015 Document title Upcoming meetings within HELCOM Code 7-2-Rev.1 Category INF Agenda Item 7 - Future work
VINTERSJÖFARTSFORSKNING
 STYRELSEN FÖR VINTERSJÖFARTSFORSKNING WINTER NAVIGATION RESEARCH BOARD Research Report No 76 Hanna Leisti and Kaj Riska OBSERV - OBSERVATIONS OF SHIP ICE PERFORMANCE IN THE BALTIC Winter 2011 Finnish Transport
Market Commentary. Greece s Shipping Sector: Overview and Outlook
 Market Commentary November 10, 2010 Greece s Shipping Sector: Overview and Outlook Overview Greece is a maritime nation by tradition and is one of the world's largest shipping powers. Greek shipping is
THE TARIFF OF PORT FEES AND CHARGES SZCZECIN AND ŚWINOUJŚCIE SEAPORTS AUTHORITY
 THE TARIFF OF PORT FEES AND CHARGES SZCZECIN AND ŚWINOUJŚCIE SEAPORTS AUTHORITY CONTENTS 1. APPLICATION... 3 2. COLLECTION.... 3 3. COLLECTION OF WASTE FROM SHIPS... 4 4. SERVICES PROVIDED BY PORT RESCUE
The ice season
 The ice season 2005-2006 Author: Jouni Vainio 1 Co-authors: Simo Kalliosaari 1, Natalija Schmelzer 2, Torbjörn Grafström 3, Inga Dailidiene 4, Evgeni Komissarov 5 and P. Soloshchuk 5 Key Message The ice
COMMISSION OF THE EUROPEAN COMMUNITIES REPORT FROM THE COMMISSION
 COMMISSION OF THE EUROPEAN COMMUNITIES Brussels, 24.02.2000 COM(2000) 99 final REPORT FROM THE COMMISSION THIRD REPORT ON THE IMPLEMENTATION OF COUNCIL REGULATION 3577/92 APPLYING THE PRINCIPLE OF FREEDOM
5,5. 8th. 2nd FACTS OF FINLAND. 5,5 million inhabitants. EU member since 1995.
 5,5 FACTS OF FINLAND 5,5 million inhabitants. EU member since 1995. OSLO NORWAY DENMARK SWEDEN FINLAND HELSINKI STOCKHOLM TALLINN RIGA VILNIUS 200 km ST. PETERSBURG MOSCOW R U S S I A 8th 8th 2nd The 8th
State of South Africa s Maritime Industry Transport Portfolio Committee. 08 May 2012 Commander Tsietsi Mokhele Chief Executive Officer
 State of South Africa s Maritime Industry Transport Portfolio Committee 08 May 2012 Commander Tsietsi Mokhele Chief Executive Officer An Overview of the SA Maritime Industry 3,000 km coastline in 3 oceans
Baltic Sea MIRG Project
 Baltic Sea MIRG Project 1 BALTIC SEA MIRG PROJECT (2014-2016) Baltic Sea Maritime Incident Response Group (Baltic Sea MIRG) project The project will create joint MIRG coordination models and standard operating
Baltic Sea Hydrographic Commission, Bathymetric Database and the MONALISA project. - with co-financing from EU TEN-T SJÖFARTSVERKET
 SJÖFARTSVERKET Baltic Sea Hydrographic Commission, Presentation vid dialogmöte Kommunikationer för tillväxt Centerpartiet Östergötland, 25 oktober 2011 Magnus Sundström Bathymetric Database and the MONALISA
APPLICATION OF THE NO-SPECIAL-FEE SYSTEM IN THE BALTIC SEA AREA
 CONVENTION ON THE PROTECTION OF THE MARINE ENVIRONMENT OF THE BALTIC SEA AREA HELSINKI COMMISSION - Baltic Marine HELCOM 19/98 Environment Protection Commission 15/1 Annex 19 19th Meeting Helsinki, 23-27
APPENDIX 20 EFFECTS ON NAVIGATIONAL SAFETY
 APPENDIX 20 EFFECTS ON NAVIGATIONAL SAFETY Effects of Lyttelton Port Recovery Plan on Navigational Safety November 2014 INTRODUCTION Lyttelton Port of Christchurch (LPC) utilises an integrated health
IUMI 2005 Amsterdam Facts & Figures Committee
 Report on Marine Insurance Premium 23 and 24 IUMI 25 Amsterdam Facts & Figures Committee Tore Forsmo, Managing Director Astrid Seltmann, Analyst The Central Union of Marine Underwriters, Oslo, Norway Thanks
3 Pilbara ports provide gateways
 COMMUNITY AND STAKEHOLDERS Community Consultation Committees 8 meetings each year across our 3 port locations Dampier, Port Hedland and Ashburton Community Support Initiative >$295,000 a year in financial
ACI EUROPE POSITION. A level playing field for European airports the need for revised guidelines on State Aid
 ACI EUROPE POSITION A level playing field for European airports the need for revised guidelines on State Aid 16 June 2010 1. INTRODUCTION Airports play a vital role in the European economy. They ensure
National Report of Finland
 National Report of Finland [15 August 2012] Executive Summary This Report gives an overview of the main activities of the Finnish Hydrographic Office (FHO) since the previous BSHC 16 th Conference. The
Worldwide Fleet Forecast
 Worldwide Fleet Forecast Presented to: Montreal June 6, 26 DAVID BECKERMAN Director, Consulting Services Agenda State of the Industry Worldwide Fleet Regional Jets Narrowbody Jets Large Widebody Jets Freighter
FINAVIA INTERIM REPORT 1 JANUARY SEPTEMBER 2010: DEMAND FOR AIR SERVICES RECOVERING
 1 (8) FINAVIA INTERIM REPORT 1 JANUARY 2010 30 SEPTEMBER 2010: DEMAND FOR AIR SERVICES RECOVERING Summary of the key figures for January to September Finavia Group s corresponding figures for the previous
BALTIC ICEBREAKING MANAGEMENT. Baltic Sea Icebreaking Report
 BALTIC ICEBREAKING MANAGEMENT Baltic Sea Icebreaking Report 2007-2008 1 Table of contents FOREWORD...3 1. Short history of the Baltic Icebreaking Management...4 2. Overview of the icebreaking season (2007-2008)
Estonia. Tourism in the economy. Tourism governance and funding
 Estonia Tourism in the economy Tourism contributes directly around 4.6% of Estonia s GDP, rising to 6.6% if indirect impacts are also included. Export revenues from tourism amount to approximately EUR
4 Rights and duties in connection with the conduct of petroleum activities
 Guidelines for application for Acknowledgment of Compliance (AoC) for mobile facilities intended for use in the petroleum activities on the Norwegian Continental Shelf (Unofficial translation), issued
An overview of Tallinn tourism trends
 An overview of Tallinn tourism trends August 2015 The data is collected from Statistics Estonia, Tallinn Airport and Port of Tallinn. In August 2015, 179,338 stayed overnight in Tallinn s accommodation
Investment possibilities of municipal formation KINGISEPP MUNICIPAL DISTRICT. This project is funded by the European Union
 Investment possibilities of municipal formation KINGISEPP MUNICIPAL DISTRICT This project is funded by the European Union Kingisepp municipal district is situated in the South-West of Leningrad Region.
Panama Canal Stakeholder Working Group Meeting
 Panama Canal Stakeholder Working Group Meeting POHA, Bayport Container Terminal, Houston, Texas August 27, 2012 TOTAL ECONOMIC IMPACT 9,749 Texas jobs are in some way related to the Port Of the 9,749
Accommodation statistics
 Transport and Tourism 201 Accommodation statistics 201, September Nights spent by foreign tourists in Finland up by 11.3 per cent in September 201 Nights spent by foreign tourists at Finnish accommodation
PRESS RELEASE. Address: Hungary, H-1068 Budapest, Benczúr utca 25.
 PRESS RELEASE Participation of the Permanent Representative of Hungary in Danube Commission, Dr. Ivan Gyurcsík at the 7th ASEM Sustainable Development Dialogue, (11-12 September 2018, Budapest, Hungary)