TECHNICAL REPORT 2018
|
|
|
- Gary Little
- 5 years ago
- Views:
Transcription


1 TECHNICAL REPORT 2018


2 Texas Aviation Economic Impact Study August 2018 Prepared for: TxDOT Aviation Division 125 E. 11th St. Austin, TX Phone: Prepared by: Texas A&M University System 3135 TAMU College Station, Texas Governor s Hill Drive, Suite 430 Cincinnati, OH With assistance from: KSA Engineers
3 TABLE OF CONTENTS CHAPTER 1: Study Overview and Results Texas Airports Show Robust Economic Growth TXDOT Leads A Coordinated Effort for Airport Development Texas Is A Leader in Aviation and Aerospace All Facets of The Airport System Were Engaged A Complete Picture of The System s Benefits The Conclusion Airport Benefits Continue to Soar CHAPTER 2: Socioeconomic Overview of Texas Population Trends Gross State Product Trends Industry Split Summary CHAPTER 3: The Economic Modeling Process Study Approach Measures of Economic Impact Categories of Economic Impact Types of Economic Impact Data Collection Methods On-Airport Activity Capital Improvement Impacts Commercial Service Visitors General Aviation Visitors Multiplier Impacts Impacts CHAPTER 4: Economic Impacts of Texas Airports Statewide Economic Impact of Airports Impacts On-Airport Construction Commercial Service Visitor-Related General Aviation Visitor-Related Impacts On-Airport Construction Commercial Service Visitor-Related General Aviation Visitor-Related Impacts On-Airport TOC-i
4 Construction Commercial Service Visitor-Related General Aviation Visitor-Related Comparison to Previous Study Summary CHAPTER 5: Business Use of Aviation Business Aviation Overview of Business Aviation Benefits of Business Aviation Accessibility On-Demand Aviation Employee Productivity Company Performance, Profits and Return to Shareholders Safety and Security Humanitarian Efforts Summary TOC-ii
5 LIST OF FIGURES Figure 1-1 Texas System Airports Figure 2-1 Historic Population Growth by Texas County, Figure 2-2 Forecasted Population Growth by Texas County, Figure 2-3 Gross State Product of Texas and Gross Domestic Product of USA (Billions of U.S. Dollars) Figure 2-4 Historic Texas Jobs, Figure 2-5 Historic Texas and National Unemployment Rates, Figure 2-6 Industry Split of Texas Economy, Figure 3-1 Illustration of Economic Impacts Figure 5-1 Percentage of Industry Best Of Lists Made Up of Business Aviation Users List of Tables Table 1-1 Economic Impacts of Texas System Airports Table 3-1 Texas IMPLAN Multipliers by Economy Sector Table 4-1 On-Airport Table 4-2 Construction Table 4-3 Commercial Service Visitor-Related Table 4-4 General Aviation Visitor-Related Table Table 4-6 On-Airport Table 4-7 Construction Table 4-8 Commercial Service Visitor-Related Table 4-9 General Aviation Visitor-Related Table Table 4-11 On-Airport Table 4-12 Construction Table 4-13 Commercial Service Visitor-Related Table 4-14 General Aviation Visitor-Related Table Table 4-16 Comparison of Economic Impacts TOC-iii
6 Appendices Appendix A Economic Impact Tables Table A-1: Estimates of General Aviation Visitors to Texas Airports... A-2 Table A-2: On-Airport from Texas Airports... A-9 Table A-3: Construction from Texas Airports... A-16 Table A-4: Commercial Service Visitor-Related from Texas Airports... A-23 Table A-5: General Aviation Visitor-Related from Texas Airports... A-24 Table A-6: from Texas Airports... A-31 Table A-7: On-Airport from Texas Airports... A-38 Table A-8: Construction from Texas Airports... A-45 Table A-9: Commercial Service Visitor-Related from Texas Airports... A-52 Table A-10: General Aviation Visitor-Related from Texas Airports... A-53 Table A-11: from Texas Airports... A-60 Table A-12: On-Airport from Texas Airports... A-67 Table A-13: Construction from Texas Airports... A-74 Table A-14: Commercial Service Visitor-Related from Texas Airports... A-81 Table A-15: General Aviation Visitor-Related from Texas Airports... A-82 Table A-16: from Texas Airports... A-89 TOC-iv

7 CHAPTER 1: STUDY OVERVIEW AND RESULTS TEXAS AIRPORTS SHOW ROBUST ECONOMIC GROWTH Texas is served by a robust, 289-airport system, a key element of the state s transportation network that attracts business, facilitates the travel of residents and visitors, and supports countless services such as military, law enforcement, and agriculture. Connections made through the airport system lead to the continued growth of Texas s metropolitan areas while providing invaluable access to the state s more rural communities. The Texas Department of Transportation s (TxDOT) Aviation Division has commissioned the Texas Aviation Economic Impact Study to examine the value these connections bring to local communities across the state. The results of the 2017 study clearly show that Texas s 25 commercial service airports and 264 general aviation airports continue to be major catalysts for well-paying, quality jobs. When results from the 2017 are compared to the last statewide economic impact (2011), employment and output have shown a significant increase. 1-1
 State Block Grant Program.")
8 STUDY OVERVIEW AND RESULTS TXDOT LEADS A COORDINATED EFFORT FOR AIRPORT DEVELOPMENT Since 1966, the State of Texas has participated in the development of a statewide system of airports by providing grants to communities for airport improvements. Beginning in 1993, Texas became part of the Federal Aviation Administration s (FAA) State Block Grant Program. Texas is one of 10 states in the program and it allows TxDOT s Aviation Division to serve as the FAA s agent in administering grant funding under their Airport Improvement Program. This economic impact study is a key component of the overall system planning effort undertaken by TxDOT s Aviation Division. The Aviation Division constantly engages airport sponsors and stakeholders and periodically updates the Texas Airport System Plan that aids the Division in identifying the roles and future needs of system airports. This system planning process assists the Division in determining what capital improvements would best serve the state s aviation needs. TxDOT continuously updates its three-year Aviation Capital Improvement Program with input from airport sponsors. This detailed listing of projects is updated and submitted annually for approval to the Texas Transportation Commission. TxDOT annually invests approximately $70 million in the airport system s 264 general aviation airports. While that may change somewhat from year to year, it represents Lobby at TSTC Waco Airport the combined investment from federal, state, and local sources. The Aviation Division works to enhance safety, preserves existing facilities, responds to present needs, and provides for future needs. TEXAS IS A LEADER IN AVIATION AND AEROSPACE It should also be noted that, while the focus of this study is the Texas airport system, and its general aviation airports in particular, Texas has extensive aerospace activity in addition to what is tied to its system airports. Aviation economic activity related to military bases, aerospace manufacturing firms, and space exploration is extensive. According to the 2017 Texas Aerospace, Aviation and Defense report, the aerospace industry in Texas employs more than 135,000 workers at 1,300 companies. In terms of air transportation jobs, Texas ranks number one among all U.S. states. Furthermore, there are more aircraft mechanics and airfield operations specialists working in Texas than any other state. Texas is also one of the top states for aerospace manufacturing jobs. Of the 20 largest aerospace manufacturers in the world, 17 operate major facilities in Texas, with employers such as Boeing, Airbus, Lockheed Martin, and General Electric employing 9 percent of the U.S. aerospace manufacturing workforce there. So, while the impacts associated with the Texas system airports are substantial, it is important to remember that the airport system is only part of an even larger aerospace industry that stimulates the Texas economy. 1-2

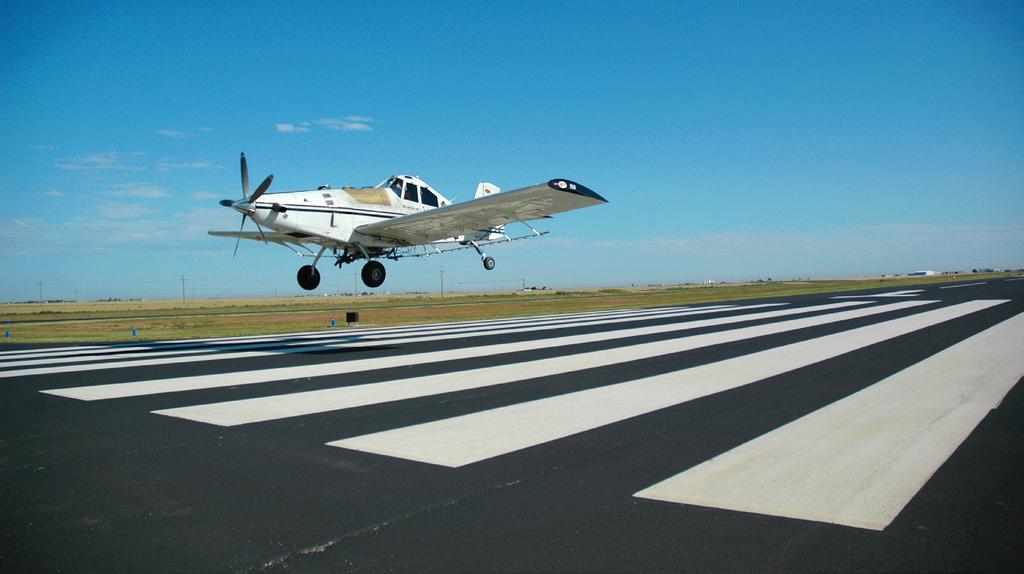
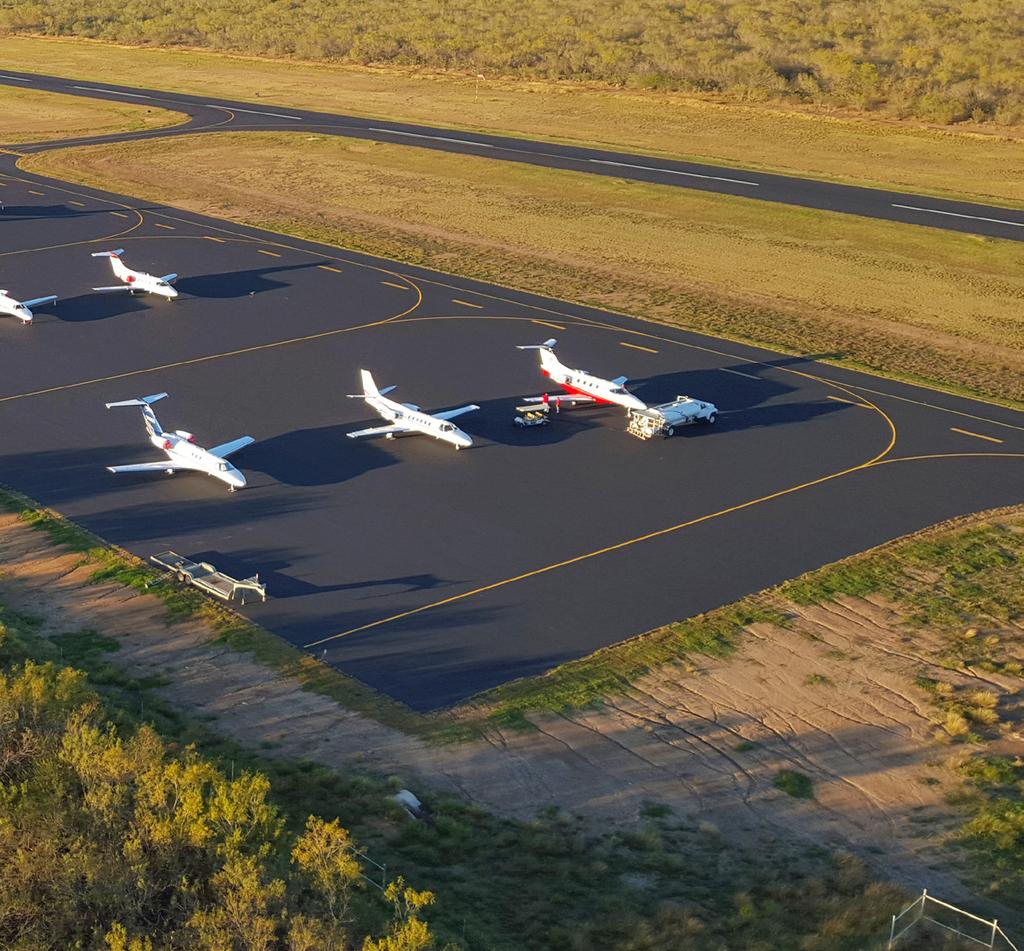
9 STUDY OVERVIEW AND RESULTS ALL FACETS OF THE AIRPORT SYSTEM WERE ENGAGED In the 2017 study, airports and their businesses and tenants were surveyed and analyzed to determine the employment, payroll, and economic output that they generate through direct and indirect means. Companies from multiple sectors use Texas airports to visit offices and work sites, transport employees, ship products, and to base their business. The Texas airport system offers the opportunity for connections to the domestic and international markets via commercial service and general aviation travel. Corporate flight departments rely on both types of airports, simplifying travel in an age where business is ever-evolving. Airports operating in major metropolitan areas such as Houston, Dallas, Fort Worth, San Antonio, and Austin have witnessed great success in providing homes for aircraft flying for Fortune 500 companies involved in oil and gas, technology, defense, and other industries. The aviation industry also brings tourists to Texas for diverse recreation opportunities. Businesses off-airport benefit from visitor spending during their trip. This aviation economic activity generates additional impacts as it recirculates amongst other companies and households throughout Texas. Airports play an integral role in disaster mitigation and recovery. They provide government agencies with aerial access to prevent and put out wildfires as well as rapid contact to communities along the Gulf of Mexico where severe storms can cripple critical resources and place a great number of lives in danger. For example, the Aransas County Airport in Rockport played an important role after Hurricane Harvey. Airport and TxDOT staff worked tirelessly to clear the airport for use within four days after the hurricane made landfall. Once operational, the airport served as a staging area for crews helping to restore utilities and buildings and welcomed aircraft from around the nation bringing aid supplies to Texas. Airports will continue to play a major role in disaster mitigation and recovery as processes and planning focus on best practices and improvements to prepare for future events. Other airports in the system provide homes to tenants that play a prominent, but not always visible role in the everyday lives of Texas residents. Agricultural operations at smaller airports throughout rural Texas have easy access to farmland and keep valuable cotton and food crops safe from pests and disease. Airports along the Mexico border are home to U.S. Customs and Border Patrol and Texas Department of Public Safety outfits that provide monitoring and security via helicopters and airplanes. These industries play important roles that may be overlooked but rely on Planes on the apron at Midland Airpark airports for their success. These industries provide context for the data and results presented throughout this report and illustrate the importance of airports to the Texas economy. The 25 commercial service and 264 general aviation airports that make up Texas s airport system, as shown in Figure 1-1 vary in size and function. This study estimates the various economic impacts produced by the assorted aviation-related activities associated with each of these airports. Airports 1-3

10 STUDY OVERVIEW AND RESULTS were contacted, many through on-site visits, by study team members to gather data from airport staff, tenants, and visitors to quantify the activity and investment taking place. This data is then categorized by on-airport activity, capital improvement expenditures, and spending from visitors arriving via commercial service and general aviation aircraft. Analyzing data from these categories leads to measurements of jobs, annual payroll, and annual output stemming from each system airport. For this study, data and multipliers used in the development of the model are for the year Figure 1-1 Texas System Airports Source: CDM Smith. 1-4

11 STUDY OVERVIEW AND RESULTS A COMPLETE PICTURE OF THE SYSTEM S BENEFITS The Technical Report presents a complete picture of the many benefits stemming from the Texas airport system, outlining 2017 results with background information and connections to unique airports in the system to provide useful insight into the total value these facilities bring to Texas. Chapter 1, Study Overview, provides a background on the study, significant findings, and summarized airport results. Chapter 2, Socioeconomic Overview of Texas, depicts the trends in Texas population and employment, and discusses key aspects of the Texas economy and its industries. Chapter 3, The Economic Modeling Process, outlines the methodology used to collect data, analyze findings, and produce valuable quantitative results. Chapter 4, Economic Impacts of Texas Airports, separates results by three measures, employment, payroll, and output, and further breaks down results by on-airport activity, capital improvements, and visitor-related impacts, by both commercial service and general aviation visitors. Chapter 5, Business Use of Aviation, identifies the benefits of business operations at airports in the United States and Texas and the significance they hold in general aviation operations. THE CONCLUSION AIRPORT BENEFITS CONTINUE TO SOAR Results from the Texas Aviation Economic Impact Study indicate the tremendous strength of Texas s overall system. EMPLOYMENT 778,955 PAYROLL $30.1 BILLION OUTPUT $94.3 BILLION The 264 general aviation airports contribute more than 48,000 jobs with a payroll of nearly $2.6 billion. As presented above, these numbers represent a significant increase since the system was last evaluated in The total output attributable to general aviation airports surpasses $9.3 billion. This report provides a comprehensive analysis of Texas airports and the results of the study, identifying the socioeconomic make-up of the study area, the details of the study approach and impacts by category, and the importance of business aviation. The following findings demonstrate the stature and importance of the Texas aviation system. Nearly 17,150 direct jobs (those jobs associated with where the initial point of economic activity occurs) are found on general aviation airports, with an associated payroll of $1.4 billion and output of $4.5 billion. General aviation visitors support 5,621 direct jobs, nearly $134.8 million in annual payroll, and $325.8 million in annual output. Cessna 182 preparing to park 1-5
12 STUDY OVERVIEW AND RESULTS Commercial service airports support approximately 112,500 direct on-airport jobs that generate $7.3 billion in payroll and $23.9 billion in output. Commercial service airport visitors are responsible for 345,508 direct jobs, $8.3 billion in annual payroll, and nearly $19.0 billion in annual expenditures. On average, Texas system airports and their businesses invest $1.5 billion annually in capital projects. These projects result in more than 9,600 direct jobs with pay and benefits of $347.1 million. In addition to these economic benefits, Texas airports deliver an assortment of qualitative benefits. For example, airports across the state support the oil and gas industry as gateways to remote operations involving oil rigs, pipelines, and processing plants. They provide training grounds for flight crews and aircraft maintainers, necessary for the future of the aviation industry. The total economic impact of each system airport is presented in Table 1-1 below. Table 1-1 Economic Impacts of Texas System Airports Airport Commercial Service Airports Abilene Abilene Regional 2,649 $112,584,000 $362,636,000 Amarillo Rick Husband Amarillo International 11,381 $419,520,000 $1,233,171,000 Austin Austin-Bergstrom International 74,148 $2,506,178,000 $7,605,871,000 Beaumont/Port Arthur Jack Brooks Regional 405 $14,446,000 $39,817,000 Brownsville Brownsville/South Padre Island International 1,800 $58,545,000 $178,916,000 College Station Easterwood Field 1,333 $42,821,000 $124,586,000 Corpus Christi Corpus Christi International 8,693 $286,829,000 $782,479,000 Dallas Dallas Love Field 60,595 $1,920,556,000 $6,106,367,000 Dallas-Fort Worth Dallas/Fort Worth International 243,506 $9,292,419,000 $29,916,566,000 El Paso El Paso International 24,374 $725,151,000 $2,234,988,000 Fort Hood (Killeen) Killeen-Fort Hood Regional 1,557 $46,833,000 $134,880,000 Harlingen Valley International 4,540 $148,071,000 $432,745,000 Houston George Bush Intercontinental/Houston 161,366 $7,217,245,000 $22,748,921,000 Houston William P Hobby 50,808 $1,931,812,000 $4,785,816,000 Laredo Laredo International 1,667 $56,491,000 $180,766,000 Longview East Texas Regional 681 $29,847,000 $88,667,000 Lubbock Lubbock Preston Smith International 6,203 $193,548,000 $565,895,000 Mc Allen Mc Allen Miller International 7,227 $231,653,000 $632,911,000 Midland Midland International Air and Space Port 10,133 $334,517,000 $908,119,000 San Angelo San Angelo Regional/Mathis Field 1,218 $44,960,000 $124,302,000 San Antonio San Antonio International 52,593 $1,749,050,000 $5,316,580,
13 STUDY OVERVIEW AND RESULTS Airport Texarkana Regional Airport- Texarkana, AR Webb Field 495 $15,711,000 $39,684,000 Tyler Tyler Pounds Regional 1,353 $50,235,000 $152,377,000 Waco Waco Regional 1,179 $40,938,000 $113,983,000 Sheppard AFB/Wichita Falls Wichita Falls Municipal 962 $32,907,000 $92,510,000 Commercial Service Airports 730,866 $27,502,867,000 $84,903,553,000 General Aviation Airports Albany Albany Municipal 7 $147,000 $524,000 Alice Alice International 93 $2,776,000 $8,890,000 Alpine Alpine-Casparis Municipal 81 $4,263,000 $12,948,000 Amarillo Tradewind 41 $1,419,000 $4,177,000 Anahuac Chambers County 8 $168,000 $1,319,000 Andrews Andrews County 19 $529,000 $1,716,000 Angleton/Lake Jackson Texas Gulf Coast Regional 220 $7,686,000 $24,498,000 Arlington Arlington Municipal 906 $52,136,000 $236,354,000 Athens Athens Municipal 19 $570,000 $2,397,000 Atlanta Hall-Miller Municipal 8 $227,000 $667,000 Ballinger Bruce Field 2 $60,000 $220,000 Bay City Bay City Regional 45 $966,000 $3,056,000 Beaumont Beaumont Municipal 47 $1,350,000 $5,526,000 Beeville Beeville Municipal 7 $207,000 $771,000 Big Lake Reagan County 3 $76,000 $282,000 Big Spring Big Spring Mc Mahon- 93 $4,283,000 $15,606,000 Wrinkle Bonham Jones Field 21 $492,000 $2,084,000 Borger Hutchinson County 72 $3,287,000 $12,280,000 Bowie Bowie Municipal 8 $284,000 $899,000 Brady Curtis Field 43 $1,294,000 $4,034,000 Breckenridge Stephens County 100 $3,002,000 $7,255,000 Brenham Brenham Municipal 43 $1,709,000 $5,832,000 Bridgeport Bridgeport Municipal 20 $499,000 $1,303,000 Brownfield Terry County 16 $376,000 $1,727,000 Brownwood Brownwood Regional 66 $2,414,000 $9,443,000 Bryan Coulter Field 66 $3,588,000 $11,539,000 Burnet Burnet Municipal Kate 38 $1,268,000 $5,654,000 Craddock Field Caddo Mills Caddo Mills Municipal 52 $1,282,000 $3,463,000 Caldwell Caldwell Municipal 8 $220,000 $824,000 Cameron Cameron Municipal Airpark 1 $22,000 $124,000 Canadian Hemphill County 12 $323,000 $939,000 Carrizo Springs Dimmit County 39 $1,676,000 $6,318,000 Carthage Panola County-Sharpe Field 6 $189,000 $646,000 Castroville Castroville Municipal 51 $1,042,000 $3,943,000 Center Center Municipal 6 $207,000 $680,000 Childress Childress Municipal 28 $1,163,000 $4,801,000 Cisco Cisco Municipal 2 $31,000 $110,
14 STUDY OVERVIEW AND RESULTS Airport Clarksville Clarksville/Red River County- 3 $53,000 $176,000 J D Trissell Field Cleburne Cleburne Regional 96 $2,702,000 $8,948,000 Cleveland Cleveland Municipal 17 $488,000 $1,878,000 Clifton Clifton Municipal/Isenhower 19 $472,000 $2,050,000 Field Coleman Coleman Municipal 4 $114,000 $909,000 Colorado City Colorado City 9 $191,000 $936,000 Columbus Robert R Wells Jr. 5 $55,000 $229,000 Comanche Comanche County-City 5 $130,000 $401,000 Commerce Commerce Municipal 19 $584,000 $2,342,000 Corsicana C David Campbell Field- 22 $561,000 $1,979,000 Corsicana Municipal Cotulla Cotulla-La Salle County 29 $683,000 $2,670,000 Crane Crane County 1 $34,000 $136,000 Crockett Houston County 4 $126,000 $397,000 Crosbyton Crosbyton Municipal 19 $382,000 $2,109,000 Dalhart Dalhart Municipal 42 $1,081,000 $4,959,000 Dallas Addison 3,212 $147,382,000 $467,378,000 Dallas Dallas CBD Vertiport 1 $25,000 $668,000 Dallas Dallas Executive 456 $15,123,000 $54,816,000 McKinney McKinney National 993 $64,272,000 $212,717,000 Decatur Decatur Municipal 65 $2,641,000 $8,926,000 Del Rio Del Rio International 135 $6,073,000 $19,027,000 Dell City Dell City Municipal 4 $87,000 $432,000 Denton Denton Enterprise 1,435 $45,840,000 $156,338,000 Denver City Denver City 2 $49,000 $174,000 Desoto Desoto Heliport 37 $1,766,000 $7,090,000 Devine Devine Municipal 34 $866,000 $2,591,000 Dimmitt Dimmitt Municipal 4 $92,000 $507,000 Dryden Terrell County 5 $110,000 $449,000 Dublin Dublin Municipal 7 $179,000 $649,000 Dumas Moore County 42 $1,296,000 $6,688,000 Eagle Lake Eagle Lake 53 $1,293,000 $5,598,000 Eagle Pass Maverick County Memorial 7 $208,000 $986,000 International Eastland Eastland Municipal 31 $1,273,000 $4,555,000 Edinburg South Texas International at 73 $3,515,000 $10,041,000 Edinburg Edna Jackson County 10 $308,000 $745,000 Ennis Ennis Municipal 18 $491,000 $2,175,000 Fabens Fabens 14 $352,000 $1,317,000 Falfurrias Brooks County 16 $440,000 $1,596,000 Floydada Floydada Municipal 25 $599,000 $2,892,000 Fort Stockton Fort Stockton-Pecos County 14 $398,000 $1,722,000 Fort Worth Fort Worth Alliance 3,410 $148,928,000 $519,006,000 Fort Worth Fort Worth Meacham 2,162 $100,933,000 $326,447,000 International Fort Worth Fort Worth Spinks 388 $13,444,000 $39,086,
15 STUDY OVERVIEW AND RESULTS Airport Fredericksburg Gillespie County 103 $4,016,000 $13,727,000 Gainesville Gainesville Municipal 2,291 $62,066,000 $172,770,000 Galveston Scholes International at 361 $15,778,000 $42,878,000 Galveston Garland Garland/DFW Heloplex 73 $4,121,000 $15,047,000 Gatesville Gatesville Municipal 13 $387,000 $1,627,000 George West Live Oak County 9 $260,000 $1,122,000 Georgetown Georgetown Municipal 546 $14,757,000 $52,663,000 Giddings Giddings-Lee County 9 $271,000 $1,153,000 Gilmer Fox Stephens Field-Gilmer 19 $494,000 $1,457,000 Municipal Gladewater Gladewater Municipal 26 $545,000 $1,467,000 Gonzales Roger M. Dreyer Memorial 2 $60,000 $226,000 Graford Possum Kingdom 2 $55,000 $180,000 Graham Graham Municipal 16 $745,000 $1,967,000 Granbury Granbury Regional 135 $4,905,000 $18,473,000 Grand Prairie Grand Prairie Municipal 2,184 $104,617,000 $361,171,000 Greenville Majors 9,115 $969,003,000 $4,083,384,000 Gruver Gruver Municipal 19 $395,000 $2,240,000 Hallettsville Hallettsville Municipal 2 $79,000 $422,000 Hamilton Hamilton Municipal 6 $158,000 $516,000 Haskell Haskell Municipal 12 $275,000 $1,352,000 Hearne Hearne Municipal 15 $323,000 $1,712,000 Hebbronville Jim Hogg County 3 $76,000 $377,000 Henderson Rusk County 13 $389,000 $1,983,000 Hereford Hereford Municipal 35 $802,000 $3,898,000 Hillsboro Hillsboro Municipal 32 $917,000 $3,908,000 Hondo South Texas Regional at 162 $3,894,000 $11,582,000 Hondo Houston Conroe-North Houston 1,170 $48,281,000 $136,330,000 Regional Houston David Wayne Hooks 806 $29,871,000 $91,725,000 Memorial Houston Ellington Field 2,599 $130,090,000 $332,857,000 Houston Houston-Southwest 189 $5,413,000 $14,931,000 Houston Pearland Regional 154 $5,669,000 $18,862,000 Houston Sugar Land Regional 692 $32,478,000 $92,993,000 Houston West Houston 215 $7,442,000 $22,413,000 Huntsville Huntsville Municipal 44 $1,228,000 $3,664,000 Ingleside McCampbell-Porter 118 $4,190,000 $17,850,000 Jacksboro Jacksboro Municipal 4 $100,000 $338,000 Jacksonville Cherokee County 97 $3,875,000 $10,137,000 Jasper Jasper County-Bell Field 10 $297,000 $1,024,000 Jayton Kent County 1 $27,000 $134,000 Jefferson Cypress River 2 $71,000 $278,000 Junction Kimble County 20 $476,000 $2,097,000 Kenedy Karnes County 5 $123,000 $524,000 Kerrville Kerrville Municipal/Louis Schreiner Field 680 $16,814,000 $38,330,
16 STUDY OVERVIEW AND RESULTS Airport Killeen Skylark Field 69 $1,435,000 $4,302,000 Kingsville Kleberg County 38 $1,128,000 $4,475,000 Kirbyville Kirbyville 7 $199,000 $624,000 Knox City Harrison Field of Knox City 14 $284,000 $1,549,000 Kountze/Silsbee Hawthorne Field 6 $178,000 $771,000 La Grange Fayette Regional Air Center 26 $650,000 $2,237,000 La Porte La Porte Municipal 71 $2,340,000 $9,530,000 Lago Vista Lago Vista TX-Rusty Allen 34 $914,000 $3,509,000 Lamesa Lamesa Municipal 61 $1,424,000 $6,050,000 Lampasas Lampasas 4 $124,000 $592,000 Lancaster Lancaster Regional 156 $4,429,000 $11,911,000 Levelland Levelland Municipal 35 $1,279,000 $4,907,000 Liberty Liberty Municipal 7 $192,000 $578,000 Littlefield Taylor Brown Municipal 18 $411,000 $2,004,000 Livingston Livingston Municipal 8 $217,000 $793,000 Llano Llano Municipal 19 $538,000 $2,334,000 Lockhart Lockhart Municipal 19 $491,000 $1,682,000 Lufkin Angelina County 153 $7,558,000 $25,973,000 Madisonville Madisonville Municipal 17 $291,000 $860,000 Marfa Marfa Municipal 23 $663,000 $1,932,000 Marshall Harrison County 19 $509,000 $1,169,000 Mason Mason County 2 $64,000 $359,000 Mc Camey Upton County 13 $435,000 $2,004,000 Mesquite Mesquite Metro 281 $8,559,000 $22,726,000 Mexia Mexia-Limestone County 62 $2,548,000 $10,562,000 Midland Midland Airpark 90 $3,627,000 $14,596,000 Midlothian/Waxahachie Mid-Way Regional 202 $6,000,000 $22,115,000 Mineola/Quitman Wood County 13 $378,000 $1,356,000 Mineral Wells Mineral Wells 515 $23,573,000 $78,020,000 Monahans Roy Hurd Memorial 27 $1,177,000 $3,611,000 Mount Pleasant Mount Pleasant Regional 44 $1,465,000 $5,203,000 Mount Vernon Franklin County 3 $103,000 $453,000 Muleshoe Muleshoe Municipal 2 $60,000 $226,000 Munday Munday Municipal 9 $197,000 $1,117,000 Nacogdoches A L Mangham Jr. Regional 18 $488,000 $1,391,000 Navasota Navasota Municipal 11 $259,000 $909,000 New Braunfels New Braunfels Regional 240 $7,711,000 $27,331,000 Odessa Odessa-Schlemeyer Field 202 $4,665,000 $15,142,000 Olney Olney Municipal 786 $39,402,000 $145,936,000 Orange Orange County 19 $552,000 $1,823,000 Ozona Ozona Municipal 8 $220,000 $821,000 Paducah Dan E Richards Municipal 16 $328,000 $1,869,000 Palacios Palacios Municipal 6 $141,000 $463,000 Palestine Palestine Municipal 12 $352,000 $1,304,000 Pampa Perry Lefors Field 14 $412,000 $1,475,000 Panhandle Panhandle-Carson County 16 $330,000 $1,912,000 Paris Cox Field 42 $1,206,000 $4,122,000 Pearsall Mc Kinley Field 6 $190,000 $859,
17 STUDY OVERVIEW AND RESULTS Airport Pecos Pecos Municipal 60 $1,820,000 $6,262,000 Perryton Perryton Ochiltree County 34 $1,320,000 $4,810,000 Plains Yoakum County 24 $527,000 $2,036,000 Plainview Hale County 74 $3,699,000 $13,815,000 Pleasanton Pleasanton Municipal 12 $288,000 $811,000 Port Aransas Mustang Beach 6 $164,000 $502,000 Port Isabel Port Isabel-Cameron County 25 $696,000 $3,035,000 Port Lavaca Calhoun County 33 $986,000 $3,517,000 Port Mansfield Charles R Johnson 1 $26,000 $132,000 Presidio Presidio Lely International 4 $102,000 $384,000 Quanah Quanah Municipal 12 $269,000 $1,416,000 Refugio Rooke Field 6 $202,000 $1,087,000 Roanoke Northwest Regional 291 $8,009,000 $32,088,000 Robstown Nueces County 16 $492,000 $1,392,000 Rockdale H H Coffield Regional 2 $60,000 $226,000 Rockport Aransas County 160 $5,263,000 $15,410,000 Rocksprings Edwards County 1 $37,000 $149,000 Rockwall Ralph M Hall/Rockwall 25 $672,000 $2,342,000 Municipal San Antonio Stinson Municipal 361 $12,412,000 $35,617,000 San Marcos San Marcos Regional 664 $22,671,000 $82,109,000 San Saba San Saba County Municipal 2 $48,000 $148,000 Seminole Gaines County 14 $415,000 $1,696,000 Seymour Seymour Municipal 13 $176,000 $856,000 Sherman Sherman Municipal 11 $307,000 $958,000 Sherman/Denison North Texas Regional/Perrin 347 $7,312,000 $25,542,000 Field Sinton Alfred C 'Bubba' Thomas 28 $677,000 $2,141,000 Slaton Slaton Municipal 22 $577,000 $2,242,000 Smithville Smithville Crawford 19 $532,000 $2,164,000 Municipal Snyder Winston Field 31 $1,299,000 $4,500,000 Sonora Sonora Municipal 2 $35,000 $191,000 Spearman Major Samuel B Cornelius 4 $119,000 $393,000 Field Stamford Arledge Field 10 $204,000 $1,003,000 Stephenville Stephenville Clark Regional 52 $1,313,000 $5,239,000 Sulphur Springs Sulphur Springs Municipal 83 $3,599,000 $11,941,000 Sunray Sunray 30 $614,000 $3,337,000 Sweetwater Avenger Field 13 $546,000 $1,968,000 Tahoka T-Bar 2 $57,000 $257,000 Taylor Taylor Municipal 74 $1,825,000 $6,334,000 Temple Draughon-Miller Central 220 $11,315,000 $35,861,000 Texas Regional Terrell Terrell Municipal 47 $1,639,000 $4,806,000 Throckmorton Throckmorton Municipal 1 $42,000 $208,000 Tulia City of Tulia/Swisher County 3 $78,000 $273,000 Municipal Uvalde Garner Field 386 $13,653,000 $43,921,
18 STUDY OVERVIEW AND RESULTS Airport Van Horn Culberson County 7 $201,000 $923,000 Vega Oldham County 3 $74,000 $265,000 Vernon Wilbarger County 30 $723,000 $3,007,000 Victoria Victoria Regional 272 $11,699,000 $42,250,000 McGregor Mc Gregor Executive 122 $6,259,000 $22,776,000 Waco TSTC Waco 3,358 $169,178,000 $552,097,000 Wellington Marian Airpark 3 $73,000 $257,000 Weslaco Mid Valley 57 $1,710,000 $4,738,000 Wharton Wharton Regional 38 $1,469,000 $4,830,000 Wheeler Wheeler Municipal 1 $26,000 $132,000 Wichita Falls Kickapoo Downtown 71 $2,846,000 $8,858,000 Wills Point Van Zandt County Regional 11 $176,000 $706,000 Wink Winkler County 4 $123,000 $571,000 Winnie/Stowell Chambers County-Winnie 134 $2,612,000 $15,653,000 Stowell Winnsboro Winnsboro Municipal 1 $33,000 $164,000 Winters Winters Municipal 2 $35,000 $122,000 Zapata Zapata County 6 $136,000 $487,000 Other Airports 28 $275,000 $1,344,000 General Aviation Airports 48,089 $2,576,144,000 $9,347,159,000 All Airports 778,955 $30,079,011,000 $94,250,712,000 Source: CDM Smith and IMPLAN 1-12
19 CHAPTER 2: SOCIOECONOMIC OVERVIEW OF TEXAS Texas is the second most populous state in the nation with more than 27 million residents, and the second largest state by total area. As such, the state s economy is among the most diverse and robust in the United States. Like much of the United States, the economy of Texas was negatively impacted by the recession of 2008 and However, several indicators reveal that Texas recovered more rapidly than much of the nation. Today, economic indicators show Texas is again at the nation s forefront regarding employment and industry diversification. The demand for aviation services typically correlates with the economy and its growth. As population and employment grow, so too does demand for airline travel, air cargo shipments, recreational flying, and other aviation-related activities. The following sections provide a brief overview of key population and economic trends in Texas that positively impact aviation demand. POPULATION TRENDS Texas population is spread throughout multiple nodes in its 254 counties, with some counties having fewer than 1,000 total residents and other, largely urban counties having several million residents. The state s most populous county is Harris County, home to Houston. With a population of over 4.5 million residents, Harris County is also the third most populous county in the United States. The next most populous counties in Texas are Dallas County (2.5 million residents), Tarrant County (1.9 million), Bexar County (1.8 million), and Travis County (1.1 million). From 2005 to 2015, the total population of Texas grew from 22.6 million to million, an average annual increase of 1.9 percent, based on Woods & Poole Economics data. This growth rate is significantly higher than the 0.8 percent experienced nationwide over the same period. However, as shown on Figure 2-1, Texas did not experience this growth uniformly. As the state s most populous counties, it should be no surprise that Harris, Tarrant, Bexar, Dallas, and Travis counties experienced the most growth by total population increase. However, other very populous counties experienced higher growth rates over this period. Hays, Fort Bend, Williamson, and Rockwall Counties all experienced annual growth rates of over 4 percent from 2005 to In general, counties that lost population over this period were among the state s least populous counties, showing that Texas is predominantly experiencing population growth in its urban areas. Of the state s 245 counties, 74 experienced a decrease in population from 2005 to Figure 2-2 displays forecasted population growth rates from 2015 to The state s largest counties are typically expected to continue growth, with Harris County again showing the largest total increase in forecasted population. However, other counties are forecasted to experience higher growth rates. Notably, several counties on the outskirts of the Dallas-Ft. Worth metroplex anticipate population growth rates of more than 2 percent annually. One of these counties, Collin County, is expected to experience growth of 3 percent annually. Williamson County, part of the Austin metropolitan region, is also expected to experience population growth of approximately 3 percent annually from 2015 to Fewer counties are forecasted to lose population over the forecast period than they did from 2005 to 2015, with only 45 counties forecasted to experience a decrease in population from 2015 to

20 SOCIOECONOMIC OVERVIEW OF TEXAS Figure 2-1 Historic Population Growth by Texas County, Source: CDM Smith, Woods and Poole Economics. 2-2

21 SOCIOECONOMIC OVERVIEW OF TEXAS Figure 2-2 Forecasted Population Growth by Texas County, Source: CDM Smith, Woods and Poole Economics. 2-3
22 Gross State Product of Texas Gross Domestic Product of USA SOCIOECONOMIC OVERVIEW OF TEXAS Gross State Product In terms of gross state product (GSP), Texas has the second largest statewide economy in the United States, trailing only California. In 2017, the Texas GSP made up 8.8 percent of the national gross domestic product (GDP). As shown in Figure 2-3, the Texas economy recovered from the 2009 recession more rapidly than the overall US economy, but then tapered off in 2015 and 2016 due to a weakening oil and gas industry, before resuming its strong growth in From 2007 to 2017, the Texas GSP has grown from $1.179 trillion to $1.696 trillion, a total increase of 44 percent and average annual increase of 3.7 percent. This rate of increase is third to only North Dakota (7.0 percent annually) and Nebraska (4.0 percent annually). However, the GSPs of these states rank 37 th (Nebraska) and 47 th (North Dakota) out of 51 qualifying areas (including the District of Columbia). The rapidity of the Texas economy s growth, combined with its place within the national economy, further emphasize the significance of the state as an economic generator. Figure 2-3 Gross State Product of Texas and Gross Domestic Product of USA (Billions of U.S. Dollars) $2,200 $2,000 $19,263 $22,000 $20,000 $1,800 $1,600 $1,400 $14,391 $1,696 $18,000 $16,000 $14,000 $1,200 $1,000 $1,179 $12,000 $10,000 $800 $8,000 $600 $6,000 $400 $4,000 $200 $2,000 $ $0 Texas GSP USA GDP Source: U.S. Bureau of Economic Analysis. The Texas GSP only experienced a significant decrease from 2008 to 2009, when the state s GSP lost a total of 6.2 percent in a single year during the recession. While this is a higher loss by percentage of total than the 2.1 percent lost in total U.S. gross domestic product (GDP), Texas recovered much faster. From 2009 to 2016, the Texas GSP experienced a 39 percent total increase, while the national GDP experienced a total increase of only 29 percent. EMPLOYMENT TRENDS As of August 2017, over 12.8 million people were employed within Texas, an increase of 1.8 million jobs from the 10.9 million in 2007 (Figure 2-4). This represents an average annual increase of 1.6 percent. The only year during which Texas lost jobs over this period was from 2008 to 2009 during the national recession when the state experienced a 0.4 percent loss in total statewide jobs. However, during this same time the nation experienced a nearly 5 percent loss in total jobs. 2-4
23 SOCIOECONOMIC OVERVIEW OF TEXAS Figure 2-4 Historic Texas Jobs, ,000,000 12,000,000 12,816,361 10,000,000 10,926,733 8,000,000 6,000,000 4,000,000 2,000, Source: U.S. Bureau of Labor Statistics. Texas has traditionally fared better than has the country as a whole with regard to unemployment (Figure 2-5). In 2007, the state s unemployment rate was 4. 3 percent, lower than the national rate of 4.6 percent. During the recession, when the national unemployment rate ballooned to 9.6 percent in 2009, the Texas rate grew to 8.4 percent. In 2017, the national and Texas unemployment rates have long recovered to be lower than they were even before the recession, with Texas unemployment rate sitting at 4.2 percent and the national rate slightly higher at 4.4 percent. 12.0% Figure 2-5 Historic Texas and National Unemployment Rates, % 8.0% 9.6% 8.4% 6.0% 4.0% 2.0% 4.6% 4.3% 4.4% 4.2% 0.0% Texas Unemployment Rate US Unemployment Rate Source: U.S. Bureau of Labor Statistics. 2-5
24 SOCIOECONOMIC OVERVIEW OF TEXAS Industry Split Figure 2-6 summarizes the industry split of the Texas economy based on the number of jobs in each industry as of August With over 2.4 million persons employed in the trade, transportation, and utilities group, this accounts for 19 percent of all Texas jobs and is the largest sector of the Texas economy by employment. Government agencies employ 15 percent of the jobs in Texas, followed by professional and businesses services and education and health services with 13 percent of the total each. The leisure and hospitality group follows with 10 percent of the total Texas employment. Figure 2-6 Industry Split of Texas Economy, 2017 Farming/Agriculture 4% Mining and Logging 2% Construction 6% Other Services 3% Leisure & Hospitality 10% Government 15% Trade, Transportation, and Utilities 19% Manufacturing 7% Information 2% Education & Health Services 13% Professional & Business Services 13% Financial Activities 6% Source: U.S. Bureau of Labor Statistics. SUMMARY This chapter summarized socioeconomic conditions in Texas. With over 27 million residents in 2015, Texas is the second most populous state in the nation, trailing only California. The most populous counties in Texas are Harris County (4.5 million residents; home to Houston) and Dallas County (2.5 million residents). Texas is experiencing rapid population growth at the rate of 1.9 percent annually from 2005 to 2015, much higher than the national rate of 0.8 percent annually. Texas has one of the largest economies of any state in the nation. The 2015 GSP of $1.617 trillion, second only to California s GSP, was up from $1.088 trillion in 2005, an average annual increase of 4 percent. in the state has grown steadily in recent years, increasing from 10.9 million employed persons in 2007 to 12.8 million in 2017, an average annual increase of 1.6 percent. At the peak of the recession in 2009, the national unemployment rate was 9.6 percent, while the rate in Texas was only 8.4 percent. By 2017, Texas unemployment rate had fallen to 4.2 percent, lower than the national rate of 4.4 percent. The largest industry sectors in Texas are trade, transportation, and utilities (19 percent of the state s total jobs), government (15 percent), professional and business services (13 percent, and education and health services (13 percent). 2-6

25 CHAPTER 3: THE ECONOMIC MODELING PROCESS This chapter describes the overall methodology employed to estimate the economic impacts stemming from Texas s 289 system airports. Beginning with a definition of economic terms, the remainder of the chapter describes the economic model used, provides details on the data gathering process and discusses the subsequent data analysis. STUDY APPROACH All economic impacts from the 289 airports considered in this analysis were either estimated using data gathered from the system airports or calculated using an input-output model. This input-output model, described in more detail below, provides three measures of economic impact, broken down into several categories of economic impact, and expressed as three related types of economic impact. Measures of Economic Impact This economic impact study expresses the results using three measures employment, payroll, and output. is based on the total of full-time jobs plus part-time jobs. In this analysis, two part-time positions are the equivalent of a single full-time position. represents the costs associated with the annual salary, wages, and benefits earned by all employees, or business owners. is the quantity of goods and services generated annually by an airport, and its associated activities and businesses, expressed in dollars. is estimated using an organization s annual sales, or its annual operating costs, which assumes that its output is approximately equivalent to what it expends. It is important to note that payroll and output cannot be combined because elements of economic benefit related to payroll are also contained, to some extent, in the output estimate. Each of the three impact measures (employment, payroll, and output) stand alone as part of the quantification of an airport s total economic impact. Categories of Economic Impact The three measures described above are used to evaluate a number of categories of economic impact. These categories are based on the source of economic activity and require various forms of inputs that are described below in detail. On-Airport Activity This category includes airport tenants that are businesses with employees, such as airlines, fixed base operators (FBO), flight schools, charter outfits, flight departments, concessionaires, and airport restaurants. Also included are governmental agencies, such as public airport sponsors, air traffic control organizations, other Federal Aviation Administration (FAA) units, as well as other state and federal agencies that serve or use aviation. for on-airport activities is typically assumed to be the sum of annual gross sales. While this assumption works well for Refueling a general aviation aircraft 3-1


26 THE ECONOMIC MODELING PROCESS profit-oriented tenants, it must be modified for organizations that do not generate sales, such as government tenants or corporate flight departments. In order to estimate the impact of these important tenant-related activities, output is assumed to be the sum of all annual operating expenditures. While airlines do generate sales, ticket revenue is usually transferred outside the area being modeled. This makes it difficult to assign that revenue to specific airports, so airlines are treated in a manner similar to organizations that do not generate sales. Capital Improvement Impacts Each year, airports undertake capital improvement projects (CIP), such as runway rehabilitation or terminal improvements. In addition, businesses and other agencies undertake capital improvements. These projects employ people in jobs such as construction, architecture, engineering, and consulting. related to CIP is equal to the expenditures on those projects. Ratios of employment to capital expense, and per capita income were used to estimate the number of jobs and associated payroll tied to these capital expenditures. Commercial Service Visitors This group includes estimated non-local passengers (visitors) arriving via commercial airlines. The annual spending by these visitors, which supports the employment of local workers predominately in the hospitality industry, is treated as output. Average visitor spending was estimated from an analysis of available Texas data and existing information from other studies. Jobs associated with this visitor spending were estimated using ratios from the input-output model. was estimated using average wage information from the Bureau of Labor Statistics. General Aviation Visitors Impacts from general aviation visitors are produced by non-local passengers arriving via private or business aircraft. Similar to commercial service visitors, the annual spending of this category promotes the local economy, particularly the hospitality industry, and is treated as output. General aviation visitors were estimated using survey data from across Texas airports and various in-house databases to convert FAA general aviation operations data into visitor numbers. Survey and in-house data were also used to estimate average spending per visitor. Jobs associated with this visitor spending were estimated using ratios from the input-output model. was estimated using average wage information from the Bureau of Labor Statistics. Jet taxiing at Addison Airport Types of Economic Impact Data gathered from the categories described above were used as inputs for a linear input-output economic impact model. That model estimates three types of economic impact associated with Texas airports using each of the three economic impact measures described previously. Direct Impacts Direct impacts account for the initial point where the money from aviationrelated activity first starts circulating in the economy. This includes impacts that result from onairport activity and visitor spending. On-airport activity includes the benefits associated with businesses and government organizations located at the airport, which are directly related to the provision of aviation services. On-airport impacts include the employment, payroll, and spending 3-2 Construction of a new hangar

27 THE ECONOMIC MODELING PROCESS of businesses such as FBOs, flight schools, aircraft repair facilities, and airport management and operations staff. Capital expenditures of these businesses and government organizations are also part of the direct impacts. Visitors contribute to direct impacts through their off-airport spending (any on-airport spending by visitors is included in the on-airport impacts), such as might take place at restaurants or hotels. Direct impacts serve as the inputs for the economic model. Multiplier Impacts Multiplier impacts result from the re-circulation and re-spending of direct impacts within the economy. This re-spending of money can occur multiple times and takes two forms indirect and induced. Indirect impacts occur when businesses spend their revenue on business expenses, whereas induced impacts occur when employees spend their earnings on goods and services. For example, as airport employees spend their salary for housing, food, and services, those expenditures circulate through the economy resulting in increased spending, payroll, and employment throughout Texas. As this money is spent over and over again, some of it leaks beyond the boundaries of Texas, and thus no longer benefits the state s citizens. The economic model uses parameters specific to Texas to estimate the leakage effect associated with these multiplier impacts, thereby tabulating only those impacts that benefit the people and businesses of Texas. Multiplier impacts are the output of the economic model. Impacts impacts are the sum of all direct and multiplier economic impacts attributable to an airport or the system of airports. Figure 3-1 shows how the categories of impacts flow through the types of impacts. It can be seen that the direct on-airport impacts are generally measured in terms such as the number of jobs that can be seen on the airport, while the direct visitor impacts are measured in jobs that are found off the airport. Furthermore, all of the direct impacts help drive the multiplier impacts and contribute to the total impacts. Figure 3-1: Illustration of Economic Impacts Direct impacts are measured through surveys of businesses, government units, and visitors. Because multiplier impacts are not as easy to measure as direct impacts, they are estimated instead. It is 3-3
28 THE ECONOMIC MODELING PROCESS important to employ a reliable method of estimating multiplier impacts and one leading method used to estimate multiplier impacts is the input-output model. The Impact Analysis for Planning (IMPLAN) input-output model was used to quantify multiplier impacts in this study. IMPLAN is a linear model that estimates purchases and sales between hundreds of sectors of the economy. The U.S. Forest Service, in cooperation with several other government agencies, initially developed the IMPLAN system to generate regional non-survey input-output models for regions as small as a single county. This modeling process is considered one of the leading methods currently available for estimating the total economic impact of an industry and has been used to estimate economic impacts for individual airports and systems of airports throughout the country. The IMPLAN model contains a large economic database used to generate input-output tables. It includes data from sources such as Dun and Bradstreet, the U.S. Department of Commerce, and the U.S. Census Bureau. IMPLAN multipliers and data tables specific to Texas industrial sectors were obtained and used in this analysis. Proper use of this model involves inputting the best economic data available for the industry analyzed. Therefore, the information gathered during the early part of the study is critical. DATA COLLECTION METHODS Data collection for this study was a major undertaking and a critical component to making this a successful study. Each category of economic impact needed significant data inputs from various sources. The method used depended upon the category for which the data was gathered. On-Airport Activity A variety of economic data was needed from airport management and each business tenant operating on the airport. This information was obtained through a two-step process. The first step involved surveying the airport sponsor or manager to obtain basic data relating to the operation and management of the airport. This involved a survey that asked the airport to provide: Number of full-time and part-time employees working for the airport sponsor Estimated total operating expenses in 2017 Estimated total annual wages and benefits paid to airport employees in 2017 Estimated total capital improvement expenditures for each year, 2015 through 2017 In addition, the airport sponsor was asked to provide a list of all business tenants located on the airport and an estimate of the number of employees working at each business. The second step involved contacting each business tenant and requesting that they complete a survey. Contact was attempted either through face-to-face communication for those airports visited by the study team, or by an ed survey. The survey asked for: Type of aviation activity or business conducted by the tenant Number of full-time and part-time employees working for the tenant Estimated total operating expenses in 2017 Estimated total annual wages and benefits paid to employees of the tenant in 2017 Estimated total capital improvement expenditures for each year, 2015 through 2017 Estimated total gross sales (where applicable) by the tenant on the airport in

29 THE ECONOMIC MODELING PROCESS A key component of this surveying effort was determining the type of aviation activity each tenant undertook. This served a two-fold purpose. The first was to screen out tenants that were not aviation related and should not be included in the impact totals of the airport. For example, the impacts of an insurance business located on an airport would not be included since an insurance business does not need an airport to operate. If it were determined that the insurance business operated an aircraft that required a pilot or dispatcher at the airport, then it would be treated as an aviation-related business and the impacts of its flight operations included. The second was to classify the tenant for purposes of evaluating the reasonableness of their data. By comparing per capita payroll and output to other similar businesses, any outliers could be identified and investigated for soundness. Some companies engaged in more than one line of business, so a determination of their primary focus was made and each tenant assigned to one of the following categories: Aerial applicators Air ambulance operators Air cargo Aircraft maintenance for piston powered aircraft Aircraft maintenance for turbine powered aircraft Airlines passenger only Airport management commercial service airports Airport management general aviation airports (with four or more full-time employees) Airport management general aviation airports (with less than four full-time employees) Airport management unattended general aviation airports Air traffic control contract Air traffic control FAA Charter Concessions commercial service airports Concessions general aviation airports Corporate flight departments FBOs with six or more full-time employees FBOs with less than six full-time employees Federal government, not including air traffic control or TSA Flight instruction Ground transportation Hangar rental and development Large Commercial Service Airports Because of their large size, the previously described methodologies for estimating direct on-airport and capital improvement impacts were not used at the seven largest commercial service airports, namely: Austin-Bergstrom International (AUS) Dallas Love Field (DAL) Dallas/Fort Worth International (DFW) El Paso International (ELP) George Bush Intercontinental/Houston (IAH) William P Hobby (HOU) San Antonio International (SAT) Instead, alternative methods were used to estimate the direct impacts at these airports, including the use of the most recent economic impact studies at DFW, IAH, HOU, and SAT. For capital improvement expenditures, data was obtained from FAA Form 127 reports. Onairport impacts were estimated using various in-house information sets. Dallas-Fort Worth International Airport Additionally, the impacts for the Texarkana Regional Airport were taken from a 2017 draft of the Economic Impact of Arkansas Airports report and adjusted for inflation. 3-5

30 THE ECONOMIC MODELING PROCESS Military Nonprofit Parking Rental car State and local government TSA For airport tenants who did not supply complete information on payroll, expenses, output, and CIP, estimates were developed using ratios of payroll, expenses, output, and CIP per employee. These ratios were developed from survey data obtained from similar tenant and business categories who did respond to the survey. For those categories of tenants that did not have sufficient Texas data to provide reliable averages, additional data was used from economic studies conducted by CDM Smith around the country, which is a standard practice for economic impact studies such as this. This blend of survey data and estimated economic impact data were used to determine the direct onairport impacts and served as inputs for the IMPLAN model. Capital Improvement Impacts As previously explained, capital projects, both by airports and the businesses and organizations operating on the airport, employ people in jobs such as construction, architecture, engineering, and consulting. For this analysis, information was gathered on capital expenditures from airports and their tenants as described above and combined with IMPLAN data to estimate direct construction impacts. This survey data was checked against FAA Airport Improvement Program grant data, and data provided by TxDOT Aviation to ensure that all impacts were captured. The following steps were used to estimate direct construction impacts: The CIP data provided by airports, businesses, and government organizations for the period 2015 to 2017 was averaged to avoid showing peaks or troughs in capital project activity. This average CIP expenditure was used as the CIP direct output for the airport. Direct employment related to this construction impact was determined through the use of the IMPLAN model. Based on Texas specific data, the IMPLAN model indicates that every $1 million CIP-related expenditure supports approximately 5.7 jobs in Texas. Data from the U.S. Bureau of Labor Statistics was used to calculate the average annual pay and benefits for these jobs at approximately $36,000. The estimated direct jobs, payroll, and CIP expenditures (output) provided inputs for the IMPLAN model. Commercial Service Visitors The Texas airport system features 25 airports with scheduled airline service. These airports enplaned 80 million passengers in A significant portion of these passengers were visitors who Gates at Rick Husband Amarillo International Airport 3-6

31 THE ECONOMIC MODELING PROCESS spent money in the region during their trip, predominately on hospitality services, such as hotels and restaurants. Taking into account multiplier impacts, numerous other industries benefit from the effects of visitor spending as well. With such a large number of commercial service airports spread out over a wide geographic area, a method was needed that could be applied to each airport to estimate their commercial service visitor expenditures. Based on data from other economic impact studies of commercial service airports, the study team found a 95 percent correlation between the concession fees paid to airports by rental car companies and the total expenditures from visitors during their trip. Using rental car revenues as reported by airports to the FAA on FAA Form , Operating and Financial Summary, and the relationship with visitor spending, the study team estimated direct visitor expenditures for each commercial service airport. Using FAA ticketing data, along with origin and destination data, the study team determined the number of visitors to each commercial service airport. With this information, an average expenditure per visitor per trip was calculated from the estimated visitor expenditures derived previously, and evaluated for reasonableness. The average visitor expenditure ranged from approximately $350 per trip to $2,200 per trip. Two airports San Angelo Regional and Wichita Falls Municipal did not file FAA Form reports, so no rental car concession fee data was available. For these two airports, visitor spending was estimated using an average expenditure per trip of $850, based on the overall average spending per visitor from the other Texas airports. General Aviation Visitors It is estimated that more than one million visitors in Texas make use of general aviation aircraft to conduct business and to enjoy the leisure opportunities available throughout the Lone Star State. There are numerous examples of airports that facilitate business operations. In the Dallas-Fort Worth region, airports such as McKinney National and Addison offer services tailored to TEXAS AIRPORTS ARE VERY SIGNIFICANT TO OUR COMPANY! SIXTY PERCENT OF OUR FLYING FROM MISSISSIPPI IS TO TEXAS. - Visitors to Sugar Land Regional from Hattiesburg, MS corporate flights. Around the Houston area, airports like Sugar Land Regional and Conroe-North Houston Regional support business flight operations and accommodate their passengers. Airports like these are found throughout Texas, not just in major metropolitan areas. Airports such as Draughon-Miller Central Texas Regional, Pecos Municipal, and Albany Municipal host business aircraft on a daily basis, providing company owners, managers, and key staff with access to parts of Texas that are not otherwise easily reached. General aviation airports also serve as gateways to local attractions for tourists. For example, Alpine- Casparis Municipal serves many visitors annually that come through the airport on their way to Big Bend National Park. Gillespie County typically sees a peak in activity from Thursday through Sunday, as local attractions such as the National Museum of the Pacific War, and visits to weekend homes draw people to the area. General aviation airports are also important in allowing hunters, fishermen, and other outdoor enthusiasts to access the many natural recreation activities available in Texas. 3-7
32 THE ECONOMIC MODELING PROCESS The direct economic activity produced by general aviation visitors in Texas was determined through a combination of survey data and economic model outputs. Surveys were used to gather expenditure data from visiting pilots and passengers and distributed through the help of FBO managers at many of the state s airports. The survey requested the following information: The airport where the survey was received Where the aircraft is based (verifying the respondent was not based at the airport surveyed) The number of travelers in the aircraft The general type of aircraft The purpose of the trip The length of stay in the airport area The estimated expenditures during the trip The number of people responsible for the expenditures Additional comments regarding the value of the Texas aviation system to pilots, passengers, and their businesses The study team used this survey data, along with survey data from numerous other statewide airport economic impact studies, to derive an estimate of direct general aviation visitor expenditures. The Texas data was analyzed for patterns in visitor spending based upon the number of itinerant operations at each Texas airport. Based on this analysis, Texas airports were classified into one of four tiers, with commercial service airports broken out into a fifth tier. The four general aviation tiers consisted of those airports with less than 500 itinerant operations, those with 500 to less than 5,000 itinerant operations, those with 5,000 to less than 10,000 itinerant operations, and those with 10,000 or more itinerant operations. For each tier, the study team estimated the average number of travelers per arriving visiting aircraft, and the average spending of each of those visitors, if the data was available for that group of airports. Texas airports with fewer than 5,000 itinerant operations did not submit a sufficient number of surveys with which to derive statistically significant averages. Therefore, data from numerous other statewide airport economic impact studies was used to derive the estimates for airports with fewer than 5,000 itinerant operations. The values used for each tier were: 0 to 499 itinerant operations: 2.8 visitors per arrival; $10 per visitor 500 to 4,999 itinerant operations: 2.8 visitors per arrival; $130 per visitor 5,000 to 9,999 itinerant operations: 2.1 visitors per arrival; $150 per visitor 10,000 or more itinerant operations: 2.7 visitors per arrival; $190 per visitor Commercial service airports: 3.7 visitors per arrival; $290 per visitor To estimate general aviation visitor expenditures (the direct output impact) the calculation started with each airport s itinerant general aviation operations. These are general aviation aircraft arrivals and departures that arrive from outside, or depart, the local airport area. Not all itinerant arrivals, as defined by the FAA, carry visitors. A majority of the itinerant arrivals are local aircraft returning from outside the immediate airspace, transient fuel stops, or other activities that are not consistent with the definition of a visitor. Most statewide studies use an accepted industry standard of 33 percent to estimate true transient arrivals. This study continues that best practice by also estimating that AIRPORTS NOT ONLY SAVE TIME, ALLOWING FOR MORE BUSINESS AND VISITATION TIME THEN TRAVELING BY CAR, BUT ALSO ALLOWS FOR A LESS EXHAUSTED FAMILY. - Tourists visiting San Angelo Regional from Ruidoso, NM

33 THE ECONOMIC MODELING PROCESS percent of itinerant operations carry visitors. Table A-1 in the appendix shows estimates of general aviation visitors for each system airport. The following example using Granbury Regional Airport demonstrates the calculations used to estimate general aviation visitor impacts. Plane taxiing at Granbury Regional Airport Granbury Regional Airport was estimated to have 8,900 itinerant operations in 2017, or 4,450 itinerant arrivals, since every arrival is assumed to have a corresponding departure. Of those, 33 percent were assumed to be visiting aircraft. 4,450 itinerant arrivals x 33 percent = 1,469 visiting aircraft Granbury Regional s tier of airports average 2.1 visitors per visiting aircraft and each of those visitors spent, on average, $150 on goods and services away from the airport during their stay. Any on-airport expenditures are taken into account in the on-airport impacts and are not included in the general aviation visitor impacts. Using this data, an estimated 3,085 visitors passed through Granbury Regional in 2017, and spent approximately $463,000 during their stay. 1,469 visiting aircraft x 2.1 visitors per aircraft = 3,085 visitors 3,085 visitors x $150 per visitor per trip = $463,000 This spending supported jobs and businesses in the region around Granbury Regional, predominately in the service and retail industries. The IMPLAN model estimates that every $1 million spent by general aviation visitors supports approximately 17.2 jobs. For the area around Granbury Regional, this means approximately eight employees are supported by visitor spending attributed to the airport. $463,000 x 17.2 jobs $1,000,000 per job = 8.0 jobs Using information from the U.S. Bureau of Labor Statistics, it was estimated that these types of jobs earned an average annual payroll and benefits of $24,050, which generated a total of approximately $192,000 in jobs x $24,050 = $192,000 annual payroll WITHOUT FINE FBOS IN TEXAS, I WOULDN T HAVE ANY WORK AND WOULD BE OUT OF A JOB. - Flight instructor visiting Texas Gulf Coast Regional These direct impacts from general aviation visitor spending were used as inputs for the IMPLAN input-output model. 3-9
34 THE ECONOMIC MODELING PROCESS Multiplier Impacts The initial direct economic impacts from financial transactions are not the only effects that take place within an economy. As explained earlier, initial transactions result in a cascade of follow-on impacts. For example, some of the money a flight school takes in for giving flight lessons (its direct output) goes to the local bank to pay off part of the loan on the flight school s training aircraft, which creates economic output for the bank. The bank then uses some of its revenues to pay for local contracted security services, adding to the output. Eventually, these transactions result in the money leaking beyond the defined boundaries of the study in this case, Texas. The number of times that a dollar of output, or a dollar of pay, or a job recirculates through the economy before it leaks, is a multiple of the initial input from the airport; hence it is referred to as a multiplier impact. Figure 3-1 shows the complex interactions typically occurring in an economy that the IMPLAN model takes into account. Multiplier impacts are estimated by entering the direct impacts into the IMPLAN input-output model and accounting for the different interactions that various categories of impact have within the area of study. The model determines how many times an impact is multiplied within the boundaries of the study. It should be noted that multipliers can vary somewhat from year to year as industries change suppliers and shipping processes, costs for raw materials and transportation fluctuate, and as new technologies and regulations impact industries. The multipliers used in this analysis were developed specifically to measure the economic impacts that occur within different sectors of the Texas economy. Table 3-1 summarizes the multipliers used for modeling the multiplier impacts of on-airport activities, capital improvement, and visitor spending. Note that on-airport activities were classified into one of three areas aviation, concession, or government based upon the nature of their operation. This was done to more accurately assess the degree to which each organization recirculated its economic influence within the state. Economy Sector Table 3-1 Texas IMPLAN Multipliers by Economy Sector Multiplier Multiplier Multiplier On-Airport: Aviation On-Airport: Concessions On-Airport: Government Capital Improvement Commercial Service Visitor Expenditures General Aviation Visitor Expenditures Sources: CDM Smith and IMPLAN multipliers 1 Aviation multipliers are the weighted average of the Air Transportation, Aircraft Manufacturing, Aircraft Engine and Engine Parts Manufacturing, and Other Aircraft Parts and Auxiliary Equipment Manufacturing multipliers. 2 Concessions multipliers are the weighted average of the Hotels and Motels, Full-Service Restaurants, Retail Miscellaneous Store Retailers, and Business Support Services multipliers. 3 Government multipliers are the weighted average of the Other Federal Government Enterprises, and Other State Government Enterprises multipliers. 4 Construction multipliers are the weighted average of the Construction of Other New Nonresidential Structures, Asphalt Paving Mixture and Block Manufacturing, Cement Manufacturing, Ready-Mix Concrete Manufacturing, Maintenance and Repair of Nonresidential Structures, and Architectural, Engineering, and Related Services multipliers. 5 Visitor expenditures multipliers are the weighted average of the Hotels and Motels, Full-Service Restaurants, Retail Miscellaneous Store Retailers, and Automotive Equipment Rental and Leasing multipliers. Weightings were different for commercial airline service and general aviation visitor multipliers to reflect the difference in their spending habits. 3-10


35 THE ECONOMIC MODELING PROCESS Aviation multipliers were used for aerial applicators, air ambulance services, airlines (passenger and cargo), aircraft maintenance, charter operators, contract air traffic control towers, FBOs, flight departments, flight schools, and hangar development. Retail, food and beverage, car rental, ground transportation, and parking tenants had a set of concession multipliers applied to estimate multiplier impacts. Government-related entities, including military units, received their own set of multipliers. Impacts stemming from construction projects were broken out from each tenant and a unique set of multipliers applied to these impacts. Different multipliers were used for each of these categories because each of these categories interacts with the Texas economy in different ways. The multipliers presented in Table 3-1 were used to estimate multiplier impacts in this analysis. For example, $100 in direct revenues (output) in the aviation sector supports a total output of $177 ($100 times the Aviation output multiplier of 1.77). That total output breaks down into $100 of direct output and $77 of multiplier impact. Impacts impacts consist of the sum of the direct and multiplier impacts. When referring to each Texas airport s (or the airport system s) economic impacts, this generally means the total employment, total payroll, and total output of the airport (or the airport system). Air traffic control tower at Addison Airport 3-11
36 CHAPTER 4: ECONOMIC IMPACTS OF TEXAS AIRPORTS STATEWIDE ECONOMIC IMPACT OF AIRPORTS Airports serve as an economic driver in Texas diverse economy. Texas s airports function as gateways for residents and visitors through commercial service and general aviation flights, as well as hubs for on- and off-airport commerce. The economic impact these airports generate translates into jobs, payroll and economic output that can be directly and indirectly attributed to the aviation industry. Airports in Texas accommodate over 80 million enplanements, resulting in approximately 17.3 million visitors to the state. While hub airports in Texas, such as Dallas/Fort Worth International Airport and Houston Intercontinental Airport, account for most of Texas s visitors traveling by air, there are still significant numbers arriving via private and business aircraft at general aviation airports. It is estimated that 1.5 million visitors arrived via general aviation aircraft at all Texas airports in These visitors impact more than just the aviation industry - they create jobs and add payroll through their expenditures throughout the state. The transportation network created by airports in Texas supports a significant number of jobs in well-paying industries. One telling example is that with 52,014 certificated pilots in the state, nearly 50 percent have a pilot certificate that allows them to fly for compensation or hire in fields such as corporate flight, aerial application, charter, and commercial airlines. Many notable aviation-related businesses call Texas airports home, generating economic impact in their communities and throughout the state. Mooney International in Kerrville and Air Tractor in Olney are aircraft manufacturers that are headquartered at Texas airports and operate full assembly plants. Companies focused on military and aerospace research also have large presences throughout the state, with major contributor L3 Communications operating out of Majors Airport in Greenville, the Texas State Technical College Airport in Waco, and other airports. A significant number of Fortune 500 corporations have headquarters and offices located in Texas, such as AT&T, Toyota, and Texas Instruments, that in turn operate corporate flight departments. The growth of metropolitan areas throughout the state has directly impacted the demand for commercial and general aviation facilities. Prominent businesses maintain a presence at airports such as Arlington Municipal Airport and Fort Worth Alliance Airport in the Dallas/Fort Worth metroplex, where respectively, Bell Helicopter operates a Flight Training Center and FedEx transports air cargo. At Abilene Regional Airport, Eagle Aviation Services operates a maintenance facility for Envoy Air aircraft that fly under the American Eagle brand. An assortment of flight instruction businesses also call Texas general aviation airports home. These include ATP Flight at Georgetown Municipal Airport and Anson Aviation at Sugar Land Regional Airport. Besides the aviation-related businesses found at system airports, there are a significant number of major aerospace and technology companies operating in Texas. The aerospace industry in Texas employs more than 135,000 workers at 1,300 companies, according to the 2017 Texas Aerospace, Aviation and Defense report. While the economic impact of these off-airport companies is not part of this analysis, it is worth noting that corporations such as Boeing, Airbus, Bell Helicopter, Gulfstream, Lockheed Martin, Honeywell, and Textron, employ thousands and contribute billions of dollars to the state s economy. In fact, 17 of the world s largest aerospace manufacturers operate major facilities in Texas. These firms are a significant component of the Texas aerospace industry and contribute greatly to the overall economy of Texas, the U.S., and the world. 4-1

37 ECONOMIC IMPACTS OF TEXAS AIRPORTS This chapter identifies the economic impacts associated with employment, annual payroll, and total economic output that stems from each of the study airports. The combined impact of all 289 system airports is also presented. Detailed tables showing the impacts of each individual airport can be found in Appendix A. EMPLOYMENT IMPACTS Airports are a significant source of employment across the entire state of Texas. impacts are calculated for on-airport activity, capital improvement projects, and visitors arriving via commercial service and general aviation flights. On-airport activity includes private businesses, government agencies, and on-airport military units. Additionally, spending for capital improvement projects (CIP) is converted to an employment equivalent. On-Airport Table 4-1 identifies the total number of jobs supported by the day-to-day activities of on-airport, aviation-related tenants and businesses at the 289 Texas system airports. These jobs include aircraft maintenance, flight instruction, pilot services, and fuel sales, to name just a few. Table 4-1 On-Airport Multiplier On-Airport On- Airport Direct On-Airport Airports Commercial Service Airports 112, , ,066 General Aviation Airports 17,146 22,521 39,667 On-Airport 129, , ,733 Source: CDM Smith and IMPLAN In total, there are 129,637 direct jobs supported by the on-airport activities of Texas' airports, with 112,491 attributed to commercial service airports and 17,146 stemming from general aviation airports. Hubs and operating bases such as American Airlines at Dallas/Fort Worth International, United Airlines at Houston Intercontinental, and Southwest Airlines at Dallas Love Field and Houston Hobby Airport are behind strong employment numbers at commercial service airports in Texas. It is important to note that this employment estimate does not include jobs associated with non-aviation businesses which, for various reasons, are Maintenance hangar at Mid-Way Regional Airport 4-2
38 ECONOMIC IMPACTS OF TEXAS AIRPORTS located on an airport. In instances where airports include nearby industrial and business parks, the tenants may technically be on airport property but are not involved with-aviation. related to non-aviation businesses is not included in the employment estimate shown in Table 4-1. Jobs created by multiplier impacts are a result of tenant and business activity at Texas airports. The magnitude of on-airport tenant activity relates to the number of additional multiplier jobs created at each airport. Multiplier impacts from Texas airports add 134,096 positions to the economy. Combined, direct and multiplier employment from airport tenants lead to 263,733 additional jobs within the Texas economy. Onairport employment impacts for each airport are listed in Table A- 2 in the appendix. INVALUABLE BUSINESS TOOL. ALLOWS OUR COMPANY TO CONNECT WITH CUSTOMERS THAT WOULD OTHERWISE NOT BE POSSIBLE WERE IT NOT FOR AIRPORTS LIKE COULTER FIELD - Visitors to Coulter Field from Rusk County Airport Construction Capital projects at Texas airports generate jobs for architects, engineers, consultants, and construction workers. Table 4-2 identifies the number of employees in Texas whose jobs are supported by an average year of airport-related construction. Many airports throughout Texas receive Airport Improvement Program (AIP) grants provided by the Federal Aviation Administration (FAA), as well as funding from the Texas Department of Transportation (TxDOT), airport sponsors, and other public and private sources to complete capital improvements, ranging from new and extended runways to hangars and fuel farms. The investment in Texas s airports through these capital programs produces 9,638 direct jobs, as shown in Table 4-2. Texas general aviation airports constitute 20 percent of all direct-cip employment while commercial service airports make up 80 percent. When considering the multiplier effect, another 8,068 jobs are added resulting in a total of 17,706. Construction-related employment impacts for each airport are listed in Table A-3 in the appendix. Table 4-2 Construction Multiplier Direct CIP CIP CIP Airports Commercial Service Airports 7,660 6,412 14,072 General Aviation Airports 1,978 1,656 3,634 CIP 9,638 8,068 17,706 Source: CDM Smith and IMPLAN 4-3

39 ECONOMIC IMPACTS OF TEXAS AIRPORTS Commercial Service Visitor-Related Texas s commercial service airports accommodate millions of visitors to the state, where they spend money on lodging, restaurants, transportation, entertainment, and other activities. This visitor spending supports jobs in a multitude of employment sectors outside aviation. Table 4-3 identifies the number of employees in Texas whose jobs are supported by the spending of the nearly 17.3 million visitors arriving on airlines via Texas s 25 commercial service airports. Dallas/Fort Worth International accounts for nearly one third of all employment related to visitor spending stemming from commercial service airports. Austin-Bergstrom International Airport and San Antonio International Airport also make up a significant portion of visitor-related employment, constituting nearly a fifth of all jobs resulting from commercial visitor spending. On a different scale, the community in Tyler, Texas, recognizes the benefit of commercial service providing access to locals and visitors, and actively participates in surveys to help encourage additional commercial service to Tyler Pounds Regional Airport. Air carrier visitor-related employment impacts for each airport are listed in Table A-4 in the appendix. American Airlines is headquartered in Fort Worth and maintains a hub at Dallas/Fort Worth International Airport Southwest Airlines is headquartered in Dallas and maintains a large presence at Dallas Love Field and Houston Hobby Airport Table 4-3 Commercial Service Visitor-Related Multiplier Direct Commercial Commercial Service Visitor- Service Visitor- Related Related Commercial Service Visitor- Related Airports Commercial Service Visitor 345, , ,324 Source: CDM Smith and IMPLAN Texas commercial service airports supported 345,508 direct jobs related to visitor employment with an additional 143,816 attributed to multiplier impacts. When combined, commercial visitor-related employment totals 489,324. General Aviation Visitor-Related Visitors using general aviation travel also make purchases in the local economy, leading to jobs in different industries throughout Texas. Table 4-4 shows the number of jobs in Texas supported by spending from visitors using general aviation aircraft to travel to and within the state. Texas is home to 264 general aviation airports with additional general aviation activity taking place at each of the 25 commercial service airports. In total, nearly 1.5 million visitors travel to and around the state via general aviation aircraft. 4-4
40 ECONOMIC IMPACTS OF TEXAS AIRPORTS Table 4-4 General Aviation Visitor-Related Direct GA Visitor- Related Multiplier GA Visitor- Related GA Visitor- Related Airports Commercial Service Airports 2,334 1,070 3,404 General Aviation Airports 3,287 1,501 4,788 General Aviation Visitor 5,621 2,571 8,192 Source: CDM Smith and IMPLAN General aviation visitor expenditures occur off-airport property and directly support jobs at businesses operating in the cities and towns close to airports. Visitors to general aviation airports in Texas come for a variety of reasons, all of which in some way generate employment in varying industries and locations. Airports across Texas see frequent use by businesses in the energy industry. Aransas County Airport serves as a preparation location for workers stationed at oil rigs in the Gulf of Mexico while Odessa-Schlemeyer Field welcomes business-persons to oil-rich west Texas. In the Dallas/Fort Worth metro as well as near Houston, airports like Arlington Municipal, Grand Prairie Municipal, and Pearland Regional host visitors to AT&T Stadium and NRG Stadium which in past years have hosted Super Bowls and events that draw in visitors from around the country. Survey results indicated hunting as a popular attraction throughout the state that draws a large number of visitors arriving via general aviation aircraft, spending money in smaller, more rural communities. Overall, spending by general aviation visitors in Texas supported 5,621 direct jobs. As the money general aviation visitors spend at businesses continues to change hands in the local and state economy, a multiplier effect occurs creating additional jobs. In this case, multiplier impacts resulted in 2,571 additional jobs. When combined, direct and multiplier general aviation visitorrelated impacts result in 8,192 jobs supported by visitors using general aviation aircraft. General aviation visitor-related employment impacts for each airport are listed in Table A-5 in the appendix. Texas s diverse system of airports helps augment employment statewide through a variety of jobs, both on Texas airports, as well as in nearby cities and towns. Table 4-5 displays the total employment that is a result of all activity at airports in the Texas system. On-airport activities, CIP expenditures, and spending by visitors at the study airports results in 490,404 direct jobs with the multiplier effect adding 288,551 additional jobs. Combined, 778,955 jobs are supported in Texas by aviation-related operations, businesses, and visitors to the study airports. employment impacts for each airport are listed in Table A-6 in the appendix. Table 4-5 Airports Direct Multiplier Commercial Service Airports 467, , ,866 General Aviation Airports 22,411 25,678 48, , , ,955 Source: CDM Smith and IMPLAN 4-5
41 ECONOMIC IMPACTS OF TEXAS AIRPORTS PAYROLL IMPACTS The salaries, wages, and benefits paid to the employees described in the previous section enter the Texas economy and are analyzed as payroll impacts. Estimates of these payroll impacts associated with on-airport businesses and their activities, construction, commercial service and general aviation visitors are detailed below. On-Airport Table 4-6 shows the annual payroll impacts associated with on-airport activity at the study airports. Table 4-6 On-Airport Direct On- Multiplier On- Airport Airport On-Airport Airports Commercial Service Airports $7,339,811,000 $5,023,417,000 $12,363,228,000 General Aviation Airports $1,380,980,000 $932,794,000 $2,313,774,000 On-Airport $8,720,791,000 $5,956,211,000 $14,677,002,000 Source: CDM Smith and IMPLAN Texas airports contributed $8.7 billion in direct on-airport payroll impacts. Commercial service airports make up more than 80 percent of payroll in the group of study airports. Dallas/Fort Worth International and Houston Intercontinental are the major contributors to the system, with each airport contributing over $2.5 billion in payroll to the economy. General aviation airports in Texas combine to contribute just under $1.4 billion in direct annual payroll impacts, distributed across a wide range of airports differing in size and function. Air Tractor at Olney Municipal Airport serves as an example of an airport tenant that generates nearly all of an airport s direct payroll while other airports may rely on a diverse tenant base working in aircraft maintenance, medical evacuation, flight training, or other areas. As payroll is spent in industries Air Tractor at Olney Municipal Airport outside aviation but within the Texas economy, multiplier impacts are created. These multiplier impacts are estimated through the IMPLAN model. The multiplier impact stemming from the payroll of on-airport tenants and businesses is approximately $6.0 billion. payroll impacts produced by on-airport activity, which includes direct and multiplier payroll, are just under $14.7 billion annually. On-airport payroll impacts for each airport are listed in Table A-7 in the appendix. Construction Capital improvements and related construction work at Texas airports add aviation-related payroll to the state economy. Estimates of annual payroll tied to capital investment are shown in Table

42 ECONOMIC IMPACTS OF TEXAS AIRPORTS Table 4-7 Construction Multiplier CIP Direct CIP Airports CIP Commercial Service Airports $275,678,000 $193,817,000 $469,495,000 General Aviation Airports $71,393,000 $50,176,000 $121,569,000 CIP $347,071,000 $243,993,000 $591,064,000 Source: CDM Smith and IMPLAN Commercial service airports make up more than three-quarters of all construction payroll. Notable capital projects at commercial service airports include a $52 million runway reconstruction project at Dallas/Fort Worth International that will upgrade Runway 17C/35C in the summer of At Austin Bergstrom International, a major terminal and apron expansion project Construction improvements at Bridgeport Municipal Airport will increase the number of gates from 24 to 33 and is expected to be completed in 2019 at a total cost of $350 million. Brownsville South Padres Island International Airport is constructing an entirely new terminal to modernize and accommodate future growth, receiving $12.7 million in FAA AIP grant funding to help make the project possible. On the general aviation side, Ellington Field outside Houston is constructing a new control tower at a cost of $11 million that is projected to open by the end of TSTC Waco invested in renovating hangar space to draw in Siemens as a new tenant, where they research and test their eaircraft development. General aviation contributes 20 percent of all construction payroll impacts. Multiplier impacts add almost $244 million in construction payroll, providing a total annual payroll impact of $591.1 million. Construction payroll impacts for each airport are listed in Table A-8 in the appendix. Commercial Service Visitor-Related Table 4-8 identifies the annual payroll impact attributed to employees whose jobs are supported by the spending of commercial service visitors using the study airports. Table 4-8 Commercial Service Visitor-Related Multiplier Direct Commercial Commercial Service Visitor- Service Visitor- Related Related Commercial Service Visitor Airports Commercial Service Visitor $8,309,200,000 $6,260,583,000 $14,569,783,000 Source: CDM Smith and IMPLAN Direct payroll impacts related to commercial service visitors adds the salary, wages, and benefits of workers in industries such as hospitality, entertainment, and recreation, that are most frequented by such visitors. Direct annual payroll attributable to spending by commercial service visitors is estimated at over $8.3 billion, with nearly $4.3 billion contributed by Dallas/Fort Worth International and Houston Intercontinental. Commercial service airports that frequently serve tourists also generate significant visitor-related payroll such as Brownsville South Padre Island International that 4-7

43 ECONOMIC IMPACTS OF TEXAS AIRPORTS maintains a successful partnership with the Brownsville Convention & Visitors Bureau to direct tourists to local businesses during their stay. As direct payroll impacts from commercial service visitors circulate in the Texas economy, multiplier impacts are produced. This circulation of money generates employment and additional payroll in other industries outside of aviation that can be attributed to the initial spending by visitors arriving through commercial service airports. associated with multiplier impacts is estimated at $6.3 billion. Nearly $14.6 billion in total annual payroll impact from commercial service visitors is produced when combining direct and multiplier impacts. Air carrier visitor-related payroll impacts for each airport are listed in Table A-9 in the appendix. General Aviation Visitor-Related Table 4-9 identifies the payroll impacts generated by visitors when traveling to Texas airports using general aviation. Table 4-9 General Aviation Visitor-Related Multiplier GA Direct GA Visitor- Visitor-Related Related GA Visitor- Related Airports Commercial Service Airports $56,130,000 $44,231,000 $100,361,000 General Aviation Airports $78,667,000 $62,134,000 $140,801,000 General Aviation Visitor $134,797,000 $106,365,000 $241,162,000 Source: CDM Smith and IMPLAN produced from general aviation visitors relates to the salaries, wages, and benefits at jobs directly used by those passengers traveling by general aviation aircraft, no matter if the airport hosts commercial service. Near the Cotulla-La Salle County Airport, construction and service industry jobs have seen significant growth as hotels experience near-capacity occupancy and new development is slated as a highway is being planned near the Jets occupy the new apron at Cotulla-La Salle County Airport airport; this activity in turn helps accommodate general aviation visitors coming for business involving the oil industry or hunting at nearby ranches. General aviation visitors generate $134.8 million in direct annual payroll. General aviation airports constitute nearly $78.7 million in payroll. As employees in the visitor-related industries spend their payroll, this spending continues to circulate, generating additional employment and subsequent payroll. With these multiplier impacts, another $106.4 million is added in payroll impact due to the spending of general aviation visitor dollars. General aviation visitor impacts combine to produce $241.2 million in annual payroll impact. General aviation visitor-related payroll impacts for each airport are listed in Table A-10 in the appendix. Continued investment in Texas airports, whether in metropolitan, rural, or destination locations, adds payroll benefits in important sectors such as construction and tourism across the state. The combined impacts of airport businesses and tenants, CIP, commercial service visitor, and general 4-8

44 ECONOMIC IMPACTS OF TEXAS AIRPORTS aviation visitor-related payroll in Texas are identified in Table Commercial service and general aviation direct annual payroll impacts equate to over $17.5 billion. When considering multiplier impacts, another $12.6 billion in annual payroll impacts are added to produce a total payroll impact of just over $30.0 billion. payroll impacts for each airport are listed in Table A-11 in the appendix. Table 4-10 Airports Direct Multiplier Commercial Service Airports $15,980,819,000 $11,522,048,000 $27,502,867,000 General Aviation Airports $1,531,040,000 $1,045,104,000 $2,576,144,000 $17,511,859,000 $12,567,152,000 $30,079,011,000 Source: CDM Smith and IMPLAN OUTPUT IMPACTS Economic output generated by aviation-related businesses, government agencies, and visitors relates to the money spent and circulated originating at Texas airports. For this study, on-airport output is defined as annual gross sales for on-airport businesses and activities. In instances where businesses or organizations do not generate revenue, annual operating expenses are used as a gage of output. Examples of these instances would be government agencies like TSA and federally-operated control towers, corporate flight departments, and airlines which generate revenue from ticket sales, but are difficult to assign to specific airports. When looking at CIP, output is equivalent to the amount spent to complete the projects. Commercial service and general aviation visitor output is defined as the money spent on their visits outside the airport and airport-related activities. Annual economic output generated annually from Texas airports benefiting the state s economy is discussed in this section. On-Airport Table 4-11 identifies annual output for all onairport activities. Texas airports produce over $28.4 billion in direct economic output, with over 80 percent stemming from activity at the 25 commercial service airports throughout the state. Commercial service airports are responsible for more than $23.9 billion in direct on-airport output, while general aviation airports contribute $4.5 billion to the Texas economy. At the Gillespie County Airport near Fredericksburg, the Hangar Hotel and Airport Diner offer a unique experience for general aviation visitors, providing on-airport Hangar Hotel at the Gillespie County Airport hospitality that helps increase the airport s output in a form usually seen only at commercial service airports. One-of-a-kind tenants help keep general aviation airports thriving in Texas and encourage spending and investment by the community and other airport users. 4-9
45 ECONOMIC IMPACTS OF TEXAS AIRPORTS Table 4-11 On-Airport Direct On-Airport Multiplier On- Airport On-Airport Airports Commercial Service Airports $23,942,393,000 $21,162,332,000 $45,104,725,000 General Aviation Airports $4,498,137,000 $3,823,511,000 $8,321,648,000 On-Airport $28,440,530,000 $24,985,843,000 $53,426,373,000 Source: CDM Smith and IMPLAN As aviation-related tenants located on each study airport spend money keeping their businesses operating, these expenditures enter the Texas economy and spread to different sectors and industries, leading to additional output impacts that can be derived from aviation-related spending. Multiplier output impacts are estimated using the IMPLAN model, with an estimate of nearly $25.0 billion in multiplier output from on-airport activity. When direct and multiplier impacts are combined, the total annual output for the study airports from on-airport activity exceeds $53.4 billion. On-airport output impacts for each airport are listed in Table A-12 in the appendix. Construction The Texas economy receives $1.5 billion in direct output from capital-related spending, as shown in Table The estimated annual capital expenditures are based on the average of the three previous years of expenditures for each airport. related to commercial service airports makes up over 75 percent of the direct economic output related to CIP. Airports require frequent maintenance and long-range planning to acquire funding for major improvements. For example, the Dallas Executive Airport is undertaking a $23.4 million project to reconstruct portions of Runway 13/31 and shift it to meet runway safety standards. This effort began in 2014 and is expected to conclude in Multiplier impacts add $1.4 billion in additional output, resulting in total construction impacts of $2.9 billion. Construction-related output impacts for each airport are listed in Table A-13 in the appendix. Table 4-12 Construction Multiplier CIP Direct CIP Airports CIP Commercial Service Airports $1,130,776,000 $1,068,737,000 $2,199,513,000 General Aviation Airports $336,181,000 $317,969,000 $654,150,000 CIP $1,466,957,000 $1,386,706,000 $2,853,663,000 Source: CDM Smith and IMPLAN Commercial Service Visitor-Related Table 4-13 identifies the output attributed to commercial visitor spending. Airports from the largest metropolitan areas in Texas - Dallas/Fort Worth, Houston, Austin, and San Antonio - contribute 88 percent of direct output from commercial service visitor spending. Dallas Love and Houston Hobby provide alternatives to Dallas Fort Worth International and Houston Intercontinental that feature low cost carrier Southwest Airlines, popular among visitors for their fares and assists in adding more visitor output based on the nature of their business model. The recirculation of all direct spending from commercial visitors creates another $18 billion in multiplier impacts. In total, the combined annual output from commercial service visitor spending is over $37 billion. Air carrier visitor output impacts for each airport are listed in Table A-14 in the appendix. 4-10
46 ECONOMIC IMPACTS OF TEXAS AIRPORTS Table 4-13 Commercial Service Visitor-Related Multiplier Direct Commercial Commercial Service Visitor- Service Visitor- Related Related Commercial Service Visitor- Related Airports Commercial Service Visitor $18,984,157,000 $18,350,807,000 $37,334,964,000 Source: CDM Smith and IMPLAN General Aviation Visitor-Related Table 4-14 displays the output generated by all general aviation visitors in Texas. Direct annual output is estimated at $325.8 million. General aviation airports in Texas support more than half of all direct general aviation visitor-related output. In rural west Texas, Marfa Municipal Airport and the City of Marfa have worked together to take advantage of the city s growing arts and culture community. The City of Marfa contributes hotel occupancy taxes toward the costs of airport facilities in recognition of the visitors that they airport brings to the region. When adding in the multiplier effect, as the money makes its way through the economy, over $309.9 million is created in additional output. When direct and multiplier impacts are combined, general aviation visitor output is $635.7 million. General aviation visitor-related output impacts for each airport are listed in Table A-15 in the appendix. Table 4-14 General Aviation Visitor-Related Multiplier GA Direct GA Visitor- Visitor-Related Related AIRPORTS AND RECENT IMPROVEMENTS REFLECT WELL ON THE STATE AS AN ECONOMIC GENERATOR FOR BUSINESS. - Visitors to Sugar Land Regional from Tradewind GA Visitor- Related Airports Commercial Service Airports $135,542,000 $128,809,000 $264,351,000 General Aviation Airports $190,222,000 $181,139,000 $371,361,000 General Aviation Visitor $325,764,000 $309,948,000 $635,712,000 Source: CDM Smith and IMPLAN The total combined annual output related to on-airport activities, CIP, and commercial service and general aviation visitor spending is presented in Table Direct annual output measures more than $49.2 billion while multiplier output impacts are estimated at more than $45.0 billion annually. Combined direct and multiplier output from on-airport activities, construction and all aviation visitors produce a total annual output of $94.3 billion for Texas economy. impacts for each airport are listed in Table A-16 in the appendix. While commercial service airports produce the majority of total output, general aviation airports continue to provide great benefit to the communities they serve as evidenced by investment from the community and tenants at Gillespie County, Granbury Regional, and others. 4-11
47 ECONOMIC IMPACTS OF TEXAS AIRPORTS Table 4-15 Airports Direct Multiplier Commercial Service Airports $44,192,868,000 $40,710,685,000 $84,903,553,000 General Aviation Airports $5,024,540,000 $4,322,619,000 $9,347,159,000 $49,217,408,000 $45,033,304,000 $94,250,712,000 Source: CDM Smith and IMPLAN COMPARISON TO PREVIOUS STUDY The growth of the Texas airport system can be measured by comparison of current economic impacts to past studies. When making such a comparison, it is important to compare results that were obtained using similar methodologies. The previous study, The Economic Impact of General Aviation in Texas, used 2011 as the base year. Like this study, it focused on the general aviation airports in the system, but also included economic impact estimates for the 25 commercial service airports. It made use of an IMPLAN economic model, so it can be safely assumed that a methodology similar to the current study was used to develop the 2011 economic impact estimates. However, the technical report for the study did not provide details by airport beyond the total impact level, so the only valid comparisons that can be made are at the total impact level. The total impacts include both direct and multiplier impacts. As shown in Table 4-16, the Texas airport system has exhibited growth across each economic measure. employment attributed to general aviation airports rose to more than 48,000 since 2011 an increase of 54 percent. for those jobs grew even more over this period, rising nearly 65 percent to $2.6 billion. output from general aviation airports soared to $9.3 billion, an increase of nearly 47 percent from Table 4-16 Comparison of Economic Impacts Airports 2011 Study 2017 Study Percent Change General Aviation Airports 31,192 48, % $1,563,355,202 $2,576,144, % $6,368,561,698 $9,347,159, % Commercial Service Airports 698, , % $19,956,019,828 $27,502,867, % $45,357,769,462 $84,903,553, % Source: CDM Smith and The Economic Impact of General Aviation in Texas, The 25 commercial service airports showed gains as well. The number of jobs attributed to activities at commercial service airports grew modestly from 2011, increasing by nearly 5 percent to more than 730,000 workers. The total payroll for those jobs experienced much greater growth of approximately 38 percent, indicating gains in salary and wages for commercial service airport workers. output at the commercial service airports exhibited the greatest growth, jumping 87 percent over 2011 output to $84.9 billion. 4-12
48 ECONOMIC IMPACTS OF TEXAS AIRPORTS SUMMARY Texas airports are significant contributors to the Texas economy. The aviation-related activity at Texas airports supports 778,955 jobs with an associated payroll of $30.1 billion. This economic impact is the result of on-airport businesses and government organizations carrying out their duties and services as part of the aviation industry. It also includes impacts from airport-related capital projects, as well as the effects from expenditures by visitors arriving via airline and private aircraft. Using an economic input-output model, the follow-on effects of multiplier impacts were estimated. Together, all of this activity results in $94.3 billion of economic output for Texas. These impacts are significantly higher than when they were last measured in The general aviation airports exhibited strong growth across all measures, with employment rising 54 percent, payroll up 65 percent, and output increasing 47 percent since the previous study. The impacts at commercial service airports also showed growth. grew by 5 percent, while payroll and output jumped 38 percent and 87 percent, respectively. 4-13
49 CHAPTER 5: BUSINESS USE OF AVIATION BUSINESS AVIATION General aviation is all civil aviation activity not flown on scheduled commercial airlines, and business aviation is general aviation flown for business purposes. Business general aviation aircraft include piston aircraft, helicopters, turboprops, and jets. Several studies provide an overview of the benefits and scope of business aviation, as well as its impact on the national economy. These documents include the following: NBAA Business Aviation Fact Book The National Business Aviation Association (NBAA) is the premiere organization for companies that rely on general aviation for business travel. NBAA represents over 11,000 companies, providing products, services, and market research. The mission statement of NBAA is to foster an environment that allows business aviation to thrive in the United States and around the world. NBAA publishes the NBAA Business Aviation Fact Book to illustrate the economic impacts, benefits to companies, and need for business-specific general aviation services. The Fact Book makes specific note of how business aviation can benefit companies over commercial aviation. Business Aviation and Top Performing Companies 2017 Written by NEXA Advisors, this document is their latest research effort to support the finding that business aviation contributes to a company s enterprise value and productivity. NEXA separates businesses into two categories users of business aviation and non-users and states where users place in rankings by such publications as Forbes and Fortune. Business Aviation: Maintaining Shareholder Value Through Turbulent Times, Part IV Fall 2012 Also written by NEXA Advisors, Business Aviation analyzes the value of business aviation to shareholders for Standard and Poor s S&P 500 (large cap) and S&P 600 (small cap) companies. The study focused on the period from 2003 to 2010, paying particular attention to how companies recovered from the Great Recession, and if companies that regularly use business aviation fared better. The Real World of Business Aviation: A Survey of Companies Using General Aviation Aircraft Prepared by Harris Interactive for both NBAA and The General Aviation Manufacturers Association, many of the results of this document were included as key parts of NBAA s Fact Book. The survey was distributed to NBAA member businesses, with results further emphasizing the ways in which companies use general aviation and the various benefits they experience. The following sections provide an overview of business aviation, its benefits to companies, and how it impacts the national and global economy. Overview of Business Aviation According to NBAA, the vast majority of business aircraft seat six passengers and fly trips that average less than 1,000 miles. Business aircraft are often equipped with phones and internet access so that employees can maintain productivity while in the air. Business aviation is a massive economic activity for the United States, generating approximately $150 billion in annual economic output and employing more than 1.2 million people. These jobs are not just limited to pilots and flight attendants, but include professionals in aircraft maintenance, aircraft sales and service, ground handling and support, aviation education, flight scheduling and dispatch, and more. The global business aviation industry is an expanding sector. In 2004, the worldwide fleet of business aviation aircraft was 5-1

50 BUSINESS USE OF AVIATION growing at approximately 1 percent annually. By 2012, growth had increased to nearly 2 percent annually. In addition, the majority of these worldwide business aircraft are built, serviced, and maintained in the U.S. Small companies operate the majority of business aircraft, with 59 percent of all companies using business general aviation having fewer than 500 employees, and 70 percent have fewer than 1,000 employees. Most business flights are conducted on-demand, but some companies also maintain scheduled operations, known as general aviation shuttles. King Air at Abilene Regional Airport Harris Interactive s survey effort focused on many facets of business aviation, including how companies use aviation differently. Companies were asked to report the job title or position of the employees typically using aviation. Nearly three quarters were found to be in management positions, with over 20 percent being described as top management. Another 20 percent of business aviation passengers were reported as being in technical, sales, or service positions. Harris Interactive also asked businesses to report the number of aircraft they used. The vast majority 75 percent of responding businesses stated that they only operate one aircraft. An additional 12 percent indicated the use of two aircraft, while the remaining 13 percent reported using three or more aircraft. 5-2

51 BUSINESS USE OF AVIATION Benefits of Business Aviation The Fact Book details a multitude of benefits companies reap from the use of business general aviation. These benefits range from accessibility and scheduling to increased productivity and profits. The following sections summarize the various benefits of business aviation. Accessibility Business aviation provides access to a far greater number of airports than does commercial aviation. NBAA estimates that business general aviation flies to 10 times the number of airports flown to by commercial airlines; approximately 5,000 airports compared to 500. Many of these airports offer less Addison Airport congested airfields located closer to a traveler s destination. Harris Interactive s survey effort asked companies to report the percentage of their flights flown into communities that have never had a commercial service airport. On average, companies reported that 40 percent of business aviation flights were into communities that have never had commercial service. Business general aviation also allows companies to reach multiple destinations much faster than does commercial aviation or ground transportation. In their survey effort, Harris Interactive found that the most common destinations are customer offices, followed by locations of new business opportunities and company-owned offices or facilities. On-Demand Aviation Business aviation supports on-demand travel for companies. The Harris Interactive survey effort found that over 60 percent of businesses reported that scheduling was a primary benefit. Because of the on-demand nature of business flights, much less time is spent in airport terminals and security lines. Passengers on business aviation can typically go from the airport terminal into their aircraft very rapidly. This helps employees minimize their non-working hours away from home. The ondemand nature of business aviation also allows for timely shipment of supplies, cargo, office and industrial equipment, and sensitive documents. Employee Productivity Harris Interactive and NBAA found that employees are far more productive while on business aviation flights than on commercial flights. Results of the survey effort showed that individual employee productivity is nearly the same on commercial airlines as it is on business flights. However, survey respondents reported overwhelmingly that productivity between company employees is far higher on business general aviation flights than on commercial flights. In addition, some companies reported productivity between employees and clients on general aviation business flights. No companies reported this activity on commercial flights. Much of this productivity is created by the nature of a business aircraft itself. Operating essentially as a mobile office, a business aircraft provides companies and clients with a level of privacy to do business that they could never experience in a commercial aircraft. 5-3

52 BUSINESS USE OF AVIATION Company Performance, Profits and Return to Shareholders Aransas County Airport The increase in productivity and time savings are naturally reflected in companies bottom lines. NEXA Advisors found that business aviation is highly correlated to increased profits for companies both large and small. NEXA split 2017 S&P 500 businesses into two groups: business aviation users those that regularly use aircraft that is owned, fractionally owned, leased, or chartered for business purposes and non-users. Specifically, small and medium enterprises (SMEs) that use business aviation provided a total return on investment 245 percent higher than that of businesses that do not use business aviation. NEXA also found that from 2012 to 2017 users of business aviation experienced an enterprise value change of 170 percent compared to 100 percent for non-users, and that the difference between the two has increased each year during this period. NEXA found that business aviation is also highly correlated with a company s resiliency during turbulent financial times. From 2007 through 2011, during the Great Recession, aviation business users experiences on average far less revenue setbacks than non-users, and recovered to prerecession levels rapidly. User companies were also quicker in hiring back employees after the recession than were non-user companies. NEXA made many measurements of the performance of business aviation users versus non-users in their analyses, but perhaps most telling is where user companies rank in several industry best of lists. NEXA found that business aviation user companies made up a very high percentage of each of the following lists, as shown in Figure 5-1. Figure 5-1 Percentage of Industry Best Of Lists Made Up of Business Aviation Users 100 Best Corporate Citizens (The CRO) Change the World Top 20 (Fortune) S&P Top Performing Stocks (16-Q1117) 100 Most-Trustworthy Companies in America (Forbes) 50 Top-Performing U.S. Companies (Forbes Global) World s 50 Most-Admired Companies (Fortune) 50 Best Brands (Interbrand) 50 Best Customer Service (24/7 Wall St.) 100 Best Places to Work (Fortune) America s 50 Most-Innovative Companies (Forbes Global) 92% 95% 86% 100% 95% 98% 92% 97% 95% 92% 0% 10% 20% 30% 40% 50% 60% 70% 80% 90% 100% 5-4

53 BUSINESS USE OF AVIATION Source: NEXA Advisors. Safety and Security The business aviation community has established several standards for aviation safety, and aircraft operators have several places to turn for best practices. NBAA s Safety Committee has established 10 Safety Focus Areas, and presents Flying Safety Awards to companies that excel in aviation safety. Safety management systems help aviation professionals identify potential hazards and mitigate risks. NBAA is a founding member of the International Business Aviation Council, which developed the International Standard for Business Aircraft Operations, a code of best practices for business aviation. In addition, many companies participate in voluntary safety programs. The cumulative result of these efforts is that the number of general aviation accidents has steadily decreased in the U.S. since General aviation maintains a level of security comparable to that of commercial aviation. Security is maintained through many policies, starting with the screening of non-u.s. citizens seeking flight training, the reporting of any suspicious activity in the purchase or sale of aircraft, and the issuance of tamper-proof licenses for aviation personnel. Law Jets at Cotulla-La Salle County Airport enforcement agencies check registries of pilots and aircraft against terrorist and criminal databases. Security at small airports is provided by pilots reporting suspicious activity to a Transportation Security Administration (TSA) hotline, while charter aircraft over 12,500 pounds must comply with many of the same TSA standards as commercial aircraft. Humanitarian Efforts Finally, business aviation makes it easier for companies to take part in humanitarian efforts. In times of natural disasters, business aircraft can be used to transport relief and medical supplies to disaster areas. Medical helicopters and business aircraft are used throughout the world by organizations such as the Red Cross, Angel Flight, Air Care Alliance, and more. Business helicopter-operators aided in relief from Superstorm Sandy in 2012, delivering over 12 tons of supplies to the areas in most need. After the 2010 earthquake in Haiti, business aircraft flew more than 700 flights to the island nation, transporting passengers and delivering more than 700 tons of relief supplies. In the aftermath of this disaster, NBAA developed the Humanitarian Emergency Response Operator (HERO) database so that relief organizations can better communicate with pilots and aircraft owners. In 2017, a series of hurricanes ravaged the Caribbean islands and Gulf Coast. In Houston, where Hurricane Harvey caused an estimated $125 billion in damages, business aviation was crucial to an efficient and rapid recovery effort. In a public letter, Texas State Representative Dade Phelan praised the efforts and contributions of the general aviation community. He specifically pointed to the aid provided by the Patient Airlift Services (PALS) Sky Hope Disaster Relief Program, which organizes volunteer pilots during times of crisis. Sky Hope made over 150 flights to the Texas Gulf Coast in the 5-5

54 BUSINESS USE OF AVIATION days following the hurricane, carrying over 200,000 lbs. of relief supplies. Representative Phelan praised Sky Hope for its ability to coordinate relief efforts with the military and various volunteer groups. 1 In South Florida, the business aviation community provided relief to the Florida Keys as well as Caribbean islands following Hurricanes Maria and Irma. A hurricane relief fund was set up by three South Florida business aviation organizations: the South Florida Business Aviation Association (SFBAA), Tampa Bay Aviation THE SKY HOPE AIRLIFT TO ORANGE AND JEFFERSON COUNTIES PROVIDES AN EXCELLENT EXAMPLE OF HOW CRITICAL GENERAL AVIATION AIRPORTS AND AIRSPACE ARE IN SERVING COMMUNITIES. THIS WAS A MAJOR HUMANITARIAN RELIEF EFFORT AND SHOULD SERVE AS A TEMPLATE FOR OTHER RESCUE AND RECOVERY EFFORTS GOING FORWARD. - Texas State Representative Dade Phelan Association (TBAA), and the Florida Aviation Business Association (FABA). In addition to organizing relief funds, these organizations coordinated volunteer pilots and flights. Aerobridge, another nonprofit organization that coordinates relief efforts, flew over 80 tons of relief supplies to the Florida Keys and other areas following Hurricane Irma. In Fort Lauderdale, fixed-base operator Banyan Air Service became a base of operations for relief efforts. The company stated that during relief efforts, over 150 aircraft from throughout the country arrived at Fort Lauderdale, and Banyan provided further help by discounting fuel prices and suspending ramp fees. 2 Texas Flight Department Activity Based on information gathered for this study, there are at more than 122 corporate flight departments operating at Texas system airports. 3 These businesses employ nearly 570 workers at 38 airports. Many of these flight departments consist of four or fewer personnel, with many making use of part-time employees to fill their staffing needs. At the other end of the spectrum, the most robust flight operation departments employ as many as 50 people and operate multiple aircraft. Flight departments typically provide well-paying jobs in the community. Collectively, identified flight departments support $90 million in salary and benefits. from these on-airport departments create more than $300 million in economic impacts. Additionally, a network of avionics, airframe and powerplant maintenance, and other professions exist to support the operations of these companies. 1 Office of Dade Phelan, Texas State Representative, District 21 (2017). 2 NBAA (2017). 3 Since detailed studies were not done for AUS, DAL, DFW, ELP, HOU, IAH, and SAT, the corporate flight departments at these airports are not included in the count. 5-6
55 BUSINESS USE OF AVIATION SUMMARY This chapter summarized the findings of several studies on business aviation, including studies performed by NBAA, NEXA Advisors, Harris Interactive, and other organizations. Business aviation is a $150 billion industry and employs over 1.2 million people nationwide. Most employees using business aviation are in management positions, with over 20 percent being upper management, while 75 percent of companies that use business aviation only own one aircraft. There are numerous benefits of using business aviation over commercial passenger service. Business aircraft can access approximately 5,000 airports to commercial service s 500, while business aviation allows for on-demand travel, not scheduled passenger service. A survey effort by Harris Interactive found that business aviation yielded far higher employee productivity than commercial service, particularly productivity between employees. Another benefit of business aviation is resiliency, as NEXA Advisors found that companies using business aviation have higher stability during turbulent financial times. NEXA also found that industry best of lists are typically populated largely by companies that use business aviation. In addition, business aviation carries with it a security standard comparable to that of commercial service. In Texas, this study identified more than 100 corporate flight departments, both large and small, which employ hundreds of well-paid, highlyskilled workers. Business aviation is also important to humanitarian efforts. During the aftermath of such natural disasters as Superstorm Sandy, the 2010 earthquake in Haiti, and the hurricane season of 2017, the business aviation community was key in organizing the shipment of supplies and crucial personnel to the devastated areas. 5-7
56 APPENDIX A: ECONOMIC IMPACT TABLES This Appendix contains tables detailing the economic impacts from the 289 Texas system airports. The row labeled Other Airports combines the impacts of the following airports: Bishop Municipal (07R) Cochran County (F85) Crystal City Municipal (20R) Cuero Municipal (T71) Dilley Airpark (24R) Duval-Freer (T19) Eldorado (27R) Fisher County (56F) Follett/Lipscomb County (T93) Goldthwaite Municipal (T37) Greater Morris County (8F5) Groveton-Trinity County (33R) Higgins-Lipscomb County (1X1) Marlin (T15) Mc Lean/Gray County (2E7) Memphis Municipal (F21) Menard County (T50) Miami-Roberts County (3E0) Newton Municipal (61R) Pineland Municipal (T24) Post-Garza County Municipal (5F1) Real County (49R) Rio Grande City Municipal (67R) Robert Lee (54F) San Augustine County (78R) Shamrock Municipal (2F1) Smiley Johnson Municipal/Bass Field (E34) Stanton Municipal (63F) Stonewall County (T60) Teague Municipal (68F) The Carter Memorial (T91) Tyler County (09R) Yoakum Municipal (T85) A-1
57 Table A-1: Estimates of General Aviation Visitors to Texas Airports Percentage GA True True Transient Transients Arrivals Visitors per Arrival Estimated GA Visitors Airport GA Operations Commercial Service Airports Abilene Abilene Regional 45,489 9% 4, ,455 Amarillo Rick Husband Amarillo International 46,815 10% 4, ,754 Austin Austin-Bergstrom International 62,283 16% 9, ,742 Beaumont/Port Arthur Jack Brooks Regional 12,959 12% 1, ,894 Brownsville Brownsville/South Padre Island International 23,065 11% 2, ,276 College Station Easterwood Field 40,760 12% 4, ,682 Corpus Christi Corpus Christi International 50,406 11% 5, ,928 Dallas Dallas Love Field 60,481 16% 9, ,922 Dallas-Fort Worth Dallas/Fort Worth International 7,043 16% 1, ,299 El Paso El Paso International 47,465 12% 5, ,042 Fort Hood (Killeen) Killeen-Fort Hood Regional 7,193 17% 1, ,392 Harlingen Valley International 25,006 4% 1, ,922 Houston George Bush Intercontinental/Houston 11,236 17% 1, ,860 Houston William P Hobby 57,811 17% 9, ,294 Laredo Laredo International 87,840 4% 3, ,838 Longview East Texas Regional 49,835 7% 3, ,236 Lubbock Lubbock Preston Smith International 39,152 11% 4, ,583 Mc Allen Mc Allen Miller International 45,439 14% 6, ,925 Midland Midland International Air and Space Port 48,668 11% 5, ,605 San Angelo San Angelo Regional/Mathis Field 82,289 8% 6, ,040 San Antonio San Antonio International 55,281 16% 9, ,748 Texarkana, AR Texarkana Regional Airport- Webb Field 18,110 10% 1, ,438 Tyler Tyler Pounds Regional 31,422 11% 3, ,191 Waco Waco Regional 27,800 13% 3, ,379 Wichita Falls Sheppard AFB/Wichita Falls Municipal 103,051 16% 16, ,921 Commercial Service Airports 1,086,899 12% 127, ,366 General Aviation Airports Albany Albany Municipal 2,800 4% Alice Alice International 26,600 14% 3, ,553 Alpine Alpine-Casparis Municipal 10,450 4% ,224 Amarillo Tradewind 44,030 4% 1, ,723 Anahuac Chambers County 2,400 6% Andrews Andrews County 10,400 4% ,201 Angleton/Lake Jackson Texas Gulf Coast Regional 77,981 11% 8, ,673 Arlington Arlington Municipal 85,137 9% 7, ,194 A-2
58 Table A-1: Estimates of General Aviation Visitors to Texas Airports (cont.) Airport GA Operations Percentage True Transients GA True Transient Arrivals Visitors per Arrival Estimated GA Visitors Athens Athens Municipal 6,125 6% Atlanta Hall-Miller Municipal 15,600 6% ,802 Ballinger Bruce Field 2,850 4% Bay City Bay City Regional 8,750 6% ,389 Beaumont Beaumont Municipal 15,500 6% ,907 Beeville Beeville Municipal 8,000 4% Big Lake Reagan County 4,000 4% Big Spring Big Spring Mc Mahon-Wrinkle 23,520 5% 1, ,329 Bonham Jones Field 5,700 6% Borger Hutchinson County 10,010 4% ,159 Bowie Bowie Municipal 13,700 4% ,618 Brady Curtis Field 26,400 7% 1, ,778 Breckenridge Stephens County 15,200 4% ,756 Brenham Brenham Municipal 15,050 6% ,749 Bridgeport Bridgeport Municipal 15,900 6% ,838 Brownfield Terry County 6,800 4% Brownwood Brownwood Regional 25,000 5% 1, ,426 Bryan Coulter Field 16,200 6% ,871 Burnet Burnet Municipal Kate Craddock Field 16,200 6% ,010 Caddo Mills Caddo Mills Municipal 14,000 13% 1, ,716 Caldwell Caldwell Municipal 7,100 5% Cameron Cameron Municipal Airpark 1,500 6% Canadian Hemphill County 6,400 4% Carrizo Springs Dimmit County 1,800 6% Carthage Panola County-Sharpe Field 11,050 4% ,364 Castroville Castroville Municipal 16,420 5% ,808 Center Center Municipal 7,630 6% ,215 Childress Childress Municipal 4,840 4% Cisco Cisco Municipal 2,800 4% Clarksville Clarksville/Red River County-J D Trissell Field 1,300 3% Cleburne Cleburne Regional 33,124 4% 1, ,953 Cleveland Cleveland Municipal 14,200 6% ,733 Clifton Clifton Municipal/Isenhower Field 5,700 6% Coleman Coleman Municipal 7,500 6% ,156 Colorado City Colorado City 2,000 4% Columbus Robert R Wells Jr. 4,000 4% Comanche Comanche County-City 9,200 4% ,064 Commerce Commerce Municipal 5,000 13% ,848 Corsicana C David Campbell Field- Corsicana Municipal 25,200 4% 1, ,184 Cotulla Cotulla-La Salle County 13,450 12% 1, ,274 Crane Crane County 1,200 8% Crockett Houston County 6,600 6% ,016 Crosbyton Crosbyton Municipal 2,000 4% A-3
59 Table A-1: Estimates of General Aviation Visitors to Texas Airports (cont.) Airport GA Operations Percentage True Transients GA True Transient Arrivals Visitors per Arrival A-4 Estimated GA Visitors Dalhart Dalhart Municipal 11,350 4% ,364 Dallas Addison 95,324 16% 15, ,889 Dallas Dallas CBD Vertiport % Dallas Dallas Executive 47,229 0% 4, ,428 McKinney McKinney National 107,139 6% 6, ,333 Decatur Decatur Municipal 13,200 6% ,033 Del Rio Del Rio International 15,259 4% ,506 Dell City Dell City Municipal 2,500 3% Denton Denton Enterprise 166,815 7% 12, ,388 Denver City Denver City 4,400 4% Desoto Desoto Heliport 1,915 4% Devine Devine Municipal 5,400 6% Dimmitt Dimmitt Municipal 2,600 1% Dryden Terrell County % Dublin Dublin Municipal 4,400 4% Dumas Moore County 10,830 4% ,260 Eagle Lake Eagle Lake 8,700 6% ,341 Eagle Pass Maverick County Memorial International 600 6% Eastland Eastland Municipal 8,000 4% Edinburg South Texas International at Edinburg 4,140 4% Edna Jackson County 7,600 6% ,201 Ennis Ennis Municipal 3,720 5% Fabens Fabens 10,500 6% ,896 Falfurrias Brooks County 5,400 14% ,080 Floydada Floydada Municipal 6,300 6% Fort Stockton Fort Stockton-Pecos County 8,250 4% ,039 Fort Worth Fort Worth Alliance 116,438 9% 10, ,783 Fort Worth Fort Worth Meacham International 117,060 9% 10, ,234 Fort Worth Fort Worth Spinks 66,515 7% 4, ,999 Fredericksburg Gillespie County 14,808 8% 1, ,602 Gainesville Gainesville Municipal 17,800 6% ,079 Galveston Scholes International at Galveston 31,050 13% 4, ,366 Garland Garland/DFW Heloplex 36,500 1% Gatesville Gatesville Municipal 4,500 6% George West Live Oak County 1,508 12% Georgetown Georgetown Municipal 74,939 8% 5, ,071 Giddings Giddings-Lee County 5,800 7% ,064 Gilmer Fox Stephens Field-Gilmer Municipal 9,100 3% Gladewater Gladewater Municipal 17,600 4% ,173 Gonzales Roger M. Dreyer Memorial 3,200 4% Graford Possum Kingdom 5,200 4% Graham Graham Municipal 13,510 1% Granbury Granbury Regional 26,700 6% 1, ,085
60 Table A-1: Estimates of General Aviation Visitors to Texas Airports (cont.) Airport GA Operations Percentage True Transients GA True Transient Arrivals Visitors per Arrival Estimated GA Visitors Grand Prairie Grand Prairie Municipal 66,748 6% 3, ,234 Greenville Majors 19,135 5% 1, ,209 Gruver Gruver Municipal 3,100 1% Hallettsville Hallettsville Municipal 2,100 6% Hamilton Hamilton Municipal 6,900 4% Haskell Haskell Municipal 2,400 6% Hearne Hearne Municipal 3,200 4% Hebbronville Jim Hogg County % Henderson Rusk County 12,400 5% ,571 Hereford Hereford Municipal 13,435 3% ,274 Hillsboro Hillsboro Municipal 6,000 6% Hondo South Texas Regional at Hondo 25,000 3% ,733 Houston Conroe-North Houston Regional 63,269 10% 6, ,120 Houston David Wayne Hooks Memorial 113,586 9% 10, ,190 Houston Ellington Field 102,269 12% 11, ,189 Houston Houston-Southwest 42,624 6% 2, ,905 Houston Pearland Regional 60,000 6% 3, ,210 Houston Sugar Land Regional 73,577 10% 7, ,546 Houston West Houston 103,000 5% 5, ,147 Huntsville Huntsville Municipal 29,613 6% 1, ,542 Ingleside McCampbell-Porter 20,000 4% ,733 Jacksboro Jacksboro Municipal 2,500 3% Jacksonville Cherokee County 12,350 6% ,954 Jasper Jasper County-Bell Field 16,000 4% ,848 Jayton Kent County 100 8% Jefferson Cypress River 3,200 4% Junction Kimble County 7,700 4% Kenedy Karnes County 3,000 6% Kerrville Kerrville Municipal/Louis Schreiner Field 59,800 13% 7, ,101 Killeen Skylark Field 28,365 4% 1, ,552 Kingsville Kleberg County % Kirbyville Kirbyville 10,000 4% ,156 Knox City Harrison Field of Knox City 2,500 3% Kountze/Silsbee Hawthorne Field 4,200 4% La Grange Fayette Regional Air Center 9,300 6% ,434 La Porte La Porte Municipal 29,050 6% 1, ,356 Lago Vista Lago Vista TX-Rusty Allen 5,100 6% Lamesa Lamesa Municipal 13,600 4% ,571 Lampasas Lampasas 10,800 4% ,249 Lancaster Lancaster Regional 67,100 7% 4, ,138 Levelland Levelland Municipal 14,025 4% ,630 Liberty Liberty Municipal 6,243 10% ,705 Littlefield Taylor Brown Municipal 7,025 4% Livingston Livingston Municipal 9,200 4% ,064 Llano Llano Municipal 10,024 8% ,741 Lockhart Lockhart Municipal 17,700 6% ,045 A-5
61 Table A-1: Estimates of General Aviation Visitors to Texas Airports (cont.) Airport GA Operations Percentage True Transients GA True Transient Arrivals Visitors per Arrival Estimated GA Visitors Lufkin Angelina County 23,000 11% 2, ,587 Madisonville Madisonville Municipal 400 4% Marfa Marfa Municipal 16,000 4% ,848 Marshall Harrison County 16,000 4% ,848 Mason Mason County 2,000 10% Mc Camey Upton County 800 4% Mesquite Mesquite Metro 69,366 7% 4, ,496 Mexia Mexia-Limestone County 6,900 6% ,064 Midland Midland Airpark 27,210 5% 1, ,879 Midlothian/Waxahachie Mid-Way Regional 37,400 5% 2, ,570 Mineola/Quitman Wood County 20,000 4% ,733 Mineral Wells Mineral Wells 22,750 6% 1, ,686 Monahans Roy Hurd Memorial 13,200 4% ,526 Mount Pleasant Mount Pleasant Regional 13,200 6% ,033 Mount Vernon Franklin County 4,300 2% Muleshoe Muleshoe Municipal 2,400 6% Munday Munday Municipal 1,200 4% Nacogdoches A L Mangham Jr. Regional 22,800 6% 1, ,703 Navasota Navasota Municipal 12,800 4% ,478 New Braunfels New Braunfels Regional 52,541 8% 4, ,651 Odessa Odessa-Schlemeyer Field 50,750 9% 4, ,332 Olney Olney Municipal 4,300 4% Orange Orange County 12,470 5% ,789 Ozona Ozona Municipal 8,075 4% Paducah Dan E Richards Municipal 1,600 4% Palacios Palacios Municipal 7,060 7% ,322 Palestine Palestine Municipal 10,850 6% ,719 Pampa Perry Lefors Field 22,000 4% ,907 Panhandle Panhandle-Carson County 3,300 1% Paris Cox Field 10,830 6% ,711 Pearsall Mc Kinley Field 3,870 3% Pecos Pecos Municipal 23,600 11% 2, ,220 Perryton Perryton Ochiltree County 19,200 4% ,218 Plains Yoakum County 7,600 4% Plainview Hale County 23,650 4% ,062 Pleasanton Pleasanton Municipal 9,280 6% ,515 Port Aransas Mustang Beach 3,324 15% ,386 Port Isabel Port Isabel-Cameron County 4,250 7% Port Lavaca Calhoun County 8,700 6% ,526 Port Mansfield Charles R Johnson % Presidio Presidio Lely International 900 6% Quanah Quanah Municipal 4,400 4% Refugio Rooke Field 3,900 4% Roanoke Northwest Regional 166,000 6% 9, ,188 Robstown Nueces County 6,000 6% Rockdale H H Coffield Regional 3,200 4% Rockport Aransas County 56,720 11% 6, ,639 A-6
62 Table A-1: Estimates of General Aviation Visitors to Texas Airports (cont.) Airport GA Operations Percentage True Transients GA True Transient Arrivals Visitors per Arrival Estimated GA Visitors Rocksprings Edwards County % Rockwall Ralph M Hall/Rockwall Municipal 38,020 3% 1, ,778 San Antonio Stinson Municipal 93,157 6% 5, ,277 San Marcos San Marcos Regional 45,000 9% 4, ,992 San Saba San Saba County Municipal 2,800 7% Seminole Gaines County 10,550 4% ,271 Seymour Seymour Municipal 3,200 4% Sherman Sherman Municipal 8,250 2% Sherman/Denison North Texas Regional/Perrin Field 47,464 10% 4, ,138 Sinton Alfred C 'Bubba' Thomas 3,000 11% Slaton Slaton Municipal 12,200 4% ,478 Smithville Smithville Crawford Municipal 11,600 4% ,341 Snyder Winston Field 11,200 4% ,294 Sonora Sonora Municipal 2,400 4% Spearman Major Samuel B Cornelius Field 7,200 4% Stamford Arledge Field 4,400 4% Stephenville Stephenville Clark Regional 20,870 4% ,827 Sulphur Springs Sulphur Springs Municipal 17,910 6% 1, ,186 Sunray Sunray 5,200 4% Sweetwater Avenger Field 10,000 4% ,156 Tahoka T-Bar 2,600 4% Taylor Taylor Municipal 12,000 6% ,848 Temple Draughon-Miller Central Texas Regional 41,124 6% 2, ,702 Terrell Terrell Municipal 25,550 6% 1, ,963 Throckmorton Throckmorton Municipal 65 17% Tulia City of Tulia/Swisher County Municipal 4,800 4% Uvalde Garner Field 12,565 6% ,108 Van Horn Culberson County 600 8% Vega Oldham County 4,400 4% Vernon Wilbarger County 16,500 4% ,940 Victoria Victoria Regional 54,741 6% 3, ,288 McGregor Mc Gregor Executive 25,200 6% 1, ,049 Waco TSTC Waco 90,000 7% 6, ,047 Wellington Marian Airpark 4,060 4% Weslaco Mid Valley 44,800 4% 1, ,204 Wharton Wharton Regional 11,800 6% ,848 Wheeler Wheeler Municipal 400 4% Wichita Falls Kickapoo Downtown 33,950 4% 1, ,032 Wills Point Van Zandt County Regional 4,800 4% Wink Winkler County 1,300 5% Winnie/Stowell Chambers County-Winnie Stowell 3,600 6% Winnsboro Winnsboro Municipal 2,900 4% Winters Winters Municipal 3,200 4% A-7
63 Table A-1: Estimates of General Aviation Visitors to Texas Airports (cont.) Airport GA Operations Percentage True Transients GA True Transient Arrivals Visitors per Arrival Estimated GA Visitors Zapata Zapata County 3,000 6% Other Airports 35,375 4% 1, ,349 General Aviation Airports 4,582,051 7% 315, ,064,034 All Airports 5,668,950 8% 443, ,534,400 Source: CDM Smith. A-8
64 Table A-2: On-Airport from Texas Airports Direct On-Airport Multiplier On-Airport On-Airport Commercial Service Airports Abilene Abilene Regional 613 1,001 1,614 Amarillo Rick Husband Amarillo International 1,568 2,547 4,115 Austin Austin-Bergstrom International 7,458 7,220 14,678 Beaumont/Port Arthur Jack Brooks Regional Brownsville Brownsville/South Padre Island International College Station Easterwood Field Corpus Christi Corpus Christi International ,453 Dallas Dallas Love Field 8,303 8,040 16,343 Dallas-Fort Worth Dallas/Fort Worth International 39,564 38,305 77,869 El Paso El Paso International 3,618 3,379 6,997 Fort Hood (Killeen) Killeen-Fort Hood Regional Harlingen Valley International ,271 Houston George Bush Intercontinental/Houston 33,976 32,894 66,870 Houston William P Hobby 6,993 6,770 13,763 Laredo Laredo International Longview East Texas Regional Lubbock Lubbock Preston Smith International ,231 Mc Allen Mc Allen Miller International Midland Midland International Air and Space Port 766 1,085 1,851 San Angelo San Angelo Regional/Mathis Field San Antonio San Antonio International 5,441 5,268 10,709 Texarkana, AR Texarkana Regional Airport- Webb Field Tyler Tyler Pounds Regional Waco Waco Regional Wichita Falls Sheppard AFB/Wichita Falls Municipal Commercial Service Airports 112, , ,066 General Aviation Airports Albany Albany Municipal Alice Alice International Alpine Alpine-Casparis Municipal Amarillo Tradewind Anahuac Chambers County Andrews Andrews County Angleton/Lake Jackson Texas Gulf Coast Regional A-9
65 Table A-2: On-Airport from Texas Airports (cont.) Direct On-Airport Multiplier On-Airport On-Airport Arlington Arlington Municipal Athens Athens Municipal Atlanta Hall-Miller Municipal Ballinger Bruce Field Bay City Bay City Regional Beaumont Beaumont Municipal Beeville Beeville Municipal Big Lake Reagan County Big Spring Big Spring Mc Mahon-Wrinkle Bonham Jones Field Borger Hutchinson County Bowie Bowie Municipal Brady Curtis Field Breckenridge Stephens County Brenham Brenham Municipal Bridgeport Bridgeport Municipal Brownfield Terry County Brownwood Brownwood Regional Bryan Coulter Field Burnet Burnet Municipal Kate Craddock Field Caddo Mills Caddo Mills Municipal Caldwell Caldwell Municipal Cameron Cameron Municipal Airpark Canadian Hemphill County Carrizo Springs Dimmit County Carthage Panola County-Sharpe Field Castroville Castroville Municipal Center Center Municipal Childress Childress Municipal Cisco Cisco Municipal Clarksville Clarksville/Red River County-J D Trissell Field Cleburne Cleburne Regional Cleveland Cleveland Municipal Clifton Clifton Municipal/Isenhower Field Coleman Coleman Municipal Colorado City Colorado City Columbus Robert R Wells Jr Comanche Comanche County-City Commerce Commerce Municipal Corsicana C David Campbell Field- Corsicana Municipal Cotulla Cotulla-La Salle County Crane Crane County Crockett Houston County A-10
66 Table A-2: On-Airport from Texas Airports (cont.) Direct On-Airport Multiplier On-Airport On-Airport Crosbyton Crosbyton Municipal Dalhart Dalhart Municipal Dallas Addison 1,079 1,740 2,819 Dallas Dallas CBD Vertiport Dallas Dallas Executive McKinney McKinney National Decatur Decatur Municipal Del Rio Del Rio International Dell City Dell City Municipal Denton Denton Enterprise ,122 Denver City Denver City Desoto Desoto Heliport Devine Devine Municipal Dimmitt Dimmitt Municipal Dryden Terrell County Dublin Dublin Municipal Dumas Moore County Eagle Lake Eagle Lake Eagle Pass Maverick County Memorial International Eastland Eastland Municipal Edinburg South Texas International at Edinburg Edna Jackson County Ennis Ennis Municipal Fabens Fabens Falfurrias Brooks County Floydada Floydada Municipal Fort Stockton Fort Stockton-Pecos County Fort Worth Fort Worth Alliance 1,073 1,890 2,963 Fort Worth Fort Worth Meacham International 635 1,104 1,739 Fort Worth Fort Worth Spinks Fredericksburg Gillespie County Gainesville Gainesville Municipal 788 1,441 2,229 Galveston Scholes International at Galveston Garland Garland/DFW Heloplex Gatesville Gatesville Municipal George West Live Oak County Georgetown Georgetown Municipal Giddings Giddings-Lee County Gilmer Fox Stephens Field-Gilmer Municipal Gladewater Gladewater Municipal Gonzales Roger M. Dreyer Memorial Graford Possum Kingdom A-11
67 Table A-2: On-Airport from Texas Airports (cont.) Direct On-Airport Multiplier On-Airport On-Airport Graham Graham Municipal Granbury Granbury Regional Grand Prairie Grand Prairie Municipal 739 1,343 2,082 Greenville Majors 4,913 3,563 8,476 Gruver Gruver Municipal Hallettsville Hallettsville Municipal Hamilton Hamilton Municipal Haskell Haskell Municipal Hearne Hearne Municipal Hebbronville Jim Hogg County Henderson Rusk County Hereford Hereford Municipal Hillsboro Hillsboro Municipal Hondo South Texas Regional at Hondo Houston Conroe-North Houston Regional Houston David Wayne Hooks Memorial Houston Ellington Field 1, ,012 Houston Houston-Southwest Houston Pearland Regional Houston Sugar Land Regional Houston West Houston Huntsville Huntsville Municipal Ingleside McCampbell-Porter Jacksboro Jacksboro Municipal Jacksonville Cherokee County Jasper Jasper County-Bell Field Jayton Kent County Jefferson Cypress River Junction Kimble County Kenedy Karnes County Kerrville Kerrville Municipal/Louis Schreiner Field Killeen Skylark Field Kingsville Kleberg County Kirbyville Kirbyville Knox City Harrison Field of Knox City Kountze/Silsbee Hawthorne Field La Grange Fayette Regional Air Center La Porte La Porte Municipal Lago Vista Lago Vista TX-Rusty Allen Lamesa Lamesa Municipal Lampasas Lampasas Lancaster Lancaster Regional Levelland Levelland Municipal Liberty Liberty Municipal A-12
68 Table A-2: On-Airport from Texas Airports (cont.) Direct On-Airport Multiplier On-Airport On-Airport Littlefield Taylor Brown Municipal Livingston Livingston Municipal Llano Llano Municipal Lockhart Lockhart Municipal Lufkin Angelina County Madisonville Madisonville Municipal Marfa Marfa Municipal Marshall Harrison County Mason Mason County Mc Camey Upton County Mesquite Mesquite Metro Mexia Mexia-Limestone County Midland Midland Airpark Midlothian/Waxahachie Mid-Way Regional Mineola/Quitman Wood County Mineral Wells Mineral Wells Monahans Roy Hurd Memorial Mount Pleasant Mount Pleasant Regional Mount Vernon Franklin County Muleshoe Muleshoe Municipal Munday Munday Municipal Nacogdoches A L Mangham Jr. Regional Navasota Navasota Municipal New Braunfels New Braunfels Regional Odessa Odessa-Schlemeyer Field Olney Olney Municipal Orange Orange County Ozona Ozona Municipal Paducah Dan E Richards Municipal Palacios Palacios Municipal Palestine Palestine Municipal Pampa Perry Lefors Field Panhandle Panhandle-Carson County Paris Cox Field Pearsall Mc Kinley Field Pecos Pecos Municipal Perryton Perryton Ochiltree County Plains Yoakum County Plainview Hale County Pleasanton Pleasanton Municipal Port Aransas Mustang Beach Port Isabel Port Isabel-Cameron County Port Lavaca Calhoun County Port Mansfield Charles R Johnson Presidio Presidio Lely International Quanah Quanah Municipal Refugio Rooke Field A-13
69 Table A-2: On-Airport from Texas Airports (cont.) Direct On-Airport Multiplier On-Airport On-Airport Roanoke Northwest Regional Robstown Nueces County Rockdale H H Coffield Regional Rockport Aransas County Rocksprings Edwards County Rockwall Ralph M Hall/Rockwall Municipal San Antonio Stinson Municipal San Marcos San Marcos Regional San Saba San Saba County Municipal Seminole Gaines County Seymour Seymour Municipal Sherman Sherman Municipal Sherman/Denison North Texas Regional/Perrin Field Sinton Alfred C 'Bubba' Thomas Slaton Slaton Municipal Smithville Smithville Crawford Municipal Snyder Winston Field Sonora Sonora Municipal Spearman Major Samuel B Cornelius Field Stamford Arledge Field Stephenville Stephenville Clark Regional Sulphur Springs Sulphur Springs Municipal Sunray Sunray Sweetwater Avenger Field Tahoka T-Bar Taylor Taylor Municipal Temple Draughon-Miller Central Texas Regional Terrell Terrell Municipal Throckmorton Throckmorton Municipal Tulia City of Tulia/Swisher County Municipal Uvalde Garner Field Van Horn Culberson County Vega Oldham County Vernon Wilbarger County Victoria Victoria Regional McGregor Mc Gregor Executive Waco TSTC Waco 1,134 1,961 3,095 Wellington Marian Airpark Weslaco Mid Valley Wharton Wharton Regional Wheeler Wheeler Municipal Wichita Falls Kickapoo Downtown A-14
70 Table A-2: On-Airport from Texas Airports (cont.) Direct On-Airport Multiplier On-Airport On-Airport Wills Point Van Zandt County Regional Wink Winkler County Winnie/Stowell Chambers County-Winnie Stowell Winnsboro Winnsboro Municipal Winters Winters Municipal Zapata Zapata County Other Airports General Aviation Airports 17,146 22,521 39,667 All Airports 129, , ,733 Source: CDM Smith and IMPLAN. A-15
71 Table A-3: Construction from Texas Airports Direct Construction Multiplier Construction Construction Commercial Service Airports Abilene Abilene Regional Amarillo Rick Husband Amarillo International Austin Austin-Bergstrom International Beaumont/Port Arthur Jack Brooks Regional Brownsville Brownsville/South Padre Island International College Station Easterwood Field Corpus Christi Corpus Christi International Dallas Dallas Love Field Dallas-Fort Worth Dallas/Fort Worth International 3,537 2,957 6,494 El Paso El Paso International Fort Hood (Killeen) Killeen-Fort Hood Regional Harlingen Valley International Houston George Bush Intercontinental/Houston ,288 Houston William P Hobby ,075 Laredo Laredo International Longview East Texas Regional Lubbock Lubbock Preston Smith International Mc Allen Mc Allen Miller International Midland Midland International Air and Space Port San Angelo San Angelo Regional/Mathis Field San Antonio San Antonio International Texarkana, AR Texarkana Regional Airport- Webb Field Tyler Tyler Pounds Regional Waco Waco Regional Wichita Falls Sheppard AFB/Wichita Falls Municipal Commercial Service Airports 7,660 6,412 14,072 General Aviation Airports Albany Albany Municipal Alice Alice International Alpine Alpine-Casparis Municipal Amarillo Tradewind Anahuac Chambers County Andrews Andrews County Angleton/Lake Jackson Texas Gulf Coast Regional A-16
72 Table A-3: Construction from Texas Airports (cont.) Direct Construction Multiplier Construction Construction Arlington Arlington Municipal Athens Athens Municipal Atlanta Hall-Miller Municipal Ballinger Bruce Field Bay City Bay City Regional Beaumont Beaumont Municipal Beeville Beeville Municipal Big Lake Reagan County Big Spring Big Spring Mc Mahon-Wrinkle Bonham Jones Field Borger Hutchinson County Bowie Bowie Municipal Brady Curtis Field Breckenridge Stephens County Brenham Brenham Municipal Bridgeport Bridgeport Municipal Brownfield Terry County Brownwood Brownwood Regional Bryan Coulter Field Burnet Burnet Municipal Kate Craddock Field Caddo Mills Caddo Mills Municipal Caldwell Caldwell Municipal Cameron Cameron Municipal Airpark Canadian Hemphill County Carrizo Springs Dimmit County Carthage Panola County-Sharpe Field Castroville Castroville Municipal Center Center Municipal Childress Childress Municipal Cisco Cisco Municipal Clarksville Clarksville/Red River County-J D Trissell Field Cleburne Cleburne Regional Cleveland Cleveland Municipal Clifton Clifton Municipal/Isenhower Field Coleman Coleman Municipal Colorado City Colorado City Columbus Robert R Wells Jr Comanche Comanche County-City Commerce Commerce Municipal Corsicana C David Campbell Field- Corsicana Municipal Cotulla Cotulla-La Salle County Crane Crane County Crockett Houston County A-17
73 Table A-3: Construction from Texas Airports (cont.) Direct Construction Multiplier Construction Construction Crosbyton Crosbyton Municipal Dalhart Dalhart Municipal Dallas Addison Dallas Dallas CBD Vertiport Dallas Dallas Executive McKinney McKinney National Decatur Decatur Municipal Del Rio Del Rio International Dell City Dell City Municipal Denton Denton Enterprise Denver City Denver City Desoto Desoto Heliport Devine Devine Municipal Dimmitt Dimmitt Municipal Dryden Terrell County Dublin Dublin Municipal Dumas Moore County Eagle Lake Eagle Lake Eagle Pass Maverick County Memorial International Eastland Eastland Municipal Edinburg South Texas International at Edinburg Edna Jackson County Ennis Ennis Municipal Fabens Fabens Falfurrias Brooks County Floydada Floydada Municipal Fort Stockton Fort Stockton-Pecos County Fort Worth Fort Worth Alliance Fort Worth Fort Worth Meacham International Fort Worth Fort Worth Spinks Fredericksburg Gillespie County Gainesville Gainesville Municipal Galveston Scholes International at Galveston Garland Garland/DFW Heloplex Gatesville Gatesville Municipal George West Live Oak County Georgetown Georgetown Municipal Giddings Giddings-Lee County Gilmer Fox Stephens Field-Gilmer Municipal Gladewater Gladewater Municipal Gonzales Roger M. Dreyer Memorial Graford Possum Kingdom A-18
74 Table A-3: Construction from Texas Airports (cont.) Direct Construction Multiplier Construction Construction Graham Graham Municipal Granbury Granbury Regional Grand Prairie Grand Prairie Municipal Greenville Majors Gruver Gruver Municipal Hallettsville Hallettsville Municipal Hamilton Hamilton Municipal Haskell Haskell Municipal Hearne Hearne Municipal Hebbronville Jim Hogg County Henderson Rusk County Hereford Hereford Municipal Hillsboro Hillsboro Municipal Hondo South Texas Regional at Hondo Houston Conroe-North Houston Regional Houston David Wayne Hooks Memorial Houston Ellington Field Houston Houston-Southwest Houston Pearland Regional Houston Sugar Land Regional Houston West Houston Huntsville Huntsville Municipal Ingleside McCampbell-Porter Jacksboro Jacksboro Municipal Jacksonville Cherokee County Jasper Jasper County-Bell Field Jayton Kent County Jefferson Cypress River Junction Kimble County Kenedy Karnes County Kerrville Kerrville Municipal/Louis Schreiner Field Killeen Skylark Field Kingsville Kleberg County Kirbyville Kirbyville Knox City Harrison Field of Knox City Kountze/Silsbee Hawthorne Field La Grange Fayette Regional Air Center La Porte La Porte Municipal Lago Vista Lago Vista TX-Rusty Allen Lamesa Lamesa Municipal Lampasas Lampasas Lancaster Lancaster Regional Levelland Levelland Municipal Liberty Liberty Municipal A-19
75 Table A-3: Construction from Texas Airports (cont.) Direct Construction Multiplier Construction Construction Littlefield Taylor Brown Municipal Livingston Livingston Municipal Llano Llano Municipal Lockhart Lockhart Municipal Lufkin Angelina County Madisonville Madisonville Municipal Marfa Marfa Municipal Marshall Harrison County Mason Mason County Mc Camey Upton County Mesquite Mesquite Metro Mexia Mexia-Limestone County Midland Midland Airpark Midlothian/Waxahachie Mid-Way Regional Mineola/Quitman Wood County Mineral Wells Mineral Wells Monahans Roy Hurd Memorial Mount Pleasant Mount Pleasant Regional Mount Vernon Franklin County Muleshoe Muleshoe Municipal Munday Munday Municipal Nacogdoches A L Mangham Jr. Regional Navasota Navasota Municipal New Braunfels New Braunfels Regional Odessa Odessa-Schlemeyer Field Olney Olney Municipal Orange Orange County Ozona Ozona Municipal Paducah Dan E Richards Municipal Palacios Palacios Municipal Palestine Palestine Municipal Pampa Perry Lefors Field Panhandle Panhandle-Carson County Paris Cox Field Pearsall Mc Kinley Field Pecos Pecos Municipal Perryton Perryton Ochiltree County Plains Yoakum County Plainview Hale County Pleasanton Pleasanton Municipal Port Aransas Mustang Beach Port Isabel Port Isabel-Cameron County Port Lavaca Calhoun County Port Mansfield Charles R Johnson Presidio Presidio Lely International Quanah Quanah Municipal Refugio Rooke Field A-20
76 Table A-3: Construction from Texas Airports (cont.) Direct Construction Multiplier Construction Construction Roanoke Northwest Regional Robstown Nueces County Rockdale H H Coffield Regional Rockport Aransas County Rocksprings Edwards County Rockwall Ralph M Hall/Rockwall Municipal San Antonio Stinson Municipal San Marcos San Marcos Regional San Saba San Saba County Municipal Seminole Gaines County Seymour Seymour Municipal Sherman Sherman Municipal Sherman/Denison North Texas Regional/Perrin Field Sinton Alfred C 'Bubba' Thomas Slaton Slaton Municipal Smithville Smithville Crawford Municipal Snyder Winston Field Sonora Sonora Municipal Spearman Major Samuel B Cornelius Field Stamford Arledge Field Stephenville Stephenville Clark Regional Sulphur Springs Sulphur Springs Municipal Sunray Sunray Sweetwater Avenger Field Tahoka T-Bar Taylor Taylor Municipal Temple Draughon-Miller Central Texas Regional Terrell Terrell Municipal Throckmorton Throckmorton Municipal Tulia City of Tulia/Swisher County Municipal Uvalde Garner Field Van Horn Culberson County Vega Oldham County Vernon Wilbarger County Victoria Victoria Regional McGregor Mc Gregor Executive Waco TSTC Waco Wellington Marian Airpark Weslaco Mid Valley Wharton Wharton Regional Wheeler Wheeler Municipal Wichita Falls Kickapoo Downtown A-21
77 Table A-3: Construction from Texas Airports (cont.) Direct Construction Multiplier Construction Construction Wills Point Van Zandt County Regional Wink Winkler County Winnie/Stowell Chambers County-Winnie Stowell Winnsboro Winnsboro Municipal Winters Winters Municipal Zapata Zapata County Other Airports General Aviation Airports 1,978 1,656 3,634 All Airports 9,638 8,068 17,706 Source: CDM Smith and IMPLAN. A-22
78 Table A-4: Commercial Service Visitor-Related from Texas Airports Direct CS Visitor-Related Multiplier CS Visitor-Related CS Visitor-Related Commercial Service Airports Abilene Abilene Regional Amarillo Rick Husband Amarillo International 4,924 2,050 6,974 Austin Austin-Bergstrom International 41,263 17,176 58,439 Beaumont/Port Arthur Jack Brooks Regional Brownsville Brownsville/South Padre Island International College Station Easterwood Field Corpus Christi Corpus Christi International 4,498 1,872 6,370 Dallas Dallas Love Field 30,820 12,829 43,649 Dallas-Fort Worth Dallas/Fort Worth International 112,346 46, ,112 El Paso El Paso International 11,839 4,928 16,767 Fort Hood (Killeen) Killeen-Fort Hood Regional ,224 Harlingen Valley International 2, ,120 Houston George Bush Intercontinental/Houston 65,777 27,381 93,158 Houston William P Hobby 25,217 10,496 35,713 Laredo Laredo International Longview East Texas Regional Lubbock Lubbock Preston Smith International 3,263 1,358 4,621 Mc Allen Mc Allen Miller International 4,334 1,804 6,138 Midland Midland International Air and Space Port 5,594 2,328 7,922 San Angelo San Angelo Regional/Mathis Field San Antonio San Antonio International 28,851 12,009 40,860 Texarkana, AR Texarkana Regional Airport- Webb Field Tyler Tyler Pounds Regional Waco Waco Regional Wichita Falls Sheppard AFB/Wichita Falls Municipal Commercial Service Airports 345, , ,324 Source: CDM Smith and IMPLAN. A-23
79 Table A-5: General Aviation Visitor-Related from Texas Airports Direct GA Visitor-Related Multiplier GA Visitor-Related GA Visitor-Related Commercial Service Airports Abilene Abilene Regional Amarillo Rick Husband Amarillo International Austin Austin-Bergstrom International Beaumont/Port Arthur Jack Brooks Regional Brownsville Brownsville/South Padre Island International College Station Easterwood Field Corpus Christi Corpus Christi International Dallas Dallas Love Field Dallas-Fort Worth Dallas/Fort Worth International El Paso El Paso International Fort Hood (Killeen) Killeen-Fort Hood Regional Harlingen Valley International Houston George Bush Intercontinental/Houston Houston William P Hobby Laredo Laredo International Longview East Texas Regional Lubbock Lubbock Preston Smith International Mc Allen Mc Allen Miller International Midland Midland International Air and Space Port San Angelo San Angelo Regional/Mathis Field San Antonio San Antonio International Texarkana, AR Texarkana Regional Airport-Webb Field Tyler Tyler Pounds Regional Waco Waco Regional Wichita Falls Sheppard AFB/Wichita Falls Municipal Commercial Service Airports 2,334 1,070 3,404 General Aviation Airports Albany Albany Municipal Alice Alice International Alpine Alpine-Casparis Municipal Amarillo Tradewind A-24
80 Table A-5: General Aviation Visitor-Related from Texas Airports (cont.) Direct GA Visitor-Related Multiplier GA Visitor-Related GA Visitor-Related Anahuac Chambers County Andrews Andrews County Angleton/Lake Jackson Texas Gulf Coast Regional Arlington Arlington Municipal Athens Athens Municipal Atlanta Hall-Miller Municipal Ballinger Bruce Field Bay City Bay City Regional Beaumont Beaumont Municipal Beeville Beeville Municipal Big Lake Reagan County Big Spring Big Spring Mc Mahon- Wrinkle Bonham Jones Field Borger Hutchinson County Bowie Bowie Municipal Brady Curtis Field Breckenridge Stephens County Brenham Brenham Municipal Bridgeport Bridgeport Municipal Brownfield Terry County Brownwood Brownwood Regional Bryan Coulter Field Burnet Burnet Municipal Kate Craddock Field Caddo Mills Caddo Mills Municipal Caldwell Caldwell Municipal Cameron Cameron Municipal Airpark Canadian Hemphill County Carrizo Springs Dimmit County Carthage Panola County-Sharpe Field Castroville Castroville Municipal Center Center Municipal Childress Childress Municipal Cisco Cisco Municipal Clarksville Clarksville/Red River County-J D Trissell Field Cleburne Cleburne Regional Cleveland Cleveland Municipal Clifton Clifton Municipal/Isenhower Field Coleman Coleman Municipal Colorado City Colorado City Columbus Robert R Wells Jr A-25
81 Table A-5: General Aviation Visitor-Related from Texas Airports (cont.) Direct GA Visitor-Related Multiplier GA Visitor-Related GA Visitor-Related Comanche Comanche County-City Commerce Commerce Municipal Corsicana C David Campbell Field- Corsicana Municipal Cotulla Cotulla-La Salle County Crane Crane County Crockett Houston County Crosbyton Crosbyton Municipal Dalhart Dalhart Municipal Dallas Addison Dallas Dallas CBD Vertiport Dallas Dallas Executive McKinney McKinney National Decatur Decatur Municipal Del Rio Del Rio International Dell City Dell City Municipal Denton Denton Enterprise Denver City Denver City Desoto Desoto Heliport Devine Devine Municipal Dimmitt Dimmitt Municipal Dryden Terrell County Dublin Dublin Municipal Dumas Moore County Eagle Lake Eagle Lake Eagle Pass Maverick County Memorial International Eastland Eastland Municipal Edinburg South Texas International at Edinburg Edna Jackson County Ennis Ennis Municipal Fabens Fabens Falfurrias Brooks County Floydada Floydada Municipal Fort Stockton Fort Stockton-Pecos County Fort Worth Fort Worth Alliance Fort Worth Fort Worth Meacham International Fort Worth Fort Worth Spinks Fredericksburg Gillespie County Gainesville Gainesville Municipal Galveston Scholes International at Galveston Garland Garland/DFW Heloplex Gatesville Gatesville Municipal A-26
82 Table A-5: General Aviation Visitor-Related from Texas Airports (cont.) Direct GA Visitor-Related Multiplier GA Visitor-Related GA Visitor-Related George West Live Oak County Georgetown Georgetown Municipal Giddings Giddings-Lee County Gilmer Fox Stephens Field-Gilmer Municipal Gladewater Gladewater Municipal Gonzales Roger M. Dreyer Memorial Graford Possum Kingdom Graham Graham Municipal Granbury Granbury Regional Grand Prairie Grand Prairie Municipal Greenville Majors Gruver Gruver Municipal Hallettsville Hallettsville Municipal Hamilton Hamilton Municipal Haskell Haskell Municipal Hearne Hearne Municipal Hebbronville Jim Hogg County Henderson Rusk County Hereford Hereford Municipal Hillsboro Hillsboro Municipal Hondo South Texas Regional at Hondo Houston Conroe-North Houston Regional Houston David Wayne Hooks Memorial Houston Ellington Field Houston Houston-Southwest Houston Pearland Regional Houston Sugar Land Regional Houston West Houston Huntsville Huntsville Municipal Ingleside McCampbell-Porter Jacksboro Jacksboro Municipal Jacksonville Cherokee County Jasper Jasper County-Bell Field Jayton Kent County Jefferson Cypress River Junction Kimble County Kenedy Karnes County Kerrville Kerrville Municipal/Louis Schreiner Field Killeen Skylark Field Kingsville Kleberg County Kirbyville Kirbyville A-27
83 Table A-5: General Aviation Visitor-Related from Texas Airports (cont.) Direct GA Visitor-Related Multiplier GA Visitor-Related GA Visitor-Related Knox City Harrison Field of Knox City Kountze/Silsbee Hawthorne Field La Grange Fayette Regional Air Center La Porte La Porte Municipal Lago Vista Lago Vista TX-Rusty Allen Lamesa Lamesa Municipal Lampasas Lampasas Lancaster Lancaster Regional Levelland Levelland Municipal Liberty Liberty Municipal Littlefield Taylor Brown Municipal Livingston Livingston Municipal Llano Llano Municipal Lockhart Lockhart Municipal Lufkin Angelina County Madisonville Madisonville Municipal Marfa Marfa Municipal Marshall Harrison County Mason Mason County Mc Camey Upton County Mesquite Mesquite Metro Mexia Mexia-Limestone County Midland Midland Airpark Midlothian/Waxahachie Mid-Way Regional Mineola/Quitman Wood County Mineral Wells Mineral Wells Monahans Roy Hurd Memorial Mount Pleasant Mount Pleasant Regional Mount Vernon Franklin County Muleshoe Muleshoe Municipal Munday Munday Municipal Nacogdoches A L Mangham Jr. Regional Navasota Navasota Municipal New Braunfels New Braunfels Regional Odessa Odessa-Schlemeyer Field Olney Olney Municipal Orange Orange County Ozona Ozona Municipal Paducah Dan E Richards Municipal Palacios Palacios Municipal Palestine Palestine Municipal Pampa Perry Lefors Field Panhandle Panhandle-Carson County Paris Cox Field Pearsall Mc Kinley Field Pecos Pecos Municipal A-28
84 Table A-5: General Aviation Visitor-Related from Texas Airports (cont.) Direct GA Visitor-Related Multiplier GA Visitor-Related GA Visitor-Related Perryton Perryton Ochiltree County Plains Yoakum County Plainview Hale County Pleasanton Pleasanton Municipal Port Aransas Mustang Beach Port Isabel Port Isabel-Cameron County Port Lavaca Calhoun County Port Mansfield Charles R Johnson Presidio Presidio Lely International Quanah Quanah Municipal Refugio Rooke Field Roanoke Northwest Regional Robstown Nueces County Rockdale H H Coffield Regional Rockport Aransas County Rocksprings Edwards County Rockwall Ralph M Hall/Rockwall Municipal San Antonio Stinson Municipal San Marcos San Marcos Regional San Saba San Saba County Municipal Seminole Gaines County Seymour Seymour Municipal Sherman Sherman Municipal Sherman/Denison North Texas Regional/Perrin Field Sinton Alfred C 'Bubba' Thomas Slaton Slaton Municipal Smithville Smithville Crawford Municipal Snyder Winston Field Sonora Sonora Municipal Spearman Major Samuel B Cornelius Field Stamford Arledge Field Stephenville Stephenville Clark Regional Sulphur Springs Sulphur Springs Municipal Sunray Sunray Sweetwater Avenger Field Tahoka T-Bar Taylor Taylor Municipal Temple Draughon-Miller Central Texas Regional Terrell Terrell Municipal A-29
85 Table A-5: General Aviation Visitor-Related from Texas Airports (cont.) Direct GA Visitor-Related Multiplier GA Visitor-Related GA Visitor-Related Throckmorton Throckmorton Municipal Tulia City of Tulia/Swisher County Municipal Uvalde Garner Field Van Horn Culberson County Vega Oldham County Vernon Wilbarger County Victoria Victoria Regional McGregor Mc Gregor Executive Waco TSTC Waco Wellington Marian Airpark Weslaco Mid Valley Wharton Wharton Regional Wheeler Wheeler Municipal Wichita Falls Kickapoo Downtown Wills Point Van Zandt County Regional Wink Winkler County Winnie/Stowell Chambers County-Winnie Stowell Winnsboro Winnsboro Municipal Winters Winters Municipal Zapata Zapata County Other Airports General Aviation Airports 3,287 1,501 4,788 All Airports 5,621 2,571 8,192 Source: CDM Smith and IMPLAN. A-30
86 Table A-6: from Texas Airports Direct Multiplier Commercial Service Airports Abilene Abilene Regional 1,307 1,342 2,649 Amarillo Rick Husband Amarillo International 6,669 4,712 11,381 Austin Austin-Bergstrom International 49,319 24,829 74,148 Beaumont/Port Arthur Jack Brooks Regional Brownsville Brownsville/South Padre Island International 1, ,800 College Station Easterwood Field ,333 Corpus Christi Corpus Christi International 5,739 2,954 8,693 Dallas Dallas Love Field 39,490 21,105 60,595 Dallas-Fort Worth Dallas/Fort Worth International 155,469 88, ,506 El Paso El Paso International 15,811 8,563 24,374 Fort Hood (Killeen) Killeen-Fort Hood Regional 1, ,557 Harlingen Valley International 2,806 1,734 4,540 Houston George Bush Intercontinental/Houston 100,488 60, ,366 Houston William P Hobby 32,971 17,837 50,808 Laredo Laredo International ,667 Longview East Texas Regional Lubbock Lubbock Preston Smith International 4,023 2,180 6,203 Mc Allen Mc Allen Miller International 4,915 2,312 7,227 Midland Midland International Air and Space Port 6,577 3,556 10,133 San Angelo San Angelo Regional/Mathis Field ,218 San Antonio San Antonio International 34,884 17,709 52,593 Texarkana, AR Texarkana Regional Airport-Webb Field Tyler Tyler Pounds Regional ,353 Waco Waco Regional ,179 Wichita Falls Sheppard AFB/Wichita Falls Municipal Commercial Service Airports 467, , ,866 General Aviation Airports Albany Albany Municipal Alice Alice International Alpine Alpine-Casparis Municipal Amarillo Tradewind Anahuac Chambers County Andrews Andrews County A-31
87 Table A-6: from Texas Airports (cont.) Direct Multiplier Angleton/Lake Jackson Texas Gulf Coast Regional Arlington Arlington Municipal Athens Athens Municipal Atlanta Hall-Miller Municipal Ballinger Bruce Field Bay City Bay City Regional Beaumont Beaumont Municipal Beeville Beeville Municipal Big Lake Reagan County Big Spring Big Spring Mc Mahon- Wrinkle Bonham Jones Field Borger Hutchinson County Bowie Bowie Municipal Brady Curtis Field Breckenridge Stephens County Brenham Brenham Municipal Bridgeport Bridgeport Municipal Brownfield Terry County Brownwood Brownwood Regional Bryan Coulter Field Burnet Burnet Municipal Kate Craddock Field Caddo Mills Caddo Mills Municipal Caldwell Caldwell Municipal Cameron Cameron Municipal Airpark Canadian Hemphill County Carrizo Springs Dimmit County Carthage Panola County-Sharpe Field Castroville Castroville Municipal Center Center Municipal Childress Childress Municipal Cisco Cisco Municipal Clarksville Clarksville/Red River County-J D Trissell Field Cleburne Cleburne Regional Cleveland Cleveland Municipal Clifton Clifton Municipal/Isenhower Field Coleman Coleman Municipal Colorado City Colorado City Columbus Robert R Wells Jr Comanche Comanche County-City Commerce Commerce Municipal Corsicana C David Campbell Field- Corsicana Municipal A-32
88 Table A-6: from Texas Airports (cont.) Direct Multiplier Cotulla Cotulla-La Salle County Crane Crane County Crockett Houston County Crosbyton Crosbyton Municipal Dalhart Dalhart Municipal Dallas Addison 1,331 1,881 3,212 Dallas Dallas CBD Vertiport Dallas Dallas Executive McKinney McKinney National Decatur Decatur Municipal Del Rio Del Rio International Dell City Dell City Municipal Denton Denton Enterprise ,435 Denver City Denver City Desoto Desoto Heliport Devine Devine Municipal Dimmitt Dimmitt Municipal Dryden Terrell County Dublin Dublin Municipal Dumas Moore County Eagle Lake Eagle Lake Eagle Pass Maverick County Memorial International Eastland Eastland Municipal Edinburg South Texas International at Edinburg Edna Jackson County Ennis Ennis Municipal Fabens Fabens Falfurrias Brooks County Floydada Floydada Municipal Fort Stockton Fort Stockton-Pecos County Fort Worth Fort Worth Alliance 1,342 2,068 3,410 Fort Worth Fort Worth Meacham International 893 1,269 2,162 Fort Worth Fort Worth Spinks Fredericksburg Gillespie County Gainesville Gainesville Municipal 822 1,469 2,291 Galveston Scholes International at Galveston Garland Garland/DFW Heloplex Gatesville Gatesville Municipal George West Live Oak County Georgetown Georgetown Municipal Giddings Giddings-Lee County Gilmer Fox Stephens Field-Gilmer Municipal A-33
89 Table A-6: from Texas Airports (cont.) Direct Multiplier Gladewater Gladewater Municipal Gonzales Roger M. Dreyer Memorial Graford Possum Kingdom Graham Graham Municipal Granbury Granbury Regional Grand Prairie Grand Prairie Municipal 804 1,380 2,184 Greenville Majors 5,263 3,852 9,115 Gruver Gruver Municipal Hallettsville Hallettsville Municipal Hamilton Hamilton Municipal Haskell Haskell Municipal Hearne Hearne Municipal Hebbronville Jim Hogg County Henderson Rusk County Hereford Hereford Municipal Hillsboro Hillsboro Municipal Hondo South Texas Regional at Hondo Houston Conroe-North Houston Regional ,170 Houston David Wayne Hooks Memorial Houston Ellington Field 1,498 1,101 2,599 Houston Houston-Southwest Houston Pearland Regional Houston Sugar Land Regional Houston West Houston Huntsville Huntsville Municipal Ingleside McCampbell-Porter Jacksboro Jacksboro Municipal Jacksonville Cherokee County Jasper Jasper County-Bell Field Jayton Kent County Jefferson Cypress River Junction Kimble County Kenedy Karnes County Kerrville Kerrville Municipal/Louis Schreiner Field Killeen Skylark Field Kingsville Kleberg County Kirbyville Kirbyville Knox City Harrison Field of Knox City Kountze/Silsbee Hawthorne Field La Grange Fayette Regional Air Center La Porte La Porte Municipal Lago Vista Lago Vista TX-Rusty Allen Lamesa Lamesa Municipal A-34
90 Table A-6: from Texas Airports (cont.) Direct Multiplier Lampasas Lampasas Lancaster Lancaster Regional Levelland Levelland Municipal Liberty Liberty Municipal Littlefield Taylor Brown Municipal Livingston Livingston Municipal Llano Llano Municipal Lockhart Lockhart Municipal Lufkin Angelina County Madisonville Madisonville Municipal Marfa Marfa Municipal Marshall Harrison County Mason Mason County Mc Camey Upton County Mesquite Mesquite Metro Mexia Mexia-Limestone County Midland Midland Airpark Midlothian/Waxahachie Mid-Way Regional Mineola/Quitman Wood County Mineral Wells Mineral Wells Monahans Roy Hurd Memorial Mount Pleasant Mount Pleasant Regional Mount Vernon Franklin County Muleshoe Muleshoe Municipal Munday Munday Municipal Nacogdoches A L Mangham Jr. Regional Navasota Navasota Municipal New Braunfels New Braunfels Regional Odessa Odessa-Schlemeyer Field Olney Olney Municipal Orange Orange County Ozona Ozona Municipal Paducah Dan E Richards Municipal Palacios Palacios Municipal Palestine Palestine Municipal Pampa Perry Lefors Field Panhandle Panhandle-Carson County Paris Cox Field Pearsall Mc Kinley Field Pecos Pecos Municipal Perryton Perryton Ochiltree County Plains Yoakum County Plainview Hale County Pleasanton Pleasanton Municipal Port Aransas Mustang Beach Port Isabel Port Isabel-Cameron County Port Lavaca Calhoun County A-35
91 Table A-6: from Texas Airports (cont.) Direct Multiplier Port Mansfield Charles R Johnson Presidio Presidio Lely International Quanah Quanah Municipal Refugio Rooke Field Roanoke Northwest Regional Robstown Nueces County Rockdale H H Coffield Regional Rockport Aransas County Rocksprings Edwards County Rockwall Ralph M Hall/Rockwall Municipal San Antonio Stinson Municipal San Marcos San Marcos Regional San Saba San Saba County Municipal Seminole Gaines County Seymour Seymour Municipal Sherman Sherman Municipal Sherman/Denison North Texas Regional/Perrin Field Sinton Alfred C 'Bubba' Thomas Slaton Slaton Municipal Smithville Smithville Crawford Municipal Snyder Winston Field Sonora Sonora Municipal Spearman Major Samuel B Cornelius Field Stamford Arledge Field Stephenville Stephenville Clark Regional Sulphur Springs Sulphur Springs Municipal Sunray Sunray Sweetwater Avenger Field Tahoka T-Bar Taylor Taylor Municipal Temple Draughon-Miller Central Texas Regional Terrell Terrell Municipal Throckmorton Throckmorton Municipal Tulia City of Tulia/Swisher County Municipal Uvalde Garner Field Van Horn Culberson County Vega Oldham County Vernon Wilbarger County Victoria Victoria Regional McGregor Mc Gregor Executive Waco TSTC Waco 1,292 2,066 3,358 Wellington Marian Airpark A-36
92 Table A-6: from Texas Airports (cont.) Direct Multiplier Weslaco Mid Valley Wharton Wharton Regional Wheeler Wheeler Municipal Wichita Falls Kickapoo Downtown Wills Point Van Zandt County Regional Wink Winkler County Winnie/Stowell Chambers County-Winnie Stowell Winnsboro Winnsboro Municipal Winters Winters Municipal Zapata Zapata County Other Airports General Aviation Airports 22,411 25,678 48,089 All Airports 490, , ,955 Source: CDM Smith and IMPLAN. A-37
93 Table A-7: On-Airport from Texas Airports Direct On-Airport Multiplier On-Airport On-Airport Commercial Service Airports Abilene Abilene Regional $43,938,000 $37,069,000 $81,007,000 Amarillo Rick Husband Amarillo International $108,929,000 $93,649,000 $202,578,000 Austin Austin-Bergstrom International $436,451,000 $296,180,000 $732,631,000 Beaumont/Port Arthur Jack Brooks Regional $4,047,000 $2,304,000 $6,351,000 Brownsville Brownsville/South Padre Island International $15,620,000 $11,878,000 $27,498,000 College Station Easterwood Field $6,212,000 $4,885,000 $11,097,000 Corpus Christi Corpus Christi International $42,743,000 $25,929,000 $68,672,000 Dallas Dallas Love Field $358,460,000 $243,255,000 $601,715,000 Dallas-Fort Worth Dallas/Fort Worth International $2,583,586,000 $1,753,249,000 $4,336,835,000 El Paso El Paso International $121,387,000 $84,713,000 $206,100,000 Fort Hood (Killeen) Killeen-Fort Hood Regional $4,860,000 $3,197,000 $8,057,000 Harlingen Valley International $27,620,000 $22,699,000 $50,319,000 Houston George Bush Intercontinental/Houston $2,620,521,000 $1,778,313,000 $4,398,834,000 Houston William P Hobby $491,434,000 $333,492,000 $824,926,000 Laredo Laredo International $14,399,000 $10,342,000 $24,741,000 Longview East Texas Regional $12,586,000 $9,213,000 $21,799,000 Lubbock Lubbock Preston Smith International $25,583,000 $19,125,000 $44,708,000 Mc Allen Mc Allen Miller International $22,712,000 $15,648,000 $38,360,000 Midland Midland International Air and Space Port $48,600,000 $38,568,000 $87,168,000 San Angelo San Angelo Regional/Mathis Field $13,403,000 $8,573,000 $21,976,000 San Antonio San Antonio International $297,334,000 $201,774,000 $499,108,000 Texarkana, AR Texarkana Regional Airport-Webb Field $4,820,000 $3,773,000 $8,593,000 Tyler Tyler Pounds Regional $14,973,000 $11,755,000 $26,728,000 Waco Waco Regional $14,047,000 $10,370,000 $24,417,000 Wichita Falls Sheppard AFB/Wichita Falls Municipal $5,546,000 $3,464,000 $9,010,000 Commercial Service Airports $7,339,811,000 $5,023,417,000 $12,363,228,000 General Aviation Airports Albany Albany Municipal $54,000 $36,000 $90,000 Alice Alice International $204,000 $173,000 $377,000 Alpine Alpine-Casparis Municipal $2,344,000 $1,342,000 $3,686,000 Amarillo Tradewind $313,000 $159,000 $472,000 A-38
94 Table A-7: On-Airport from Texas Airports (cont.) Direct Multiplier On-Airport On-Airport On-Airport Anahuac Chambers County $41,000 $31,000 $72,000 Andrews Andrews County $217,000 $159,000 $376,000 Angleton/Lake Jackson Texas Gulf Coast Regional $1,951,000 $1,354,000 $3,305,000 Arlington Arlington Municipal $28,632,000 $17,634,000 $46,266,000 Athens Athens Municipal $230,000 $202,000 $432,000 Atlanta Hall-Miller Municipal Undisclosed Undisclosed Undisclosed Ballinger Bruce Field Undisclosed Undisclosed Undisclosed Bay City Bay City Regional $408,000 $321,000 $729,000 Beaumont Beaumont Municipal $235,000 $190,000 $425,000 Beeville Beeville Municipal $60,000 $47,000 $107,000 Big Lake Reagan County Undisclosed Undisclosed Undisclosed Big Spring Big Spring Mc Mahon- Wrinkle $2,050,000 $1,663,000 $3,713,000 Bonham Jones Field $159,000 $144,000 $303,000 Borger Hutchinson County $1,683,000 $1,449,000 $3,132,000 Bowie Bowie Municipal $79,000 $40,000 $119,000 Brady Curtis Field $187,000 $125,000 $312,000 Breckenridge Stephens County $1,452,000 $1,310,000 $2,762,000 Brenham Brenham Municipal $745,000 $666,000 $1,411,000 Bridgeport Bridgeport Municipal $149,000 $128,000 $277,000 Brownfield Terry County $119,000 $103,000 $222,000 Brownwood Brownwood Regional $1,135,000 $911,000 $2,046,000 Bryan Coulter Field $1,591,000 $1,391,000 $2,982,000 Burnet Burnet Municipal Kate Craddock Field $510,000 $442,000 $952,000 Caddo Mills Caddo Mills Municipal $167,000 $142,000 $309,000 Caldwell Caldwell Municipal $60,000 $47,000 $107,000 Cameron Cameron Municipal Airpark $0 $0 $0 Canadian Hemphill County $130,000 $111,000 $241,000 Carrizo Springs Dimmit County $853,000 $765,000 $1,618,000 Carthage Panola County-Sharpe Field Undisclosed Undisclosed Undisclosed Castroville Castroville Municipal $407,000 $337,000 $744,000 Center Center Municipal Undisclosed Undisclosed Undisclosed Childress Childress Municipal $544,000 $482,000 $1,026,000 Cisco Cisco Municipal Undisclosed Undisclosed Undisclosed Clarksville Clarksville/Red River County-J D Trissell Field Undisclosed Undisclosed Undisclosed Cleburne Cleburne Regional $1,161,000 $973,000 $2,134,000 Cleveland Cleveland Municipal $77,000 $56,000 $133,000 Clifton Clifton Municipal/Isenhower Field $171,000 $150,000 $321,000 Coleman Coleman Municipal $0 $0 $0 Colorado City Colorado City $67,000 $62,000 $129,000 Columbus Robert R Wells Jr. $6,000 $3,000 $9,000 A-39
95 Table A-7: On-Airport from Texas Airports (cont.) Direct On-Airport Multiplier On-Airport On-Airport Comanche Comanche County-City Undisclosed Undisclosed Undisclosed Commerce Commerce Municipal $60,000 $47,000 $107,000 Corsicana C David Campbell Field- Corsicana Municipal $149,000 $135,000 $284,000 Cotulla Cotulla-La Salle County $160,000 $138,000 $298,000 Crane Crane County $0 $0 $0 Crockett Houston County Undisclosed Undisclosed Undisclosed Crosbyton Crosbyton Municipal $152,000 $139,000 $291,000 Dalhart Dalhart Municipal $457,000 $381,000 $838,000 Dallas Addison $74,023,000 $61,259,000 $135,282,000 Dallas Dallas CBD Vertiport $0 $0 $0 Dallas Dallas Executive $5,214,000 $3,812,000 $9,026,000 McKinney McKinney National $30,319,000 $26,788,000 $57,107,000 Decatur Decatur Municipal $1,254,000 $1,132,000 $2,386,000 Del Rio Del Rio International $3,178,000 $2,109,000 $5,287,000 Dell City Dell City Municipal Undisclosed Undisclosed Undisclosed Denton Denton Enterprise $19,074,000 $17,143,000 $36,217,000 Denver City Denver City $0 $0 $0 Desoto Desoto Heliport $924,000 $825,000 $1,749,000 Devine Devine Municipal $395,000 $356,000 $751,000 Dimmitt Dimmitt Municipal $45,000 $34,000 $79,000 Dryden Terrell County $57,000 $45,000 $102,000 Dublin Dublin Municipal $60,000 $47,000 $107,000 Dumas Moore County $466,000 $330,000 $796,000 Eagle Lake Eagle Lake $552,000 $478,000 $1,030,000 Eagle Pass Maverick County Memorial International $115,000 $84,000 $199,000 Eastland Eastland Municipal $429,000 $391,000 $820,000 Edinburg South Texas International at Edinburg $1,560,000 $796,000 $2,356,000 Edna Jackson County $111,000 $73,000 $184,000 Ennis Ennis Municipal $203,000 $179,000 $382,000 Fabens Fabens $77,000 $61,000 $138,000 Falfurrias Brooks County $19,000 $10,000 $29,000 Floydada Floydada Municipal $224,000 $203,000 $427,000 Fort Stockton Fort Stockton-Pecos County $134,000 $122,000 $256,000 Fort Worth Fort Worth Alliance $71,553,000 $63,182,000 $134,735,000 Fort Worth Fort Worth Meacham International $46,388,000 $41,159,000 $87,547,000 Fort Worth Fort Worth Spinks $5,585,000 $4,952,000 $10,537,000 Fredericksburg Gillespie County $1,815,000 $1,492,000 $3,307,000 Gainesville Gainesville Municipal $31,433,000 $28,594,000 $60,027,000 Galveston Scholes International at Galveston $7,441,000 $5,790,000 $13,231,000 Garland Garland/DFW Heloplex $2,002,000 $1,785,000 $3,787,000 Gatesville Gatesville Municipal $128,000 $116,000 $244,000 A-40
96 Table A-7: On-Airport from Texas Airports (cont.) Direct Multiplier On-Airport On-Airport On-Airport George West Live Oak County Undisclosed Undisclosed Undisclosed Georgetown Georgetown Municipal $5,180,000 $4,592,000 $9,772,000 Giddings Giddings-Lee County $76,000 $69,000 $145,000 Gilmer Fox Stephens Field-Gilmer Municipal $206,000 $189,000 $395,000 Gladewater Gladewater Municipal $177,000 $134,000 $311,000 Gonzales Roger M. Dreyer Memorial Undisclosed Undisclosed Undisclosed Graford Possum Kingdom $0 $0 $0 Graham Graham Municipal $358,000 $297,000 $655,000 Granbury Granbury Regional $2,380,000 $2,083,000 $4,463,000 Grand Prairie Grand Prairie Municipal $53,200,000 $48,290,000 $101,490,000 Greenville Majors $627,087,000 $320,597,000 $947,684,000 Gruver Gruver Municipal $166,000 $152,000 $318,000 Hallettsville Hallettsville Municipal Undisclosed Undisclosed Undisclosed Hamilton Hamilton Municipal Undisclosed Undisclosed Undisclosed Haskell Haskell Municipal $105,000 $87,000 $192,000 Hearne Hearne Municipal $128,000 $110,000 $238,000 Hebbronville Jim Hogg County Undisclosed Undisclosed Undisclosed Henderson Rusk County $102,000 $56,000 $158,000 Hereford Hereford Municipal $310,000 $263,000 $573,000 Hillsboro Hillsboro Municipal $370,000 $309,000 $679,000 Hondo South Texas Regional at Hondo $1,872,000 $1,612,000 $3,484,000 Houston Conroe-North Houston Regional $24,853,000 $16,062,000 $40,915,000 Houston David Wayne Hooks Memorial $12,987,000 $10,147,000 $23,134,000 Houston Ellington Field $73,391,000 $37,931,000 $111,322,000 Houston Houston-Southwest $1,863,000 $1,520,000 $3,383,000 Houston Pearland Regional $2,035,000 $1,774,000 $3,809,000 Houston Sugar Land Regional $14,250,000 $11,921,000 $26,171,000 Houston West Houston $2,800,000 $1,749,000 $4,549,000 Huntsville Huntsville Municipal $149,000 $130,000 $279,000 Ingleside McCampbell-Porter $768,000 $657,000 $1,425,000 Jacksboro Jacksboro Municipal $55,000 $43,000 $98,000 Jacksonville Cherokee County $1,861,000 $1,664,000 $3,525,000 Jasper Jasper County-Bell Field $60,000 $47,000 $107,000 Jayton Kent County $0 $0 $0 Jefferson Cypress River Undisclosed Undisclosed Undisclosed Junction Kimble County $53,000 $42,000 $95,000 Kenedy Karnes County $51,000 $26,000 $77,000 Kerrville Kerrville Municipal/Louis Schreiner Field $6,367,000 $5,742,000 $12,109,000 Killeen Skylark Field $575,000 $454,000 $1,029,000 Kingsville Kleberg County $184,000 $161,000 $345,000 Kirbyville Kirbyville Undisclosed Undisclosed Undisclosed A-41
97 Table A-7: On-Airport from Texas Airports (cont.) Direct On-Airport Multiplier On-Airport On-Airport Knox City Harrison Field of Knox City $111,000 $101,000 $212,000 Kountze/Silsbee Hawthorne Field $64,000 $58,000 $122,000 La Grange Fayette Regional Air Center $241,000 $200,000 $441,000 La Porte La Porte Municipal $954,000 $861,000 $1,815,000 Lago Vista Lago Vista TX-Rusty Allen $389,000 $334,000 $723,000 Lamesa Lamesa Municipal $468,000 $426,000 $894,000 Lampasas Lampasas $0 $0 $0 Lancaster Lancaster Regional $957,000 $758,000 $1,715,000 Levelland Levelland Municipal $594,000 $492,000 $1,086,000 Liberty Liberty Municipal Undisclosed Undisclosed Undisclosed Littlefield Taylor Brown Municipal $157,000 $135,000 $292,000 Livingston Livingston Municipal $60,000 $47,000 $107,000 Llano Llano Municipal $101,000 $73,000 $174,000 Lockhart Lockhart Municipal $141,000 $108,000 $249,000 Lufkin Angelina County $3,095,000 $2,554,000 $5,649,000 Madisonville Madisonville Municipal $136,000 $117,000 $253,000 Marfa Marfa Municipal $198,000 $140,000 $338,000 Marshall Harrison County $162,000 $147,000 $309,000 Mason Mason County $0 $0 $0 Mc Camey Upton County Undisclosed Undisclosed Undisclosed Mesquite Mesquite Metro $2,878,000 $2,156,000 $5,034,000 Mexia Mexia-Limestone County $1,179,000 $1,075,000 $2,254,000 Midland Midland Airpark $1,594,000 $1,452,000 $3,046,000 Midlothian/Waxahachie Mid-Way Regional $2,258,000 $1,943,000 $4,201,000 Mineola/Quitman Wood County $81,000 $67,000 $148,000 Mineral Wells Mineral Wells $12,065,000 $10,898,000 $22,963,000 Monahans Roy Hurd Memorial $498,000 $455,000 $953,000 Mount Pleasant Mount Pleasant Regional $691,000 $487,000 $1,178,000 Mount Vernon Franklin County $0 $0 $0 Muleshoe Muleshoe Municipal Undisclosed Undisclosed Undisclosed Munday Munday Municipal $83,000 $76,000 $159,000 Nacogdoches A L Mangham Jr. Regional $92,000 $77,000 $169,000 Navasota Navasota Municipal $56,000 $45,000 $101,000 New Braunfels New Braunfels Regional $2,777,000 $2,531,000 $5,308,000 Odessa Odessa-Schlemeyer Field $957,000 $824,000 $1,781,000 Olney Olney Municipal $20,342,000 $18,524,000 $38,866,000 Orange Orange County $191,000 $153,000 $344,000 Ozona Ozona Municipal $60,000 $47,000 $107,000 Paducah Dan E Richards Municipal $139,000 $126,000 $265,000 Palacios Palacios Municipal Undisclosed Undisclosed Undisclosed Palestine Palestine Municipal $60,000 $47,000 $107,000 Pampa Perry Lefors Field $102,000 $86,000 $188,000 Panhandle Panhandle-Carson County $139,000 $126,000 $265,000 Paris Cox Field $528,000 $472,000 $1,000,000 Pearsall Mc Kinley Field $94,000 $65,000 $159,000 Pecos Pecos Municipal $185,000 $128,000 $313,000 A-42
98 Table A-7: On-Airport from Texas Airports (cont.) Direct Multiplier On-Airport On-Airport On-Airport Perryton Perryton Ochiltree County $524,000 $470,000 $994,000 Plains Yoakum County $206,000 $183,000 $389,000 Plainview Hale County $1,651,000 $1,504,000 $3,155,000 Pleasanton Pleasanton Municipal $72,000 $56,000 $128,000 Port Aransas Mustang Beach Undisclosed Undisclosed Undisclosed Port Isabel Port Isabel-Cameron County $197,000 $177,000 $374,000 Port Lavaca Calhoun County $429,000 $343,000 $772,000 Port Mansfield Charles R Johnson Undisclosed Undisclosed Undisclosed Presidio Presidio Lely International Undisclosed Undisclosed Undisclosed Quanah Quanah Municipal $93,000 $81,000 $174,000 Refugio Rooke Field Undisclosed Undisclosed Undisclosed Roanoke Northwest Regional $1,573,000 $1,413,000 $2,986,000 Robstown Nueces County $170,000 $132,000 $302,000 Rockdale H H Coffield Regional Undisclosed Undisclosed Undisclosed Rockport Aransas County $996,000 $800,000 $1,796,000 Rocksprings Edwards County $0 $0 $0 Rockwall Ralph M Hall/Rockwall Municipal $170,000 $155,000 $325,000 San Antonio Stinson Municipal $4,339,000 $2,994,000 $7,333,000 San Marcos San Marcos Regional $9,916,000 $8,936,000 $18,852,000 San Saba San Saba County Municipal $0 $0 $0 Seminole Gaines County $77,000 $56,000 $133,000 Seymour Seymour Municipal $63,000 $54,000 $117,000 Sherman Sherman Municipal $147,000 $120,000 $267,000 Sherman/Denison North Texas Regional/Perrin Field $2,329,000 $1,968,000 $4,297,000 Sinton Alfred C 'Bubba' Thomas $296,000 $235,000 $531,000 Slaton Slaton Municipal $211,000 $186,000 $397,000 Smithville Smithville Crawford Municipal $194,000 $176,000 $370,000 Snyder Winston Field $648,000 $504,000 $1,152,000 Sonora Sonora Municipal Undisclosed Undisclosed Undisclosed Spearman Major Samuel B Cornelius Field Undisclosed Undisclosed Undisclosed Stamford Arledge Field $73,000 $59,000 $132,000 Stephenville Stephenville Clark Regional $303,000 $271,000 $574,000 Sulphur Springs Sulphur Springs Municipal $1,620,000 $1,440,000 $3,060,000 Sunray Sunray $236,000 $215,000 $451,000 Sweetwater Avenger Field $238,000 $139,000 $377,000 Tahoka T-Bar Undisclosed Undisclosed Undisclosed Taylor Taylor Municipal $645,000 $568,000 $1,213,000 Temple Draughon-Miller Central Texas Regional $4,780,000 $4,030,000 $8,810,000 Terrell Terrell Municipal $602,000 $381,000 $983,000 A-43
99 Table A-7: On-Airport from Texas Airports (cont.) Direct On-Airport Multiplier On-Airport On-Airport Throckmorton Throckmorton Municipal $0 $0 $0 Tulia City of Tulia/Swisher County Municipal Undisclosed Undisclosed Undisclosed Uvalde Garner Field $6,997,000 $5,499,000 $12,496,000 Van Horn Culberson County $102,000 $86,000 $188,000 Vega Oldham County Undisclosed Undisclosed Undisclosed Vernon Wilbarger County $270,000 $202,000 $472,000 Victoria Victoria Regional $5,325,000 $4,214,000 $9,539,000 McGregor Mc Gregor Executive $2,733,000 $2,464,000 $5,197,000 Waco TSTC Waco $85,945,000 $74,893,000 $160,838,000 Wellington Marian Airpark Undisclosed Undisclosed Undisclosed Weslaco Mid Valley $374,000 $262,000 $636,000 Wharton Wharton Regional $561,000 $476,000 $1,037,000 Wheeler Wheeler Municipal Undisclosed Undisclosed Undisclosed Wichita Falls Kickapoo Downtown $1,143,000 $931,000 $2,074,000 Wills Point Van Zandt County Regional $21,000 $14,000 $35,000 Wink Winkler County $60,000 $47,000 $107,000 Winnie/Stowell Chambers County-Winnie Stowell $1,068,000 $969,000 $2,037,000 Winnsboro Winnsboro Municipal $0 $0 $0 Winters Winters Municipal Undisclosed Undisclosed Undisclosed Zapata Zapata County $50,000 $25,000 $75,000 Other Airports $35,000 $13,000 $48,000 General Aviation Airports $1,380,980,000 $932,794,000 $2,313,774,000 All Airports $8,720,791,000 $5,956,211,000 $14,677,002,000 Note: has been marked Undisclosed for airports reporting a single on-airport employee to protect the individual s privacy. Source: CDM Smith and IMPLAN. A-44
100 Table A-8: Construction from Texas Airports Direct Construction Multiplier Construction Construction Commercial Service Airports Abilene Abilene Regional $4,215,000 $2,961,000 $7,176,000 Amarillo Rick Husband Amarillo International $3,337,000 $2,346,000 $5,683,000 Austin Austin-Bergstrom International $15,117,000 $10,623,000 $25,740,000 Beaumont/Port Arthur Jack Brooks Regional $863,000 $606,000 $1,469,000 Brownsville Brownsville/South Padre Island International $3,374,000 $2,371,000 $5,745,000 College Station Easterwood Field $1,456,000 $1,024,000 $2,480,000 Corpus Christi Corpus Christi International $14,215,000 $9,989,000 $24,204,000 Dallas Dallas Love Field $6,573,000 $4,620,000 $11,193,000 Dallas-Fort Worth Dallas/Fort Worth International $127,324,000 $89,473,000 $216,797,000 El Paso El Paso International $8,956,000 $6,293,000 $15,249,000 Fort Hood (Killeen) Killeen-Fort Hood Regional $820,000 $576,000 $1,396,000 Harlingen Valley International $2,354,000 $1,654,000 $4,008,000 Houston George Bush Intercontinental/Houston $25,246,000 $17,740,000 $42,986,000 Houston William P Hobby $21,068,000 $14,804,000 $35,872,000 Laredo Laredo International $3,696,000 $2,598,000 $6,294,000 Longview East Texas Regional $1,931,000 $1,357,000 $3,288,000 Lubbock Lubbock Preston Smith International $4,514,000 $3,172,000 $7,686,000 Mc Allen Mc Allen Miller International $3,286,000 $2,310,000 $5,596,000 Midland Midland International Air and Space Port $4,121,000 $2,897,000 $7,018,000 San Angelo San Angelo Regional/Mathis Field $1,860,000 $1,307,000 $3,167,000 San Antonio San Antonio International $15,269,000 $10,730,000 $25,999,000 Texarkana, AR Texarkana Regional Airport-Webb Field $528,000 $464,000 $992,000 Tyler Tyler Pounds Regional $2,862,000 $2,011,000 $4,873,000 Waco Waco Regional $1,723,000 $1,210,000 $2,933,000 Wichita Falls Sheppard AFB/Wichita Falls Municipal $970,000 $681,000 $1,651,000 Commercial Service Airports $275,678,000 $193,817,000 $469,495,000 General Aviation Airports Albany Albany Municipal $16,000 $11,000 $27,000 Alice Alice International $289,000 $204,000 $493,000 Alpine Alpine-Casparis Municipal $271,000 $190,000 $461,000 Amarillo Tradewind $0 $0 $0 A-45
101 Table A-8: Construction from Texas Airports (cont.) Direct Construction Multiplier Construction Construction Anahuac Chambers County $36,000 $26,000 $62,000 Andrews Andrews County $22,000 $15,000 $37,000 Angleton/Lake Jackson Texas Gulf Coast Regional $38,000 $26,000 $64,000 Arlington Arlington Municipal $1,117,000 $785,000 $1,902,000 Athens Athens Municipal $25,000 $18,000 $43,000 Atlanta Hall-Miller Municipal $1,000 $1,000 $2,000 Ballinger Bruce Field $0 $0 $0 Bay City Bay City Regional $60,000 $43,000 $103,000 Beaumont Beaumont Municipal $419,000 $295,000 $714,000 Beeville Beeville Municipal $5,000 $4,000 $9,000 Big Lake Reagan County $4,000 $3,000 $7,000 Big Spring Big Spring Mc Mahon- Wrinkle $183,000 $129,000 $312,000 Bonham Jones Field $61,000 $42,000 $103,000 Borger Hutchinson County $25,000 $17,000 $42,000 Bowie Bowie Municipal $5,000 $4,000 $9,000 Brady Curtis Field $15,000 $11,000 $26,000 Breckenridge Stephens County $42,000 $30,000 $72,000 Brenham Brenham Municipal $62,000 $43,000 $105,000 Bridgeport Bridgeport Municipal $12,000 $8,000 $20,000 Brownfield Terry County $45,000 $32,000 $77,000 Brownwood Brownwood Regional $56,000 $40,000 $96,000 Bryan Coulter Field $235,000 $165,000 $400,000 Burnet Burnet Municipal Kate Craddock Field $54,000 $38,000 $92,000 Caddo Mills Caddo Mills Municipal $15,000 $11,000 $26,000 Caldwell Caldwell Municipal $11,000 $7,000 $18,000 Cameron Cameron Municipal Airpark $1,000 $0 $1,000 Canadian Hemphill County $5,000 $4,000 $9,000 Carrizo Springs Dimmit County $19,000 $14,000 $33,000 Carthage Panola County-Sharpe Field $5,000 $3,000 $8,000 Castroville Castroville Municipal $57,000 $39,000 $96,000 Center Center Municipal $28,000 $19,000 $47,000 Childress Childress Municipal $48,000 $34,000 $82,000 Cisco Cisco Municipal $0 $0 $0 Clarksville Clarksville/Red River County-J D Trissell Field $5,000 $3,000 $8,000 Cleburne Cleburne Regional $141,000 $99,000 $240,000 Cleveland Cleveland Municipal $95,000 $67,000 $162,000 Clifton Clifton Municipal/Isenhower Field $38,000 $27,000 $65,000 Coleman Coleman Municipal $0 $1,000 $1,000 Colorado City Colorado City $24,000 $17,000 $41,000 Columbus Robert R Wells Jr. $2,000 $1,000 $3,000 A-46
102 Table A-8: Construction from Texas Airports (cont.) Direct Construction Multiplier Construction Construction Comanche Comanche County-City $0 $0 $0 Commerce Commerce Municipal $176,000 $124,000 $300,000 Corsicana C David Campbell Field- Corsicana Municipal $20,000 $15,000 $35,000 Cotulla Cotulla-La Salle County $13,000 $10,000 $23,000 Crane Crane County $5,000 $4,000 $9,000 Crockett Houston County $1,000 $1,000 $2,000 Crosbyton Crosbyton Municipal $41,000 $29,000 $70,000 Dalhart Dalhart Municipal $67,000 $47,000 $114,000 Dallas Addison $2,487,000 $1,748,000 $4,235,000 Dallas Dallas CBD Vertiport $0 $0 $0 Dallas Dallas Executive $2,223,000 $1,563,000 $3,786,000 McKinney McKinney National $2,362,000 $1,660,000 $4,022,000 Decatur Decatur Municipal $36,000 $26,000 $62,000 Del Rio Del Rio International $375,000 $264,000 $639,000 Dell City Dell City Municipal $8,000 $5,000 $13,000 Denton Denton Enterprise $1,900,000 $1,335,000 $3,235,000 Denver City Denver City $1,000 $1,000 $2,000 Desoto Desoto Heliport $10,000 $7,000 $17,000 Devine Devine Municipal $20,000 $13,000 $33,000 Dimmitt Dimmitt Municipal $8,000 $5,000 $13,000 Dryden Terrell County $5,000 $3,000 $8,000 Dublin Dublin Municipal $15,000 $10,000 $25,000 Dumas Moore County $223,000 $157,000 $380,000 Eagle Lake Eagle Lake $79,000 $55,000 $134,000 Eagle Pass Maverick County Memorial International $6,000 $3,000 $9,000 Eastland Eastland Municipal $213,000 $149,000 $362,000 Edinburg South Texas International at Edinburg $656,000 $460,000 $1,116,000 Edna Jackson County $5,000 $3,000 $8,000 Ennis Ennis Municipal $39,000 $27,000 $66,000 Fabens Fabens $19,000 $14,000 $33,000 Falfurrias Brooks County $124,000 $88,000 $212,000 Floydada Floydada Municipal $45,000 $32,000 $77,000 Fort Stockton Fort Stockton-Pecos County $26,000 $18,000 $44,000 Fort Worth Fort Worth Alliance $5,129,000 $3,605,000 $8,734,000 Fort Worth Fort Worth Meacham International $4,536,000 $3,188,000 $7,724,000 Fort Worth Fort Worth Spinks $384,000 $271,000 $655,000 Fredericksburg Gillespie County $247,000 $174,000 $421,000 Gainesville Gainesville Municipal $1,061,000 $745,000 $1,806,000 Galveston Scholes International at Galveston $227,000 $160,000 $387,000 Garland Garland/DFW Heloplex $159,000 $111,000 $270,000 Gatesville Gatesville Municipal $39,000 $27,000 $66,000 A-47
103 Table A-8: Construction from Texas Airports (cont.) Direct Construction Multiplier Construction Construction George West Live Oak County $110,000 $77,000 $187,000 Georgetown Georgetown Municipal $1,105,000 $776,000 $1,881,000 Giddings Giddings-Lee County $13,000 $9,000 $22,000 Gilmer Fox Stephens Field-Gilmer Municipal $22,000 $16,000 $38,000 Gladewater Gladewater Municipal $13,000 $10,000 $23,000 Gonzales Roger M. Dreyer Memorial $0 $0 $0 Graford Possum Kingdom $0 $0 $0 Graham Graham Municipal $20,000 $15,000 $35,000 Granbury Granbury Regional $57,000 $41,000 $98,000 Grand Prairie Grand Prairie Municipal $661,000 $465,000 $1,126,000 Greenville Majors $12,377,000 $8,697,000 $21,074,000 Gruver Gruver Municipal $45,000 $32,000 $77,000 Hallettsville Hallettsville Municipal $8,000 $5,000 $13,000 Hamilton Hamilton Municipal $14,000 $10,000 $24,000 Haskell Haskell Municipal $29,000 $20,000 $49,000 Hearne Hearne Municipal $30,000 $21,000 $51,000 Hebbronville Jim Hogg County $14,000 $10,000 $24,000 Henderson Rusk County $48,000 $33,000 $81,000 Hereford Hereford Municipal $61,000 $43,000 $104,000 Hillsboro Hillsboro Municipal $86,000 $61,000 $147,000 Hondo South Texas Regional at Hondo $128,000 $89,000 $217,000 Houston Conroe-North Houston Regional $2,331,000 $1,638,000 $3,969,000 Houston David Wayne Hooks Memorial $718,000 $504,000 $1,222,000 Houston Ellington Field $7,369,000 $5,179,000 $12,548,000 Houston Houston-Southwest $373,000 $263,000 $636,000 Houston Pearland Regional $83,000 $59,000 $142,000 Houston Sugar Land Regional $1,345,000 $945,000 $2,290,000 Houston West Houston $33,000 $23,000 $56,000 Huntsville Huntsville Municipal $16,000 $11,000 $27,000 Ingleside McCampbell-Porter $1,511,000 $1,061,000 $2,572,000 Jacksboro Jacksboro Municipal $1,000 $1,000 $2,000 Jacksonville Cherokee County $94,000 $66,000 $160,000 Jasper Jasper County-Bell Field $8,000 $5,000 $13,000 Jayton Kent County $16,000 $11,000 $27,000 Jefferson Cypress River $7,000 $4,000 $11,000 Junction Kimble County $170,000 $120,000 $290,000 Kenedy Karnes County $1,000 $2,000 $3,000 Kerrville Kerrville Municipal/Louis Schreiner Field $359,000 $252,000 $611,000 Killeen Skylark Field $71,000 $50,000 $121,000 Kingsville Kleberg County $448,000 $314,000 $762,000 Kirbyville Kirbyville $12,000 $8,000 $20,000 A-48
104 Table A-8: Construction from Texas Airports (cont.) Direct Construction Multiplier Construction Construction Knox City Harrison Field of Knox City $30,000 $21,000 $51,000 Kountze/Silsbee Hawthorne Field $6,000 $3,000 $9,000 La Grange Fayette Regional Air Center $42,000 $29,000 $71,000 La Porte La Porte Municipal $89,000 $62,000 $151,000 Lago Vista Lago Vista TX-Rusty Allen $67,000 $47,000 $114,000 Lamesa Lamesa Municipal $223,000 $157,000 $380,000 Lampasas Lampasas $2,000 $2,000 $4,000 Lancaster Lancaster Regional $178,000 $125,000 $303,000 Levelland Levelland Municipal $22,000 $15,000 $37,000 Liberty Liberty Municipal $2,000 $1,000 $3,000 Littlefield Taylor Brown Municipal $30,000 $21,000 $51,000 Livingston Livingston Municipal $4,000 $2,000 $6,000 Llano Llano Municipal $100,000 $71,000 $171,000 Lockhart Lockhart Municipal $9,000 $6,000 $15,000 Lufkin Angelina County $329,000 $232,000 $561,000 Madisonville Madisonville Municipal $22,000 $16,000 $38,000 Marfa Marfa Municipal $87,000 $61,000 $148,000 Marshall Harrison County $13,000 $10,000 $23,000 Mason Mason County $7,000 $5,000 $12,000 Mc Camey Upton County $243,000 $170,000 $413,000 Mesquite Mesquite Metro $541,000 $380,000 $921,000 Mexia Mexia-Limestone County $112,000 $78,000 $190,000 Midland Midland Airpark $154,000 $108,000 $262,000 Midlothian/Waxahachie Mid-Way Regional $432,000 $304,000 $736,000 Mineola/Quitman Wood County $22,000 $15,000 $37,000 Mineral Wells Mineral Wells $184,000 $129,000 $313,000 Monahans Roy Hurd Memorial $45,000 $32,000 $77,000 Mount Pleasant Mount Pleasant Regional $55,000 $39,000 $94,000 Mount Vernon Franklin County $48,000 $34,000 $82,000 Muleshoe Muleshoe Municipal $0 $0 $0 Munday Munday Municipal $22,000 $16,000 $38,000 Nacogdoches A L Mangham Jr. Regional $11,000 $7,000 $18,000 Navasota Navasota Municipal $10,000 $7,000 $17,000 New Braunfels New Braunfels Regional $118,000 $82,000 $200,000 Odessa Odessa-Schlemeyer Field $344,000 $242,000 $586,000 Olney Olney Municipal $287,000 $202,000 $489,000 Orange Orange County $21,000 $15,000 $36,000 Ozona Ozona Municipal $10,000 $8,000 $18,000 Paducah Dan E Richards Municipal $37,000 $26,000 $63,000 Palacios Palacios Municipal $4,000 $2,000 $6,000 Palestine Palestine Municipal $48,000 $34,000 $82,000 Pampa Perry Lefors Field $7,000 $6,000 $13,000 Panhandle Panhandle-Carson County $38,000 $27,000 $65,000 Paris Cox Field $25,000 $18,000 $43,000 Pearsall Mc Kinley Field $4,000 $2,000 $6,000 A-49
105 Table A-8: Construction from Texas Airports (cont.) Direct Construction Multiplier Construction Construction Pecos Pecos Municipal $124,000 $87,000 $211,000 Perryton Perryton Ochiltree County $65,000 $46,000 $111,000 Plains Yoakum County $31,000 $21,000 $52,000 Plainview Hale County $186,000 $131,000 $317,000 Pleasanton Pleasanton Municipal $8,000 $5,000 $13,000 Port Aransas Mustang Beach $2,000 $2,000 $4,000 Port Isabel Port Isabel-Cameron County $141,000 $99,000 $240,000 Port Lavaca Calhoun County $39,000 $28,000 $67,000 Port Mansfield Charles R Johnson $0 $0 $0 Presidio Presidio Lely International $37,000 $26,000 $63,000 Quanah Quanah Municipal $28,000 $20,000 $48,000 Refugio Rooke Field $48,000 $34,000 $82,000 Roanoke Northwest Regional $124,000 $86,000 $210,000 Robstown Nueces County $58,000 $41,000 $99,000 Rockdale H H Coffield Regional $0 $0 $0 Rockport Aransas County $82,000 $57,000 $139,000 Rocksprings Edwards County $9,000 $7,000 $16,000 Rockwall Ralph M Hall/Rockwall Municipal $22,000 $15,000 $37,000 San Antonio Stinson Municipal $1,390,000 $977,000 $2,367,000 San Marcos San Marcos Regional $1,004,000 $706,000 $1,710,000 San Saba San Saba County Municipal $1,000 $0 $1,000 Seminole Gaines County $95,000 $67,000 $162,000 Seymour Seymour Municipal $15,000 $10,000 $25,000 Sherman Sherman Municipal $4,000 $2,000 $6,000 Sherman/Denison North Texas Regional/Perrin Field $355,000 $249,000 $604,000 Sinton Alfred C 'Bubba' Thomas $32,000 $23,000 $55,000 Slaton Slaton Municipal $23,000 $16,000 $39,000 Smithville Smithville Crawford Municipal $20,000 $13,000 $33,000 Snyder Winston Field $13,000 $9,000 $22,000 Sonora Sonora Municipal $1,000 $1,000 $2,000 Spearman Major Samuel B Cornelius Field $6,000 $5,000 $11,000 Stamford Arledge Field $15,000 $10,000 $25,000 Stephenville Stephenville Clark Regional $315,000 $222,000 $537,000 Sulphur Springs Sulphur Springs Municipal $175,000 $122,000 $297,000 Sunray Sunray $63,000 $45,000 $108,000 Sweetwater Avenger Field $33,000 $23,000 $56,000 Tahoka T-Bar $4,000 $2,000 $6,000 Taylor Taylor Municipal $255,000 $180,000 $435,000 Temple Draughon-Miller Central Texas Regional $753,000 $529,000 $1,282,000 A-50
106 Table A-8: Construction from Texas Airports (cont.) Direct Construction Multiplier Construction Construction Terrell Terrell Municipal $193,000 $135,000 $328,000 Throckmorton Throckmorton Municipal $25,000 $17,000 $42,000 Tulia City of Tulia/Swisher County Municipal $0 $0 $0 Uvalde Garner Field $561,000 $394,000 $955,000 Van Horn Culberson County $8,000 $5,000 $13,000 Vega Oldham County $0 $1,000 $1,000 Vernon Wilbarger County $39,000 $28,000 $67,000 Victoria Victoria Regional $252,000 $177,000 $429,000 McGregor Mc Gregor Executive $424,000 $298,000 $722,000 Waco TSTC Waco $2,994,000 $2,104,000 $5,098,000 Wellington Marian Airpark $0 $0 $0 Weslaco Mid Valley $33,000 $24,000 $57,000 Wharton Wharton Regional $150,000 $105,000 $255,000 Wheeler Wheeler Municipal $0 $0 $0 Wichita Falls Kickapoo Downtown $255,000 $180,000 $435,000 Wills Point Van Zandt County Regional $52,000 $37,000 $89,000 Wink Winkler County $9,000 $7,000 $16,000 Winnie/Stowell Chambers County-Winnie Stowell $307,000 $216,000 $523,000 Winnsboro Winnsboro Municipal $2,000 $1,000 $3,000 Winters Winters Municipal $0 $0 $0 Zapata Zapata County $10,000 $8,000 $18,000 Other Airports $30,000 $25,000 $55,000 General Aviation Airports $71,393,000 $50,176,000 $121,569,000 All Airports $347,071,000 $243,993,000 $591,064,000 Source: CDM Smith and IMPLAN. A-51
107 Table A-9: Commercial Service Visitor-Related from Texas Airports Direct CS Visitor-Related Multiplier CS Visitor-Related CS Visitor-Related Commercial Service Airports Abilene Abilene Regional $12,023,000 $9,059,000 $21,082,000 Amarillo Rick Husband Amarillo International $118,425,000 $89,234,000 $207,659,000 Austin Austin-Bergstrom International $992,370,000 $747,762,000 $1,740,132,000 Beaumont/Port Arthur Jack Brooks Regional $3,057,000 $2,303,000 $5,360,000 Brownsville Brownsville/South Padre Island International $13,292,000 $10,016,000 $23,308,000 College Station Easterwood Field $14,512,000 $10,935,000 $25,447,000 Corpus Christi Corpus Christi International $108,167,000 $81,506,000 $189,673,000 Dallas Dallas Love Field $741,209,000 $558,509,000 $1,299,718,000 Dallas-Fort Worth Dallas/Fort Worth International $2,701,929,000 $2,035,933,000 $4,737,862,000 El Paso El Paso International $284,733,000 $214,549,000 $499,282,000 Fort Hood (Killeen) Killeen-Fort Hood Regional $20,779,000 $15,658,000 $36,437,000 Harlingen Valley International $52,980,000 $39,921,000 $92,901,000 Houston George Bush Intercontinental/Houston $1,581,942,000 $1,192,010,000 $2,773,952,000 Houston William P Hobby $606,459,000 $456,974,000 $1,063,433,000 Laredo Laredo International $12,823,000 $9,663,000 $22,486,000 Longview East Texas Regional $1,217,000 $917,000 $2,134,000 Lubbock Lubbock Preston Smith International $78,468,000 $59,126,000 $137,594,000 Mc Allen Mc Allen Miller International $104,233,000 $78,540,000 $182,773,000 Midland Midland International Air and Space Port $134,533,000 $101,373,000 $235,906,000 San Angelo San Angelo Regional/Mathis Field $8,478,000 $6,388,000 $14,866,000 San Antonio San Antonio International $693,862,000 $522,832,000 $1,216,694,000 Texarkana, AR Texarkana Regional Airport- Webb Field $3,364,000 $2,046,000 $5,410,000 Tyler Tyler Pounds Regional $9,012,000 $6,790,000 $15,802,000 Waco Waco Regional $6,109,000 $4,603,000 $10,712,000 Wichita Falls Sheppard AFB/Wichita Falls Municipal $5,224,000 $3,936,000 $9,160,000 Commercial Service Airports $8,309,200,000 $6,260,583,000 $14,569,783,000 Source: CDM Smith and IMPLAN. A-52
108 Table A-10: General Aviation Visitor-Related from Texas Airports Multiplier GA Visitor-Related GA Visitor-Related Direct GA Visitor- Related Commercial Service Airports Abilene Abilene Regional $1,854,000 $1,465,000 $3,319,000 Rick Husband Amarillo Amarillo International $2,011,000 $1,589,000 $3,600,000 Austin Austin-Bergstrom International $4,288,000 $3,387,000 $7,675,000 Beaumont/Port Arthur Jack Brooks Regional $707,000 $559,000 $1,266,000 Brownsville Brownsville/South Padre Island International $1,114,000 $880,000 $1,994,000 College Station Easterwood Field $2,121,000 $1,676,000 $3,797,000 Corpus Christi Corpus Christi International $2,391,000 $1,889,000 $4,280,000 Dallas Dallas Love Field $4,430,000 $3,500,000 $7,930,000 Dallas-Fort Worth Dallas/Fort Worth International $517,000 $408,000 $925,000 El Paso El Paso International $2,525,000 $1,995,000 $4,520,000 Fort Hood (Killeen) Killeen-Fort Hood Regional $527,000 $416,000 $943,000 Harlingen Valley International $471,000 $372,000 $843,000 Houston George Bush Intercontinental/Houston $823,000 $650,000 $1,473,000 Houston William P Hobby $4,235,000 $3,346,000 $7,581,000 Laredo Laredo International $1,659,000 $1,311,000 $2,970,000 Longview East Texas Regional $1,467,000 $1,159,000 $2,626,000 Lubbock Lubbock Preston Smith International $1,989,000 $1,571,000 $3,560,000 Mc Allen Mc Allen Miller International $2,751,000 $2,173,000 $4,924,000 Midland Midland International Air and Space Port $2,472,000 $1,953,000 $4,425,000 San Angelo San Angelo Regional/Mathis Field $2,766,000 $2,185,000 $4,951,000 San Antonio San Antonio International $4,050,000 $3,199,000 $7,249,000 Texarkana, AR Texarkana Regional Airport-Webb Field $462,000 $254,000 $716,000 Tyler Tyler Pounds Regional $1,582,000 $1,250,000 $2,832,000 Waco Waco Regional $1,607,000 $1,269,000 $2,876,000 Wichita Falls Sheppard AFB/Wichita Falls Municipal $7,311,000 $5,775,000 $13,086,000 Commercial Service Airports $56,130,000 $44,231,000 $100,361,000 General Aviation Airports Albany Albany Municipal $17,000 $13,000 $30,000 Alice Alice International $1,065,000 $841,000 $1,906,000 Alpine Alpine-Casparis Municipal $65,000 $51,000 $116,000 A-53
109 Table A-10: General Aviation Visitor-Related from Texas Airports (cont.) Multiplier GA Visitor-Related GA Visitor-Related Direct GA Visitor- Related Amarillo Tradewind $529,000 $418,000 $947,000 Anahuac Chambers County $19,000 $15,000 $34,000 Andrews Andrews County $65,000 $51,000 $116,000 Angleton/Lake Jackson Texas Gulf Coast Regional $2,412,000 $1,905,000 $4,317,000 Arlington Arlington Municipal $2,217,000 $1,751,000 $3,968,000 Athens Athens Municipal $53,000 $42,000 $95,000 Atlanta Hall-Miller Municipal $111,000 $88,000 $199,000 Ballinger Bruce Field $19,000 $15,000 $34,000 Bay City Bay City Regional $75,000 $59,000 $134,000 Beaumont Beaumont Municipal $118,000 $93,000 $211,000 Beeville Beeville Municipal $51,000 $40,000 $91,000 Big Lake Reagan County $24,000 $19,000 $43,000 Big Spring Big Spring Mc Mahon- Wrinkle $144,000 $114,000 $258,000 Bonham Jones Field $48,000 $38,000 $86,000 Borger Hutchinson County $63,000 $50,000 $113,000 Bowie Bowie Municipal $87,000 $69,000 $156,000 Brady Curtis Field $534,000 $422,000 $956,000 Breckenridge Stephens County $94,000 $74,000 $168,000 Brenham Brenham Municipal $108,000 $85,000 $193,000 Bridgeport Bridgeport Municipal $113,000 $89,000 $202,000 Brownfield Terry County $43,000 $34,000 $77,000 Brownwood Brownwood Regional $152,000 $120,000 $272,000 Bryan Coulter Field $115,000 $91,000 $206,000 Burnet Burnet Municipal Kate Craddock Field $125,000 $99,000 $224,000 Caddo Mills Caddo Mills Municipal $529,000 $418,000 $947,000 Caldwell Caldwell Municipal $53,000 $42,000 $95,000 Cameron Cameron Municipal Airpark $12,000 $9,000 $21,000 Canadian Hemphill County $41,000 $32,000 $73,000 Carrizo Springs Dimmit County $14,000 $11,000 $25,000 Carthage Panola County-Sharpe Field $72,000 $57,000 $129,000 Castroville Castroville Municipal $113,000 $89,000 $202,000 Center Center Municipal $65,000 $51,000 $116,000 Childress Childress Municipal $31,000 $24,000 $55,000 Cisco Cisco Municipal $17,000 $13,000 $30,000 Clarksville Clarksville/Red River County-J D Trissell Field $0 $0 $0 Cleburne Cleburne Regional $183,000 $145,000 $328,000 Cleveland Cleveland Municipal $108,000 $85,000 $193,000 Clifton Clifton Municipal/Isenhower Field $48,000 $38,000 $86,000 Coleman Coleman Municipal $63,000 $50,000 $113,000 A-54
110 Table A-10: General Aviation Visitor-Related from Texas Airports (cont.) Multiplier GA Visitor-Related GA Visitor-Related Direct GA Visitor- Related Colorado City Colorado City $12,000 $9,000 $21,000 Columbus Robert R Wells Jr. $24,000 $19,000 $43,000 Comanche Comanche County-City $58,000 $46,000 $104,000 Commerce Commerce Municipal $99,000 $78,000 $177,000 Corsicana C David Campbell Field- Corsicana Municipal $135,000 $107,000 $242,000 Cotulla Cotulla-La Salle County $202,000 $160,000 $362,000 Crane Crane County $14,000 $11,000 $25,000 Crockett Houston County $55,000 $43,000 $98,000 Crosbyton Crosbyton Municipal $12,000 $9,000 $21,000 Dalhart Dalhart Municipal $72,000 $57,000 $129,000 Dallas Addison $4,394,000 $3,471,000 $7,865,000 Dallas Dallas CBD Vertiport $14,000 $11,000 $25,000 Dallas Dallas Executive $1,291,000 $1,020,000 $2,311,000 McKinney McKinney National $1,756,000 $1,387,000 $3,143,000 Decatur Decatur Municipal $108,000 $85,000 $193,000 Del Rio Del Rio International $82,000 $65,000 $147,000 Dell City Dell City Municipal $12,000 $9,000 $21,000 Denton Denton Enterprise $3,569,000 $2,819,000 $6,388,000 Denver City Denver City $26,000 $21,000 $47,000 Desoto Desoto Heliport $0 $0 $0 Devine Devine Municipal $46,000 $36,000 $82,000 Dimmitt Dimmitt Municipal $0 $0 $0 Dryden Terrell County $0 $0 $0 Dublin Dublin Municipal $26,000 $21,000 $47,000 Dumas Moore County $67,000 $53,000 $120,000 Eagle Lake Eagle Lake $72,000 $57,000 $129,000 Eagle Pass Maverick County Memorial International $0 $0 $0 Eastland Eastland Municipal $51,000 $40,000 $91,000 Edinburg South Texas International at Edinburg $24,000 $19,000 $43,000 Edna Jackson County $65,000 $51,000 $116,000 Ennis Ennis Municipal $24,000 $19,000 $43,000 Fabens Fabens $101,000 $80,000 $181,000 Falfurrias Brooks County $111,000 $88,000 $199,000 Floydada Floydada Municipal $53,000 $42,000 $95,000 Fort Stockton Fort Stockton-Pecos County $55,000 $43,000 $98,000 Fort Worth Fort Worth Alliance $3,050,000 $2,409,000 $5,459,000 Fort Worth Fort Worth Meacham International $3,163,000 $2,499,000 $5,662,000 Fort Worth Fort Worth Spinks $1,258,000 $994,000 $2,252,000 Fredericksburg Gillespie County $161,000 $127,000 $288,000 Gainesville Gainesville Municipal $130,000 $103,000 $233,000 A-55
111 Table A-10: General Aviation Visitor-Related from Texas Airports (cont.) Direct GA Visitor- Related Multiplier GA Visitor-Related GA Visitor-Related Scholes International at Galveston $1,207,000 $953,000 $2,160,000 Galveston Garland Garland/DFW Heloplex $36,000 $28,000 $64,000 Gatesville Gatesville Municipal $43,000 $34,000 $77,000 George West Live Oak County $26,000 $21,000 $47,000 Georgetown Georgetown Municipal $1,734,000 $1,370,000 $3,104,000 Giddings Giddings-Lee County $58,000 $46,000 $104,000 Gilmer Fox Stephens Field-Gilmer Municipal $34,000 $27,000 $61,000 Gladewater Gladewater Municipal $118,000 $93,000 $211,000 Gonzales Roger M. Dreyer Memorial $19,000 $15,000 $34,000 Graford Possum Kingdom $31,000 $24,000 $55,000 Graham Graham Municipal $31,000 $24,000 $55,000 Granbury Granbury Regional $192,000 $152,000 $344,000 Grand Prairie Grand Prairie Municipal $1,118,000 $883,000 $2,001,000 Greenville Majors $137,000 $108,000 $245,000 Gruver Gruver Municipal $0 $0 $0 Hallettsville Hallettsville Municipal $17,000 $13,000 $30,000 Hamilton Hamilton Municipal $46,000 $36,000 $82,000 Haskell Haskell Municipal $19,000 $15,000 $34,000 Hearne Hearne Municipal $19,000 $15,000 $34,000 Hebbronville Jim Hogg County $0 $0 $0 Henderson Rusk County $84,000 $66,000 $150,000 Hereford Hereford Municipal $70,000 $55,000 $125,000 Hillsboro Hillsboro Municipal $51,000 $40,000 $91,000 Hondo South Texas Regional at Hondo $108,000 $85,000 $193,000 Houston Conroe-North Houston Regional $1,898,000 $1,499,000 $3,397,000 Houston David Wayne Hooks Memorial $3,081,000 $2,434,000 $5,515,000 Houston Ellington Field $3,475,000 $2,745,000 $6,220,000 Houston Houston-Southwest $779,000 $615,000 $1,394,000 Houston Pearland Regional $960,000 $758,000 $1,718,000 Houston Sugar Land Regional $2,244,000 $1,773,000 $4,017,000 Houston West Houston $1,585,000 $1,252,000 $2,837,000 Huntsville Huntsville Municipal $515,000 $407,000 $922,000 Ingleside McCampbell-Porter $108,000 $85,000 $193,000 Jacksboro Jacksboro Municipal $0 $0 $0 Jacksonville Cherokee County $106,000 $84,000 $190,000 Jasper Jasper County-Bell Field $99,000 $78,000 $177,000 Jayton Kent County $0 $0 $0 Jefferson Cypress River $19,000 $15,000 $34,000 Junction Kimble County $51,000 $40,000 $91,000 Kenedy Karnes County $24,000 $19,000 $43,000 A-56
112 Table A-10: General Aviation Visitor-Related from Texas Airports (cont.) A-57 Direct GA Visitor- Related Multiplier GA Visitor-Related GA Visitor-Related Kerrville Municipal/Louis Schreiner Field $2,287,000 $1,807,000 $4,094,000 Kerrville Killeen Skylark Field $159,000 $126,000 $285,000 Kingsville Kleberg County $12,000 $9,000 $21,000 Kirbyville Kirbyville $63,000 $50,000 $113,000 Knox City Harrison Field of Knox City $12,000 $9,000 $21,000 Kountze/Silsbee Hawthorne Field $26,000 $21,000 $47,000 La Grange Fayette Regional Air Center $77,000 $61,000 $138,000 La Porte La Porte Municipal $209,000 $165,000 $374,000 Lago Vista Lago Vista TX-Rusty Allen $43,000 $34,000 $77,000 Lamesa Lamesa Municipal $84,000 $66,000 $150,000 Lampasas Lampasas $67,000 $53,000 $120,000 Lancaster Lancaster Regional $1,347,000 $1,064,000 $2,411,000 Levelland Levelland Municipal $87,000 $69,000 $156,000 Liberty Liberty Municipal $91,000 $72,000 $163,000 Littlefield Taylor Brown Municipal $38,000 $30,000 $68,000 Livingston Livingston Municipal $58,000 $46,000 $104,000 Llano Llano Municipal $108,000 $85,000 $193,000 Lockhart Lockhart Municipal $127,000 $100,000 $227,000 Lufkin Angelina County $753,000 $595,000 $1,348,000 Madisonville Madisonville Municipal $0 $0 $0 Marfa Marfa Municipal $99,000 $78,000 $177,000 Marshall Harrison County $99,000 $78,000 $177,000 Mason Mason County $29,000 $23,000 $52,000 Mc Camey Upton County $0 $0 $0 Mesquite Mesquite Metro $1,455,000 $1,149,000 $2,604,000 Mexia Mexia-Limestone County $58,000 $46,000 $104,000 Midland Midland Airpark $178,000 $141,000 $319,000 Midlothian/Waxahachie Mid-Way Regional $594,000 $469,000 $1,063,000 Mineola/Quitman Wood County $108,000 $85,000 $193,000 Mineral Wells Mineral Wells $166,000 $131,000 $297,000 Monahans Roy Hurd Memorial $82,000 $65,000 $147,000 Mount Pleasant Mount Pleasant Regional $108,000 $85,000 $193,000 Mount Vernon Franklin County $12,000 $9,000 $21,000 Muleshoe Muleshoe Municipal $19,000 $15,000 $34,000 Munday Munday Municipal $0 $0 $0 Nacogdoches A L Mangham Jr. Regional $168,000 $133,000 $301,000 Navasota Navasota Municipal $79,000 $62,000 $141,000 New Braunfels New Braunfels Regional $1,231,000 $972,000 $2,203,000 Odessa Odessa-Schlemeyer Field $1,284,000 $1,014,000 $2,298,000 Olney Olney Municipal $26,000 $21,000 $47,000 Orange Orange County $96,000 $76,000 $172,000 Ozona Ozona Municipal $53,000 $42,000 $95,000 Paducah Dan E Richards Municipal $0 $0 $0 Palacios Palacios Municipal $72,000 $57,000 $129,000
113 Table A-10: General Aviation Visitor-Related from Texas Airports (cont.) Multiplier GA Visitor-Related GA Visitor-Related Direct GA Visitor- Related Palestine Palestine Municipal $91,000 $72,000 $163,000 Pampa Perry Lefors Field $118,000 $93,000 $211,000 Panhandle Panhandle-Carson County $0 $0 $0 Paris Cox Field $91,000 $72,000 $163,000 Pearsall Mc Kinley Field $14,000 $11,000 $25,000 Pecos Pecos Municipal $724,000 $572,000 $1,296,000 Perryton Perryton Ochiltree County $120,000 $95,000 $215,000 Plains Yoakum County $48,000 $38,000 $86,000 Plainview Hale County $127,000 $100,000 $227,000 Pleasanton Pleasanton Municipal $82,000 $65,000 $147,000 Port Aransas Mustang Beach $75,000 $59,000 $134,000 Port Isabel Port Isabel-Cameron County $46,000 $36,000 $82,000 Port Lavaca Calhoun County $82,000 $65,000 $147,000 Port Mansfield Charles R Johnson $0 $0 $0 Presidio Presidio Lely International $0 $0 $0 Quanah Quanah Municipal $26,000 $21,000 $47,000 Refugio Rooke Field $22,000 $17,000 $39,000 Roanoke Northwest Regional $2,689,000 $2,124,000 $4,813,000 Robstown Nueces County $51,000 $40,000 $91,000 Rockdale H H Coffield Regional $19,000 $15,000 $34,000 Rockport Aransas County $1,859,000 $1,469,000 $3,328,000 Rocksprings Edwards County $12,000 $9,000 $21,000 Rockwall Ralph M Hall/Rockwall Municipal $173,000 $137,000 $310,000 San Antonio Stinson Municipal $1,515,000 $1,197,000 $2,712,000 San Marcos San Marcos Regional $1,178,000 $931,000 $2,109,000 San Saba San Saba County Municipal $26,000 $21,000 $47,000 Seminole Gaines County $67,000 $53,000 $120,000 Seymour Seymour Municipal $19,000 $15,000 $34,000 Sherman Sherman Municipal $19,000 $15,000 $34,000 Sherman/Denison North Texas Regional/Perrin Field $1,347,000 $1,064,000 $2,411,000 Sinton Alfred C 'Bubba' Thomas $51,000 $40,000 $91,000 Slaton Slaton Municipal $79,000 $62,000 $141,000 Smithville Smithville Crawford Municipal $72,000 $57,000 $129,000 Snyder Winston Field $70,000 $55,000 $125,000 Sonora Sonora Municipal $14,000 $11,000 $25,000 Spearman Major Samuel B Cornelius Field $46,000 $36,000 $82,000 Stamford Arledge Field $26,000 $21,000 $47,000 Stephenville Stephenville Clark Regional $113,000 $89,000 $202,000 Sulphur Springs Sulphur Springs Municipal $135,000 $107,000 $242,000 A-58
114 Table A-10: General Aviation Visitor-Related from Texas Airports (cont.) Multiplier GA Visitor-Related GA Visitor-Related Direct GA Visitor- Related Sunray Sunray $31,000 $24,000 $55,000 Sweetwater Avenger Field $63,000 $50,000 $113,000 Tahoka T-Bar $14,000 $11,000 $25,000 Taylor Taylor Municipal $99,000 $78,000 $177,000 Temple Draughon-Miller Central Texas Regional $683,000 $540,000 $1,223,000 Terrell Terrell Municipal $183,000 $145,000 $328,000 Throckmorton Throckmorton Municipal $0 $0 $0 Tulia City of Tulia/Swisher County Municipal $29,000 $23,000 $52,000 Uvalde Garner Field $113,000 $89,000 $202,000 Van Horn Culberson County $0 $0 $0 Vega Oldham County $26,000 $21,000 $47,000 Vernon Wilbarger County $103,000 $81,000 $184,000 Victoria Victoria Regional $967,000 $764,000 $1,731,000 McGregor Mc Gregor Executive $190,000 $150,000 $340,000 Waco TSTC Waco $1,811,000 $1,431,000 $3,242,000 Wellington Marian Airpark $26,000 $21,000 $47,000 Weslaco Mid Valley $568,000 $449,000 $1,017,000 Wharton Wharton Regional $99,000 $78,000 $177,000 Wheeler Wheeler Municipal $0 $0 $0 Wichita Falls Kickapoo Downtown $188,000 $149,000 $337,000 Wills Point Van Zandt County Regional $29,000 $23,000 $52,000 Wink Winkler County $0 $0 $0 Winnie/Stowell Chambers County-Winnie Stowell $29,000 $23,000 $52,000 Winnsboro Winnsboro Municipal $17,000 $13,000 $30,000 Winters Winters Municipal $19,000 $15,000 $34,000 Zapata Zapata County $24,000 $19,000 $43,000 Other Airports $97,000 $75,000 $172,000 General Aviation Airports $78,667,000 $62,134,000 $140,801,000 All Airports $134,797,000 $106,365,000 $241,162,000 Source: CDM Smith and IMPLAN. A-59
115 Table A-11: from Texas Airports Direct Multiplier Commercial Service Airports Abilene Abilene Regional $62,030,000 $50,554,000 $112,584,000 Amarillo Rick Husband Amarillo International $232,702,000 $186,818,000 $419,520,000 Austin Austin-Bergstrom International $1,448,226,000 $1,057,952,000 $2,506,178,000 Beaumont/Port Arthur Jack Brooks Regional $8,674,000 $5,772,000 $14,446,000 Brownsville Brownsville/South Padre Island International $33,400,000 $25,145,000 $58,545,000 College Station Easterwood Field $24,301,000 $18,520,000 $42,821,000 Corpus Christi Corpus Christi International $167,516,000 $119,313,000 $286,829,000 Dallas Dallas Love Field $1,110,672,000 $809,884,000 $1,920,556,000 Dallas-Fort Worth Dallas/Fort Worth International $5,413,356,000 $3,879,063,000 $9,292,419,000 El Paso El Paso International $417,601,000 $307,550,000 $725,151,000 Fort Hood (Killeen) Killeen-Fort Hood Regional $26,986,000 $19,847,000 $46,833,000 Harlingen Valley International $83,425,000 $64,646,000 $148,071,000 Houston George Bush Intercontinental/Houston $4,228,532,000 $2,988,713,000 $7,217,245,000 Houston William P Hobby $1,123,196,000 $808,616,000 $1,931,812,000 Laredo Laredo International $32,577,000 $23,914,000 $56,491,000 Longview East Texas Regional $17,201,000 $12,646,000 $29,847,000 Lubbock Lubbock Preston Smith International $110,554,000 $82,994,000 $193,548,000 Mc Allen Mc Allen Miller International $132,982,000 $98,671,000 $231,653,000 Midland Midland International Air and Space Port $189,726,000 $144,791,000 $334,517,000 San Angelo San Angelo Regional/Mathis Field $26,507,000 $18,453,000 $44,960,000 San Antonio San Antonio International $1,010,515,000 $738,535,000 $1,749,050,000 Texarkana, AR Texarkana Regional Airport-Webb Field $9,174,000 $6,537,000 $15,711,000 Tyler Tyler Pounds Regional $28,429,000 $21,806,000 $50,235,000 Waco Waco Regional $23,486,000 $17,452,000 $40,938,000 Wichita Falls Sheppard AFB/Wichita Falls Municipal $19,051,000 $13,856,000 $32,907,000 Commercial Service Airports $15,980,819,000 $11,522,048,000 $27,502,867,000 General Aviation Airports Albany Albany Municipal $87,000 $60,000 $147,000 Alice Alice International $1,558,000 $1,218,000 $2,776,000 Alpine Alpine-Casparis Municipal $2,680,000 $1,583,000 $4,263,000 Amarillo Tradewind $842,000 $577,000 $1,419,000 Anahuac Chambers County $96,000 $72,000 $168,000 A-60
116 Table A-11: from Texas Airports (cont.) Direct Multiplier Andrews Andrews County $304,000 $225,000 $529,000 Angleton/Lake Jackson Texas Gulf Coast Regional $4,401,000 $3,285,000 $7,686,000 Arlington Arlington Municipal $31,966,000 $20,170,000 $52,136,000 Athens Athens Municipal $308,000 $262,000 $570,000 Atlanta Hall-Miller Municipal $129,000 $98,000 $227,000 Ballinger Bruce Field $36,000 $24,000 $60,000 Bay City Bay City Regional $543,000 $423,000 $966,000 Beaumont Beaumont Municipal $772,000 $578,000 $1,350,000 Beeville Beeville Municipal $116,000 $91,000 $207,000 Big Lake Reagan County $45,000 $31,000 $76,000 Big Spring Big Spring Mc Mahon- Wrinkle $2,377,000 $1,906,000 $4,283,000 Bonham Jones Field $268,000 $224,000 $492,000 Borger Hutchinson County $1,771,000 $1,516,000 $3,287,000 Bowie Bowie Municipal $171,000 $113,000 $284,000 Brady Curtis Field $736,000 $558,000 $1,294,000 Breckenridge Stephens County $1,588,000 $1,414,000 $3,002,000 Brenham Brenham Municipal $915,000 $794,000 $1,709,000 Bridgeport Bridgeport Municipal $274,000 $225,000 $499,000 Brownfield Terry County $207,000 $169,000 $376,000 Brownwood Brownwood Regional $1,343,000 $1,071,000 $2,414,000 Bryan Coulter Field $1,941,000 $1,647,000 $3,588,000 Burnet Burnet Municipal Kate Craddock Field $689,000 $579,000 $1,268,000 Caddo Mills Caddo Mills Municipal $711,000 $571,000 $1,282,000 Caldwell Caldwell Municipal $124,000 $96,000 $220,000 Cameron Cameron Municipal Airpark $13,000 $9,000 $22,000 Canadian Hemphill County $176,000 $147,000 $323,000 Carrizo Springs Dimmit County $886,000 $790,000 $1,676,000 Carthage Panola County-Sharpe Field $111,000 $78,000 $189,000 Castroville Castroville Municipal $577,000 $465,000 $1,042,000 Center Center Municipal $122,000 $85,000 $207,000 Childress Childress Municipal $623,000 $540,000 $1,163,000 Cisco Cisco Municipal $18,000 $13,000 $31,000 Clarksville Clarksville/Red River County-J D Trissell Field $29,000 $24,000 $53,000 Cleburne Cleburne Regional $1,485,000 $1,217,000 $2,702,000 Cleveland Cleveland Municipal $280,000 $208,000 $488,000 Clifton Clifton Municipal/Isenhower Field $257,000 $215,000 $472,000 Coleman Coleman Municipal $63,000 $51,000 $114,000 Colorado City Colorado City $103,000 $88,000 $191,000 Columbus Robert R Wells Jr. $32,000 $23,000 $55,000 Comanche Comanche County-City $75,000 $55,000 $130,000 Commerce Commerce Municipal $335,000 $249,000 $584,000 A-61
117 Table A-11: from Texas Airports (cont.) Direct Multiplier C David Campbell Field- Corsicana Municipal $304,000 $257,000 $561,000 Corsicana Cotulla Cotulla-La Salle County $375,000 $308,000 $683,000 Crane Crane County $19,000 $15,000 $34,000 Crockett Houston County $73,000 $53,000 $126,000 Crosbyton Crosbyton Municipal $205,000 $177,000 $382,000 Dalhart Dalhart Municipal $596,000 $485,000 $1,081,000 Dallas Addison $80,904,000 $66,478,000 $147,382,000 Dallas Dallas CBD Vertiport $14,000 $11,000 $25,000 Dallas Dallas Executive $8,728,000 $6,395,000 $15,123,000 McKinney McKinney National $34,437,000 $29,835,000 $64,272,000 Decatur Decatur Municipal $1,398,000 $1,243,000 $2,641,000 Del Rio Del Rio International $3,635,000 $2,438,000 $6,073,000 Dell City Dell City Municipal $48,000 $39,000 $87,000 Denton Denton Enterprise $24,543,000 $21,297,000 $45,840,000 Denver City Denver City $27,000 $22,000 $49,000 Desoto Desoto Heliport $934,000 $832,000 $1,766,000 Devine Devine Municipal $461,000 $405,000 $866,000 Dimmitt Dimmitt Municipal $53,000 $39,000 $92,000 Dryden Terrell County $62,000 $48,000 $110,000 Dublin Dublin Municipal $101,000 $78,000 $179,000 Dumas Moore County $756,000 $540,000 $1,296,000 Eagle Lake Eagle Lake $703,000 $590,000 $1,293,000 Eagle Pass Maverick County Memorial International $121,000 $87,000 $208,000 Eastland Eastland Municipal $693,000 $580,000 $1,273,000 Edinburg South Texas International at Edinburg $2,240,000 $1,275,000 $3,515,000 Edna Jackson County $181,000 $127,000 $308,000 Ennis Ennis Municipal $266,000 $225,000 $491,000 Fabens Fabens $197,000 $155,000 $352,000 Falfurrias Brooks County $254,000 $186,000 $440,000 Floydada Floydada Municipal $322,000 $277,000 $599,000 Fort Stockton Fort Stockton-Pecos County $215,000 $183,000 $398,000 Fort Worth Fort Worth Alliance $79,732,000 $69,196,000 $148,928,000 Fort Worth Fort Worth Meacham International $54,087,000 $46,846,000 $100,933,000 Fort Worth Fort Worth Spinks $7,227,000 $6,217,000 $13,444,000 Fredericksburg Gillespie County $2,223,000 $1,793,000 $4,016,000 Gainesville Gainesville Municipal $32,624,000 $29,442,000 $62,066,000 Galveston Scholes International at Galveston $8,875,000 $6,903,000 $15,778,000 Garland Garland/DFW Heloplex $2,197,000 $1,924,000 $4,121,000 Gatesville Gatesville Municipal $210,000 $177,000 $387,000 George West Live Oak County $153,000 $107,000 $260,000 Georgetown Georgetown Municipal $8,019,000 $6,738,000 $14,757,000 Giddings Giddings-Lee County $147,000 $124,000 $271,000 A-62
118 Table A-11: from Texas Airports (cont.) Direct Multiplier Fox Stephens Field-Gilmer Municipal $262,000 $232,000 $494,000 Gilmer Gladewater Gladewater Municipal $308,000 $237,000 $545,000 Gonzales Roger M. Dreyer Memorial $36,000 $24,000 $60,000 Graford Possum Kingdom $31,000 $24,000 $55,000 Graham Graham Municipal $409,000 $336,000 $745,000 Granbury Granbury Regional $2,629,000 $2,276,000 $4,905,000 Grand Prairie Grand Prairie Municipal $54,979,000 $49,638,000 $104,617,000 Greenville Majors $639,601,000 $329,402,000 $969,003,000 Gruver Gruver Municipal $211,000 $184,000 $395,000 Hallettsville Hallettsville Municipal $44,000 $35,000 $79,000 Hamilton Hamilton Municipal $94,000 $64,000 $158,000 Haskell Haskell Municipal $153,000 $122,000 $275,000 Hearne Hearne Municipal $177,000 $146,000 $323,000 Hebbronville Jim Hogg County $48,000 $28,000 $76,000 Henderson Rusk County $234,000 $155,000 $389,000 Hereford Hereford Municipal $441,000 $361,000 $802,000 Hillsboro Hillsboro Municipal $507,000 $410,000 $917,000 Hondo South Texas Regional at Hondo $2,108,000 $1,786,000 $3,894,000 Houston Conroe-North Houston Regional $29,082,000 $19,199,000 $48,281,000 Houston David Wayne Hooks Memorial $16,786,000 $13,085,000 $29,871,000 Houston Ellington Field $84,235,000 $45,855,000 $130,090,000 Houston Houston-Southwest $3,015,000 $2,398,000 $5,413,000 Houston Pearland Regional $3,078,000 $2,591,000 $5,669,000 Houston Sugar Land Regional $17,839,000 $14,639,000 $32,478,000 Houston West Houston $4,418,000 $3,024,000 $7,442,000 Huntsville Huntsville Municipal $680,000 $548,000 $1,228,000 Ingleside McCampbell-Porter $2,387,000 $1,803,000 $4,190,000 Jacksboro Jacksboro Municipal $56,000 $44,000 $100,000 Jacksonville Cherokee County $2,061,000 $1,814,000 $3,875,000 Jasper Jasper County-Bell Field $167,000 $130,000 $297,000 Jayton Kent County $16,000 $11,000 $27,000 Jefferson Cypress River $43,000 $28,000 $71,000 Junction Kimble County $274,000 $202,000 $476,000 Kenedy Karnes County $76,000 $47,000 $123,000 Kerrville Kerrville Municipal/Louis Schreiner Field $9,013,000 $7,801,000 $16,814,000 Killeen Skylark Field $805,000 $630,000 $1,435,000 Kingsville Kleberg County $644,000 $484,000 $1,128,000 Kirbyville Kirbyville $113,000 $86,000 $199,000 Knox City Harrison Field of Knox City $153,000 $131,000 $284,000 Kountze/Silsbee Hawthorne Field $96,000 $82,000 $178,000 La Grange Fayette Regional Air Center $360,000 $290,000 $650,000 La Porte La Porte Municipal $1,252,000 $1,088,000 $2,340,000 A-63
119 Table A-11: from Texas Airports (cont.) Direct Multiplier Lago Vista Lago Vista TX-Rusty Allen $499,000 $415,000 $914,000 Lamesa Lamesa Municipal $775,000 $649,000 $1,424,000 Lampasas Lampasas $69,000 $55,000 $124,000 Lancaster Lancaster Regional $2,482,000 $1,947,000 $4,429,000 Levelland Levelland Municipal $703,000 $576,000 $1,279,000 Liberty Liberty Municipal $110,000 $82,000 $192,000 Littlefield Taylor Brown Municipal $225,000 $186,000 $411,000 Livingston Livingston Municipal $122,000 $95,000 $217,000 Llano Llano Municipal $309,000 $229,000 $538,000 Lockhart Lockhart Municipal $277,000 $214,000 $491,000 Lufkin Angelina County $4,177,000 $3,381,000 $7,558,000 Madisonville Madisonville Municipal $158,000 $133,000 $291,000 Marfa Marfa Municipal $384,000 $279,000 $663,000 Marshall Harrison County $274,000 $235,000 $509,000 Mason Mason County $36,000 $28,000 $64,000 Mc Camey Upton County $258,000 $177,000 $435,000 Mesquite Mesquite Metro $4,874,000 $3,685,000 $8,559,000 Mexia Mexia-Limestone County $1,349,000 $1,199,000 $2,548,000 Midland Midland Airpark $1,926,000 $1,701,000 $3,627,000 Midlothian/Waxahachie Mid-Way Regional $3,284,000 $2,716,000 $6,000,000 Mineola/Quitman Wood County $211,000 $167,000 $378,000 Mineral Wells Mineral Wells $12,415,000 $11,158,000 $23,573,000 Monahans Roy Hurd Memorial $625,000 $552,000 $1,177,000 Mount Pleasant Mount Pleasant Regional $854,000 $611,000 $1,465,000 Mount Vernon Franklin County $60,000 $43,000 $103,000 Muleshoe Muleshoe Municipal $36,000 $24,000 $60,000 Munday Munday Municipal $105,000 $92,000 $197,000 Nacogdoches A L Mangham Jr. Regional $271,000 $217,000 $488,000 Navasota Navasota Municipal $145,000 $114,000 $259,000 New Braunfels New Braunfels Regional $4,126,000 $3,585,000 $7,711,000 Odessa Odessa-Schlemeyer Field $2,585,000 $2,080,000 $4,665,000 Olney Olney Municipal $20,655,000 $18,747,000 $39,402,000 Orange Orange County $308,000 $244,000 $552,000 Ozona Ozona Municipal $123,000 $97,000 $220,000 Paducah Dan E Richards Municipal $176,000 $152,000 $328,000 Palacios Palacios Municipal $80,000 $61,000 $141,000 Palestine Palestine Municipal $199,000 $153,000 $352,000 Pampa Perry Lefors Field $227,000 $185,000 $412,000 Panhandle Panhandle-Carson County $177,000 $153,000 $330,000 Paris Cox Field $644,000 $562,000 $1,206,000 Pearsall Mc Kinley Field $112,000 $78,000 $190,000 Pecos Pecos Municipal $1,033,000 $787,000 $1,820,000 Perryton Perryton Ochiltree County $709,000 $611,000 $1,320,000 Plains Yoakum County $285,000 $242,000 $527,000 Plainview Hale County $1,964,000 $1,735,000 $3,699,000 Pleasanton Pleasanton Municipal $162,000 $126,000 $288,000 Port Aransas Mustang Beach $94,000 $70,000 $164,000 A-64
120 Table A-11: from Texas Airports (cont.) Direct Multiplier Port Isabel-Cameron County $384,000 $312,000 $696,000 Port Isabel Port Lavaca Calhoun County $550,000 $436,000 $986,000 Port Mansfield Charles R Johnson $17,000 $9,000 $26,000 Presidio Presidio Lely International $63,000 $39,000 $102,000 Quanah Quanah Municipal $147,000 $122,000 $269,000 Refugio Rooke Field $113,000 $89,000 $202,000 Roanoke Northwest Regional $4,386,000 $3,623,000 $8,009,000 Robstown Nueces County $279,000 $213,000 $492,000 Rockdale H H Coffield Regional $36,000 $24,000 $60,000 Rockport Aransas County $2,937,000 $2,326,000 $5,263,000 Rocksprings Edwards County $21,000 $16,000 $37,000 Rockwall Ralph M Hall/Rockwall Municipal $365,000 $307,000 $672,000 San Antonio Stinson Municipal $7,244,000 $5,168,000 $12,412,000 San Marcos San Marcos Regional $12,098,000 $10,573,000 $22,671,000 San Saba San Saba County Municipal $27,000 $21,000 $48,000 Seminole Gaines County $239,000 $176,000 $415,000 Seymour Seymour Municipal $97,000 $79,000 $176,000 Sherman Sherman Municipal $170,000 $137,000 $307,000 Sherman/Denison North Texas Regional/Perrin Field $4,031,000 $3,281,000 $7,312,000 Sinton Alfred C 'Bubba' Thomas $379,000 $298,000 $677,000 Slaton Slaton Municipal $313,000 $264,000 $577,000 Smithville Smithville Crawford Municipal $286,000 $246,000 $532,000 Snyder Winston Field $731,000 $568,000 $1,299,000 Sonora Sonora Municipal $20,000 $15,000 $35,000 Spearman Major Samuel B Cornelius Field $69,000 $50,000 $119,000 Stamford Arledge Field $114,000 $90,000 $204,000 Stephenville Stephenville Clark Regional $731,000 $582,000 $1,313,000 Sulphur Springs Sulphur Springs Municipal $1,930,000 $1,669,000 $3,599,000 Sunray Sunray $330,000 $284,000 $614,000 Sweetwater Avenger Field $334,000 $212,000 $546,000 Tahoka T-Bar $32,000 $25,000 $57,000 Taylor Taylor Municipal $999,000 $826,000 $1,825,000 Temple Draughon-Miller Central Texas Regional $6,216,000 $5,099,000 $11,315,000 Terrell Terrell Municipal $978,000 $661,000 $1,639,000 Throckmorton Throckmorton Municipal $25,000 $17,000 $42,000 Tulia City of Tulia/Swisher County Municipal $46,000 $32,000 $78,000 Uvalde Garner Field $7,671,000 $5,982,000 $13,653,000 Van Horn Culberson County $110,000 $91,000 $201,000 Vega Oldham County $43,000 $31,000 $74,000 A-65
121 Table A-11: from Texas Airports (cont.) Direct Multiplier Vernon Wilbarger County $412,000 $311,000 $723,000 Victoria Victoria Regional $6,544,000 $5,155,000 $11,699,000 McGregor Mc Gregor Executive $3,347,000 $2,912,000 $6,259,000 Waco TSTC Waco $90,750,000 $78,428,000 $169,178,000 Wellington Marian Airpark $43,000 $30,000 $73,000 Weslaco Mid Valley $975,000 $735,000 $1,710,000 Wharton Wharton Regional $810,000 $659,000 $1,469,000 Wheeler Wheeler Municipal $17,000 $9,000 $26,000 Wichita Falls Kickapoo Downtown $1,586,000 $1,260,000 $2,846,000 Wills Point Van Zandt County Regional $102,000 $74,000 $176,000 Wink Winkler County $69,000 $54,000 $123,000 Winnie/Stowell Chambers County-Winnie Stowell $1,404,000 $1,208,000 $2,612,000 Winnsboro Winnsboro Municipal $19,000 $14,000 $33,000 Winters Winters Municipal $20,000 $15,000 $35,000 Zapata Zapata County $84,000 $52,000 $136,000 Other Airports $162,000 $113,000 $275,000 General Aviation Airports $1,531,040,000 $1,045,104,000 $2,576,144,000 All Airports $17,511,859,000 $12,567,152,000 $30,079,011,000 Source: CDM Smith and IMPLAN. A-66
122 Table A-12: On-Airport from Texas Airports Direct On-Airport Multiplier On-Airport On-Airport Commercial Service Airports Abilene Abilene Regional $149,388,000 $117,517,000 $266,905,000 Amarillo Rick Husband Amarillo International $372,276,000 $293,187,000 $665,463,000 Austin Austin-Bergstrom International $1,593,889,000 $1,414,504,000 $3,008,393,000 Beaumont/Port Arthur Jack Brooks Regional $8,400,000 $7,592,000 $15,992,000 Brownsville Brownsville/South Padre Island International $46,714,000 $39,382,000 $86,096,000 College Station Easterwood Field $19,066,000 $16,016,000 $35,082,000 Corpus Christi Corpus Christi International $91,549,000 $80,992,000 $172,541,000 Dallas Dallas Love Field $1,432,397,000 $1,271,188,000 $2,703,585,000 Dallas-Fort Worth Dallas/Fort Worth International $8,889,076,000 $7,888,654,000 $16,777,730,000 El Paso El Paso International $461,146,000 $412,498,000 $873,644,000 Fort Hood (Killeen) Killeen-Fort Hood Regional $16,712,000 $15,907,000 $32,619,000 Harlingen Valley International $96,207,000 $77,857,000 $174,064,000 Houston George Bush Intercontinental/Houston $8,180,043,000 $7,259,419,000 $15,439,462,000 Houston William P Hobby $993,963,000 $882,096,000 $1,876,059,000 Laredo Laredo International $46,759,000 $39,640,000 $86,399,000 Longview East Texas Regional $31,656,000 $25,891,000 $57,547,000 Lubbock Lubbock Preston Smith International $91,126,000 $77,498,000 $168,624,000 Mc Allen Mc Allen Miller International $65,642,000 $56,372,000 $122,014,000 Midland Midland International Air and Space Port $129,369,000 $104,926,000 $234,295,000 San Angelo San Angelo Regional/Mathis Field $31,478,000 $27,136,000 $58,614,000 San Antonio San Antonio International $1,091,587,000 $968,734,000 $2,060,321,000 Texarkana, AR Texarkana Regional Airport-Webb Field $9,657,000 $7,666,000 $17,323,000 Tyler Tyler Pounds Regional $44,506,000 $35,959,000 $80,465,000 Waco Waco Regional $35,783,000 $29,221,000 $65,004,000 Wichita Falls Sheppard AFB/Wichita Falls Municipal $14,004,000 $12,480,000 $26,484,000 Commercial Service Airports $23,942,393,000 $21,162,332,000 $45,104,725,000 General Aviation Airports Albany Albany Municipal $172,000 $147,000 $319,000 Alice Alice International $898,000 $703,000 $1,601,000 Alpine Alpine-Casparis Municipal $5,607,000 $4,915,000 $10,522,000 Amarillo Tradewind $880,000 $804,000 $1,684,000 A-67
123 Table A-12: On-Airport from Texas Airports (cont.) Direct Multiplier On-Airport On-Airport On-Airport Anahuac Chambers County $506,000 $436,000 $942,000 Andrews Andrews County $676,000 $566,000 $1,242,000 Angleton/Lake Jackson Texas Gulf Coast Regional $6,875,000 $5,951,000 $12,826,000 Arlington Arlington Municipal $115,004,000 $101,188,000 $216,192,000 Athens Athens Municipal $1,096,000 $853,000 $1,949,000 Atlanta Hall-Miller Municipal $69,000 $63,000 $132,000 Ballinger Bruce Field $69,000 $63,000 $132,000 Bay City Bay City Regional $1,232,000 $1,000,000 $2,232,000 Beaumont Beaumont Municipal $941,000 $749,000 $1,690,000 Beeville Beeville Municipal $274,000 $221,000 $495,000 Big Lake Reagan County $69,000 $63,000 $132,000 Big Spring Big Spring Mc Mahon- Wrinkle $7,243,000 $5,766,000 $13,009,000 Bonham Jones Field $781,000 $606,000 $1,387,000 Borger Hutchinson County $6,616,000 $5,176,000 $11,792,000 Bowie Bowie Municipal $233,000 $214,000 $447,000 Brady Curtis Field $750,000 $653,000 $1,403,000 Breckenridge Stephens County $3,652,000 $2,828,000 $6,480,000 Brenham Brenham Municipal $2,519,000 $1,957,000 $4,476,000 Bridgeport Bridgeport Municipal $380,000 $293,000 $673,000 Brownfield Terry County $648,000 $528,000 $1,176,000 Brownwood Brownwood Regional $4,597,000 $3,694,000 $8,291,000 Bryan Coulter Field $4,039,000 $3,181,000 $7,220,000 Burnet Burnet Municipal Kate Craddock Field $2,570,000 $2,071,000 $4,641,000 Caddo Mills Caddo Mills Municipal $479,000 $375,000 $854,000 Caldwell Caldwell Municipal $274,000 $221,000 $495,000 Cameron Cameron Municipal Airpark $31,000 $28,000 $59,000 Canadian Hemphill County $395,000 $314,000 $709,000 Carrizo Springs Dimmit County $3,444,000 $2,653,000 $6,097,000 Carthage Panola County-Sharpe Field $138,000 $126,000 $264,000 Castroville Castroville Municipal $1,652,000 $1,320,000 $2,972,000 Center Center Municipal $82,000 $74,000 $156,000 Childress Childress Municipal $2,408,000 $1,872,000 $4,280,000 Cisco Cisco Municipal $15,000 $13,000 $28,000 Clarksville Clarksville/Red River County-J D Trissell Field $77,000 $61,000 $138,000 Cleburne Cleburne Regional $3,845,000 $3,134,000 $6,979,000 Cleveland Cleveland Municipal $343,000 $285,000 $628,000 Clifton Clifton Municipal/Isenhower Field $863,000 $666,000 $1,529,000 Coleman Coleman Municipal $321,000 $293,000 $614,000 Colorado City Colorado City $390,000 $300,000 $690,000 Columbus Robert R Wells Jr. $51,000 $47,000 $98,000 A-68
124 Table A-12: On-Airport from Texas Airports (cont.) Direct On-Airport Multiplier On-Airport On-Airport Comanche Comanche County-City $69,000 $63,000 $132,000 Commerce Commerce Municipal $274,000 $221,000 $495,000 Corsicana C David Campbell Field- Corsicana Municipal $658,000 $521,000 $1,179,000 Cotulla Cotulla-La Salle County $906,000 $701,000 $1,607,000 Crane Crane County $12,000 $11,000 $23,000 Crockett Houston County $69,000 $63,000 $132,000 Crosbyton Crosbyton Municipal $977,000 $753,000 $1,730,000 Dalhart Dalhart Municipal $2,254,000 $1,834,000 $4,088,000 Dallas Addison $233,041,000 $183,289,000 $416,330,000 Dallas Dallas CBD Vertiport $312,000 $286,000 $598,000 Dallas Dallas Executive $17,059,000 $14,275,000 $31,334,000 McKinney McKinney National $85,948,000 $67,661,000 $153,609,000 Decatur Decatur Municipal $4,585,000 $3,541,000 $8,126,000 Del Rio Del Rio International $8,594,000 $7,117,000 $15,711,000 Dell City Dell City Municipal $177,000 $136,000 $313,000 Denton Denton Enterprise $70,317,000 $54,324,000 $124,641,000 Denver City Denver City $20,000 $18,000 $38,000 Desoto Desoto Heliport $3,935,000 $3,073,000 $7,008,000 Devine Devine Municipal $1,256,000 $971,000 $2,227,000 Dimmitt Dimmitt Municipal $246,000 $199,000 $445,000 Dryden Terrell County $229,000 $180,000 $409,000 Dublin Dublin Municipal $227,000 $178,000 $405,000 Dumas Moore County $2,447,000 $2,175,000 $4,622,000 Eagle Lake Eagle Lake $2,611,000 $2,033,000 $4,644,000 Eagle Pass Maverick County Memorial International $515,000 $426,000 $941,000 Eastland Eastland Municipal $1,224,000 $950,000 $2,174,000 Edinburg South Texas International at Edinburg $2,512,000 $2,292,000 $4,804,000 Edna Jackson County $225,000 $177,000 $402,000 Ennis Ennis Municipal $978,000 $773,000 $1,751,000 Fabens Fabens $386,000 $301,000 $687,000 Falfurrias Brooks County $50,000 $46,000 $96,000 Floydada Floydada Municipal $1,296,000 $998,000 $2,294,000 Fort Stockton Fort Stockton-Pecos County $709,000 $548,000 $1,257,000 Fort Worth Fort Worth Alliance $261,931,000 $202,573,000 $464,504,000 Fort Worth Fort Worth Meacham International $141,703,000 $110,005,000 $251,708,000 Fort Worth Fort Worth Spinks $16,980,000 $13,165,000 $30,145,000 Fredericksburg Gillespie County $5,967,000 $5,064,000 $11,031,000 Gainesville Gainesville Municipal $91,298,000 $70,274,000 $161,572,000 Galveston Scholes International at Galveston $19,712,000 $15,690,000 $35,402,000 Garland Garland/DFW Heloplex $6,856,000 $5,326,000 $12,182,000 Gatesville Gatesville Municipal $634,000 $489,000 $1,123,000 A-69
125 Table A-12: On-Airport from Texas Airports (cont.) Direct Multiplier On-Airport On-Airport On-Airport George West Live Oak County $69,000 $63,000 $132,000 Georgetown Georgetown Municipal $20,010,000 $15,828,000 $35,838,000 Giddings Giddings-Lee County $437,000 $346,000 $783,000 Gilmer Fox Stephens Field-Gilmer Municipal $629,000 $488,000 $1,117,000 Gladewater Gladewater Municipal $388,000 $303,000 $691,000 Gonzales Roger M. Dreyer Memorial $69,000 $63,000 $132,000 Graford Possum Kingdom $15,000 $13,000 $28,000 Graham Graham Municipal $909,000 $756,000 $1,665,000 Granbury Granbury Regional $9,593,000 $7,527,000 $17,120,000 Grand Prairie Grand Prairie Municipal $198,028,000 $152,691,000 $350,719,000 Greenville Majors $2,083,652,000 $1,901,318,000 $3,984,970,000 Gruver Gruver Municipal $1,067,000 $821,000 $1,888,000 Hallettsville Hallettsville Municipal $149,000 $129,000 $278,000 Hamilton Hamilton Municipal $103,000 $94,000 $197,000 Haskell Haskell Municipal $581,000 $454,000 $1,035,000 Hearne Hearne Municipal $777,000 $608,000 $1,385,000 Hebbronville Jim Hogg County $138,000 $126,000 $264,000 Henderson Rusk County $636,000 $576,000 $1,212,000 Hereford Hereford Municipal $1,732,000 $1,362,000 $3,094,000 Hillsboro Hillsboro Municipal $1,675,000 $1,323,000 $2,998,000 Hondo South Texas Regional at Hondo $5,628,000 $4,448,000 $10,076,000 Houston Conroe-North Houston Regional $59,217,000 $49,933,000 $109,150,000 Houston David Wayne Hooks Memorial $37,979,000 $30,580,000 $68,559,000 Houston Ellington Field $135,723,000 $123,107,000 $258,830,000 Houston Houston-Southwest $4,664,000 $3,674,000 $8,338,000 Houston Pearland Regional $7,633,000 $6,050,000 $13,683,000 Houston Sugar Land Regional $39,803,000 $32,083,000 $71,886,000 Houston West Houston $7,841,000 $6,841,000 $14,682,000 Huntsville Huntsville Municipal $624,000 $491,000 $1,115,000 Ingleside McCampbell-Porter $2,802,000 $2,242,000 $5,044,000 Jacksboro Jacksboro Municipal $178,000 $146,000 $324,000 Jacksonville Cherokee County $4,679,000 $3,671,000 $8,350,000 Jasper Jasper County-Bell Field $274,000 $221,000 $495,000 Jayton Kent County $5,000 $4,000 $9,000 Jefferson Cypress River $69,000 $63,000 $132,000 Junction Kimble County $286,000 $245,000 $531,000 Kenedy Karnes County $207,000 $189,000 $396,000 Kerrville Kerrville Municipal/Louis Schreiner Field $13,944,000 $10,784,000 $24,728,000 Killeen Skylark Field $1,659,000 $1,339,000 $2,998,000 Kingsville Kleberg County $513,000 $399,000 $912,000 Kirbyville Kirbyville $133,000 $106,000 $239,000 A-70
126 Table A-12: On-Airport from Texas Airports (cont.) Direct On-Airport Multiplier On-Airport On-Airport Knox City Harrison Field of Knox City $710,000 $547,000 $1,257,000 Kountze/Silsbee Hawthorne Field $336,000 $263,000 $599,000 La Grange Fayette Regional Air Center $866,000 $680,000 $1,546,000 La Porte La Porte Municipal $4,429,000 $3,425,000 $7,854,000 Lago Vista Lago Vista TX-Rusty Allen $1,529,000 $1,255,000 $2,784,000 Lamesa Lamesa Municipal $2,204,000 $1,702,000 $3,906,000 Lampasas Lampasas $135,000 $124,000 $259,000 Lancaster Lancaster Regional $2,272,000 $1,893,000 $4,165,000 Levelland Levelland Municipal $2,404,000 $1,918,000 $4,322,000 Liberty Liberty Municipal $69,000 $63,000 $132,000 Littlefield Taylor Brown Municipal $894,000 $697,000 $1,591,000 Livingston Livingston Municipal $274,000 $221,000 $495,000 Llano Llano Municipal $556,000 $484,000 $1,040,000 Lockhart Lockhart Municipal $557,000 $459,000 $1,016,000 Lufkin Angelina County $9,830,000 $7,959,000 $17,789,000 Madisonville Madisonville Municipal $387,000 $301,000 $688,000 Marfa Marfa Municipal $432,000 $353,000 $785,000 Marshall Harrison County $336,000 $259,000 $595,000 Mason Mason County $85,000 $78,000 $163,000 Mc Camey Upton County $54,000 $49,000 $103,000 Mesquite Mesquite Metro $6,369,000 $5,265,000 $11,634,000 Mexia Mexia-Limestone County $5,317,000 $4,101,000 $9,418,000 Midland Midland Airpark $7,094,000 $5,457,000 $12,551,000 Midlothian/Waxahachie Mid-Way Regional $8,789,000 $7,139,000 $15,928,000 Mineola/Quitman Wood County $377,000 $300,000 $677,000 Mineral Wells Mineral Wells $42,768,000 $33,025,000 $75,793,000 Monahans Roy Hurd Memorial $1,347,000 $1,039,000 $2,386,000 Mount Pleasant Mount Pleasant Regional $1,993,000 $1,659,000 $3,652,000 Mount Vernon Franklin County $10,000 $9,000 $19,000 Muleshoe Muleshoe Municipal $69,000 $63,000 $132,000 Munday Munday Municipal $531,000 $409,000 $940,000 Nacogdoches A L Mangham Jr. Regional $287,000 $230,000 $517,000 Navasota Navasota Municipal $253,000 $202,000 $455,000 New Braunfels New Braunfels Regional $11,435,000 $9,170,000 $20,605,000 Odessa Odessa-Schlemeyer Field $3,561,000 $2,833,000 $6,394,000 Olney Olney Municipal $81,132,000 $62,431,000 $143,563,000 Orange Orange County $669,000 $535,000 $1,204,000 Ozona Ozona Municipal $274,000 $221,000 $495,000 Paducah Dan E Richards Municipal $889,000 $685,000 $1,574,000 Palacios Palacios Municipal $52,000 $47,000 $99,000 Palestine Palestine Municipal $274,000 $221,000 $495,000 Pampa Perry Lefors Field $480,000 $379,000 $859,000 Panhandle Panhandle-Carson County $911,000 $705,000 $1,616,000 Paris Cox Field $1,971,000 $1,521,000 $3,492,000 Pearsall Mc Kinley Field $413,000 $347,000 $760,000 Pecos Pecos Municipal $1,011,000 $863,000 $1,874,000 A-71
127 Table A-12: On-Airport from Texas Airports (cont.) Direct Multiplier On-Airport On-Airport On-Airport Perryton Perryton Ochiltree County $1,835,000 $1,420,000 $3,255,000 Plains Yoakum County $887,000 $687,000 $1,574,000 Plainview Hale County $6,095,000 $4,697,000 $10,792,000 Pleasanton Pleasanton Municipal $201,000 $163,000 $364,000 Port Aransas Mustang Beach $69,000 $63,000 $132,000 Port Isabel Port Isabel-Cameron County $967,000 $750,000 $1,717,000 Port Lavaca Calhoun County $1,577,000 $1,246,000 $2,823,000 Port Mansfield Charles R Johnson $69,000 $63,000 $132,000 Presidio Presidio Lely International $48,000 $43,000 $91,000 Quanah Quanah Municipal $598,000 $469,000 $1,067,000 Refugio Rooke Field $331,000 $272,000 $603,000 Roanoke Northwest Regional $10,394,000 $8,047,000 $18,441,000 Robstown Nueces County $392,000 $311,000 $703,000 Rockdale H H Coffield Regional $69,000 $63,000 $132,000 Rockport Aransas County $3,327,000 $2,677,000 $6,004,000 Rocksprings Edwards County $8,000 $6,000 $14,000 Rockwall Ralph M Hall/Rockwall Municipal $764,000 $594,000 $1,358,000 San Antonio Stinson Municipal $9,633,000 $7,962,000 $17,595,000 San Marcos San Marcos Regional $38,791,000 $29,905,000 $68,696,000 San Saba San Saba County Municipal $7,000 $6,000 $13,000 Seminole Gaines County $343,000 $285,000 $628,000 Seymour Seymour Municipal $364,000 $282,000 $646,000 Sherman Sherman Municipal $464,000 $377,000 $841,000 Sherman/Denison North Texas Regional/Perrin Field $9,160,000 $7,252,000 $16,412,000 Sinton Alfred C 'Bubba' Thomas $929,000 $724,000 $1,653,000 Slaton Slaton Municipal $949,000 $739,000 $1,688,000 Smithville Smithville Crawford Municipal $941,000 $730,000 $1,671,000 Snyder Winston Field $2,261,000 $1,809,000 $4,070,000 Sonora Sonora Municipal $58,000 $52,000 $110,000 Spearman Major Samuel B Cornelius Field $69,000 $63,000 $132,000 Stamford Arledge Field $423,000 $335,000 $758,000 Stephenville Stephenville Clark Regional $1,256,000 $981,000 $2,237,000 Sulphur Springs Sulphur Springs Municipal $4,620,000 $3,626,000 $8,246,000 Sunray Sunray $1,519,000 $1,171,000 $2,690,000 Sweetwater Avenger Field $757,000 $661,000 $1,418,000 Tahoka T-Bar $89,000 $69,000 $158,000 Taylor Taylor Municipal $2,154,000 $1,713,000 $3,867,000 Temple Draughon-Miller Central Texas Regional $12,476,000 $9,922,000 $22,398,000 Terrell Terrell Municipal $1,334,000 $1,098,000 $2,432,000 A-72
128 Table A-12: On-Airport from Texas Airports (cont.) Direct On-Airport Multiplier On-Airport On-Airport Throckmorton Throckmorton Municipal $7,000 $6,000 $13,000 Tulia City of Tulia/Swisher County Municipal $69,000 $63,000 $132,000 Uvalde Garner Field $21,634,000 $17,367,000 $39,001,000 Van Horn Culberson County $480,000 $379,000 $859,000 Vega Oldham County $69,000 $63,000 $132,000 Vernon Wilbarger County $1,217,000 $989,000 $2,206,000 Victoria Victoria Regional $19,123,000 $15,631,000 $34,754,000 McGregor Mc Gregor Executive $9,318,000 $7,199,000 $16,517,000 Waco TSTC Waco $292,847,000 $227,286,000 $520,133,000 Wellington Marian Airpark $69,000 $63,000 $132,000 Weslaco Mid Valley $980,000 $823,000 $1,803,000 Wharton Wharton Regional $1,507,000 $1,201,000 $2,708,000 Wheeler Wheeler Municipal $69,000 $63,000 $132,000 Wichita Falls Kickapoo Downtown $2,715,000 $2,292,000 $5,007,000 Wills Point Van Zandt County Regional $85,000 $70,000 $155,000 Wink Winkler County $274,000 $221,000 $495,000 Winnie/Stowell Chambers County-Winnie Stowell $7,383,000 $5,727,000 $13,110,000 Winnsboro Winnsboro Municipal $35,000 $32,000 $67,000 Winters Winters Municipal $15,000 $13,000 $28,000 Zapata Zapata County $151,000 $138,000 $289,000 Other Airports $306,000 $270,000 $576,000 General Aviation Airports $4,498,137,000 $3,823,511,000 $8,321,648,000 All Airports $28,440,530,000 $24,985,843,000 $53,426,373,000 Source: CDM Smith and IMPLAN. A-73
129 Table A-13: Construction from Texas Airports Direct Construction Multiplier Construction Construction Commercial Service Airports Abilene Abilene Regional $16,941,000 $16,023,000 $32,964,000 Amarillo Rick Husband Amarillo International $13,415,000 $12,688,000 $26,103,000 Austin Austin-Bergstrom International $60,763,000 $57,473,000 $118,236,000 Beaumont/Port Arthur Jack Brooks Regional $3,469,000 $3,281,000 $6,750,000 Brownsville Brownsville/South Padre Island International $14,306,000 $13,532,000 $27,838,000 College Station Easterwood Field $7,342,000 $6,944,000 $14,286,000 Corpus Christi Corpus Christi International $57,881,000 $54,747,000 $112,628,000 Dallas Dallas Love Field $26,421,000 $24,991,000 $51,412,000 Dallas-Fort Worth Dallas/Fort Worth International $511,775,000 $484,066,000 $995,841,000 El Paso El Paso International $35,996,000 $34,048,000 $70,044,000 Fort Hood (Killeen) Killeen-Fort Hood Regional $3,294,000 $3,116,000 $6,410,000 Harlingen Valley International $9,462,000 $8,950,000 $18,412,000 Houston George Bush Intercontinental/Houston $101,474,000 $95,979,000 $197,453,000 Houston William P Hobby $84,680,000 $80,096,000 $164,776,000 Laredo Laredo International $14,857,000 $14,052,000 $28,909,000 Longview East Texas Regional $9,623,000 $9,102,000 $18,725,000 Lubbock Lubbock Preston Smith International $18,144,000 $17,161,000 $35,305,000 Mc Allen Mc Allen Miller International $15,195,000 $14,372,000 $29,567,000 Midland Midland International Air and Space Port $29,635,000 $28,031,000 $57,666,000 San Angelo San Angelo Regional/Mathis Field $7,476,000 $7,072,000 $14,548,000 San Antonio San Antonio International $61,374,000 $58,051,000 $119,425,000 Texarkana, AR Texarkana Regional Airport-Webb Field $3,625,000 $2,613,000 $6,238,000 Tyler Tyler Pounds Regional $12,309,000 $11,643,000 $23,952,000 Waco Waco Regional $7,173,000 $6,784,000 $13,957,000 Wichita Falls Sheppard AFB/Wichita Falls Municipal $4,146,000 $3,922,000 $8,068,000 Commercial Service Airports $1,130,776,000 $1,068,737,000 $2,199,513,000 General Aviation Airports Albany Albany Municipal $63,000 $60,000 $123,000 Alice Alice International $1,163,000 $1,099,000 $2,262,000 Alpine Alpine-Casparis Municipal $1,088,000 $1,028,000 $2,116,000 Amarillo Tradewind $0 $0 $0 A-74
130 Table A-13: Construction from Texas Airports (cont.) Direct Construction Multiplier Construction A-75 Construction Anahuac Chambers County $145,000 $138,000 $283,000 Andrews Andrews County $87,000 $82,000 $169,000 Angleton/Lake Jackson Texas Gulf Coast Regional $152,000 $143,000 $295,000 Arlington Arlington Municipal $4,987,000 $4,717,000 $9,704,000 Athens Athens Municipal $102,000 $96,000 $198,000 Atlanta Hall-Miller Municipal $4,000 $4,000 $8,000 Ballinger Bruce Field $0 $0 $0 Bay City Bay City Regional $242,000 $229,000 $471,000 Beaumont Beaumont Municipal $1,685,000 $1,593,000 $3,278,000 Beeville Beeville Municipal $21,000 $21,000 $42,000 Big Lake Reagan County $17,000 $16,000 $33,000 Big Spring Big Spring Mc Mahon- Wrinkle $984,000 $932,000 $1,916,000 Bonham Jones Field $243,000 $231,000 $474,000 Borger Hutchinson County $99,000 $94,000 $193,000 Bowie Bowie Municipal $22,000 $20,000 $42,000 Brady Curtis Field $60,000 $57,000 $117,000 Breckenridge Stephens County $170,000 $160,000 $330,000 Brenham Brenham Municipal $434,000 $411,000 $845,000 Bridgeport Bridgeport Municipal $47,000 $44,000 $91,000 Brownfield Terry County $181,000 $171,000 $352,000 Brownwood Brownwood Regional $227,000 $214,000 $441,000 Bryan Coulter Field $1,937,000 $1,833,000 $3,770,000 Burnet Burnet Municipal Kate Craddock Field $217,000 $206,000 $423,000 Caddo Mills Caddo Mills Municipal $61,000 $57,000 $118,000 Caldwell Caldwell Municipal $43,000 $40,000 $83,000 Cameron Cameron Municipal Airpark $3,000 $3,000 $6,000 Canadian Hemphill County $22,000 $21,000 $43,000 Carrizo Springs Dimmit County $78,000 $73,000 $151,000 Carthage Panola County-Sharpe Field $19,000 $17,000 $36,000 Castroville Castroville Municipal $227,000 $215,000 $442,000 Center Center Municipal $111,000 $105,000 $216,000 Childress Childress Municipal $194,000 $184,000 $378,000 Cisco Cisco Municipal $0 $0 $0 Clarksville Clarksville/Red River County-J D Trissell Field $18,000 $18,000 $36,000 Cleburne Cleburne Regional $567,000 $537,000 $1,104,000 Cleveland Cleveland Municipal $381,000 $361,000 $742,000 Clifton Clifton Municipal/Isenhower Field $153,000 $145,000 $298,000 Coleman Coleman Municipal $1,000 $1,000 $2,000 Colorado City Colorado City $96,000 $91,000 $187,000 Columbus Robert R Wells Jr. $7,000 $7,000 $14,000 Comanche Comanche County-City $0 $0 $0
131 Table A-13: Construction from Texas Airports (cont.) Direct Construction Multiplier Construction Construction Commerce Commerce Municipal $708,000 $670,000 $1,378,000 Corsicana C David Campbell Field- Corsicana Municipal $82,000 $78,000 $160,000 Cotulla Cotulla-La Salle County $53,000 $51,000 $104,000 Crane Crane County $22,000 $21,000 $43,000 Crockett Houston County $4,000 $3,000 $7,000 Crosbyton Crosbyton Municipal $165,000 $155,000 $320,000 Dalhart Dalhart Municipal $270,000 $255,000 $525,000 Dallas Addison $15,581,000 $14,737,000 $30,318,000 Dallas Dallas CBD Vertiport $0 $0 $0 Dallas Dallas Executive $8,936,000 $8,453,000 $17,389,000 McKinney McKinney National $26,119,000 $24,706,000 $50,825,000 Decatur Decatur Municipal $146,000 $139,000 $285,000 Del Rio Del Rio International $1,507,000 $1,426,000 $2,933,000 Dell City Dell City Municipal $31,000 $29,000 $60,000 Denton Denton Enterprise $7,638,000 $7,224,000 $14,862,000 Denver City Denver City $4,000 $3,000 $7,000 Desoto Desoto Heliport $40,000 $38,000 $78,000 Devine Devine Municipal $78,000 $75,000 $153,000 Dimmitt Dimmitt Municipal $31,000 $29,000 $60,000 Dryden Terrell County $20,000 $18,000 $38,000 Dublin Dublin Municipal $59,000 $56,000 $115,000 Dumas Moore County $897,000 $849,000 $1,746,000 Eagle Lake Eagle Lake $316,000 $298,000 $614,000 Eagle Pass Maverick County Memorial International $22,000 $21,000 $43,000 Eastland Eastland Municipal $1,103,000 $1,044,000 $2,147,000 Edinburg South Texas International at Edinburg $2,635,000 $2,493,000 $5,128,000 Edna Jackson County $19,000 $19,000 $38,000 Ennis Ennis Municipal $157,000 $148,000 $305,000 Fabens Fabens $77,000 $73,000 $150,000 Falfurrias Brooks County $500,000 $473,000 $973,000 Floydada Floydada Municipal $181,000 $171,000 $352,000 Fort Stockton Fort Stockton-Pecos County $103,000 $98,000 $201,000 Fort Worth Fort Worth Alliance $20,617,000 $19,500,000 $40,117,000 Fort Worth Fort Worth Meacham International $30,741,000 $29,076,000 $59,817,000 Fort Worth Fort Worth Spinks $1,545,000 $1,461,000 $3,006,000 Fredericksburg Gillespie County $994,000 $941,000 $1,935,000 Gainesville Gainesville Municipal $5,442,000 $5,147,000 $10,589,000 Galveston Scholes International at Galveston $913,000 $863,000 $1,776,000 Garland Garland/DFW Heloplex $1,382,000 $1,307,000 $2,689,000 Gatesville Gatesville Municipal $157,000 $148,000 $305,000 George West Live Oak County $443,000 $418,000 $861,000 Georgetown Georgetown Municipal $4,440,000 $4,200,000 $8,640,000 A-76
132 Table A-13: Construction from Texas Airports (cont.) Direct Construction Multiplier Construction Construction Giddings Giddings-Lee County $52,000 $49,000 $101,000 Gilmer Fox Stephens Field-Gilmer Municipal $90,000 $86,000 $176,000 Gladewater Gladewater Municipal $116,000 $109,000 $225,000 Gonzales Roger M. Dreyer Memorial $0 $0 $0 Graford Possum Kingdom $0 $0 $0 Graham Graham Municipal $82,000 $77,000 $159,000 Granbury Granbury Regional $231,000 $218,000 $449,000 Grand Prairie Grand Prairie Municipal $2,658,000 $2,515,000 $5,173,000 Greenville Majors $50,244,000 $47,524,000 $97,768,000 Gruver Gruver Municipal $181,000 $171,000 $352,000 Hallettsville Hallettsville Municipal $32,000 $30,000 $62,000 Hamilton Hamilton Municipal $56,000 $52,000 $108,000 Haskell Haskell Municipal $115,000 $108,000 $223,000 Hearne Hearne Municipal $120,000 $113,000 $233,000 Hebbronville Jim Hogg County $56,000 $53,000 $109,000 Henderson Rusk County $192,000 $181,000 $373,000 Hereford Hereford Municipal $247,000 $233,000 $480,000 Hillsboro Hillsboro Municipal $347,000 $329,000 $676,000 Hondo South Texas Regional at Hondo $513,000 $485,000 $998,000 Houston Conroe-North Houston Regional $9,370,000 $8,863,000 $18,233,000 Houston David Wayne Hooks Memorial $4,435,000 $4,195,000 $8,630,000 Houston Ellington Field $29,620,000 $28,017,000 $57,637,000 Houston Houston-Southwest $1,500,000 $1,419,000 $2,919,000 Houston Pearland Regional $334,000 $316,000 $650,000 Houston Sugar Land Regional $5,405,000 $5,113,000 $10,518,000 Houston West Houston $133,000 $125,000 $258,000 Huntsville Huntsville Municipal $63,000 $59,000 $122,000 Ingleside McCampbell-Porter $6,320,000 $5,978,000 $12,298,000 Jacksboro Jacksboro Municipal $5,000 $5,000 $10,000 Jacksonville Cherokee County $664,000 $627,000 $1,291,000 Jasper Jasper County-Bell Field $31,000 $29,000 $60,000 Jayton Kent County $64,000 $61,000 $125,000 Jefferson Cypress River $27,000 $25,000 $52,000 Junction Kimble County $685,000 $647,000 $1,332,000 Kenedy Karnes County $6,000 $5,000 $11,000 Kerrville Kerrville Municipal/Louis Schreiner Field $1,443,000 $1,365,000 $2,808,000 Killeen Skylark Field $286,000 $270,000 $556,000 Kingsville Kleberg County $1,800,000 $1,702,000 $3,502,000 Kirbyville Kirbyville $47,000 $45,000 $92,000 Knox City Harrison Field of Knox City $120,000 $113,000 $233,000 Kountze/Silsbee Hawthorne Field $22,000 $21,000 $43,000 A-77
133 Table A-13: Construction from Texas Airports (cont.) Direct Construction Multiplier Construction Construction La Grange Fayette Regional Air Center $168,000 $160,000 $328,000 La Porte La Porte Municipal $357,000 $337,000 $694,000 Lago Vista Lago Vista TX-Rusty Allen $270,000 $256,000 $526,000 Lamesa Lamesa Municipal $897,000 $849,000 $1,746,000 Lampasas Lampasas $9,000 $8,000 $17,000 Lancaster Lancaster Regional $714,000 $676,000 $1,390,000 Levelland Levelland Municipal $88,000 $83,000 $171,000 Liberty Liberty Municipal $7,000 $6,000 $13,000 Littlefield Taylor Brown Municipal $120,000 $113,000 $233,000 Livingston Livingston Municipal $15,000 $14,000 $29,000 Llano Llano Municipal $403,000 $381,000 $784,000 Lockhart Lockhart Municipal $34,000 $33,000 $67,000 Lufkin Angelina County $2,378,000 $2,249,000 $4,627,000 Madisonville Madisonville Municipal $89,000 $83,000 $172,000 Marfa Marfa Municipal $348,000 $330,000 $678,000 Marshall Harrison County $54,000 $51,000 $105,000 Mason Mason County $28,000 $27,000 $55,000 Mc Camey Upton County $976,000 $923,000 $1,899,000 Mesquite Mesquite Metro $2,175,000 $2,057,000 $4,232,000 Mexia Mexia-Limestone County $450,000 $425,000 $875,000 Midland Midland Airpark $618,000 $584,000 $1,202,000 Midlothian/Waxahachie Mid-Way Regional $1,737,000 $1,643,000 $3,380,000 Mineola/Quitman Wood County $88,000 $83,000 $171,000 Mineral Wells Mineral Wells $740,000 $700,000 $1,440,000 Monahans Roy Hurd Memorial $431,000 $407,000 $838,000 Mount Pleasant Mount Pleasant Regional $532,000 $504,000 $1,036,000 Mount Vernon Franklin County $193,000 $182,000 $375,000 Muleshoe Muleshoe Municipal $0 $0 $0 Munday Munday Municipal $90,000 $85,000 $175,000 Nacogdoches A L Mangham Jr. Regional $43,000 $40,000 $83,000 Navasota Navasota Municipal $40,000 $39,000 $79,000 New Braunfels New Braunfels Regional $473,000 $447,000 $920,000 Odessa Odessa-Schlemeyer Field $1,382,000 $1,308,000 $2,690,000 Olney Olney Municipal $1,153,000 $1,091,000 $2,244,000 Orange Orange County $84,000 $80,000 $164,000 Ozona Ozona Municipal $42,000 $40,000 $82,000 Paducah Dan E Richards Municipal $150,000 $141,000 $291,000 Palacios Palacios Municipal $15,000 $13,000 $28,000 Palestine Palestine Municipal $192,000 $182,000 $374,000 Pampa Perry Lefors Field $30,000 $28,000 $58,000 Panhandle Panhandle-Carson County $152,000 $144,000 $296,000 Paris Cox Field $101,000 $96,000 $197,000 Pearsall Mc Kinley Field $15,000 $14,000 $29,000 Pecos Pecos Municipal $497,000 $471,000 $968,000 Perryton Perryton Ochiltree County $511,000 $482,000 $993,000 Plains Yoakum County $123,000 $116,000 $239,000 A-78
134 Table A-13: Construction from Texas Airports (cont.) Direct Construction Multiplier Construction A-79 Construction Plainview Hale County $1,244,000 $1,176,000 $2,420,000 Pleasanton Pleasanton Municipal $32,000 $30,000 $62,000 Port Aransas Mustang Beach $10,000 $9,000 $19,000 Port Isabel Port Isabel-Cameron County $566,000 $535,000 $1,101,000 Port Lavaca Calhoun County $158,000 $149,000 $307,000 Port Mansfield Charles R Johnson $0 $0 $0 Presidio Presidio Lely International $150,000 $141,000 $291,000 Quanah Quanah Municipal $113,000 $107,000 $220,000 Refugio Rooke Field $195,000 $184,000 $379,000 Roanoke Northwest Regional $496,000 $470,000 $966,000 Robstown Nueces County $234,000 $221,000 $455,000 Rockdale H H Coffield Regional $0 $0 $0 Rockport Aransas County $328,000 $311,000 $639,000 Rocksprings Edwards County $38,000 $36,000 $74,000 Rockwall Ralph M Hall/Rockwall Municipal $87,000 $83,000 $170,000 San Antonio Stinson Municipal $5,587,000 $5,284,000 $10,871,000 San Marcos San Marcos Regional $4,036,000 $3,817,000 $7,853,000 San Saba San Saba County Municipal $3,000 $3,000 $6,000 Seminole Gaines County $383,000 $363,000 $746,000 Seymour Seymour Municipal $60,000 $56,000 $116,000 Sherman Sherman Municipal $15,000 $14,000 $29,000 Sherman/Denison North Texas Regional/Perrin Field $1,426,000 $1,348,000 $2,774,000 Sinton Alfred C 'Bubba' Thomas $130,000 $124,000 $254,000 Slaton Slaton Municipal $92,000 $87,000 $179,000 Smithville Smithville Crawford Municipal $79,000 $74,000 $153,000 Snyder Winston Field $53,000 $49,000 $102,000 Sonora Sonora Municipal $6,000 $5,000 $11,000 Spearman Major Samuel B Cornelius Field $26,000 $24,000 $50,000 Stamford Arledge Field $60,000 $56,000 $116,000 Stephenville Stephenville Clark Regional $1,268,000 $1,199,000 $2,467,000 Sulphur Springs Sulphur Springs Municipal $1,570,000 $1,485,000 $3,055,000 Sunray Sunray $254,000 $241,000 $495,000 Sweetwater Avenger Field $132,000 $125,000 $257,000 Tahoka T-Bar $15,000 $14,000 $29,000 Taylor Taylor Municipal $1,027,000 $971,000 $1,998,000 Temple Draughon-Miller Central Texas Regional $5,260,000 $4,976,000 $10,236,000 Terrell Terrell Municipal $775,000 $732,000 $1,507,000 Throckmorton Throckmorton Municipal $100,000 $95,000 $195,000 Tulia City of Tulia/Swisher County Municipal $0 $0 $0
135 Table A-13: Construction from Texas Airports (cont.) Direct Construction Multiplier Construction Construction Uvalde Garner Field $2,253,000 $2,132,000 $4,385,000 Van Horn Culberson County $32,000 $30,000 $62,000 Vega Oldham County $2,000 $2,000 $4,000 Vernon Wilbarger County $159,000 $150,000 $309,000 Victoria Victoria Regional $1,510,000 $1,428,000 $2,938,000 McGregor Mc Gregor Executive $2,758,000 $2,609,000 $5,367,000 Waco TSTC Waco $12,033,000 $11,382,000 $23,415,000 Wellington Marian Airpark $0 $0 $0 Weslaco Mid Valley $135,000 $127,000 $262,000 Wharton Wharton Regional $849,000 $804,000 $1,653,000 Wheeler Wheeler Municipal $0 $0 $0 Wichita Falls Kickapoo Downtown $1,523,000 $1,440,000 $2,963,000 Wills Point Van Zandt County Regional $210,000 $200,000 $410,000 Wink Winkler County $37,000 $35,000 $72,000 Winnie/Stowell Chambers County-Winnie Stowell $1,234,000 $1,168,000 $2,402,000 Winnsboro Winnsboro Municipal $8,000 $7,000 $15,000 Winters Winters Municipal $0 $0 $0 Zapata Zapata County $42,000 $39,000 $81,000 Other Airports $128,000 $120,000 $248,000 General Aviation Airports $336,181,000 $317,969,000 $654,150,000 All Airports $1,466,957,000 $1,386,706,000 $2,853,663,000 Source: CDM Smith and IMPLAN. A-80
136 Table A-14: Commercial Service Visitor-Related from Texas Airports Direct CS Visitor-Related Multiplier CS Visitor-Related CS Visitor-Related Commercial Service Airports Abilene Abilene Regional $27,465,000 $26,552,000 $54,017,000 Amarillo Rick Husband Amarillo International $270,555,000 $261,564,000 $532,119,000 Austin Austin-Bergstrom International $2,267,173,000 $2,191,835,000 $4,459,008,000 Beaumont/Port Arthur Jack Brooks Regional $6,986,000 $6,753,000 $13,739,000 Brownsville Brownsville/South Padre Island International $30,370,000 $29,361,000 $59,731,000 College Station Easterwood Field $33,154,000 $32,053,000 $65,207,000 Corpus Christi Corpus Christi International $247,120,000 $238,908,000 $486,028,000 Dallas Dallas Love Field $1,693,369,000 $1,637,099,000 $3,330,468,000 Dallas-Fort Worth Dallas/Fort Worth International $6,172,841,000 $5,967,720,000 $12,140,561,000 El Paso El Paso International $650,502,000 $628,886,000 $1,279,388,000 Fort Hood (Killeen) Killeen-Fort Hood Regional $47,471,000 $45,893,000 $93,364,000 Harlingen Valley International $121,036,000 $117,013,000 $238,049,000 Houston George Bush Intercontinental/Houston $3,614,110,000 $3,494,013,000 $7,108,123,000 Houston William P Hobby $1,385,521,000 $1,339,480,000 $2,725,001,000 Laredo Laredo International $29,299,000 $28,325,000 $57,624,000 Longview East Texas Regional $2,781,000 $2,688,000 $5,469,000 Lubbock Lubbock Preston Smith International $179,267,000 $173,311,000 $352,578,000 Mc Allen Mc Allen Miller International $238,132,000 $230,220,000 $468,352,000 Midland Midland International Air and Space Port $307,354,000 $297,140,000 $604,494,000 San Angelo San Angelo Regional/Mathis Field $19,370,000 $18,726,000 $38,096,000 San Antonio San Antonio International $1,585,202,000 $1,532,526,000 $3,117,728,000 Texarkana, AR Texarkana Regional Airport-Webb Field $8,602,000 $5,808,000 $14,410,000 Tyler Tyler Pounds Regional $20,588,000 $19,905,000 $40,493,000 Waco Waco Regional $13,956,000 $13,492,000 $27,448,000 Wichita Falls Sheppard AFB/Wichita Falls Municipal $11,933,000 $11,536,000 $23,469,000 Commercial Service Airports $18,984,157,000 $18,350,807,000 $37,334,964,000 Source: CDM Smith and IMPLAN. A-81
137 Table A-15: General Aviation Visitor-Related from Texas Airports Direct GA Visitor-Related Multiplier GA Visitor-Related GA Visitor-Related Commercial Service Airports Abilene Abilene Regional $4,482,000 $4,268,000 $8,750,000 Amarillo Rick Husband Amarillo International $4,859,000 $4,627,000 $9,486,000 Austin Austin-Bergstrom International $10,365,000 $9,869,000 $20,234,000 Beaumont/Port Arthur Jack Brooks Regional $1,709,000 $1,627,000 $3,336,000 Brownsville Brownsville/South Padre Island International $2,690,000 $2,561,000 $5,251,000 College Station Easterwood Field $5,128,000 $4,883,000 $10,011,000 Corpus Christi Corpus Christi International $5,779,000 $5,503,000 $11,282,000 Dallas Dallas Love Field $10,707,000 $10,195,000 $20,902,000 Dallas-Fort Worth Dallas/Fort Worth International $1,247,000 $1,187,000 $2,434,000 El Paso El Paso International $6,102,000 $5,810,000 $11,912,000 Fort Hood (Killeen) Killeen-Fort Hood Regional $1,274,000 $1,213,000 $2,487,000 Harlingen Valley International $1,137,000 $1,083,000 $2,220,000 Houston George Bush Intercontinental/Houston $1,989,000 $1,894,000 $3,883,000 Houston William P Hobby $10,235,000 $9,745,000 $19,980,000 Laredo Laredo International $4,013,000 $3,821,000 $7,834,000 Longview East Texas Regional $3,548,000 $3,378,000 $6,926,000 Lubbock Lubbock Preston Smith International $4,809,000 $4,579,000 $9,388,000 Mc Allen Mc Allen Miller International $6,648,000 $6,330,000 $12,978,000 Midland Midland International Air and Space Port $5,975,000 $5,689,000 $11,664,000 San Angelo San Angelo Regional/Mathis Field $6,682,000 $6,362,000 $13,044,000 San Antonio San Antonio International $9,787,000 $9,319,000 $19,106,000 Texarkana, AR Texarkana Regional Airport-Webb Field $1,005,000 $708,000 $1,713,000 Tyler Tyler Pounds Regional $3,825,000 $3,642,000 $7,467,000 Waco Waco Regional $3,880,000 $3,694,000 $7,574,000 Wichita Falls Sheppard AFB/Wichita Falls Municipal $17,667,000 $16,822,000 $34,489,000 Commercial Service Airports $135,542,000 $128,809,000 $264,351,000 General Aviation Airports Albany Albany Municipal $42,000 $40,000 $82,000 Alice Alice International $2,575,000 $2,452,000 $5,027,000 Alpine Alpine-Casparis Municipal $159,000 $151,000 $310,000 Amarillo Tradewind $1,277,000 $1,216,000 $2,493,000 Anahuac Chambers County $48,000 $46,000 $94,000 A-82
138 Table A-15: General Aviation Visitor-Related from Texas Airports (cont.) A-83 Direct GA Visitor-Related Multiplier GA Visitor-Related GA Visitor-Related Andrews Andrews County $156,000 $149,000 $305,000 Angleton/Lake Jackson Texas Gulf Coast Regional $5,828,000 $5,549,000 $11,377,000 Arlington Arlington Municipal $5,357,000 $5,101,000 $10,458,000 Athens Athens Municipal $128,000 $122,000 $250,000 Atlanta Hall-Miller Municipal $270,000 $257,000 $527,000 Ballinger Bruce Field $45,000 $43,000 $88,000 Bay City Bay City Regional $181,000 $172,000 $353,000 Beaumont Beaumont Municipal $286,000 $272,000 $558,000 Beeville Beeville Municipal $120,000 $114,000 $234,000 Big Lake Reagan County $60,000 $57,000 $117,000 Big Spring Big Spring Mc Mahon- Wrinkle $349,000 $332,000 $681,000 Bonham Jones Field $114,000 $109,000 $223,000 Borger Hutchinson County $151,000 $144,000 $295,000 Bowie Bowie Municipal $210,000 $200,000 $410,000 Brady Curtis Field $1,288,000 $1,226,000 $2,514,000 Breckenridge Stephens County $228,000 $217,000 $445,000 Brenham Brenham Municipal $262,000 $249,000 $511,000 Bridgeport Bridgeport Municipal $276,000 $263,000 $539,000 Brownfield Terry County $102,000 $97,000 $199,000 Brownwood Brownwood Regional $364,000 $347,000 $711,000 Bryan Coulter Field $281,000 $268,000 $549,000 Burnet Burnet Municipal Kate Craddock Field $302,000 $288,000 $590,000 Caddo Mills Caddo Mills Municipal $1,276,000 $1,215,000 $2,491,000 Caldwell Caldwell Municipal $126,000 $120,000 $246,000 Cameron Cameron Municipal Airpark $30,000 $29,000 $59,000 Canadian Hemphill County $96,000 $91,000 $187,000 Carrizo Springs Dimmit County $36,000 $34,000 $70,000 Carthage Panola County-Sharpe Field $177,000 $169,000 $346,000 Castroville Castroville Municipal $271,000 $258,000 $529,000 Center Center Municipal $158,000 $150,000 $308,000 Childress Childress Municipal $73,000 $70,000 $143,000 Cisco Cisco Municipal $42,000 $40,000 $82,000 Clarksville Clarksville/Red River County-J D Trissell Field $1,000 $1,000 $2,000 Cleburne Cleburne Regional $443,000 $422,000 $865,000 Cleveland Cleveland Municipal $260,000 $248,000 $508,000 Clifton Clifton Municipal/Isenhower Field $114,000 $109,000 $223,000 Coleman Coleman Municipal $150,000 $143,000 $293,000 Colorado City Colorado City $30,000 $29,000 $59,000 Columbus Robert R Wells Jr. $60,000 $57,000 $117,000 Comanche Comanche County-City $138,000 $131,000 $269,000 Commerce Commerce Municipal $240,000 $229,000 $469,000
139 Table A-15: General Aviation Visitor-Related from Texas Airports (cont.) A-84 Direct GA Visitor-Related Multiplier GA Visitor-Related GA Visitor-Related C David Campbell Field- Corsicana Municipal $328,000 $312,000 $640,000 Corsicana Cotulla Cotulla-La Salle County $491,000 $468,000 $959,000 Crane Crane County $36,000 $34,000 $70,000 Crockett Houston County $132,000 $126,000 $258,000 Crosbyton Crosbyton Municipal $30,000 $29,000 $59,000 Dalhart Dalhart Municipal $177,000 $169,000 $346,000 Dallas Addison $10,619,000 $10,111,000 $20,730,000 Dallas Dallas CBD Vertiport $36,000 $34,000 $70,000 Dallas Dallas Executive $3,121,000 $2,972,000 $6,093,000 McKinney McKinney National $4,243,000 $4,040,000 $8,283,000 Decatur Decatur Municipal $264,000 $251,000 $515,000 Del Rio Del Rio International $196,000 $187,000 $383,000 Dell City Dell City Municipal $30,000 $29,000 $59,000 Denton Denton Enterprise $8,624,000 $8,211,000 $16,835,000 Denver City Denver City $66,000 $63,000 $129,000 Desoto Desoto Heliport $2,000 $2,000 $4,000 Devine Devine Municipal $108,000 $103,000 $211,000 Dimmitt Dimmitt Municipal $1,000 $1,000 $2,000 Dryden Terrell County $1,000 $1,000 $2,000 Dublin Dublin Municipal $66,000 $63,000 $129,000 Dumas Moore County $164,000 $156,000 $320,000 Eagle Lake Eagle Lake $174,000 $166,000 $340,000 Eagle Pass Maverick County Memorial International $1,000 $1,000 $2,000 Eastland Eastland Municipal $120,000 $114,000 $234,000 Edinburg South Texas International at Edinburg $56,000 $53,000 $109,000 Edna Jackson County $156,000 $149,000 $305,000 Ennis Ennis Municipal $61,000 $58,000 $119,000 Fabens Fabens $246,000 $234,000 $480,000 Falfurrias Brooks County $270,000 $257,000 $527,000 Floydada Floydada Municipal $126,000 $120,000 $246,000 Fort Stockton Fort Stockton-Pecos County $135,000 $129,000 $264,000 Fort Worth Fort Worth Alliance $7,369,000 $7,016,000 $14,385,000 Fort Worth Fort Worth Meacham International $7,644,000 $7,278,000 $14,922,000 Fort Worth Fort Worth Spinks $3,040,000 $2,895,000 $5,935,000 Fredericksburg Gillespie County $390,000 $371,000 $761,000 Gainesville Gainesville Municipal $312,000 $297,000 $609,000 Galveston Scholes International at Galveston $2,920,000 $2,780,000 $5,700,000 Garland Garland/DFW Heloplex $90,000 $86,000 $176,000 Gatesville Gatesville Municipal $102,000 $97,000 $199,000 George West Live Oak County $66,000 $63,000 $129,000 Georgetown Georgetown Municipal $4,193,000 $3,992,000 $8,185,000 Giddings Giddings-Lee County $138,000 $131,000 $269,000
140 Table A-15: General Aviation Visitor-Related from Texas Airports (cont.) Direct GA Visitor-Related Multiplier GA Visitor-Related GA Visitor-Related Fox Stephens Field-Gilmer Gilmer Municipal $84,000 $80,000 $164,000 Gladewater Gladewater Municipal $282,000 $269,000 $551,000 Roger M. Dreyer Gonzales Memorial $48,000 $46,000 $94,000 Graford Possum Kingdom $78,000 $74,000 $152,000 Graham Graham Municipal $73,000 $70,000 $143,000 Granbury Granbury Regional $463,000 $441,000 $904,000 Grand Prairie Grand Prairie Municipal $2,704,000 $2,575,000 $5,279,000 Greenville Majors $331,000 $315,000 $646,000 Gruver Gruver Municipal $0 $0 $0 Hallettsville Hallettsville Municipal $42,000 $40,000 $82,000 Hamilton Hamilton Municipal $108,000 $103,000 $211,000 Haskell Haskell Municipal $48,000 $46,000 $94,000 Hearne Hearne Municipal $48,000 $46,000 $94,000 Hebbronville Jim Hogg County $2,000 $2,000 $4,000 Henderson Rusk County $204,000 $194,000 $398,000 Hereford Hereford Municipal $166,000 $158,000 $324,000 Hillsboro Hillsboro Municipal $120,000 $114,000 $234,000 Hondo South Texas Regional at Hondo $260,000 $248,000 $508,000 Houston Conroe-North Houston Regional $4,583,000 $4,364,000 $8,947,000 Houston David Wayne Hooks Memorial $7,446,000 $7,090,000 $14,536,000 Houston Ellington Field $8,396,000 $7,994,000 $16,390,000 Houston Houston-Southwest $1,882,000 $1,792,000 $3,674,000 Houston Pearland Regional $2,320,000 $2,209,000 $4,529,000 Houston Sugar Land Regional $5,424,000 $5,165,000 $10,589,000 Houston West Houston $3,828,000 $3,645,000 $7,473,000 Huntsville Huntsville Municipal $1,243,000 $1,184,000 $2,427,000 Ingleside McCampbell-Porter $260,000 $248,000 $508,000 Jacksboro Jacksboro Municipal $2,000 $2,000 $4,000 Jacksonville Cherokee County $254,000 $242,000 $496,000 Jasper Jasper County-Bell Field $240,000 $229,000 $469,000 Jayton Kent County $0 $0 $0 Jefferson Cypress River $48,000 $46,000 $94,000 Junction Kimble County $120,000 $114,000 $234,000 Kenedy Karnes County $60,000 $57,000 $117,000 Kerrville Kerrville Municipal/Louis Schreiner Field $5,529,000 $5,265,000 $10,794,000 Killeen Skylark Field $383,000 $365,000 $748,000 Kingsville Kleberg County $31,000 $30,000 $61,000 Kirbyville Kirbyville $150,000 $143,000 $293,000 Knox City Harrison Field of Knox City $30,000 $29,000 $59,000 Kountze/Silsbee Hawthorne Field $66,000 $63,000 $129,000 A-85
141 Table A-15: General Aviation Visitor-Related from Texas Airports (cont.) Direct GA Visitor-Related Multiplier GA Visitor-Related GA Visitor-Related Fayette Regional Air Center $186,000 $177,000 $363,000 La Grange La Porte La Porte Municipal $503,000 $479,000 $982,000 Lago Vista Lago Vista TX-Rusty Allen $102,000 $97,000 $199,000 Lamesa Lamesa Municipal $204,000 $194,000 $398,000 Lampasas Lampasas $162,000 $154,000 $316,000 Lancaster Lancaster Regional $3,256,000 $3,100,000 $6,356,000 Levelland Levelland Municipal $212,000 $202,000 $414,000 Liberty Liberty Municipal $222,000 $211,000 $433,000 Littlefield Taylor Brown Municipal $92,000 $88,000 $180,000 Livingston Livingston Municipal $138,000 $131,000 $269,000 Llano Llano Municipal $261,000 $249,000 $510,000 Lockhart Lockhart Municipal $307,000 $292,000 $599,000 Lufkin Angelina County $1,822,000 $1,735,000 $3,557,000 Madisonville Madisonville Municipal $0 $0 $0 Marfa Marfa Municipal $240,000 $229,000 $469,000 Marshall Harrison County $240,000 $229,000 $469,000 Mason Mason County $72,000 $69,000 $141,000 Mc Camey Upton County $1,000 $1,000 $2,000 Mesquite Mesquite Metro $3,514,000 $3,346,000 $6,860,000 Mexia Mexia-Limestone County $138,000 $131,000 $269,000 Midland Midland Airpark $432,000 $411,000 $843,000 Midlothian/Waxahachie Mid-Way Regional $1,438,000 $1,369,000 $2,807,000 Mineola/Quitman Wood County $260,000 $248,000 $508,000 Mineral Wells Mineral Wells $403,000 $384,000 $787,000 Monahans Roy Hurd Memorial $198,000 $189,000 $387,000 Mount Pleasant Mount Pleasant Regional $264,000 $251,000 $515,000 Mount Vernon Franklin County $30,000 $29,000 $59,000 Muleshoe Muleshoe Municipal $48,000 $46,000 $94,000 Munday Munday Municipal $1,000 $1,000 $2,000 Nacogdoches A L Mangham Jr. Regional $405,000 $386,000 $791,000 Navasota Navasota Municipal $192,000 $183,000 $375,000 New Braunfels New Braunfels Regional $2,974,000 $2,832,000 $5,806,000 Odessa Odessa-Schlemeyer Field $3,103,000 $2,955,000 $6,058,000 Olney Olney Municipal $66,000 $63,000 $129,000 Orange Orange County $233,000 $222,000 $455,000 Ozona Ozona Municipal $125,000 $119,000 $244,000 Paducah Dan E Richards Municipal $2,000 $2,000 $4,000 Palacios Palacios Municipal $172,000 $164,000 $336,000 Palestine Palestine Municipal $223,000 $212,000 $435,000 Pampa Perry Lefors Field $286,000 $272,000 $558,000 Panhandle Panhandle-Carson County $0 $0 $0 Paris Cox Field $222,000 $211,000 $433,000 Pearsall Mc Kinley Field $36,000 $34,000 $70,000 Pecos Pecos Municipal $1,752,000 $1,668,000 $3,420,000 Perryton Perryton Ochiltree County $288,000 $274,000 $562,000 A-86
142 Table A-15: General Aviation Visitor-Related from Texas Airports (cont.) Direct GA Visitor-Related Multiplier GA Visitor-Related GA Visitor-Related Plains Yoakum County $114,000 $109,000 $223,000 Plainview Hale County $309,000 $294,000 $603,000 Pleasanton Pleasanton Municipal $197,000 $188,000 $385,000 Port Aransas Mustang Beach $180,000 $171,000 $351,000 Port Isabel Port Isabel-Cameron County $111,000 $106,000 $217,000 Port Lavaca Calhoun County $198,000 $189,000 $387,000 Port Mansfield Charles R Johnson $0 $0 $0 Presidio Presidio Lely International $1,000 $1,000 $2,000 Quanah Quanah Municipal $66,000 $63,000 $129,000 Refugio Rooke Field $54,000 $51,000 $105,000 Roanoke Northwest Regional $6,496,000 $6,185,000 $12,681,000 Robstown Nueces County $120,000 $114,000 $234,000 Rockdale H H Coffield Regional $48,000 $46,000 $94,000 Rockport Aransas County $4,491,000 $4,276,000 $8,767,000 Rocksprings Edwards County $31,000 $30,000 $61,000 Rockwall Ralph M Hall/Rockwall Municipal $417,000 $397,000 $814,000 San Antonio Stinson Municipal $3,663,000 $3,488,000 $7,151,000 San Marcos San Marcos Regional $2,848,000 $2,712,000 $5,560,000 San Saba San Saba County Municipal $66,000 $63,000 $129,000 Seminole Gaines County $165,000 $157,000 $322,000 Seymour Seymour Municipal $48,000 $46,000 $94,000 Sherman Sherman Municipal $45,000 $43,000 $88,000 Sherman/Denison North Texas Regional/Perrin Field $3,256,000 $3,100,000 $6,356,000 Sinton Alfred C 'Bubba' Thomas $120,000 $114,000 $234,000 Slaton Slaton Municipal $192,000 $183,000 $375,000 Smithville Smithville Crawford Municipal $174,000 $166,000 $340,000 Snyder Winston Field $168,000 $160,000 $328,000 Sonora Sonora Municipal $36,000 $34,000 $70,000 Spearman Major Samuel B Cornelius Field $108,000 $103,000 $211,000 Stamford Arledge Field $66,000 $63,000 $129,000 Stephenville Stephenville Clark Regional $274,000 $261,000 $535,000 Sulphur Springs Sulphur Springs Municipal $328,000 $312,000 $640,000 Sunray Sunray $78,000 $74,000 $152,000 Sweetwater Avenger Field $150,000 $143,000 $293,000 Tahoka T-Bar $36,000 $34,000 $70,000 Taylor Taylor Municipal $240,000 $229,000 $469,000 Temple Draughon-Miller Central Texas Regional $1,653,000 $1,574,000 $3,227,000 Terrell Terrell Municipal $444,000 $423,000 $867,000 Throckmorton Throckmorton Municipal $0 $0 $0 A-87
143 Table A-15: General Aviation Visitor-Related from Texas Airports (cont.) Direct GA Visitor-Related Multiplier GA Visitor-Related GA Visitor-Related City of Tulia/Swisher County Municipal $72,000 $69,000 $141,000 Tulia Uvalde Garner Field $274,000 $261,000 $535,000 Van Horn Culberson County $1,000 $1,000 $2,000 Vega Oldham County $66,000 $63,000 $129,000 Vernon Wilbarger County $252,000 $240,000 $492,000 Victoria Victoria Regional $2,335,000 $2,223,000 $4,558,000 McGregor Mc Gregor Executive $457,000 $435,000 $892,000 Waco TSTC Waco $4,379,000 $4,170,000 $8,549,000 Wellington Marian Airpark $64,000 $61,000 $125,000 Weslaco Mid Valley $1,369,000 $1,304,000 $2,673,000 Wharton Wharton Regional $240,000 $229,000 $469,000 Wheeler Wheeler Municipal $0 $0 $0 Wichita Falls Kickapoo Downtown $455,000 $433,000 $888,000 Wills Point Van Zandt County Regional $72,000 $69,000 $141,000 Wink Winkler County $2,000 $2,000 $4,000 Winnie/Stowell Chambers County-Winnie Stowell $72,000 $69,000 $141,000 Winnsboro Winnsboro Municipal $42,000 $40,000 $82,000 Winters Winters Municipal $48,000 $46,000 $94,000 Zapata Zapata County $60,000 $57,000 $117,000 Other Airports $266,000 $254,000 $520,000 General Aviation Airports $190,222,000 $181,139,000 $371,361,000 All Airports $325,764,000 $309,948,000 $635,712,000 Source: CDM Smith and IMPLAN. A-88
144 Table A-16: from Texas Airports Direct Multiplier Commercial Service Airports Abilene Abilene Regional $198,276,000 $164,360,000 $362,636,000 Amarillo Rick Husband Amarillo International $661,105,000 $572,066,000 $1,233,171,000 Austin Austin-Bergstrom International $3,932,190,000 $3,673,681,000 $7,605,871,000 Beaumont/Port Arthur Jack Brooks Regional $20,564,000 $19,253,000 $39,817,000 Brownsville Brownsville/South Padre Island International $94,080,000 $84,836,000 $178,916,000 College Station Easterwood Field $64,690,000 $59,896,000 $124,586,000 Corpus Christi Corpus Christi International $402,329,000 $380,150,000 $782,479,000 Dallas Dallas Love Field $3,162,894,000 $2,943,473,000 $6,106,367,000 Dallas-Fort Worth Dallas/Fort Worth International $15,574,939,000 $14,341,627,000 $29,916,566,000 El Paso El Paso International $1,153,746,000 $1,081,242,000 $2,234,988,000 Fort Hood (Killeen) Killeen-Fort Hood Regional $68,751,000 $66,129,000 $134,880,000 Harlingen Valley International $227,842,000 $204,903,000 $432,745,000 Houston George Bush Intercontinental/Houston $11,897,616,000 $10,851,305,000 $22,748,921,000 Houston William P Hobby $2,474,399,000 $2,311,417,000 $4,785,816,000 Laredo Laredo International $94,928,000 $85,838,000 $180,766,000 Longview East Texas Regional $47,608,000 $41,059,000 $88,667,000 Lubbock Lubbock Preston Smith International $293,346,000 $272,549,000 $565,895,000 Mc Allen Mc Allen Miller International $325,617,000 $307,294,000 $632,911,000 Midland Midland International Air and Space Port $472,333,000 $435,786,000 $908,119,000 San Angelo San Angelo Regional/Mathis Field $65,006,000 $59,296,000 $124,302,000 San Antonio San Antonio International $2,747,950,000 $2,568,630,000 $5,316,580,000 Texarkana, AR Texarkana Regional Airport-Webb Field $22,889,000 $16,795,000 $39,684,000 Tyler Tyler Pounds Regional $81,228,000 $71,149,000 $152,377,000 Waco Waco Regional $60,792,000 $53,191,000 $113,983,000 Wichita Falls Sheppard AFB/Wichita Falls Municipal $47,750,000 $44,760,000 $92,510,000 Commercial Service Airports $44,192,868,000 $40,710,685,000 $84,903,553,000 General Aviation Airports Albany Albany Municipal $277,000 $247,000 $524,000 Alice Alice International $4,636,000 $4,254,000 $8,890,000 Alpine Alpine-Casparis Municipal $6,854,000 $6,094,000 $12,948,000 Amarillo Tradewind $2,157,000 $2,020,000 $4,177,000 A-89
145 Table A-16: from Texas Airports (cont.) Direct Multiplier Anahuac Chambers County $699,000 $620,000 $1,319,000 Andrews Andrews County $919,000 $797,000 $1,716,000 Angleton/Lake Jackson Texas Gulf Coast Regional $12,855,000 $11,643,000 $24,498,000 Arlington Arlington Municipal $125,348,000 $111,006,000 $236,354,000 Athens Athens Municipal $1,326,000 $1,071,000 $2,397,000 Atlanta Hall-Miller Municipal $343,000 $324,000 $667,000 Ballinger Bruce Field $114,000 $106,000 $220,000 Bay City Bay City Regional $1,655,000 $1,401,000 $3,056,000 Beaumont Beaumont Municipal $2,912,000 $2,614,000 $5,526,000 Beeville Beeville Municipal $415,000 $356,000 $771,000 Big Lake Reagan County $146,000 $136,000 $282,000 Big Spring Big Spring Mc Mahon- Wrinkle $8,576,000 $7,030,000 $15,606,000 Bonham Jones Field $1,138,000 $946,000 $2,084,000 Borger Hutchinson County $6,866,000 $5,414,000 $12,280,000 Bowie Bowie Municipal $465,000 $434,000 $899,000 Brady Curtis Field $2,098,000 $1,936,000 $4,034,000 Breckenridge Stephens County $4,050,000 $3,205,000 $7,255,000 Brenham Brenham Municipal $3,215,000 $2,617,000 $5,832,000 Bridgeport Bridgeport Municipal $703,000 $600,000 $1,303,000 Brownfield Terry County $931,000 $796,000 $1,727,000 Brownwood Brownwood Regional $5,188,000 $4,255,000 $9,443,000 Bryan Coulter Field $6,257,000 $5,282,000 $11,539,000 Burnet Burnet Municipal Kate Craddock Field $3,089,000 $2,565,000 $5,654,000 Caddo Mills Caddo Mills Municipal $1,816,000 $1,647,000 $3,463,000 Caldwell Caldwell Municipal $443,000 $381,000 $824,000 Cameron Cameron Municipal Airpark $64,000 $60,000 $124,000 Canadian Hemphill County $513,000 $426,000 $939,000 Carrizo Springs Dimmit County $3,558,000 $2,760,000 $6,318,000 Carthage Panola County-Sharpe Field $334,000 $312,000 $646,000 Castroville Castroville Municipal $2,150,000 $1,793,000 $3,943,000 Center Center Municipal $351,000 $329,000 $680,000 Childress Childress Municipal $2,675,000 $2,126,000 $4,801,000 Cisco Cisco Municipal $57,000 $53,000 $110,000 Clarksville Clarksville/Red River County-J D Trissell Field $96,000 $80,000 $176,000 Cleburne Cleburne Regional $4,855,000 $4,093,000 $8,948,000 Cleveland Cleveland Municipal $984,000 $894,000 $1,878,000 Clifton Clifton Municipal/Isenhower Field $1,130,000 $920,000 $2,050,000 Coleman Coleman Municipal $472,000 $437,000 $909,000 Colorado City Colorado City $516,000 $420,000 $936,000 Columbus Robert R Wells Jr. $118,000 $111,000 $229,000 Comanche Comanche County-City $207,000 $194,000 $401,000 Commerce Commerce Municipal $1,222,000 $1,120,000 $2,342,000 A-90
146 Table A-16: from Texas Airports (cont.) Direct Multiplier Corsicana C David Campbell Field- Corsicana Municipal $1,068,000 $911,000 $1,979,000 Cotulla Cotulla-La Salle County $1,450,000 $1,220,000 $2,670,000 Crane Crane County $70,000 $66,000 $136,000 Crockett Houston County $205,000 $192,000 $397,000 Crosbyton Crosbyton Municipal $1,172,000 $937,000 $2,109,000 Dalhart Dalhart Municipal $2,701,000 $2,258,000 $4,959,000 Dallas Addison $259,241,000 $208,137,000 $467,378,000 Dallas Dallas CBD Vertiport $348,000 $320,000 $668,000 Dallas Dallas Executive $29,116,000 $25,700,000 $54,816,000 McKinney McKinney National $116,310,000 $96,407,000 $212,717,000 Decatur Decatur Municipal $4,995,000 $3,931,000 $8,926,000 Del Rio Del Rio International $10,297,000 $8,730,000 $19,027,000 Dell City Dell City Municipal $238,000 $194,000 $432,000 Denton Denton Enterprise $86,579,000 $69,759,000 $156,338,000 Denver City Denver City $90,000 $84,000 $174,000 Desoto Desoto Heliport $3,977,000 $3,113,000 $7,090,000 Devine Devine Municipal $1,442,000 $1,149,000 $2,591,000 Dimmitt Dimmitt Municipal $278,000 $229,000 $507,000 Dryden Terrell County $250,000 $199,000 $449,000 Dublin Dublin Municipal $352,000 $297,000 $649,000 Dumas Moore County $3,508,000 $3,180,000 $6,688,000 Eagle Lake Eagle Lake $3,101,000 $2,497,000 $5,598,000 Eagle Pass Maverick County Memorial International $538,000 $448,000 $986,000 Eastland Eastland Municipal $2,447,000 $2,108,000 $4,555,000 Edinburg South Texas International at Edinburg $5,203,000 $4,838,000 $10,041,000 Edna Jackson County $400,000 $345,000 $745,000 Ennis Ennis Municipal $1,196,000 $979,000 $2,175,000 Fabens Fabens $709,000 $608,000 $1,317,000 Falfurrias Brooks County $820,000 $776,000 $1,596,000 Floydada Floydada Municipal $1,603,000 $1,289,000 $2,892,000 Fort Stockton Fort Stockton-Pecos County $947,000 $775,000 $1,722,000 Fort Worth Fort Worth Alliance $289,917,000 $229,089,000 $519,006,000 Fort Worth Fort Worth Meacham International $180,088,000 $146,359,000 $326,447,000 Fort Worth Fort Worth Spinks $21,565,000 $17,521,000 $39,086,000 Fredericksburg Gillespie County $7,351,000 $6,376,000 $13,727,000 Gainesville Gainesville Municipal $97,052,000 $75,718,000 $172,770,000 Galveston Scholes International at Galveston $23,545,000 $19,333,000 $42,878,000 Garland Garland/DFW Heloplex $8,328,000 $6,719,000 $15,047,000 Gatesville Gatesville Municipal $893,000 $734,000 $1,627,000 George West Live Oak County $578,000 $544,000 $1,122,000 Georgetown Georgetown Municipal $28,643,000 $24,020,000 $52,663,000 Giddings Giddings-Lee County $627,000 $526,000 $1,153,000 A-91
147 Table A-16: from Texas Airports (cont.) Direct Multiplier Fox Stephens Field- Gilmer Gilmer Municipal $803,000 $654,000 $1,457,000 Gladewater Gladewater Municipal $786,000 $681,000 $1,467,000 Roger M. Dreyer Gonzales Memorial $117,000 $109,000 $226,000 Graford Possum Kingdom $93,000 $87,000 $180,000 Graham Graham Municipal $1,064,000 $903,000 $1,967,000 Granbury Granbury Regional $10,287,000 $8,186,000 $18,473,000 Grand Prairie Grand Prairie Municipal $203,390,000 $157,781,000 $361,171,000 Greenville Majors $2,134,227,000 $1,949,157,000 $4,083,384,000 Gruver Gruver Municipal $1,248,000 $992,000 $2,240,000 Hallettsville Hallettsville Municipal $223,000 $199,000 $422,000 Hamilton Hamilton Municipal $267,000 $249,000 $516,000 Haskell Haskell Municipal $744,000 $608,000 $1,352,000 Hearne Hearne Municipal $945,000 $767,000 $1,712,000 Hebbronville Jim Hogg County $196,000 $181,000 $377,000 Henderson Rusk County $1,032,000 $951,000 $1,983,000 Hereford Hereford Municipal $2,145,000 $1,753,000 $3,898,000 Hillsboro Hillsboro Municipal $2,142,000 $1,766,000 $3,908,000 Hondo South Texas Regional at Hondo $6,401,000 $5,181,000 $11,582,000 Houston Conroe-North Houston Regional $73,170,000 $63,160,000 $136,330,000 Houston David Wayne Hooks Memorial $49,860,000 $41,865,000 $91,725,000 Houston Ellington Field $173,739,000 $159,118,000 $332,857,000 Houston Houston-Southwest $8,046,000 $6,885,000 $14,931,000 Houston Pearland Regional $10,287,000 $8,575,000 $18,862,000 Houston Sugar Land Regional $50,632,000 $42,361,000 $92,993,000 Houston West Houston $11,802,000 $10,611,000 $22,413,000 Huntsville Huntsville Municipal $1,930,000 $1,734,000 $3,664,000 Ingleside McCampbell-Porter $9,382,000 $8,468,000 $17,850,000 Jacksboro Jacksboro Municipal $185,000 $153,000 $338,000 Jacksonville Cherokee County $5,597,000 $4,540,000 $10,137,000 Jasper Jasper County-Bell Field $545,000 $479,000 $1,024,000 Jayton Kent County $69,000 $65,000 $134,000 Jefferson Cypress River $144,000 $134,000 $278,000 Junction Kimble County $1,091,000 $1,006,000 $2,097,000 Kenedy Karnes County $273,000 $251,000 $524,000 Kerrville Kerrville Municipal/Louis Schreiner Field $20,916,000 $17,414,000 $38,330,000 Killeen Skylark Field $2,328,000 $1,974,000 $4,302,000 Kingsville Kleberg County $2,344,000 $2,131,000 $4,475,000 Kirbyville Kirbyville $330,000 $294,000 $624,000 Knox City Harrison Field of Knox City $860,000 $689,000 $1,549,000 Kountze/Silsbee Hawthorne Field $424,000 $347,000 $771,000 La Grange Fayette Regional Air Center $1,220,000 $1,017,000 $2,237,000 A-92
148 Table A-16: from Texas Airports (cont.) Direct Multiplier La Porte La Porte Municipal $5,289,000 $4,241,000 $9,530,000 Lago Vista Lago Vista TX-Rusty Allen $1,901,000 $1,608,000 $3,509,000 Lamesa Lamesa Municipal $3,305,000 $2,745,000 $6,050,000 Lampasas Lampasas $306,000 $286,000 $592,000 Lancaster Lancaster Regional $6,242,000 $5,669,000 $11,911,000 Levelland Levelland Municipal $2,704,000 $2,203,000 $4,907,000 Liberty Liberty Municipal $298,000 $280,000 $578,000 Littlefield Taylor Brown Municipal $1,106,000 $898,000 $2,004,000 Livingston Livingston Municipal $427,000 $366,000 $793,000 Llano Llano Municipal $1,220,000 $1,114,000 $2,334,000 Lockhart Lockhart Municipal $898,000 $784,000 $1,682,000 Lufkin Angelina County $14,030,000 $11,943,000 $25,973,000 Madisonville Madisonville Municipal $476,000 $384,000 $860,000 Marfa Marfa Municipal $1,020,000 $912,000 $1,932,000 Marshall Harrison County $630,000 $539,000 $1,169,000 Mason Mason County $185,000 $174,000 $359,000 Mc Camey Upton County $1,031,000 $973,000 $2,004,000 Mesquite Mesquite Metro $12,058,000 $10,668,000 $22,726,000 Mexia Mexia-Limestone County $5,905,000 $4,657,000 $10,562,000 Midland Midland Airpark $8,144,000 $6,452,000 $14,596,000 Midlothian/Waxahachie Mid-Way Regional $11,964,000 $10,151,000 $22,115,000 Mineola/Quitman Wood County $725,000 $631,000 $1,356,000 Mineral Wells Mineral Wells $43,911,000 $34,109,000 $78,020,000 Monahans Roy Hurd Memorial $1,976,000 $1,635,000 $3,611,000 Mount Pleasant Mount Pleasant Regional $2,789,000 $2,414,000 $5,203,000 Mount Vernon Franklin County $233,000 $220,000 $453,000 Muleshoe Muleshoe Municipal $117,000 $109,000 $226,000 Munday Munday Municipal $622,000 $495,000 $1,117,000 Nacogdoches A L Mangham Jr. Regional $735,000 $656,000 $1,391,000 Navasota Navasota Municipal $485,000 $424,000 $909,000 New Braunfels New Braunfels Regional $14,882,000 $12,449,000 $27,331,000 Odessa Odessa-Schlemeyer Field $8,046,000 $7,096,000 $15,142,000 Olney Olney Municipal $82,351,000 $63,585,000 $145,936,000 Orange Orange County $986,000 $837,000 $1,823,000 Ozona Ozona Municipal $441,000 $380,000 $821,000 Paducah Dan E Richards Municipal $1,041,000 $828,000 $1,869,000 Palacios Palacios Municipal $239,000 $224,000 $463,000 Palestine Palestine Municipal $689,000 $615,000 $1,304,000 Pampa Perry Lefors Field $796,000 $679,000 $1,475,000 Panhandle Panhandle-Carson County $1,063,000 $849,000 $1,912,000 Paris Cox Field $2,294,000 $1,828,000 $4,122,000 Pearsall Mc Kinley Field $464,000 $395,000 $859,000 Pecos Pecos Municipal $3,260,000 $3,002,000 $6,262,000 Perryton Perryton Ochiltree County $2,634,000 $2,176,000 $4,810,000 Plains Yoakum County $1,124,000 $912,000 $2,036,000 Plainview Hale County $7,648,000 $6,167,000 $13,815,000 A-93
149 Table A-16: from Texas Airports (cont.) Direct Multiplier Pleasanton Pleasanton Municipal $430,000 $381,000 $811,000 Port Aransas Mustang Beach $259,000 $243,000 $502,000 Port Isabel Port Isabel-Cameron County $1,644,000 $1,391,000 $3,035,000 Port Lavaca Calhoun County $1,933,000 $1,584,000 $3,517,000 Port Mansfield Charles R Johnson $69,000 $63,000 $132,000 Presidio Presidio Lely International $199,000 $185,000 $384,000 Quanah Quanah Municipal $777,000 $639,000 $1,416,000 Refugio Rooke Field $580,000 $507,000 $1,087,000 Roanoke Northwest Regional $17,386,000 $14,702,000 $32,088,000 Robstown Nueces County $746,000 $646,000 $1,392,000 Rockdale H H Coffield Regional $117,000 $109,000 $226,000 Rockport Aransas County $8,146,000 $7,264,000 $15,410,000 Rocksprings Edwards County $77,000 $72,000 $149,000 Rockwall Ralph M Hall/Rockwall Municipal $1,268,000 $1,074,000 $2,342,000 San Antonio Stinson Municipal $18,883,000 $16,734,000 $35,617,000 San Marcos San Marcos Regional $45,675,000 $36,434,000 $82,109,000 San Saba San Saba County Municipal $76,000 $72,000 $148,000 Seminole Gaines County $891,000 $805,000 $1,696,000 Seymour Seymour Municipal $472,000 $384,000 $856,000 Sherman Sherman Municipal $524,000 $434,000 $958,000 Sherman/Denison North Texas Regional/Perrin Field $13,842,000 $11,700,000 $25,542,000 Sinton Alfred C 'Bubba' Thomas $1,179,000 $962,000 $2,141,000 Slaton Slaton Municipal $1,233,000 $1,009,000 $2,242,000 Smithville Smithville Crawford Municipal $1,194,000 $970,000 $2,164,000 Snyder Winston Field $2,482,000 $2,018,000 $4,500,000 Sonora Sonora Municipal $100,000 $91,000 $191,000 Spearman Major Samuel B Cornelius Field $203,000 $190,000 $393,000 Stamford Arledge Field $549,000 $454,000 $1,003,000 Stephenville Stephenville Clark Regional $2,798,000 $2,441,000 $5,239,000 Sulphur Springs Sulphur Springs Municipal $6,518,000 $5,423,000 $11,941,000 Sunray Sunray $1,851,000 $1,486,000 $3,337,000 Sweetwater Avenger Field $1,039,000 $929,000 $1,968,000 Tahoka T-Bar $140,000 $117,000 $257,000 Taylor Taylor Municipal $3,421,000 $2,913,000 $6,334,000 Temple Draughon-Miller Central Texas Regional $19,389,000 $16,472,000 $35,861,000 Terrell Terrell Municipal $2,553,000 $2,253,000 $4,806,000 Throckmorton Throckmorton Municipal $107,000 $101,000 $208,000 Tulia City of Tulia/Swisher County Municipal $141,000 $132,000 $273,000 A-94
150 Table A-16: from Texas Airports (cont.) Direct Multiplier Uvalde Garner Field $24,161,000 $19,760,000 $43,921,000 Van Horn Culberson County $513,000 $410,000 $923,000 Vega Oldham County $137,000 $128,000 $265,000 Vernon Wilbarger County $1,628,000 $1,379,000 $3,007,000 Victoria Victoria Regional $22,968,000 $19,282,000 $42,250,000 McGregor Mc Gregor Executive $12,533,000 $10,243,000 $22,776,000 Waco TSTC Waco $309,259,000 $242,838,000 $552,097,000 Wellington Marian Airpark $133,000 $124,000 $257,000 Weslaco Mid Valley $2,484,000 $2,254,000 $4,738,000 Wharton Wharton Regional $2,596,000 $2,234,000 $4,830,000 Wheeler Wheeler Municipal $69,000 $63,000 $132,000 Wichita Falls Kickapoo Downtown $4,693,000 $4,165,000 $8,858,000 Wills Point Van Zandt County Regional $367,000 $339,000 $706,000 Wink Winkler County $313,000 $258,000 $571,000 Winnie/Stowell Chambers County-Winnie Stowell $8,689,000 $6,964,000 $15,653,000 Winnsboro Winnsboro Municipal $85,000 $79,000 $164,000 Winters Winters Municipal $63,000 $59,000 $122,000 Zapata Zapata County $253,000 $234,000 $487,000 Other Airports $700,000 $644,000 $1,344,000 General Aviation Airports $5,024,540,000 $4,322,619,000 $9,347,159,000 All Airports $49,217,408,000 $45,033,304,000 $94,250,712,000 Source: CDM Smith and IMPLAN. A-95


151 For more information on the Texas Aviation Economic Impact Study, go to txdot.gov/inside-txdot/division/aviation.html or contact: TxDOT Aviation Division 125 E. 11th St. Austin, TX (512) or Toll free (800) 68-PILOT Prepared for Texas Department of Transportation, Aviation Division. Prepared by CDM Smith, with assistance from KSA Engineers, under the auspices of Texas A&M Transportation Institute.
TEXAS TRANSPORTATION COMMISSION. MINUTE ORDER Page 1 of 1
 TEXAS TRANSPORTATION COMMISSION VARIOUS Counties MINUTE ORDER Page 1 of 1 Districts The Texas Department of Transportation (department) is authorized under Texas Transportation Code, Chapter 21 and Chapter
Aviation Capital Improvement Program DRAFT August Aviation Division
 Aviation Capital Improvement Program 219-221 August 218 Aviation Division Aviation Capital Improvement Program 219-221 August,218 Executive Summary The Texas Department of Transportation (TxDOT) Aviation
Federal Reserve Bank of Dallas
 Federal Reserve Bank of Dallas Member Banks As of: 10/4/2017 State City Name State Member Banks Louisiana CHOUDRANT ORIGIN BANK New Mexico HOBBS LEA COUNTY STATE BANK LORDSBURG WESTERN BANK Texas ABILENE
Federal Reserve Bank of Dallas
 Federal Reserve Bank of Dallas Member Banks As of: 11/5/2018 State City Name State Member Banks Louisiana CHOUDRANT ORIGIN BANK New Mexico HOBBS LEA COUNTY STATE BANK LORDSBURG WESTERN BANK Texas ABILENE
Current list of entities that have an MOU with TxDOT
 Alamo Regional Mobility Authority (RMA) 6/29/2009 Bexar County 7/23/2007 Bowie County 1/19/2011 Brazoria County 5/9/2011 Brownsville Navigation District 9/28/2016 Bryan / College Station Metropolitan Planning
Aviation Capital Improvement Program August 2013 DRAFT Aviation Division
 Aviation Capital Improvement Program 214-216 August 213 DRAFT Aviation Division DRAFT Aviation Capital Improvement Program 214-216 August,213 Table of Contents Section Page EXECUTIVE SUMMARY... 2 Background...
Center Number Address City State Zip Phone
 Center Number Address City State Zip Phone 4757 3285 S. 14th St. Abilene TX 79605 (325) 793-7189 3199 1001 Frontage Rd, Ste. S Alamo TX 78516 (956) 787-1250 3166 1725-A East Main St. Alice TX 78332 (361)
ESTIMATION OF ECONOMIC IMPACTS FOR AIRPORTS IN HAWTHORNE, EUREKA, AND ELY, NEVADA
 TECHNICAL REPORT UCED 97/98-14 ESTIMATION OF ECONOMIC IMPACTS FOR AIRPORTS IN HAWTHORNE, EUREKA, AND ELY, NEVADA UNIVERSITY OF NEVADA, RENO ESTIMATION OF ECONOMIC IMPACTS FOR AIRPORTS IN HAWTHORNE, EUREKA
COLUMBUS REGIONAL AIRPORT AUTHORITY. Economic Impact Study Update. Technical Report
 COLUMBUS REGIONAL AIRPORT AUTHORITY Economic Impact Study Update Technical Report November 2012 COLUMBUS REGIONAL AIRPORT AUTHORITY ECONOMIC IMPACT STUDY UPDATE November 2012 Prepared for: Prepared by:
Licensed Jailer Turnover Report 2017
 County Month # of Licensed Jailers Left Total # of Jailer Positions (Month Report Received) Employment fully staffed Staff Turnover Rate % Anderson August 1 36 2.78% Andrews August 1 16 6.25% Angelina
Aviation and Heliport Use Survey
 Aviation and Heliport Use Survey December 2009 1 AVIATION AND HELIPORT USE SURVEY TABLE OF CONTENTS A. Methodology... 3 B. Survey Instrument... 6 C. Survey Findings Among All Groups... 7 Aircraft Purpose
2009 Muskoka Airport Economic Impact Study
 2009 Muskoka Airport Economic Impact Study November 4, 2009 Prepared by The District of Muskoka Planning and Economic Development Department BACKGROUND The Muskoka Airport is situated at the north end
Houston Economic Update. Presented by Patrick Jankowski Vice President, Research Greater Houston Partnership
 Houston Economic Update Presented by Patrick Jankowski Vice President, Research Greater Houston Partnership Houston Astros - Percent Regular Season Games Won Help from the bullpen this year Help from the
Working Draft. S e g m e n t 1
 Segment One The map below displays Segment One Committee s recommendations for the I-69 route, relief routes and S e g m e n t 1 Longview Rusk US at Nacogdoches US at Texarkana Bowie 2 30 Cass Marion Harrison
DMA Job Code Theater Location # of Screens # of Spots
 Scenario 1 4/25/2014 Displayed by Theater/Zip Code Regional Segment 2 0:30 5/30/2014-8/21/2014 (12 weeks) DMA Job Code Theater Location # of Screens # of Spots Abilene-Sweetwater 313988 CNK429 Abilene
The Economic Impact of Tourism in Jacksonville, FL. June 2016
 The Economic Impact of Tourism in Jacksonville, FL June 2016 Highlights Visitor spending surpassed $2.0 billion in 2015, growing 4.4%. As this money flowed through Duval County, the $2.0 billion in visitor
Provided by: South Central Illinois Regional Planning & Development Commission
 Provided by: South Central Illinois Regional Planning & Development Commission Economic Impact Summary of Flora Municipal Airport (KFOA) Table of Content Introduction...1 General Information...3 Ownership...3
Scroll down for all HEB Stores Available for Parking Lot Vending *Please note that this list contains only stores with available lease spaces.
 PARKING LOT VENDING TENANT INFORMATION: If you are interested in being a Parking Lot vendor, there are a few minimum requirements including (but not limited to): Tenant must sign a minimum of a six month
FOX Sports Plus Channel Guide. Satellite/Telco:
 FOX Sports Plus is a channel used by FOX Sports Southwest to simultaneously show multiple events on two channels, giving viewers another option to follow their favorite teams. FOX Sports Plus is available
THE 2006 ECONOMIC IMPACT OF TRAVEL & TOURISM IN INDIANA
 THE 2006 ECONOMIC IMPACT OF TRAVEL & TOURISM IN INDIANA A Comprehensive Analysis Prepared by: In Partnership with: PREPARED FOR: Carrie Lambert Marketing Director Indiana Office of Tourism Development
EXECUTIVE SUMMARY. hospitality compensation as a share of total compensation at. Page 1
 EXECUTIVE SUMMARY Applied Analysis was retained by the Las Vegas Convention and Visitors Authority (the LVCVA ) to review and analyze the economic impacts associated with its various operations and southern
C.E. Williams, Panhandle GCD, P.O. Box 637, White Deer
 Region A Planning Group From the rolling plains of Childress County in the southeast to the dry arroyos of Dallam County in the northern Panhandle, the Panhandle (Region A) Regional Water Planning Area
PARKING LOT VENDING TENANT INFORMATION:
 PARKING LOT VENDING TENANT INFORMATION: If you are interested in being a Parking Lot vendor, there are a few minimum requirements including (but not limited to): Tenant must sign a minimum of a six month
Houston Airport System Economic Impact Study
 GRA, Incorporated Economic Counsel to the Transportation Industry Houston Airport System Economic Impact Study Final Report June 30, 2011 Prepared by: GRA, Incorporated 115 West Avenue, Suite 201 Jenkintown,
The Economic Impact of Travel on Texas
 The Economic Impact of Travel on Texas 1994-2016p July 2017 Prepared for Texas Tourism Office of the Governor Texas Economic Development & Tourism This page intentionally blank THE ECONOMIC IMPACT OF TRAVEL
Industrial Market Report
 CLIENT FOCUSED. RESULTS DRIVEN. Lubbock Industrial Map Statistics The Lubbock industrial market continues to expand Southwest with the majority of new construction being in this sector followed by the
Economic Impact of Kalamazoo-Battle Creek International Airport
 Reports Upjohn Research home page 2008 Economic Impact of Kalamazoo-Battle Creek International Airport George A. Erickcek W.E. Upjohn Institute, erickcek@upjohn.org Brad R. Watts W.E. Upjohn Institute
Economic Impact of Tourism in Hillsborough County September 2016
 Economic Impact of Tourism in Hillsborough County - 2015 September 2016 Key findings for 2015 Almost 22 million people visited Hillsborough County in 2015. Visits to Hillsborough County increased 4.5%
The Economic Impact of Tourism in: Dane County & Madison, Wisconsin. April 2017
 The Economic Impact of Tourism in: Dane County & Madison, Wisconsin April 2017 Key themes for 2016 Visitor spending continued growing in Dane County, Wisconsin in 2016, growing 5.2% to surpass $1.2 billion.
AIRPORT: Seattle-Tacoma International (SEA) ASSOCIATED CITY: Seattle ARC: D-V Region: Central Puget Sound
 ASSOCIATED CITY: Seattle ARC: D-V Region: Central Puget Sound") AIRPORT: Seattle-Tacoma International (SEA) ASSOCIATED CITY: Seattle ARC: D-V Region: Central Puget Sound AIRPORT DATA AND FACILITIES (Sea-Tac) is located in King County, 10 miles south of downtown Seattle,
AIRPORT: Seattle-Tacoma International (SEA) ASSOCIATED CITY: Seattle ARC: D-V Region: Central Puget Sound AIRPORT DATA AND FACILITIES (Sea-Tac) is located in King County, 10 miles south of downtown Seattle,
The Economic Impact of Tourism in The Appalachian Region of Ohio. June 2014
 The Economic Impact of Tourism in The Appalachian Region of Ohio June 2014 Appalachia Region Tourism Summary Total Tourism Impact Appalachian Region Sales Wages Taxes Employment $4.9 billion $1.2 billion
The Economic Impact of Tourism in The Appalachian Region of Ohio. June 2016
 The Economic Impact of Tourism in The Appalachian Region of Ohio June 2016 Appalachian Region tourism summary Total Tourism Impact Appalachian Region, Ohio Sales Wages Taxes Employment $5.3 billion $1.3
COLUMBUS REGIONAL AIRPORT AUTHORITY. Economic Impact Study Update. Executive Summary
 COLUMBUS REGIONAL AIRPORT AUTHORITY Economic Impact Study Update Executive Summary November 2012 Hearing a plane overhead is an everyday occurrence. But how many people stop to think that what they are
Thank you for a wonderful year...
 Thank you for a wonderful year... Ashley, Tammie and Ted Off We Go... Ready to Lead the Way Hello to District 5730 Rotarians, The last eight months have been very busy.going to Governor Elect Training
The Economic Impact of Tourism in Walworth County, Wisconsin. July 2013
 The Economic Impact of Tourism in Walworth County, Wisconsin July 2013 Key themes for 2012 The Walworth County, Wisconsin visitor economy continued its brisk growth in 2012. Visitor spending rose 11% after
Massachusetts. Massachusetts. Statewide Airport Economic Impact Study Update TECHNICAL REPORT
 Massachusetts Massachusetts Statewide Airport Economic Impact Study Update TECHNICAL REPORT MASSACHUSETTS STATEWIDE AIRPORT ECONOMIC IMPACT STUDY UPDATE DECEMBER 2014 Prepared for: Prepared by: MASSACHUSETTS
Message from the Governor
 Message from the Governor Frank Keating Governor of the State of Oklahoma Oklahoma s aviation and aerospace industry has a proud heritage and plays a major role in the socioeconomic development of our
3. Aviation Activity Forecasts
 3. Aviation Activity Forecasts This section presents forecasts of aviation activity for the Airport through 2029. Forecasts were developed for enplaned passengers, air carrier and regional/commuter airline
Janna Owen /19/2016 2,240. Melody Lytle /22/
 Anderson County EAST TEXAS COUNCIL OF Donetta Murphy donetta.murphy@etcog.org 903-218-6424 7/21/2016 4,960 Andrews County Angelina County DEEP EAST TEXAS COUNCIL OF John McDowell jmcdowell@detcog.org 936-433-4011
Economic Impacts of Campgrounds in New York State
 Economic Impacts of Campgrounds in New York State June 2017 Report Submitted to: Executive Summary Executive Summary New York State is home to approximately 350 privately owned campgrounds with 30,000
The Economic Impact of Tourism on Galveston Island, Texas Analysis
 The Economic Impact of Tourism on Galveston Island, Texas 2012 Analysis Headline Results Headline results Tourism is a significant contributor to business sales, employment, and taxes on Galveston Island.
Economic Impact of Aviation in Arizona
 Economic Impact of Aviation in Arizona Presented by: Arizona Department of Transportation Aeronautics Division May 5, 2004 Aviation Contributes $38.5 Billion to the Arizona Economy PRIMARY IMPACT Economic
AIRPORT: Yakima Air Terminal (YKM) ASSOCIATED CITY: Yakima ARC: C-III Region: South Central
 ASSOCIATED CITY: Yakima ARC: C-III Region: South Central") AIRPORT: Yakima Air Terminal (YKM) ASSOCIATED CITY: Yakima ARC: C-III Region: South Central AIRPORT DATA AND FACILITIES is located in Yakima County, three miles south of the City. The Airport has 115 based
AIRPORT: Yakima Air Terminal (YKM) ASSOCIATED CITY: Yakima ARC: C-III Region: South Central AIRPORT DATA AND FACILITIES is located in Yakima County, three miles south of the City. The Airport has 115 based
The Economic Impact of Emirates in the United States. Prepared by:
 Prepared by: www.av-econ.com Alexandria, Virginia July 2017 EXECUTIVE SUMMARY About Emirates Emirates Airline (Emirates), based in Dubai, United Arab Emirates (U.A.E.), was established in 1985 and since
Wyoming Travel Impacts
 Wyoming Travel Impacts 2000-2013 Wyoming Office of Tourism April 2014 Prepared for the Wyoming Office of Tourism Cheyenne, Wyoming The Economic Impact of Travel on Wyoming 2000-2013 Detailed State and
The Economic Impact of Tourism in North Carolina. Tourism Satellite Account Calendar Year 2015
 The Economic Impact of Tourism in North Carolina Tourism Satellite Account Calendar Year 2015 Key results 2 Total tourism demand tallied $28.3 billion in 2015, expanding 3.6%. This marks another new high
Local Government or Entity with an AFA
 Local Government or Entity with an AFA County Name BOWIE BRAZORIA BRAZOS BROOKS BURLESON CALDWELL LOCAL GOVERNMENT OR ENTITY NAME ALAMO AREA COG ALAMO RMA, C/O COUNTY PW COUNTY COUNTY BOWIE COUNTY BRAZORIA
Dallas/Fort Worth: DirecTV 675. Frontier Communications 77 (SD) 577 (HD) Spectrum Dallas 320 Spectrum Fort Worth 300 (SD) 776 (HD) 32, 35 (SD/HD)
 577 (HD) Spectrum Dallas 320 Spectrum Fort Worth 300 (SD) 776 (HD) 32, 35 (SD/HD)") FOX Sports Plus is a channel used by FOX Sports Southwest to simultaneously show multiple events on two channels, giving viewers another option to follow their favorite teams. FOX Sports Plus is available
FOX Sports Plus is a channel used by FOX Sports Southwest to simultaneously show multiple events on two channels, giving viewers another option to follow their favorite teams. FOX Sports Plus is available
VIRGINIA AIRPORT SYSTEM ECONOMIC IMPACT STUDY EXECUTIVE SUMMARY
 VIRGINIA AIRPORT SYSTEM ECONOMIC IMPACT STUDY EXECUTIVE SUMMARY The Economic Importance of Virginia s Airports The Commonwealth of Virginia s diverse system of 66 public-use airports plays a vital role
The Economic Contributions of Agritourism in New Jersey
 The Economic Contributions of Agritourism in New Jersey Bulletin E333 Cooperative Extension Brian J. Schilling, Extension Specialist in Agricultural Policy Kevin P. Sullivan, Institutional Research Analyst
Existing Airport System
 Introduction Rhode Island s Aviation System A strong relationship exists between Rhode Island s economy and aviation. In today s global market place, the state s system of commercial service and general
Wyoming Travel Impacts
 Wyoming Travel Impacts 2000-2014 Wyoming Office of Tourism April 2015 Prepared for the Wyoming Office of Tourism Cheyenne, Wyoming The Economic Impact of Travel on Wyoming 2000-2014 Detailed State and
The Economic Impact of Tourism in North Carolina. Tourism Satellite Account Calendar Year 2013
 The Economic Impact of Tourism in North Carolina Tourism Satellite Account Calendar Year 2013 Key results 2 Total tourism demand tallied $26 billion in 2013, expanding 3.9%. This marks another new high
The Economic Impact of Tourism in Hillsborough County, June 2018
 The Economic Impact of Tourism in Hillsborough County, 2017 June 2018 Table of contents 1) Key Findings for 2017 3 2) Local Tourism Trends 7 3) Trends in Visits and Spending 12 4) The Domestic Market 19
The Economic Impact of Tourism in Maryland. Tourism Satellite Account Calendar Year 2015
 The Economic Impact of Tourism in Maryland Tourism Satellite Account Calendar Year 2015 MD tourism economy reaches new peaks The Maryland visitor economy continued to grow in 2015; tourism industry sales
Trout Stocking Schedule - Sorted by Stocking Dates
 Trout Stocking Schedule - Sorted by Stocking Dates *based on January 10, 2015 update Stocking Location City Hatchery DateCnv Date Status Grover-Nelson Small Pond * Abilene PK Nov 25 2014 11/25/2014 Completed
Chapter 1: Introduction Draft
 Chapter 1: Draft TABLE OF CONTENTS 1... 4 1.6.1 Stakeholder Engagement Plan... 10 Chapter 1 Page 2 TABLE OF EXHIBITS Exhibit 1.1-1 ABIA Annual Growth Since 1993... 5 Exhibit 1.4-1: ABIA Location Map...
SECTION 3 AVIATION ACTIVITY FORECASTS
 SECTION 3 AVIATION ACTIVITY FORECASTS 3.1 INTRODUCTION Projecting future aviation demand is a critical element in the overall master planning process. The activity forecasts developed in this section are
The Economic Impact of Tourism on Galveston Island, Texas
 The Economic Impact of Tourism on Galveston Island, Texas 2017 Analysis Prepared for: Headline Results Headline results Tourism is an integral part of the Galveston Island economy and continues to be a
The Economic Impact of Tourism in Buncombe County, North Carolina
 The Economic Impact of Tourism in Buncombe County, North Carolina 2017 Analysis September 2018 Introduction and definitions This study measures the economic impact of tourism in Buncombe County, North
~~~ 1. EXECUTIVE SUMMARY -RSW
 . ~~~ 1. EXECUTVE SUMMARY -RSW This section presents summary findings of the Economic mpact of Southwest Florida nternational Airport (Airport) for 1999, conducted for the Lee County Port Authority (Authority).
The Economic Impact of Travel in Minnesota Analysis
 The Economic Impact of Travel in Minnesota 2013 Analysis Overview 2013 Highlights Traveler Spending Traveler spending of $10.3 billion generated $17.6 billion in total business sales in 2013 as travel
The Economic Impact of Tourism in Maryland. Tourism Satellite Account Calendar Year 2016
 The Economic Impact of Tourism in Maryland Tourism Satellite Account Calendar Year 2016 County Results Washington County, Visitors Washington County Visitors (thousands) Year Overnight Day Total Growth
ENERGY SYSTEMS LABORATORY Texas Engineering Experiment Station Texas A&M University System
 ESL-TR-05-12-05 NO X, SO X AND CO 2 EMISSIONS REDUCTION FROM CONTINUOUS COMMISSIONING (CC ) MEASURES AT THE RENT-A-CAR FACILITY IN THE DALLAS-FORT WORTH INTERNATIONAL AIRPORT Juan-Carlos Baltazar-Cervantes
Chapter 1: Introduction
 Chapter 1: TABLE OF CONTENTS 1... 4 1.1 Master Plan Study Content... 4 1.2 Purpose and Scope of Master Plan Study... 4 1.3 Airport History and Role... 6 1.4 Airport Location and Service Area... 6 1.5 ABIA
TEXAS TRANSPORTATION COMMISSION
 TEXAS TRANSPORTATION COMMISSION ALL Counties MINUTE ORDER Page 1 of 1 ALL Districts Transportation Code, 201.991 provides that the Texas Department of Transportation (department) shall develop a Unified
ECONOMIC IMPACT STUDY OF CALIFORNIA AIRPORTS
 ECONOMIC IMPACT STUDY OF CALIFORNIA AIRPORTS MARCH 1, 2013 Prepared for California Airports Council Prepared by Applied Development Economics 100 Pringle Avenue, Suite 560 Walnut Creek, California 94596
Tyler Counties (Headquarters) Counties (alpha) Cities (alpha) Anderson Alto Allen Cherokee Anderson Anna Gregg Angelina Apple Springs Henderson
 Counties (alpha) Cities (alpha) Anderson Alto Allen Cherokee Anderson Anna Gregg Angelina Apple Springs Henderson") Tyler Counties (Headquarters) Counties (alpha) Cities (alpha) Anderson Alto Allen Cherokee Anderson Anna Gregg Angelina Apple Springs Henderson Athens Argyle Panola Bowie Atlanta Rains Bullard Aubrey Rusk
Tyler Counties (Headquarters) Counties (alpha) Cities (alpha) Anderson Alto Allen Cherokee Anderson Anna Gregg Angelina Apple Springs Henderson Athens Argyle Panola Bowie Atlanta Rains Bullard Aubrey Rusk
Westover Metropolitan Airport Master Plan Update
 Westover Metropolitan Airport Master Plan Update June 2008 INTRODUCTION Westover Metropolitan Airport (CEF) comprises the civilian portion of a joint-use facility located in Chicopee, Massachusetts. The
The Economic Impact of Travel in Kansas. Tourism Satellite Account Calendar Year 2013
 The Economic Impact of Travel in Kansas Tourism Satellite Account Calendar Year 2013 Who we are Tourism Economics Union of industry expertise and economic disciplines Real world insights based on quantitative
THE ECONOMIC SIGNIFICANCE OF TOURISM AND NATURE TOURISM IN CORPUS CHRISTI 2012 UPDATE
 THE ECONOMIC SIGNIFICANCE OF TOURISM AND NATURE TOURISM IN CORPUS CHRISTI 2012 UPDATE Prepared for Corpus Christi Convention & Visitors Bureau Prepared by Jim Lee, Ph.D. March 2012 TABLE OF CONTENTS Section
Time-series methodologies Market share methodologies Socioeconomic methodologies
 This Chapter features aviation activity forecasts for the Asheville Regional Airport (Airport) over a next 20- year planning horizon. Aviation demand forecasts are an important step in the master planning
SUMMARY. Figure 1 ECONOMIC IMPACT OF U.S. CIVIL AVIATION IN 2007
 FINAL REPORT ECONOMIC IMPACT STUDY Sacramento County Airport System Prepared for Sacramento County Airport System Sacramento, California January 2011 FINAL REPORT ECONOMIC IMPACT STUDY Sacramento County
Technical Report Economic Impact Study
 Technical Report 2009 Economic Impact Study Prepared for: Metropolitan Washington Airports Authority 1 Aviation Circle Washington, DC 20001 Prepared by: The Louis Berger Group, Inc. 2445 M Street, NW Washington,
Tourism Satellite Account Calendar Year 2010
 The Economic Impact of Tourism in Georgia Tourism Satellite Account Calendar Year 2010 Highlights The Georgia visitor economy rebounded in 2010, recovering 98% of the losses experienced during the recession
Agency COG Name First Last Phone Pickup Date ERGs Atascosa County ALAMO AREA COUNCIL OF GOVERNMENTS James Minze
 Atascosa County ALAMO AREA COUNCIL OF James Minze jminze@aacog.com 210-585-1241 7/13/2016 5,400 Bandera County ALAMO AREA COUNCIL OF James Minze jminze@aacog.com 210-585-1241 7/13/2016 5,400 Bexar County
PRE-LEASING KDTO. Denton Enterprise Airport ±15,500 SF CORPORATE HANGAR FACILITY. West Court Drive Denton Texas UNDER CONSTRUCTION OCT 2018
 PRE-LEASING UNDER CONSTRUCTION OCT 2018 ±15,500 SF CORPORATE HANGAR FACILITY Denton Enterprise Airport UNDER CONSTRUCTION (PRE-LEASING) 12,000 SF CORPORATE HANGAR (120' WIDE x 100' DEEP) SCHWEISS HYDRAULIC
FOX Sports Plus Channel Guide. Satellite/Telco:
 FOX Sports Plus is a channel used by FOX Sports Southwest to simultaneously show multiple events on two channels, giving viewers another option to follow their favorite teams. FOX Sports Plus is available
5.4 SECONDARY (INDUCED) IMPACTS
 IMPACTS") 5.4 SECONDARY (INDUCED) IMPACTS Major development proposals often involve the potential for induced or secondary impacts on surrounding communities. Examples of these impacts include: shifts in patterns
5.4 SECONDARY (INDUCED) IMPACTS Major development proposals often involve the potential for induced or secondary impacts on surrounding communities. Examples of these impacts include: shifts in patterns
SLOW GROWTH OF SOUTHERN NEVADA ECONOMY
 NEVADA S ECONOMY A monthly report produced for Commerce Real Estate Solutions by Stephen P. A. Brown, PhD, Center for Business & Economic Research, University of Nevada, Las Vegas To receive an electronic
Status Report on New Nursing Education Programs and Potential Proposals
 Agenda Item: 3.2.1. Prepared by: J. Hooper Board Meeting: October Report on New Education s and Potential Proposals The following table lists vocational and professional nursing education s approved since
Fort McMurray International Airport
 FINAL REPORT Fort McMurray International Airport Economic Impacts Associated with Current Air Services PREPARED FOR Fort McMurray Airport Authority (FMAA) PREPARED BY InterVISTAS Consulting Inc. 29 September
APPENDIX B: NPIAS CANDIDATE AIRPORT ANALYSIS
 APPENDIX B: NPIAS CANDIDATE AIRPORT ANALYSIS The National Plan of Integrated Airport Systems (NPIAS) is the Federal Aviation Administration s (FAA) national airport plan. The NPIAS includes nearly 3,500
Benchmarking Travel & Tourism in United Arab Emirates
 Benchmarking Travel & Tourism in United Arab Emirates How does Travel & Tourism compare to other sectors? Summary of Findings, November 2013 Sponsored by: Outline Introduction... 3 UAE summary...... 8
Economic Impact of Tourism in South Dakota, December 2018
 Economic Impact of Tourism in South Dakota, 2018 December 2018 1) Key Findings Growth rebounds in 2018 as a strong hunting season drives tourism growth Key facts about South Dakota s tourism sector Key
The Travel and Tourism Industry in Vermont. A Benchmark Study of the Economic Impact of Visitor Expenditures on the Vermont Economy 2005
 The Travel and Tourism Industry in Vermont A Benchmark Study of the Economic Impact of Visitor Expenditures on the Vermont Economy 2005 INTRODUCTION GENERAL November, 2006 This 2005 update of the original
TEXAS PURPLE HEART ENTITITES
 TEXAS PURPLE HEART ENTITITES STATE Texas, USA 78701 CITIES/TOWNS/VILLAGES Addison, TX 75001 Abernathy, TX 79311 Arlington, TX 76010 Austin, TX 78702 Belton, TX 76513 Boerne, TX 78006 Bullard, TX 75757
The Economic Impacts of the Open Skies Initiative: Past and Future
 The Economic Impacts of the Open Skies Initiative Past and Future strategic transportation & tourism solutions The Economic Impacts of the Open Skies Initiative: Past and Future Prepared for Aéroports
ECONOMIC IMPACT OF THE RELIEVER AIRPORTS
 Metropolitan Airports Commission ECONOMIC IMPACT OF THE RELIEVER AIRPORTS Prepared for Prepared by April 3, 2018 Executive Summary The Metropolitan Airports Commission engaged InterVISTAS Consulting Inc.
The forecasts evaluated in this appendix are prepared for based aircraft, general aviation, military and overall activity.
 Chapter 3: Forecast Introduction Forecasting provides an airport with a general idea of the magnitude of growth, as well as fluctuations in activity anticipated, over a 20-year forecast period. Forecasting
The Economic Impact of Tourism in Hillsborough County. July 2017
 The Economic Impact of Tourism in Hillsborough County July 2017 Table of contents 1) Key Findings for 2016 3 2) Local Tourism Trends 7 3) Trends in Visits and Spending 12 4) The Domestic Market 19 5) The
Statewide Transportation Enhancement Program
 Statewide Transportation Enhancement Program Call 6 nominations TxDOT District Project Name Abilene Big Spring State Park CCC Road Engineering Study Texas Parks and Wildlife Department $201,480 Abilene
PARKING LOT VENDING TENANT INFORMATION:
 PARKING LOT VENDING TENANT INFORMATION: If you are interested in being a Parking Lot vendor, there are a few minimum requirements including (but not limited to): Tenant must sign a minimum of a six month
2012 Texas Water Conservation Association Meeting
 2012 Texas Water Conservation Association Meeting BG Thomas Kula Southwestern Division Commander 15 June 2012 US Army Corps of Engineers AGENDA UNCLASSIFIED Overview of Southwestern Division Missions Texas
Overview of the Southern Nevada Convention and Meeting Segment
 Executive Summary Applied Analysis was retained by the Las Vegas Convention and Visitors Authority (the LVCVA ) to review and analyze the economic impacts associated with its various operations and southern
WSDOT Aviation Aviation Economic Impact Study
 WSDOT Aviation Aviation Economic Impact Study Paula J. Hammond, P.E. Secretary David L. Dye, P.E. Deputy Secretary Steve Reinmuth Chief of Staff Tristan Atkins WSDOT Aviation Director Washington State
Outlook for Future Demand
 Chapter Three: Introduction This chapter discusses findings and methodologies used to project future aviation demand for study airports. Forecasts developed in the Greater Kansas City Regional Aviation
Economic Impact Analysis. Tourism on Tasmania s King Island
 Economic Impact Analysis Tourism on Tasmania s King Island i Economic Impact Analysis Tourism on Tasmania s King Island This project has been conducted by REMPLAN Project Team Matthew Nichol Principal
VALUE OF TOURISM. Trends from
 VALUE OF TOURISM Trends from 2005-2015 March 2017 TABLE OF CONTENTS 1. Overview... 2 Key highlights in 2015... 2 2. Contributions to the economy... 4 TOURISM REVENUE... 5 Total revenue... 5 Tourism revenue
2013 WYOMING AIRPORTS Economic Impact Study ECONOMIC IMPACT. Executive Summary
 2013 WYOMING AIRPORTS Economic Impact Study ECONOMIC IMPACT Executive Summary 2013 Economic Impact Study for Wyoming Airports Study Overview In late 2013, the Aeronautics Division of the Wyoming Department