Professor Carey Curtis Curtin University
|
|
|
- Maud McKenzie
- 5 years ago
- Views:
Transcription
1 Integrating Land Use with Public Transport: the use of a discursive accessibility tool to inform metropolitan spatial planning Professor Carey Curtis Curtin University
2 Approach... Local Policy Context and LUTI practices The SNAMUTS tool Using SNAMUTS to inform future metropolitan growth Using SNAMUTS to inform future public transport options Comparing Perth, Melbourne and Sydney
3 Approach... Local Policy Context and LUTI practices The SNAMUTS tool Using SNAMUTS to inform future metropolitan growth Using SNAMUTS to inform future public transport options Comparing Perth, Melbourne and Sydney

4 'land use transport integration' is not new; part of planning ideology for decades Reality check... >100 activity centres (defined by non-home based trip destinations Some planned but many unplanned the possibility of supplying a high frequency public transport system to serve these centres represents a significant and expensive challenge Source: C.Curtis, 2001

5 1990 s new approach emerging policy context Mode Share Target by trips (1995): Perth % 5 80% Perth % 13% 61% Non-motorised modes Public transport Private vehicle...targets imply that public transport patronage needs to grow four-fold between 2000 and
6 Network City spatial framework did not determine which centres should perform which role within the goal of sustainable accessibility demanded a multi-dimensional perspective which centres have or could have mixed use development also which have or could have more sustainable accessibility centres must not be considered in isolation from each other the way in which they are networked which forms an important component
7 Approach... Local Policy Context and LUTI practices The SNAMUTS tool Using SNAMUTS to inform future metropolitan growth Using SNAMUTS to inform future public transport options Comparing Perth, Melbourne and Sydney
 are travel time, and the ubiquity of travel")
8 compiling a base network... Our focus is on measuring the ease of movement on a public transport network in ways that come close to user perceptions and motivations... Public transport users are only marginally interested in geographical distance: the main factors of travel impediment (or spatial separation) are travel time, and the ubiquity of travel opportunities (service frequency).
 during the weekday inter-peak period - determines a transfer point according to intersections of")
9 compiling a base network... Our network model: -applies a minimum service standard - a 30-minute frequency (or better) during the weekday inter-peak period - determines a transfer point according to intersections of routes that offer a level of convenience that is functionally and visually co-located, with signposting as required and (relatively) barrier-free access between modes.
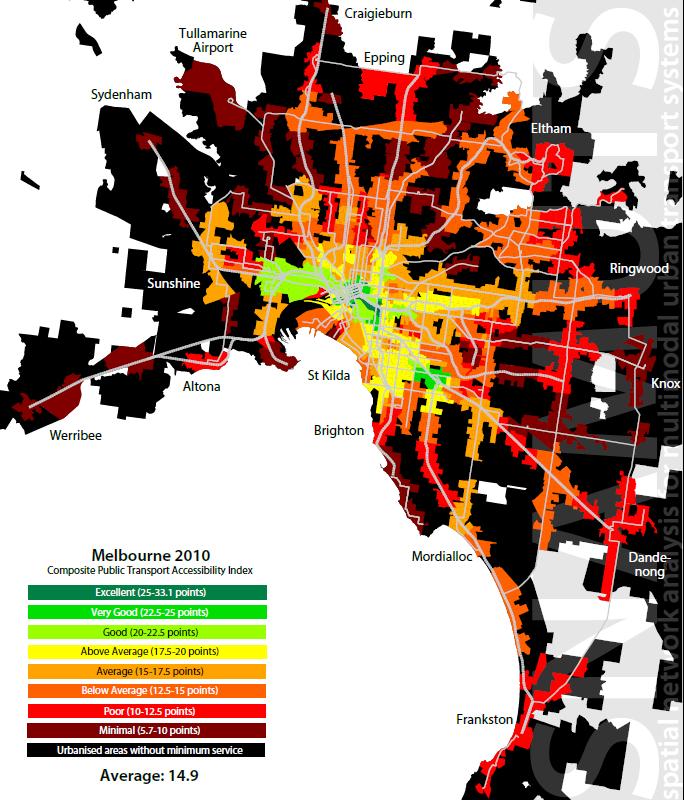
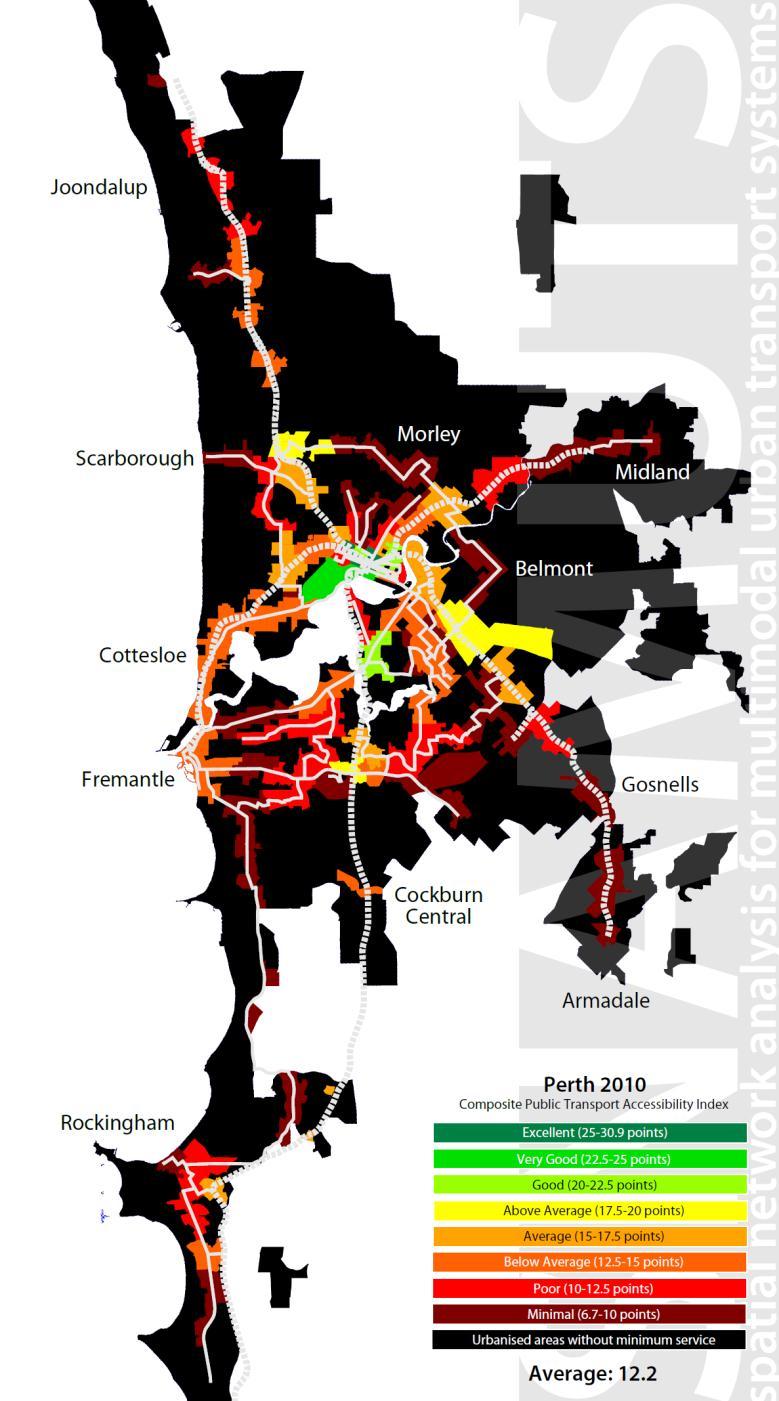
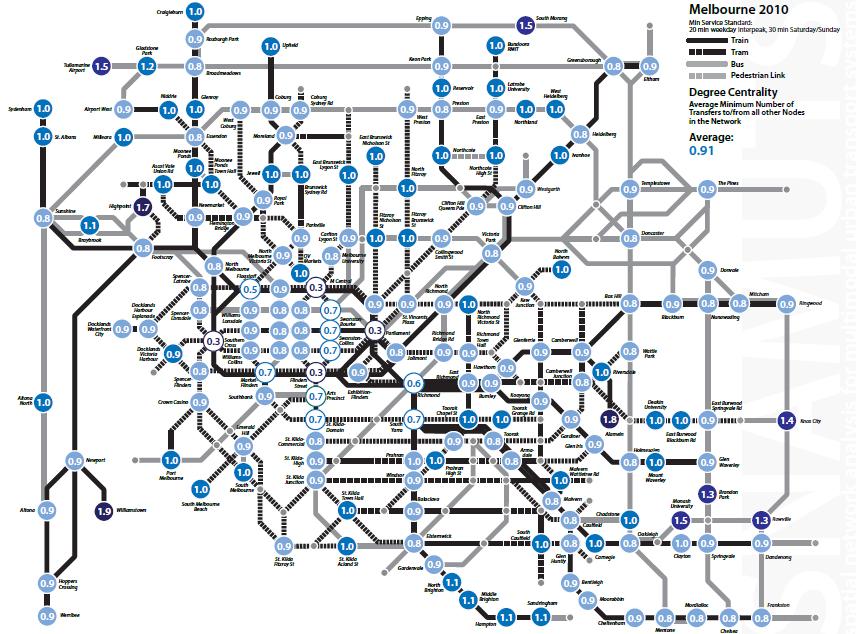
10 SNAMUTS Indicators 1. Impediment: what is the ease of movement between adjacent network nodes expressed by time and frequency? 2. Degree centrality: How many transfers separate a node from the rest of the network? 3. Closeness centrality: What is the ease of movement between a node and the rest of the network? 4. Efficiency centrality: By how much does ease of movement across the network improve? 5. Catchment size of 30-minute travel time contour: How many residents and jobs are accessible within half an hour? 6. Betweenness centrality: How are travel opportunities geographically distributed across the network? 7. Speed comparison: How competitive is public transport travel with road travel? 8. Connectivity Index: How well integrated is a node within the web of travel opportunities? Full explanation see: Progress in Planning Vol 74 (2010), pp
11 project1
12
13 Activity Centres Walkable Catchme nt Populatio n 2008 Walkable Catchme nt Employm ent 2008 Walkable Catchment Activities min Catchme nt Populatio n min Catchment Employmen t 2008 Composite Public Transport Accessibility Ran Value k project 2 High Accessibility Perth Central- Northbridge 9,992 50,987 60, , , (could do with more housing) Perth Esplanade 4,011 30,589 34, , , (could do with more housing) Bull Creek 14,462 2,019 16, , , (could do with more jobs) Claisebrook-East Perth 5,305 6,514 11, , , (could do with more housing) Oats Street 5,825 12,430 18, , , (could do with more housing) Unbalanced Node: Intensify Canning Bridge 8,353 1,653 10, , , Land Use Medium Accessibility Cottesloe-Mosman Park 12,497 1,205 13, , , (could do with more jobs) Gosnells 6,687 1,219 7, , , Unbalanced Node: Intensify 14 Land Use Subiaco 11,355 4,073 15, , , Unbalanced Place: Improve 16 Accessibility Thornlie 16,828 1,803 18, , , Unbalanced Node: Intensify 18 Land Use Low Accessibility Balcatta 16,828 1,803 18, , , Unbalanced Place: Improve 18 Accessibility Unbalanced Place: Improve
14 Approach... Local Policy Context and LUTI practices The SNAMUTS tool Using SNAMUTS to inform future metropolitan growth Using SNAMUTS to inform future public transport options Comparing Perth, Melbourne and Sydney

15 Project 3... research questions: What is the contribution land use-transport integration can make towards the Metro Land Use Planning and Metro Transport Strategy goals? How can SNAMUTS help assess and inform this process......which development scenario provides for greatest public transport accessibility potential?
16 Research Approach...test a range of scenarios to assist in the development of a hierarchy of activity centres by exploring and measuring the effect of : Changes in public transport accessibility resulting from service improvements Comparative accessibility by car and by public transport (to examine how and where public transport can be more competitive) Exploring potential changes in activity levels (different patterns of jobs/residents defined by regional/local catchments) in each activity centre
17 The testing of these types of scenarios enables key Network City questions to be examined Which Activity Centres and Corridors can best be intensified? Which Centres should perform a regional role and which a local role? Where should public transport investment (infrastructure, service improvement) go? Answers to these questions will provide a robust basis for decisions about the future metropolitan structure.
18 Scenario development Discursive process... Model development... Phase 1: Game 1 - Strategic development priorities Phase 1: Game 2 Urban growth trends 20 yrs on Building 2031 network and designation of growth areas and type; Modelling scenarios Phase 2: Game 1 strategic development priorities (within each scenario) Phase 2: Game 2 developing a composite scenario Building Composite network and designation of growth areas and type; Modelling CWB scenario
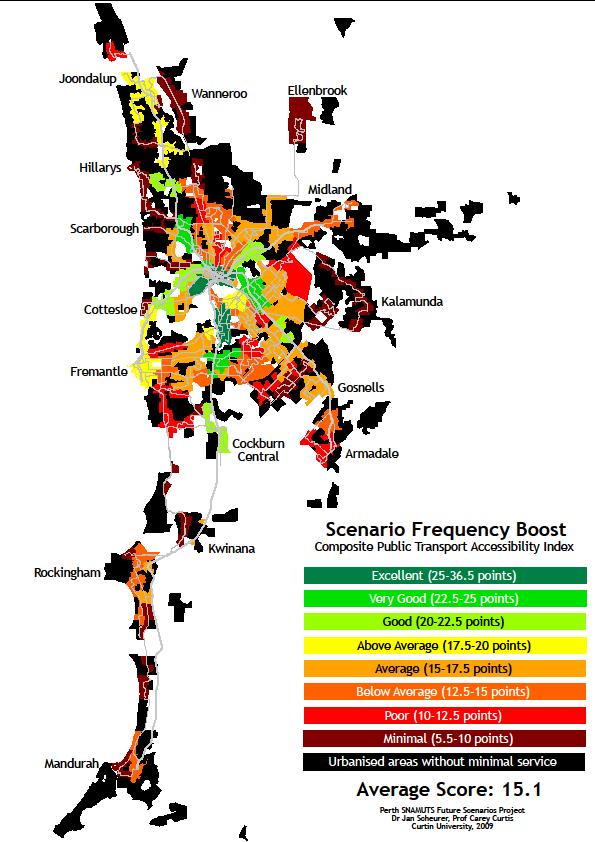
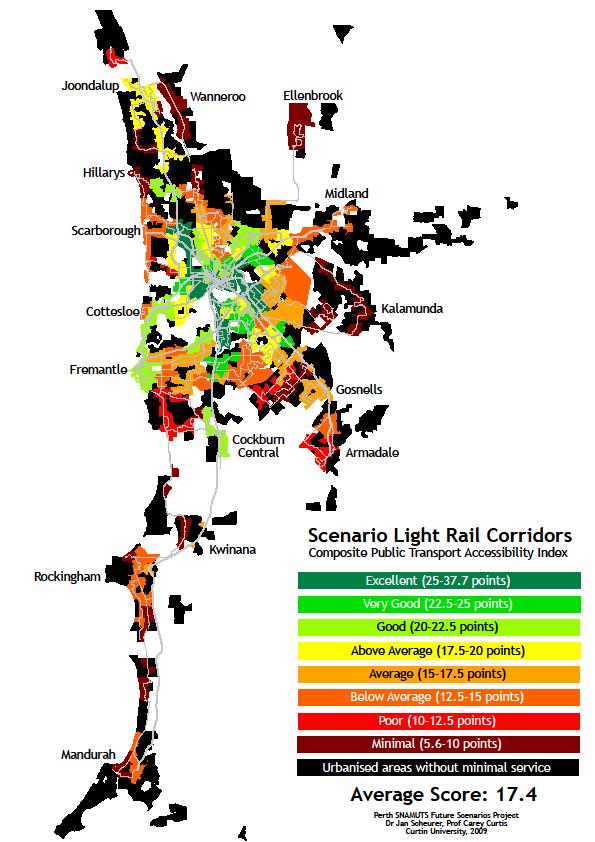
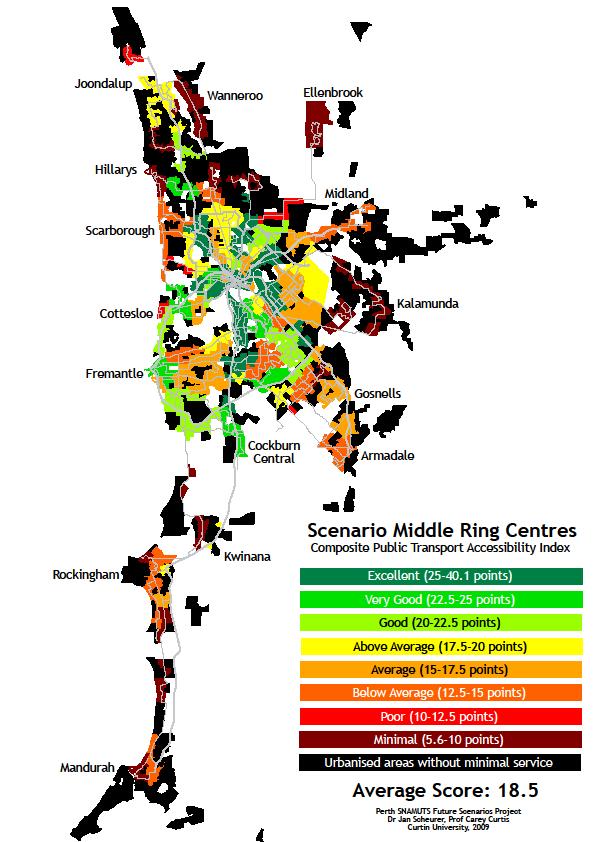
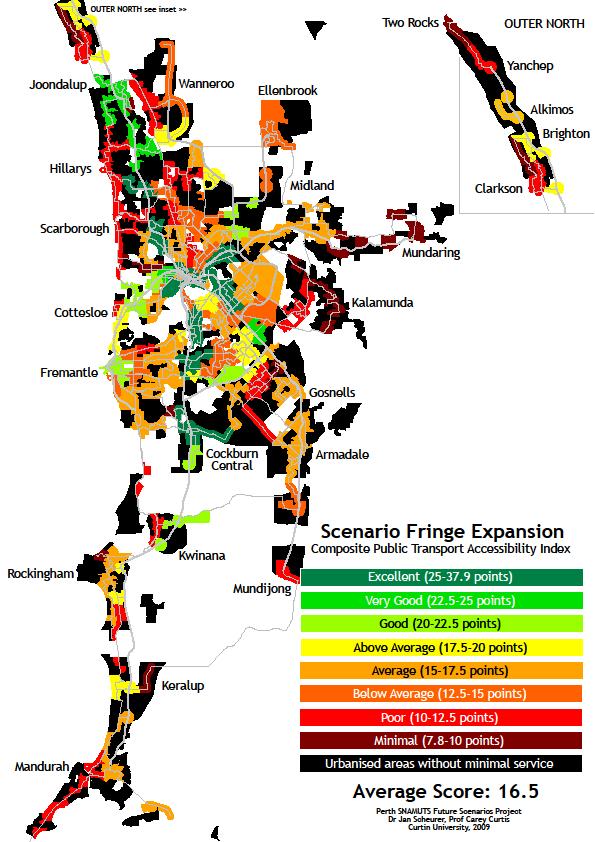
19 scenarios for testing Status Quo: Public transport network in early Frequency Boost: Public transport network after a comprehensive package of service improvements, achievable in the short term. Future land use-transport integration scenarios with a 2031 horizon: Light Rail Corridors Middle Ring Centres Fringe Expansion
20
21
22 summary of findings: contour catchments Service Intensity: Service hours per hour (weekday interpeak) on the minimum-standard network Average 30-minute contour catchment (number of residents and jobs) STQ 279 STQ 249,800 FRB 355 FRB 279,200 LRC 382 LRC 577,500 MRC 371 MRC 649,900 FEX 446 FEX 342,800 CWB 430 CWB 601,600 STQ = Status Quo FRB = Frequency Boost LRC = Light Rail Corridors MRC = Middle Ring Centres FEX = Fringe Expansion CWB = Composite Wishbone
23 summary of findings: network coverage Service Intensity: Service hours per hour (weekday interpeak) on the minimum-standard network Network Coverage: Percentage of residents and jobs in metropolitan area within walking distance of minimum-standard service STQ 279 STQ 62.7% FRB 355 FRB 63.4% LRC 382 LRC 75.3% MRC 371 MRC 76.3% FEX 446 FEX 66.6% CWB 430 CWB 79.5% STQ = Status Quo FRB = Frequency Boost LRC = Light Rail Corridors MRC = Middle Ring Centres FEX = Fringe Expansion CWB = Composite Wishbone
24 Phase 2 - Game 2 Creating a meaningful composite scenario Re-group (drawing one from each scenario group) Each group develops a composite scenario: land use strategy; public transport network.
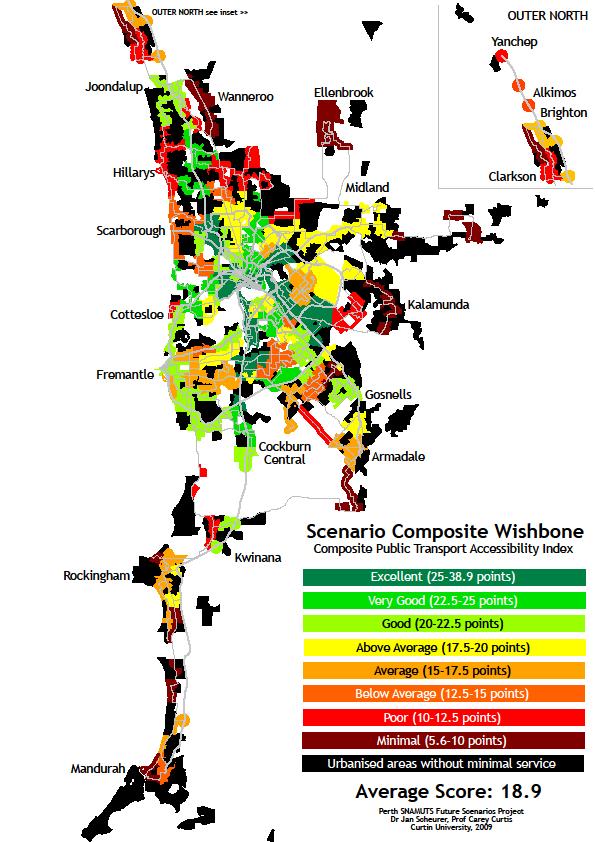
 and along a southern orbital between Bayswater and Fremantle via the airport (approx.")
25 scenario composite wishbone Incorporates the best-performing elements of the three previous scenarios while allowing for all three forms of urban growth to continue concurrently. Contains heavy rail extensions between Clarkson and Yanchep (northern corridor) and along a southern orbital between Bayswater and Fremantle via the airport (approx. 60 km), and a 109-km mixed light rail network centred on a wishbone-shaped orbital between Fremantle and Scarborough, a north-eastern radial including a short CBD tunnel and several branch lines. Also includes a bus transitway along South Street (15 km) as well as several new orbital and diagonal bus routes to link the growth areas. Urban consolidation and growth to occur in the 400/800-metre catchments of all new public transport facilities, at an average target density of 75 residents and jobs per hectare [say 30du/ha] (except in Perth s CBD and in the activity centres of Armadale, Fremantle, Joondalup, Midland, Murdoch, Rockingham and Stirling-Glendalough where the target density is 150 res + jobs per ha).
26
27 Indicator Scenario Status Quo (STQ) Scenario Frequency Boost (FRB) 177 km, 67 stations Scenario Light Rail Corridors (LRC) Scenario Middle Ring Centres (MRC) 209 km, 79 stations Scenario Fringe Expansion (FEX) Scenario Composite Wishbone (CWB) 237 km, 86 stations Heavy Rail route length and number of stations 177 km, 67 stations 177 km, 68 stations 287 km, 102 stations Light Rail route length km 55 km 20 km, 6 stations 109 km Service Intensity (veh hrs/hr (30 rail, (35 rail, (35 HR, 372 (39 HR, 446 (61 HR, 430 (52 HR, weekday interpeak period) bus) bus) 99 LR, 247 B) 32 LR, 301 B) 3 LR, 383 B) 85 LR, 293 B) Coverage of residents/jobs metro area >29 min service 62.7% 63.4% 75.3% 76.3% 66.6% 79.5% Degree Centrality (average per node) Closeness Centrality (average per node) Efficiency Change (weighted) - +28% +120% +130% +67% +173% 30-min Catchment in residents and jobs (av/per node) 249, , , , , , min Catchment (av/per node in % of tot. resids & jobs) Betweenness Centrality (weighted by combined catchment size and cumulative impediment), activity nodes ranked 1-10 WHERE IS THE ENERGY IN THE NETWORK Betweenness Centrality (segments per mode - % trav. time) Betweenness Centrality at CBD cordon Speed Comparison pub trspt/congested road (av per node) Connectivity Score in Activity Nodes 13.6% 15.3% 22.2% 24.8% 13.1% 23.1% 1 Perth Central (46.8%) 2 Perth Esplanade (39.3%) 3 Murdoch (19.7%) 4 Bull Creek (19.3%) 5 Leederville (18.8%) 6 Claisebrook (18.5%) 7 Glendalough (17.6%) 8 Stirling (15.8%) 9 Oats Street (13.0%) 10 Warwick (11.1%) 1 Perth Central (49.5%) 2 Perth Esp ade (29.6%) 3 Canning Bridge (25.5%) 4 Claisebrook (22.3%) 5 Leederville (19.8%) 6 Murdoch (18.0%) 7 Bull Creek (17.4%) 8 Burswood (17.3%) 9 Glendalough (17.0%) 10 Oats Street (14.5%) Rail 43%, Bus 57% Rail 50%, Bus 50% 1 Perth Central (41.5%) 2 Canning Bridge (21.4%) 3 Perth Esplanade (17.2%) 4 Claisebrook (15.8%) 5 South Perth (14.3%) 6 Burswood (13.6%) 7 Glendalough (13.0%) 8 Subiaco (12.1%) 9 Leederville (11.9%) 10 Bull Creek (11.1%) HR 35%, LR42%, Bus 23% 1 Perth Central (42.7%) 2 Perth Esplanade (22.5%) 3 Canning Bridge (20.1%) 4 Murdoch (18.1%) 5 Concert Hall (15.5%) 6 Bull Creek (15.4%) 7 South Perth (14.6%) 8 Northbridge (14.1%) 9 Leederville (13.8%) 10 Claisebrook (13.0%) HR 44%, LR 22%, Bus 34% 1 Perth Central (49.2%) 2 Perth Esplanade (28.9%) 3 Claisebrook (28.6%) 4 Canning Bridge (26.2%) 5 Murdoch (22.6%) 6 Leederville (20.1%) 7 Bull Creek (20.1%) 8 Glendalough (18.4%) 9 Bayswater (18.3%) 10 Stirling (15.8%) HR 63%, LR 1%, Bus 37% 1 Perth Central (40.4%) 2 Canning Bridge (22.3%) 3 Perth Esplanade (20.5%) 4 Murdoch (17.6%) 5 South Perth (16.3%) 6 Claisebrook (15.9%) 7 Glendalough (15.4%) 8 Bull Creek (15.3%) 9 Leederville (13.2%) 10 Concert Hall (12.6%) HR 50%, LR 28%, Bus 21% 54.7% 48.3% 41.3% 44.8% 50.8% 39.4%
28 Approach... Local Policy Context and LUTI practices The SNAMUTS tool Using SNAMUTS to inform future metropolitan growth Using SNAMUTS to inform future public transport options Comparing Perth, Melbourne and Sydney
29 Land use assumptions and service input per scenario (2009 = Status Quo, Scenario 2031) Service Intensity: Train (+81%) Service Intensity: Bus (+56%) Service Intensity: Ferry 1 3 (+118%) Service Intensity: (+58%) Total Number of Nodes Activities in 2,629,497 3,655,399 metropolitan area Activities in serviced 2,528,198 (96%) 3,513,548 (96%) area 24th Aesop Annual Conference Finland 7-10 July
30 our evaluation of the network we focussed on the following objectives: The extent to which potential accessibility of quality public transport was expanded to a larger proportion of metropolitan residents; The extent to which accessibility was enhanced across fourteen key activity centres (defined by PTA); The public transport effort (performance of different transport modes and across corridors). 30
31 Composite Accessibility Index for key centres AC1 (outer region) (+2.9) AC2 (middle region) (+3.0) AC3 (inner region major employment centre) (+4.2) AC4 (inner region) (+2.3) AC5 (outer region) (+4.0) this shows our Composite SNAMUTS Accessibility Index for the metro area as whole and for the 14 centres...higher figures indicate better accessibility, up to a theoretical maximum of 45. AC6 (outer region) (+1.8) AC7 (outer region) (+2.0) AC8 (middle region large employment centre) (+3.9) AC9 (Airport) (+12.6) AC10 Perth Central (+4.2) AC11 (outer region) (+2.4) On average accessibility across the network goes up by about 3 points on the 45-point scale...but does not reach 45. AC12 (middle region major employment centre) (+3.4) AC13 (inner region major employment centre) (+5.3) AC14 (outer region) Average Key Centres (+3.4) Standard Deviation Key Centres Average Network Standard Deviation Network th Aesop Annual Conference Finland 7-10 July (+3.1)
32 Contour catchment change for key activity centres AC1 (outer region) 17.1% 26.6% In relation to access to individual activity centres... this contour catchment index shows the percentage of total metropolitan activities (residents, jobs and students) that can be reached from the reference node within a public transport travel time of 45 minutes or less AC2 (middle region) 28.2% 31.9% AC3 (inner region major employment centre) 36.1% 46.1% AC4 (inner region) 45.2% 45.9% AC5 (outer region) 35.2% 49.4% AC6 (outer region) 14.1% 15.9% AC7 (outer region) 37.8% 40.1% AC8 (middle region large employment centre) 62.0% 80.0% AC9 (Airport) 12.2% 56.8% These centres have a metropolitan-wide function so it is desirable to be very well served by public transport... But the output here shows that they have not benefitted from the proposed measures to the extent necessary. AC10 Perth Central 77.8% 83.6% AC11 (outer region) 23.3% 26.4% AC12 (middle region major employment centre) 66.8% 72.9% AC13 (inner region major employment centre) 35.9% 59.9% AC14 (outer region) % Average Key Centres 37.8% 46.5% Standard Deviation Key Centres 20.5% 22.2% Average Network 24th Aesop Annual Conference 30.0% % Standard Deviation Network Finland 7-10 July % 21.7%
33 Issue 1: incremental change results in lost opportunity

34 towards a solution bus re-routing

35 towards a solution higher performing mode


36 SNAMUTS tool applied to deliberate over Perth s future public transport network
37 Approach... Local Policy Context and LUTI practices The SNAMUTS tool Using SNAMUTS to inform future metropolitan growth Using SNAMUTS to inform future public transport options Comparing Perth, Melbourne and Sydney
38 38
39 24th Aesop Annual Conference Finland 7-10 July


40 24th Aesop Annual Conference Finland 7-10 July
41 24th Aesop Annual Conference Finland 7-10 July
42 42
43 To conclude There is an important need to plan for the integration of land use and public transport Tools that can demonstrate the extent of public transport accessibility have an important role in planning decision support Important questions remain as to what the benchmark for public transport access should be for Australian cities
44 Curtis C (2011) Integrating Land Use with Public Transport: The Use of a Discursive Accessibility Tool to Inform Metropolitan Spatial Planning in Perth. Transport Reviews Vol 31 (2) pp Curtis C and Scheurer J (2010) Planning for Sustainable Accessibility: Developing tools to aid discussion and decision-making. Progress in Planning Vol 74 (2010), pp Curtis C, Renne J L, Bertolini L (eds) (2009) Transit Oriented Development: Making it Happen Ashgate, Aldershot Curtis C (2008) The evolution of the TOD model for low density cities: A case study of Perth s new railway corridor. Planning Practice and Research Vol. 23, No. 3 pp (Special Edition: Integrating Rail and Land Use Investment) Curtis C (2008) Planning for Sustainable Accessibility: the implementation challenge. Transport Policy Vol 15 (2) pp
Public Transport for Perth in 2031
 South West Group Submission Public Transport for Perth in 2031 October 2011 South West Group Vision and Mission Local Governments in South Metropolitan Perth, through cooperation with industry, community
Linking Modes to Transform the Perth Public Transport Network. Mark Burgess Managing Director, Public Transport Authority
 Linking Modes to Transform the Perth Public Transport Network Mark Burgess Managing Director, Public Transport Authority The Public Transport Authority Provides public transport In Perth To the regional
5 Rail demand in Western Sydney
 5 Rail demand in Western Sydney About this chapter To better understand where new or enhanced rail services are needed, this chapter presents an overview of the existing and future demand on the rail network
Examining 60 Years of Strategic Planning in Metropolitan Perth and Peel. Gemma Davis and Georgia Harford-Mills
 Examining 60 Years of Strategic Planning in Metropolitan Perth and Peel Gemma Davis and Georgia Harford-Mills Introduction This Bulletin examines the evolution of strategic land use and transport planning
Kilometres. Blacktown. Penrith. Parramatta. Liverpool Bankstown. Campbelltown
 0 5 10 15 20 Kilometres Penrith Blacktown Parramatta Liverpool Bankstown Campbelltown accessibility outcomes Legend Outcomes targeted in Western Sydney are: public transport that is accessible throughout
Submission to Infrastructure Victoria s Draft 30-Year Infrastructure Strategy
 Submission to Infrastructure Victoria s Draft 30-Year Infrastructure Strategy 1. Introduction This submission is a response to Infrastructure Victoria s assessment of the need to construct a heavy rail
Football impacts in July and August. Plan your journey.
 Football impacts in July and August. Plan your journey. InfoLine 13 62 13 railinfo@pclrail.com.au Plan your journey transperth.wa.gov.au Find out why perthcitylink.wa.gov.au SHUTDOWN 12-1 West Coast vs
Connecting Sydney Olympic Park and GPOP with Greater Sydney. Final Summary Report 29 May 2017
 Connecting Sydney Olympic Park and GPOP with Greater Sydney Final Summary Report 29 May 2017 GPOP sits at the core of the emerging Central City. East Sydney is at the centre of the established Eastern
CHRISTCHURCH MOTORWAYS. Project Summary Statement February 2010
 CHRISTCHURCH MOTORWAYS Project Summary Statement February 2010 Table of Contents 1. Purpose of Document 2. Strategic Context 3. Benefits 4. Project Scope and Economics 5. Implementation Plan 1 ROADS OF
The Relationship between Transport, Spatial Form and Economic Growth. A comparison and analysis of Sydney, Melbourne and Perth.
 The Relationship between Transport, Spatial Form and Economic Growth. A comparison and analysis of Sydney, Melbourne and Perth Gemma Davis The relationship between transport, economic and spatial development
FUTURE TRANSPORT STRATEGY AND GREATER SYDNEY SERVICES AND INFRASTRUCTURE PLAN. Western Parkland City
 FUTURE TRANSPORT STRATEGY AND GREATER SYDNEY SERVICES AND INFRASTRUCTURE PLAN Western Parkland City 2 Transport for NSW Future Transport Strategy and Greater Sydney Services and Infrastructure Plan Western
PO Box 257 PO Box 257 PARRAMATTA NSW 2124 PARRAMATTA NSW 2124
 31 March 2017 Sean O Toole Sheridan Dudley District Commissioner - West District Commissioner - South West Greater Sydney Commission Greater Sydney Commission PO Box 257 PO Box 257 PARRAMATTA NSW 2124
PLANNING THE SUNBURY GROWTH CORRIDOR
 SUNBURY GROWTH CORRIDOR NOVEMBER 2016 PLANNING THE SUNBURY GROWTH CORRIDOR Sunbury Planning Background The Victorian Planning Authority, in consultation with Hume City Council, is undertaking a number
Perth's urban rail renaissance
 Research Online Faculty of Engineering and Information Sciences - Papers: Part B Faculty of Engineering and Information Sciences 2016 Perth's urban rail renaissance Philip G. Laird, plaird@uow.edu.au Publication
County of Cumberland Plan Sydney Region Outline Plan
 Sydney has been fortunate in having had two ground breaking Strategic Plans to guide its growth. The first was the County of Cumberland Plan 1948, based on the 1944 London Plan, complete with a green belt.
3 The growth of Western Sydney
 3 The growth of Western Sydney About this chapter This chapter provides an overview of Western Sydney s growing population and economy, and the benefit of the proposed Western Sydney Airport. Population
new Perth Stadium Transport Project Definition Plan
 new Perth Stadium Transport Project Definition Plan December 2012 Artist s impression: pedestrian bridge location 0ii transport solution for the new Perth Stadium 03 Artist s impression: new Perth Stadium
Draft City Centre Transport Proposals
 Draft City Centre Transport Proposals Introduction This draft position paper provides an overview of the current City Centre transport issues, including concepts of the possible future City Centre transport
TOWN PLANNING SUBMISSION TO THE GREATER SYDNEY COMMISSION LANDS AT ARTARMON
 TOWN PLANNING SUBMISSION TO THE GREATER SYDNEY COMMISSION LANDS AT ARTARMON March 2017 TABLE OF CONTENTS 1.0 INTRODUCTION 3 2.0 THE SUBJECT SITE 4 3.0 STRATEGIC PLANNING CONTEXT 6 4.0 SUMMARY AND CONCLUSIONS
1. Introduction. 2. Network analyses
 LIZ MCGREGOR Practise Leader, Transport Advisory Veitch Lister Consulting Liz.mcgregor@veitchlister.com.au AUSTRALIAN CAPITAL CITIES SEPARATED BY SIMILARITIES? Australia is one of the most urbanised countries
PREFACE. Service frequency; Hours of service; Service coverage; Passenger loading; Reliability, and Transit vs. auto travel time.
 PREFACE The Florida Department of Transportation (FDOT) has embarked upon a statewide evaluation of transit system performance. The outcome of this evaluation is a benchmark of transit performance that
PERTH CITY SWAN PERTH AIRPORT CURTIN UNIVERSITY WESTFIELD CAROUSEL TANGNEY CITY OF CANNING JANDAKOT AIRPORT SWAN TANGNEY
 THE CITY OF CANNING CITY OF CANNING PERTH CITY SWAN PERTH AIRPORT CURTIN UNIVERSITY WESTFIELD CAROUSEL TANGNEY CITY OF CANNING JANDAKOT AIRPORT SWAN TANGNEY UNTAPPED POTENTIAL The Canning City Centre,
Congestion. Addressing urban congestion in SEQ. How do you define congestion? South East Queensland is growing. Sustained growth in motorised travel
 How do you define congestion? Addressing urban congestion in SEQ Engineer: traffic volume exceeds road capacity Russell Murray Director Urban Congestion Task Force Department of Transport and Main Roads
DEMOGRAPHICS AND EXISTING SERVICE
 EXECUTIVE SUMMARY The Central Corridor light-rail transit (LRT) project will open in 2014 and operate between downtown Minneapolis and downtown St. Paul, serving the University of Minnesota and University
PCAL Case Study Retail Areas: Rouse Hill Town Centre
 PCAL Case Study Retail Areas: Rouse Hill Town Centre Introduction Rouse Hill Town Centre is a new mixed use development on a greenfield site in Sydney s North West. It has been planned to be a major hub
FEDERAL BUDGET PRIORITIES FOR THE SOUTH WEST METROPOLITAN REGION 2018 TO 2022
 A Co-operative venture of the municipalities of: Cockburn, East Fremantle, Fremantle, Kwinana, Melville & Rockingham Tuesday, 5 December 2017 Enquiries: Mick McCarthy 9364 0631 Our Ref: Federal Budget
New Runway Project PRELIMINARY DRAFT MAJOR DEVELOPMENT PLAN VOLUME A: BACKGROUND AND NEED SECTIONS 1-7
 New Runway Project PRELIMINARY DRAFT MAJOR DEVELOPMENT PLAN VOLUME A: BACKGROUND AND NEED SECTIONS 1-7 MAY 2018 110 New Runway Project Preliminary Draft Major Development Plan May 2018 05 Consistency with
URBAN REGENERATION CENTRED AROUND PUBLIC TRANSPORT
 5th Cyprus Sustainable Mobility and Intelligent Transport Conference 1 URBAN REGENERATION CENTRED AROUND PUBLIC TRANSPORT Jumeirah Central Development The first Transit Oriented Development of Dubai Sustainable
Interstate 90 and Mercer Island Mobility Study APRIL Commissioned by. Prepared by
 Interstate 90 and Mercer Island Mobility Study APRIL 2017 Commissioned by Prepared by Interstate 90 and Mercer Island Mobility Study Commissioned by: Sound Transit Prepared by: April 2017 Contents Section
4 Transport projects underway in Western Sydney
 4 Transport projects underway in Western Sydney About this chapter This chapter provides an overview of the Australian and NSW government s significant investments in road, bus and rail infrastructure
EXTRACTING MAXIMUM BENEFIT FROM PARKING POLICY 10 YEARS EXPERIENCE IN PERTH, AUSTRALIA. Emmerson Richardson Sinclair Knight Merz
 1 EXTRACTING MAXIMUM BENEFIT FROM PARKING POLICY 10 YEARS EXPERIENCE IN PERTH, AUSTRALIA Emmerson Richardson Sinclair Knight Merz 1. INTRODUCTION By the mid 1990 s, the Western Australian Government, most
WELLINGTON $422 MILLION $614 MILLION $83 MILLION 22% SPEND $1.9 BILLION
 WELLINGTON WELLINGTON $1.9 BILLION FORECAST TOTAL WELLINGTON INVESTMENT The Wellington region s transport challenges are dominated by the region s concentration of population in the metropolitan cities,
Badgery s Creek Airport Presention. Revised from NAN 2015 AGM
 Badgery s Creek Airport Presention Revised from NAN 2015 AGM Contents History Badgery s Creek Objectives Why is another airport required? Badgery s Creek Airport key facts, approval process and timeline
Whatwethoughtwouldkilus
 Whatwethoughtwouldkilus CaseStudy2:TheEvolutionofPerth spasengerrail June2011 Promoting &enabling change Research Report: What we thought would kill us Case Study 2: The Evolution of Perth s Passenger
Parkland County Municipal Development Plan Amendment Acheson Industrial Area Structure Plan
 Parkland County Municipal Development Plan Amendment Acheson Industrial Area Structure Plan New Plan Acheson Industrial Area Structure Plan Amendment Parkland County Municipal Development Plan Board Reference
PERTH CITY - GROWTH NEEDS FOR THE FUTURE PLOT RATIO AND BUILT FORM STUDY
 PERTH CITY - GROWTH NEEDS FOR THE FUTURE PLOT RATIO AND BUILT FORM STUDY PART A - BUSINESS AS USUAL EXECUTIVE SUMMARY ii This page has been left blank intentionally. 1 INTRODUCTION The City of Perth resolved
N4 Carrick-on-Shannon to Dromod Road Project. 2.1 Introduction
 Chapter 2 Need for the Scheme 2.1 Introduction The National Primary Route N4, Dublin to Sligo is a strategic corridor from Dublin to the northwest and border counties (See RCSR 101 in Volume 2). The National
Why the. Building for growth. West Metro. is vital
 Information summary West Building for growth World class public transport solutions for high demand challenges can transform the way a global city like Sydney lives, works and breathes. Sydney s busiest
THIRTEENTH AIR NAVIGATION CONFERENCE
 International Civil Aviation Organization AN-Conf/13-WP/22 14/6/18 WORKING PAPER THIRTEENTH AIR NAVIGATION CONFERENCE Agenda Item 1: Air navigation global strategy 1.4: Air navigation business cases Montréal,
PSP 75 Lancefield Road. Northern Jacksons Creek Crossing Supplementary Information
 PSP 75 Lancefield Road Northern Jacksons Creek Crossing Supplementary Information September 2017 The northern crossing of Jacksons Creek proposed within the Lancefield Road PSP is a key part of the ultimate
CURRENT SHORT-RANGE TRANSIT PLANNING PRACTICE. 1. SRTP -- Definition & Introduction 2. Measures and Standards
 CURRENT SHORT-RANGE TRANSIT PLANNING PRACTICE Outline 1. SRTP -- Definition & Introduction 2. Measures and Standards 3. Current Practice in SRTP & Critique 1 Public Transport Planning A. Long Range (>
November Creating liveable cities in Australia A scorecard and priority recommendations for Brisbane
 November 2018 Creating liveable cities in Australia A scorecard and priority recommendations for Brisbane What makes a liveable city? The term liveability is widely used in Australia and across the world,
AUSTRALIAN TRAVEL TIME METRIC 2017 EDITION
 AUSTRALIAN TRAVEL TIME METRIC 217 EDITION For more information please contact: Brendan Lyon Chief Executive Officer Infrastructure Partnerships Australia Suite 3.3, Level 3, 9 Pitt Street Sydney NSW 2
OUTLOOK STIRLING PRECINCT A CONTEXT ON BUSINESS, CULTURE, LIFESTYLE AND RESIDENTIAL
 OUTLOOK STIRLING PRECINCT A CONTEXT ON BUSINESS, CULTURE, LIFESTYLE AND RESIDENTIAL The Stirling Precinct is serviced by major public transport infrastructure whilst being walking distance to the city
COMMITTEE OF THE WHOLE (WORKING SESSION) APRIL 19, 2011 YORK REGION RAPID TRANSIT HIGHWAY 7 BUS RAPID TRANSIT- VMC STATION WARD 4.
 APRIL 19, 2011 YORK REGION RAPID TRANSIT HIGHWAY 7 BUS RAPID TRANSIT- VMC STATION WARD 4.") COMMITTEE OF THE WHOLE (WORKING SESSION) APRIL 19, 2011 YORK REGION RAPID TRANSIT HIGHWAY 7 BUS RAPID TRANSIT- VMC STATION WARD 4 Recommendation The Commissioner of Engineering and Public Works and the
COMMITTEE OF THE WHOLE (WORKING SESSION) APRIL 19, 2011 YORK REGION RAPID TRANSIT HIGHWAY 7 BUS RAPID TRANSIT- VMC STATION WARD 4 Recommendation The Commissioner of Engineering and Public Works and the
C. SYKIANAKI, President, Organization for Planning and Environmental Protection of Athens.
 ! GENERAL PRESENTATION OF THE ATHENS METROPOLITAN REGION (AMR) C. SYKIANAKI, President, Organization for Planning and Environmental Protection of Athens. Athens, July 2006 1 ! The capital city of Athens
Wellington $312 $49 $456 OVERVIEW WELLINGTON REGIONAL SUMMARY
 National Land Transport Programme 2015 18 Wellington WELLINGTON REGIONAL SUMMARY OVERVIEW The Wellington region is made up of a number of cities, urban areas and supporting rural hinterland. The city is
Infrastructure Priority List. Infrastructure Priority List Printed as at 28 April
 Infrastructure Priority List Infrastructure Priority List Printed as at 28 April 2018 1 High Priority Projects High Priority Projects are potential infrastructure solutions for which a full business case
Appraisal of Factors Influencing Public Transport Patronage in New Zealand
 Appraisal of Factors Influencing Public Transport Patronage in New Zealand Dr Judith Wang Research Fellow in Transport Economics The Energy Centre The University of Auckland Business School, New Zealand
South Australia Transport Infrastructure Summit Adelaide May 2009
 TOWARDS 2020: RAA s vision for metropolitan adelaide Sharon Hanlon General Manager Public Affairs Royal Automobile Association (RAA) of South Australia Inc INTRODUCTION The Royal Automobile Association
WHY INVEST IN QUEENSLAND URBIS MARKET OUTLOOK
 WHY INVEST IN QUEENSLAND URBIS MARKET OUTLOOK WHO IS URBIS? PERTH AUSTRALIA ADELAIDE BRISBANE GOLD COAST SYDNEY MELBOURNE Urbis is an integrated multi-disciplinary consulting firm with a unique and comprehensive
Lansdowne Wetton BRT Public Transport Corridor Trunk Route: Planning Analysis
 Lansdowne Wetton BRT Public Transport Corridor Trunk Route: Planning Analysis 1. Introduction The purpose of this report is to detail the planning evaluation for the trunk route alignment alternatives
Managed Lanes, Transit Access, and Economic Development: Implementing the Region s First Highway BRT Corridor
 Managed Lanes, Transit Access, and Economic Development: Implementing the Region s First Highway BRT Corridor Tim Burkhardt, AICP William Reynolds, AICP, PTP Matt Horton Who we are/astrological signs Tim
OBJECTION TO AMENDMENT TO PLANNING SCHEME AND GRANTING OF PLANNING PERMIT
 PLANNING AND ENVIRONMENT ACT 1987 OBJECTION TO AMENDMENT TO PLANNING SCHEME AND GRANTING OF PLANNING PERMIT AMENDMENT C32 APPLICATION 0873/02 Public Transport Users Association Inc. 247-249 Flinders Lane
Peer Performance Measurement February 2019 Prepared by the Division of Planning & Market Development
 2017 Regional Peer Review Peer Performance Measurement February 2019 Prepared by the Division of Planning & Market Development CONTENTS EXECUTIVE SUMMARY... 3 SNAPSHOT... 5 PEER SELECTION... 6 NOTES/METHODOLOGY...
NSW PRE-BUDGET STATEMENT FUTURE ECONOMY FUTURE JOBS
 2017-18 NSW PRE-BUDGET STATEMENT FUTURE ECONOMY FUTURE JOBS Executive Summary The 2017-18 NSW State Budget presents an opportunity for the NSW Government to future-proof the tourism and transport sectors.
[REGIONAL LAND TRANSPORT PROGRAM AND REGIONAL FUEL TAX SUBMISSION ]
![[REGIONAL LAND TRANSPORT PROGRAM AND REGIONAL FUEL TAX SUBMISSION ]](/thumbs/89/99007492.jpg "[REGIONAL LAND TRANSPORT PROGRAM AND REGIONAL FUEL TAX SUBMISSION ]") 2018 Ben Ross Talking Southern Auckland Picture 1: Manukau Bus Station with MIT and rail station in the background [REGIONAL LAND TRANSPORT PROGRAM AND REGIONAL FUEL TAX SUBMISSION ] Submission to the
2018 Ben Ross Talking Southern Auckland Picture 1: Manukau Bus Station with MIT and rail station in the background [REGIONAL LAND TRANSPORT PROGRAM AND REGIONAL FUEL TAX SUBMISSION ] Submission to the
Auckland City Centre: Transport Capacity and Access Trends
 Auckland City Centre: Transport Capacity and Access Trends Final Report Prepared for: Auckland Council Date: 8 August 2018 Version: Final QUALITY ASSURANCE REGISTER Issue Description Prepared by Reviewed
Plugging the greater Midlands region into global wealth
 Plugging the greater Midlands region into global wealth A great airport for a great city Birmingham Airport will be at the centre of a network of great airports delivering aviation capacity and connectivity
ALL ABOARD LABOR S LONG TERM PASSENGER TRANSPORT STRATEGY
 ALL ABOARD LABOR S LONG TERM PASSENGER TRANSPORT STRATEGY Revitalising Passenger Transport Increasing traffic congestion in our cities and a lack of transport services in our regional towns is frustrating
MARKET OUTLOOK. 01 Walkability & Accessibility 02 Infrastructure & Employment 03 Demographics 04 Residential Analysis 06 Rental Analysis
 MARKET OUTLOOK EAST LEPPINGTON Located within the rapidly expanding South West Growth Centre of Sydney, the East Leppington Precinct is well positioned to benefit from the region s strong infrastructure
SYDNEY S GROWTH ENGINES: DRIVING SYDNEY S ROAD NETWORK NEEDS
 SYDNEY S GROWTH ENGINES: DRIVING SYDNEY S ROAD NETWORK NEEDS John Brewer, General Manager Strategic Network Planning, RTA of NSW Natalie Camilleri, Manager Network and Corridor Planning, RTA of NSW ABSTRACT:
TransAction Overview. Introduction. Vision. NVTA Jurisdictions
 Introduction Vision NVTA Jurisdictions In the 21 st century, Northern Virginia will develop and sustain a multimodal transportation system that enhances quality of life and supports economic growth. Investments
Development of SH119 BRT Route Pattern Alternatives for Tier 2 - Service Level and BRT Route Pattern Alternatives
 Development of SH119 BRT Route Pattern Alternatives for Tier 2 - Service Level and BRT Route Pattern Alternatives June 1, 2018 Development of SH119 BRT Route Pattern Alternatives for Tier 2 - Service Level
Melbourne Public Transport Needs vs Promises
 Melbourne Public Transport Needs vs Promises Institution of Transportation Engineers Thursday 21st August 2014 4:30 6:00 pm Jacobs Theatrette 452 Flinders St Melbourne Professor Graham Currie Institute
Chapter 3. Burke & Company
 Chapter 3 Burke & Company 3. WRTA RIDERSHIP AND RIDERSHIP TRENDS 3.1 Service Overview The Worcester Regional Transit Authority (WRTA) provides transit service to over half a million people. The service
Co-ordinated and Orderly Growth A Suite of Infrastructure and Public Assets for the Future... 1
 Co-ordinated and Orderly Growth... 1 A Suite of Infrastructure and Public Assets for the Future... 1 Funding Sources, Revenues and Prioritising Expenditure... 2 Stage 1 Short Term Growth Sunbury to 50,000...
DATE 23 February, Integrated Transport Strategy. Halls Creek. For Stockland
 Halls Creek For Stockland DATE 23 February, 2015 CONTACT STEVE WILLIAMS EXECUTIVE SUMMARY The Halls Creek Identified Growth Area (IGA) has been identified within the South East Queensland Regional Plan
EL PASO COUNTY REGIONAL TRANSIT INSTITUTIONAL OPTIONS ASSESSMENT STUDY
 EL PASO COUNTY REGIONAL TRANSIT INSTITUTIONAL OPTIONS ASSESSMENT STUDY Sponsored by: El Paso County Funding Support: Texas Department of Transportation Technical Assistance to the County: Texas A&M Transportation
Draft Greater Sydney Region Plan
 Powered by TCPDF (www.tcpdf.org) Draft Greater Sydney Region Plan Submission_id: 31119 Date of Lodgment: 12 Dec 2017 Origin of Submission: Online Organisation name: Serapark Pty Ltd Organisation type:
Regional Town Centre and Employment Land Assessment
 Regional Town Centre and Employment Land Assessment PSP 1067 Donnybrook PSP 1096 Woodstock PSP 25.2 English Street Prepared for Metropolitan Planning Authority by Essential Economics Pty Ltd J u n e 2
Presentation to Planning Panel
 Presentation to Planning Panel Amendment C207 & C208 to the Hume Planning Scheme Lancefield Road PSP & Sunbury South PSP August 2017 1 Historical Planning Context Sunbury has long been identified as a
Draft Greater Sydney Region Plan
 Powered by TCPDF (www.tcpdf.org) Draft Greater Sydney Region Plan Submission_id: 31382 Date of Lodgment: 14 Dec 2017 Origin of Submission: Online Organisation name: Greenfields Development Company & Ingham
New free City connector bus service
 The Adelaide City Council invites engagement from the community about New free City connector bus service 99C City Loop and Adelaide Connector free bus services to merge: Project Summary Adelaide City
Northern Beaches Transport Action Plan
 Northern Beaches Transport Action Plan The NSW Government is taking action now to deliver transport improvements for the Northern Beaches, as well as planning for the future growth of the area. $633 million
TERMINAL DEVELOPMENT PLAN
 5.0 TERMINAL DEVELOPMENT PLAN 5.0 TERMINAL DEVELOPMENT PLAN Key points The development plan in the Master Plan includes the expansion of terminal infrastructure, creating integrated terminals for international,
Lessons Learned from Rebuilding the Muni Subway Schedule Leslie Bienenfeld
 Lessons Learned from Rebuilding the Muni Subway Schedule Leslie Bienenfeld Manager of Fixed Guideway Scheduling San Francisco Municipal Transportation Agency San Francisco, California SFMTA & the Municipal
NOW LEASING FOOD AND BEVERAGE OPPORTUNITIES
 NOW LEASING FOOD AND BEVERAGE OPPORTUNITIES Right in the heart of Perth s CBD, Yagan Square will be one of the city s most popular meeting and celebration places and a major tourist destination. At just
Auckland Port and the Unitary Plan Dr Douglas Fairgray
 Auckland Port and the Unitary Plan Dr Douglas Fairgray Source: Auckland 1886 - Sir George Grey Special Collections, Auckland Libraries, NZ Map 374 Scope The interface between the Unitary Plan and the Port
SYDNEY S SECOND AIRPORT
 COLLIERS RADAR SYDNEY S SECOND AIRPORT The Catalytic Effect of Transport Infrastructure By Sass J-Baleh Manager Research sass.jbaleh@colliers.com Summary Industrial land values across the Sydney markets
North District Plan OVERVIEW
 OUR GREATER SYDNEY 2056 Revised Draft North District Plan OVERVIEW Hornsby Hunter's Hill Ku-ring-gai Lane Cove Mosman Northern Beaches North Sydney Ryde Willoughby Snapshot of the North District today
HOW TO IMPROVE HIGH-FREQUENCY BUS SERVICE RELIABILITY THROUGH SCHEDULING
 HOW TO IMPROVE HIGH-FREQUENCY BUS SERVICE RELIABILITY THROUGH SCHEDULING Ms. Grace Fattouche Abstract This paper outlines a scheduling process for improving high-frequency bus service reliability based
General Issues Committee Item Transit Operating Budget Ten Year Local Transit Strategy
 General Issues Committee Item 4.1 2017 Transit Operating Budget Ten Year Local Transit Strategy January 27, 2017 Presentation Outline 2017 Operating Budget Overview Ten Year Local Transit Strategy 2 2017
Draft Greater Sydney Region Plan
 Draft Greater Sydney Region Plan Submission_id: 31392 Date of Lodgment: 14 Dec 2017 Origin of Submission: Online Organisation name: Greenfields Development Company No. 2 Pty Limited Organisation type:
Review of Government Secondary School Requirements within the Sunbury South Precinct Structure Plan
 Review of Government Secondary School Requirements within the Sunbury South Precinct Structure Plan Expert Witness Statement August 11 th, 2017 Prepared by Robert Panozzo Director, ASR Research Pty Ltd
TWENTY-SECOND MEETING OF THE ASIA/PACIFIC AIR NAVIGATION PLANNING AND IMPLEMENTATION REGIONAL GROUP (APANPIRG/22)
") INTERNATIONAL CIVIL AVIATION ORGANIZATION TWENTY-SECOND MEETING OF THE ASIA/PACIFIC AIR NAVIGATION PLANNING AND IMPLEMENTATION REGIONAL GROUP (APANPIRG/22) Bangkok, Thailand, 5-9 September 2011 Agenda
INTERNATIONAL CIVIL AVIATION ORGANIZATION TWENTY-SECOND MEETING OF THE ASIA/PACIFIC AIR NAVIGATION PLANNING AND IMPLEMENTATION REGIONAL GROUP (APANPIRG/22) Bangkok, Thailand, 5-9 September 2011 Agenda
FEDERATION SQUARE MELBOURNE, AUSTRALIA CORPORATE PLAN
 FEDERATION SQUARE MELBOURNE, AUSTRALIA CORPORATE PLAN 201619 MELBOURNE S INSPIRATIONAL PUBLIC PLACE Federation Square is Melbourne s heartbeat, an inspirational precinct which concentrates community, cultural
URBAN CONSOLIDATION VS URBAN SPRAWL IN SYDNEY. THE DEBATE RAGES ON
 URBAN CONSOLIDATION VS URBAN SPRAWL IN SYDNEY. THE DEBATE RAGES ON Tim Brooker (Senior Transport Planner, Arup Sydney) Megan Gee (Graduate Environmental Engineer, Arup Sydney) ABSTRACT The challenge of
Tram Passenger Survey
 Key findings Autumn 2015 Foreword Jeff Halliwell Now in its third year, our Tram Passenger Survey has covered passengers views of their journey in six network areas in Britain. For the second time this
Paul Fletcher Minister for Urban Infrastructure and Cities Launch of Infrastructure Australia Future Cities Paper. Fri 23 February 2018
 Paul Fletcher Minister for Urban Infrastructure and Cities Launch of Infrastructure Australia Future Cities Paper Fri 23 February 2018 Introduction I am pleased to have the opportunity to speak at the
MODAIR: Measure and development of intermodality at AIRport. INO WORKSHOP EEC, December 6 h 2005
 MODAIR: Measure and development of intermodality at AIRport INO WORKSHOP EEC, December 6 h 2005 What is intermodality? The use of different and coordinated modes of transports for one trip High Speed train
Presentation to The HK Institute of Certified Public Accountants. New Railways to Sustain Hong Kong s Momentum
 Presentation to The HK Institute of Certified Public Accountants New Railways to Sustain Hong Kong s Momentum Stephen Chik Head of Project Engineering 26 February 2014 MTR Corporation 28/02/2014 Page 1
LA Metro Rapid - Considerations in Identifying BRT Corridors. Martha Butler LACMTA, Transportation Planning Manager Los Angeles, California
 LA Metro Rapid - Considerations in Identifying BRT Corridors Martha Butler LACMTA, Transportation Planning Manager Los Angeles, California LA Metro Transportation planner/coordinator, designer, builder
TfL Planning. 1. Question 1
 TfL Planning TfL response to questions from Zac Goldsmith MP, Chair of the All Party Parliamentary Group on Heathrow and the Wider Economy Heathrow airport expansion proposal - surface access February
Appendix B Ultimate Airport Capacity and Delay Simulation Modeling Analysis
 Appendix B ULTIMATE AIRPORT CAPACITY & DELAY SIMULATION MODELING ANALYSIS B TABLE OF CONTENTS EXHIBITS TABLES B.1 Introduction... 1 B.2 Simulation Modeling Assumption and Methodology... 4 B.2.1 Runway
Brisbane Population Update
 April 28, 2016 Brisbane Population Update When it comes to property, population is important. From a high-level perspective, it is a key market driver. Macquarie Bank sees it as the key driver of housing
Mega Projects in Transport and Development: Background in Australian Case Studies
 Mega Projects in Transport and Development: Background in Australian Case Studies Perth Urban Railway Imran Muhammad, Nicholas Low &. Leigh Glover August 2006 Australasian Centre for the Governance and
Fixed-Route Operational and Financial Review
 Chapter II CHAPTER II Fixed-Route Operational and Financial Review Chapter II presents an overview of route operations and financial information for KeyLine Transit. This information will be used to develop
SUBMISSION ON PERTH TRANSPORT PLAN FOR 3.5 MILLION
 SUBMISSION ON PERTH TRANSPORT PLAN FOR 3.5 MILLION PREPARED : THE SOUTH WEST GROUP OCTOBER 2016 EXECUTIVE SUMMARY The draft Perth Transport Plan (PTP) for 3.5 Million presents a strategic blueprint for
Figure 1.1 St. John s Location. 2.0 Overview/Structure
 St. John s Region 1.0 Introduction Newfoundland and Labrador s most dominant service centre, St. John s (population = 100,645) is also the province s capital and largest community (Government of Newfoundland