Adding on Amenities, Broadening the Base
|
|
|
- Moris Miller
- 5 years ago
- Views:
Transcription
1 Adding on Amenities, Broadening the Base 2014 Year-in-Review of Intercity Bus Service in the United States EMBARGOED UNTIL 1/12/15 DRAFT COPY SUBJECT TO CHANGE Chaddick Institute for Metropolitan Development January 13, 2015 Joseph P. Schwieterman 1, Brian Antolin 2, Marisa Schulz 3, Gary Scott 2, and Martin Sellers 2 jschwiet@depaul.edu 312/ office 1 Director, Chaddick Institute and Professor, School of Public Service 2 Research Associate 3 Assistant Director, Chaddick Institute
2 Executive Summary Intercity bus service providers added more than 100 new daily services across the United States in 2014, resulting in a 2.1% increase in daily scheduled operations. While bus service grew, Amtrak train-miles held constant, and the number of airline flights diminished by 3.5%. A flurry of initiatives to introduce new amenities catering to business travelers and luxuryoriented pleasure travelers are broadening the sector s appeal. New premium services on Red Coach, Royal Sprinter, and Vonlane point to an accelerating trend to make these features focal points of investment. Megabus introduced reserved seating, added extensive new service in Florida, and continues to move aggressively towards building a national network of interconnected hubs that cater to both short- and longer-distance trips. Carriers are increasingly selling flexibility to allow passengers to change their departure times at only a modest expense in sharp contrast to the restrictive (and costly) airline policies. Bus travel-booking websites, most notably Wanderu and Busbud, are encouraging reluctant bus travelers to try this mode of transportation. These websites offer a convenient means of comparison-shopping, much as Expedia, Orbitz, and Travelocity do for air travel. 1
3 Introduction Intercity bus service providers are attracting an ever-widening range of passengers through the introduction of sought-after amenities and services. With power outlets and free Wi-Fi now standard on most routes, attention is turning to reserved seating, online tools that give travelers maximum flexibility including features allowing changes to reservations and apps that allow travelers to comparison shop and stay informed about the status of their bus. On a growing number of routes, firstclass services featuring entertainment systems, onboard refreshments, and even passenger attendants are now available. As a result, bus travel is gaining loyalty among passengers who place a premium on comfort and convenience. Increasingly, business travelers who have tended to shy away from bus service in the past are now jumping onboard. In the midst of another wave of expansion, the intercity bus retains its status as America s fastestgrowing intercity travel mode. This Chaddick Institute report, the seventh in an annual series, summarizes changes to the sector during the 2014 calendar year: Part A reviews the expansion of the intercity network during the 2014 calendar year. Part B focuses on notable amenities and new luxury offerings. Part C summarizes new routes added to the network. A. Industry Growth in 2014 America s intercity bus network expanded at a steady pace in Both conventional bus lines (such as Greyhound, Peter Pan, and Trailways), as well as city-to-city express operators (such as BestBus, BoltBus and Megabus.com (Megabus), expanded the scale of their operations. The details of this expansion can be found in our Intercity Bus Database. This resource, maintained by the Chaddick Institute for Metropolitan Development at DePaul University, encompasses all known scheduled bus lines (presently 108 operators) that meet a fairly broad set of criteria. These carriers are divided into conventional carriers (a category that includes all of Greyhound, Trailways, and Peter Pan) and city-to-city express (a category consisting of express-oriented carriers operating from downtown districts operators sometimes referred to as Corporate Curbside Carriers). 1 As in previous years, the dataset does not include airport-shuttle operators, Chinatown bus operators, and public transitoriented service. For further details and a list of carriers, please refer to the report s Data Supplement, available by ing chaddick@depaul.edu. The following conclusions about the 2014 calendar year warrant particular attention: 1): The expansion of city-to-city express carriers and conventional bus lines added 80 new daily services across the United States, resulting in a 2.1% increase in daily scheduled operations. City-tocity bus express carriers have nearly doubled their service offerings since the start of the decade and now account for about 1,066 daily operations. America s intercity bus system grew from 4,309 to 4,399 daily operations in 2014, representing a 2.1% increase over the course of the year. (Daily operations, sometime called daily schedules, are akin to 2
4 flights in air travel). The growth included targeted expansion by a wide range of carriers, and marks the sector s eighth straight year of expansion. Notably, after a year in which conventional bus lines kept their services virtually flat, leaving the growth to city-to-city express operators (which grew by 4% in 2013), both sectors are again on an upward trajectory. The number of operations by city-to-city express carriers has almost doubled since the start of the decade, rising from approximately 589 in 2010 to 1,066 in 2014 (Figure 1). The number of daily trips was up 3.9% in 2014 vs. 2013, with BoltBus and Megabus accounting for nearly 80% of these operations. These figures do not include the significant number of extra sections regularly operated to meet demand Figure 1 Total Daily Discount City-to-City Bus Operations ,026 1, KEY INITIATIVES OF CARRIERS: Greyhound mostly held firm in 2014, but with 1,080 daily buses (down 28 from 2013), it continues to have nearly twice as many daily departures as any other carrier, even without the inclusion of other operators owned by its parent company, FirstGroup (including Greyhound s BoltBus and Yo! Bus divisions) (Figure 2). Greyhound continued to expand its Greyhound Express network, which offers faster schedules, Wi-Fi, and guaranteed seating, in the Southwest. Moreover, Greyhound continued to make Wi-Fi and power outlets standard amenities throughout its entire system and adopted a sophisticated yield management system for all its services. This carrier also continues to be more aggressive in managing the number of reservations allowed for each bus departure. Although it still does not explicitly guarantee a seat to everyone with a ticket (except on its Express offerings), the operator is moving in this direction. Greyhound s competition intensified as its two largest U.S. competitors, Coach USA and Megabus (both owned by Stagecoach, Inc.) recorded significant growth. Megabus grew from 594 to 616 daily operations. Its expansion focused heavily on new routes to and from Florida as well as in New England. Separately branded Coach USA services to/from points in New York State grew from 330 to 356. BoltBus grew at only a modest rate, expanding its schedule from 200 to 204 daily departures. The carrier has apparently chosen to let the market catch up to its robust expansion in 2013, which ushered 3
5 in new California and Nevada services. Among the largest eight carriers, only Martz Trailways did not experience growth its operations remained constant at 122. Expansion by other carriers added to the density of service in the Northeast. As witnessed in the past two years, Yo! Bus, a Greyhound subsidiary, is elbowing its way into crowded Northeastern markets (see page 9). DC2NY, a prominent city-to-city express operator, rebranded BestBus, is now a major player on the New York - Washington, D.C./Northern Virginia route. The year also saw Academy Bus buy GO Buses (formerly World Wide Bus), a major player in the Boston - New York market, giving the parent company a broad platform for expansion. Section C, Notable New Intercity Bus Services in 2014, further details how carriers expanded routes and improved quality of service to underserved regions Figure 2 Largest Intercity Bus Operators Scheduled Daily Trips ) The number of schedule options available to bus travelers continues to grow faster than options offered by other modes of travel, creating a powerful dynamic to expand market share. While bus service grew, Amtrak train-miles held constant, and the number of airline flights diminished by 3.5%. The increasing number of schedules made available to travelers is spurring a growing ridership on intercity buses. As previously noted, the number of bus operations (schedules) expanded 2.1% in The number of Amtrak train operations, measured in train-miles, grew by just 0.6%, between October 2014, the most recent month available, and the same month in The number of domestic airline flights fell by 3.5% over the first nine months of calendar year the most recent data available (Figure 3). Although the number of airline seat miles rose by 1.2%, reflecting moves by airlines to fly 4
6 Figure 3 Change in Daily Schedules Operated % 2% 1% 0% -1% -2% -3% -4% 2.1% 0.6% [Ty Intercity Bus Amtrak Airlines -3.5% Measures: Intercity bus: change in operations (schedules), beginning of 2014 vs. beginning of 2014; Amtrak: change in total trains miles, Oct vs. Oct (the most recent month available), Airlines: change in total domestic departures, Jan. Sept., 2013 vs. Jan. Sept., Source: (See Endnote 4 for details) larger planes while offering fewer daily flights, the number of departure operations fell by its fastest rate in several years. As in previous years, ridership data is not available to assess changes in the number of people traveling by bus in Greyhound, as well as other major bus lines, no longer reports such data. It is notable, however, that Megabus reported in October 2014 a 13.5% increase in ridership over the previous year. 3 Considering the growth in schedules in past years, as well as revenue growth reported by major bus lines, ridership can conservatively be estimated to have grown in the range of %. This suggests that the number of travelers on intercity buses increased at a faster rate than on airlines, which grew by 2.3%, or via Amtrak, which grew by 0.2%. 4 The Intercity Bus Database also allows for reasonable approximations of the number of annual bus riders. Given the scale of bus operations in the database (which, as previously noted, excludes many operators, including Chinatown, casino, and many Latino-oriented operators), we believe the number is around million. Other estimates, which use different measurements and include carriers we omit, place the number much higher. 5 5
7 B. New Amenities & Luxury Offerings This year brought a flurry of initiatives to introduce new amenities appealing to business travelers and luxury-oriented pleasure travelers. 1) New Red Coach, Royal Sprinter, and Vonlane service, in addition to reserved seating on Megabus, point to an accelerating trend to make amenities focal points of bus-industry investment. The industry is placing a great deal of emphasis on enhancing onboard services. As reported by Amy Zipkin of the New York Times, new amenities and first-class offerings are attracting more and more business travelers to the bus. 6 This trend is also attributable to a perceived decline in the air travel experience for many riders. Several developments made 2014 a defining year for amenities: VONLANE: A new operator, Vonlane, launched a first-class ground travel alternative to flying between Austin and Dallas, TX and announced expansion to Houston. Compared to traditional operators servicing the same route, Vonlane features only 16 seats, Wi-Fi and outlets, and an on-board attendant serving snacks and drinks. This service targets the cohort of business travelers commuting between the two cities each day that currently either drives or flies on airlines such as Southwest. The custom-built coaches also feature a private six-seat boardroom with a table in the back. Instead of operating from bus terminals or downtown curbside locations, Vonlane partners with hotels in each metropolitan area and operates up to four trips in each direction, depending on the day of the week. Vonlane charges around $100 per one-way trip and recently announced its Dallas - Houston service starting this March. Indicative of the carrier s desire to win the loyalties of travelers who would otherwise fly, or are willing to ride coaches to make connections to long-haul flights, the carrier operates from the Hyatt Hotel at Dallas Love Field, where patrons have access to a free airport shuttle. ROYAL SPRINTER: Royal Sprinter began offering an intimate, luxury travel experience in the Northeast. Successful DCbased restaurateur Andy Seligman entered the crowded New York - Washington, D.C., travel corridor with the launch of Royal Sprinter in March. The concept of a higher level of bus service is not new to the Northeast, as the service model currently exists in several forms with LimoLiner in Boston, Vamoose Gold in the Washington, D.C. area, and C&J and Dartmouth Coach in New England. What differentiates Royal Sprinter is its focus on personalization, as its vehicles offer a first-class service with only eight seats on board (using coaches somewhat smaller than is the norm) and direct service to and from hotels in each city. The carrier features a leather seat that reclines more than the standard, satellite TV that accesses pay movie and sports channels, as well as snacks and drinks. The company currently operates two schedules in each direction every day. MEGABUS: In May, Megabus began offering reserved seats on select schedules on the New York - Baltimore/Washington, D.C., New York - Philadelphia, New York - Boston, and Philadelphia - 6
8 Baltimore/Washington, D.C. routes. The carrier expanded the program to select routes from California, Chicago and Texas and presently offers reserved seating in 58 North American cities. A total of 10 seats on each bus can generally be reserved ahead of time. 7 This new offering allows passengers to select prime seats aboard double-decker buses for an additional fee. Reserved seating at a table gives work-oriented passengers that travel in groups the opportunity to conduct business meetings during their trip. The additional costs range from $1 to $9, a small fraction of the cost of reserving prime seats on airlines that charge for this service. REDCOACH: Red Coach expanded its first-class offerings in Florida, with the introduction of Orlando-Jacksonville- Tallahassee service. Red Coach has been a pioneer in the provision of spacious and luxury-oriented bus services in Florida. The carrier operates three different types of buses, each specializing in a different class of service and operating principally from Miami to major cities in central Florida. The new service, launched in September, is aimed at business and collegiate travelers and provided with a first-class bus. Originally located near the airport, Red Coach relocated its Jacksonville stop shortly after its launch to a more centrally located area in the coastal city. 2) Carriers are increasingly selling flexibility to allow passengers to change their departure times at only a modest expense. This is in sharp contrast to the restrictive (and costly) policies of airlines. Bus companies have made notable advances to their websites in order to facilitate changes to reservations. Numerous bus companies now have online tools that allow travelers to make such changes up to 24 hours before a departure for a modest transaction fee, plus any difference in fare. BestBus, Megabus, and Vamoose allow customers to make changes online for $10 or less. BoltBus allows changes for a $4.50 fee (plus any difference in fare) made via phone. Greyhound and Peter Pan allow changes for a $20 fee, if paid in cash at a bus station. Red Coach allows changes free of charge except for of trips involving its lowest-priced nonrefundable fares. These arrangements exemplify the trend, particularly among city-to-city express carriers, to offer consumers greater flexibility. These policies are far more generous than those consumers face when booking on the country s three largest network airlines: American, Delta, and United, which each impose a $200 fee for changes. Smaller airlines generally charge fees of $50 - $100. Southwest is an exception by allowing changes at no cost. Even so, travelers on Southwest or other airlines making changes within 7 days of their new desired departure time generally must buy unrestricted full-coach fares, which are typically $100 - $250 higher than discounted advance-purchase fares. This makes changes a few days before departure quite punitive for most travelers. Amtrak s policies are similar to those of bus lines. In March, however, the carriers began imposing a 10% penalty on changes and cancellations on certain fares within a day of departure. 3) This year brought large investments in travel-booking aggregator websites, most notably Wanderu and Busbud, which encourage travelers who have been reluctant in the past to travel by bus to try the mode. These carriers offer a convenient means of comparison shopping, allowing for searches much in the same way that Expedia, Orbitz, and Travelocity do for air travel. Major expansions to both websites lay the groundwork for further enhancements in 2015, as they 7
9 continue to help expand the market by giving travelers options they do not have on the sites of individual carriers or other travel tools. Travelers can conduct searches involving many carriers to find their best option. Wanderu reports the majority of its consumer search for departure/arrival times more than any other methods. Many of their consumers, however, search for amenities, with Wi-Fi being the most popular filter, followed by power outlets, and extra legroom. WANDERU: The first to develop a truly comprehensive bus-travel website, Wanderu has expanded its coverage to over 80% of the U.S. Wanderu now has partnerships with major brands including BoltBus, Megabus, and Greyhound, with the latter announcing a partnership with the company in March. Under an initial agreement, Wanderu will feature select city pairs within Greyhound s national network. This partnership provides greater access to travelers to find the best option for their travel needs by comparing other carriers to Greyhound and Greyhound Express services. Wanderu offers passengers schedule choices that involve routings on several carriers and thus generates travel options that do not exist on individual-carrier websites. According to the company, around 9% of tickets sold are part of a routed trip that involves travel on more than one carrier. Around 10% of buyers use the station locator & point to point search tool, which allows users to find where the closest bus station is located a tool particular valuable to buyers who are outside of major cities and would normally not be able to find a trip on a carrier's website. 8 Wanderu experienced exponential growth in The number of segments sold increased from around 3,000 in 2013 to 23,000 last year, with total sales now exceeding $20 million/year. 9 The website has served more than 4 million visitors since its creation several years ago. BUSBUD: In December, Busbud jumped into the U.S. market by announcing its own formal partnership with Greyhound allowing consumers to search and book tickets on their site and mobile apps. Busbud is the only bus-travel-booking website to operate on a worldwide scale, offering more than one million departures each week across around 1,500 bus operators in 89 countries. Busbud is standardizing both the data behind and the user experience of buying bus tickets online. The site displays bus travel information in 11 languages and 21 currencies, attracting international users and global travelers. GREYHOUND & BOLTBUS: This year also brought mobile ticketing for Greyhound with the release of apps for both BoltBus and Greyhound Lines, Inc. These new tools, available on both Apple and Android platforms, allow passengers to search for and reserve tickets. They also provide an easier way for passengers to check their status in the rewards programs of both companies. BoltBus released its app in March 2014, while Greyhound released its version in October Megabus.com has offered a mobile ticket sales service on Apple and Android handheld devices since July
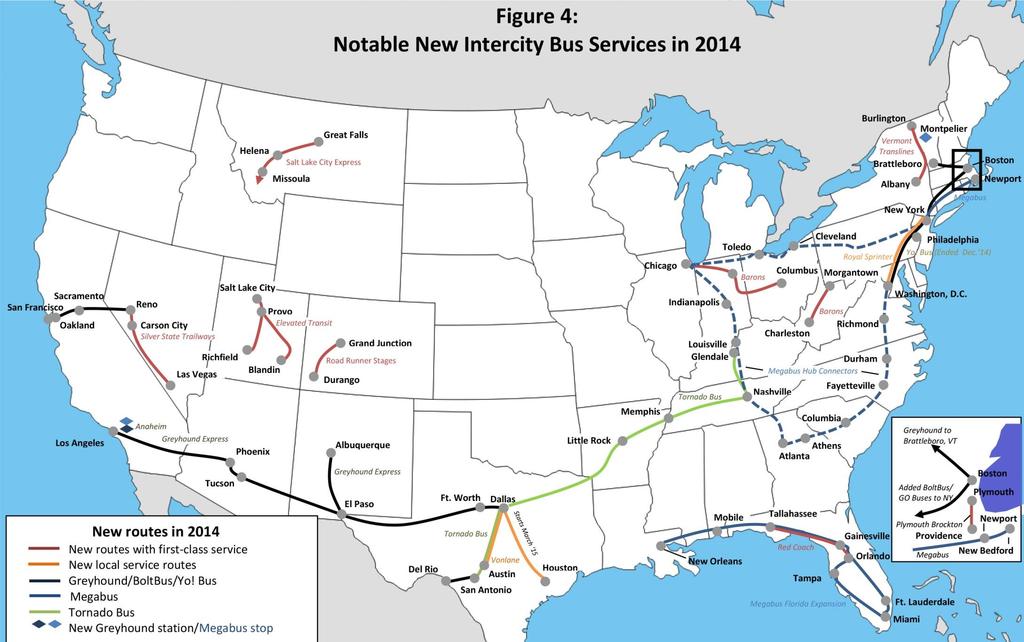
10 C. Notable New Intercity Bus Services & Expansions Carriers made many notable moves in 2014 to strengthen their route networks and improve the quality of service to underserved regions. In addition to luxury services summarized in the previous section, the initiatives taken in 2014 stand out. 1) Greyhound was on the move, particularly in the Southwest. The company added Greyhound Express service on three routes from El Paso, TX, linking this growing city to i) Albuquerque, ii) Ft. Worth - Dallas, and iii) Phoenix - Los Angeles. To improve its service in the border area, Greyhound launched twice-daily San Antonio - Del Rio, TX service. The company also introduced Greyhound Express service to the busy San Francisco - Sacramento - Oakland corridor. In the East, bi-weekly Greyhound service between Boston and Brattleboro, VT became available. A Massachusetts program that assists regional operators funds this service. Greyhound purchased a new motor coach for this service, which operates one scheduled service in each direction on Fridays and Sundays. The route also operates via Nashua and Keene, NH. 11 Greyhound also expanded, but then reduced, Yo! Bus, a brand marketed toward passengers who use Chinatown-based services. Yo! Bus tickets are sold on GotoBus, an online aggregator of Chinatownbased and curbside intercity bus carriers, not on the main Greyhound site. In July, Greyhound launched New York - Washington, D.C. service, complementing its existing Boston - Philadelphia routes. The buses ran between a curbside location in Chinatown on Manhattan Island, but on a limited schedule, with four schedules in each direction on Fridays and Sundays only. On December 19, however, Greyhound not only discontinued this route, but also scaled back frequency on other routes. 9
11 10
12 2) Megabus continues to move aggressively toward building a national network of interconnected hubs that cater to short- and middle-distance travel segments, as well as longer-distance trips. New overnight runs linking major hubs give it the ability to handle long-haul traffic in a manner similar to Greyhound. Three moves by Megabus in 2014 are particularly notable: Expanded Florida Services: Megabus expanded its network in May with the opening of a new hub in Orlando. The service features new Orlando - Tampa, Orlando - Miami, and Orlando - Tallahassee - New Orleans service, as well as a direct link between Miami and Tampa. These new services complement existing routes that operate into the Sunshine State from Atlanta, which began several years ago. Megabus s Florida service now operates at the daily frequencies that appear in Figure 5. The twice-daily New Orleans service connects this network to destinations in the Gulf Coast and Texas. Megabus began stopping in Fort Lauderdale on selected schedules in August. Figure 5 Megabus Service to and from Florida Typical frequency in each direction 11
13 12
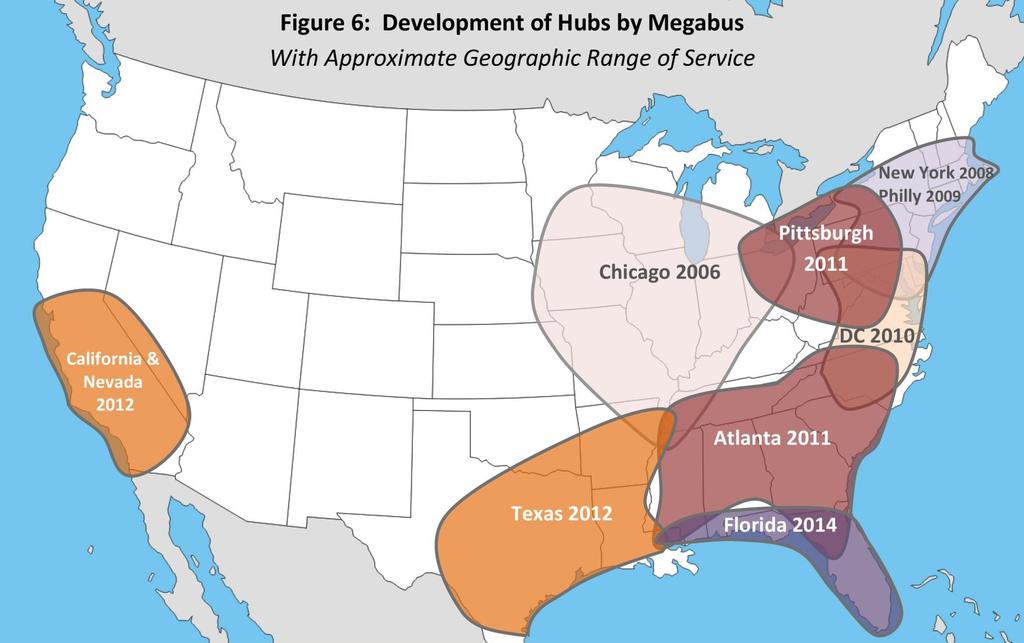
14 New long distance routes between hubs: In June, Megabus began an overnight Chicago - New York service, the longest route by distance operated without a timed transfer. The route, which includes one scheduled service in each direction daily, operates via State College, PA, and Cleveland and Toledo, OH. With a single change of buses, a passenger can now travel from New York to Des Moines, Minneapolis, and many other the points west of Chicago. Previously, these passengers had to transfer twice in order to get to Chicago. Megabus also began two new Atlanta - Washington, D.C., routes. The first, via Athens, GA; Columbia, SC; Fayetteville, NC; and Richmond, VA began with daily schedules in each direction in February. In July, another route, via Athens; Charlotte, NC; Durham, NC; and Richmond, VA commenced, effectively combining a pair of routes that previously terminated in Charlotte. Nevertheless, tickets are not sold from end-to-end points on these buses in order to encourage travel on a third route linking Atlanta and the nation s capital via Charlottesville, WV and Knoxville, TN. The cumulative effects of Megabus s expansion can be seen in Figure 6, which shows the dates and approximate geographic range of its hub additions from 2006 to These hubs now make the company s buses a prominent part of the transportation landscape in the eastern part of the country. In the western regions, however, it still has significant opportunities to expand into virgin territories. Megabus will likely eye expansion to major cities in the Southwest, such as Albuquerque, Phoenix, and Tucson, which it served briefly in 2007, and the Pacific Northwest, a BoltBus stronghold. Although distances between major cities are much higher in the Rocky Mountain states, making its normal business model more tenuous in this area, it appears likely that Megabus will consider at least limited expansion into this area. Expansion in New England: Megabus is on a steady growth trajectory in mid-sized New England communities. The carrier launched new express services for New York City - Newport, RI and New Bedford - Fair Haven, MA in July. These services are provided through a partnership agreement with Dattco Coach & Tour. 12 One to three schedules operate in each direction on Fridays and Sundays only, depending on the season, primarily to transport tourists. In October, the carrier began having some of these buses stop at Dartmouth, MA and Kingston, RI to serves students at the University of Massachusetts and University of Rhode Island, respectively. In September, buses on the Boston - Burlington, VT route began stopping in Montpelier, VT to serve students from the Vermont College of Fine Arts and the New England Culinary Institute. Minor Changes: After many requests from students and parents, as well as discussions with the University of Delaware, Megabus reactivated its Newark, DE - New York City service in September, which was discontinued several months prior, and now encompasses one to two daily trips in each direction. 13 The carrier discontinued its express service from New York to the Connecticut towns of Storrs, Hartford, and New Haven due to low ridership. Service to Hartford continues as part of the aforementioned Burlington service (also operated by Dattco). In May, Megabus annulled its Pittsburgh, PA Ann Arbor, MI service, which operated via Cleveland, Toledo, and Detroit, due to low ridership. Other routes continue to serve these cities. 13
15 3) State governments stepped up investments in rural feeder service during 2014 to foster better connections to the national network. Public financial support was particularly significant in New England and the West. Momentum for state-supported service grew in With many states eager to cater to local communities with metropolitan areas, at least 10 routes and interline partnerships entered the mix. While a handful of routes were developed to revive former services discontinued by Greyhound Lines, others were introduced for the first time to communities underserved by transportation. Moves in the Northeast Plymouth Brockton Street Railway, a fixture on Cape Cod, launched a new twice-daily service connecting Plymouth, MA, with Providence, RI, in July. The route is sponsored in part by a grant provided through Massachusetts s Bus Plus program. The service was created primarily to serve tourists traveling to the area, particularly from New York City via Amtrak and Peter Pan Bus, as well as college students attending institutions in the area. 14 Vermont Translines, a subsidiary of Vermont-based charter carrier Premier Coach, launched two new routes in June, one linking Burlington to Albany, NY, and another linking Rutland to White River Junction. Operated under contract with the state of Vermont, this service was developed to provide residents with better connections to Boston, Montreal, and New York City. 15 In the Midwest, Southeast, and South Central States Baron s Bus launched a new service in July called I-Ride 79 that serves various communities on the I-79 Corridor between Charleston, SC and Morgantown, WV. With one daily scheduled operation in each direction, the service connects to Greyhound service at both ends and improves mobility for students at the University of West Virginia. 16 Baron s also added a second frequency between Chicago and Columbus, OH, matching that provided by Miller Trailways. Both carriers operate via Ft. Wayne, Indiana. 17 Tornado Bus added a significant number of new routes, many of which are feeder lines served with vans between smaller communities and major stations. 18 Tornado, however, also added a long-distance bus service linking Glendale, KY and Nashville, TN to its Dallas hub, and strengthened its intra-texas service, including the Dallas - San Antonio route, which is served using double-decker buses. TRAX, a carrier supported by the Ark-Tex Council of Governments, started a new DeKalb - Texarkana, TX route, which is sold on greyhound.com and offers connections with the national carrier. 19 Florida Express began daily Miami - Key West, FL service, competing with Greyhound. Expansion in the West Elevated Transit launched a pair of routes serving Utah in August. Operating in partnership with the Utah state government, the carrier uses the Greyhound Bus at Salt Lake City as its focal point. These routes extend to Blandin and Richfield, UT and are served by one or two daily schedules
16 Road Runner Stages launched service in July with the help of Greyhound, the state of Colorado, and the Southern Ute Community Action Program. Operating one schedule in each direction between Durango - Grand Junction, CO with numerous stops, this route partially replaces service dropped by Greyhound in This route complements existing transit service and connects with the national carrier in Grand Junction. 21 Silver State Trailways, in conjunction with the State of Nevada, launched a new Reno - Las Vegas, NV service in June. The route, which also serves Carson City and other stops, connects with Greyhound service at both ends. 22 Yuma County Area Transit and Greyhound added regional feeder services between Yuma and San Luis, AZ to the growing portfolio of Greyhound Connect in June. This service is made possible through a partnership with several government agencies. 23 Looking Ahead to 2015 Scheduled motor coach operators continue to invest in broadening their appeal to a wider range of passengers, including business travelers. Attention has shifted from the rapid expansion, which occurred at a feverish pace between 2006 and 2012, to the more recent pattern of growing in a focused manner, with heavy emphasis on providing new amenities and fostering better connections. The pace in which scheduled operators enhance their services appears likely to remain brisk throughout Megabus continues to eye expansion opportunities, while its rival, BoltBus, which has been focusing on its Northwest and West Coast service, also positions itself for growth. Expansion by BoltBus could bring Megabus new competition, particularly in the Deep South or the Midwest regions with a number of densely traveled city pairs in the mile range that are best-suited for city-to-city express service at high frequencies. Smaller carriers also appear poised to grow. Academy s ownership of GO Buses, and its experience as the contractual operator of BestBus services, gives it a solid platform for expansion. Tornado Bus will most likely broaden its demographic base to gain more mainstream appeal. In the past, this carrier s marketing has been heavily oriented toward the Spanish-speaking population. Following the acquisition of new double-decker buses, Tornado has muscled its way into Texas and other markets in the Southeast previously dominated by Greyhound and Megabus. By all indications, the trend toward more first-class services will continue. A new breed of carrier has emerged, operating from business-oriented hotels and providing service marketed as an alternative to short-haul air travel. Red Coach appears eager to expand outside of the markets entirely or partially within Florida, while Vonlane is no doubt interested in expanding its brand. Carriers have a particular incentive to bring the luxury product to California and the Midwest, where it is currently unavailable. 15
17 Whether larger carriers will eventually offer two or three classes of service, as do many airlines, remains to be seen, although it seems likely that Megabus will consider offering overnight sleeper service similar to megabusgold in the United Kingdom. The wind behind the intercity bus industry s sails last year suggests that this mode will continue to invest aggressively to leverage revenue opportunities, much as airlines did in the frenetic years following airline deregulation in
18 Recent Chaddick Institute Studies that Supplement This Report Motoring into the Mainstream: 2013 Year-in-Review: Intercity Bus Service in the United States Last year s update on developments in intercity bus travel. (January 2014) Link to Reuters coverage of the study at Intercity Bus Data Supplement Includes information about the Intercity Bus Data Set and previously unavailable data from Wanderu.com. (February 2014) The Traveler s Tradeoff: Comparing Intercity Bus, Plane, & Train Fares across the United States A systematic look at the fares for air, bus, and train travel in 52 markets between 100 and 500 miles. (April 2014) Link to USA Today coverage of this study on The Personal Tech Tidal Wave: The Rising Use on Intercity Bus, Planes & Trains A review of how personal electronic devices are used on intercity services, with particularly heavy use on buses on trains. (July 2014) Link to USA Today coverage of this study on Each of these reports are available as PDFs in the Research & Publications section of the Chaddick Institute website at: las.depaul.edu/chaddick. 1 These carriers were referred to as discount city-to-city carriers in past reports. This category encompasses only carriers that specialize in this type of service and does not include Greyhound or Peter Pan Express, which offer similar competing services. 2 Bus companies, including city-to-city express carriers, often operate more than one bus at a designated departure time to meet the demand. The methods used in this study to estimate the amount of service provided are not able to capture the effects of this practice. 3 See 4 Amtrak data taken from October 2014 Performance Report, available at Performance-Report-October-2014.pdf. Airline data available from Bureau of Transportation Statistics (USDOT) website, Use the customize table feature to obtain January September data, the most recent available at the time of this report. 5 Amtrak ridership growth taken from Amtrak Ridership and Revenues Continue Strong Growth in FY 2014, dated October 27, 2014, available at See Endnote 4 for information on air travel data sources. 6 Amy Zipkin, See Harried Travelers Take the Bus, New York Times, August 25, 2014 at 7 Among the options available are the first row of seats on the upper level of the coach and select seats with a table on the lower level. See 8 This information was provided to the Chaddick Institute by Polina Raygorodskaya, CEO of Wanderu, in January The authors of the report are grateful for the data assistance Wanderu provided. 9 These estimates are based on information provided by Wanderu and cover the period from approximately January 5, 2014 to January 5, 2015 The estimates of the number of legs (segments) sold refer only to single-legged and do not include legs sold as part of routed trips, which account for a great deal more legs. 17
19 10 See especially and 11 See 12 See 13 After discontinuing its express service between New York City and Newark, DE, citing low ridership, megabus.com continued to serve Newark, DE, home to the University of Delaware, through its Philadelphia - Newark - Baltimore - Washington, D.C. - Richmond - Hampton, VA route. 14 See and 15 There are two routes that operate via prominent travel corridors in the state: Route 7: Colchester, Burlington, S. Burlington, Middlebury, Rutland, Wallingford, Manchester, Bennington, and Albany; and Route 4: Rutland, Mendon, Sherburne, Killington, Bridgewater, Woodstock, Quechee, White River Junction, Hanover, and Lebanon. The two routes connect in Rutland, VT and operate one single round trip in both directions each day. See and 16 See 17 For a summary of Baron s Bus and Miller Transportation service changes, see the American intercity Bus Riders Association Summary, available at See, also, Northwest Indiana Times, available at 18 For a summary of some of the most notable stations, see the American intercity Bus Riders Association Summary, available at 19 For details, see the American intercity Bus Riders Association Summary, available at 20 One route links the Utah communities of Richfield, Salina, Centerfield, Gunnison, Manti, Ephraim, Fairview, Mount Pleasant, Moroni, Nephi, Provo, and Salt Lake City, with one schedule each direction every day. An additional schedule operates in each direction Thursday Monday between Blanding, Monticello, Moab, Green River, Price, Spanish Fork, Provo, and Salt Lake City. See 21 The company operating one schedule in each direction every day. This route partially replaces service dropped by Greyhound Lines, Inc in Intermediate sites include Mancos, Cortez, Dolores, Rico, Telluride, Placerville, Ridgway, Montrose, and Delta. See 22 Operating one trip in each direction every day, the route serves North Las Vegas, Las Vegas, Pahrump, Beatty, Tonopah, Hawthorne, Fallon, Carson City, Sparks, Reno, and Doyle, CA. See 23 This feeder service, which operates locally as Yellow Route 95, serves several intermediary locations, including San Luis, Gadsden, Somerton, Cocopah Casino, West Yuma Transfer Hub, Downtown Yuma Transit Center, and the Yuma Greyhound bus stop. The service operates once per hour on Monday - Saturday at various times throughout the day. See 18
2015 Independence Day Travel Overview U.S. Intercity Bus Industry
 2015 Independence Day Travel Overview U.S. Intercity Bus Industry Chaddick Institute for Metropolitan Development, DePaul University June 25, 2015 This Intercity Bus Briefing summarizes the Chaddick Institute
Lower Income Journey to Work Market Share From American Community Survey
 Lower Income Journey to Work Market Share From American Community Survey 2006-2010 Table 1: Overall National Data Table 2: Car, Truck or Van Table 3: Transit Table 4: Metrics Table 1 Work Trip Market Share:
Hector International Airport Fargo, North Dakota
 Hector International Airport Fargo, North Dakota Volume 073 Twelve Months Ended September 2007 January 2008 Airlines Serving Fargo Carried 831 Onboard Passengers Per Day for the Twelve Months Ended September
Hector International Airport Fargo, North Dakota
 Hector International Airport Fargo, North Dakota Volume 072 Twelve Months Ended June 2007 November 2007 Airlines Serving Fargo Carried 830 Onboard Passengers Per Day for the Twelve Months Ended June 2007,
Census Affects Children in Poverty by Professors Donald Hernandez and Nancy Denton State University of New York, Albany
 Phone: (301) 457-9900 4700 Silver Hill Road, Suite 1250-3, Suitland, MD 20746 Fax: (301) 457-9901 Census Affects in Poverty by Professors Donald Hernandez and Nancy Denton State University of New York,
Location, Location, Location. 19 th Annual NIC Conference NIC MAP Data & Analysis Service
 Location, Location, Location 19 th Annual NIC Conference NIC MAP Data & Analysis Service The Great Occupancy Decline 94% Occupancy Trends Majority Nursing Seniors Housing 93% 92% 91% 92.8% 91.0% 90% 89%
BLACK KNIGHT HPI REPORT
 CONTENTS 1 OVERVIEW 2 NATIONAL OVERVIEW 3 LARGEST STATES AND METROS 4 FEBRUARY S BIGGEST MOVERS 5 20 LARGEST STATES 6 40 LARGEST METROS 7 ADDITIONAL INFORMATION OVERVIEW Each month, the Data & Analytics
CONNECTICUT INTERSTATE AND INTRASTATE LOCAL REDUCED CITY-PAIR FARES
 PASSENGER TARIFF AND SALES MANUAL CONNECTICUT INTERSTATE AND INTRASTATE LOCAL REDUCED CITY-PAIR S The following section contains city-pair fares that are lower than walkup mileage-based fares. Although
Hector International Airport Fargo, North Dakota
 Hector International Airport Fargo, North Dakota Volume 081 Twelve Months Ended March 2008 July 2008 Airlines Serving Fargo Carried 838 Onboard Passengers Per Day for the Twelve Months Ended March 2008,
PUBLIC TRANSPORTATION INTRODUCTION
 PUBLIC TRANSPORTATION INTRODUCTION 1 OUTLINE Current Status and Recent Trends Significant Influences A Critical Assessment Arguments Supporting Public Transport Future Influences Ingredients for Future
Higher Education in America s Metropolitan Areas A Statistical Profile
 Higher Education in America s Metropolitan Areas A Statistical Profile MSA Study No.2 Higher Education in America s Metropolitan Areas A Statistical Profile CONTENTS Why Metro Areas? 1 Executive Summary
FBI Drug Demand Reduction Coordinators
 FBI Drug Demand Reduction Coordinators Alabama 2121 Building, Room 1400 Birmingham, AL 35203 (205) 252 7705 One St. Louis Centre One St. Louis Street Mobile, AL 36602 (334) 438 3674 Alaska 222 West Seventh
Appendix D: Aggregation Error for New England Metro Areas and for Places
 Appendix D: for New England Metro Areas and for Places D-1 Appendix D: s Figure D-1: New England Metro Areas - Summary of Tract s (2000) Metro ID (msapma99) Metro Area Name Census NCDB 1120 Boston, MA-NH
INDIANA INTERSTATE AND INTRASTATE LOCAL REDUCED CITY-PAIR FARES
 The following section contains city-pair fares that are lower than walkup mileage-based fares. Although shown in only one direction, the fares in this section apply in both directions, unless otherwise
Access Across America: Transit 2014
 Access Across America: Transit 2014 Final Report CTS 14-11 Prepared by: Andrew Owen David Levinson Accessibility Observatory Department of Civil, Environmental, and Geo- Engineering University of Minnesota
Norwegian's Free Airfare Promotion
 Norwegian's Free Airfare Promotion Start planning your next vacation with 200+ cruises to incredible destinations, including Alaska, Bahamas & Florida, Bermuda, Canada & New England, Caribbean, Mexican
Population Estimates for U.S. Cities Report 1: Fastest Growing Cities Based on Numeric Increase,
 ulation s for U.S. Cities Report 1: Fastest Growing Cities Based on Numeric Increase, 2015-2015 1 Phoenix AZ 32,113 2.0 1,582,904 1,615,017 167,393 11.6 2 Los Angeles CA 27,173 0.7 3,949,149 3,976,322
Rank Place State Native Hawaiian and Pacific Islander population (alone or in combination
 TABLE 2a: 100 Largest Places Ranked by Number of s (race alone or in *) Living in Hard-to- Census Rank Place State (alone or in 1 Honolulu (CDP) HI 64,196 11,130 17.3 2 New York City NY 14,981 8,211 54.8
Monthly Employment Watch: Milwaukee and the Nation's Largest Cities
 Monthly Employment Watch: Milwaukee and the Nation's Largest Cities A monthly report on employment trends in the nation s largest cities Prepared by: The University of Wisconsin-Milwaukee Center for Economic
333 W. Campbell Road, Suite 440 Richardson, Texas Cruising for Charity with Randy Limbacher in Tahiti July 28, 2007
 333 W. Campbell Road, Suite 440 Richardson, Texas 75080 972.238.1998 800.952.1998 Cruising for Charity with Randy Limbacher in Tahiti July 28, 2007 Join me for this special annual event to raise money
Monthly Employment Watch: Milwaukee and the Nation's Largest Cities
 Monthly Employment Watch: Milwaukee and the Nation's Largest Cities A monthly report on employment trends in the nation s largest cities Prepared by: The University of Wisconsin-Milwaukee Center for Economic
The Decline and Revival of Intercity Bus Service
 TRN_303.e$S_TRN_303 7/1/16 11:46 AM Page 4 The Bus Renaissance PHOTO: RYAN JOHNSON, CITY OF NORTH CHARLESTON The Decline and Revival of Intercity Bus Service J O S E P H P. S C H W I E T E R M A N 4 The
ILLINOIS INTERSTATE AND INTRASTATE LOCAL REDUCED CITY-PAIR FARES
 The following section contains city-pair fares that are lower than walkup mileage-based fares. Although shown in only one direction, the fares in this section apply in both directions, unless otherwise
A CORPORATE OR MEDICAL USER OPPORTUNITY WELL-LOCATED OFF THE PA TURNPIKE AM Drive. Quakertown, PA INVESTMENT SUMMARY. Page 1
 A CORPORATE OR MEDICAL USER OPPORTUNITY WELL-LOCATED OFF THE PA TURNPIKE 1900 AM Drive Quakertown, PA INVESTMENT SUMMARY Page 1 EXECUTIVE SUMMARY On behalf of ownership, Avison Young is pleased to offer
Major Metropolitan Area Sales Tax Rates
 August 19, 2010 No. 239 FISCAL FACT Major Metropolitan Area Sales Tax Rates By Lawrence Summers Introduction General sales taxes levied by state, county and city governments in the United States vary greatly,
Aviation Insights No. 5
 Aviation Insights Explaining the modern airline industry from an independent, objective perspective No. 5 November 16, 2017 Question: How has air travel in specific metropolitan areas changed in recent
Mango Market Development Index
 Mango Market Development Index 2016-2017 Understanding the Market Index The Mango Market Development Index is designed to measure and compare mango volume sold at retail relative to population by region
Hotel Valuation and Transaction Trends for the U.S. Lodging Industry
 Hotel Valuation and Transaction Trends for the U.S. Lodging Industry June 2010 Presented by Steve Rushmore, MAI, FRICS, CHA srushmore@hvs.com - 1 - Value Trend for a Typical U.S. Hotel 1987 1988 1989 1990
AUGUST 2018 MONTHLY STATISTICAL REPORT
 AUGUST 2018 MONTHLY STATISTICAL REPORT Monthly Statistical Report To: Russell J. Handy, Aviation Director From: Brian Pratte, Air Service Administrator Copies: San Antonio Regional Stakeholders Subject:
TOP 100 Bus Fleets Agency 35 ft. and Over Artic under 35 ft. Total. 18 < metro magazine SEPTEMBER/OCTOBER 2018 metro-magazine.
 1 1 MTA New York City Transit/MTA Bus Co. 0 4,860 951 5,811 New York City 2 3 New Jersey Transit Corp. 418 2,879 85 3,382 Newark, N.J. 3 2 Los Angeles County Metropolitan Transportation Authority 50 1,882
Impact of Hurricane Irma on US Metropolitan Areas
 Impact of Hurricane Irma on US Metropolitan Areas Puerto Ricans in mainland Prepared for: Jorge Restrepo, CEO 2017 EurekaFacts LLC September 29, 2017 Climate refugees from Puerto Rico in US metropolitan
U.S. Metropolitan Area Exports, 2015
 U.S. Metropolitan Area Exports, 2015 Jeffrey Hall Office of Trade and Economic Analysis Industry and Analysis Department of Commerce International Trade Administration September 2016 U.S. Metro Exports:
Florida's Scheduled Commercial Service Airports
 Florida's Scheduled Commercial Service Airports Volume 154 May 2016 - Domestic Airlines Serving Florida Carried 170,726 Onboard Passengers Per Day for, up 7.7% over the previous 12 months. Highlights in
Metropolitan Votes and the 2012 U.S. Election: Population, GDP, Patents and Creative Class
 politan Votes and the 2012 U.S. Election: Population, GDP, Patents and Creative Class Author: Shawn Gilligan, Shawn.Gilligan@rotman.utoronto.ca Zara Matheson, Zara.Matheson@rotman.utoronto.ca Kevin Stolarick,
Hotel InduSTRy Overview What Lies Ahead
 University of Massachusetts Amherst ScholarWorks@UMass Amherst Tourism Travel and Research Association: Advancing Tourism Research Globally 2013 Marketing Outlook Forum - Outlook for 2014 Hotel InduSTRy
MANGO MARKET DEVELOPMENT INDEX REPORT
 MANGO MARKET DEVELOPMENT INDEX REPORT 2015-2016 UNDERSTANDING THE MARKET INDEX The Mango Market Development Index is designed to measure and compare mango sales volume relative to population by region
Major US City Preparedness For an Oil Crisis Which Cities and Metro Areas are Best Prepared for $4 a Gallon Gas and Beyond?
 Major US City Preparedness For an Oil Crisis Which Cities and Metro Areas are Best Prepared for $4 a Gallon Gas and Beyond? March 4, 2008 By Warren Karlenzig President Common Current www.commoncurrent.com
Monthly Employment Watch: Milwaukee and the Nation's Largest Cities
 Monthly Employment Watch: Milwaukee and the Nation's Largest Cities A monthly report on employment trends in the nation s largest cities Prepared by: The University of Wisconsin-Milwaukee Center for Economic
World Class Airport For A World Class City
 World Class Airport For A World Class City Air Service Update April 2018 2018 Air Service Updates February 2018 Seattle new departure, seasonal, 2x weekly Boston new departure, seasonal, 2x weekly March
World Class Airport For A World Class City
 World Class Airport For A World Class City Air Service Update October 2017 2017 Air Service Updates February 2017 Cleveland new destination, 2x weekly Raleigh-Durham new destination, 2x weekly March 2017
Agency 35 ft. Over Artic. Trolley 2012 Total and 35 ft. under. 1 1 MTA New York City Transit 0 3, ,344 New York City
 Capital Metro-No. 40 Courtesy Capital Metro 1 1 MTA New York City Transit 0 3,704 640 0 4,344 New York City 2 3 New Jersey Transit Corp. 47 2,263 85 0 2,395 Newark, N.J. 3 2 Metro 50 1,956 378 0 2,384
Non-stop Scheduled Passenger Service at Fargo as of October Top 20 Domestic O&D Passenger Markets at Fargo Twelve Months Ended June 2006
 0 5000 10000 15000 20000 25000 30000 35000 40000 45000 50000 Airport Traffic Quarterly Non-stop Scheduled Passenger Service at Fargo as of October 2006 Top 20 Domestic O&D Passenger Markets at Fargo Twelve
Monthly Employment Watch: Milwaukee and the Nation's Largest Cities
 Monthly Employment Watch: Milwaukee and the Nation's Largest Cities A monthly report on employment trends in the nation s largest cities Prepared by: The University of Wisconsin-Milwaukee Center for Economic
 Snakes & Lattes is currently composed of three corporate owned and operated board game cafes in Toronto, ON. Over the last 7 years these have become renowned as Toronto's premiere board game cafe destinations.
U.S. Lodging Industry Update
 U.S. Lodging Industry Update First Watch on a Long Voyage R. MARK WOODWORTH AMERICAS RESEARCH AGENDA THE ECONOMY WHAT COULD END THE CURRENT CYCLE? LABOR COSTS OUR FORECASTS SHARING ECONOMY UPDATE First
Monthly Employment Watch: Milwaukee and the Nation's Largest Cities
 Monthly Employment Watch: Milwaukee and the Nation's Largest Cities A monthly report on employment trends in the nation s largest cities Prepared by: The University of Wisconsin-Milwaukee Center for Economic
MARKETBEAT U.S. Office
 MARKETBEAT U.S. Office Q3 2018 U.S. OFFICE Employment Indicators Market Indicators (Overall) Office: Net Absorption/Asking Rent 4Q TRAILING AVERAGE Office: Overall Vacancy Q3 17 Q3 18 Total Nonfarm Employment
October Air Traffic Statistics. Prepared by the Office of Corporate Risk and Strategy
 October 214 Air Traffic Statistics Prepared by the Office of Corporate Risk and Strategy Metropolitan Washington Airports Authority Air Traffic Statistics Table of Contents Summary Air Traffic Summary...
RANKING OF THE 100 MOST POPULOUS U.S. CITIES 12/7/ /31/2016
 OVERVIEW OF THE DATA The following information is based on incoming communication to the National Human Trafficking Hotline via phone, email, and online tip report from December 7, 2007 December 31, 2016
Monthly Employment Watch: Milwaukee and the Nation's Largest Cities
 Monthly Employment Watch: Milwaukee and the Nation's Largest Cities A monthly report on employment trends in the nation s largest cities Prepared by: The University of Wisconsin-Milwaukee Center for Economic
TRANSPORTATION PROGRAMS
 High Speed Transit Corridor Studies Rail/Freight Session 2011 ITE/MSA Spring Conference Black Canyon Conference Center Phoenix, Arizona March 9, 2011 The Maricopa Association of Governments (MAG) is the
ustravel.org/travelpromotion
 Agenda 1. Power of Travel Promotion Resources 2. New Tool: Travel Economic Impact Calculator 3. Accessing data through Interactive Travel Analytics 4. Unused Vacation Time Opportunity 5. Highlights from
3. Proposed Midwest Regional Rail System
 3. Proposed Midwest Regional Rail System 3.1 Introduction The proposed Midwest Regional Rail System (MWRRS) will operate in nine states, encompass approximately 3,000 route miles and operate on eight corridors.
These elements are designed to make service more convenient, connected, and memorable.
 Transit is most attractive when it is frequent enough that people don t need to consult a timetable, and can instead just go to a stop and know that the train or bus will arrive shortly. Nearly all major
MARKETBEAT U.S. Office
 MARKETBEAT U.S. Office Q4 2018 U.S. OFFICE Employment Indicators Market Indicators (Overall) Office: Net Absorption/Asking Rent 4Q TRAILING AVERAGE Office: Overall Vacancy Q4 17 Q4 18 Total Nonfarm Employment
Planning, Engineering & Construction Department September 2017
 Planning, Engineering & Construction Department September 2017 More frequent routes (next bus arrival 15 minutes or less) More reliable service 7 day a week service More options for connections METRO s
Frequent Fliers Rank New York - Los Angeles as the Top Market for Reward Travel in the United States
 Issued: April 4, 2007 Contact: Jay Sorensen, 414-961-1939 IdeaWorksCompany.com Frequent Fliers Rank New York - Los Angeles as the Top Market for Reward Travel in the United States IdeaWorks releases report
1Q 2014 Greater Atlanta HBA Builder Developer Lender Council meeting Information presented by. Atlanta Job Growth
 1Q 2014 Greater Atlanta HBA Builder Developer Lender Council meeting 5-21-2014 Information presented by Eugene James, Regional Director ejames@metrostudy.com 404-510-1080 connect on LinkedIn Atlanta Job
Passengers Boarded At The Top 50 U. S. Airports ( Updated April 2
 (Ranked By Passenger Enplanements in 2006) Airport Table 1-41: Passengers Boarded at the Top 50 U.S. Airportsa Atlanta, GA (Hartsfield-Jackson Atlanta International) Chicago, IL (Chicago O'Hare International)
TOP 100. Transit Bus Fleets Agency 35 ft. Over Artic and 35 ft. Total +/- under 0 3, ,426 82
 L.A. Metro-No. 3 1 1 MTA New York City Transit New York City 2 2 New Jersey Transit Corp. Newark, N.J. 3 3 Metro Los Angeles 4 5 Toronto Transit Commission Toronto 5 10 Chicago Transit Authority Chicago
STATE OF UTAH "BEST VALUE" COOPERATIVE CONTRACT CONTRACT NUMBER: AR2270 November 14, 2016
 Item: Contracted Airline Fares Purchasing Agent: Chad Hinds Phone #: (801) 538-1287 Email: chinds@utah.gov Vendor: 112932A Internet Homepage: Delta Air Lines, Inc. 1030 Delta Blvd. Atlanta, GA 30354 www.statetravel.utah.gov
December Air Traffic Statistics. Prepared by the Office of Marketing & Consumer Strategy
 December 217 Air Traffic Statistics Prepared by the Office of Marketing & Consumer Strategy 1 This report includes only data submitted by airlines as of the date of publication: February 2, 217. Reports
Largest cities in the United States by population by decade
 1 of 17 11/15/2008 7:30 AM Largest cities in the United States by population by decade From Wikipedia, the free encyclopedia This entry tracks and ranks the population of the largest cities in the United
NATIONAL TOLL FACILITIES USAGE ANALYSIS RECORD-BREAKING YEAR FOR TOLL FACILITIES ACROSS THE U.S.
 NATIONAL TOLL FACILITIES USAGE ANALYSIS RECORD-BREAKING YEAR FOR TOLL FACILITIES ACROSS THE U.S. INTRODUCTION KEY FACTS FROM THE NATIONAL TOLL FACILITIES USAGE ANALYSIS 31 TOLL AUTHORITIES from across
September Air Traffic Statistics. Prepared by the Office of Corporate Risk and Strategy
 September 214 Air Traffic Statistics Prepared by the Office of Corporate Risk and Strategy Air Traffic Summary September 214 Commercial Total Dom Int'l Passengers % Change Passenger Activity (in Millions)
District Match Data Availability
 District Match Data Availability National & State Data Location Available National Data Australia Parliament, Provincial and Territory Assemblies Canada Parliament, Provincial Legislative Assemblies New
Marketing and Passenger Demographics
 Marketing and Passenger Demographics This chapter presents information obtained from surveys and related sources about regional bus users in Massachusetts. If broad user characteristics in this market
air traffic statistics
 December 213 air traffic statistics Prepared by the Office of Finance Department of Internal Controls, Compliance and Financial Strategy Commercial Total Dom Int'l Passengers % Change Air Traffic Summary
November Air Traffic Statistics. Prepared by the Office of Corporate Risk and Strategy
 November 214 Air Traffic Statistics Prepared by the Office of Corporate Risk and Strategy Air Traffic Statistics Table of Contents Summary Air Traffic Summary... 1 SH&E Air Traffic Schedule Activity...
Westshore Development Forum April 11, Hillsborough County Aviation Authority
 Westshore Development Forum April 11, 2017 Aviation in Florida Only state with four large hub airports $144 billion in annual economic activity or output Approximately 43.1 million visitors come to Florida
World Class Airport For A World Class City
 World Class Airport For A World Class City Air Service Update December 2018 2018 Air Service Updates February 2018 Delta Air Lines Seattle new departure, seasonal, 2x weekly Delta Air Lines Boston new
At the end of the bill (before the short title), insert the following:
, insert the following:") AMENDMENT TO H. R. (CONTINUING APPROPRIATIONS, 0) OFFERED BY MR. PENCE OF INDIANA At the end of the bill (before the short title), insert the following: 0 SEC. ll. None of the funds made available by this
AMENDMENT TO H. R. (CONTINUING APPROPRIATIONS, 0) OFFERED BY MR. PENCE OF INDIANA At the end of the bill (before the short title), insert the following: 0 SEC. ll. None of the funds made available by this
June Air Traffic Statistics. Prepared by the Office of Corporate Risk and Strategy
 June 214 Air Traffic Statistics Prepared by the Office of Corporate Risk and Strategy Air Traffic Statistics Table of Contents Summary Air Traffic Summary... 1 SH&E Air Traffic Schedule Activity... 3 Passenger
(See Note 1) Solar Energy Factor (SEF D ) Solar Fraction (SF D ) Estimated Energy Savings SYSTEM DETAILS
 Solar Energy Factor (SEF D ) Solar Fraction (SF D ) Estimated Energy Savings SYSTEM DETAILS") OG-300 ICC-SRCC TM CERTIFIED SOLAR SYSTEM # SYSTEM INFORMATION Pumped Internal Backup: Gas Tank Collector Type: Glazed Flat Plate Solar Tank Volume: 379 liter (100 gal) Collector Heat Transfer Fluid: GRAS
OG-300 ICC-SRCC TM CERTIFIED SOLAR SYSTEM # SYSTEM INFORMATION Pumped Internal Backup: Gas Tank Collector Type: Glazed Flat Plate Solar Tank Volume: 379 liter (100 gal) Collector Heat Transfer Fluid: GRAS
METROPOLITAN STATISTICAL AREA
 Miami-Fort Lauderdale-West Palm Beach METROPOLITAN STATISTICAL AREA Broward County is part of the 8th largest metropolitan statistical area (MSA)() in the country with a population just over 6M in 2016.
July air traffic statistics. Prepared by the Office of Corporate Risk and Strategy
 July 214 air traffic statistics Prepared by the Office of Corporate Risk and Strategy Air Traffic Statistics Table of Contents Summary Air Traffic Summary... 1 SH&E Air Traffic Schedule Activity... 3 Passenger
The FMR history file contains the following fields, all for 2-bedroom FMRs. It is in EXCEL format for easy use with database or spreadsheet programs.
 The FMR history file contains the following fields, all for 2-bedroom FMRs. It is in EXCEL format for easy use with database or spreadsheet programs. GENERAL NOTES 1. There are no Fiscal Year 1984 FMRs
Parking Rates & Policies Survey. December 2013
 METER OVERVIEW RATE & POLICY PRESENTATION SURVEY / 1 Parking Rates & Policies Survey December 2013 METER OVERVIEW RATE & POLICY PRESENTATION SURVEY / 2 Parking rates and policies survey The purpose of
World Class Airport For A World Class City
 World Class Airport For A World Class City Air Service Update April 2017 2017 Air Service Updates February 2017 Cleveland new destination, 2x weekly Raleigh-Durham new destination, 2x weekly March 2017
August air traffic statistics. Prepared by the Office of Corporate Risk and Strategy
 August 214 air traffic statistics Prepared by the Office of Corporate Risk and Strategy Metropolitan Washington Airports Authority Air Traffic Statistics Table of Contents Summary Air Traffic Summary...
MASSACHUSETTS INTERSTATE AND INTRASTATE LOCAL REDUCED CITY-PAIR FARES
 The following section contains city-pair fares that are lower than walkup mileage-based fares. Although shown in only one direction, the fares in this section apply in both directions, unless otherwise
Fort Lauderdale August 8, 2017
 Fort Lauderdale August 8, 2017 8/10/2017 TAP Software Analytics Division Brian Finucane TAP Reports Jeff Eastman TAP Hotel Reports Jeanne Eastman TAP Data Source Jeff Eastman Cloud Database Numerous Data
Like many transit service providers, the Port Authority of Allegheny County (Port Authority) uses a set of service level guidelines to determine
 uses a set of service level guidelines to determine") Transit service consists of two fundamental elements: frequency (how often service operates) and service span (how long service runs during the day). Combined, these two factors measure how much service
Transit service consists of two fundamental elements: frequency (how often service operates) and service span (how long service runs during the day). Combined, these two factors measure how much service
MARKETBEAT U.S. Office
 MARKETBEAT U.S. Office Q2 2017 U.S. OFFICE Employment Indicators Q2 16 Q2 17 Total Nonfarm Employment 143.9M 146.2M Office-using Employment 30.1M 31.8M Unemployment 4.9% 4.4% Source: BLS Market Indicators
Park-Related Total* Expenditure per Resident, by City
 Park-Related Total* per Resident, by City FY 2008 City Population Total Park per Resident Washington, D.C. 591,833 $153,324,830 $259 Seattle 598,541 $150,672,543 $252 Scottsdale 235,371 $50,429,049 $214
OB-GYN Workload & Potential Shortages: The Coming U.S. Women s Health Crisis
 OB-GYN Workload & Potential Shortages: The Coming U.S. Women s Health Crisis JULY 2017 Introduction Obstetricians and Gynecologists (OB-GYNs) are a critical part of the health care provider community.
BATON ROUGE Metropolitan Airport
 BATON ROUGE Metropolitan Airport May August, 2011 presented by: Why the research? objective and methodology SCI was contacted by the Baton Rouge Metropolitan airport (BTR) to determine, using a quantitative
National Fact Sheet: FY 2008
 The name "Amtrak" is the blending of the words "America" and "track." It is properly used in documents with only the first letter capitalized. The railroad is also known as the National Railroad Passenger
MARKETBEAT U.S. Industrial Snapshot Q4 2015
 MARKETBEAT U.S. Industrial Snapshot Q4 2015 U.S. INDUSTRIAL Employment Indicators Q4 14 Q4 15 Total Nonfarm Employment 140.2M 143.0M Industrial Employment 23.4M 23.6M Unemployment 5.7% 5.0% Market Indicators
Social Media In Your New & Improved Phoenix Sky Harbor
 Social Media In Your New & Improved Phoenix Sky Harbor AZ Chapter of HSMAI September 19, 2013 It always begins & ends with: skyharbor.com Began Facebook page in October 2010 More than 27,000 people Like
August Air Traffic Statistics. Prepared by the Office of Marketing & Consumer Strategy
 August 218 Air Traffic Statistics Prepared by the Office of Marketing & Consumer Strategy This report includes only data submitted by airlines as of the date of publication: October 17, 218. Reports are
September Air Traffic Statistics. Prepared by the Office of Marketing & Consumer Strategy
 September 217 Air Traffic Statistics Prepared by the Office of Marketing & Consumer Strategy This report includes only data submitted by airlines as of the date of publication: November 15, 217. Reports
U.S. Office Snapshot Q1 2016
 MARKETBEAT U.S. Office Snapshot Q1 2016 U.S. OFFICE Employment Indicators Q1 15 Q1 16 Total Nonfarm Employment 140.8M 143.5M Offi ce-using Employment 30.2M 31.0M Unemployment 5.6% 4.9% Source: BLS Market
March 2011 Visitor Profile
 RESEARCH DATA SERVICES, INC. 777 SOUTH HARBOUR ISLAND BOULEVARD SUITE 260 TAMPA, FLORIDA 33602 TEL (813) 254-2975 FAX (813) 254-2986 Naples, Marco Island, Everglades Convention and Visitors Bureau March
2012 Airfares CA Out-of-State City Pairs -
 2012 Airfares Out-of-State City Pairs - Contracted rates are from July 1, 2012 through June 30, 2013. Please note all fares are designated as () and ( ) in airline computer reservation systems. fares are
Multi-Aero Inc. d/b/a Air Choice One
 Multi-Aero Inc. d/b/a Air Choice One Proposal to Provide Essential Air Service at Owensboro, Kentucky Docket DOT-OST-2000-7855 Direct Inquiries Regarding this Proposal to: Shane Storz, CEO Air Choice One
2016 Air Service Updates
 Air Service Update May 2016 2016 Air Service Updates February 2016 Pittsburgh new destination, 2x weekly April 2016 Los Angeles new departure, 1x daily Atlanta new departure, 1x daily Jacksonville new
January Air Traffic Statistics. Prepared by the Office of Marketing & Consumer Strategy
 January 218 Air Traffic Statistics Prepared by the Office of Marketing & Consumer Strategy This report includes only data submitted by airlines as of the date of publication: March 21, 218. Reports are
LEASING CONTACTS. Northern Region. Mid-Atlantic Region. Southern Region. Western Region
 Northern Region Mid-Atlantic Region JOSH WEINKRANZ, Northern Region (516) 869-7146 jweinkranz@kimcorealty.com DAVE SALVAGE Vice, Northern Region (617) 933-2821 dsalvage@kimcorealty.com TOM SIMMONS, Mid-Atlantic
February Air Traffic Statistics. Prepared by the Office of Marketing & Consumer Strategy
 February 218 Air Traffic Statistics Prepared by the Office of Marketing & Consumer Strategy 1 This report includes only data submitted by airlines as of the date of publication: April 18, 218. Reports