TABLE OF CONTENTS CHAPTERS. INTRODUCTION... i CHAPTER ONE: FORECAST OF AVIATION DEMAND
|
|
|
- Arthur Lane
- 5 years ago
- Views:
Transcription
1 P r e p a r e d f o r :
2 TABLE OF CONTENTS CHAPTER CHAPTERS PAGE NO. INTRODUCTION... i AIRPORT BACKGROUND... ii STUDY DESIGN... iii CHAPTER ONE: FORECAST OF AVIATION DEMAND PURPOSE AVIATION DEMAND ELEMENTS NATIONAL AND LOCAL AVIATION TRENDS FORECAST FRAMEWORK GENERAL AVIATION DEMAND FORECASTS A. REGISTERED AIRCRAFT FORECAST B. BASED AIRCRAFT FORECAST C. ANNUAL GENERAL AVIATION OPERATIONS FORECAST D. GENERAL AVIATION ENPLANEMENTS FORECASTS AIRPORT REFERENCE CODE CRITICAL AIRCRAFT AVIATION DEMAND FORECAST SUMMARY CHAPTER TWO: RUNWAY ANALYSIS INTRODUCTION SERVICE TO NATIONAL FLEET OF BUSINESS JETS FAA RUNWAY LENGTHS MODELS RUNWAY LENGTH ADJUSTMENTS AIRCRAFT PERFORMANCE ANALYSIS INSTRUMENT APPROACH PROCEDURES RUNWAY WIDTH AND RUNWAY TAXIWAY SEPARATION CONCLUSIONS AND RECOMMENDATIONS CARROLL COUNTY REGIONAL AIRPORT JUNE 2015
3 TABLE OF CONTENTS CHAPTER CHAPTERS PAGE NO. CHAPTER THREE: NOISE AND COMPATIBLE LAND USE NOISE A. EXISTING CONDITIONS (2012) B. FUTURE NO BUILD SCENARIO (2033) C. FUTURE BUILD SCENARIO (2033) COMPATIBLE LAND USE A. TALL STRUCTURES B. VISUAL OBSTRUCTIONS C. WILDLIFE AND BIRD ATTRACTANTS D. HIGH CONCENTRATIONS OF PEOPLE CHAPTER FOUR: FAA DESIGN STANDARDS REVIEW RUNWAY AND TAXIWAY SAFETY AREAS RUNWAY PROTECTION ZONES RUNWAY OBJECT-FREE AREA RUNWAY LENGTH AND WIDTH OBSTRUCTIONS A. FAR PART 77 OBSTRUCTIONS B. DEPARTURE SURFACE OBSTRUCTIONS TAXIWAY WIDTH AND FILLET STANDARDS RUNWAY INCURSION PREVENTION A. TAXIWAY AND TAXILANE DESIGN B. APRON LAYOUT NAVIGATIONAL AIDS CHAPTER FIVE: COST ESTIMATES AND FUNDING SOURCES INTRODUCTION COST ESTIMATES SUMMARY OF FUNDING SOURCES A. FAA- AIRPORT IMPROVEMENT PROGRAM (AIP) B. MARYLAND AVIATION ADMINISTRATION (MAA) C. LOCAL FUNDS D. PRIVATE INVESTMENT CARROLL COUNTY REGIONAL AIRPORT JUNE 2015
4 TABLE OF CONTENTS TABLE LIST OF TABLES PAGE NO. TABLE 1-1 FAA TERMINAL AREA FORECAST FOR DMW TABLE 1-2 SERVICE AREA SOCIOECONOMIC VARIABLES TABLE 1-3 FORECAST OF REGISTERED AIRCRAFT IN THE DMW SERVICE AREA TABLE 1-4 FORECAST OF BASED AIRCRAFT TABLE 1-5 NATIONAL FORECAST OF AIRCRAFT TYPES BY FLEET MIX TABLE 1-6 GENERAL AVIATION BASED AIRCRAFT FLEET MIX TABLE 1-7 FORECAST OF LOCAL AND ITINERANT GENERAL AVIATION OPERATIONS TABLE 1-8 LOCAL/ITINERANT OPERATIONS BREAKDOWN TABLE 1-9 FORECAST OF GENERAL AVIATION OPERATIONAL FLEET MIX TABLE 1-10 FORECAST OF GENERAL AVIATION PEAK PERIOD OPERATIONS TABLE 1-11 FORECAST OF GENERAL AVIATION ENPLANEMENTS TABLE 1-12 AIRCRAFT APPROACH CATEGORY AND AIRPLANE DESIGN GROUP TABLE 1-13 BASED TURBOJET AIRCRAFT (2013) TABLE 1-14 FORECAST SUMMARY TABLE TABLE 3-1 AIRCRAFT OPERATIONS BY CATEGORY, TABLE 3-2 AIRCRAFT OPERATIONS BY CATEGORY, TABLE 3-3 LAND USE COMPATIBILITY WITH YEARLY DAY-NIGHT AVERAGE SOUND TABLE 3-4 LAND USES REQUIRING COORDINATION WITH APP TABLE 4-1 VISIBILITY MINIMUMS TABLE 4-2 FIXED-BY-FUNCTION DESIGNATION FOR NAVAIDS - RSA AND ROFA TABLE 5-1 SHORT-TERM CAPITAL IMPROVEMENT PROJECTS TABLE 5-2 INTERMEDIATE-TERM CAPITAL IMPROVEMENT PROJECTS TABLE 5-3 LONG-TERM CAPITAL IMPROVEMENT PROJECTS CARROLL COUNTY REGIONAL AIRPORT JUNE 2015
5 TABLE OF CONTENTS LIST OF FIGURES FIGURE PAGE NO. FIGURE 1-1 SERVICE AREA REGISTERED AIRCRAFT HISTORY FIGURE 1-2 SUMMARY OF REGISTERED AIRCRAFT PROJECTIONS FIGURE PERCENT FLEET FIGURE PERCENT FLEET (TOP 25%) FIGURE 2-3 RUNWAY LENGTH REQUIREMENT FIGURE 3-1 EXISTING (2012) NOISE CONTOURS FIGURE 3-2 FUTURE (2033) NO BUILD NOISE CONTOURS FIGURE 3-3 FUTURE (2033) BUILD NOISE CONTOURS FIGURE 3-4 GENERAL ZONING MAP -CARROLL COUNTY, MARYLAND FIGURE 3-5 ZONING MAP CITY OF WESTMINSTER, MARYLAND FIGURE 4-1 HOLD APRON AT DMW FIGURE 4-2 FILLET DESIGN EXAMPLE FIGURE 4-3 ENTRANCE TAXIWAY AT DMW APPENDICES LIST OF APPENDICES APPENDIX A APPENDIX B APPENDIX C AIRPORT USER LETTERS OF SUPPORT NOISE ANALYSIS TECHNICAL APPENDIX AGENCY CORRESPONDENCE CARROLL COUNTY REGIONAL AIRPORT JUNE 2015
. Forecasts of aviation demand are a key element in all airport planning.")
6 Chapter One FORECAST OF AVIATION DEMAND Chapter One Forecast of Aviation Demand This chapter includes aviation activity forecasts for the Carroll County Regional Airport (DMW) over the 20-year planning horizon ( ). Forecasts of aviation demand are a key element in all airport planning. Ultimately, they form the basis for future demand-driven improvements at DMW; provide data used to estimate future off-airport impacts such as noise and traffic; and provide a basis for determining the type, size, and timing of aviation facility development. Consequently, these forecasts influence virtually all phases of the planning process. The Federal Aviation Administration (FAA) projects future aviation activity at airports through its Terminal Area Forecast (TAF) which forecasts aviation activity 20 years into the future and is updated annually. The general requirement for FAA approval of the Master Plan Study Forecast is that it is supported by an acceptable forecasting analysis and is consistent with the TAF. An airport sponsor may request changes to the published TAF provided sufficient justification and rationale is provided. CARROLL COUNTY REGIONAL AIRPORT JUNE 2015 PAGE 1-1
7 Chapter One FORECAST OF AVIATION DEMAND Major sections of this chapter include: Purpose Aviation Demand Elements National and Local Aviation Trends Forecast Framework General Aviation Demand Forecasts Airport Reference Code Critical Aircraft Aviation Demand Forecast Summary Forecasts were developed on an unconstrained basis for short, intermediate, and long term planning timeframes. These timeframes correspond to the following years: Short Term: Intermediate Term: Long Term: PURPOSE The aviation demand forecasts serve many purposes in the development of a master plan. These include: Facility Requirements Determination Runway Length Analysis Noise Analysis Compatible Land Use Analysis Cost Estimates/Summary of Funding Sources CARROLL COUNTY REGIONAL AIRPORT JUNE 2015 PAGE 1-2
8 Chapter One FORECAST OF AVIATION DEMAND 1.2 AVIATION DEMAND ELEMENTS Forecasts of aviation demand can be developed for numerous aviation demand elements. In the case of DMW, the primary demand elements focus on general aviation activity such as based aircraft and operations. For this study, aviation activity forecasts were prepared for the following aviation demand elements: Registered Aircraft: Defined as being either fixed or rotary wing aircraft, operated in nonairline service with a current registration. Based Aircraft: Defined as a general aviation aircraft which is stationed at an airport on a permanent basis. Forecasts were prepared for based aircraft and the based aircraft fleet mix. General Aviation Aircraft Operations: This type of operation is either a takeoff or a landing of a general aviation aircraft. Forecasts were prepared for total annual operations; local operations versus itinerant operations; operations per aircraft type; and peak period operations (i.e., monthly, daily and hourly). General Aviation Enplaned Passengers: Defined as air travelers who have boarded departing general aviation aircraft. The level of future military operations (either a takeoff or a landing of a military aircraft) is a function of Department of Defense policy and Congressional spending. Without a clear knowledge of this future policy or Congressional budget levels, it was assumed that future military operations at DMW would continue at 2013 levels. The FAA 5010 Master Record reports 90 military operations at DMW in NATIONAL AND LOCAL AVIATION TRENDS The FAA Aerospace Forecast for Fiscal Years concedes that the sluggish growth of the United States (U.S.) economy has diminished the growth potential for general aviation in the short term; however, the forecast anticipates growth in the long term as U.S. economic activity improves, especially in the turbo jet, turboprop, and turbine rotorcraft markets. The FAA projects that the active general aviation fleet will increase from 220,670 units in 2012 to 246,375 units in CARROLL COUNTY REGIONAL AIRPORT JUNE 2015 PAGE 1-3
9 Chapter One FORECAST OF AVIATION DEMAND 2033, representing an annual growth rate of 0.5 percent. The FAA further expects that the number of single and multi-engine piston aircraft will decrease during the next 20 years while turbo jet and rotorcraft aircraft will grow. This shift in the overall mix of piston-engine aircraft to turbo jet is also reflected in FAA s forecast of the number of hours flown by aircraft type. The FAA anticipates that the number of hours flown by general aviation aircraft will increase by 1.5 percent per year with turbine powered aircraft flight hours increasing 3.3 percent per year from 8,649 hours (in thousands and estimated) to 17,141 hours (in thousands) in Piston aircraft activity during this same period is expected to decrease from 14,205 hours (estimated and in thousands) in 2012 to 13,511 hours (in thousands) in Specific to DMW, Table 1-1 outlines FAA s forecast of aircraft operations and based aircraft for the period The FAA projects no growth in operations or in based aircraft throughout the entire forecast period. Year Air Carrier Operations Table 1-1: FAA Terminal Area Forecast for DMW Air Taxi/Commuter General Aviation Military Total Operations Based Aircraft , , , , , , , , , , % Change % 0% 0% 0% 0% 0% Source: FAA-TAF for DMW , Forecast Issued January Represents FAA Estimate of Actual Activity CARROLL COUNTY REGIONAL AIRPORT JUNE 2015 PAGE 1-4
10 Chapter One FORECAST OF AVIATION DEMAND 1.4 FORECAST FRAMEWORK The framework for this forecast was based upon the development of a consensus or likely set of forecasts of demand, accompanied by potential adjustments (up or down) resulting from changes to basic assumptions of the likely forecast. A 20-year forecast of aviation demand carries inherent uncertainties about the future, which grow as the timeframe extends further from the base year. For this reason, a number of projections were developed which used different methods of prediction. Some methods were based upon local socioeconomic factors; others were based on national forecasts; and others used historical trends. The benefit of using a variety of projection methods occurs when the results show a forecast consensus (i.e., if a number of projections all point in the same direction, greater confidence is gained in the resulting forecast). To achieve a forecasting consensus, all projection methods employed traditional means of extrapolating historical aviation trends at DMW or its airport service area into future time frames. The airport service area for general aviation demand was assumed to be Carroll County, Maryland. Table 1-2 presents a summary of the historical and forecast socioeconomic variables from Carroll County used in developing the general aviation forecasts for DMW. CARROLL COUNTY REGIONAL AIRPORT JUNE 2015 PAGE 1-5
11 Chapter One FORECAST OF AVIATION DEMAND Each of the three socioeconomic sectors in Table 1-2 shows growth since Most striking is the over 24 percent increase in per capita personal income (PCPI), which has grown from $36,657 in 2004 to $45,507 in Table 1-2: Service Area Socioeconomic Variables Year Population 1 Employment 1 PCPI (Income) 1, ,915 76,607 $36, ,519 80,271 $38, ,950 82,286 $40, ,390 84,557 $42, ,433 85,279 $44, ,028 82,512 $43, ,247 81,836 $43, ,288 83,126 $45,507 % Change % 8.5% 24.1% Forecast ,680 84,897 $47, ,454 86,232 $48, ,560 92,140 $54, ,820 96,580 $59, , ,300 $71,606 % Change % 20.5% 52.3% Source: 1 Regional Economic Information System (REIS) U.S. Department of Commerce, Bureau of Economic Analysis, September 2013 for Historical Data 2 Population and employment projections from Maryland Department of Planning, March & June 2012; Delta Airport Consultants, Inc. projections for PCPI 3 PCPI Per Capita Personal Income As mentioned previously, several specific forecasting methods were used for the different aviation demand elements. These forecasting methods are described in more detail below: CARROLL COUNTY REGIONAL AIRPORT JUNE 2015 PAGE 1-6
12 Chapter One FORECAST OF AVIATION DEMAND Market Share Projection: Market share projections are developed by calculating historical shares of activity at DMW and projecting these respective shares into future time frames. This method of projection reflects demand based upon trends occurring in the service area and the entire U.S. Market share projections reflect historical trends and may include static (constant) or dynamic (increasing or decreasing) future market shares. It is essentially a top-down method of forecasting where other forecasts of activity for larger areas are used as drivers of the local share of that demand. Socioeconomic and per capita projections, on the other hand, are considered bottom-up methodologies and are based upon local factors. Socioeconomic Regression Analysis: Socioeconomic regression projections are based upon an assumed causal relationship between population, income, or employment and the aviation activity in a particular area. This projection of demand is obtained by relating socioeconomic data via regression analysis to aviation activity. The resulting set of regression equations, coupled with independent projections of future socioeconomic data, produces a projection of aviation activity. This forecast utilized population, PCPI, and employment statistics as the independent socioeconomic variables. Data from the U.S. Department of Commerce, Bureau of Economic Analysis were used to establish historical trends. Projections of population and employment through 2033 were obtained from the Maryland Department of Planning. PCPI projections were created using a separate regression analysis. The resulting PCPI projections indicate an Average Annual Growth Rate of 2.02 percent through 2033, compared to the historical Annual Average Growth Rate of 3.14 percent. Socioeconomic Regression Analysis was used in forecasting general aviation registered aircraft. Trend Analysis: Trend projections use historical data to formulate predictions of future activity. For this study, two trend analysis methods were used to project aviation activity: double exponential smoothing and least squares linear trending. CARROLL COUNTY REGIONAL AIRPORT JUNE 2015 PAGE 1-7
13 Chapter One FORECAST OF AVIATION DEMAND The double exponential smoothing process produces projections by combining the forecast for the previous period with an adjustment for past errors. It is desirable to correct for past errors when the error has resulted from changes in the trend. In this case, correcting for past errors will enable the development of a more realistic forecast. Double exponential smoothing is appropriate when the time series contains a linear trend. It acts by calculating two smoothed series - a single and a double smoothed value. Both will lag behind any trend. However, the difference between them indicates the size of the trend. This difference is used to adjust the forecast for the trend. The second trend method used was least squares linear trending. This method uses aviation activity regressed against time to produce a projection. No assumptions about the causes of trends are included in the trending methodology. 1.5 GENERAL AVIATION DEMAND FORECASTS The forecasts of general aviation demand which have been developed for DMW are listed below and are presented in the following sections: A) Registered Aircraft Forecast B) Based Aircraft Forecast - Based Aircraft Fleet Mix C) Annual General Aviation Operations Forecast - Local versus Itinerant - General Aviation (GA) Operational Fleet Mix - GA Operational Peaking Characteristics D) General Aviation Enplanements CARROLL COUNTY REGIONAL AIRPORT JUNE 2015 PAGE 1-8
14 Number of Aircraft Chapter One FORECAST OF AVIATION DEMAND A) Registered Aircraft Forecast A registered aircraft is defined as being either fixed or rotary wing, operated in non-airline service with a current registration. The number of aircraft based at DMW is dependent, in part, upon the nature and magnitude of aircraft ownership in the service area surrounding the airport. As mentioned, the airport service area for general aviation users is Carroll County, Maryland. Historical information used to develop the registered aircraft forecast is based on aircraft information by type for the service area on an annual basis. Figure 1-1 presents a graphic illustration of the service area's registered aircraft growth trends since The historical number of registered aircraft in Carroll County has increased by approximately 15 percent since 2004, from 141 to 162 in Figure 1-1: Service Area Registered Aircraft History Year Source: Avantext data; FAA registered aircraft database CARROLL COUNTY REGIONAL AIRPORT JUNE 2015 PAGE 1-9
15 Chapter One FORECAST OF AVIATION DEMAND To arrive at an acceptable forecast of service area registered aircraft, eight projections were made using market share, socioeconomic regression and trend analysis methodologies. Table 1-3 presents a summary of the projections for registered aircraft demand in the service area. Market Share Projection: The Constant Market Share Projection of demand predicts the number of registered aircraft if the service area keeps pace with the anticipated national growth in registered aircraft. The Constant Market Share for the DMW service area yields a total of 181 registered aircraft by the year 2033 representing a 0.56 percent increase per year and 19 additional aircraft. The Dynamic Market Share Projection of demand examines historical market shares and develops a linear trend of these market shares to generate the projection of 243 registered aircraft by the year 2033, which represents a 2.05 percent increase per year and yields a net increase of 81 aircraft over the planning period. Socioeconomic Regression: The Socioeconomic Regression Projections included employment and income statistics from the service area. These projections resulted from the regression analyses between each indicator and registered aircraft in the service area from 2004 through Both of these projections showed positive growth throughout the planning period, forecasting 211 (employment) and 213 (income) based aircraft at DMW in Trend Analysis: The Trend Analysis Projections, similar to the Socioeconomic Regression Projections, examined the historical trend of registered aircraft. The Trend Analysis methodology projected growth using Linear Trend Analysis (least squares) and Double Exponential Smoothing Analysis. Since the historical trend is upward, both the linear trend projection and the exponential smoothing projection show an increase in service area registered aircraft over the period, forecasting 216 and 225 based aircraft, respectively, in CARROLL COUNTY REGIONAL AIRPORT JUNE 2015 PAGE 1-10
16 Chapter One FORECAST OF AVIATION DEMAND Derived Projections: Derived Projections are simply derivatives of the other existing projections. As its name implies, the High/Low Average is the average of the highest and lowest projections. The Multiple Average is the average of all projections. Both of these derived projections were well above the Constant Market Share projection, meaning that the service area is anticipated to grow faster than the U.S. trend. If historical growth is any indicator of future growth, Carroll County should outpace the U.S. market. Since 2005, the County has added 27 registered aircraft, which is significantly higher than the 19 additional registered aircraft in 2033 predicted by the Constant Market Share projection method. Market Share Table 1-3: Forecast of Registered Aircraft in the DMW Service Area Projection Forecast Base % Change Constant % Dynamic % Socioeconomic Employment % Income % Trend Analysis Linear Trend % Exponential Smoothing % Derived Projection High/Low Average % Multi-Average % Selected % Forecast Source: Delta Airport Consultants, Inc. analysis CARROLL COUNTY REGIONAL AIRPORT JUNE 2015 PAGE 1-11
17 Registered Aircraft Chapter One FORECAST OF AVIATION DEMAND As illustrated in Figure 1-2, all other projections produced 2033 forecasts which are significantly higher than the Constant Market Share, and which are significantly lower than the Dynamic Share. To diminish the influence of these projections, the Multiple Average projection was selected as the preferred registered aircraft forecast. As this is the average of all projections, this forecast better represents the mid-range. The preferred forecast of registered aircraft shows a growth from 162 in 2013 to 215 in 2033, an overall growth of over 32 percent Figure 1-2: Summary of Registered Aircraft Projections Constant Dynamic Employment Income Linear Trend Exp Smoothing High/Low Average Multi-Average Year Source: Delta Airport Consultants, Inc. analysis B) Based Aircraft Forecast A based aircraft is a general aviation aircraft that is stationed at an airport. The based aircraft population at DMW was projected using market share methodology that relied on the forecast of registered aircraft as the "market" and DMW based aircraft as the "share." To generate the historical data for based aircraft, the FAA Form 5010 Master Record and discussions with airport management concerning any new aircraft basing activity were used. As shown in Table 1-4, a CARROLL COUNTY REGIONAL AIRPORT JUNE 2015 PAGE 1-12
18 Chapter One FORECAST OF AVIATION DEMAND constant market share projection was used to forecast based aircraft at DMW. This forecast employed the 2013 market share of 56.2 percent throughout the future periods. Table 1-4: Forecast of Based Aircraft Year Service Area Registered Aircraft DMW Based Aircraft Market Share 2012 (Base) % % Forecast % % % Source: Delta Airport Consultants, Inc. analysis Although FAA TAF shows a no-growth, straight-line projection of 97 based aircraft over the planning horizon (see Table 1-1), the Market Share forecast shows a growth from the current 91 based aircraft in 2013 to 121 in The difference between the TAF and this Market Share forecast can be explained by the strong socioeconomic activity in the County and at the Airport. In 2013 alone, for example, two additional based jets were recorded at DMW. Based Aircraft Fleet Mix An aircraft fleet mix refers to the characteristics of a population of aircraft. General aviation aircraft are classified with regard to specific physical traits such as aircraft type (whether fixed wing or rotorcraft), weight, and number and type of engines. Fleet mix categories include: singleengine, multi-engine, turbojet, rotorcraft, and "other, which could include gliders and lighterthan-air vehicles. Projection of the fleet mix at DMW involved the consideration of the effects of the national trends in aircraft manufacturing, and the service area registered aircraft fleet mix. Table 1-5 presents the national forecasts of fleet mix from the FAA Aerospace Forecast for Fiscal Years CARROLL COUNTY REGIONAL AIRPORT JUNE 2015 PAGE 1-13
19 Chapter One FORECAST OF AVIATION DEMAND Table 1-5: National Forecast of Aircraft Types By Fleet Mix Year Single-Engine Multi-Engine Turbojet Rotorcraft Other Total ,288 22,903 12,230 10,995 5, , ,898 23,153 14,420 12,815 5, , ,524 23,301 16,895 14,590 5, , ,700 23,955 24,620 18,555 5, ,375 % in % 10.36% 5.53% 4.97% 2.56% 100% % in % 9.72% 9.99% 7.53% 2.25% 100% % change in share % -0.64% 4.46% 2.56% -0.31% - Source: FAA Aerospace Forecasts for Fiscal Years Throughout the planning period, turbojet aircraft are anticipated to make up a larger portion of the national aircraft fleet, from 5.53 percent in 2013 to 9.99 percent in 2033; while the fleet mix shares of both single-engine and multi-engine aircraft will shrink (see Table 1-5). Despite a projected decrease in fleet share of 6.07 percent, single-engine aircraft will continue to represent the largest component of the national aircraft fleet. As depicted in Table 1-4, the total number of based aircraft at DMW is expected to grow from 91 to 121 over the forecast period. Correspondingly, operational fleet mix changes are also anticipated at DMW as a result of new aircraft replacing aircraft that are retired or sold. While the total number of aircraft increases, the based fleet at DMW is anticipated to mimic the national fleet mix trends and move toward a more sophisticated, larger, business-type aircraft mix. Table 1-6 presents the forecast of based aircraft fleet mix anticipated for DMW. As shown, the predominance of single-engine aircraft will continue throughout the planning period. Turbojets and rotorcraft are expected to constitute a greater percentage share of the overall fleet mix at DMW in 2033, consistent with national trends. CARROLL COUNTY REGIONAL AIRPORT JUNE 2015 PAGE 1-14
20 Chapter One FORECAST OF AVIATION DEMAND Table 1-6: General Aviation Based Aircraft Fleet Mix at DMW Single- Multi- Year Turbojet Rotorcraft Other Total Engine Engine % in % 13.19% 4.40% 1.10% 0.00% 100% % in % 14.05% 9.92% 2.48% 0.00% 100% % change in share % 0.86% 5.52% 1.38% 0.00% - Source: FAA Aerospace Forecasts for Fiscal Years FAA Form , Airport Master Record - September 2013 Delta Airport Consultants, Inc. analysis C) Annual General Aviation Operations Forecast An aircraft operation is defined as either a takeoff or a landing (i.e., a takeoff and landing are considered two operations.) Local versus Itinerant Local operations are performed by aircraft that operate within the local traffic pattern or within sight of the airport. They can also be assigned to aircraft arriving or departing from local practice areas within 20 miles of the airport. In essence, local operations are associated with pilot training. Itinerant operations are all other aircraft operations other than local operations. FAA 5010 Master Record data for DMW reports that local operations consist of 74 percent of operations while itinerant operations consist of 26 percent of total operations at DMW; these percentages are anticipated to remain the same through the planning period. The forecast for annual general aviation operations was derived for both local and itinerant operations through the use of the operations-per-based-aircraft (OPBA) ratio. The OPBA for the base year (2012) applied to the forecast of based aircraft in order to determine the forecasted total CARROLL COUNTY REGIONAL AIRPORT JUNE 2015 PAGE 1-15
21 Chapter One FORECAST OF AVIATION DEMAND operations. Table 1-7 presents the forecast of total general aviation operations, as well as the forecasted breakdown of local and itinerant operations, at DMW. Year Table 1-7: Forecast of Local and Itinerant General Aviation Operations at DMW Based Aircraft Local Ops Local OPBA Itinerant Ops (GA & Air Taxi) Itinerant OPBA Total Ops Total OPBA Base , , , Forecast , , , , , , , , , , , , % change Source: Historical operation data from FAA 5010, Airport Master Record Forecast from Delta Airport Consultants, Inc. analysis 32.97% Growth in the overall level of general aviation operations is expected to occur as a natural outgrowth in the number of based aircraft and business and corporate use of DMW. The results of the general aviation operations forecast show a growth from 36,000 operations in 2012 to 44,407 operations in 2033, which represents an increase of percent over the planning period. Table 1-8 presents the local/itinerant operations breakdown for the planning period. For purposes of this analysis, itinerant operations are further divided into general aviation and air taxi. CARROLL COUNTY REGIONAL AIRPORT JUNE 2015 PAGE 1-16
22 Chapter One FORECAST OF AVIATION DEMAND TOTAL OPERATION S General Aviation General Aviation Table 1-8: Local/Itinerant Operations Breakdown for DMW Base 2012 Forecast % Change ,000 33,397 35,966 38,535 44, % Local Operations 26,625 24,714 26,615 28,516 32, % Itinerant Operations 8,875 8,183 8,851 9,519 11, % Air Taxi % Source: Delta Airport Consultants, Inc. analysis CARROLL COUNTY REGIONAL AIRPORT JUNE 2015 PAGE 1-17
23 Chapter One FORECAST OF AVIATION DEMAND General Aviation (GA) Operational Fleet Mix The operational fleet mix forecast presents a breakdown of aircraft operations by aircraft type using the operations forecast outlined in Table 1-7. Table 1-9 presents the forecast of operational fleet mix for general aviation users at DMW. While single-engine aircraft activity is expected to continue to represent the majority of aircraft operations for DMW during this period, the percentage growth rates for turbojet and rotorcraft are expected to significantly eclipse piston aircraft growth activity. The operational fleet mix forecasts for multi-engine and rotorcraft-type aircraft were derived by multiplying the based aircraft fleet mix (see Table 1-6) by the forecasted OPBA (see Table 1-7). The operational fleet mix forecast for turbojet aircraft was found by applying the growth rate of historical turbojet operations and extrapolating from the base year. After subtracting these forecasted operations from total operations, the remaining operations were assumed to be by single-engine aircraft. Year Base Table 1-9: Forecast of General Aviation Operational Fleet Mix at DMW Single- Engine Multi- Engine Turbojet 1 Rotorcraft Other Total ,109 5, ,000 Forecast ,680 4, , ,037 4,771 1, , ,672 5,138 1, , ,603 6,239 3,464 1, ,407 % Change % 41.67% % % % Source: 1 Flightwise data used for historical turbojet operations. Projections based on airport fleet mix and declining training activity for single engine aircraft. CARROLL COUNTY REGIONAL AIRPORT JUNE 2015 PAGE 1-18
24 Chapter One FORECAST OF AVIATION DEMAND GA Operational Peaking Characteristics An important measure of airport activity is periodic peaking. Forecasts were developed for peak month, design day, and design hour. Ideally, a comprehensive historical data pool should be analyzed to determine the peaking characteristics. As DMW is a non-towered airport, this data was not available. The alternative approach taken in developing these activity descriptions is outlined below: Peak Month: Peak month operations are calculated assuming that the peak month is 10 percent busier than the average month (annual operations/12x110%). Average Day: Average peak day operations are defined as the average day during the peak month. It is calculated by dividing the peak month by 30. Peak Hour: Peak Hour operations represent the highest number of operations during the busiest hour of an average day during a peak month. Peak hour operations are assumed to be 15 percent of the average peak day. Table 1-10 presents the forecast of peak hour and peak month operations at DMW. Base Year Table 1-10: Forecast of General Aviation Peak Period Operations at DMW Annual Operations Peak Month Operations Peak Day Operations Peak Hour Operations ,000 3, Forecast ,397 3, ,966 3, ,535 3, ,407 4, Source: Delta Airport Consultants, Inc. analysis CARROLL COUNTY REGIONAL AIRPORT JUNE 2015 PAGE 1-19
25 Chapter One FORECAST OF AVIATION DEMAND D) General Aviation Enplanements Forecasts of annual general aviation enplaned passengers can be used by airport management and FBOs to determine the need for such landside facilities as the general aviation terminal building sizes and the amount of automobile parking areas and access roads. GA enplanements include those persons traveling for corporate/business reasons, air charters, air taxis, and other transient departures. The Aircraft Owners and Pilots Association (AOPA) estimates that an average of passengers per general aviation departure is a reasonable estimate of GA aircraft occupancy. For this study, this factor was applied to all forecast GA departures. As mentioned previously, one operation equals either one takeoff or one landing; therefore the operations figures from Table 1-7 were divided in half in order to determine the number of departures. Table 1-11 presents a forecast of total general aviation enplanements at DMW. Table 1-11: Forecast of General Aviation Enplanements at DMW Year Enplanements-Per- Departure Total Departures Total Enplanements ,000 45,000 Forecast ,699 41, ,983 44, ,268 48, ,204 55,509 Source: Delta Airport Consultants, Inc. analysis 1 Source: CARROLL COUNTY REGIONAL AIRPORT JUNE 2015 PAGE 1-20
26 Chapter One FORECAST OF AVIATION DEMAND 1.6 AIRPORT REFERENCE CODE Runway design is based in part on the airport reference code (ARC) for the runway under study. The FAA uses the ARC to relate airport design criteria to the operational and physical characteristics of the airplane types that will operate at a particular airport. The ARC has two components relating to the airport design aircraft. The first component, depicted by a letter, is the aircraft approach category and relates to aircraft approach speed (operational characteristic). The aircraft approach category is a grouping of aircraft based on 1.3 times their stall speed in their landing configuration at their maximum certificated landing weight. The second component, depicted by a Roman numeral, is the airplane design group and relates to airplane wingspan or tail height (physical characteristics), whichever is the most restrictive. The airplane design group is a grouping of airplanes based on wingspan or tail height. Where an airplane is in two categories, the most demanding category should be used. The ARC represents a basis for planning as it influences the type and extent of facility design on an airfield. Table 1-12 denotes the aircraft approach category and airplane design group. Table 1-12: Aircraft Approach Category and Airplane Design Group Aircraft Approach Category Aircraft Approach Approach Speed Category Group # A Less than 91 knots I B C D 91 knots or more but less than 121 knots 121 knots or more but less than 141 knots 141 knots or more but less than 166 knots II III IV E 166 knots or more V Source: AC 150/ A VI Airplane Design Group Tail Height (ft [m]) < 20 (< 6m) 20 - < 30 (6m- < 9m) 30 - < 45 (9m - < 13.5m) 45 - < 60 (13.5m 18.5m) 60 - < 66 (18.5m - < 20m) (20m - < 24.5m) Wingspan (ft [m]) < 49 (<15m) 49 - <79 (15m- < 24 m) 79 - < 118 (24m - < 36m) < 171 (36m - < 52m) < 214 (52m - < 65m) < 262 (65m - < 80m) CARROLL COUNTY REGIONAL AIRPORT JUNE 2015 PAGE 1-21
27 Chapter One FORECAST OF AVIATION DEMAND 1.7 CRITICAL AIRCRAFT The determination of the future critical aircraft at DMW is necessary in order to establish the airport reference code (ARC) for DMW. The critical aircraft is defined as the aircraft or family of aircraft with the largest wingspan and highest approach to landing speed that uses the airport on a regular basis. The FAA defines regular basis as more than 500 itinerant operations per year. In some cases, the critical aircraft may be two different aircraft, where one aircraft establishes design criteria based on the largest wingspan and another establishes design criteria based on the highest approach to landing speed. The first step in identifying the critical aircraft is to review the jet aircraft currently based at the airport. Table 1-13 lists the based turbojet aircraft at DMW. Table 1-13: Based Turbojet Aircraft (2013) at DMW AIRCRAFT QUANTITY Canadair Challenger Cessna Citation XL 1 Dassault Falcon Embraer Phenom Source: DMW Local Records, 2013 Skytech, Inc. serves as the Fixed Base Operator (FBO) for DMW and serves a variety of jet aircraft operators, including the Phenom 300 and the Challenger 605 based at DMW. As indicated in the accompanying letter from Vice-President David Conover (see Appendix A), Skytech provides a broad range of maintenance and repair services to its DMW turbojet and turboprop customers. In addition, Skytech s affiliations with fractional owner/operator firms such as Flight Options and Flex Jets introduce transient aircraft operations to DMW that include Hawker 800s and Lear Jets. NetJets also operates Gulfstream 450 and Hawker 800 aircraft at DMW. Although demand for this class of aircraft remains high among their clients, Al Ball, NetJets Manager of Operational Analysis, notes that the existing runway length often prevents operations except during dry runway conditions. Skytech also highlighted the need for client aircraft to divert to an alternate airport CARROLL COUNTY REGIONAL AIRPORT JUNE 2015 PAGE 1-22

28 Chapter One FORECAST OF AVIATION DEMAND when the runway surface is contaminated. More detail regarding recommended runway length is provided in Chapter Two of this document. The 2007 DMW Master Plan noted the existing critical design aircraft as the Gulfstream III which represents an approach Category C and design Group II aircraft. The 2007 DMW Master Plan and associated Airport Layout Plan (ALP) also identified the Gulfstream V as the future critical aircraft indicating the need to accommodate design Group III in future airport development. Since that time, the anticipated flight operations of the Gulfstream V have not occurred and examination of the current and forecasted operational data indicates the current and future design criteria should remain Group II. While Group II operations at DMW consistently exceed 500 annually, the review of the Flightwise data ( ) indicated no Group III operations occurred. The critical family of aircraft for DMW during the current planning period ( ) therefore is the medium-size business jet, similar to the based Challenger 605 aircraft. Aircraft such as the Challenger are approach Category C aircraft, and design Group II. G450 and two Challenger 300s at DMW. Photo taken May 2013 CARROLL COUNTY REGIONAL AIRPORT JUNE 2015 PAGE 1-23
29 Chapter One FORECAST OF AVIATION DEMAND 1.8 AVIATION DEMAND FORECAST SUMMARY Table 1-14 presents a summary of the forecasts of aviation demand for DMW. As shown, based aircraft are anticipated to grow from 91 to 121 by the year Aircraft operations are projected to grow at a compound annual growth rate of 1.43 percent over the 20 year planning period. Turbojet operations are forecast to grow at a compound annual growth rate of 6.7 percent over the same period. Service Area Registered Aircraft 2012 (Base) Table 1-14: Forecast Summary for DMW Forecast Forecast of General Aviation CAGR % Based Aircraft % Single-Engine % Multi-Engine % Turbo Jet % Rotorcraft % Operations 36,000 33,397 35,966 38,535 44, % Local 26,625 24,714 26,615 28,516 32, % Itinerant 9,375 8,683 9,351 10,019 11, % Operations by Aircraft Type Single-Engine 29,109 27,680 29,037 30,672 33, % Multi-Engine 5,510 4,404 4,771 5,138 6, % Turbo Jet ,424 1,991 3, % Rotorcraft , % Military % Peak Hour Operations Enplaned Passengers % 45,000 41,746 44,958 48,169 55, % 1 Military operations forecasts were not conducted and are listed for reference only. CARROLL COUNTY REGIONAL AIRPORT JUNE 2015 PAGE 1-24
.")
30 Chapter Two RUNWAY ANALYSIS Chapter Two Runway Analysis This section evaluates the runway length and width based on the existing and future aircraft expected to use the Carroll County Regional Airport (DMW). The recommendations are based on FAA advisory circulars (AC), specific manufacturers aircraft performance data, and runway use limitations placed on fractional owner and on-demand operations such as Title 14 of the Code of Federal Regulations (14CFR) Part 91K and Part 135. The section also examines the instrument approach procedures currently published for DMW and the improved minimums or additional procedures necessary to enhance safe and efficient all-weather operating capability. 2.1 INTRODUCTION The determination of runway length and width required for an airport is based on standards presented in Chapter Three of FAA AC 150/ A (AC-13A), Airport Design and FAA AC 150/5325-4B, Runway Length Requirements for Airport Design. AC-13A notes that the runway should be long enough to accommodate arrival and departure requirements for the design aircraft. CARROLL COUNTY REGIONAL AIRPORT JUNE 2015 PAGE 2-1
31 Chapter Two RUNWAY ANALYSIS All aircraft operational considerations, to include the takeoff, landing, and accelerate stop distances, and obstacle clearance, need to be considered when determining runway length. Additional factors considered include the design aircraft approach speed, its maximum certificated take-off weight, useful load and length of haul, the airport s field elevation above sea level, the mean daily maximum temperature at the airfield, and runway surface conditions, such as wet and slippery. 2.2 SERVICE TO NATIONAL FLEET OF BUSINESS JETS The initial analysis of recommended runway length for DMW is based on performance curves developed from FAA-approved airplane flight manuals in accordance with Federal Aviation Regulations. Guidance on runway length analysis is provided in AC 150/5325-4B, Runway Length Requirements for Airport Design. Tables 3-1 and 3-2 of the AC (see Figures 2-1 and 2-2) provide a listing of aircraft identified by the FAA to comprise 75 percent and 100 percent of the national fleet of business jets, respectively. A majority of the aircraft (13 of 19) within the top 25 percent tier of the national business jet fleet is served by DMW; these aircraft are noted by arrows on Figure 2-2. As documented in Chapter One, the Challenger series aircraft from the top 25 list is also based at DMW. Additionally, fractional jet operators and aircraft management firms such as NetJets, Flex Jets, and Flight Options operate aircraft from the top 25 list at DMW, including the Hawker 800, Gulfstream, and Citation series. These firms operate primarily under 14CFR Part 135, and consequently, are subject to Part , Landing Limitations: Destination Airports (commonly referred to as the 60 Percent Rule ). This regulation requires that the arriving turbojet aircraft must be able to land within 60 percent of the effective runway length, or if the runway is wet and slippery, the effective runway length must be at least 115 percent of the runway length required for that specific aircraft operation. CARROLL COUNTY REGIONAL AIRPORT JUNE 2015 PAGE 2-2
32 Chapter Two RUNWAY ANALYSIS Given the based and transient jets operating at DMW from the FAA 100 percent fleet list, the 100 percent fleet table should be used for determining baseline runway length requirements. CARROLL COUNTY REGIONAL AIRPORT JUNE 2015 PAGE 2-3
33 Chapter Two RUNWAY ANALYSIS Figure Percent Fleet CARROLL COUNTY REGIONAL AIRPORT JUNE 2015 PAGE 2-4
34 Chapter Two RUNWAY ANALYSIS Figure 2-2 Remaining 25 Percent Airplanes in 100 Percent Fleet CARROLL COUNTY REGIONAL AIRPORT JUNE 2015 PAGE 2-5
35 Chapter Two RUNWAY ANALYSIS 2.3 FAA RUNWAY LENGTH MODELS Having defined 100 percent of the fleet as appropriate for the DMW analysis, the useful load factor of these aircraft is also considered. The mean daily maximum temperature (85 F) and the airfield elevation (789 MSL) are used in Figure 2-3 to determine a runway length requirement of approximately 5,400 feet for the 60 percent useful load. For purposes of this analysis, the term useful load refers to the difference between the maximum allowable structural gross weight and the operating empty weight of the aircraft in question. The 60 percent table is used in this analysis to establish a baseline recommended length of 5,400 feet and is supplemented with adjustments from FAA guidance and specific operator detail later in this study. 2.4 RUNWAY LENGTH ADJUSTMENTS The runway length obtained from Figure 2-3 is based on no wind, a dry runway surface, and a zero effective runway gradient. As such, and as stated in FAA AC 150/4325-4B, the obtained runway length is to be increased to account for (1) takeoff operations when the effective runway gradient is other than zero and (2) landing operations of turbojet powered airplanes under wet and slippery runway surface conditions. The increase is not cumulative since the first length adjustment applies to takeoffs and the latter to landings. After both adjustments have been independently applied, the greatest resultant length becomes the recommended runway length. CARROLL COUNTY REGIONAL AIRPORT JUNE 2015 PAGE 2-6
36 Chapter Two RUNWAY ANALYSIS a CARROLL COUNTY REGIONAL AIRPORT JUNE 2015 PAGE 2-7
37 Chapter Two RUNWAY ANALYSIS In consideration of wet and slippery conditions during landing operations, AC 150/5325-4B requires the runway length for turbojet-powered airplanes obtained from the 60 percent useful load curve to be increased by 15 percent, or up to 5,500 feet, whichever is less. Thus in the case of DMW, the length of 5,400 feet noted above is increased to a recommended length of 5,500 feet. 2.5 AIRCRAFT PERFORMANCE ANALYSIS General aviation (GA) airports such as DMW continue to experience an increase in use by business jets as corporations satisfy their executives needs for flexibility in scheduling, speed, and privacy. As of February 2014, DMW had four based turbojets including a Canadair Challenger 605, a Dassault Falcon 2000, a Cessna Citation XL, and an Embraer Phenom 300. As discussed in Chapter One, the number of based business jets is forecast to grow to 12 by 2033, and during the same period, the number of annual turbojet operations is forecast to increase from 946 to 3,464. In reviewing the runway length requirements produced from the performance charts and runway length adjustments, the existing useable primary runway length of 5,100 feet was found to be inadequate to accommodate the turbojet fleet currently operating at DMW. Information from based and transient jet operators was solicited to document their operational needs: Skytech, Inc., which provides FBO services at DMW, expressed customer s concerns that the current runway length is inadequate to support their operational needs during inclement weather conditions. The most critical operational limitation experienced has been the reduction of useful load capability. Mr. Dave Conover, Vice-President for Skytech, notes that this limitation has required existing and potential clients to operate from Martin State Airport or Harrisburg rather than DMW due to passenger and fuel loading requirements. Letters of support for the runway project from Skytech are attached as Appendix A. Skytech also maintains affiliations with fractional jet operators such as Flight Options and Flex Jets as an FAA Certified Repair Station. Mr. Conover noted that the runway extension is critical to Skytech s continued growth in this business segment at DMW. CARROLL COUNTY REGIONAL AIRPORT JUNE 2015 PAGE 2-8
38 Chapter Two RUNWAY ANALYSIS TTi Aviation, LLC, has two jets based at DMW; a Citation XL and a Falcon 2000 EX. Mr. Steve Brodie, Chief Pilot/Aviation Manager for TTi Aviation, noted that the existing runway length is inadequate to support their operations year round and specifically during any contaminated runway conditions. A letter of support for the runway project from TTi Aviation is included in Appendix A. As noted previously in this chapter, the existing 5,100 feet runway length is inadequate to accommodate the existing and future turbojet operations at DMW. The 60 percent useful load, plus adjustments, results in a recommended length of 5,500 feet. 2.6 INSTRUMENT APPROACH PROCEDURES Generally, Runway 16 is the preferred approach during instrument meteorological conditions at DMW due to wind direction. Therefore, the instrument approach procedures for Runway 16 are a key element in maintaining airport operational efficiency in all-weather conditions. There is currently an RNAV (GPS) instrument approach to Runway 16 with established LPV minima of 1081 MSL (292 feet AGL) and one mile visibility. It is recommended the County improve approach minima for the existing RNAV (GPS) with reduction of visibility to less than 3/4 mile with installation of a Medium Intensity Approach Lighting System with Runway Alignment Indicator Lights (MALSR). This reduction in visibility requires additional separation between the runway and existing parallel taxiway. FAA design guidance specifies 400 feet separation between runway and taxiway, which requires relocation of the existing runway. This required relocation is depicted on the currently approved Airport Layout Plan (ALP). FAA guidance since the 2007 Master Plan requires a review of land uses within the Runway Protection Zone (RPZ) including roadways. This review of land uses within the proposed RPZ (after the runway has been relocated) is presented in Chapter Three. The approved ALP also depicts installation of an Instrument Landing System (ILS) comprised of glideslope and localizer. Recent technological advancements in satellite navigation now support CARROLL COUNTY REGIONAL AIRPORT JUNE 2015 PAGE 2-9
39 Chapter Two RUNWAY ANALYSIS minimums for GPS approach procedures as low as can be achieved with the much more expensive, ground based ILS. As such, discussions with the County during the scope of this Study have indicated their desire to eliminate the proposed ILS and pursue visibility minima reduction to less than ¾ mile with the existing RNAV (GPS) approach. There are currently two instrument approach procedures to Runway 34, an RNAV (GPS) and a VOR approach. The RNAV (GPS) offers LPV minima as low as 988 MSL (200 feet AGL) and one mile visibility and the VOR offers minima as low as 1480 MSL (692 feet AGL) and one mile visibility. It is recommended that the County pursue approach minima for the existing RNAV (GPS) with reduction of visibility to not lower than 3/4 mile. 2.7 RUNWAY WIDTH AND RUNWAY-TAXIWAY SEPARATION Runway width is specified within FAA AC 150/ A based on the Runway Design Code (RDC). The design standard width for a C-II runway such as DMW is 100 feet for all specified visibility minimums, and thus a width of 100 feet should be provided throughout the planning period. As stated in Section 2.6, the recommended improvement in approach minima will require an increase in the runway-centerline to taxiway-centerline separation distance, per design standards in AC 150/ A. The existing separation between the runway and parallel Taxiway A is 300- feet which satisfies design standards for a C-II runway with approach minima not lower than one mile. As the approach minima for the existing RNAV (GPS) are reduced to lower than ¾ mile, the separation distance required by AC 13A increases to 400-feet, requiring the relocation of the existing runway 100-feet to the west. The relocation is recommended to occur toward the west because the majority of airfield facilities are located east of the runway. Relocating the runway to the east would encroach on the existing terminal area and diminish the available facilities at DMW. CARROLL COUNTY REGIONAL AIRPORT JUNE 2015 PAGE 2-10
40 Chapter Two RUNWAY ANALYSIS 2.8 CONCLUSIONS AND RECOMMENDATIONS In conclusion, this section has demonstrated the need to provide a runway length at DMW beyond the existing 5,100 feet consistent with FAA guidance. This need is supported by identification of the family of medium size business jets as the critical design aircraft (represented by the Challenger 605) as well as several other factors including: Service to the 100 percent fleet of U.S. business jets; Runway length determination for the 100 percent fleet; and Letters of support from both based and transient users. Runway length determination for the 100 percent fleet for 60 percent useful load produced a recommended runway length of 5,400 feet. It is important to recognize that this length from the FAA tables (Tables 3-1 and 3-2 from the AC 150/5325-4B) does not account for wind, runway condition, or effective runway gradient. Correspondence from DMW jet operators is provided as attachments. Based on this analysis, it is recommended that a runway length of 5,500 feet be considered as the critical length requirement and be used as the basis for primary runway planning at DMW during the planning period. It is further recommended that the County retain the 6,400 foot runway length depicted on the current ALP as conceptual development for the ultimate phase beyond the 20-year planning period of this study. It is also recommended that instrument approach procedures be achieved as depicted on the currently approved ALP with minimums less than 3/4 mile visibility for Runway 16 (including installation of a MALSR) and not lower than 3/4 mile visibility for Runway 34. Achievement of these recommendations, consistent with FAA design guidance, requires relocation of the existing runway to the west to provide adequate separation from the parallel taxiway. The relocation also allows the County to achieve the desired reduction in instrument approach minimums and establish associated RPZ s free of incompatible land uses. CARROLL COUNTY REGIONAL AIRPORT JUNE 2015 PAGE 2-11
41 Chapter Two RUNWAY ANALYSIS Blast pads are also recommended to be constructed at each runway end to mitigate erosion due to the forecasted increase of jet traffic. CARROLL COUNTY REGIONAL AIRPORT JUNE 2015 PAGE 2-12
 and discusses land use compatibility issues related to the Airport and the proposed development. 3.")
, which was developed to measure sounds with more emphasis on frequencies that can be heard by the human")
42 Chapter Three NOISE AND COMPATIBLE LAND USE Chapter Three Noise and Compatible Land Use This chapter evaluates the airport noise contours developed for both the base year (2012) and forecast year (2033) and discusses land use compatibility issues related to the Airport and the proposed development. 3.1 NOISE Noise, defined as undesirable sound, is typically the most significant off-airport environmental impact associated with aircraft operation. Noise is measured in decibels (db). Aircraft sound levels are quantified for single events using the A-weighted decibel scale (dba), which was developed to measure sounds with more emphasis on frequencies that can be heard by the human ear. The Federal Aviation Administration (FAA) specifies metrics to be used in measuring aircraft noise. The metric used in this analysis is the Day Night Average Sound Level (DNL or Ldn). DNL CARROLL COUNTY REGIONAL AIRPORT JUNE 2015 PAGE 3-1
43 Chapter Three NOISE AND COMPATIBLE LAND USE is the average cumulative sound level that provides a measure of the total sound energy during a 24-hour period. A 10-decibel (db) weighting penalty is added to aircraft noise occurring during the nighttime hours (between 10:00 pm and 7:00 am). The 10 db penalty represents the added intrusiveness of noise events that occur during normal sleep hours when ambient sound levels are typically about 10 db lower than during daytime hours, because of the annoyance associated with sleep disruption. The FAA s Integrated Noise Model (INM) Version 7.0d was used to prepare noise contours to evaluate potential aircraft noise effects for the base (2012) scenario. INM is the computer program used to determine the total effect of aircraft noise in an airport environment. INM produces noise contours, which are computer-generated lines that connect points of equal noise levels resulting from aircraft operations and are overlaid on a base map. The INM was used to produce aircraft noise contours for DNL 65, 70, and 75 for existing conditions (2012); a No-Build scenario for a future year (2033); and, a Build scenario for a future year (2033). The methodology is described in Sections A through C below; the Noise Analysis Technical Appendix is included as Appendix B. The estimated noise effects of airport operations can be interpreted in terms of the probable effect on human activities characteristic of specific land uses. 14 Code of Federal Regulations (CFR) Part 150 guidelines for evaluating land use compatibility with noise exposure are discussed in Section 3.2. Whether a land use is compatible or non-compatible is determined by comparing the measured DNL at a specific site with the compatibility guidelines. Generally, the FAA considers DNL 75 and higher to be incompatible with most land uses, while DNL 65 is compatible with most land uses. Above 65 DNL, noise sensitive land uses (such as residential) are typically discouraged.. CARROLL COUNTY REGIONAL AIRPORT JUNE 2015 PAGE 3-2
44 Chapter Three NOISE AND COMPATIBLE LAND USE A) Existing Conditions (2012) The data used as input to the INM for the year 2012 noise contours were comprised of the following: Runway layout and use Number of aircraft operations Operational time of day Aircraft fleet mix Flight tracks and profiles Runway layout and use: DMW has one runway, Runway 16-34, which is 5,100-feet long and 100-feet wide. Runway 34 is used 90% of the time annually and Runway 16 is used 10% of the time. Aircraft Operations: The 2012 aircraft operations by category are presented in Chapter One (Table 1-9) and are shown again in Table 3-1 below: Table 3-1: Aircraft Operations by Category, 2012 Aircraft Category Operations Single-Engine 29,109 Multi-Engine 5,510 Jet 646 Rotorcraft 735 Total 36,000 Source: Delta Airport Consultants, Inc. CARROLL COUNTY REGIONAL AIRPORT JUNE 2015 PAGE 3-3
45 Chapter Three NOISE AND COMPATIBLE LAND USE Operational time of day: Based on discussions with airport management, FBO staff, and airport users, it was estimated that approximately three percent of the operations at the Airport occur during the nighttime hours. Aircraft fleet mix: The FAA s Traffic Flow Management System (TFMSC) for calendar year 2012 was used to develop the 2012 INM aircraft fleet mix for DMW. TFMSC data provides information on traffic counts by airport and includes the specific aircraft types operating at that airport, data which is collected when pilots file flight plans. For the purposes of preparing DNL contours, operational data were segregated by aircraft type and by type of operation (local or itinerant). The detailed 2012 Aircraft Operations and INM Fleet Mix are included in Appendix B. Flight Tracks and Profiles: Flight paths utilized by arriving, departing, and local touch-and-go operations in north flow (arrivals to and departures from Runway 34) and south flow (arrivals to and departures from Runway 16) were determined through interviews with airport management and airport users. A series of flight path centerlines were then established for each runway and were splayed within the INM in order to reflect the typical range of flight paths used by individual flights Noise Contours: The noise contours for the existing conditions (2012) are shown in Figure 3-1. The total area encompassed by the 65 DNL contour is 51.5 acres, all of which lies within the Airport s existing property boundary. There are no residences or other noise sensitive land uses within the DNL contour. CARROLL COUNTY REGIONAL AIRPORT JUNE 2015 PAGE 3-4
46 Chapter Three NOISE AND COMPATIBLE LAND USE Figure 3-1 Existing (2012) Noise Contours CARROLL COUNTY REGIONAL AIRPORT JUNE 2015 PAGE 3-5
47 Chapter Three NOISE AND COMPATIBLE LAND USE B) Future No Build Scenario (2033) The Future No Build scenario includes the same runway layout and use, operational time of day, flight tracks, and profiles as the Existing (2012) scenario. However, the year 2033 aircraft operations and fleet mix were defined using the aviation activity forecast in Chapter One (Table 1-9) which is shown again in Table 3-2: Table 3-2: Aircraft Operations by Category, 2033 Aircraft Category Operations Single-Engine 33,603 Multi-Engine 6,239 Jet 3,464 Rotorcraft 1,101 Total 44,407 Source: Delta Airport Consultants, Inc. Aircraft fleet mix: The 2033 No Build aircraft fleet mix was determined by multiplying the percentages by aircraft type that occurred in 2012 by the total operations forecasted to occur at the Airport in The 2033 No Build INM aircraft operations and fleet mix are provided in Appendix B No Build Noise Contours: The noise contours for the Future No Build scenario (2033) are shown in Figure 3-2. The total area encompassed by the 65 DNL contour is 63.1 acres, all of which lies within the Airport s existing property boundary. There are no residences or other noise sensitive land uses within the DNL contour for the Future No-Build option. CARROLL COUNTY REGIONAL AIRPORT JUNE 2015 PAGE 3-6
48 Chapter Three NOISE AND COMPATIBLE LAND USE Figure 3-2 Future No Build (2033) Noise Contours CARROLL COUNTY REGIONAL AIRPORT JUNE 2015 PAGE 3-7
49 Chapter Three NOISE AND COMPATIBLE LAND USE C) Future Build Scenario (2033) The Future Build scenario includes the same aircraft operations, fleet mix and operational timeof-day as the 2033 No Build scenario. However, the runway layout reflects the proposed new runway discussed in Chapter Two, which would parallel the existing runway and would be extended to a length of 5,500-feet. Runway Layout and Use: The proposed new runway would parallel the existing runway and would therefore maintain the runway-end designations 16 and 34. The total length of the new runway is proposed to be 5,500-feet. The existing runway would no longer be in service once the new runway is operational. The runway use percentages for the Future Build scenario were the same as the 2033 No Build scenario. Flight Tracks: The INM flight tracks for the 2033 Build Alternative were reflective of the new runway location Build Noise Contours: The noise contours for the Future Build scenario (2033) are shown in Figure 3-3. The total area encompassed by the 65 DNL contour is 63.3 acres. Due to the location of the proposed runway, the 2033 Build Alternative 65 DNL contour extends slightly off airport property to the west of the proposed runway, over an area of industrial land use. There are no residences or other incompatible land uses within the 2033 Build Alternative 65 DNL contour. CARROLL COUNTY REGIONAL AIRPORT JUNE 2015 PAGE 3-8
50 Chapter Three NOISE AND COMPATIBLE LAND USE Figure 3-3 Future Build (2033) Noise Contours CARROLL COUNTY REGIONAL AIRPORT JUNE 2015 PAGE 3-9
51 Chapter Three NOISE AND COMPATIBLE LAND USE 3.2 COMPATIBLE LAND USE Estimates of noise effects resulting from aircraft operations can be interpreted in terms of the probable effect on human activities characteristic of specific land uses. The guidelines for evaluating land use compatibility with noise exposure presented in Appendix A of 14 CFR Part 150 are shown in Table 3-3. These guidelines reflect the average response of large groups of people to noise. Therefore, the guidelines might not reflect an individual s perception of an actual noise environment. Compatible or non-compatible land use is determined by comparing the predicted or measured DNL at a specific site with the compatibility guidelines provided in the table. Furthermore, there are some land uses that are compatible with noise levels between DNL All land uses are considered to be compatible with noise less than or equal to DNL 65. CARROLL COUNTY REGIONAL AIRPORT JUNE 2015 PAGE 3-10
52 Chapter Three NOISE AND COMPATIBLE LAND USE Table 3-3: Land Use Compatibility with Yearly Day-Night Average Sound Land use Residential Residential, other than mobile homes and transient lodgings DNL expressed in db(a) Below Over 85 Y N(1) N(1) N N N Mobile home parks Y N N N N N Transient lodgings Y N(1) N(1) N(1) N N Public Use Schools Y N(1) N(1) N N N Hospitals and nursing homes Y N N N Churches, auditoriums, and concert halls Y N N N Governmental services Y Y N N Transportation Y Y Y(2) Y(3) Y(4) Y(4) Parking Y Y Y(2) Y(3) Y(4) N Commercial Use Offices, business and professional Y Y N N Wholesale and retail building materials, hardware and Y Y Y(2) Y(3) Y(4) N farm equipment Retail trade general Y Y N N Utilities Y Y Y(2) Y(3) Y(4) N Communication Y Y N N Manufacturing and Production Manufacturing, general Y Y Y(2) Y(3) Y(4) N Photographic and optical Y Y N N Agriculture (except livestock) and forestry Y Y(6) Y(7) Y(8) Y(8) Y(8) Livestock farming and breeding Y Y(6) Y(7) N N N Mining and fishing, resource production and extraction Y Y Y Y Y Y Recreational Outdoor sports arenas and spectator sports Y Y(5) Y(5) N N N Outdoor music shells, amphitheaters Y N N N N N Nature exhibits and zoos Y Y N N N N Amusements, parks, resorts and camps Y Y Y N N N Golf courses, riding stables and water recreation Y Y N N Source: 14 C.F.R. Part 150 Y (Yes) = Land Use and related structures compatible without restrictions. N (No) = Land Use and related structures are not compatible and should be prohibited. NLR = Noise Level Reduction (outdoor to indoor) to be achieved through incorporation of noise attenuation into the design and construction of the structure. 25, 30, or 35=Land use and related structures generally compatible; measures to achieve NLR of 25, 30, or 35 db must be incorporated into design and construction of structure. (1) Where the community determines that residential or school uses must be allowed, measures to achieve outdoor to indoor Noise Level Reduction (NLR) of at least 25 db and 30 db should be incorporated into building codes and be considered in individual approvals. Normal residential construction can be expected to provide a NLR of 20 db, thus, the reduction requirements are often stated as 5, 10 or 15 db over standard construction and normally assume mechanical ventilation and closed windows year round. However, the use of NLR criteria will not eliminate outdoor noise problems. (2) Measures to achieve NLR 25 db must be incorporated into the design and construction of portions of these buildings where the public is received, office areas, noise sensitive areas or where the normal noise level is low. (3) Measures to achieve NLR of 30 db must be incorporated into the design and construction of portions of these buildings where the public is received, office areas, noise sensitive areas or where the normal noise level is low. (4) Measures to achieve NLR 35 db must be incorporated into the design and construction of portions of these buildings where the public is received, office areas, noise sensitive areas or where the normal level is low. (5) Land use compatible provided special sound reinforcement systems are installed. (6) Residential buildings require an NLR of 25. (7) Residential buildings require an NLR of 30. (8) Residential buildings not permitted. CARROLL COUNTY REGIONAL AIRPORT JUNE 2015 PAGE 3-11
53 Chapter Three NOISE AND COMPATIBLE LAND USE The Carroll County Regional Airport is located in Carroll County, Maryland, approximately three miles north of the central business district of the City of Westminster. According to the Carroll County Generalized Zoning map (see Figure 3-4), the airport property is designated Restricted Industrial and is immediately bordered by Agricultural and Conservation zoning designations to the north and west. The City of Westminster immediately borders the airport property to the southwest, south, and east with property also zoned Restricted Industrial (see Figure 3-5). A residential area is located approximately ½ mile southeast of the Runway 34 end. Residential uses are generally not considered compatible with airport operations. As confirmed in Section 3.1, no incompatible land uses are contained within the 65 DNL noise contour. CARROLL COUNTY REGIONAL AIRPORT JUNE 2015 PAGE 3-12
54 Chapter Three NOISE AND COMPATIBLE LAND USE Insert Figure 3-4 Carroll County general zoning map CARROLL COUNTY REGIONAL AIRPORT JUNE 2015 PAGE 3-13
55 Chapter Three NOISE AND COMPATIBLE LAND USE Insert Figure 3-5 City of Westminster zoning map CARROLL COUNTY REGIONAL AIRPORT JUNE 2015 PAGE 3-14
56 Chapter Three NOISE AND COMPATIBLE LAND USE While airport noise is the major factor affecting land use compatibility, other factors listed below should be considered when addressing overall land use compatibility around an airport. Generally, the objective of land use compatibility planning for airports is to encourage compatible land uses to locate around airport facilities while discouraging or containing the incompatible land uses in the airport vicinity. A) Tall Structures Structures such as cell towers, wind turbines, vegetation (trees), terrain, and tall buildings can inhibit airport operations and pose a safety concern. According to ACRP Report 27- Enhancing Airport Land Use Compatibility, it is critical to discourage tall structures within the airport approach and departure surface. Current and Proposed Conditions at DMW: The obstruction analysis conducted as part of the Airport Layout Plan (ALP) Update did identify tree, terrain, obstructions to the 34:1 GPS nonprecision instrument approaches and 40:1 TERPS Departure surfaces on both runway ends. The Carroll County zoning ordinance ( ) protects Federal Aviation Regulation (FAR) Part 77 surfaces surrounding the Airport from communications towers which may penetrate these surfaces. It is recommended that the airport sponsor and the County expand the current zoning ordinance to prevent all incompatible land uses within the departure surface. B) Visual Obstructions Those objects and substances which can impede visibility around airports include smoke, glare, steam, dust, and light emissions, especially for airport operations taking place without navigational aids (NAVAIDs). These visual obstructions should be managed as practicable to minimize their effect on aircraft and airport operations. Current and Proposed Conditions at DMW: While there are no known visual obstructions in the airport vicinity, it is recommended that the County zoning ordinance prevent visual CARROLL COUNTY REGIONAL AIRPORT JUNE 2015 PAGE 3-15
57 Chapter Three NOISE AND COMPATIBLE LAND USE obstructions in areas around the Airport to protect pilots from visual obstructions. This includes glare from solar panels and other installations off airport property. C) Wildlife and Bird Attractants Wetlands, bodies of open water, and certain crops can attract wildlife and birds and cause safety hazards for airport operations. Wildlife attractants are defined in AC 150/ B, as humanmade structures, land-use practices, or human-made or natural geographic features that can attract or sustain hazardous wildlife within the landing or departure airspace or the airport s Airport Operations Area (AOA). Architectural features, landscaping, waste disposal sites, wastewater treatment facilities, agricultural or aquaculture activities, surface mining, and wetlands can all act as wildlife attractants. Current Conditions at DMW: While there are no known bodies of open water in the Airport s vicinity, National Wetlands Inventory data consulted in July 2014 identifies two small wetland bodies on airport property within approximately ½ mile of the Runway 16 end: one approximately three-acre area of Freshwater Forested/Shrub wetland and one approximately 3.4-acre area of Freshwater Emergent wetland. There are no known landfills or water treatment facilities in the vicinity of the Airport. McDaniel College Golf Club is located approximately one-mile south of the Runway 34 end, on the opposite side of College View Boulevard. The FAA Advisory Circular (AC) 150/ B, Hazardous Wildlife Attractants on or near Airports, recommends that airports serving turbine-powered aircraft maintain a separation distance of 10,000-feet between hazardous wildlife attractants (such as those mentioned above) and the air operations area (AOA). D) High Concentrations of People / Runway Protection Zone (RPZ) Areas where high concentrations of people gather, such as schools, churches, or arenas, are generally considered to be incompatible with airport operations. Land use around an airport is the primary concern within the Runway Protection Zone (RPZ). The FAA requires the airport owner to control the defined RPZ area to enhance protection of people and property on the ground. Such CARROLL COUNTY REGIONAL AIRPORT JUNE 2015 PAGE 3-16
58 Chapter Three NOISE AND COMPATIBLE LAND USE control includes the clearing and maintenance of incompatible objects and activities. As per AC- 13A, control is exercised through the acquisition of property interest as well as the clearing and maintenance of RPZ areas of incompatible objects and activities. Current and Proposed Conditions at DMW: The majority of land within each RPZ is on airport property with the exception of an approximately 0.82-acre corner of the Runway 16 RPZ and an approximately 1.39-acre corner of the Runway 34 RPZ (excluding the road right-of-way within the Runway 34 RPZ). According to the FAA Interim Guidance on Land Uses within a Runway Protection Zone regional FAA staff must consult with the National Airport Planning and Environmental Division (APP-400) when any of the following land uses would enter the limits of the RPZ as the result of: an airfield project (e.g., a runway extension or shift); a change in the critical design aircraft which increases RPZ dimensions; a new or revised instrument approach procedure that increases RPZ dimensions; or a local development proposal in the RPZ (see list in Table 3-4). Table 3-4: Land Uses Requiring Coordination with APP-400 Buildings and structures, including: residences, schools, churches, hospitals, and Recreational land use, including: golf courses, sports fields, and amusement parks Transportation facilities, including rail facilities, public roads/highways and parking Fuel storage facilities (above and below ground) Hazardous materials storage (above and below ground) Wastewater treatment facilities Above-ground utility infrastructure, including electrical substations and solar panel Source: FAA Interim Guidance on Land Uses within a Runway Protection Zone The proposed RPZs for both runway ends will increase in size as a result of the improved approach minimums recommended in Chapter Two. With the improved approach minimum for Runway 16 of less than ¾ mile, the proposed RPZ will measure acres. With the improved approach minimum for Runway 34 of not lower than ¾ mile, the proposed RPZ will measure acres. The area of proposed RPZ which is off airport property is approximately acres on the CARROLL COUNTY REGIONAL AIRPORT JUNE 2015 PAGE 3-17
59 Chapter Three NOISE AND COMPATIBLE LAND USE Runway 16 end and approximately 7.39-acres on the Runway 34 end (excluding Meadow Branch Road). Per FAA guidance in AC-13A the Airport should acquire all property within the RPZ to prevent incompatible land uses within these areas. CARROLL COUNTY REGIONAL AIRPORT JUNE 2015 PAGE 3-18
. Specific on-airport configurations and areas of analysis at Carroll County Regional Airport (DMW) are discussed in the following text.")
60 Chapter Four FAA DESIGN STANDARDS REVIEW Chapter Four FAA Design Standards Review The existing (as of May 2014) and proposed airfield and facility configuration has been reviewed based on current FAA design standards found in AC 150/ A (AC-13A). Specific on-airport configurations and areas of analysis at Carroll County Regional Airport (DMW) are discussed in the following text. As stated in Chapter One, the airport reference code (ARC) for DMW is C-II. The FAA uses the ARC to relate airport design criteria to the operational and physical characteristics of the airplane types that will operate at a particular airport. As established in Chapter One, the critical family of aircraft for DMW during the current planning period (through 2033) is the medium-size business jet, similar to the based Challenger 605 aircraft, which is Approach Category C and Design roup II. The ARC for DMW is anticipated to remain C-II throughout the planning period. AC-13A introduces the Runway Design Code (RDC) which is a code signifying the design standards to which the runway is to be built, and which is composed of the ARC plus the visibility minimums expressed by Runway Visual Range (RVR) values in feet of 1200, 1600, 2400, 4000 CARROLL COUNTY REGIONAL AIRPORT JUNE 2015 PAGE 4-1
61 Chapter Four FAA DESIGN STANDARDS REVIEW and 5000 (see Table 4-1). There is currently an RNAV (GPS) instrument approach to both runway ends at DMW with one mile visibility; there is also a VOR approach to Runway 34 with one mile visibility. Therefore the RDC for Runway is C-II With the incorporation of the improved visibility minimums recommended in Chapter Two, the RDC for Runway will be C-II Table 4-1: Visibility Minimums RVR (ft) Flight Visibility Category (statute mile) 5000 Not lower than 1 mile 4000 Lower than 1 mile but not lower than ¾ mile (APV ¾ but < 1 mile) 2400 Lower than ¾ mile but not lower than ½ mile (CAT-I PA) 1600 Lower than ½ mile but not lower than ¼ mile (CAT-II PA) 1200 Lower than ¼ mile (CAT-III PA) Source: AC 150/ A AC-13A also introduces the Taxiway Design Group (TDG) which is a classification of airplanes based on outer-to-outer Main Gear Width (MGW) and Cockpit to Main Gear (CMG) distance of the aircraft, and whose categories include 1A, 1B, and 2 through 7. The TDG determines the width of taxiways and taxilanes as well as fillet standards and, in some instances, runway to taxiway and taxiway/taxilane separation requirements. The corresponding taxiway design group for the critical design aircraft for DMW is TDG RUNWAY AND TAXIWAY SAFETY AREAS The Runway Safety Area (RSA) is a defined surface surrounding the runway prepared or suitable for reducing the risk of damage to aircraft in the event of an undershoot, overshoot, or excursion from the runway. The current RSA design standards contained in AC-13A are based on 90% of overruns being contained within the RSA. The RSA for Runway is 500-feet wide and extends 1,000-feet beyond each runway end which meets the design standards for C-II runways as specified in AC-13A. A RSA with a width of 500-feet which extends 1,000-feet beyond each runway end should be provided throughout the planning period. CARROLL COUNTY REGIONAL AIRPORT JUNE 2015 PAGE 4-2
62 Chapter Four FAA DESIGN STANDARDS REVIEW Similar to the RSA, the Taxiway Safety Area (TSA) is a defined surface alongside the taxiway prepared or suitable for reducing the risk of damage to an aircraft deviating from the taxiway. Taxiway A is the parallel taxiway serving Runway AC-13A dictates the dimensions of TSAs based on Airplane Design Group (ADG). The TSA for Taxiway A and all connector taxiways is 79-feet wide which meets the design standards for Group II as specified in the AC. A TSA with a width of 79-feet should be provided for all taxiways throughout the planning period. A taxilane is a taxiway designed for low speed and precise taxiing, usually located on an apron. The taxilane safety area standard for Group II is 115-feet wide. A taxilane safety area with a width of 115-feet should be provided throughout the planning period. 4.2 RUNWAY PROTECTION ZONES The RPZ is a trapezoidal-shaped area situated at ground level prior to the threshold or beyond the runway end to enhance the safety and protection of people and property on the ground. The existing RPZ for both ends of Runway spans acres, with a 500-foot inner width, a length of 1,700-feet and an outer width of 1,010-feet. As discussed in Section 3.2, the majority of land within each RPZ is on airport property with the exception of an approximately 0.82-acre corner of the Runway 16 RPZ and an approximately 1.39-acre corner of the Runway 34 RPZ (excluding public road rights-of-way). The proposed RPZs for both runway ends will increase in size as a result of the improved approach minimums. With the improved approach minimum for Runway 16 of less than ¾ mile, the proposed RPZ will have a 1,000-foot inner width, a length of 2,500- feet, and an outer width of 1,750-feet, measuring acres. With the improved approach minimum for Runway 34 of not lower than ¾ mile, the proposed RPZ will have a 1,000-foot inner width, a length of 1,700-feet, and an outer width of 1,510-feet, measuring acres. The area of proposed RPZ which is off airport property is approximately acres on the Runway 16 end and approximately 7.39-acres on the Runway 34 end (excluding Meadow Branch Road). Per FAA CARROLL COUNTY REGIONAL AIRPORT JUNE 2015 PAGE 4-3
 is an area centered on the ground on the runway provided to enhance the safety of aircraft operations by remaining clear of objects,")
63 Chapter Four FAA DESIGN STANDARDS REVIEW guidance in AC-13A, the Airport should acquire all property within the RPZ to prevent incompatible land uses within these areas. 4.3 RUNWAY OBJECT-FREE AREAS The Runway Object-Free Area (ROFA) is an area centered on the ground on the runway provided to enhance the safety of aircraft operations by remaining clear of objects, except for objects that need to be located in the ROFA for air navigation or aircraft ground maneuvering purposes. The ROFA clearing standard requires clearing the ROFA of above-ground objects protruding above the nearest point of the RSA. The ROFA for Runway is 800-feet wide and extends 1,000- feet beyond each runway end, per the design requirements for C-II runways in AC-13A. A ROFA width of 800-feet should be provided throughout the planning period. The hold apron east of the Runway 34 end is almost entirely within the ROFA (see Figure 4-1). Per AC-13A, taxi and hold aircraft are permitted within the ROFA. Figure 4-1: Hold Apron at DMW Source: Delta Airport Consultants, Inc. CARROLL COUNTY REGIONAL AIRPORT JUNE 2015 PAGE 4-4
64 Chapter Four FAA DESIGN STANDARDS REVIEW 4.4 RUNWAY LENGTH AND WIDTH AC-13A specifies a runway width of 100-feet for C-II runways. Runway is 100-feet wide which satisfies this standard. A runway width of 100-feet should be provided throughout the planning period. Runway is 5,100-feet long. FAA AC 150/5325-4B, Runway Length Requirements for Airport Design, describes procedures for establishing the appropriate runway length based on accommodating landing and departures for the design aircraft. Chapter Two of this document, Runway Analysis, details the methodology used to determine the recommended runway length at DMW. After identifying the family of medium-size business jets represented by the Challenger 605 as the critical design aircraft and considering service to the 100 percent fleet of U.S. business jets as well as letters of support from existing airport users, the analysis recommends a runway length of 5,500-feet. A runway length of 5,500-feet should be considered as the critical length requirement and used as the basis for primary runway planning at DMW during the planning period. 4.5 OBSTRUCTIONS An aerial survey and obstruction analysis were conducted as part of the Airport Layout Plan (ALP) update effort. A) FAR Part 77 Obstructions Several obstructions to existing Federal Aviation Regulation (FAR) Part 77 imaginary surfaces were identified. Existing obstructions include vegetative (tree) obstructions to the existing Part 77 transitional, approach and horizontal surfaces to both runway ends. The Part 77 horizontal surface is obstructed by trees and an antenna on a residence; the Part 77 conical surface is obstructed by a tower. Trees and natural terrain represent the majority of the obstructions to the proposed FAR Part 77 obstructions to each runway end. The number of obstructions to the proposed Part 77 surfaces for CARROLL COUNTY REGIONAL AIRPORT JUNE 2015 PAGE 4-5
65 Chapter Four FAA DESIGN STANDARDS REVIEW Runway 34 is significantly higher than existing due to the proposed runway extension to the north, which is a less developed and more forested area. B) Departure Surface Obstructions The obstruction survey identified terrain penetrations and tree obstructions to the 40:1 TERPS Departure Surface to each runway end. In addition, public and private roads are obstructions to the Departure Surface on both runway ends once the prescribed 15-foot obstruction clearance area from CFR 14 Part is taken into account. Trees and natural terrain represent the majority of the obstructions to the proposed 40-1 Departure Surfaces to each runway end. Similar to the proposed FAR Part 77 surfaces on this runway end, the number of obstructions to the proposed Runway 34 Departure Surface is significantly higher than existing. due to the proposed runway extension to the north, which is a less developed and more forested area. 4.6 TAXIWAY WIDTH AND FILLET STANDARDS Parallel Taxiway A and the connector taxiways at DMW are 35-feet wide, which meets the 35- foot width requirement for TDG 2 per AC-13A. A taxiway width of 35-feet should be provided throughout the planning period. Taxiway fillets are the additional pavement provided on taxiway curves. As an airplane negotiates a turn designed for cockpit over centerline taxiing, the main gear requires this additional pavement. Per AC-13A, at the start of the turn, the taxiway is widened on the inside of the turn for a length L-1, with the distance from the taxiway centerline to the pavement edge tapering from W-0 to W- 1. As the airplane continues, the distance from the taxiway centerline to the pavement edge taper must be increased further, for a length L-2, from W-1 to W-2, ending at a distance L-3 from the point of intersection. The tapers associated with the dimensions L-1 and L-2 are symmetrical about a line bisecting the angle between the two centerlines, and the L-2 tapers are connected by a fillet of radius R-fillet, tangent to both (see Figure 4-2). CARROLL COUNTY REGIONAL AIRPORT JUNE 2015 PAGE 4-6
66 Chapter Four FAA DESIGN STANDARDS REVIEW Taxiway fillet geometry has been updated in the Airport Layout Plan (ALP) to meet the design standard required by AC-13A. Figure 4-2: Fillet design example Source: FAA AC 150/ A 4.7 RUNWAY INCURSION PREVENTION Runway incursion is defined as any occurrence at an airport involving the incorrect presence of an aircraft, vehicle or person on the protected area of a surface designated for the landing and takeoff of an aircraft. AC-13A provides guidance for runway incursion prevention with the objectives of increasing situational awareness for pilots, improving taxiway geometry, and improving operational use of taxiways. A) Taxiway and Taxilane Design CARROLL COUNTY REGIONAL AIRPORT JUNE 2015 PAGE 4-7
67 Chapter Four FAA DESIGN STANDARDS REVIEW AC-13A recommends existing taxiway geometry be improved whenever feasible, with emphasis on hot spots, which are locations on an airport movement area with a history of potential risk of collision or runway incursion, and where heightened attention by pilots and drivers is necessary. 1. Three-node concept: Complex intersections increase the possibility of pilot error. The three-node concept means that a pilot is presented with no more than three choices at an intersection (generally, left, right, and straight ahead). 2. Taxiway/runway interface: Optimally, taxiways and runways would intersect at a 90 (right) angle with the exception of high-speed exit taxiways. (The right angle provides the best visual perspective to a pilot at an intersection.) Taxiways providing direct access from a ramp/terminal to the runway are discouraged. 3. Entrance taxiways: Entrance taxiways should be connected to the runway end at a right angle. Entrance taxiways should not be designed to provide direct access from an apron. Each entrance taxiway should have its own taxiway designator, markings and elevated signage. Figure 4-3 denotes the entrance taxiway leading directly from the terminal area apron to the runway, which does not conform to current FAA design standards. CARROLL COUNTY REGIONAL AIRPORT JUNE 2015 PAGE 4-8


68 Chapter Four FAA DESIGN STANDARDS REVIEW Figure 4-3: Entrance Taxiway at DMW Source: Google Earth B) Apron Layout Apron locations that allow direct access onto a runway are not recommended. The apron layout should allow the design of taxiways in a manner that promotes good situational awareness by forcing pilots to consciously make turns. Taxiways originating from aprons and forming a straight line across runways are not recommended. Other design features which are discouraged in the AC are: 1. Wide throat taxiway entrances from aprons. Such large pavement expanses adjacent to an apron may cause pilot confusion and loss of situational awareness. Wide expanses of pavement also make it difficult for pilots to identify signs and lighting. CARROLL COUNTY REGIONAL AIRPORT JUNE 2015 PAGE 4-9
69 Chapter Four FAA DESIGN STANDARDS REVIEW 2. Taxiway connectors that cross over a parallel taxiway from an apron and directly onto a runway. A staggered layout is best. 3. Direct connection from an apron to a parallel taxiway at the end of a runway. 4.8 NAVIGATIONAL AIDS Navigational aids, or NAVAIDs, are electronic or visual air navigation aids, lights, signs, and associated supporting equipment. According to AC-13A, electronic NAVAIDs emit an electronic signal that either (1) is received by special equipment located on the aircraft, or (2) provides information about the location of the aircraft for air traffic control (ATC) purposes. Visual NAVAIDs consist of a light source that is perceived and interpreted by the pilot. According to AC-13A, any object that is located near an active runway can present an increased risk to aircraft operations. Objects within the ROFA, RSA and Obstacle Free Zone (OFZ) are not permitted unless the object is required to be in a certain location to perform its function. In this case, AC-13A requires that the object within the RSA be supported by frangible structures to minimize damage to aircraft in the case of an accidental strike. Table 4-2 lists select NAVAIDs which may be permitted within the RSA or ROFA because of their fixed-by-function status. There are several NAVAIDs in place at DMW, including the following which are highlighted in Table 4-2: MIRL (Medium-Intensity Runway Lights) MITL (Medium-Intensity Taxiway Lights) REIL (Runway End Identifier Lights) PAPI (Precision Approach Path Indicator) Rotating Beacon Lighted Wind Indicator AWOS (Automated Weather Observation Station) CARROLL COUNTY REGIONAL AIRPORT JUNE 2015 PAGE 4-10
70 Chapter Four FAA DESIGN STANDARDS REVIEW Table 4-2: Fixed-by-Function Designation for NAVAIDs for RSA and ROFA Fixed-by-Function NAVAID In RSA In ROFA Associated Equipment Airport Beacon No No N/A Approach Lighting System (ALS) Yes Yes No 1 Airport Surveillance Rader (ASR) No No N/A Automated Weather Observation No No N/A Station (AWOS) DME No No No Glideslope No 2 No 2, 3 No Lead-In Lighting System (LDIN) Yes Yes No 1 Localizer No No No LLWAS No No No Non-Directional Beacon (NDB) No No N/A REIL Yes Yes No 1 Runway Lights/Signs Yes Yes No RTR No No No RVL No Yes Yes RWSL Yes Yes No Taxiway Lights/Signs Yes Yes No VOR/TACAN/VORTAC No No N/A PAPI & VASI Yes Yes No WAAS No No No WCAM No No No WEF No No No Windcone No No No Source: AC 150/ A Notes: 1. Flasher light power units (Individual Control Cabinets) are fixed-by-function. 2. End Fire glideslopes are fixed-by-function in the RSA/ROFA. 3. Allowing a GS within ROFA due to a physical constraint should be evaluated on a case-by-case basis. CARROLL COUNTY REGIONAL AIRPORT JUNE 2015 PAGE 4-11
71 Chapter Four FAA DESIGN STANDARDS REVIEW Several airport signs are located within the RSA, ROFA and OFZ at DMW. Per AC A, runway signs are permitted within the RSA and ROFA (see Table 4-2). No NAVAIDs penetrate the FAR Part 77 surface. The design standards prescribed in AC-13A help to maintain safety and efficiently at airports according to national policy. Complying with the standards included in the AC ensures that aircraft in a particular category can operate at the Airport without restrictions or encumbrances which could impact safe operations. CARROLL COUNTY REGIONAL AIRPORT JUNE 2015 PAGE 4-12
, intermediate-range (6-10 years), and long-range (11-20 years) planning")
72 Chapter Five COST ESTIMATES AND FUNDING SOURCES Chapter Five Cost Estimates and Funding Sources 5.1 INTRODUCTION This section provides a development program which has been prepared for the airport for shortrange (1-5 years), intermediate-range (6-10 years), and long-range (11-20 years) planning periods, addressing identified airfield needs according to air traffic projections for each period. Capital cost estimates (in current year dollars) have been developed to reflect the phase-by-phase airport development based on the recommend Airport Layout Plan (ALP). The budget data provided in this chapter represents an order-of-magnitude estimate of the total project cost, including construction and additional expenses such as engineering, administration, surveying, and testing. These are preliminary estimates for planning purposes; more detailed cost estimates should be developed prior to the implementation of a project in order to ensure that sufficient funding is available to complete the identified scope of work. To this end, project cost estimates should be periodically reviewed and updated to reflect annual inflation and other changing conditions. The recommended phasing plan should also be evaluated periodically and adjusted to reflect changes in demand, local priorities, economic conditions, and availability of funding. CARROLL COUNTY REGIONAL AIRPORT JUNE 2015 PAGE 5-1
73 Chapter Five COST ESTIMATES AND FUNDING SOURCES 5.2 COST ESTIMATES Table 5-1: Short-Term Capital Improvement Projects Funding Year Project Description FAA MAA Local /Other TOTAL 1 Environmental Assessment $270,000 $15,000 $15,000 $300,000 YEAR 1 TOTAL $270,000 $15,000 $15,000 $300,000 2 Land Acquisition $4,500,000 $250,000 $250,000 $5,000,000 2 Obstruction Removal $500,000 $25,000 $25,000 $500,000 3 YEAR 2 TOTAL $5,000,000 $275,000 $275,000 $5,500,000 Relocate Meadowbranch Road (Design) $630,000 $35,000 $35,000 $700,000 3 Construct Runway (Design) $4,320,000 $240,000 $240,000 $4,800, Construct 2 Corporate Hangars $0 $0 $9,000,000 $9,000,000 YEAR 3 TOTAL $4,950,000 $275,000 $9,275,000 $14,500,000 Relocate Meadowbranch Road (Construction) Runway, Parallel Taxiway (Design) $2,700,000 $150,000 $150,000 $3,000,000 $2,250,000 $125,000 $125,000 $2,500,000 YEAR 4 TOTAL $4,950,000 $275,000 $275,000 $5,500,000 Runway, Parallel Taxiway (Design) Construct Runway (Construction) $360,000 $20,000 $20,000 $400,000 $4,640,000 $257,777 $257,779 $5,155,556 YEAR 5 TOTAL $5,000,000 $277,777 $277,779 $5,555,556 CARROLL COUNTY REGIONAL AIRPORT JUNE 2015 PAGE 5-2
74 Chapter Five COST ESTIMATES AND FUNDING SOURCES Yea r 1 2 Table 5-2: Intermediate-Term Capital Improvement Projects Funding Project Description FAA MAA Local/Other TOTAL Construct Runway (Construction) $5,000,00 0 YEAR 1 TOTAL $5,000,00 Construct Runway $5,000,00 0 (Construction) 0 $277,777 $277,779 $5,555,556 $277,777 $277,779 $5,555,556 $277,777 $277,779 $5,555,556 2 Construct 2 Corporate Hangars $8,000,000 $8,000, YEAR 2 TOTAL $5,000,00 Construct Runway $5,000,00 0 (Construction) 0 $277,777 $8,277,779 $13,555,55 6 $277,777 $277,779 $5,555,556 Terminal Parking (Design & Construction) $0 $0 $1,400,000 $1,400,000 YEAR 3 TOTAL $5,000,00 $277,777 $1,677,779 $6,955,556 Construct Runway $5,000,00 0 (Construction) 0 $277,777 $277,779 $5,555,556 Terminal Building (Design & Construction) YEAR 4 TOTAL $5,000,00 Construct Runway $5,000,00 0 (Construction) 0 YEAR 5 TOTAL $5,000,00 0 $0 $0 $2,500,000 $2,500,000 $277,777 $2,777,779 $8,055,556 $277,777 $277,779 $5,555,556 $277,777 $277,779 $5,555,556 CARROLL COUNTY REGIONAL AIRPORT JUNE 2015 PAGE 5-3
75 Chapter Five COST ESTIMATES AND FUNDING SOURCES Table 5-3: Long-Term Capital Improvement Projects Funding Year Project Description FAA MAA Local/Other TOTAL 1 2 Construct Runway (Construction) $5,000,000 $277,777 $277,779 $5,555,556 YEAR 1 TOTAL $5,000,000 $277,777 $277,779 $5,555,556 Construct Runway and Parallel Taxiway (Construction) $5,000,000 $277,777 $277,779 $5,555,556 YEAR 2 TOTAL $5,000,000 $277,777 $277,779 $5,555,556 3 Parallel Taxiway (Construction) $5,000,000 $277,777 $277,779 $5,555,556 3 Corporate Hangar (Design & $0 $0 $3,000,000 $3,000,000 Construction) YEAR 3 TOTAL $5,000,000 $277,777 $3,277,779 $8,555,556 4 Parallel Taxiway (Construction) $5,000,000 $277,777 $277,779 $5,555,556 YEAR 4 TOTAL $5,000,000 $277,777 $277,779 $5,555,556 5 Parallel Taxiway (Construction) $5,000,000 $277,777 $277,779 $5,555,556 YEAR 5 TOTAL $5,000,000 $277,777 $277,779 $5,555,556 6 Parallel Taxiway (Construction) $1,429,000 $79,444 $79,445 $1,588, Expand Terminal Apron (Design) Construct 3 Corporate Hangars (Design & Construction) $414,000 $23,000 $23,000 $460,000 $0 $0 $10,000,000 $10,000,000 YEAR 6 TOTAL $1,843,995 $102,444 $10,102,445 $12,048,884 Expand Terminal Apron (Construction) $3,366,000 $187,000 $187,000 $3,740,000 YEAR 7 TOTAL $3,366,000 $187,000 $187,000 $3,740,000 8 Expand North Apron (Design) $414,000 $23,000 $23,000 $460,000 9 YEAR 8 TOTAL $414,000 $23,000 $23,000 $460,000 Expand North Apron (Construction) $3,366,000 $187,000 $187,000 $3,740,000 YEAR 9 TOTAL $3,336,000 $187,000 $187,000 $3,740, Expand South Apron (Design) $234,000 $13,000 $13,000 $260,000 YEAR 10 TOTAL $234,000 $13,000 $13,000 $260,000 CARROLL COUNTY REGIONAL AIRPORT JUNE 2015 PAGE 5-4
76 Chapter Five COST ESTIMATES AND FUNDING SOURCES 5.3 SUMMARY OF FUNDING SOURCES The purpose of this section is to analyze the capacity of the Carroll County Board of Commissioners to undertake the recommended projects included on the recommended ALP. It is anticipated that four primary sources of funding would be utilized to implement the Airport s Capital Improvement Program (CIP). These sources include: Federal Aviation Administration (FAA), Maryland Aviation Administration (MAA), local funding, and private investment. Each governmental source may have specific eligibility criteria and application guidelines that require diligent planning and administration to ensure that sufficient funds are received to implement this program. A) FAA - Airport Improvement Program (AIP) The Airport Improvement Program (AIP) provides federal grants to public agencies for the planning and development of public-use airports which are included in the National Plan of Integrated Airport Systems (NPIAS). The NPIAS identifies nearly 3,400 airports in the United States that are considered to be significant to the national air transportation system, and therefore are eligible to receive federal grants under the AIP. As mentioned previously, DMW is included in the NPIAS which classifies it as a reliever airport. For small primary, reliever, and general aviation airports, the AIP grant covers a range of percent of eligible costs, based on statutory requirements. Eligible projects include those improvements related to enhancing airport safety, capacity, security, and environmental concerns. Projects related to airport operations and revenuegenerating improvements (such as hangar buildings) are typical not eligible for grants. B) Maryland Aviation Administration (MAA) The Maryland Aviation Administration s (MAA) Statewide Airport Development Grant Program offers financial assistance to public-use airports receiving eligible funds through the FAA-funded AIP. The MAA program is designed to provide half of the project cost for the local share of an AIP project- that is, if the AIP-funded portion of a project is 90-percent, then the MAA would fund half (5-percent) of the remaining 10-percent of the project cost. State funds are made available by CARROLL COUNTY REGIONAL AIRPORT JUNE 2015 PAGE 5-5
77 Chapter Five COST ESTIMATES AND FUNDING SOURCES annual budget authorizations; funds for individual airport projects are administered by the MAA s Office of Regional Aviation Assistance (ORAA). C) Local Funds Airports have the ability to fund capital projects from surplus revenues generated at the airport; funds generated through the issuance of airport bonds; and public infrastructure or development funds provided by, or to, the local government operator of the airport. D) Private Investment Private funds are assumed to be provided by airport tenants or third-party investors. Privatelyfunded projects are typically reserved for non-eligible items including revenue-generating improvements (such as hangar space, parking, concession space, and car rental). CARROLL COUNTY REGIONAL AIRPORT JUNE 2015 PAGE 5-6
78 APPENDIX A Airport User Letters of Support
79
80
81
82
83
84
85
86
87
88
89
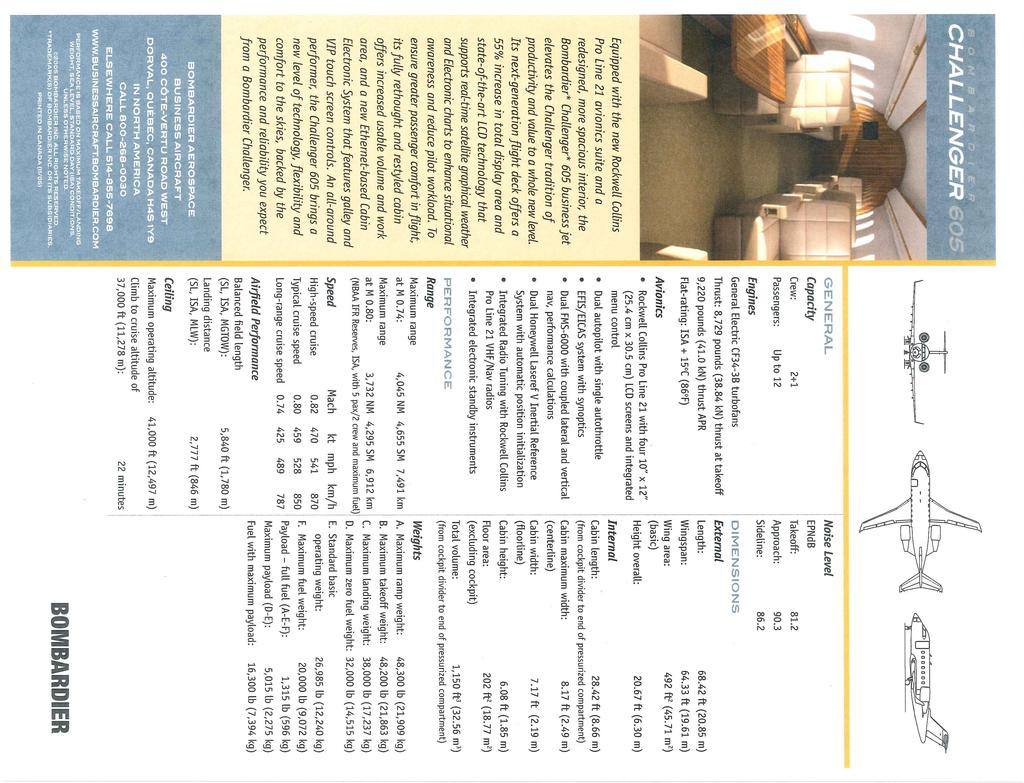
90
91
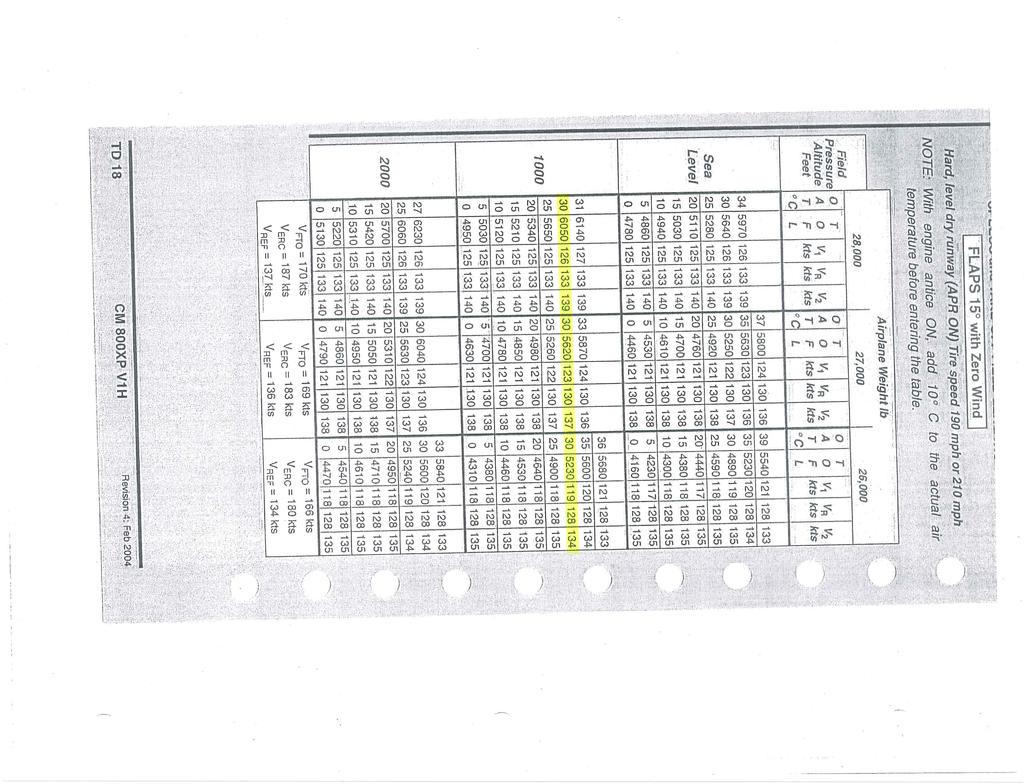
92
93
94
95
96 APPENDIX B Noise Analysis Technical Appendix

97 CARROLL COUNTY REGIONAL AIRPORT MASTER PLAN UPDATE Noise Analysis Technical Report Prepared for: Delta Airport Consultants Prepared by: KB Environmental Sciences, Inc. FINAL August 12, 2014
98 Carroll County Regional Airport Master Plan Update Noise Analysis Technical Report TABLE OF CONTENTS Section 1 Introduction... 3 Section 2 Methodology... 4 Section 3 Existing Conditions (2012)... 6 Section 4 Future No Build Conditions (2033) Section 5 Future Build Alternative (2033) Section 6 Conclusion August 12,
99 Carroll County Regional Airport Master Plan Update Noise Analysis Technical Report SECTION 1 Introduction Carroll County Regional Airport (DMW) located in Westminster, Maryland is currently preparing an update to its Master Plan. As part of the Master Plan Update, Noise Exposure Maps (NEMs) were prepared for the following scenarios: Existing Conditions, using the Master Plan baseline year of 2012; Future No Build Conditions, using the Master Plan out-year forecast for 2033; and, Future Build Alternative, including a proposed replacement runway using the same forecast year of This noise analysis technical report describes the methodology used to develop the NEMs and the resulting noise exposure levels in the vicinity of the airport. August 12,
100 Carroll County Regional Airport Master Plan Update Noise Analysis Technical Report SECTION 2 Methodology The NEMs were developed using the Federal Aviation Administration (FAA) Integrated Noise Model (INM) Version 7.0d. The INM was developed by the FAA using methods and calculations from SAE International s Aerospace Information Report (AIR) 1845, Procedure for the Calculation of Airplane Noise in the Vicinity of Airports. The INM produces aircraft noise contours that delineate areas of equal day-night average sound levels (DNL). The INM works by defining a network of grid points at ground level around an airport. It then selects the shortest distance from each grid point to each flight track and computes the noise exposure generated by each aircraft operation, along each flight track. Corrections are applied for atmospheric acoustical attenuation, acoustical shielding of the aircraft engines by the aircraft itself, and aircraft speed variations. The noise exposure levels for each aircraft are then summed at each grid location. The cumulative noise exposure levels at all grid points are then used to develop noise exposure contours for selected values (e.g. 65, 70 and 75 DNL). Using the results of the grid point analysis, noise contours of equal noise exposure can then be plotted. A DNL is a 24-hour (average day), time-weighted sound level that is expressed in A- weighted decibels and is abbreviated as db(a) or db. The FAA, and other federal agencies, use DNL as the primary measure of noise impact because: it correlates well with the results of attitudinal surveys regarding noise; it increases with the duration of noise events; and, it accounts for an increased sensitivity to noise at night by increasing each noise event that occurs during nighttime hours (i.e., 10 pm to 7 am) by 10 db(a). In Appendix A of 14 CFR Part 150, the FAA identifies, as a function of yearly (365-day average) DNL value, land uses which are compatible and land uses which are noncompatible in an airport environs. As shown in Table 2-1, the FAA considers all land uses to be compatible with aircraft noise if the DNL is less than 65 db(a). The procedures used to develop the 2012 and 2033 NEMs are described in 14 CFR Part150 Appendix A and Subpart B. Appendix A of 14 CFR Part 150 stipulates the following regarding the preparation, illustration, and documentation of NEMs: Continuous contours depicting 65, 70, and 75 DNL must be developed; NEMs must identify runway locations, flight tracks, an outline of an airport s boundaries, noncompatible land uses within the 65 DNL, and the location of noise sensitive buildings (e.g., schools, hospitals); Estimates are to be made of the number of people residing within the 65, 70, and 75 DNL contours. Subpart B of 14 CFR Part 150 stipulates that forecast conditions are to be representative of conditions at least five years in the future and assumptions concerning future conditions are to be reasonable regarding, among other factors, the type and frequency of aircraft operations and the number of nighttime operations. August 12,
101 Carroll County Regional Airport Master Plan Update Noise Analysis Technical Report Table 2-1. Land Use Compatibility Land use Residential DNL expressed in db(a) Below Over 85 Residential, other than mobile homes and transient lodgings Y N(1) N(1) N N N Mobile home parks Y N N N N N Transient lodgings Y N(1) N(1) N(1) N N Public Use Schools Y N(1) N(1) N N N Hospitals and nursing homes Y N N N Churches, auditoriums, and concert halls Y N N N Governmental services Y Y N N Transportation Y Y Y(2) Y(3) Y(4) Y(4) Parking Y Y Y(2) Y(3) Y(4) N Commercial Use Offices, business and professional Y Y N N Wholesale and retail building materials, hardware and farm equipment Y Y Y(2) Y(3) Y(4) N Retail trade general Y Y N N Utilities Y Y Y(2) Y(3) Y(4) N Communication Y Y N N Manufacturing and Production Manufacturing, general Y Y Y(2) Y(3) Y(4) N Photographic and optical Y Y N N Agriculture (except livestock) and forestry Y Y(6) Y(7) Y(8) Y(8) Y(8) Livestock farming and breeding Y Y(6) Y(7) N N N Mining and fishing, resource production and extraction Y Y Y Y Y Y Recreational Outdoor sports arenas and spectator sports Y Y(5) Y(5) N N N Outdoor music shells, amphitheaters Y N N N N N Nature exhibits and zoos Y Y N N N N Amusements, parks, resorts and camps Y Y Y N N N Golf courses, riding stables and water recreation Y Y N N SLUCM=Standard Land Use Coding Manual. Y (Yes) = Land Use and related structures compatible without restrictions. N (No) = Land Use and related structures are not compatible and should be prohibited. NLR = Noise Level Reduction (outdoor to indoor) to be achieved through incorporation of noise attenuation into the design and construction of the structure. 25, 30, or 35=Land use and related structures generally compatible; measures to achieve NLR of 25, 30, or 35 db must be incorporated into design and construction of structure. (1) Where the community determines that residential or school uses must be allowed, measures to achieve outdoor to indoor Noise Level Reduction (NLR) of at least 25 db and 30 db should be incorporated into building codes and be considered in individual approvals. Normal residential construction can be expected to provide a NLR of 20 db, thus, the reduction requirements are often stated as 5, 10 or 15 db over standard construction and normally assume mechanical ventilation and closed windows year round. However, the use of NLR criteria will not eliminate outdoor noise problems. (2) Measures to achieve NLR 25 db must be incorporated into the design and construction of portions of these buildings where the public is received, office areas, noise sensitive areas or where the normal noise level is low. (3) Measures to achieve NLR of 30 db must be incorporated into the design and construction of portions of these buildings where the public is received, office areas, noise sensitive areas or where the normal noise level is low. (4) Measures to achieve NLR 35 db must be incorporated into the design and construction of portions of these buildings where the public is received, office areas, noise sensitive areas or where the normal level is low. (5) Land use compatible provided special sound reinforcement systems are installed. (6) Residential buildings require an NLR of 25. (7) Residential buildings require an NLR of 30. (8) Residential buildings not permitted. Source: 14 CFR Part 150 August 12,
102 Carroll County Regional Airport Master Plan Update Noise Analysis Technical Report SECTION 3 Existing Conditions (2012) This section details the development of DNL contours at 65, 70, and 75 db(a) for the current 2012 conditions. The data used as input to the INM for the year 2012 NEM were comprised of the following: Runway layout and use, Number of aircraft operations, Operational Time-of-Day, Aircraft fleet mix, and Flight tracks and profiles. This section discusses each of the above data elements and concludes with the NEM. 3.1 Runway Layout and Use DMW has one runway, Runway 16/34, which is 5,100 feet long and 100 feet wide. Of the two available runway ends, Runway 34 is used predominantly (90% of the time annually) versus Runway 16 which is used the remaining 10% of the time. 3.2 Aircraft Operations An aviation activity forecast for DMW was prepared as part of the Master Plan Update with a baseline year of The overall forecast of aviation activity was divided into categories of aircraft. The 2012 aircraft operations by category is provided in Table 3-1. As shown, in 2012 there were 36,000 operations at DMW (an average of approximately 99 operations per day). An aircraft operation is defined as either one arrival or one departure. A touch-and-go operation an arrival of an aircraft and the departure of the same aircraft is defined as two operations. Table Aircraft Operations by Category Aircraft Category Operations Single-Engine 29,109 Multi-Engine 5,510 Jet 646 Rotorcraft 735 Total 36,000 Source: 2014 Carroll County Regional Airport Master Plan Update August 12,
103 Carroll County Regional Airport Master Plan Update Noise Analysis Technical Report 3.3 Operational Time-of-Day As previously stated, DNL is calculated such that aircraft operations that occur after 10 pm and before 7 am (i.e., during the nighttime) are penalized by the addition of 10 db(a) to each operation. Based on discussions with airport management, FBO staff, and airport users, it was estimated that approximately 3 percent of the operations at the airport occur during the nighttime hours. 3.4 Fleet Mix The FAA s Traffic Flow Management System Count (TFMSC) for calendar year 2012 was used to develop the 2012 INM aircraft fleet mix for DMW. TFMSC data provides information on traffic counts by airport and includes the specific aircraft types operating at that airport. TFMSC source data are created when pilots file flight plans. The INM includes a number of individual aircraft types as well as a number of FAA-approved substitute aircraft. The TFMSC data for DMW was reviewed and each aircraft type was assigned an INM aircraft type (or approved substitute). For the purposes of preparing DNL contours, operational data were segregated by aircraft type and by type of operation. Aircraft operations were segregated as being local or itinerant. An itinerant operation is defined as an aircraft departure where the aircraft leaves the airport vicinity and lands at another airport, or an aircraft landing where the aircraft arrives from another airport. Local operations are aircraft conducting touch-and-go training operations. A touch-and-go operation occurs when an aircraft departs an airport, lands on a runway and then departs again without stopping. The 2012 INM aircraft operations and fleet mix are provided in Table 3-2. August 12,
104 Carroll County Regional Airport Master Plan Update Noise Analysis Technical Report Table Aircraft Operations and INM Fleet Mix Operation Type Aircraft Category INM Aircraft Annual Operations Single-Engine Piston GASEPV 1,930 CNA CNA PA28 84 CNA GASEPF 10 PA31 7 Multi-Engine Piston Turbo-Prop BEC58P 4,545 CNA CNA SD D 8 DHC8 3 HS748A 2 Itinerant Jet CNA560XL 156 CNA55B 137 CL LEAR35 69 MU IA F CNA560E 21 CIT3 13 CNA525C 12 CNA510 8 CNA680 6 CNA750 6 GIIB 4 EMB145 2 GIV 2 LEAR25 2 Rotorcraft B206L 745 Itinerant Total 9,375 Local Single-Engine Piston CNA172 26,625 Local Total 26,625 Grand Total 36,000 Sources: Traffic Flow Management System Counts (TFMSC), Master Plan Update August 12,
105 Carroll County Regional Airport Master Plan Update Noise Analysis Technical Report 3.5 Flight Tracks and Profiles The INM uses airport-specific ground tracks and vertical flight profiles to compute threedimensional flight paths for each modeled aircraft. The default INM vertical profiles, which consist of altitude, speed, and thrust settings, are compiled from data provided by aircraft manufacturers. The location of flight paths is an important factor in determining the geographic distribution of noise contours on the ground. Flight paths utilized by arriving, departing, and local touch-and-go aircraft operating in north flow (arrivals to and departures from Runway 34) and south flow (arrivals to and departures from Runway 16) were determined through interviews with airport management and airport users. A series of flight path centerlines were then established for each runway. These centerline tracks were splayed within the INM in order to reflect the typical range of flight paths used by individual flights. The itinerant INM flight tracks are shown on Figures 3-1 and 3-2. It should be noted that itinerant rotorcraft also utilize these tracks. The local touch-and-go tracks are shown on Figure 3-3. There is a touch-and-go track from each runway end. Touch-and-go operations at DMW use a left traffic pattern from Runway 16 and a right pattern from Runway 34. The pattern altitude at DMW is 810 feet above field elevation (AFE) Noise Exposure Map The aircraft noise contours for 2012 are provided on Figure 3-4. Table 3-3 provides the area, in acres, of each contour interval (i.e., DNL, DNL, and 75 and greater DNL). As shown, the total area encompassed by the 65 DNL contour is 51.5 acres. The 65 DNL contour lies within the airport s existing property boundary. There are no residences or other noise sensitive land uses within the DNL contour. Table Noise Contour Areas DNL (db(a)) Area (Acres) Total 51.5 Source: INM 7.0d August 12,
106 Carroll County Regional Airport Master Plan Update Noise Analysis Technical Report Figure INM Itinerant Flight Tracks North Flow August 12,

107 Carroll County Regional Airport Master Plan Update Noise Analysis Technical Report Figure INM Itinerant Flight Tracks South Flow August 12,
108 Carroll County Regional Airport Master Plan Update Noise Analysis Technical Report Figure INM Local Touch-and-Go Flight Tracks August 12,
109 Carroll County Regional Airport Master Plan Update Noise Analysis Technical Report Figure DNL Contours August 12,
110 Carroll County Regional Airport Master Plan Update Noise Analysis Technical Report SECTION 4 Future No Build (2033) This section discusses the input data developed for the year 2033 No Build scenario and the resulting Noise Exposure Map. The No Build scenario includes the same runway layout and use, flight tracks, and profiles. However, the year 2033 aircraft operations and fleet mix were defined using the aviation activity forecast from the Master Plan Update. 4.1 Runway Layout and Use The airfield configuration modeled for the 2033 No Build scenario was the same as the Existing Conditions in Likewise, the runway use for the 2033 No Build scenario was the same as the Existing Conditions in Aircraft Operations A forecast for DMW was prepared as part of the Master Plan Update. The forecast of operations for the year 2033 by aircraft category is presented in Table 4-1. As shown, the 2033 forecast includes 44,407 operations at DMW (an average of approximately 122 operations per day). Table Aircraft Operations by Category Aircraft Category Operations Single-Engine 33,603 Multi-Engine 6,239 Jet 3,464 Rotorcraft 1,101 Total 44,407 Source: 2014 Carroll County Regional Airport Master Plan Update August 12,
111 Carroll County Regional Airport Master Plan Update Noise Analysis Technical Report 4.3 Operational Time-of-Day The percentages of nighttime operations for the 2033 No Build scenario were the same as those for the Existing Conditions Fleet Mix The 2033 No Build aircraft fleet mix was determined by multiplying the percentages by aircraft type that occurred in 2012 by the total operations forecasted to occur at the airport in The 2033 No Build INM aircraft operations and fleet mix are provided in Table 4-2. August 12,
112 Carroll County Regional Airport Master Plan Update Noise Analysis Technical Report Table No Build Aircraft Operations and INM Fleet Mix Operation Type Aircraft Category INM Aircraft Annual Operations Single-Engine Piston GASEPV 579 CNA CNA PA28 25 CNA GASEPF 3 PA31 2 Multi-Engine Piston Turbo-Prop BEC58P 5,147 CNA CNA SD D 9 DHC8 3 HS748A 2 Itinerant Jet CNA560XL 868 CNA55B 735 CL LEAR MU IA F CNA560E 113 CIT3 70 CNA525C 64 CNA CNA CNA EMB GIV 11 Rotorcraft B206L 1,101 Itinerant Total 11,546 Local Single-Engine Piston CNA172 Local Total 32,861 Grand Total 44,407 August 12,
113 Carroll County Regional Airport Master Plan Update Noise Analysis Technical Report 4.5 Flight Tracks The flight tracks, flight track use, and profiles for the 2033 No Build scenario were the same as those for the Existing Conditions Noise Exposure Map The aircraft noise contours for the 2033 No Build scenario are provided on Figure 4-1. Table 4-3 provides the area, in acres, of each contour interval (i.e., DNL, DNL, and 75 and greater DNL). As shown, the total area encompassed by the 2033 No Build 65 DNL contour is 63.1 acres. The 2033 No Build 65 DNL contour is slightly larger than the DNL due to the forecasted increase in operations. As with the Existing Conditions, the No Build 65 DNL contour remains within the airport s existing property boundary. There are no residences or other noise sensitive land uses within the 2033 No Build 65 DNL contour. Table No Build Noise Contour Areas DNL (db(a)) Area (Acres) Total 63.1 Source: INM 7.0d August 12,

114 Carroll County Regional Airport Master Plan Update Noise Analysis Technical Report Figure 4-1. Future 2033 No Build DNL Contours August 12,
115 Carroll County Regional Airport Master Plan Update Noise Analysis Technical Report SECTION 5 Future Build Alternative (2033) This section discusses the input data developed for the 2033 Build Alternative and the resulting NEM. The 2033 Build Alternative includes the same aircraft operations and fleet mix as the 2033 No Build scenario. However, the runway layout reflects the proposed new runway. 5.1 Runway Layout and Use The airfield configuration for the 2033 Build Alternative included a proposed new runway which would replace the current runway. The proposed new runway would parallel the existing runway and would therefore maintain the runway-end designations 16 and 34. The total length of the new runway was proposed to be 5,500 feet. The existing runway would no longer be in service once the new runway is operational. The runway use percentages for the 2033 Build Alternative were the same as the 2033 No Build scenario. 5.2 Aircraft Operations The aircraft operations for the 2033 Build Alternative were the same as the 2033 No Build scenario. 5.3 Operational Time-of-Day The time-of-day operations for the 2033 Build Alternative were the same as the 2033 No Build scenario. 5.4 Fleet Mix The aircraft fleet mix for the 2033 Build Alternative is the same as the 2033 No Build scenario. 5.5 Flight Tracks The INM flight tracks for the 2033 Build Alternative were reflective of the new runway location (i.e., the Existing Conditions flight tracks were shifted to align with the proposed runway ends). The 2033 Build Alternative itinerant and local INM flight tracks are shown on Figures 5-1 through 5-3. August 12,

116 Carroll County Regional Airport Master Plan Update Noise Analysis Technical Report Figure 5-1. Future 2033 Build Itinerant INM Itinerant Flight Tracks North Flow August 12,
117 Carroll County Regional Airport Master Plan Update Noise Analysis Technical Report Figure 5-2. Future 2033 Build Itinerant INM Itinerant Flight Tracks South Flow August 12,
118 Carroll County Regional Airport Master Plan Update Noise Analysis Technical Report Figure 5-3. Future 2033 Build INM Local Touch-and-Go Flight Tracks August 12,
119 Carroll County Regional Airport Master Plan Update Noise Analysis Technical Report 5.6 Noise Exposure Map The aircraft noise contours for the 2033 Build Alternative are provided on Figure 5-4. Table 5-1 provides the area, in acres, of each contour interval (i.e., DNL, DNL, and 75 and greater DNL). As shown, the total area encompassed by the 2033 Build Alternative 65 DNL contour is 63.3 acres. Due to the location of the proposed runway, the 2033 Build Alternative 65 DNL contour extends slightly off airport property, just to the west of the proposed runway, over an area of industrial land use. There are no residences or other incompatible land uses within the 2033 Build Alternative 65 DNL contour. Table Build Alternative Noise Contour Areas DNL (db(a)) Area (Acres) Total 63.3 Source: INM 7.0d August 12,
120 Carroll County Regional Airport Master Plan Update Noise Analysis Technical Report Figure 5-4. Future 2033 Build Alternative DNL Contours August 12,
121 Carroll County Regional Airport Master Plan Update Noise Analysis Technical Report SECTION 6 Conclusion Noise Exposure Maps were prepared as part of the airport s Master Plan Update. DNL contours were modeled to identify the changes in noise exposure resulting from proposed airfield improvements at the airport, notably a new runway located northwest of the existing runway. While the 65 DNL contour extended beyond the airport property boundary with the proposed runway, no incompatible land uses (residences, schools, places of worship, etc.) were within the limits of the 65 DNL contour. August 12,
122 APPENDIX C Agency Correspondence
123 U. S. Department oftransportation Federal Aviation Administration WASHINGTON AIRPORTS DISTRICT OFFICE Air Freight Lane, Suite 210 Dulles. Virginia Telephone: Fax: January 23, 2014 Mr. Joseph D. McKelvey Airport Manager Carroll County Regional Airport 200 Airport Drive - Box 8 Westminster, Maryland JAN Reference: Carroll County Regional Airport AIP Master Plan Update Dear Mr. McKelvey: We have received Working Paper One via for our review and comment. Based upon that review we have developed some comments (enclosed) which need to be addressed in a revised submittal. If you have any questions please do not hesitate to contact our office. Sincerely, Thomas A. Priscilla, Jr. Baltimore Metro Engineer cc: Mr. Solanki, MAA/ Mr. Lewis, Delta*
124 Carroll County Regional Airport (DMW) Master Plan Update (In response to FAA Comments dated January 23, 2014) 1. Page ii: Some clarification regarding source data for FAA 5010 should be included. FAA publishes the 5010 based upon data supplied by airport owner/manager. Response: The text has been revised for clarification. 2. Page 1-1: The FAA policy regarding forecast and TAF permits an airport owner to request changes to the published TAF for that airport provided sufficient justification and rationale is provided. Response: The text has been revised for clarification. 3. Page 1-2: The forecast is also used to derive other facility requirements in addition to runway length. Response: The text has been edited to incur facility requirements. 4. Page 1-9: The report should consistently use the same term to define the area for the study-the following terms have been interchangeably used-study area, airport services area, market area. Response: The text has been revised for consistency. 5. Page 1-13: What was the market share for based aircraft prior to 2012? Response: The market share for the based aircraft is listed as follows. Data prior to 2012 was examined and deemed to not be representative of actual activity. With new Airport Manager in place, the data was re-examined and corrected at subsequent Annual 5010 inspections. Carroll County Year Registered Based Aircraft Market Share % % % % % % % % %
125 6. Page 1-18: Provide the Flightwise data cited for historical turbojet operations. Was it just data from 2012? Response: Please see the attached data files representing , and Jan-Sept Page 1-19: As the facility requirements evaluation has not yet been completed it seems premature to conclude that many of DMW s facility needs are related to peak period activity. Response: The text has been revised for clarification. 8. Page 1-19: From what data source were peak month operational percentages obtained when noting at airports such as DMW? Response: Data in draft text was drawn from prior NYDOT research. Peak period forecast have been revised in accordance with the FAA report Forecasting Aviation Activity, July Page 1-19: From what data source were peak hour operations identified as typically percent? Response: Data in draft text was drawn from prior NYDOT research. Peak period forecast have been revised in accordance with the FAA report Forecasting Aviation Activity, July Page 1-24: Identify the number of operations for group II and group III separately rather than noting that 50% of business jet operations are group II or greater. Response: The text has been revised as requested.


126


127


128
129 Carroll County Regional Airport Master Plan Update Working Paper Two FAA Comments & Responses (FAA Comments Dated 04/13/14) (1) The approved scope of work identifies that the proposed runway length will be determined using Figure 3-2 for 100% of the fleet at 60% useful load. The FAA did not concur with using the other means to evaluate proposed runway lengths. The scope of work also identifies FAA Advisory Circular (AC) 150/5325-4B, Runway Length Requirements for Airport Design, as the primary source document. The runway length was established based on the referenced Figure 3-2 and is presented Section 2.3 of the submitted text with the resultant being 5,400 feet. Paragraph 304, Runway Length Adjustments, of the source AC notes that runway lengths obtained from Figure 3-2 is based on no wind, a dry runway surface, and zero effective runway gradient. Paragraph 304 further states that lengths obtained from Figure 3-2 are to be increased to accommodate for the stated factors; the result of these adjustments are presented in Section 2.4 of the text with the resultant being 5,500 feet. During the Master Plan study, tenants and users that operate and service large business jets at DMW were interviewed regarding their operational needs. These interviews highlighted the need for a runway length greater than 5,500 feet, as a result of actual loads typically exceeding the 60 percent level, stage lengths to accomplish their flight mission, and the fact that many of the jet operators are subject to the 14CFR Part 91K and Part 135 operating restrictions that limit the useable runway, a condition also exacerbated by contaminated runway conditions. Additionally, Paragraph 306 of the AC recognizes the demand and benefit for adequate runway lengths at General Aviation (GA) airports and notes that GA airports receiving regular usage by large airplanes over 12,500 pounds MTOW, in addition to business jets, should provide a runway length comparable to non-ga airports. The text continues noting that the extension of an existing runway can be justified at an existing GA airport that has a need to accommodate heavier airplanes on a frequent basis. The County requests the FAA review and consider the demonstrated need for additional runway length (6,400 feet) as supported by written documentation from existing operators of based and transient jet aircraft. (2) The report must identify how the consultant believes that in DMW s role as one of the five designated reliever airports (MTN, FDK, GAI, DMW, FME) influences a proposed runway length at DMW. Such analysis should also identify the aircraft currently operating or forecast to operate out of BWI which are likely to use DMW if a longer runway length were provided. Only three of the noted reliever airports offer a runway length greater than 5,000 feet currently, (MTN, FDK, and DMW), which for many of the jet operators is a minimum requirement due to insurance or company operating procedures under Part 91K or 135. Each offers a variety of pros/cons when considered as an operational base; ie: proximity to Baltimore city, drive times
130 to key business districts in the surrounding areas, hangar leasing costs, landing fees or facility ramp fees, etc Similarly the presence of an air traffic control tower may be seen as pro or con to business jet operators. What is known, (as documented in the previously submitted letter from Skytech dated January 23, 2014), is that a Baltimore based business operating a Falcon 2000 and a G250 is currently based at MTN and has, and would again, consider relocating to DMW if the runway length was adequate to support their operational mission. This operator makes all passenger pickups at BWI and would likely continue to do so even if they relocate their operations to DMW. Another NetJet client however, that currently uses BWI as their pickup base, has expressed significant interest in DMW for all of their Citation X operations (please see attached correspondence from client and Skytech). The client has already requested NetJets schedule pickups away from BWI to DMW when weather conditions allow, and flight data records document existing Citation X operations from DMW to San Diego as noted in Table 2-2, as well as other destinations. Table 2-1 highlights the limitations Citation X operators face for both take-off and wet landing operations at DMW.


131
The forecasts evaluated in this appendix are prepared for based aircraft, general aviation, military and overall activity.
 Chapter 3: Forecast Introduction Forecasting provides an airport with a general idea of the magnitude of growth, as well as fluctuations in activity anticipated, over a 20-year forecast period. Forecasting
Chapter Two FORECAST OF AVIATION DEMAND A. DESCRIPTION OF FORECAST ELEMENTS
 Chapter Two FORECAST OF AVIATION DEMAND A. DESCRIPTION OF FORECAST ELEMENTS The forecast of aeronautical activity at the (GED) during the 20-year planning period (2002-2021) is a key element of the Master
Time-series methodologies Market share methodologies Socioeconomic methodologies
 This Chapter features aviation activity forecasts for the Asheville Regional Airport (Airport) over a next 20- year planning horizon. Aviation demand forecasts are an important step in the master planning
APPENDIX X: RUNWAY LENGTH ANALYSIS
 APPENDIX X: RUNWAY LENGTH ANALYSIS Purpose For this Airport Master Plan study, the FAA has requested a runway length analysis to be completed to current FAA AC 150/5325-4B, Runway Length Requirements for
Runway Length Analysis Prescott Municipal Airport
 APPENDIX 2 Runway Length Analysis Prescott Municipal Airport May 11, 2009 Version 2 (draft) Table of Contents Introduction... 1-1 Section 1 Purpose & Need... 1-2 Section 2 Design Standards...1-3 Section
3. Aviation Activity Forecasts
 3. Aviation Activity Forecasts This section presents forecasts of aviation activity for the Airport through 2029. Forecasts were developed for enplaned passengers, air carrier and regional/commuter airline
Merritt Island Airport
 TABLE OF CONTENTS CHAPTER 1 INTRODUCTION... 1-1 INTRODUCTION AND PROJECT OVERVIEW... 1-1 General Guidelines... 1-1 Prior Planning Documentation... 1-2 Key Issues... 1-2 Goals and Objectives... 1-2 Regulatory
Executive Summary. MASTER PLAN UPDATE Fort Collins-Loveland Municipal Airport
 Executive Summary MASTER PLAN UPDATE Fort Collins-Loveland Municipal Airport As a general aviation and commercial service airport, Fort Collins- Loveland Municipal Airport serves as an important niche
According to FAA Advisory Circular 150/5060-5, Airport Capacity and Delay, the elements that affect airfield capacity include:
 4.1 INTRODUCTION The previous chapters have described the existing facilities and provided planning guidelines as well as a forecast of demand for aviation activity at North Perry Airport. The demand/capacity
FORT LAUDERDALE-HOLLYWOOD INTERNATIONAL AIRPORT ENVIRONMENTAL IMPACT STATEMENT DRAFT
 D.3 RUNWAY LENGTH ANALYSIS Appendix D Purpose and Need THIS PAGE INTENTIONALLY LEFT BLANK Appendix D Purpose and Need APPENDIX D.3 AIRFIELD GEOMETRIC REQUIREMENTS This information provided in this appendix
CHAPTER 1 EXECUTIVE SUMMARY
 CHAPTER 1 EXECUTIVE SUMMARY 1 1 EXECUTIVE SUMMARY INTRODUCTION William R. Fairchild International Airport (CLM) is located approximately three miles west of the city of Port Angeles, Washington. The airport
AIRSIDE CAPACITY AND FACILITY REQUIREMENTS
 AIRSIDE CAPACITY AND FACILITY REQUIREMENTS This Section investigates the capacity of the airport, its ability to meet current demand, and the facilities required to meet forecasted needs as established
SECTION 3 AVIATION ACTIVITY FORECASTS
 SECTION 3 AVIATION ACTIVITY FORECASTS 3.1 INTRODUCTION Projecting future aviation demand is a critical element in the overall master planning process. The activity forecasts developed in this section are
Forecast Data specific to SDM... 6 Aviation Industry Trends Collection of Other Data... 12
 Working Paper 2 Forecasts of Aviation Demand Table of Contents 2.1 Forecast Overview... 1 2.2 Identification of Aviation Demand Elements... 2 2.3 Data Sources... 3 2.4 Historical and Existing Aviation
Table of Contents. Overview Objectives Key Issues Process...1-3
 Table of Contents Chapter One Introduction Overview...1-1 Objectives...1-1 Key Issues...1-2 Process...1-3 Chapter Two Inventory of Existing Conditions Airport Setting...2-1 Locale...2-1 Airport Surroundings...2-5
Technical Memorandum. Synopsis. Steve Carrillo, PE. Bryan Oscarson/Carmen Au Lindgren, PE. April 3, 2018 (Revised)
") Appendix D Orange County/John Wayne Airport (JWA) General Aviation Improvement Program (GAIP) Based Aircraft Parking Capacity Analysis and General Aviation Constrained Forecasts Technical Memorandum To:
Appendix D Orange County/John Wayne Airport (JWA) General Aviation Improvement Program (GAIP) Based Aircraft Parking Capacity Analysis and General Aviation Constrained Forecasts Technical Memorandum To:
Chapter Two Airport Master Plan Update AERONAUTICAL ACTIVITY FORECAST Grants Pass Airport
 Chapter Two Airport Master Plan Update AERONAUTICAL ACTIVITY FORECAST Grants Pass Airport Aviation demand forecasts help to determine the size and timing of needed airport improvements. This chapter indicates
The purpose of this Demand/Capacity. The airfield configuration for SPG. Methods for determining airport AIRPORT DEMAND CAPACITY. Runway Configuration
 Chapter 4 Page 65 AIRPORT DEMAND CAPACITY The purpose of this Demand/Capacity Analysis is to examine the capability of the Albert Whitted Airport (SPG) to meet the needs of its users. In doing so, this
APPENDIX E AVIATION ACTIVITY FORECASTS
 APPENDIX E AVIATION ACTIVITY FORECASTS E.1 PURPOSE AND CONTEXT This appendix presents the St. George Airport (SGU) aviation activity forecasts for the period of 2003 through 2020. Among the components
Appendix B Ultimate Airport Capacity and Delay Simulation Modeling Analysis
 Appendix B ULTIMATE AIRPORT CAPACITY & DELAY SIMULATION MODELING ANALYSIS B TABLE OF CONTENTS EXHIBITS TABLES B.1 Introduction... 1 B.2 Simulation Modeling Assumption and Methodology... 4 B.2.1 Runway
DRAFT FINAL REPORT AIRPORT MASTER PLAN. Rifle Garfield County Airport Revised May 15, 2014
 DRAFT FINAL REPORT AIRPORT MASTER PLAN Rifle Garfield County Airport Revised May 15, 2014 As required by Paragraph 425.B(4) of FAA Order 5100.38C, Airport Improvement Program (AIP) Handbook: The preparation
Agenda: SASP SAC Meeting 3
 Agenda: SASP SAC Meeting 3 Date: 04/12/18 Public Involvement Plan Update Defining the System Recommended Classifications Discussion Break Review current system Outreach what we heard Proposed changes Classification
CHAPTER 4 DEMAND/CAPACITY ANALYSIS
 CHAPTER DEMAND/CAPACITY ANALYSIS INTRODUCTION The demand/capacity analysis examines the capability of the airfield system at Blue Grass Airport (LEX) to address existing levels of activity as well as determine
CHAPTER 2 AVIATION ACTIVITY FORECAST
 CHAPTER 2 AVIATION ACTIVITY FORECAST Aviation activity forecasts at the Airport are presented in this chapter for the period ending in 2027. The forecasts developed in this chapter provide needed input
CHAPTER 1 BACKGROUND AND PROPOSED ACTION
 CHAPTER 1 BACKGROUND AND PROPOSED ACTION 1.0 INTRODUCTION An Environmental Assessment (EA) evaluates the effects of a proposed Federal action on the surrounding environment and is prepared in compliance
FACILITY REQUIREMENTS SUMMARY OF KEY ISSUES OVERVIEW
 FACILITY REQUIREMENTS SUMMARY OF KEY ISSUES OVERVIEW This summary is intended to provide a brief overview of the key issues associated with conformance to FAA standards at Methow Valley State Airport.
CHAPTER 1 INTRODUCTION AND BACKGROUND
 CHAPTER 1 INTRODUCTION AND BACKGROUND An Environmental Assessment (EA) evaluates the effects of a proposed Federal action on the surrounding environment and is prepared in compliance with the National
As stated in FAA Order C, Field Formulation of the National Plan of Integrated Airport Systems, dated December 4, 2004, forecasts should be: 2-1
 chapter 2 Forecasts airport master plan An important factor in facility planning involves a definition of demand that may reasonably be expected to occur during the useful life of the facility s key components.
1.0 Project Background Mission Statement and Goals Objectives of this Sustainable Master Plan
 TABLE OF CONTENTS CHAPTER 1 INTRODUCTION 10 Project Background 1-1 11 Mission Statement and Goals 1-1 12 Objectives of this Sustainable Master Plan 1-2 CHAPTER 2 INVENTORY 20 Airport Background 2-1 201
TABLE OF CONTENTS. General Study Objectives Public Involvement Issues to Be Resolved
 TABLE OF CONTENTS Description Page Number LIST OF ACRONYMS... a CHAPTER ONE INTRODUCTION General... 1-1 Study Objectives... 1-1 Public Involvement... 1-2 Issues to Be Resolved... 1-2 CHAPTER TWO EXISTING
Dr. Antonio A. Trani Professor of Civil Engineering Virginia Polytechnic Institute and State University. Spring 2015 Blacksburg, Virginia
 CEE 4674 Airport Planning and Design Runway Length Calculations Addendum 1 Dr. Antonio A. Trani Professor of Civil Engineering Virginia Polytechnic Institute and State University Spring 2015 Blacksburg,
Dr. Antonio A. Trani Professor of Civil Engineering Virginia Polytechnic Institute and State University. January 27, 2009 Blacksburg, Virginia
 Dr. Antonio A. Trani Professor of Civil Engineering Virginia Polytechnic Institute and State University January 27, 2009 Blacksburg, Virginia 1 Runway Design Assumptions (FAA 150/5325-4b) Applicable to
Tallahassee International Airport Master Plan. Technical Advisory Committee Meeting #2 October 19, 2016
 Tallahassee International Airport Master Plan Technical Advisory Committee Meeting #2 October 19, 2016 Agenda Welcome / Introductions Master Plan Process and Project Status Forecast of Aviation Demand
Facility Requirements
 C H A P T E R T H R E E Facility Requirements 3.0 OVERVIEW Airport planning for facility requirements is based upon addressing any existing issues and accommodating the probable demand that may occur over
Lake Tahoe Airport Master Plan Public Meeting March 16, 2015
 Lake Tahoe Airport Master Plan Public Meeting March 16, 2015 What is an Airport Master Plan? a comprehensive study of an airport [that] usually describes the short, medium, and long term development plans
Planning Horizon Activity Levels Airfield Capacity and Delay Airport Physical Planning Criteria Airfield and Landside Facility Requirements
 Proper airport planning requires the translation of forecast aviation demand into the specific types and quantities of facilities that can adequately serve the identified demand. This chapter will analyze
Chapter 5 Facility Requirements
 Chapter 5 Facility Requirements 50 INTRODUCTION This chapter describes the airside and landside facility requirements necessary to accommodate existing and forecasted demand in accordance with Federal
2.1 DESCRIPTION OF FORECAST ELEMENTS
 Forecasts for the are derived from analyses of aircraft and operational trends at the Airport, existing state and federal forecasts, general aviation industry trends, and professional judgment of the niche
Document prepared by MnDOT Office of Aeronautics and HNTB Corporation. MINNESOTA GO STATE AVIATION SYSTEM PLAN
 LAST UPDATE JULY 2013 Acknowledgements The preparation of this document was financed in part by a grant from the Federal Aviation Administration (Project No: 3-27-0000-07-10), with the financial support
Prepared By: Mead & Hunt, Inc Port Lansing Road Lansing, MI 48906
 Master Plan The preparation of this document was financed in part through a planning grant from the Federal Aviation Administration (FAA) as provided under Section 505 of the Airport and Airway Improvement
Alternatives. Introduction. Range of Alternatives
 Alternatives Introduction Federal environmental regulations concerning the environmental review process require that all reasonable alternatives, which might accomplish the objectives of a proposed project,
FORECAST OF AVIATION DEMAND
 3 3 FORECAST OF AVIATION DEMAND 3.1 FORECASTING BACKGROUND This chapter of the Juneau International Airport (JNU) Sustainability Master Plan (SMP) presents forecasts of future aviation demand. These forecasts
ERIE INTERNATIONAL AIRPORT MASTER PLAN TABLE OF CONTENTS
 EXECUTIVE SUMMARY ERIE INTERNATIONAL AIRPORT MASTER PLAN TABLE OF CONTENTS PAGE NO. CHAPTER 1-INTRODUCTION... 1-1 1.01 General...1-1 1.02 Purpose and Scope of Study...1-1 1.03 The Planning Process...1-2
Appendix C AIRPORT LAYOUT PLANS
 Appendix C AIRPORT LAYOUT PLANS Appendix C AIRPORT LAYOUT PLANS Airport Master Plan Santa Barbara Airport As part of this Airport Master Plan, the Federal Aviation Administration (FAA) requires the development
1. Background and Proposed Action
 1. Background and Proposed Action This chapter describes Hillsboro Airport and the planning background for the proposed project. The Port of Portland (the Port) is the sponsor for the Hillsboro Airport
Forecast of Aviation Activity
 DETROIT METROPOLITAN WAYNE COUNTY AIRPORT FAR PART 150 NOISE COMPATIBILITY STUDY UPDATE CHAPTER B FORECAST OF AVIATION ACTIVITY Forecast of Aviation Activity Introduction This chapter summarizes past aviation
CHAPTER 5 - FACILITY REQUIREMENTS
 CHAPTER 5 - FACILITY REQUIREMENTS This chapter identifies the requirements for airfield and landside facilities to accommodate the forecast demand level. Facility requirements have been developed for the
BEAR LAKE COUNTY AIRPORT MASTER PLAN. Aviation Activity Forecast
 BEAR LAKE COUNTY AIRPORT MASTER PLAN Aviation Activity Forecast *DRAFT* 3.0 AVIATION ACTIVITY FORECAST This chapter discusses the findings and methodologies used to project aviation demand at Bear Lake
3.1 CRITICAL AIRCRAFT
 The purpose of the demand capacity analysis is to determine an airport s capacity and its ability to support the forecasted aviation demand. Facility requirements identify development, replacement, and/or
Outlook for Future Demand
 Chapter Three: Introduction This chapter discusses findings and methodologies used to project future aviation demand for study airports. Forecasts developed in the Greater Kansas City Regional Aviation
Dallas Executive Airport Town Hall Meeting April 3, 2014
 Dallas Executive Airport Town Hall Meeting April 3, 2014 Background 1,040 acre general aviation facility owned and operated by the City of Dallas 150 based aircraft including business jets and helicopters,
3.1 Facility Requirements Overview Airfield Facility Requirements... 1
 Table of Contents 3.1 Overview... 1 3.2 Airfield... 1 Airspace Capacity...1 Airside Capacity... 2 Aircraft Mix Index... 3 Arrivals Percentage... 4 Touch-and-Go Percentage... 4 Taxiway Access Factors...
COMMERCIAL AND GENERAL AVIATION
 Existing Facilities Daytona Beach International Airport is served by a number of airside and landside facilities. The airport has three asphalt runways: Runway 07L/25R (10,500 feet long by 150 feet wide),
CHAPTER 3 ALTERNATIVES CONSIDERED
 CHAPTER 3 ALTERNATIVES CONSIDERED 3.0 ALTERNATIVES The 2010 Stevensville Airport Master Plan contained five (5) airside development options designed to meet projected demands. Each of the options from
Forecast and Overview
 Forecast and Overview DENVER INTERNATIONAL AIRPORT Overall goals of the (MPR): Work with DEN to refine the preferred airport development plan to guide the development over an approximate 25-year planning
SECTION 5.0 FORECASTS OF AVIATION DEMAND
 SECTION 5.0 FORECASTS OF AVIATION DEMAND SECTION 5.0 FORECASTS OF AVIATION DEMAND 5.1 GENERAL This section provides an update of aviation activity forecasts for through the year 2021. The aviation activity
1 DRAFT. General Aviation Terminal Services Aircraft Hangars Aircraft Parking Aprons Airport Support Facilities
 To properly plan for improvements at Dallas Executive Airport, it is necessary to translate forecast aviation demand into the specific types and quantities of facilities that can adequately serve the demand.
TABLE OF CONTENTS. Washington Aviation System Plan Update July 2017 i
 TABLE OF CONTENTS Chapter 1 Overview... 1-1 1.1 Background... 1-1 1.2 Overview of 2015 WASP... 1-1 1.2.1 Aviation System Performance... 1-2 1.3 Prior WSDOT Aviation Planning Studies... 1-3 1.3.1 2009 Long-Term
CHAPTER 3 AIRPORT FACILITY REQUIREMENTS
 CHAPTER 3 AIRPORT FACILITY REQUIREMENTS 3.1 Introduction The existing runway and taxiway system at Skyhaven Airport provides more than adequate operational capacity to accommodate future peak hour and
Hartford-Brainard Airport Potential Runway Closure White Paper
 Hartford-Brainard Airport Potential Runway 11-29 Closure White Paper June 2012 In recent years there has been discussion regarding the necessity of Runway 11-29 to the Hartford- Brainard Airport (HFD)
Airport Master Plan Update
 Duttchessss Countty Airrporrtt Masstterr Plan Updatte Airport Master Plan Update Final Report Dutchess County Airport Town of Wappingers, New York C&S Engineers, Inc. 499 Col. Eileen Collins Blvd. Syracuse,
1.1.3 Taxiways. Figure 1-15: Taxiway Data. DRAFT Inventory TYPICAL PAVEMENT CROSS-SECTION LIGHTING TYPE LENGTH (FEET) WIDTH (FEET) LIGHTING CONDITION
 WIDTH (FEET) LIGHTING CONDITION") 1.1.3 Taxiways EWN has an extensive network of taxiways and taxilanes connecting the terminal, air cargo, and general aviation areas with the runways as listed in Figure 1-15. A 50-foot wide parallel taxiway
1.1.3 Taxiways EWN has an extensive network of taxiways and taxilanes connecting the terminal, air cargo, and general aviation areas with the runways as listed in Figure 1-15. A 50-foot wide parallel taxiway
PORT OF PORTLAND. Chapter Four AVIATION FACILITY REQUIREMENTS
 PORT OF PORTLAND Chapter Four AVIATION FACILITY REQUIREMENTS CHAPTER FOUR PORT OF PORTLAND AVIATION FACILITY REQUIREMENTS In this chapter, existing components of the airport are evaluated to identify the
INTRODUCTION AND BACKGROUND
 CHAPTER THREE Aviation Activity Forecasts INTRODUCTION AND BACKGROUND This chapter presents projections of aviation activity at Herlong Airport (HEG) that will be used as the basis for facility planning
Las Vegas McCarran International Airport. Capacity Enhancement Plan
 Las Vegas McCarran International Airport Capacity Enhancement Plan Las Vegas McCarran International Airport Capacity Enhancement Plan September 1994 Prepared jointly by the U.S. Department of Transportation,
Welcome to the Boise Airport Master Plan Update Open House
 Welcome to the Boise Airport Master Plan Update Open House Get the facts and sign up for the Master Plan Update newsletter at http://www.iflyboise.com/about-boi/master-plan/ What does the Master Plan Update
Airport Master Plan. Brookings Regional Airport. Runway Runway 17-35
 Runway 17-35 Airport Master Plan Runway 12-30 Brookings Regional Airport Table of Contents Table of Contents Chapter 1: Master Plan Goals... 1-1 1.1. Introduction... 1 1.2. Objective 1 Identify improvements
CATCODE ] CATCODE
![CATCODE ] CATCODE](/thumbs/82/85644630.jpg "CATCODE ] CATCODE") Runways. FAC: 1111 CATCODE: 111111 OPR: AFCEC/COS OCR: AF/A3O-A 1.1. Description. The runway is the paved surface provided for normal aircraft landings and take offs. Runways are classified as either Class
Runways. FAC: 1111 CATCODE: 111111 OPR: AFCEC/COS OCR: AF/A3O-A 1.1. Description. The runway is the paved surface provided for normal aircraft landings and take offs. Runways are classified as either Class
PRIEST RIVER AIRPORT MASTER PLAN. Aviation Activity Forecasts
 PRIEST RIVER AIRPORT MASTER PLAN Aviation Activity Forecasts *DRAFT* February 11, 2015 3.0 AVIATION ACTIVITY FORECAST This chapter discusses the findings and methodologies used to project aviation demand
Aviation Activity Forecasts
 C H A P T E R 2 Aviation Activity Forecasts 2.0 OVERVIEW This chapter contains aviation activity forecasts for Chippewa Valley Regional Airport over the 20-year planning horizon. Aviation demand forecasts
STUDY OVERVIEW MASTER PLAN GOALS AND OBJECTIVES
 INTRODUCTION An Airport Master Plan provides an evalua on of the airport s avia on demand and an overview of the systema c airport development that will best meet those demands. The Master Plan establishes
Chapter 5. Facility Requirements
 Chapter 5 Facility Requirements Chapter 5 Facility Requirements INTRODUCTION The Baseline Forecast was used to determine facility requirements. Chapter 4 produced a forecast of traffic volumes expected
Chapter 3: Aviation Forecasts
 Chapter 3: Aviation Forecasts Rapid City Regional Airport Master Plan Update Chapter 3 - Aviation Forecasts Introduction The Aviation Forecasts chapter of the Airport Master Plan analyzes current and future
Chapter 5 Facility Requirements
 Chapter 5 Facility Requirements 5.0 INTRODUCTION The Facility Requirements chapter of this Sustainable Master Plan Update describes airside and landside facilities, which are needed to accommodate existing
FORECASTING FUTURE ACTIVITY
 EXECUTIVE SUMMARY The Eagle County Regional Airport (EGE) is known as a gateway into the heart of the Colorado Rocky Mountains, providing access to some of the nation s top ski resort towns (Vail, Beaver
New Opportunities PUBLIC WORKSHOP. Venice Municipal. Bringing g the pieces together
 Bringing g the PUBLIC WORKSHOP Venice Municipal Airport New Opportunities Presented for Venice City Council & Citizens of Venice September 25, 2009 Slide 1 Bringing g the Welcome & Introductions May 12th
Chapter 2 FINDINGS & CONCLUSIONS
 Chapter 2 FINDINGS & CONCLUSIONS 2.01 GENERAL Dutchess County acquired the airport facility in 1947 by deed from the War Assets Administration. Following the acquisition, several individuals who pursued
INTRODUCTION. General
 CHAPTER FOUR Airfield Demand/Capacity Analysis & Facility Requirements INTRODUCTION A key step in the master plan process is the determination of airport facility requirements to allow airside and landside
Facility Requirements
 4. This chapter presents the airside and landside facility requirements necessary to accommodate existing and forecasted demand at Erie International Airport (ERI or the Airport) in accordance with Federal
CHAPTER THREE AVIATION ACTIVITY FORECASTS
 CHAPTER THREE AVIATION ACTIVITY FORECASTS Introduction The purpose of this chapter is to update the forecasts of aviation activity for the twenty year planning period addressed in the Update (2007-2027).
Technical Advisory Committee Meeting February 29, 2016
 Technical Advisory Committee Meeting February 29, 2016 Meeting Agenda Introduction Recap of Planning Process Project Status Goals and Objectives Forecasts of Aviation Demand Overview of Facility Requirements
AIRPORT MASTER PLAN ADVISORY COMMITTEE MEETING #2 AGENDA
 AIRPORT MASTER PLAN ADVISORY COMMITTEE MEETING #2 AGENDA MEETING DATE: Wednesday, June 1, 2011 TIME: 2:30 PM (1½ Hours) LOCATION: Duluth Airport Terminal Building, Skyline Room (2 nd Floor) This meeting
Chapter 4.0 Facility Requirements
 Chapter 4.0 Facility Requirements Having inventoried the existing infrastructure and forecasted demand, determining airport facility requirements is the next essential step in the airport master planning
The presentation was approximately 25 minutes The presentation is part of Working Group Meeting 3
 This is the presentation for the third Master Plan Update Working Group Meeting being conducted for the Ted Stevens Anchorage International Airport Master Plan Update. It was given on Thursday March 7
MASTER PLAN CONCEPT 1 DRAFT
 The Airport Master Plan Update for Dallas Executive Airport has included the development of aviation demand forecasts, an assessment of future facility needs, and the evaluation of airport development
CHAPTER 1: INTRODUCTION
 CHAPTER 1: INTRODUCTION Purpose and Scope The information presented in this report represents the study findings for the 2016 Ronan Airport Master Plan prepared for the City of Ronan and Lake County, the
Westover Metropolitan Airport Master Plan Update
 Westover Metropolitan Airport Master Plan Update June 2008 INTRODUCTION Westover Metropolitan Airport (CEF) comprises the civilian portion of a joint-use facility located in Chicopee, Massachusetts. The
PLU Airport Master Plan. Master Plan Advisory Committee (MPAC) Meeting #4 March 19, 2018
 Meeting #4 March 19, 2018") PLU Airport Master Plan Master Plan Advisory Committee (MPAC) Meeting #4 March 19, 2018 Meeting Agenda 1. Master Plan Status [5 Minutes] 2. Preferred Forecasts [15 Minutes] 3. Runway Length Options [45
PLU Airport Master Plan Master Plan Advisory Committee (MPAC) Meeting #4 March 19, 2018 Meeting Agenda 1. Master Plan Status [5 Minutes] 2. Preferred Forecasts [15 Minutes] 3. Runway Length Options [45
AIRPORT MASTER PLAN. Newport State Airport. Draft. (Colonel Robert F. Wood Airpark) THE Louis Berger Group, INC. Prepared for: Prepared by:
 THE Louis Berger Group, INC. Prepared for: Prepared by:") Draft AIRPORT MASTER PLAN Newport State Airport () Prepared for: 2000 Post Road Warwick, Rhode Island 02886-1533 THE Louis Berger Group, INC. 20 Corporate Woods Boulevard Albany, New York 12211-2370 Prepared
Draft AIRPORT MASTER PLAN Newport State Airport () Prepared for: 2000 Post Road Warwick, Rhode Island 02886-1533 THE Louis Berger Group, INC. 20 Corporate Woods Boulevard Albany, New York 12211-2370 Prepared
Washington Dulles International Airport (IAD) Aircraft Noise Contour Map Update. Ultimate Operations 5th Working Group Briefing 9/25/18
 Aircraft Noise Contour Map Update. Ultimate Operations 5th Working Group Briefing 9/25/18") Washington Dulles International Airport (IAD) Aircraft Noise Contour Map Update Ultimate Operations 5th Working Group Briefing 9/25/18 Meeting Purpose Discuss methodology of Ultimate build scenario operations
Washington Dulles International Airport (IAD) Aircraft Noise Contour Map Update Ultimate Operations 5th Working Group Briefing 9/25/18 Meeting Purpose Discuss methodology of Ultimate build scenario operations
CESSNA CITATION IIB PW JT15D-4 INTRODUCTION. Runway Analysis provides the means to determine maximum allowable takeoff and landing weights based upon:
 CESSNA CITATION IIB PW JT15D-4 INTRODUCTION Runway Analysis provides the means to determine maximum allowable takeoff and landing weights based upon: Airport characteristics consisting of airport elevation,
3 INTRODUCTION. Chapter Three Facility Requirements. Facility Requirements PEAKING CHARACTERISTICS
 Chapter Three Facility Requirements 3 INTRODUCTION This chapter identifies the long-range airfield and terminal area facilities needed to satisfy the 20-year forecast of aviation demand at Monett Municipal
Airport Master Plan for Montgomery-Gibbs Executive Airport PAC Meeting #3
 Airport Master Plan for Montgomery-Gibbs Executive Airport PAC Meeting #3 Agenda > Introductions > Public Meetings Overview > Working Paper 3 - Facility Requirements > Working Paper 4 - Environmental Baseline
STUDY WORK GROUP MEETING No. 3. November 29, 2016
 STUDY WORK GROUP MEETING No. 3 November 29, 2016 Agenda Welcome and introductions Update project schedule Brief overview of previous SWG meeting Update on aviation forecasts Introduction to airfield demand/capacity
CHAPTER 3 FACILITY REQUIREMENTS
 CHAPTER 3 FACILITY REQUIREMENTS 3.1 INTRODUCTION To properly plan for the future requirements of Newport News/Williamsburg International Airport, it is necessary to translate the forecasts of aviation
6.0 Capital Improvement Program. 6.1 Capital Improvement Plan (CIP)
") 6.0 The addresses the phased scheduling of projects identified in this Master Plan and their financial implications on the resources of the Airport and the City of Prescott. The phased Capital Improvement
6.0 The addresses the phased scheduling of projects identified in this Master Plan and their financial implications on the resources of the Airport and the City of Prescott. The phased Capital Improvement
AERONAUTICAL SURVEYS & INSTRUMENT FLIGHT PROCEDURES
 AERONAUTICAL SURVEYS & INSTRUMENT FLIGHT PROCEDURES Current as of November 2012 ALASKA AVIATION SYSTEM PLAN UPDATE Prepared for: State of Alaska Department of Transportation & Public Facilities Division
CHAPTER THREE AVIATION ACTIVITY FORECASTS INTRODUCTION
 CHAPTER THREE AVIATION ACTIVITY FORECASTS INTRODUCTION The purpose of this chapter is to update the forecasts of aviation activity for the twenty-year planning period addressed in the Update (2007-2027).
Demand Patterns; Geometric Design of Airfield Prof. Amedeo Odoni
 Demand Patterns; Geometric Design of Airfield Prof. Amedeo Odoni Istanbul Technical University Air Transportation Management M.Sc. Program Airport Planning and Management Module 4 January 2016 Demand Patterns;
DRAFT MASTER PLAN UPDATE
 DRAFT MASTER PLAN UPDATE CHAPTER VI: AIRPORT LAYOUT PLAN NARRATIVE DRAFT REPORT APRIL 2017 PREPARED BY: Table of Contents WESTCHESTER COUNTY AIRPORT 6 AIRPORT LAYOUT PLAN NARRATIVE REPORT... 6-1 6.1 AGIS