INVENTORY OF EXISTING FACILITIES & ACTIVITY
|
|
|
- Warren Banks
- 5 years ago
- Views:
Transcription
1 Chapter 2 INVENTORY OF EXISTING FACILITIES & ACTIVITY The first step in the preparation of an airport master plan is the collection of data pertaining to the area that the airport serves. This includes an inventory of existing airport facilities, area planning efforts that might affect this AMPU and historical information related to the airport s development. This section will provide essential background information that will become the baseline for the forecasts and facility requirements. This inventory was conducted using the following sources of information: 1985 Master Plan FAA Form 5010, Airport Master Record on-site visits local property tax maps local zoning ordinances/maps City of Biddeford s Comprehensive Plan environmental documentation airport revenue and expenses interviews with airport management, tenants, and users coordination with local city and county planning representatives federal, state, and local publications, including the Maine Aviation Systems Plan Update AIRPORT RESOURCES This subsection reviews the resources of the airport and its support network. Included is information concerning the airport s location, a brief review of the region s transportation network, and the management structure of the airport, as well as its support network. Airport Location The airport is located on 126 acres of land entirely within the city limits of Biddeford, in Southern Maine 20 miles south of Portland, Maine s largest city, and 35 miles north of Portsmouth, New Hampshire (see ALP Title Sheet in Appendix B).
2 CHAPTER 2 - INVENTORY PAGE 10 The airport s reference point (ARP) (see Appendix A) is located at latitude N, longitude W, with an elevation of 157 feet above mean sea level (MSL). Transportation Network This subsection reviews the various modes of transportation in the region, including aviation, rail, bus, and the highway infrastructure. Regional Aviation - There are five public use airports within 25 miles of the airport. In addition there are a number of privately owned airports, not open to the public. Of the public use airports, only Portland International Jetport has commercial service (schedule airline operations). Just outside the 25 mile arc is Portsmouth International Tradeport, which also has commercial service. Airport (Identifier) Longest Runway Distance NPIAS Class 1 Sanford Regional (SFM) 6, General Aviation Portland International (PWM) 6, Commercial Service Limington-Harmon (63B) 3, General Aviation Littlebrook Air Park (3B4) 2, General Aviation Skyhaven (DAW) 4, General Aviation Rail and Bus - Passenger rail service is available in Saco, Maine through Amtrak. The Saco station is approximately 2.5 miles from the airport. The Guilford Rail System provides freight service throughout Maine and New England. Guilford uses the same tracks as Amtrak through the city of Biddeford. The nearest large service yard is in Portland. The Tri-Town Shuttle Bus Service provides commuter service between the cities of Biddeford and Portland; however the closest stop to the airport is in downtown Biddeford, approximately 2.5 miles away. Regional service is available from Portland. Highway/Road Network - The main route along the airport and through the city of Biddeford is U.S. Route 1, which connects to Portland and points north as well as Portsmouth, NH and points south. Interstate 95 (Maine Turnpike) is approximately 1.5 miles north. 1 National Plan of Integrated Airport Systems (See Appendix A).
3 CHAPTER 2 - INVENTORY PAGE 11 Airport Access The only access to the airport is via Landry Street that connects to U.S. Routes 1 and 111, and Interstate 95 to the west. Management and Services This section addresses the current management structure of the airport and basic services. Management Structure - The airport has a part-time manager on site, normally 5-days per week, who reports to the city manager. All funding issues must be approved by the city council. Crash, Fire, and Rescue (CFR) Services - The airport does not have CFR services on site. The nearest fire station is on Alfred Street, approximately 2.5 miles and six minutes away. There is an emergency telephone resource located at the airport (across the main access road from the FBO) that provides communications via a wireless network to dispatchers. Snow Removal Airport personal handle all snow removal operations at the airport. Equipment is airport owned and operated and stored outside at the airport. The airport does not have a dedicated snow removal equipment building. Airport Maintenance - Maintenance is handled by the airport manager. Minor concerns are dealt with directly; major or more complicated problems are contracted out as necessary. Grass mowing is handled by the city Public Works Department. SOCIOECONOMIC CHARACTERISTICS This section describes the socioeconomic characteristics of the community; in particular the demographics (population and income) within the airport s service area. This information will be further analyzed in Chapter 3 (Forecasts) in projecting future demand for the airport and its facilities and services.
4 CHAPTER 2 - INVENTORY PAGE 12 Service Area The airport s service area (see Appendix A) is approximately 25 miles; however the area is not a perfect circle. Two other airports in the region will influence the size and shape. Portland International Jetport to the north and Sanford Regional to the southwest both influence decisions to use the airport. For planning purposes, the demographics of York County will be used. York County York County is the southern most county in the state. It s also one of the fastest growing regions with the highest level of income, both of which influence aircraft ownership, the number of pilots, and disposable income. The economy and business infrastructure weighs heavily on the use of air transportation. These concepts will be further developed in Chapter 3 (Forecasts). Demographics Vital statistics are indispensable in studying social trends and making important decisions concerning the growth of aviation in the region. Population studies yield knowledge important for planning, particularly by governments, and assist in developing plans for airport support and the potential for expansion. Population The population of the city in 1990 was 20,710. As of the census of 2000, there are 20,942 people, 8,636 households, and 5,259 families residing in the city of Biddeford. The population of York County as of the 2000 Census was 186,700. This is a 13.5 percent increase since By comparison, the State of Maine s population grew by 3.8 percent during the same period. 2 Income The median income for a household in the city of Biddeford as of the 2000 census was $34,976, and the median income for a family is $44,109. The estimated median household income in York County was $40,886 at the end of calendar year Of the sixteen counties in Maine, York County has the third highest income level. Cumberland County, which borders York County to the immediate north, has the highest level at $42,
5 CHAPTER 2 - INVENTORY PAGE 13 FINANCIAL This subsection addresses airport revenue and expenses, which will be used as the basis for developing a financial plan in the final section of this report. More importantly, a review now of the airport s revenue and expenses will assist in developing alternatives for future development, and will aid the city in formulating financial plans. This section briefly describes the various leases and user fees the airport charges. 4 Revenue and Expenses This section reviews historic revenue and expenses for the past two fiscal years (FY). Sources of Revenue This section describes the various sources of airport generated revenue. Lease of Buildings, Hangars, and Office Space - The city owns several buildings on the airport that it leases out for commercial purposes to a single enterprise for $1, per month. Biddeford Aviation leases several buildings and ramp space from the city 5, which includes: old terminal building situated on the north side of existing ramp, a structure of block frame with pitched roof of wood frame, 16' x 34' (544 square feet). new terminal, attached hangar, and workshop, situated on the west side of the existing ramp, a metal sided structure 24' x 63' (1512 square feet) utilized as terminal, offices and rest rooms. Attached to terminal building are a 50' x 63' (3200 square feet) metal hangar; and a 15' x 50' (765 square feet) area utilized for workshop and parts storage; with associated apron area 30' wide in front of structure. Tie-down parking for five aircraft to accommodate the FBO s own aircraft and customer aircraft awaiting service hangar building, situated on the west side of the existing ramp, a metal hangar 63' x 83' (5040 square feet) of metal frame and skin, utilized for aircraft storage; with associated apron area 30' wide in front of structure. aviation fuel dispensing system, included in the lease is an underground 10,000 gallon avgas tank and related pipes, fixtures, and equipment. 4 Data provided by R. Lagarde (City Finance Director) March Lease and Operating Rights Agreement between the city of Biddeford and Delano Enterprises, LLC., dated September 2, 2003
6 CHAPTER 2 - INVENTORY PAGE 14 Ramp/Apron Space - The city charges based aircraft $30.00 per month and itinerant aircraft $3.00 per night for the use of its apron space, with tiedowns. Fees are collected by the FBO and split 50/50 with the city. The city s portion totaled $2, in FY-2001 and $2, in FY Land Lease - A hangar development program has been underway for several years in an area on the north side of the airport s main ramp. To date, 16 hangars have been built, or are in the process of being developed in this area. While the hangars are privately owned, each owner pays an annual lease to the city for the land as well as property taxes on the structures. The current rate averages $400 per year. Land lease funds are appropriated to the airport account while taxes are directed to the city s general fund. A total of $5, was collected in land lease fees in FY-2002 and $8, in hangar property taxes assessed for FY Landing fees - The airport does not collect landing fees. Fuel Flowage Fees - The FBO collects a $0.05/gallon fuel flowage fee for the city, which is in addition to federal and state taxes, and profits. Funds transferred to the airport account in FY total $1, and $1, in FY Expenses Airport expenses are directed primarily at maintenance and utility costs, with a small manager s stipend paid until the end of FY The largest expenses during the two years studied were for pavement sealing and pavement stripping. Financial Summary As Table 2-1 shows the airport was generally self-supporting during the past two fiscal years, generating revenue totaling $20, in FY-2001 and $21, in FY-2002 against $27, expenses in 2001 and $8, in In addition the city collected property taxes on hangars totaling $3, in 2001 and $8, in 2002.
7 CHAPTER 2 - INVENTORY PAGE 15 National Plan of Integrated Airport Systems The National Plan of Integrated Airport Systems (NPIAS) is submitted to Congress and identifies existing airports 3,364 in 2001 that are significant to national air transportation and contains funding estimates in infrastructure development that is eligible for federal aid that will be needed over the subsequent 5 years to meet the needs of all segments of civil aviation. Title 49 USC 18 requires that airport grant applications propose airport development or airport planning only in connection with public-use airports included in the National Plan of Integrated Airport Systems (NPIAS). 6 The basic support and justification for airport grants authorized by Congress are that such grants are required to help develop the airport system described in NPIAS. Airports are included in the NPIAS on the basis of their roles in providing air transportation. Further, airports are divided into two categories that reflect the type of service provided the community. The service level also represents statutory funding categories associated with the airport grant program. Airport categories include commercial service and general aviation airports. General aviation airports are further divided into three groups, reliever, privatelyowned public-use, and other general aviation airports. Biddeford falls within this last group under the latest NPIAS 7. 6 Section 47105(b)(2) of Title 49 United States Code (U.S.C.) 7 NPIAS
8 CHAPTER 2 - INVENTORY PAGE 16 Table 2-1 Airport Expenses and Revenue Description Expenses Revenue FY-2001 FY-2002 FY-2001 FY-2002 Managers Salary Payroll $2, FICA $ Medicare $41.23 Insurance $ Repairs-Maintenance Equipment $ Buildings $9, $1, Grounds $2, $5, Other $10, $50.63 Utilities Sewer User Fee $ $ Water $49.81 Telephone $ $ Electricity $1, $1, Miscellaneous Fees State Treasurer $50.00 Fuel Surcharge (Flowage Fee) $1, $1, Tie-Downs $2, $2, Hangar Rental (Land Lease) $3, $5, FBO Lease $13, $12, Totals $27, $8, $20, $21, Taxes Assessed on Hangars* $3, $8, * For tax years 2002 and Funds not appropriated to airport account. Source: R. R.Lagarde (City Finance Director) March 2003 By definition a general aviation airport in this category must have at least 10 based aircraft and be at least 20 miles from the nearest (other) NPIAS airport. In addition, these airports are largely intended to serve the needs of general aviation users (users who conduct non-military operations not involving the carriage of passengers or cargo for hire or compensation). Reliever airports on the other hand have the function of relieving the congestion at a commercial service airport and providing more general aviation access to the overall community. The airport held this classification for a short period from 1998 to 2001.
9 CHAPTER 2 - INVENTORY PAGE 17 In the NPIAS the airport was listed as general aviation airport, but was projected to upgrade to reliever airport status for the Portland International Jetport in five years. By the time the next NPIAS update was published ( ) the airport was designated a reliever airport. However this higher service level reverted to general aviation status when the latest NPIAS was published in The reason for this change is not clear, but probably relates to the communities desires following a referendum in and lack of development since. Without this development the airport could not meet FAA standards as a reliever airport (longer runway, runway alignment, apron and tiedown areas, etc.). The difference between its current designation general aviation airport and reliever airport is the level of funding the airport and community can expect. Reliever airports by virtue of their function will normally receive a higher share of federal (and possibly state) funds. However, the airport s designation does not in itself entitle the airport to funds through the AIP grant process. Historic Funding The city of Biddeford has received federal grants totaling $210,450 since 1983 (see Table 2-2). In addition, the State has contributed close to $14,500 in grants (exclusive of federal grants and matching funds) for projects that include those shown in Table 2-3. Table 2-2 Federal Grant History (FAA Share) Grant Number Year Description Amount AIP Airport Master Plan Study $47,923 AIP Land Acquistion Cancelled AIP Acquire land for approaches $48,317 AIP Update Airport Master Plan $114,210 AIP Purchased Snow Removal Equipment $225,720 Total $436,170 Source: FAA New England Region (January 2005) 8 The 1990 Maine Aviation Systems Plan indicates that the city of Biddeford held a special election in 1988 in which a referendum was placed on the ballot asking voters to decide if the 1985 Airport Master Plan s recommendations (new east-west runway, expanded ramp areas, and tie-downs) should be develop. The referendum was voted down in 1988, and development was put on hold.
10 CHAPTER 2 - INVENTORY PAGE 18 Table 2-3 State Grant History (State Share) Fiscal Year Description Total Cost Acquired and installed equipment to establish a supplemental weather 1990 $7,150 station (FAA Part 135 requirement) 1991 Tree clearing, grubbing, approach to Runway 24 $7, Clear trees and brush (7 acres) approach to Runway 6 $7, Overlay Runway 6-24 and mark with basic markings $99, Install medium intensity runway lights on Runway 6-24 $15, Replaced airport rotating beacon pole $2, Installed taxiway system from existing apron to leasehold parcels $6, Airport Master Plan Update $6, Purchased Snow Removal Equipment $5,783 Source: MDOT/OPT (January 2005) Total $145,466 Capital Improvement Plan With the exception of this update, there are no current projects listed in the State s Capital Improvement Plan (CIP). The CIP will be updated to show future projects pending the approval of this AMPU and inclusion by MDOT/OPT. AIRPORT GEOMETRY AND DESIGN STANDARDS This subsection discusses the various geometric and design standards at the airport. Two key and interrelated components, the design aircraft and airport reference code, are critical in establishing the dimensions of airport surfaces (runways, taxiways, aprons, etc.). The Existing Facilities Plan (Appendix B) is a scaled drawing of existing land and facilities that reflects current FAA design standards and planning criteria, which is based, in part, on the current airport reference code.
11 CHAPTER 2 - INVENTORY PAGE 19 Airport Reference Code The airport s reference code (ARC) determines many of the airport s design parameters and is defined in Appendix A. The ARC is composed of two elements: the aircraft approach speed represented by a letter (A, slowest through E, fastest), and the aircraft wingspan, symbolize by a Roman numeral (I, smallest through VI, largest). Combined, the two elements indicate to planners the size and landing speed of the design aircraft for a particular airport. See Table 2-4. The last AMPU relied on an older FAA system of establishing airport classifications and thus its design standards. In 1985 the airport was designated as a Basic Utility Stage II airport. This categorization meant the airport could accommodate 95 percent of the general aviation fleet, primarily propeller driven aircraft weighting less than 12,500 pounds. It also established the approach category as A and B with a wing span up to 79 feet in length. Essentially, the system remains the same today, only the semantics have changed. With an ARC classification of A-II, Table 2-4 Airport Reference Codes Wingspan Range (feet) < <91 A-I A-II A-III A-IV A-V A-VI Approach Speed (knots) B-I B-II B-III B-IV B-V B-VI C-I C-II C-III C-IV C-V C-VI D-I D-II D-III D-IV D-V D-VI 166> E-I E-II E-III E-IV E-V E-VI Source: FAA AC 150/ (Design Manual) Pilatus PC-12

12 CHAPTER 2 - INVENTORY PAGE 20 the airport supports aircraft in the approach category A with a wingspan up to 79 feet. The primary difference today compared to 1985 rests with the quantity of aircraft that use the airport and the fact that the number, type, size, and speed of general aviation aircraft has changed considerably since the mid 1980s. Under FAA guidelines the ARC is based on the largest and fastest aircraft that conducts at least 250 landings and takeoffs (500 operations) per year. This aircraft is referred to as the design, or critical aircraft, and it too has changed since the last AMPU. Design Aircraft A critical planning task is to identify the most demanding aircraft that is either currently using or is expected to use the airport throughout the planning period. This, in turn, determines the ARC that was addressed in the previous subsection. The wingspan and landing speed of the design aircraft establishes the airport reference code, which in turn, establishes the geometric design criteria of the airport, including runway length. Based on the data provided by the FBO 9, the existing design aircraft is the Pilatus PC-12 (Figure 2-A). It is estimated that the PC- 12 lands an average of five to six times per week (10-12 operations), totaling 520 to 600 operations per year. Coastal Aviation Services has a contract to perform maintenance on a fleet of PC-12 aircraft, built by Pilatus Aircraft Ltd., in Stans, Switzerland. The PC-12 is used primarily for passenger and small cargo transportation. Figure 2-A Biddeford Existing Design Aircraft: Pilatus PC-12 Source: photo by Jon Youngblut 9 D. Carter, Owner/Operator of Coastal Aviation Services (August 2002) (former FBO).
13 CHAPTER 2 - INVENTORY PAGE 21 Pilatus PC-12 Specifications and Performance Wing span feet Approach speed...85 knots (106 mph) Length Overall feet Height overall feet MGTOW ,920 pounds Passenger Seats (depending on configuration) Normal Takeoff Distance...2,300 (at sea level, MGTOW, 59 F) 11,12, 13 Adjusted Takeoff Distance...2,499 (MGTOW, 79 F) 80 percent Load Takeoff Distance...2,299 (80 percent load, 79 F) Normal Landing Distance...1,830 (sea level, maximum landing weight, 59 F) Adjusted Landing Distance...2,368 feet (maximum weight, 82 F, wet runway) 80 percent Load Landing Distance...1,894 feet (80 percent load, 79 F) Design Aircraft/ARC Summary The ARC classification of A-II is a change from the previous master plan that indicated the Beech King Air 90 was the design aircraft in the mid-1980s. The King Air 90 has the same wingspan (53 feet), but with its higher approach speed (101 knots), it is in the ARC group B-II. The King Air 90 and its larger version, the King Air 200, do not operate in sufficient numbers at this time to qualify as the design aircraft. Building Restriction Line The building restriction lines (BRL) are placed on airport plans to identify suitable building-area locations and to determine if existing conditions are in compliance. The BRL encompass the runway protection zone, obstacle free zone, the runway object free area, critical areas of the various navigation aids, and areas required for terminal instrument procedures. BRL dimensions are addressed by the FAA, but the specific location is left to individual planners who adopt standards based on experience, and individual airport needs. It is, in essence, a composite of several factors, based on individual airport layouts. 10 MGTOW Maximum gross takeoff weight 11 This distance represents the computed takeoff distance under the conditions shown and has no bearing on the runway length available. Aircraft operating weights would be adjusted or the pilot would wait for cooler temperatures or a dry runway surface. 12 AC 150/5325-4A (Runway Length Requirements for Airport Design) 13 Dufresne-Henry, Inc., analysis, with calculations based on AC 150/5325-4A
14 CHAPTER 2 - INVENTORY PAGE 22 Biddeford BRL The BRL was determined by establishing a parallel line from each runway at a distance of 140 feet from the edge of the primary surface (discussed later). The 140-foot distance was established by assuming a building height of 20 feet above the surface and multiplying it by 7. This represents the 7:1 ratio of the transitional surface that connects to the primary surface. The primary surface for Runway is 500 feet wide centered on the runway centerline, or 250 feet outward from each runway centerline; this sets the BRL at 390 feet from the centerline. Key concepts that concern the BRL are as follows: The BRL slopes upward and outward, starting at the edge of the primary surface at a 7:1 slope. Heights are based on perpendicular runway centerline elevations. If the ground rises or lowers, the allowable height is adjusted accordingly. The 20-foot building was used as a baseline and does not restrict taller buildings provided they do not penetrate the protected airspace around the airport, or exceed local zoning regulations. 14 Because of the previous concept, buildings shorter than 20 feet can be closer to the runway surface, provided they do not penetrate the BRL surface. BRL Infringements Several buildings and hangars penetrate the BRL. This includes the maintenance/storage hangar on the main ramp and possibly several privately owned homes along Granite Street on the south side of the airport (see Existing Facilities Plan in Appendix B). Hangar #2 is 18 feet high and sits 100 feet from the edge of the primary area. Without a waiver its maximum allowable height is 14.3 feet. Four privately owned homes along Granite Street rest inside the BRL, however their exact height is not known. 14 City of Biddeford Zoning Ordinance dated December 2001, Article V, Section 6.A, Table B sets the maximum height in Industrial Zones I and II as 60 feet; however, Article VI, Section 4, limits the height of structures in the approach zone not to exceed a 20:1 slope from the ultimate runway end.
15 CHAPTER 2 - INVENTORY PAGE 23 The home closest to the runway rests 62 feet from the edge of the primary surface. The maximum height before penetrating the BRL would be 8.9 feet. A survey will be necessary to determine the exact height. The city has no legal jurisdiction to preclude airspace obstructions to homes off-airport property, except as authorized by the city s zoning ordinance, which only restricts the overall height of objects 15 and controls the height of objects in the airport s approach zones 16. However, the city code does not clearly spell out the lateral dimensions of the approach zone. FAR Part 77 Surface Analysis The FAA regulates and defines the airspace surrounding airports in order to protect the safety of aircraft operations. This is done through Federal Aviation Regulation (FAR) Part 77, Objects Affecting Navigable Airspace. Each airport s airspace is dictated by a set of geographic surfaces, referred to as imaginary surfaces, which extend outward and upward from airport runways. These theoretical surfaces identify the maximum acceptable height of objects beneath and within stated boundaries. The height and dimensions of the imaginary surfaces are determined by the airfield elevation, the size of the aircraft using the facility, and the type of runway approaches available at the airport. The ultimate FAR Part 77 Plan is located in Appendix B. Imaginary Surfaces - Airports that only serve aircraft in visual conditions require less protected airspace than airports that serve aircraft in virtually all weather conditions. That is, the lower aircraft are permitted to fly in navigable airspace in poor weather (i.e., low cloud heights and visibility), the more airspace the FAA and airport operator must protect. The airspace around an airport and leading to and from its runways is more protected the closer it lies to the airport and the extended centerline of the runway. FAR Part 77 lists several different types of imaginary surfaces; each with its own dimensions and slope (see Appendix A). These areas include primary surfaces, approach surfaces, transitional surfaces, conical surfaces, and horizontal surfaces. Surface Dimensions - The size of each imaginary surface is based on the category of each runway according to the type of approach surface available or planned for that runway. The slope and dimensions of the approach surface applied to each end of a runway are determined by the most precise approach existing or planned for that runway end. Table 2-5 defines the approach surface dimensions, which are based on a utility airport (see Appendix A for definitions and applications). 15 Biddeford Zoning Ordinance (Updated, December 2001), Article 5 6[A] Table B 16 Biddeford Zoning Ordinance (Updated, December 2001), Article VI, 4
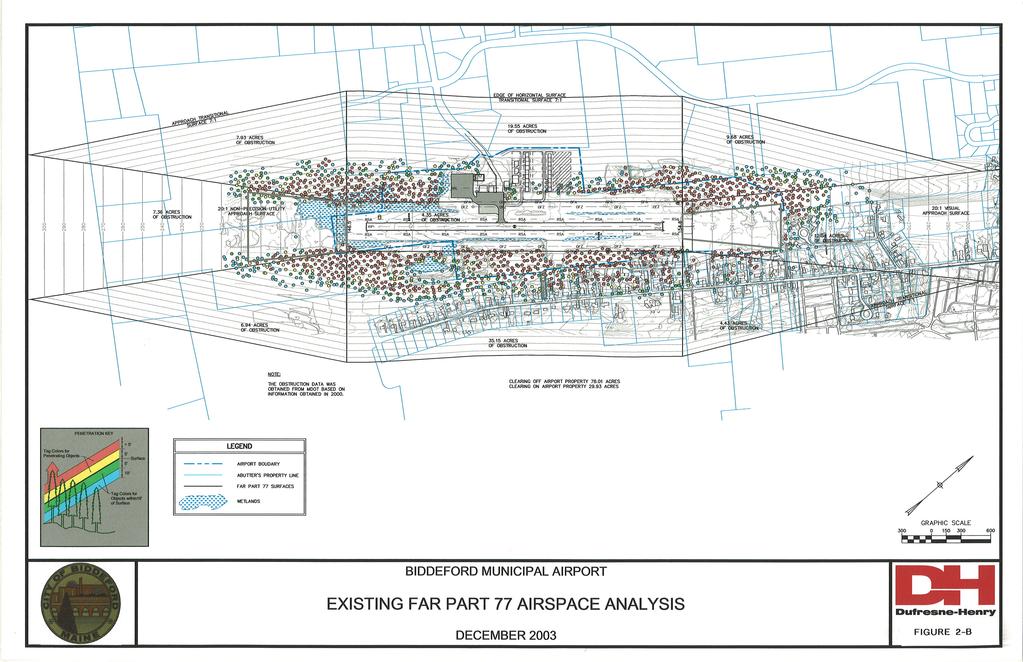
16 CHAPTER 2 - INVENTORY PAGE 24 Table 2-5 Existing PART 77 Surface Dimensional Standards Runway Controlling IAP Visibility Minimums Utility Runway Inner Outer Width (W1) Width (W2) Length Slope 6 GPS 1 mile Yes 500 2,000 5,000 20:1 24 Visual n/a Yes 250 1,250 5,000 20:1 Source: FAR Part Obstructions - Obstructions include both manmade (towers, buildings, antenna, etc.) and natural (trees, shrubs, terrain) objects that penetrate into the imaginary surfaces discussed above. All obstructions appear to be vegetation, mostly trees, with some low lying shrubs along the runway surface. Figure 2-B is an obstruction analysis drawing that shows existing and potential obstructions both on- and off-airport. Table 2-6 shows the total area covered by obstructions, as reported in acres for both on- and off-airport. Easements Table 2-6 Existing Obstructions On-Airport Off-Airport Total Area in acres Source: Dufresne-Henry, Inc., analsysis using data provided by MDOT/OPT The airport owns a single avigation easement (see Appendix A) over a parcel located in the Runway 24 approach surface. It is referenced in the city of Biddeford Deed of Registry, Book 8149, Page 226, as transferred by reference to Book 1468, Page 241. AIRSIDE FACILITY INVENTORY The inventory of existing airport facilities at the airport was accomplished through a collection and review of available plans and records, and discussions with city officials and local tenants. Facilities are divided into three sections: airside, landside, and miscellaneous. Airside facilities include runways and taxiways and their supporting infrastructure, such as signs, lighting, and other components, that are described in this subsection.
17
18 CHAPTER 2 - INVENTORY PAGE 26 Runway Inventory The airport has a single paved runway, Runway The runway was originally built as a 2,000 foot surface in 1960 and was extended to its current length in The runway is in poor condition with both lateral and longitudinal cracking. Its most recent runway pavement condition (PCI) index is 65. PCI is a relative rating based on a scale of 0-100, with zero being totally unusable and 100 being a new surface in perfect condition. Table 2-7 provides runway details. Runway Safety Areas The runway safety area (RSA) (see Appendix A) is centered on the runway centerline and extends beyond the ends of each runway (extended RSA), as well as along the sides (side RSA). The RSA follows the terrain and ideally, provides a smooth, safe overrun area for aircraft, and sound support for vehicles. The RSA length, which extends beyond the runway end, and RSA width, which extends outward along the sides of the runway, is governed by FAA airport design criteria. The dimensions of the geometric areas are based on the airplane design group is a component of the ARC. Table 2-8 shows the required and actual dimensions of the RSAs. Table 2-7 Runway Data Object Runway 6 Runway 24 Length Width Composition Condition Pavement Condition Index Weight Bearing Capacity 3,011 Feet* 75 Feet Asphalt Poor 65 25,000** Alignment (true) End Elevation feet feet Gradient 0.3% up 0.3% down * FAA Form 5010 lists the runway length as 3,011 feet. Site inspection measurement set the length at 3,001 feet, and FAA System Standards lists the runway length at 3,000 feet. ** Single wheel Source: FAA 5010 Form and MDOT/OPT.
19 CHAPTER 2 - INVENTORY PAGE 27 Table 2-8 Runway Safety Area Runway Approach Category Design Group Required Length Actual Length Required Width Actual Width 6 A II A II Distances in feet Source: AC 150/ (Table 3-1) The runway edge safety areas meet FAA standards. The Runway 6 End RSA is approximately 220 feet long, 80 feet short of the required length. The end slopes downward into a wetland area. Refer to the Existing Facilities Plan (Appendix B) and the photograph in Figure 2-C. The photograph shows the demarcation line at approximately 220 feet from the runway end where the ground begins to slope into the wetlands area. The Runway 24 End RSA extends for approximately 180 feet, 120 feet short of the required length. Vegetation has grown in this area and the surface is not graded as required to FAA standards as shown in Figure 2-E. Runway Protection Zones Runway protection zones (RPZ) are a trapezoidal area off the end of the runway to enhance the protection of people and property on the ground in the event an aircraft lands or crashes beyond the runway end. RPZs underlie a portion of the approach closest to the runway. The size is based on the approach minimums, visibility, and type of aircraft the airport is expected to serve. The larger and faster aircraft are, and the lower they can fly on an approach to the airport, the larger the RPZ is required to be. The airport owner is required to have a sufficient interest in the

20 CHAPTER 2 - INVENTORY PAGE 28 RPZ to protect it from both obstructions and incompatible land use. In addition, the airport owner is required to work to attain compatible zoning around the airport to prevent incompatible land uses that could cause sufficient conflict to endanger the airport and cause it to be closed or require substantial remedial investment to purchase conflicting developed property. Compatible land use within the RPZ is generally restricted to agricultural, golf courses, and similar employment that do not involve congregations of people or construction of buildings or other improvements that may be obstructions. Changes to the character of the airport (i.e. a longer runway), which would in turn permit larger and heavier aircraft to use the facility, could result in the need for a larger RPZ. Table 2-9 shows the required sizes and the non-conforming issues as they exist today. Existing RPZ locations are shown on the Existing Facilities Plan (Appendix B). Figure 2-C Runway 6 Safety Area Source: Dufresne-Henry, Inc. photograph (August 2002)
 Table 2-9 Existing Runway Protection Zones Runway Standards Length Inner Width Outer Width Area Non Conforming Issues Approach 6 Category A & B Visibility not lower 1,000 500")
21 CHAPTER 2 - INVENTORY PAGE 29 Figure 2-E Runway 24 Safety Area Source: Dufresne-Henry, Inc. photograph (August 2002) Table 2-9 Existing Runway Protection Zones Runway Standards Length Inner Width Outer Width Area Non Conforming Issues Approach 6 Category A & B Visibility not lower 1, than 1 mile Obstructions (trees and shrubs). Approximately 90% of the RPZ is not under control of the airport. Small Aircraft 24 1, None Exclusively Distances in feet, area in acres Source: AC 150/ , Table 2-4
22 CHAPTER 2 - INVENTORY PAGE 30 Runway Obstacle-Free Zone The runway obstacle free zone (OFZ) extends beyond the RSA, but unlike the RSA, the OFZ is a volume of airspace at and above the runway surface. The RSA does not follow the terrain, but is a level plane even with the runway surface. Like the RSA, the OFZ prohibits taxiing and parked aircraft and all objects that penetrate the area with the exception of frangible visual navigation aids (lights and electronic systems) that need to be in the OFZ because of their function. OFZ Dimensions - The OFZ is required to meet two different standards based on aircraft size (small and large aircraft) and the approach visibility minimums. The dimensional standards of the OFZ require 200 feet at each runway end and 250 feet along the edges. 17 The OFZs are shown on the Existing Facilities Plan (Appendix B). OFZ Deficiencies - There are no deviations from FAA requirements pertaining to the OFZs. Runway Object-Free Area The Runway Object-Free Area (ROFA) is yet another extension of the safety area surrounding a runway. Like the OFZ, the ROFA is also a two dimensional surface on a level plane with the runway surface, but is less restrictive then the RSA and OFZ. Taxiing aircraft and other nonfrangible objects can be located within the ROFA, but parked aircraft and certain other objects are prohibited. ROFA Dimensions - The size of the ROFA is based on the airplane design group and approach category for the runway. Table 2-10 shows the required and actual ROFA that reflect the 130 foot discrepancy between the required and actual width because of the proximity of the aircraft apron (main ramp). ROFA Deficiencies - There are approximately 12 aircraft tiedowns on the main ramp that lie within the ROFA. 17 The OFZ sides are based on the premise that the airport only serves small aircraft with approach speeds of 50 knots or more (AC 150/ , paragraphs 306.a. (1) (b).
23 CHAPTER 2 - INVENTORY PAGE 31 Table 2-10 Runway Object Free Area Runway Approach Category Design Category Required Width Actual Width Required Length Actual Length 6 A II Visual II Distances in feet Sources: AC 150/ , Table 3-1 Taxiway/Taxilane Design A standard right angled exit taxiway connects the runway to the northeast side of the main ramp (see Existing Facilities Plan in Appendix B). The taxiway is located almost equal distance between the two runway thresholds (1,640 feet from the Runway 24 threshold and 1,370 feet from the Runway 6 threshold). This surface is classified as a stub taxiway because of its purpose and location, a short connector between the parking apron and runway. The stub is 50 feet wide and 90 feet long, including the radii at its ends. There is ample room on either side of the taxiway to meet minimum FAA standards for required safety areas. An unlighted 35 foot wide taxiway connects the main ramp with the new hangar development on the east side of the terminal area. This surface is in excellent condition. Additionally, there is a short taxiway connecting the main and west ramps. This surface varies in width from 70 to 40 feet and is in poor condition. The surface edges are undermining from water and snow runoff. Taxilanes Taxilanes provide access from taxiways (usually an apron taxiway) to airplane parking positions and other terminal areas. They also provide access through aircraft parking aprons. Like taxiways and runways, taxilanes must meet minimum width requirements as well as safety area clearance.
24 CHAPTER 2 - INVENTORY PAGE 32 Taxilane Configuration - There are a series of taxilanes on the airport. The main taxilane connects the stub taxiway connected to the runway and leads to the main building and fueling area (refer to the Existing Facilities Plan in Appendix B). In addition, several other taxilanes provide access to the two aircraft parking ramps (main and west ramp). Taxilane Dimensions - Taxilane dimensions are less than required. The exception is on the main ramp that permits a circular flow of traffic depending on the number and size of aircraft parked in the center tiedown area (refer to the Existing Facilities Plan in Appendix B). In any case, the taxilanes do not meet the minimum criteria for small aircraft. The average width of the taxilanes is feet, where 75 feet is the minimum recommended. The typical aircraft has a wingspan of approximately feet, leaving 15 feet of clearance on either wingtip. The airport is classified in airplane design group II meaning aircraft can easily have a wingspan of 78 feet, leaving to no room for ground maneuvering, including the east side of the main ramp where transient aircraft would taxi for fuel, servicing, and passenger movement. Airport Lighting This subsection discusses the various aviation-related lighting systems found at the airport. Runway Lights The airport is equipped with medium intensity runway lights (MIRL) placed on either side of the runway spaced approximately 200 feet apart, forming an outline of the runway. These lights are placed on metal poles (approximately 24 inches high) to elevate them from any obstructions such as tall grass and snow. The MIRL system is old, subject to frequent outages, with a design that frequently results in toppled lights because the poles are not securely fastened to the base unit. Runway End Identifier Lights Runway end identifier lights (REIL) units are located on both sides of the approach end of Runway 6, and are synchronized to flash together two times per second. Each light is unidirectional, and are pointed approximately 15 degrees away from the centerline. Like the MIRL, these units turned on when activated by radio signal and both lights appeared to be working as required. The units are in fair to poor condition. Runway 24 is not equipped with REILS. Vertical Light Guidance Systems - Runway 06 is equipped with a 4-light VASI system (V4L) located on the left side of the runway set at 132 and 735 feet respectively. The lights appear to be in fair condition.
. 18 Figure 2-F Airport Threshold Lights Source: Dufresne-Henry, Inc.")

25 CHAPTER 2 - INVENTORY PAGE 33 Threshold Lights Both runway ends are equipped with threshold lights, however the units are located off to the side of the runway instead of along the end. The lights are in very poor condition, and are subject to frequent damage from vandalism (see Figure 2-F). 18 Figure 2-F Airport Threshold Lights Source: Dufresne-Henry, Inc., photograph (August 2002) Taxiway Lights - Blue in color, taxiway lights serve the same purpose as runway lights by providing an outline of the taxiway. There are two taxiway lights located on each side of the stub taxiway marking the exit and entrance to/from the runway. There are no lights on the other two taxiways mentioned earlier. The taxilanes are not lighted. 18 These lights were subsequently repaired by the local Experimental Aircraft Association (EAA) chapter, but indicate the need for airport security fencing and increased vigilance.
26 CHAPTER 2 - INVENTORY PAGE 34 Rotating Beacon - The airport has a standard white and green beacon mounted atop a 39 foot steel pole, located directly behind the maintenance hangar. It is a Manairco AB-1000A, twolight, 400,000 candlepower, 40 mile unit, and is in excellent condition. 19 This unit is equipped with a photosensitive cell that activates the light during the hours of darkness. However, this particular unit is not approved under FAA specifications L801A. Pavement Markings Airport pavement markings are grouped into four areas: runway markings, taxiway markings, holding position markings, and other markings. Markings for runways are reflective white, taxiways and holding position markings are reflective yellow. Runway Markings - There are three types of markings for runways: visual, non-precision, and precision. The runway environment is incorrectly marked as a visual runway with runway designation, centerline, and edge markings. The runway should be marked as a non-precision runway, with the addition of threshold marking strips. Otherwise the markings are in good condition, meet FAA standards for size, and color, and are easily recognizable from the air or the ground. Taxiway/Taxilane Markings - The exit stub taxiway is marked according to standards; however there are no taxilane markings with the exception of a short strip on the main ramp from the exit taxiway to the fueling area and along the southern most tiedown zone. Markings are faded and would be difficult to see during heavy rain and at night. Airport Signage - Airport signs to aid pilots are non-existent. At a minimum there should be a runway exit sign on either side of the stub taxiway leading pilots to the ramp area. A second sign warning pilots that they are approaching a runway as they taxi off the main ramp should also be installed. LANDSIDE FACILITY INVENTORY Landside facilities include buildings and operating surfaces not associated with flight operations. Included in this category are aprons and associated aircraft tiedowns, hangars, service and storage buildings, administrative buildings, FBOs, and other aviation and non aviation related businesses at the airport. 19 The rotating beacon was replaced in July 2001
27 CHAPTER 2 - INVENTORY PAGE 35 Aircraft Parking Capacity This section addresses the airport s ability to park and store aircraft. Apron areas, and associated tiedown spaces, along with hangar facilities, were inventoried and inspected, and the individual and overall capacity of each facility examined, as well as the aggregate capacity for the airport. This is an important issue because as it will be shown, demand has already exceeded the allowable capacity of the airport in terms of ramp space. The preferred apron is one that is paved and of adequate size to handle based and transient aircraft, and should be marked and equipped with tiedown locations to provide a means of securing aircraft. The airport has two aprons serving based and transient aircraft. Aprons The based and itinerant aprons are located on the north side of the airport in two paved areas, both of which currently exceed their design capacity. Main Ramp - The main ramp in front of the FBO is the itinerant overnight parking area, fueling area, and maintenance aircraft apron. While not specifically designated for based aircraft parking, some based aircraft are parked in this area because the west ramp is filled to capacity. A large portion of this apron extends into the runway OFA where aircraft are parked in violation of FAA design standards (see ROFA Deficiencies, Page 30) and approximately one-third is used for refueling and aircraft maneuvering, leaving approximately 6,250 feet for parking. Size: 210 x 250 (52,500 square feet) Capacity: Space for 4 aircraft (outside the OFA), but marked for 10 Average Loading: 6 aircraft Condition: Fair most recent sealing has settled leaving depressions that are filling with dirt and allowing grass and weeds to grow. See Figures 2-G and 2-H West Ramp - The west ramp is the primary based aircraft parking area. Size: 220 x 230 (50,600 square feet) Capacity: Space for 16 aircraft Average loading: 16 aircraft Condition: Fair - longitudinal cracks and grass growing in paved areas See Figures 2-G and 2-I
 Hangars Hangars come in three general forms, conventional hangars (a box shaped structure with usually one aircraft entry door) T-hangars, which when viewed from above take")
28 CHAPTER 2 - INVENTORY PAGE 36 Figure 2-G Main and West Ramps Source: Dufresne-Henry, Inc., photograph (August 2002) Hangars Hangars come in three general forms, conventional hangars (a box shaped structure with usually one aircraft entry door) T-hangars, which when viewed from above take the shape of the letter T, and combination hangars (T-units with conventional units on one or both ends). Conventional hangars are designed to hold anywhere from one to several aircraft, depending on the structure s footprint and size of aircraft, and are typically used for business and corporate use. T-hangars are designed to hold one aircraft, but are multiple units clustered together, typically six or more units, and are typically used to store privately owned aircraft, and can house small business enterprises, such as avionic shops.

29 CHAPTER 2 - INVENTORY PAGE 37 Figure 2-H Main Ramp In Front Of FBO Source: Dufresne-Henry, Inc., photograph (August 2002) A hangar development program has been underway for several years. A private developer has built 15 conventional hangars in an area east of the terminal area adding considerable capacity to the airport. Table 2-11 lists the hangars as well as their size, capacity, and condition. Three hangars (#5, 6, and 7) are used for both aircraft storage and business purposes. Hangar capacity is subjective because of the style of hangars. Private conventional hangar capacity is difficult to analyze because of the need and desire of the owners. The capacity shown in the following table is based solely on the current number of aircraft in each hangar, and the assumption that each owner has one aircraft in their respective structure.
 Aircraft Storage Demand As the preceding text and tables show, the airport has 42 potential aircraft parking spots, through a combination of 22 hangar spaces and 20 tie")
30 CHAPTER 2 - INVENTORY PAGE 38 Figure 2-I West Ramp Source: Dufresne-Henry, Inc., photograph (August 2002) Aircraft Storage Demand As the preceding text and tables show, the airport has 42 potential aircraft parking spots, through a combination of 22 hangar spaces and 20 tie downs. Current demand, as measured in August 2002 was 43 aircraft, with split of 22 aircraft in tiedown spaces and 21 in hangar facilities. The demand/capacity is therefore 102 percent, with overall hangar demand at 95 percent and tie down demand at 110 percent. Tiedown demand exceeds total capacity because the airport currently has 22 aircraft parked on apron areas designed to hold 20 (see Table 2-12).
31 CHAPTER 2 - INVENTORY PAGE 39 Table 2-11 Hangar Inventory Hangar Number* Ownership Length Size Width Square Feet Capacity Load Use Style 2 Public , C/S C 3 Public , C C 5 Private , C C 6 Private , P/S C 7 Private , P/S C 8 Private , P/S C 9 Private , P/S C 10 Private , P/S C 11 Private , P/S C 12 Private , P/S C 13 Private , P/S C 14 Private , P/S C 15 Private , P/S C 16 Private , P/S C 17 Private , P/S C 18 Private , P/S C 19 Private , P/S C TOTALS 34, Demand Legend: Use - S (Storage), C (Commercial), P (Private) Style: T (T-hangar), C (Conventional) * Numbering is based on Existing Facilities Plan (Refer to Appendix B) Source: Site visit (August 2002); Technical Drawings Paul P. Gadbois 95%
32 CHAPTER 2 - INVENTORY PAGE 40 Capacity Load Demand Capacity Load Demand Capacity Load Demand % % % Source: Dufresne-Henry, Inc., analysis Table 2-12 Aircraft Parking Capacity/Demand Hangars Apron Tiedowns Overall Automobile Parking Automobile parking is limited to a single area located next to the FBO (see Existing Facilities Plan in Appendix B). Based on the size of the lot (700 square feet), less pedestrian walkways and main ramp access, there is room for approximately 8-10 standard size cars. Additional space is available in the grass along Landry Street, which is impractical during the winter and spring. Miscellaneous Buildings There are three additional buildings located on the airport, all are publicly owned. Airport Terminal Building - The main visitor focal point of the airport is the airport terminal building located at the end of Landry Street on the north edge of the main ramp. A 1,550 square foot facility (1,000 square feet of public area) houses the FBO operation, including pilot/passenger waiting area, service desk, pilot training room, restrooms, storage, and office space. Miscellaneous Support Building A city owned 600 square foot building adjacent to the terminal building is currently leased to a private banner towing business. Refer to Building # 4 on the Existing Facilities Plan (Appendix B).
 and Figure 2-K.")
33 CHAPTER 2 - INVENTORY PAGE 41 Airfield Lighting Vault - A small vault is located on the northwest corner of the West Ramp. This building houses FAA equipment for control of the airfield lighting system. Refer to the Existing Facilities Plan (Appendix B) and Figure 2-K. Fixed-Based Operator A fixed base operator (FBO) is a business located on an airport that provides various levels of services to pilots and aircraft owners. There is one FBO, Biddeford Aviation, located in the terminal building, offering a wide range of typical services, including flight training, aircraft rental, parking, and storage of aircraft, and maintenance. Figure 2-K Airfield Lighting Vault Source: Dufresne-Henry, Inc., photograph (August 2002) The FBO operates under a lease and operating rights agreement with the city 20 and must maintain compliance in accordance with a minimum standards procedure adopted by the city. Overall the FBO leases four buildings, including two hangars and the terminal building totaling approximately 11,000 square feet, as well as the fuel pumping system and approximately 7,800 square feet of ramp space. In addition, the FBO manages the remaining apron/tiedown areas for the city. Specific financial information can be found on Page 13 (Financial). Fuel Storage and Sales Aviation gas (avgas) is sold by the FBO through an agreement with the city. Records show that the FBO sold approximately 35,000 gallons of 100LL during the period September 2001 through August The airport does not sell Jet A fuel. The airport has a single 10,000 gallon underground fuel storage tank which is used for aviation gas (avgas). The tank is located underground on the main ramp in front of the FBO. The single point refueling system is manually operated by FBO personnel during hours of operation only. 20 Lease and Operating Rights Agreement between the city of Biddeford and Delano Enterprises, LLC, dated September 2, 2003.
34 CHAPTER 2 - INVENTORY PAGE 42 The system appears to meet National Fire Protection Agency (NFPA) Code as required by Maine Statutes 21. Specifically the refueling system has: Fire extinguisher at the fueling location, No Smoking and Flammable signs, Fuel grade and type are clearly labeled, Grounding cable, and Fueling procedures are clearly posted. MISCELLANEOUS FACILITIES AND EQUIPMENT This subsection addresses facilities and equipment not listed in the airside or landside subsections, including other airport lighting. Snow Removal Equipment The airport acquired a small fleet of snow removal equipment (SRE) in 2004, which includes the following carrier vehicle and attachments. John Deere Articulated Loader Model 624J American 14 foot Snow Blade John Deere 3-Yard Bucket Tenco Snow Blower, Model # TCS-172 LMM-31263ATAAC Craig 5 yard Snow Basket Security Fence With a few exceptions airport fencing is non-existent. A rope barrier stops automobiles from entering the ramp off Landry Street. There is a small line of fence between the rear of Hangar #3 (see Existing Facilities Plan in Appendix B) that runs north along the east edge of the West ramp. A second line of fence runs along the east edge of the automobile parking lot in front of Building #4. 21 Required by Maine Revised Statutes Annotated (MRSA) Title 6 105; however the MRSA does not provide specific information concerning the exact NFPA Code that airports are required to comply with. The list shown in this AMPU was adopted from the Greenville Municipal AMPU prepared in 2001 by Dufresne-Henry, Inc and approved by MDOT/OPT.
35 CHAPTER 2 - INVENTORY PAGE 43 AIRCRAFT INVENTORY AND OPERATIONS This subsection presents information on based aircraft and flight operations at the airport. Table 2-13 Based Aircraft - Fleet Mix Type Existing Mix Single-engine 40 93% Based-Aircraft Inventory The airport has approximately 43 based aircraft, with 21 in hangars spaces and 22 utilizing tiedown spaces. Of the 43 based aircraft, 93 percent are single engine reciprocating aircraft (see Table 2-13). Multiengine 3 7% Turboprop 0 0% Turbofan 0 0% Helicopter 0 0% Total % Source: Airport Records & Site Survey Aircraft Operations Operations are difficult to measure because there is no control tower at the airport. Tower personnel maintain accurate records of operations, with a breakdown by various aircraft classifications (military versus civil, air carrier, air taxi, general aviation, etc.). Estimates must be made based at airports without a control tower, based on various sources: FBO operators, management, pilots, fuel sales, etc. The following sections will provide an accurate description of the operational characteristics of the airport. Local Operations - According to FAA records 22, local operations were reported as 25,000 per year since 1995 with general aviation accounting for 100 percent of the total. Itinerant Operations - Itinerant operations were reported at 10,220 during the same 7 year time frame. General aviation accounted for 88 percent (9,000 operations), air taxi at slightly less than 12 percent (1,200 operations), and military operations at less than 1 percent (20 operations). Total Operations - Total operations as reported by airport management to the FAA were 35,220 during the past 7 years, including the base year (2001). The mix based on this data is 30 percent itinerant and 70 percent local. The Maine Aviation Systems Plan Update (MASPU) reports 30,750 total operations in FAA Terminal Area Forecasts (TAF)
36 CHAPTER 2 - INVENTORY PAGE 44 Estimating Operations Aircraft operations reported to the FAA at uncontrolled airports (those without an air traffic control tower) have a high probability of being distorted; some planners prefer estimating operations supported by the number of based aircraft. Historically, based aircraft provide a reasonable means of estimating total itinerant operations at an airport. FAA guidelines suggest a range of between 120 and 450 operations per based aircraft, with the median being If the median of 210 is applied to the based aircraft count of 43, the estimated itinerant count would be 9,000 operations. If the same local versus itinerant mix as reported in the TAF is used (30/70 split), local operations would equal approximately 21,000 per year, for a total count of 30,000. Preferred Operations Using the data presented, the preferred total operations is 30,000, with a mix of 70 percent local (21,000) and 30 percent itinerant (9,000), which is very close to the numbers published in the MASPU. Fleet Mix Operations The breakdown of aircraft by category is presented as both local and itinerant operations. This data is used in future analysis of forecasts and facility requirements. Table 2-14 Local Operations - Fleet Mix Type Existing Mix Single-engine 19,463 93% Multiengine 1,537 7% Turboprop 0 0% Turbofan 0 0% Helicopter 0 0% Total 21, % Table 2-15 Itinerant Operations - Fleet Mix Type Existing Mix Single-engine 6,600 73% Multiengine 100 1% Turboprop 1,200 13% Turbofan % Helicopter 200 2% Total 9, % Table 2-16 Total Operations - Fleet Mix Type Total Mix Single-engine 26,063 87% Multiengine 1,637 5% Turboprop 1,200 4% Turbofan 900 3% Helicopter 200 1% Total 30, % Source: Dufresne-Henry, Inc., analysis 23 FAA AC 150/5300-4B is no longer in use, but the guideline for estimating operations is still an acceptable means of establishing a fair number for planning purposes.
37 CHAPTER 2 - INVENTORY PAGE 45 Fleet Mix - Local Operations - Using 21,000 as the base year local count, fleet mix operations by aircraft category and percent are presented in Table Fleet Mix - Itinerant Operations - Breaking out the mix of itinerant operations is more challenging, again because accurate records are not available. However, the local FBO has reported estimates based on fuel sales, maintenance records, and personal observation. During the past 12 months (October 2001 through September 2002), the mix of itinerant aircraft has, as expected, favored single-engine reciprocating aircraft (73 percent), with turboprop operations equaling 13 percent. This is also expected because the FBO completes a high percentage of its work on the design aircraft, the Pilatus PC-12, a turboprop aircraft. Table 2-15 shows the fleet mix breakout by using 9,000 as the base year. Total Fleet Mix Operations - By combining the local and itinerant fleet mix operations presented above, a total mix by type aircraft can be shown (see Table 2-16). Peak-Hour Operations Peak-hour (PH) operations are needed to help determine facility requirements such as transient aircraft parking, and passenger and pilot terminal/fbo spatial needs. The months of July and August are typically the busiest period s at most general aviation airports in the northern latitudes. Standard planning suggests that 15 percent of all annual operations occur in the peak month. With a total estimated operations count of 30,000, the peak month will result in 4,500 operations. Peak Month Average Day Operations - The PM operational demand is then divided by 30 to determine the estimated PM/average day (PMAD) operational demand of 150 operations on the average July day. Finally, the peak hour (PH) is calculated assuming that 20 percent of the daily operations (PMAD) would occur in this hour, or 30 PH operations. This data will be analyzed in Section 3 of this report to determine future needs based on various forecasting models. Peak Month Operations...4,500 Peak Day/Average Month Peak Hour...30
38 CHAPTER 2 - INVENTORY PAGE 46 Passenger Impact The number of pilots and passengers utilizing the airport on any given day influences the type and number of facilities the airport needs. Facilities such as waiting areas, bathrooms, and other services are impacted by the total number of people using the airport, particularly during peak periods. Like peak operations, the peak passenger impact is also calculated. An assumption must be made at this point because the airport does not record the activity of all aircraft that use the facility. From previous discussion we know that approximately 91 percent of all the aircraft are single engine aircraft, which have a typical capacity of four people (pilot and three passenger seats). From this premise we will assume that the average aircraft loading is 1.5 people per aircraft. Peak Month = 4,500 operations reduced by 50 percent = 2,250 x 1.5 = 3,375 Peak Month/Average Day = 2,250 operations divided by 30 days/month = 75 x 1.5 = 113 Peak Hour = 75 times 20 percent = 15 x 1.5 people = 23 pilots/passengers per hour Operations and Aircraft Summary Table 2-17 is a summary of the information presented in the previous section. NAVIGATION AIDS Various types of air navigation aids (NAVAIDS) are in use today, each serving a special purpose. These aids have various owners and operators; namely, the FAA, military services, private organizations, individual states and municipalities. The FAA has the statutory authority to establish, operate, and maintain air-navigation facilities and to prescribe standards for the operation of any of these NAVAIDs that are used for instrument flight in federally controlled airspace. These NAVAIDs are tabulated in the Airport/Facility Directory (A/FD). NAVAID Overview Electronic NAVAIDs support either en route navigation (point-to-point) or approach navigation (to a runway or airport), or both, in varying levels of accuracy, dependent on needs and financial support. Typical electronic aids used in civil aviation include: very high frequency (VHF) omni-directional range (VOR) distance-measuring equipment (DME) non-directional radio beacon (NDB) instrument landing system (ILS)
39 CHAPTER 2 - INVENTORY PAGE 47 global positioning system (GPS) All of these systems support both en route and approach/departure requirements within the United States and world navigation system; however, not all are available at the airport. In addition to the tangible assets, specific approaches must be designed to suit the needs and conditions at each specific airport and runway environment again, depending on the needs of the facility. Larger commercial airports have a wider array of NAVAIDs and approach procedures with lower minimums than a smaller regional or municipal airports. Minimums refer to the altitude in which an aircraft can descend prior to the pilot sighting the runway or airport environment. Lower minimums are a function of the type of equipment in use, terrain, and necessity. Instrument Approach Procedures The airport has two instrument approach procedures (IAPs) serving the airport; they include a GPS approach and VOR approach to Runway 6 (see Figure 2-L). Based Aircraft Segment Count Reference Single Engine Reciprocating 40 Multiengine Reciprocating 3 Turboprop 0 Turbofan 0 Helicopter 0 Total 43 Operations Local 21,000 Itinerant 9,000 Total 30,000 Fleet Mix Local Operations Single Engine Reciprocating 19,463 Multiengine Reciprocating 1,537 Turboprop 0 Turbofan 0 Helicopter 0 Total 21,000 Fleet Mix Itinerant Operations Single Engine Reciprocating 6,600 Multiengine Reciprocating 100 Turboprop 1,200 Turbofan 900 Helicopter 200 Total 9,000 Peak Operations Peak Month 4,500 Peak Month/Average Day 150 Peak Hour 30 Passenger Impact Table 2-17 Summary of Operations and Based Aircraft Peak Month 3,375 Peak Month/Average Day 113 Peak Hour 23 Table 2-13 Page 43 Page 45 Table 2-14 Page 45 Table 2-15 Page 45 Page 46 Page 46

40 CHAPTER 2 - INVENTORY PAGE 48 Figure 2-7 Instrument Approach Procedures Source: National Oceanographic and Atmospheric Administration (February 2005). Of the two IAPs, the GPS Runway 6 approach offers the lowest minimums to the airport. Minimums refer to the lowest altitude an aircraft can descend to the airport until the pilot visual acquires the runway environment. The IAPs meet the needs of the aviation community based on the type of flying typically found at the airport today.
41 CHAPTER 2 - INVENTORY PAGE 49 Nearby NAVAIDS There are several navigation facilities in the vicinity serving both the enroute and terminal phase of operations at the airport. Kennebunk VOR 6.4 NM west (bearing 266 ) Pease VOR 28 NM southwest (bearing 227 ) Augusta VOR 59.1 NM northeast (bearing 048 ) Air Traffic Control Service Air traffic control service is provided in the region by Portland Approach Control located at the Portland International Jetport 13 NM northeast. Airspace Structure The 1958 Federal Aviation Administration Act designated the FAA as the responsible agency for the control and use of navigable airspace in the United States, designated as the National Airspace System. This subsection introduces the various classifications of airspace and provides information on the requirements to operate in such airspace. The airspace structure is composed of several classifications (see definitions in Appendix A and Figures 2-M and 2-N below). Class A. The area overlying the airport starting at 18,000 feet is Class A airspace under control of the Boston ARTCC in Nashua, New Hampshire. Class B. There is no Class B airspace in the vicinity. Class C. Class C airspace lies just north of the airport around the Portland International Jetport and only impacts operations to and from the north of the airport. Class D. There is no Class D airspace around the airport. Class E. The airspace starting 700 feet about the airport is Class E airspace Class G. The airport surface to 699 feet is in Class G airspace, which is uncontrolled. Special Use Airspace. Special use airspace (SUA) consists of areas cordoned off for operations not normally associated with enroute and terminal flights. Typically, SUA involves military training, gunnery and other target practice involving weapons, and other areas restricted for national security. There are two SUA areas in the vicinity. o Prohibited Area (P-67) surrounds the compound of a former president of the United States. P-67 is a small circular area only 2 NM in diameter. However, the National
42 CHAPTER 2 - INVENTORY PAGE 50 Security Counsel, Transportation Safety Board, and FAA have recently instituted tighter security boundaries around certain events. In October 2002, P-67 was expanded to 30 NM, with no-flying in the inner 10 miles, up to 18,000 feet. Because of this, the airport has been closed on several occasions since, normally for one or two days, and typically over a weekend. o Military Operation Areas (MOA) Yankee 1 and 2 are located to the north and northwest but have no impact on local operations. METEOROLOGY One of the factors affecting aircraft performance and airport design is the climate at an airport and the surrounding region. Specifically, prevailing winds and temperature affect the performance of aircraft. Precipitation in the form of snow, rain, ice, and fog affects the performance of an airport and management s ability to operate it in a safe, efficient manner. Climate The northeastern states, comprising New England and the northern states of the Middle Atlantic area, have a humid continental climate. Artic air entering the region creates cold winters and snowfall heavier inland and north. Wind For the purposes of this update, wind data from the 1985 AMPU was reviewed and is reprinted here for evaluation purposes. As Table 2-18 shows, the wind coverage does not meet the FAA recommended level of 95 percent, under any conditions. This tells planners that if wind alone were the issue, a crosswind runway would be justified. Wind alone, however, is not the sole issue, and this discussion will be further evaluated in the following sections of this report. Table 2-18 Existing Wind Data Runway All Weather VFR IFR 6 47% 45% 60% 24 60% 61% 50% Combined 86% 86% 89% Calms 21% 20% 22% Source: 1985 Master Plan Update Study

43 CHAPTER 2 - INVENTORY PAGE 51 Figure 2-M Airspace Structure Surrounding Biddeford Source: National Aeronautical Charting Office, New York Sectional Chart

44 CHAPTER 2 - INVENTORY PAGE 52 Figure 2-N Airway Structure around Biddeford Source: National Aeronautical Charting Office
AIRSIDE CAPACITY AND FACILITY REQUIREMENTS
 AIRSIDE CAPACITY AND FACILITY REQUIREMENTS This Section investigates the capacity of the airport, its ability to meet current demand, and the facilities required to meet forecasted needs as established
Chapter 4 Airport Facility Requirements
 Chapter 4 Airport Facility Requirements Introduction CHAPTER 4 AIRPORT FACILITY REQUIREMENTS MAY 2013-1 Organization of Materials CHAPTER 4 AIRPORT FACILITY REQUIREMENTS MAY 2013-2 RPZ - ROAD RPZ - NON-AIRPORT
DRAFT MASTER PLAN UPDATE
 DRAFT MASTER PLAN UPDATE CHAPTER VI: AIRPORT LAYOUT PLAN NARRATIVE DRAFT REPORT APRIL 2017 PREPARED BY: Table of Contents WESTCHESTER COUNTY AIRPORT 6 AIRPORT LAYOUT PLAN NARRATIVE REPORT... 6-1 6.1 AGIS
Appendix C AIRPORT LAYOUT PLANS
 Appendix C AIRPORT LAYOUT PLANS Appendix C AIRPORT LAYOUT PLANS Airport Master Plan Santa Barbara Airport As part of this Airport Master Plan, the Federal Aviation Administration (FAA) requires the development
Source: Chippewa Valley Regional Airport ASOS, Period of Record
 Chapter 1 Inventory Runway wind coverage is the percentage of time a runway can be used without exceeding allowable crosswind velocities. Allowable crosswind velocities vary depending on aircraft size
Chapter Six ALP Drawings. Tacoma Narrows Airport. Master Plan Update
 Chapter Six ALP Drawings Master Plan Update The master planning process for the (Airport) has evolved through efforts in the previous chapters to analyze future aviation demand, establish airside and landside
The following criteria shall be applied within the boundaries of the AO District:
 Sec. 419 (a) Purpose AIRPORT OVERLAY DISTRICT (AO) The purpose of the Airport Overlay District is to regulate and restrict the height of structures, objects, or natural growth, regulate the locations of
FACILITY REQUIREMENTS SUMMARY OF KEY ISSUES OVERVIEW
 FACILITY REQUIREMENTS SUMMARY OF KEY ISSUES OVERVIEW This summary is intended to provide a brief overview of the key issues associated with conformance to FAA standards at Methow Valley State Airport.
Agenda: SASP SAC Meeting 3
 Agenda: SASP SAC Meeting 3 Date: 04/12/18 Public Involvement Plan Update Defining the System Recommended Classifications Discussion Break Review current system Outreach what we heard Proposed changes Classification
1.1.3 Taxiways. Figure 1-15: Taxiway Data. DRAFT Inventory TYPICAL PAVEMENT CROSS-SECTION LIGHTING TYPE LENGTH (FEET) WIDTH (FEET) LIGHTING CONDITION
 WIDTH (FEET) LIGHTING CONDITION") 1.1.3 Taxiways EWN has an extensive network of taxiways and taxilanes connecting the terminal, air cargo, and general aviation areas with the runways as listed in Figure 1-15. A 50-foot wide parallel taxiway
1.1.3 Taxiways EWN has an extensive network of taxiways and taxilanes connecting the terminal, air cargo, and general aviation areas with the runways as listed in Figure 1-15. A 50-foot wide parallel taxiway
Chapter 9 - AIRPORT SYSTEM DESIGN
 Chapter 9 - AIRPORT SYSTEM DESIGN 9.01 GENERAL This chapter discusses the development program for Dutchess County Airport to the year 2020. This airport system design is based upon the airport's existing
BELFAST MUNICIPAL AIRPORT OVERVIEW
 BELFAST MUNICIPAL AIRPORT OVERVIEW LOCATION AND HISTORY Belfast Municipal Airport (Federal Aviation Administration (FAA) airport code BST, International Civil Aviation Organization airport code KBST, FAA
Grants Pass Airport Master Plan & Airport Layout Plan Update
 Attendees: Grants Pass Airport Master Plan & Airport Layout Plan Update Meeting #3 January 26, 2010 Merlin Community Center 100 Acorn Street, Merlin 5:45 7:15 p.m. Josephine County Department of Airports:
The purpose of this Demand/Capacity. The airfield configuration for SPG. Methods for determining airport AIRPORT DEMAND CAPACITY. Runway Configuration
 Chapter 4 Page 65 AIRPORT DEMAND CAPACITY The purpose of this Demand/Capacity Analysis is to examine the capability of the Albert Whitted Airport (SPG) to meet the needs of its users. In doing so, this
CHAPTER 1 BACKGROUND AND PROPOSED ACTION
 CHAPTER 1 BACKGROUND AND PROPOSED ACTION 1.0 INTRODUCTION An Environmental Assessment (EA) evaluates the effects of a proposed Federal action on the surrounding environment and is prepared in compliance
Chapter Three AIRPORT FACILITY REQUIREMENTS/ALTERNATIVES
 Chapter Three AIRPORT FACILITY REQUIREMENTS/ALTERNATIVES Airport Layout Plan Report In this chapter, existing components of the Airport are evaluated so that the capacities of the overall system are identified.
Table of Contents. Overview Objectives Key Issues Process...1-3
 Table of Contents Chapter One Introduction Overview...1-1 Objectives...1-1 Key Issues...1-2 Process...1-3 Chapter Two Inventory of Existing Conditions Airport Setting...2-1 Locale...2-1 Airport Surroundings...2-5
Current Airport Roles
 Chapter Four: Current Airport Roles Introduction Current airport roles are defined differently from national, state, and local perspectives. The Federal Aviation Administration (FAA) has established two
According to FAA Advisory Circular 150/5060-5, Airport Capacity and Delay, the elements that affect airfield capacity include:
 4.1 INTRODUCTION The previous chapters have described the existing facilities and provided planning guidelines as well as a forecast of demand for aviation activity at North Perry Airport. The demand/capacity
CHAPTER 3 ALTERNATIVES CONSIDERED
 CHAPTER 3 ALTERNATIVES CONSIDERED 3.0 ALTERNATIVES The 2010 Stevensville Airport Master Plan contained five (5) airside development options designed to meet projected demands. Each of the options from
Document prepared by MnDOT Office of Aeronautics and HNTB Corporation. MINNESOTA GO STATE AVIATION SYSTEM PLAN
 LAST UPDATE JULY 2013 Acknowledgements The preparation of this document was financed in part by a grant from the Federal Aviation Administration (Project No: 3-27-0000-07-10), with the financial support
Runway Length Analysis Prescott Municipal Airport
 APPENDIX 2 Runway Length Analysis Prescott Municipal Airport May 11, 2009 Version 2 (draft) Table of Contents Introduction... 1-1 Section 1 Purpose & Need... 1-2 Section 2 Design Standards...1-3 Section
Addendum - Airport Development Alternatives (Chapter 6)
") Bowers Field Addendum - Airport Development Alternatives (Chapter 6) This addendum to the Airport Development Alternatives chapter includes the preferred airside development alternative and the preliminary
Bowers Field Addendum - Airport Development Alternatives (Chapter 6) This addendum to the Airport Development Alternatives chapter includes the preferred airside development alternative and the preliminary
Tallahassee International Airport Master Plan. Technical Advisory Committee Meeting #2 October 19, 2016
 Tallahassee International Airport Master Plan Technical Advisory Committee Meeting #2 October 19, 2016 Agenda Welcome / Introductions Master Plan Process and Project Status Forecast of Aviation Demand
Chapter 5. Facility Requirements
 Chapter 5 Facility Requirements Chapter 5 Facility Requirements INTRODUCTION The Baseline Forecast was used to determine facility requirements. Chapter 4 produced a forecast of traffic volumes expected
DRAFT FINAL REPORT AIRPORT MASTER PLAN. Rifle Garfield County Airport Revised May 15, 2014
 DRAFT FINAL REPORT AIRPORT MASTER PLAN Rifle Garfield County Airport Revised May 15, 2014 As required by Paragraph 425.B(4) of FAA Order 5100.38C, Airport Improvement Program (AIP) Handbook: The preparation
Lopez Island Airport Master Plan Update. Public Meeting June 15, 2017
 Lopez Island Airport Master Plan Update Public Meeting June 15, 2017 Master Plan Update Team Reid Middleton/Everett, WA Shannon Kinsella, Project Manager Melania Haagsma, Project Engineer Mead & Hunt/Tulsa,
SITE ELEVATION AMSL...Ground Elevation in feet AMSL STRUCTURE HEIGHT...Height Above Ground Level OVERALL HEIGHT AMSL...Total Overall Height AMSL
 ******************************************** * Federal Airways & Airspace * * Summary Report * ******************************************** File: User Assigned File Name Latitude: NAD83 Coordinate Longitude:
TABLE OF CONTENTS. General Study Objectives Public Involvement Issues to Be Resolved
 TABLE OF CONTENTS Description Page Number LIST OF ACRONYMS... a CHAPTER ONE INTRODUCTION General... 1-1 Study Objectives... 1-1 Public Involvement... 1-2 Issues to Be Resolved... 1-2 CHAPTER TWO EXISTING
Flying Cloud Airport (FCM) Zoning Process: Informing a Mn/DOT Path Forward
 Zoning Process: Informing a Mn/DOT Path Forward") : Informing a Mn/DOT Path Forward A Review of the Flying Cloud Airport (FCM) Joint Airport Zoning Board (JAZB) Process and the Draft Airport Zoning Ordinance B A RPZ RPZ A B C Zone Chad E. Leqve Director
: Informing a Mn/DOT Path Forward A Review of the Flying Cloud Airport (FCM) Joint Airport Zoning Board (JAZB) Process and the Draft Airport Zoning Ordinance B A RPZ RPZ A B C Zone Chad E. Leqve Director
Airport Obstruction Standards
 Airport Obstruction Standards Dr. Antonio Trani Department of Civil and Environmental Engineering Virginia Tech Outline of this Presentation Obstructions to navigation around airports Discussion of Federal
Merritt Island Airport
 TABLE OF CONTENTS CHAPTER 1 INTRODUCTION... 1-1 INTRODUCTION AND PROJECT OVERVIEW... 1-1 General Guidelines... 1-1 Prior Planning Documentation... 1-2 Key Issues... 1-2 Goals and Objectives... 1-2 Regulatory
CHAPTER 1 EXECUTIVE SUMMARY
 CHAPTER 1 EXECUTIVE SUMMARY 1 1 EXECUTIVE SUMMARY INTRODUCTION William R. Fairchild International Airport (CLM) is located approximately three miles west of the city of Port Angeles, Washington. The airport
Chapter 4 AIRPORT DEVELOPMENT ALTERNATIVES
 Chapter 4 AIRPORT DEVELOPMENT ALTERNATIVES Chapter Four Airport Development Alternatives Prior to formulating a development program for Ryan Airfield, it is important to consider development potential
1) Rescind the MOD (must meet the standard); 2) Issue a new MOD which reaffirms the intent of the previous MOD; 3) Issue a new MOD with revisions.
 Rescind the MOD (must meet the standard); 2) Issue a new MOD which reaffirms the intent of the previous MOD; 3) Issue a new MOD with revisions.") ALBUQUERQUE INTERNATIONAL SUNPORT AIRCRAFT HOLD LINE LOCATION ANALYSIS WHITE PAPER JUNE 24, 2016 HOLD LINE LOCATION ISSUE The location of many of the taxiway hold lines at the Sunport do not meet current
ALBUQUERQUE INTERNATIONAL SUNPORT AIRCRAFT HOLD LINE LOCATION ANALYSIS WHITE PAPER JUNE 24, 2016 HOLD LINE LOCATION ISSUE The location of many of the taxiway hold lines at the Sunport do not meet current
CHAPTER 1: INTRODUCTION
 CHAPTER 1: INTRODUCTION Purpose and Scope The information presented in this report represents the study findings for the 2016 Ronan Airport Master Plan prepared for the City of Ronan and Lake County, the
FACILITY REQUIREMENTS 5.1 Introduction
 Chapter 5 FACILITY REQUIREMENTS 5.1 Introduction The facility requirements section of this study defines the physical facilities needed to safely and efficiently accommodate the current and future aviation
Chapter Seven COST ESTIMATES AND FUNDING A. GENERAL
 Chapter Seven COST ESTIMATES AND FUNDING A. GENERAL This chapter delineates the recommended 2005 2024 Sussex County Airport Capital Improvement Program (CIP). It further identifies probable construction
1.0 Project Background Mission Statement and Goals Objectives of this Sustainable Master Plan
 TABLE OF CONTENTS CHAPTER 1 INTRODUCTION 10 Project Background 1-1 11 Mission Statement and Goals 1-1 12 Objectives of this Sustainable Master Plan 1-2 CHAPTER 2 INVENTORY 20 Airport Background 2-1 201
APPENDIX D FEDERAL AVIATION REGULATIONS, PART 77
 APPENDIX D FEDERAL AVIATION REGULATIONS, PART 77 Subparts A through C PART 77 - OBJECTS AFFECTING NAVIGABLE AIRSPACE Subpart A General 77.1 Scope. 77.2 Definition of terms. 77.3 Standards. 77.5 Kinds of
Chapter One INVENTORY
 Chapter One INVENTORY Airport Layout Plan Report The initial step in the preparation of the Airport Layout Plan Report for is the collection of information pertaining to the Airport and the area it serves.
CHAPTER 3 AIRPORT FACILITY REQUIREMENTS
 CHAPTER 3 AIRPORT FACILITY REQUIREMENTS 3.1 Introduction The existing runway and taxiway system at Skyhaven Airport provides more than adequate operational capacity to accommodate future peak hour and
1 DRAFT. General Aviation Terminal Services Aircraft Hangars Aircraft Parking Aprons Airport Support Facilities
 To properly plan for improvements at Dallas Executive Airport, it is necessary to translate forecast aviation demand into the specific types and quantities of facilities that can adequately serve the demand.
MASTER PLAN CONCEPT 1 DRAFT
 The Airport Master Plan Update for Dallas Executive Airport has included the development of aviation demand forecasts, an assessment of future facility needs, and the evaluation of airport development
Hartford-Brainard Airport Potential Runway Closure White Paper
 Hartford-Brainard Airport Potential Runway 11-29 Closure White Paper June 2012 In recent years there has been discussion regarding the necessity of Runway 11-29 to the Hartford- Brainard Airport (HFD)
Appendix D Project Newsletters. Tacoma Narrows Airport. Master Plan Update
 Appendix D Project Newsletters Tacoma Narrows Airport Master Plan Update This appendix contains the newsletters distributed throughout the project. These newsletters provided updates and information on
TECHNICAL REPORT #7 Palm Beach International Airport Airport Layout Plan
 TECHNICAL REPORT #7 Palm Beach International Airport Airport Layout Plan Technical Report #7 Palm Beach International Airport Layout Plan Palm Beach International Airport Prepared for Palm Beach County
Airport Master Plan. Brookings Regional Airport. Runway Runway 17-35
 Runway 17-35 Airport Master Plan Runway 12-30 Brookings Regional Airport Table of Contents Table of Contents Chapter 1: Master Plan Goals... 1-1 1.1. Introduction... 1 1.2. Objective 1 Identify improvements
1 PURPOSE AND NEED 1.1 INTRODUCTION
 1.1 INTRODUCTION 1 PURPOSE AND NEED This Environmental Assessment (EA) addresses projects at Juneau International Airport (JIA) that are the direct outcome of a Master Plan prepared for the airport and
Chapter 8.0 Implementation Plan
 Chapter 8.0 Implementation Plan 8.1 Introduction This chapter is the culmination of the analytical work accomplished in the previous chapters. The result is a prioritized list of the essential projects.
2009 Muskoka Airport Economic Impact Study
 2009 Muskoka Airport Economic Impact Study November 4, 2009 Prepared by The District of Muskoka Planning and Economic Development Department BACKGROUND The Muskoka Airport is situated at the north end
OVERVIEW BASIC DESIGN FACTORS. Demand Determinants
 3 Airfield Airfield Design Design OVERVIEW The basic configuration of the runway and taxiway system at Hanford Municipal Airport has changed moderately since the airport was constructed in 1950. These
Airfield Design. Public Review Draft OVERVIEW BASIC DESIGN FACTORS. Airport Role
 Public Review Draft 3 Airfield Design OVERVIEW The Facilities Plan, Figure 3D, presents the recommended airfield improvements. The principal airfield design issues examined in this chapter are the optimal
Chapter 4 Airport Capacity Assessment and Identification of Facility Needs
 Chapter 4 Airport Capacity Assessment and Identification of Facility Needs 4.1 Introduction The purpose of the airport capacity assessment and identification of facility needs is to evaluate the single
15 Precision Approach Path Indicator 33 None RSA 150 feet wide by 300 feet long 150 feet wide by 300 feet long
 The first (AMP) was completed in 1984 and updated in 2000. The current FAA approved Airport Layout Plan (ALP) is dated November 9, 2001. The FAA suggests updating the AMP every five year in accordance
FORT LAUDERDALE-HOLLYWOOD INTERNATIONAL AIRPORT ENVIRONMENTAL IMPACT STATEMENT DRAFT
 D.3 RUNWAY LENGTH ANALYSIS Appendix D Purpose and Need THIS PAGE INTENTIONALLY LEFT BLANK Appendix D Purpose and Need APPENDIX D.3 AIRFIELD GEOMETRIC REQUIREMENTS This information provided in this appendix
Milton. PeterPrinceAirportislocatedinSantaRosaCounty, approximatelythreemileseastofmilton.
 Milton GeneralAviationAirport PeterPrinceAirportislocatedinSantaRosaCounty, approximatelythreemileseastofmilton. Existing Facilities Peter Prince Airport is served by one runway, Runway 18/36, 3,700 feet
Acronyms. Airport Layout Plan Report Appendix A A-1
 Appendix A Acronyms AC... Advisory Circular ADG... Airplane Design Group ADO... Airport District Office AGL... Above Ground Level AIM... Aeronautical Information Manual AIP... Airport Improvement Program
B GEORGIA INFRASTRUCTURE REPORT CARD AVIATION RECOMMENDATIONS DEFINITION OF THE ISSUE. Plan and Fund for the Future:
 2014 GEORGIA INFRASTRUCTURE REPORT CARD B + RECOMMENDATIONS Plan and Fund for the Future: While the system continues to enjoy excess capacity and increased accessibility it still needs continued focus
Prepared By: Mead & Hunt, Inc Port Lansing Road Lansing, MI 48906
 Master Plan The preparation of this document was financed in part through a planning grant from the Federal Aviation Administration (FAA) as provided under Section 505 of the Airport and Airway Improvement
AIR NAVIGATION ORDER
 CLEARANCE AREAS AND OBSTACLE LIMITATION SURFACES AT AIR NAVIGATION ORDER VERSION : 2.0 DATE OF IMPLEMENTATION : 15-02-2013 OFFICE OF PRIME INTEREST : AERODROME STANDARDS BRANCH. (Directorate of Airspace
CHAPTER 3 FACILITY REQUIREMENTS
 CHAPTER 3 FACILITY REQUIREMENTS 3.1 INTRODUCTION To properly plan for the future requirements of Newport News/Williamsburg International Airport, it is necessary to translate the forecasts of aviation
Chippewa-Eau Claire Metropolitan Planning Area Long Range Transportation Plan
 1.2.7 2010 Eau Claire County Comprehensive Plan According to Eau Claire County s most recent comprehensive plan, the County will limit land use development adjacent to EAU in order to preserve the ability
CHAPTER 5 - FACILITY REQUIREMENTS
 CHAPTER 5 - FACILITY REQUIREMENTS This chapter identifies the requirements for airfield and landside facilities to accommodate the forecast demand level. Facility requirements have been developed for the
SECTION 5 ALTERNATIVE DEVELOPMENT CONCEPT ANALYSES
 SECTION 5 ALTERNATIVE DEVELOPMENT CONCEPT ANALYSES 5.1 INTRODUCTION This section investigates Airfield Development Alternatives, generalized Land Use Alternatives, and more detailed General Aviation Alternatives.
TABLE OF CONTENTS. Washington Aviation System Plan Update July 2017 i
 TABLE OF CONTENTS Chapter 1 Overview... 1-1 1.1 Background... 1-1 1.2 Overview of 2015 WASP... 1-1 1.2.1 Aviation System Performance... 1-2 1.3 Prior WSDOT Aviation Planning Studies... 1-3 1.3.1 2009 Long-Term
Chapter 4.0 Facility Requirements
 Chapter 4.0 Facility Requirements Having inventoried the existing infrastructure and forecasted demand, determining airport facility requirements is the next essential step in the airport master planning
Airport Master Plan. Rapid City Regional Airport. October 2015 FAA Submittal
 Airport Master Plan Rapid City Regional Airport October 2015 FAA Submittal Rapid City Regional Airport Master Plan Update Table of Contents Executive Summary... i Scope & Timeline... i Forecasts... i Preferred
Chapter 4 Airport Facility Requirements. Introduction
 Chapter 4 Airport Facility Requirements Introduction The airport facility requirements analysis combines the results of the inventory and forecasts contained in Chapters Two and Three, and the applicable
Chapter 4 Airport Facility Requirements
 Chapter 4 Airport Facility Requirements The evaluation of airport facility requirements uses the results of the inventory and forecasts contained in Chapters Two and Three, as well as established planning
ORDINANCE NO. _2013-
 ORDINANCE NO. _2013- AN ORDINANCE OF THE TOWNSHIP OF CONEWAGO, DAUPHIN COUNTY, PENNSYLVANIA, PROVIDING FOR AIRPORT ZONING REGULATIONS WITHIN THE AIRPORT ZONING OVERLAY DISTRICT CREATED BY THIS ORDINANCE
Table of Contents. List of Tables. Cincinnati/Northern Kentucky International Airport 2035 Master Plan Update
 Table of Contents 7.1. Airport Layout Plan (Existing Conditions)... 2 7.2. Airport Layout Plan (Future Conditions)... 3 7.3. Technical Data Sheet... 5 7.4. Commercial Terminal Area Drawing... 5 7.5. East
Vista Field Airport. Master Plan Update. February, Prepared for: Port of Kennewick One Clover Island Kennewick, Washington
 Vista Field Airport February, 2006 Prepared for: Port of Kennewick One Clover Island Kennewick, Washington 99336 Prepared by: J-U-B ENGINEERS, Inc. 2810 W. Clearwater Avenue, Suite 201 Kennewick, Washington
CHAPTER 1 INTRODUCTION AND BACKGROUND
 CHAPTER 1 INTRODUCTION AND BACKGROUND An Environmental Assessment (EA) evaluates the effects of a proposed Federal action on the surrounding environment and is prepared in compliance with the National
Boise Municipal Code. Chapter DEFINITIONS
 Chapter 12-03 DEFINITIONS Sections: 12-03-01 ADMINISTRATOR 12-03-02 AIRPORT DESIGNATIONS 12-03-03 AIRPORT HAZARD 12-03-04 AIRPORT HEIGHT LIMITATIONS 12-03-05 AIRPORT REFERENCE POINT 12-03-06 AIRPORT INSTRUMENT
5. Facility Requirements
 5. Facility Requirements The purpose of this chapter is to compare existing airfield and adjacent landside facilities with the Airport operations and aircraft forecasts developed in the previous chapter
Airfield Design OVERVIEW BASIC DESIGN FACTORS. Airport Role
 3 Airfield Design OVERVIEW Due to the presence of significant physical constraints, little change to the existing airfield is anticipated. The emphasis in this plan is on identifying airfield improvements
Why are the underground fuel tanks being removed and replaced with above ground tanks?
 AIRPORT/CITIZEN FAQ This list of Frequently Asked Questions (FAQs) with responses are provided to share information related to airport topics with the Citizens of Georgetown. The questions / responses
3.1 CRITICAL AIRCRAFT
 The purpose of the demand capacity analysis is to determine an airport s capacity and its ability to support the forecasted aviation demand. Facility requirements identify development, replacement, and/or
Chapter 2 FINDINGS & CONCLUSIONS
 Chapter 2 FINDINGS & CONCLUSIONS 2.01 GENERAL Dutchess County acquired the airport facility in 1947 by deed from the War Assets Administration. Following the acquisition, several individuals who pursued
DEPARTMENT: CIVIL ENGINEERING SEMESTER: III SUBJECT CODE / Name: CE2303/ Railway, Airport and Harbors Engineering 2 MARK QUESTIONS AND ANSWERS
 DEPARTMENT: CIVIL ENGINEERING SEMESTER: III SUBJECT CODE / Name: CE2303/ Railway, Airport and Harbors Engineering 2 MARK QUESTIONS AND ANSWERS 1.Define wind Coverage (AUC NOV/DEC 2010),(AUC NOV/DEC 2011)
AERODROME LICENCE APPLICATION PROCESS
 0000180111 Page 2 Why is a Licence Required? An aerodrome licence is required for a site if it is intended to facilitate operations by commercial transport aircraft, other aerial work other than rotorcraft,
ERIE INTERNATIONAL AIRPORT MASTER PLAN TABLE OF CONTENTS
 EXECUTIVE SUMMARY ERIE INTERNATIONAL AIRPORT MASTER PLAN TABLE OF CONTENTS PAGE NO. CHAPTER 1-INTRODUCTION... 1-1 1.01 General...1-1 1.02 Purpose and Scope of Study...1-1 1.03 The Planning Process...1-2
New Opportunities PUBLIC WORKSHOP. Venice Municipal. Bringing g the pieces together
 Bringing g the PUBLIC WORKSHOP Venice Municipal Airport New Opportunities Presented for Venice City Council & Citizens of Venice September 25, 2009 Slide 1 Bringing g the Welcome & Introductions May 12th
Preliminary Findings of Proposed Alternative
 Preliminary Findings of Proposed Alternative The attached drawing provides a schematic layout of the proposed alternative that will be discussed on July 27, 2010. A full report will follow and should be
6.1 INTRODUCTION 6.2 AIRSIDE ALTERNATIVES NORTH PERRY AIRPORT MASTER PLAN UPDATE RUNWAY LENGTH REQUIREMENTS SECTION 6: ALTERNATIVES ANALYSIS
 6.1 INTRODUCTION In the previous chapter, facility needs for the 20-year planning horizon were identified. The next step in the planning process is to identify and evaluate the various ways certain facilities
3 INTRODUCTION. Chapter Three Facility Requirements. Facility Requirements PEAKING CHARACTERISTICS
 Chapter Three Facility Requirements 3 INTRODUCTION This chapter identifies the long-range airfield and terminal area facilities needed to satisfy the 20-year forecast of aviation demand at Monett Municipal
Chapter 5 Facility Requirements
 Chapter 5 Facility Requirements Chapter 5 Facility Requirements INTRODUCTION Chapter 4 produced a forecast of traffic volumes estimated to be generated at the airport during the 20- year forecast period.
APPENDIX X: RUNWAY LENGTH ANALYSIS
 APPENDIX X: RUNWAY LENGTH ANALYSIS Purpose For this Airport Master Plan study, the FAA has requested a runway length analysis to be completed to current FAA AC 150/5325-4B, Runway Length Requirements for
GLOSSARY A.1 ABBREVIATIONS/ACRONYMS
 Appendices Glossary A A GLOSSARY A.1 ABBREVIATIONS/ACRONYMS AC ADF ADPM AGL AIP ALP ALS ALSF-1 ARC ARFF ARP ARTCC ASDA ASO ASR ASV ATC ATCT AVGAS BLI CBP CIP - Advisory Circular - Automatic Direction
Airport Master Plan for Montgomery-Gibbs Executive Airport PAC Meeting #3
 Airport Master Plan for Montgomery-Gibbs Executive Airport PAC Meeting #3 Agenda > Introductions > Public Meetings Overview > Working Paper 3 - Facility Requirements > Working Paper 4 - Environmental Baseline
Chapter 1 Introduction and Project Overview
 Chapter 1 Introduction and Project Overview Kittitas County in cooperation with the Federal Aviation Administration (FAA) is updating the Airport Master Plan for Bowers Field Airport (FAA airport identifier
chapter 5 Recommended Master Plan Concept airport master plan MASTER PLAN CONCEPT
 chapter 5 Recommended Master Plan Concept airport master plan The planning process for Coolidge Municipal Airport has included several analytical efforts in the previous chapters intended to project potential
Chapter The All-new, World-class Denver International Airport Identify Describe Know Describe Describe
 Chapter 10 The aerospace subject is very large and diverse. As seen in previous chapters, there are many subject areas. So far you have learned about history, weather, space and aerodynamics. Now you will
Table of Contents. Master Plan March 2014 TOC i Spokane International Airport
 Table of Contents Page Chapter 1 Inventory 1. Introduction... 1 1 1.1 Community Profile... 1 2 1.1.1 Location and Setting... 1 1 1.1.2 Climate... 1 2 1.1.3 Socioeconomic Conditions... 1 5 1.1.4 Area Land
Safety, Infrastructure, and Tenant Improvement Project. Public Hearing Informational Brochure February 26, 2013
 New York State Department of Transportation Safety, Infrastructure, and Tenant Improvement Project Public Hearing Informational Brochure February 26, 2013 This DEIS/Draft EA evaluates the potential impacts
Chapter 5 Airport Development Alternatives
 Chapter 5 Airport Development Alternatives Introduction CHAPTER 5 AIRPORT DEVELOPMENT ALTERNATIVES JUNE 2013-1 Evaluation Process No-Action Alternative CHAPTER 5 AIRPORT DEVELOPMENT ALTERNATIVES JUNE 2013-2
3.1 Facility Requirements Overview Airfield Facility Requirements... 1
 Table of Contents 3.1 Overview... 1 3.2 Airfield... 1 Airspace Capacity...1 Airside Capacity... 2 Aircraft Mix Index... 3 Arrivals Percentage... 4 Touch-and-Go Percentage... 4 Taxiway Access Factors...
STUDY WORK GROUP MEETING No. 3. November 29, 2016
 STUDY WORK GROUP MEETING No. 3 November 29, 2016 Agenda Welcome and introductions Update project schedule Brief overview of previous SWG meeting Update on aviation forecasts Introduction to airfield demand/capacity
STUDY OVERVIEW MASTER PLAN GOALS AND OBJECTIVES
 INTRODUCTION An Airport Master Plan provides an evalua on of the airport s avia on demand and an overview of the systema c airport development that will best meet those demands. The Master Plan establishes