2009 Comprehensive Annual Financial Report
|
|
|
- Ashley Jefferson
- 5 years ago
- Views:
Transcription


1 2009 Comprehensive Annual Financial Report Washington Dulles International Airport Ronald Reagan Washington National Airport Dulles Corridor
2 METROPOLITAN WASHINGTON AIRPORTS AUTHORITY COMPREHENSIVE ANNUAL FINANCIAL REPORT YEAR ENDED DECEMBER 31, 2009 BOARD OF DIRECTORS Charles D. Snelling, Chairman Michael L. O Reilly, Vice Chairman The Honorable H.R. Crawford, Immediate Past Chairman Mame Reiley, Past Chairman Robert Clarke Brown The Honorable William W. Cobey Jr. Frank M. Conner III Mamadi Diané The Honorable Michael David Epstein Jack Andrew Garson Leonard Manning Dennis L. Martire The Honorable David G. Speck EXECUTIVE STAFF James E. Bennett, President and Chief Executive Officer Margaret E. McKeough, Executive Vice President and Chief Operating Officer Lynn Hampton, CPA, Vice President for Finance and Chief Financial Officer Andrew T. Rountree, CPA, Deputy Chief Financial Officer Mark Tune, CPA, Controller Prepared by the Office of Finance
3 INTENTIONALLY LEFT BLANK
4 METROPOLITAN WASHINGTON AIRPORTS AUTHORITY Comprehensive Annual Financial Report Year Ended December 31, 2009 TABLE OF CONTENTS Introductory Section Title Transmittal Letter Certificate of Achievement Organization Chart Financial Section Report of Independent Auditors Management s Discussion and Analysis Basic Financial Statements Statements of Net Assets Statements of Revenues, Expenses and Changes in Net Assets Statements of Cash Flows Notes to Financial Statements A. Summary of Significant Accounting Policies B. Transfer of the Dulles Toll Road and Construction of the Dulles Metrorail Project C. Deposits and Investments D. Interest Rate Swaps E. Accounts Receivable F. Restricted Assets G. Changes in Capital Assets H. Accounts Payable I. Pension Plans and Deferred Compensation Plan J. Postemployment Benefits K. Capital Debt L. Airport Use Agreement and Premises Lease M. Net Assets N. Lease Commitments O. Other Commitments and Contingencies P. Government Grants Q. Litigation R. Passenger Facility Charges S. Risk Management T. Fair Value of Financial Instruments U. Voluntary Separation Incentive Program Page i
5 METROPOLITAN WASHINGTON AIRPORTS AUTHORITY Comprehensive Annual Financial Report Year Ended December 31, 2009 TABLE OF CONTENTS (continued) Statistical Section Exhibit Page S - 1 Annual Revenues, Expenses and Changes in Net Assets S - 2 Operating Expenses By Function S - 3 Revenues By Source S - 4 Ronald Reagan Washington National Airport Revenues S - 5 Dulles International Airport Revenues S - 6 Scheduled Airlines Rates and Charges S - 7 Ratio s of Outstanding Debt S - 8 Revenue Bond Debt Service Coverage S - 9 Airport Information - Reagan National S - 10 Airport Information - Dulles International S - 11 Airports Authority Employee Strength S - 12 Population Trends S - 13 Aircraft Operations By Airport S - 14 Landed Weights at Reagan National S - 15 Landed Weights at Dulles International S - 16 Enplanements at Reagan National S - 17 Enplanements at Dulles International S - 18 Enplanement Market Share at Reagan National S - 19 Enplanement Market Share at Dulles International S - 20 Cargo Market Share Enplaned at Reagan National S - 21 Cargo Market Share Enplaned at Dulles International S - 22 Passenger Facility Charges S - 23 Top 30 Origination and Destination Passenger Markets S - 24 Top 30 Origination and Destination Passenger Markets S - 25 Major Private Employers in Primary Air Trade Area S - 26 Employment by Industry S - 27 Revenue Bond Coverage S - 28 Dulles Toll Road Transactions S - 29 Schedule of Insurance ( ) Operations Program S - 30 Schedule of Insurance ( ) Dulles Toll Road & Dulles Rail Program (Specific) S - 31 Schedule of Insurance ( ) OCWIP Program S - 32 Schedule of Insurance ( ) Utility Relocation & Non-Dulles Transit Partners Construction (Dulles Rail) ii
6
7 April 12, 2010 To the Board of Directors and The President and Chief Executive Officer of the The Comprehensive Annual Financial Report (CAFR) of the Metropolitan Washington Airports Authority (the Airports Authority) for the year ended December 31, 2009 is submitted herewith. The Office of Finance prepared this report. Responsibility for both the accuracy of the presented data and completeness and fairness of the presentation, including all disclosures, rests with the Airports Authority. To the best of our knowledge and belief, this report fairly presents and fully discloses the Airports Authority s financial position, results of operations, and cash flows in accordance with accounting principles generally accepted in the United States of America. It includes disclosures necessary to enable the reader to gain an understanding of the Airports Authority s financial activities. The report of the independent auditors on the financial statements is included on page 15. This report was prepared following the guidelines recommended by the Government Finance Officer s Association of the United States and Canada (GFOA). The GFOA awards Certificates of Achievement to those governments whose annual financial reports are judged to conform substantially with the high standards of public financial reporting, including accounting principles generally accepted in the United States of America, promulgated by the Governmental Accounting Standards Board (GASB). The management of the Airports Authority is responsible for establishing and maintaining an internal control structure that is designed to ensure that the assets of the Airports Authority are safeguarded. In addition, as a recipient of federal financial assistance, the Airports Authority is responsible for ensuring that an adequate internal control structure is in place to ensure compliance with general and specific laws and regulations related to the Airport Improvement Program (AIP) and the Aviation Safety and Capacity Expansion Act as well as the Federal Transit Administration (FTA) provisions of the Safe, Accountable, Flexible, Efficient, Transportation Equity Act: A Legacy for Users with regards to the Dulles Corridor Metrorail Project (Dulles Metrorail Project). The objectives of an internal control structure are to provide management with reasonable assurance that the resources are safeguarded against waste, loss, and misuse, and reliable data are recorded, maintained, and fairly disclosed in reports. The Airports Authority s current internal controls provide a solid base of reliable financial records from which the financial statements are prepared. These accounting controls ensure that accounting data are reliable and available to facilitate the preparation of financial statements on a timely basis. Inherent limitations should be recognized in considering the potential effectiveness of any system of internal control. The concept of reasonable assurance is based on the recognition that the cost of a system of internal control should not exceed the benefits derived and that the evaluation of those factors requires estimates and judgment by management. The Airports Authority s Office of Audit functions include coordination of the annual financial statements audit performed by external auditors as well as internal audits of internal controls. The Office of
8 Audit conducts internal audits to provide the Airports Authority s management and the Board of Directors (the Board) with reasonable assurance that, 1) risks are being managed; 2) management and delivery capacity are being maintained; 3) adequate control is being exercised; and, 4) appropriate results are being achieved. The Office of Audit operates under the direction of Valerie Holt, CPA, and Vice President for Audit. This position has dual reporting responsibilities to the President and Chief Executive Officer and the Audit Committee of the Board. The Audit Committee of the Board has an important role in the oversight of the financial reporting to ensure the Airports Authority s financial reports are reliable, consistent and of high quality. As required by the Acts of the District of Columbia and the Commonwealth of Virginia (the Commonwealth), a firm of independent certified public accountants is retained each year to conduct an audit of the financial statements of the Airports Authority in accordance with auditing standards generally accepted in the United States of America and to meet the requirements of the Federal Single Audit Act of 1984 (pursuant to OMB Circular A-133). The Airports Authority selected the firms of PricewaterhouseCoopers LLP and Bert Smith and Company to perform these audit services. The opinion of PricewaterhouseCoopers LLP on the financial statements is presented in the financial section of this report. The Single Audit Report and its opinion from Bert Smith and Company are presented under separate cover. Each year, the firms meet with the Audit Committee of the Board to review the results of the audits. The Management Discussion and Analysis (MD&A) on page 17 provides a narrative introduction, overview and analysis of the basic financial statements. The MD&A complements this Transmittal Letter and should be read in conjunction with it. REPORTING ENTITY AND ITS SERVICES The Airports Authority is a public body politic and corporate, created with the consent of the Congress of the United States by an Act of the District of Columbia and an Act of the Commonwealth for the purpose of operating, maintaining, and improving Ronald Reagan Washington National Airport (Reagan National) and Washington Dulles International Airport (Dulles International), (collectively, the Airports). The Airports had historically been managed by the Federal Aviation Administration (FAA) of the United States Department of Transportation. Pursuant to an agreement and Deed of Lease, effective June 7, 1987, the Airports were transferred by the U. S. Government to the Airports Authority for an initial term of 50 years. On June 17, 2003, the Agreement and the Deed of Lease were extended 30 years to June 6, The Airports operate as a single Business-Type Activity and are reported in the Airports Authority s Aviation Enterprise Fund. On November 1, 2008, the Virginia Department of Transportation (VDOT) transferred responsibility for the operation and maintenance of the Dulles Toll Road (DTR) to the Airports Authority for an initial term of 50 years. As part of the agreement with the Commonwealth, the Airports Authority will construct the Dulles Metrorail Project with an eastern terminus near the West Falls Church Metrorail Station on Interstate 66 and a western terminus of Virginia Route 772 in Loudoun County and will make other improvements in the Dulles corridor consistent with VDOT and regional plans. The DTR and the Dulles Metrorail Project construction projects operate as a single Business-Type Activity and are reported in the Airports Authority s Dulles Corridor Enterprise (DCE) Fund. The Airports Authority is an independent interstate agency. A 13-member Board presently governs the Airports Authority. Five members are appointed by the Governor of Virginia subject to confirmation by the Virginia General Assembly, three are appointed by the Mayor of the District of Columbia subject to confirmation by the Council of the District of Columbia, two are appointed by the Governor of Maryland, and three are appointed by the President of the United States with the advice and consent of the United States 2
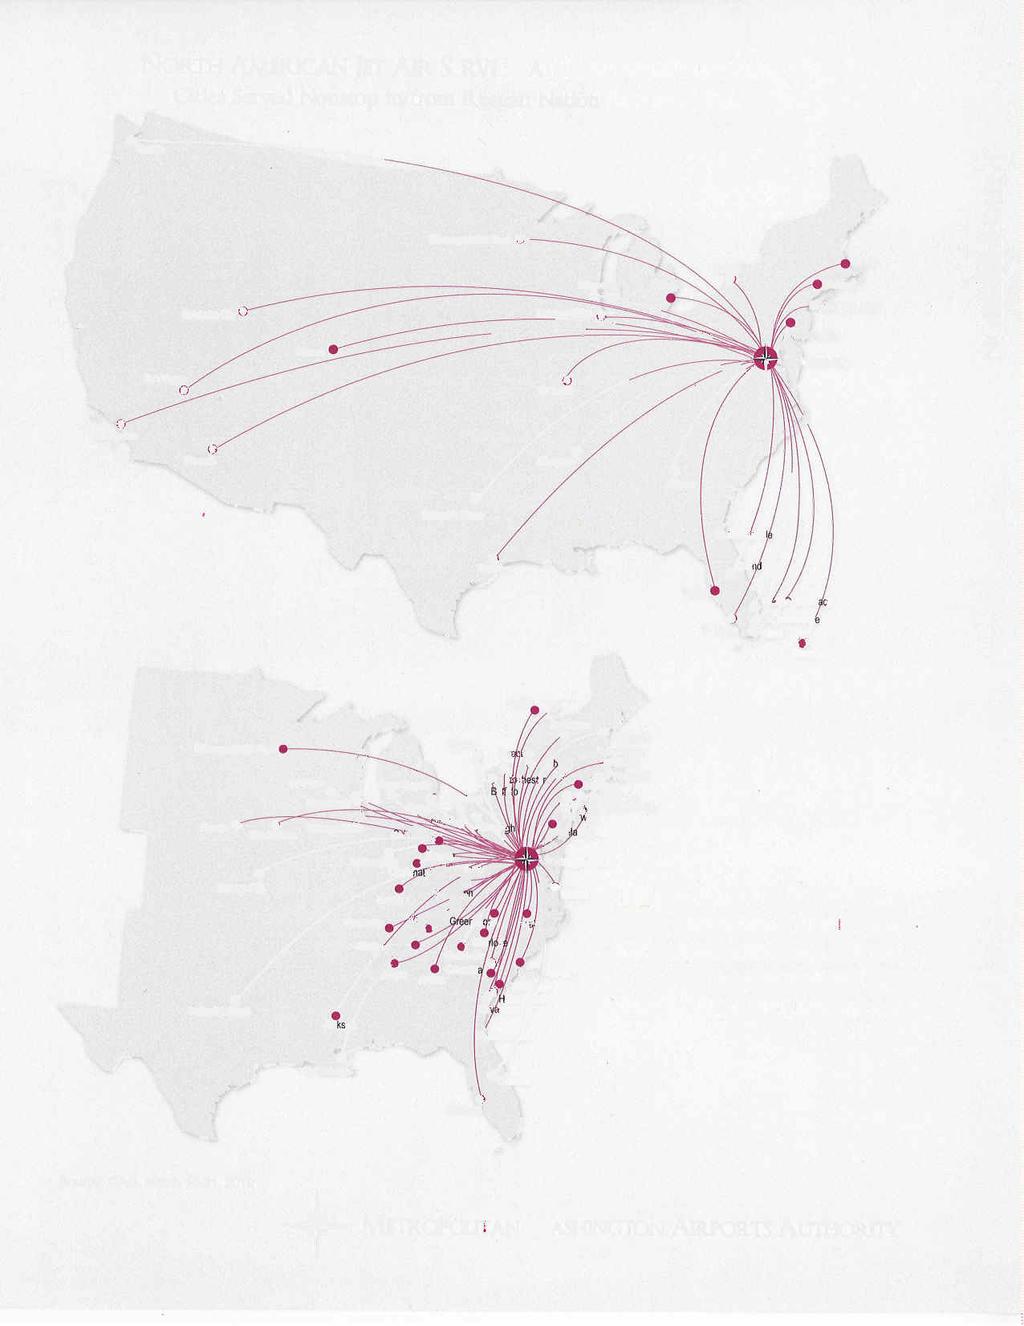
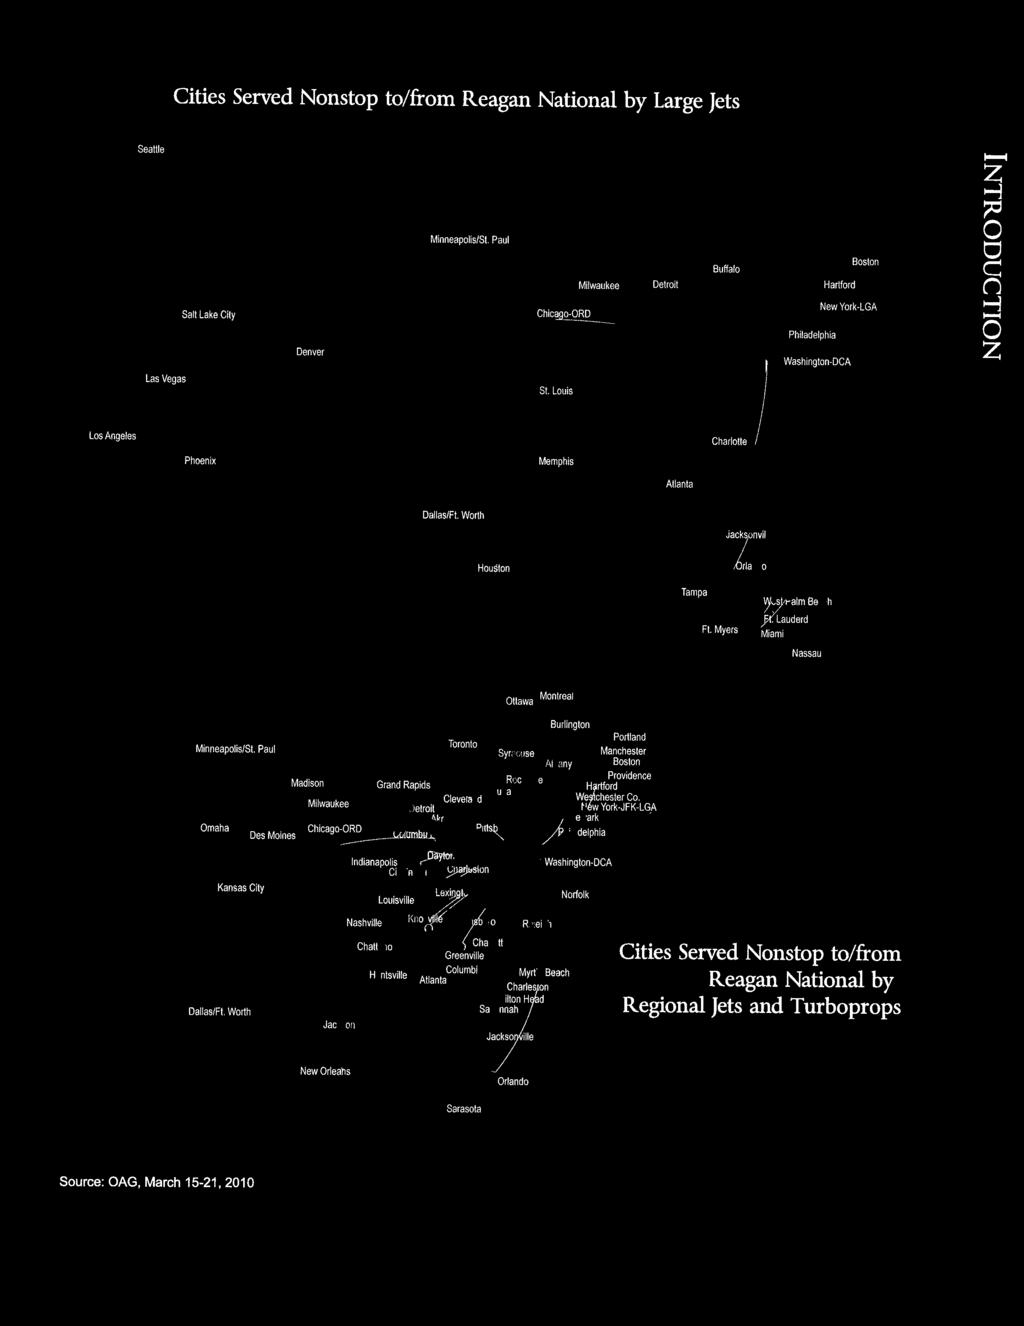
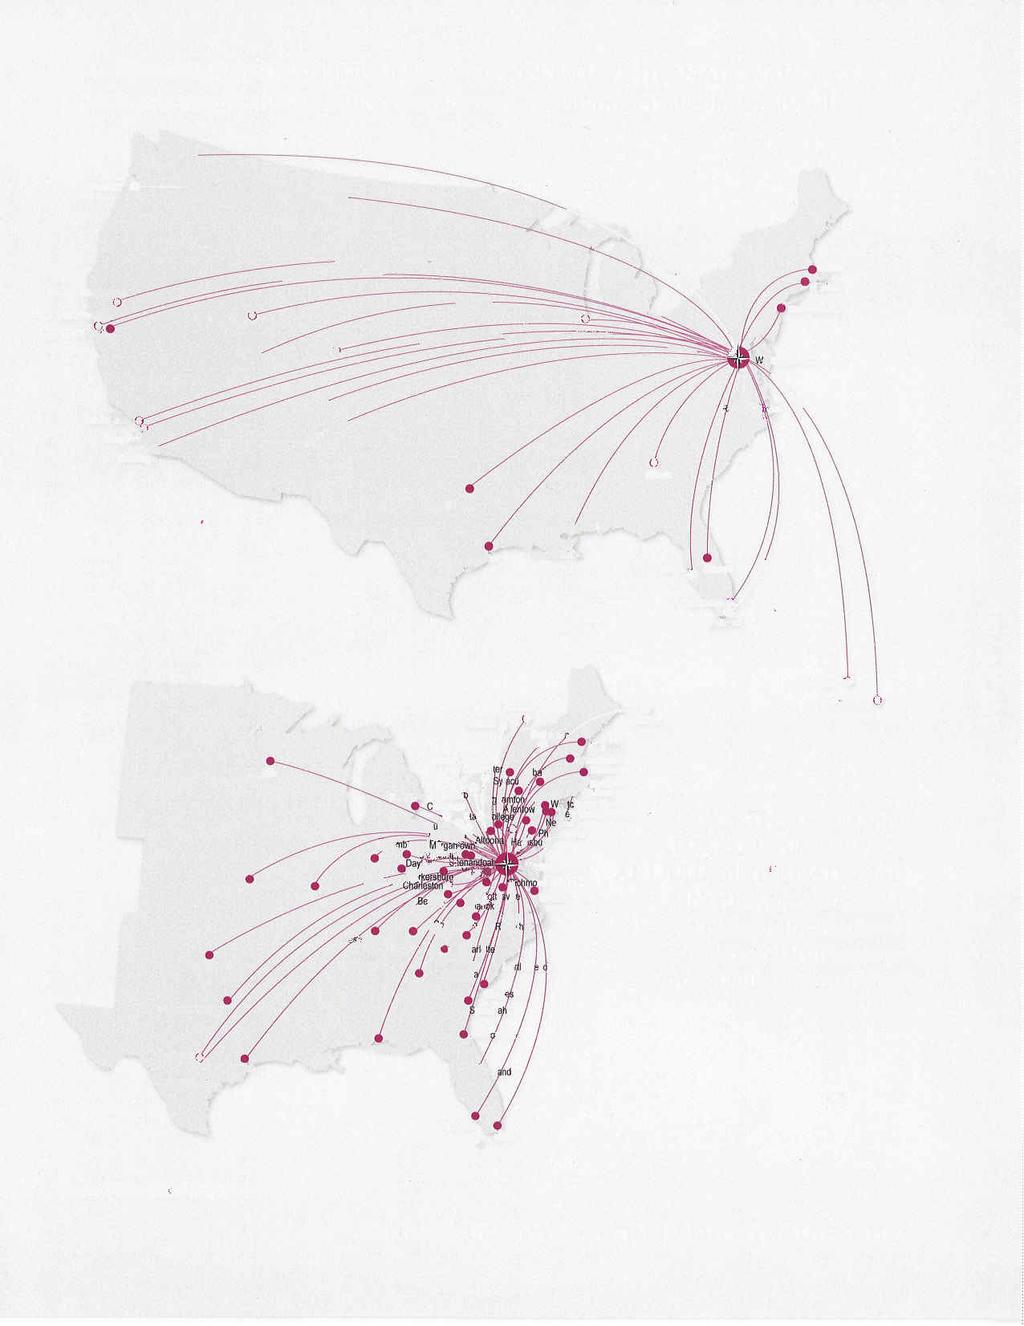
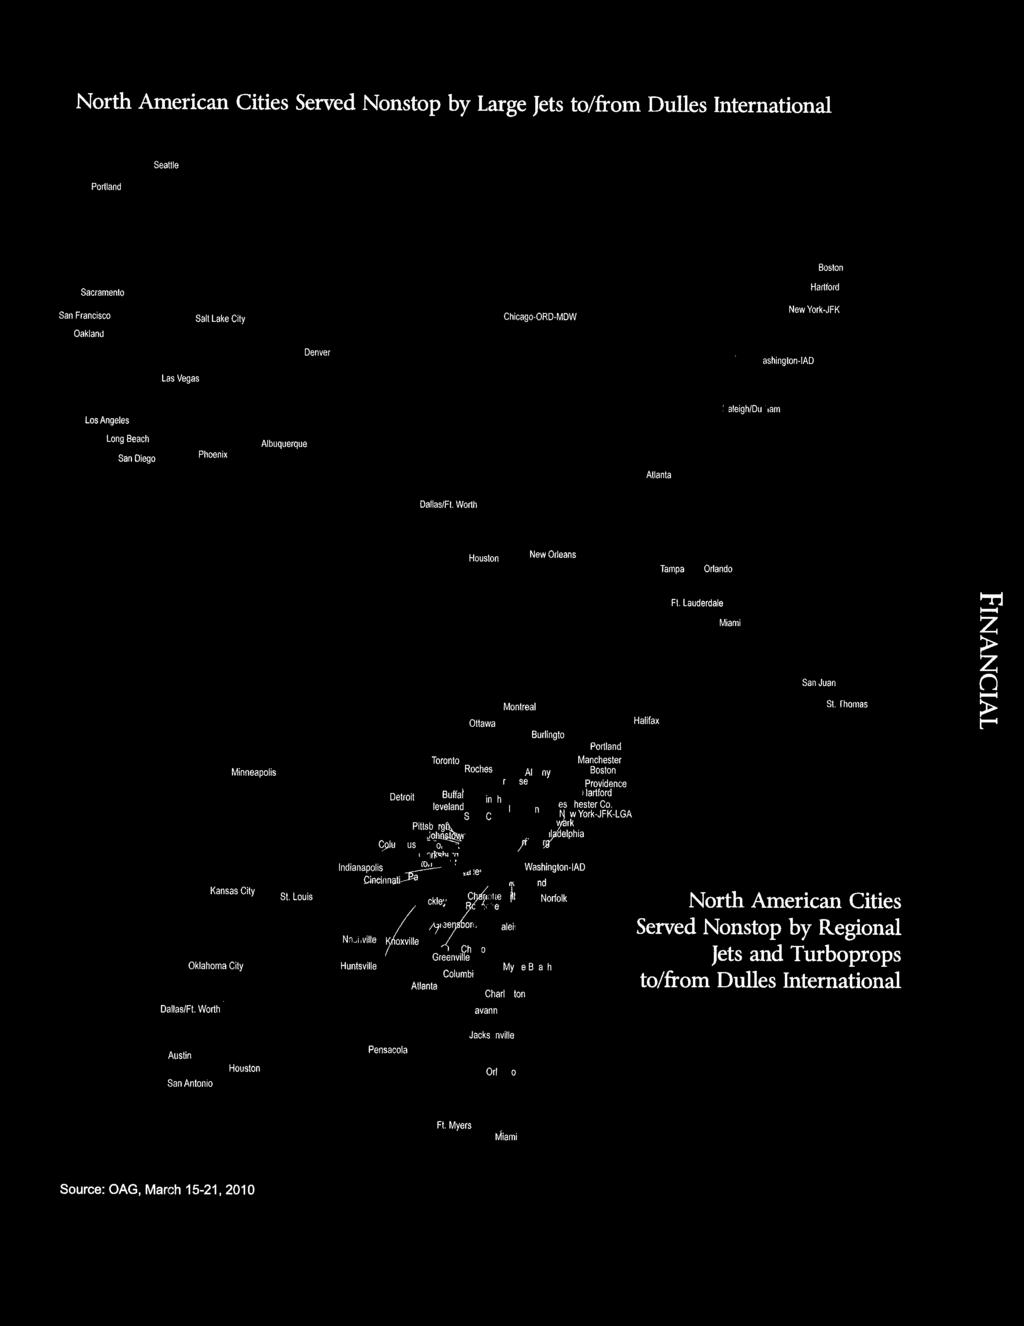
9 Senate. Directors serve staggered, six-year overlapping terms without compensation. They establish the Airports Authority s policy and appoint the Chief Executive Officer. The Board annually elects a Chairman, Vice Chairman, and Secretary. James E. Bennett became the President and Chief Executive Officer of the Airports Authority on May 3, In this position, Mr. Bennett plans and directs all programs and activities of the Airports Authority, focusing on the future and the development of long-term business strategies. Mr. Bennett was formerly the Executive Vice President and Chief Operating Officer of the Airports Authority. Margaret McKeough became the Executive Vice President and Chief Operating Officer of the Airports Authority on April 1, In this position, Ms. McKeough plans and directs the operations of the Airports Authority, including airport management. Ms. McKeough was formerly the Vice President for Business Administration of the Airports Authority. Aviation Enterprise Fund The Airports Authority Aviation Enterprise Fund operates a two-airport system that provides domestic and international air service for the mid-atlantic region. The Aviation Enterprise Fund is self-supporting, using aircraft landing fees, fees from terminal and other rentals, and revenue from concessions to fund operating expenses. The Aviation Enterprise Fund is not taxpayer-funded. The organization consists of 1,405 full and part-time employees in a structure that includes central administration, airports management and operations, and public safety. In February 1990, the Airports Authority entered into a long-term agreement with the major airlines serving Reagan National and Dulles International, the Airport Use Agreement and Premises Lease (the Agreement). The Agreement provides the financial stability necessary for the Airports Authority to operate the Airports and access the capital markets to fund the Capital Construction Program (CCP). The Agreement is for a term of 25 years, subject to annual cancellation rights by the Airports Authority starting in In 2003, the Airports Authority began a review of the Agreement and entered into discussions with the Airlines to determine if changes could be made to improve the operations of the Airports. These discussions continue. The Agreement continues a long history of a close working relationship between the Airlines and the Airports Authority. The Agreement gives the Airlines interest in the positive financial performance of the Airports Authority by sharing in the net remaining revenues (NRR) (see Note L). Christopher U. Browne became the Vice President and Airport Manager of Dulles International on April 2, He was the former Vice President and Airport Manager of Reagan National. Dulles International, which opened in 1962, is situated on approximately 11,830 acres in Fairfax and Loudoun Counties, Virginia. Dulles International is 26 miles from downtown Washington, D.C., from which it is accessible via a 17-mile dedicated dual-lane Access Road and Interstate Route 66. Dulles International is the Airports Authority s international airport, served by 54 domestic and international airlines as of December 31, 2009, providing a full range of domestic services with international service to Europe, Asia, South America, and Africa. J. Paul Malandrino, Jr. became the Vice President and Airport Manager of Reagan National on July 24, Before joining the Airports Authority, he served as the Federal Security Director for the Baltimore- Washington International Thurgood Marshall Airport (BWI) for four years. Prior to that time he served as the Manager of the Operations Department for Dulles International. Reagan National, which opened in 1941, is the 3
10 oldest commercial airport serving the Washington, D.C. area and is located on 860 acres along the Potomac River in Arlington County, Virginia. Approximately three miles from downtown Washington, Reagan National is the Airports Authority s principal domestic airport and is served by 30 airlines as of December 31, The Airports Authority s mission to develop the Airports is the driving force behind its continuing aggressive efforts of air service development. While the facility and service enhancement improvements at Reagan National and Dulles International are notable, the Airports Authority s goal to prepare the dual airport system for the world of tomorrow would not be fulfilled without a concentrated effort to attract airline service for new domestic and international destinations. The Air Trade Area for the Airports Authority is the Washington-Arlington-Alexandria, DC-VA-MD- WV Metropolitan Statistical Area and is comprised of the District of Columbia, five Maryland counties, nine Virginia counties, six independent Virginia cities, and the West Virginia county of Jefferson. There are 84 airlines serving the Airports as of December 31, 2009, providing 272 thousand takeoffs and landings at Reagan National and 340 thousand takeoffs and landings at Dulles International during In addition to passenger traffic, Dulles International provides facilities for cargo transport. There are 524 thousand square feet of cargo buildings at Dulles International, leased by eleven airlines and other aviation support companies. The occupancy of the cargo facilities decreased to 89.7% in 2009, with only 54 thousand square feet of vacancy. In 2009, total cargo weight at Dulles International decreased by 12.3% to 293 thousand metric tons of cargo. The cargo facilities at Dulles International are a major economic engine for the Washington Region. There is no significant cargo transportation at Reagan National. Dulles Corridor Enterprise Fund The DCE Fund is comprised of the Omer L. Hirst-Adelard L. Brault Expressway, also known as the DTR, and the Dulles Metrorail Project, a large capital improvement project extending the existing Metrorail system to Dulles International and beyond into Loudoun County. The DCE Fund is self-supporting using the collected tolls to support the road s general operations, finance the road s ongoing capital program and finance the construction of the Dulles Metrorail Project. The organization consists of 44 full and part-time employees in a structure that includes the DTR and the Dulles Metrorail Project. On November 1, 2008, VDOT transferred operating and maintenance responsibility of the DTR to the Airports Authority through an operating permit for a period of 50 years. The DTR is an eight-lane (4 lanes in each direction) limited access highway 13.4 miles in length. It was built in 1984 by VDOT and until the transfer on November 1, 2008 had been maintained and operated solely by VDOT. It begins just inside the Capital Beltway near Falls Church at the Interstate 66 connector to Washington, D.C. The DTR then travels westward through Fairfax County past Dulles International and terminates at the entrance to the Dulles Greenway, a privately owned toll road. The DTR has 10 exit and entrance ramps with tolls in 2009 of 75 at the main toll plaza west of the Beltway and 50 at other exit and entrance locations for 2-axle vehicles. Tolls were increased on January 1, 2010 to $1.00 at the main toll plaza and 75 at the remaining exit and entrance ramps. It has 59 collection lanes, 33 toll booths and eight E-ZPass dedicated only lanes. All tollbooths are equipped with E- ZPass, an electronic toll collection system accepted in 14 contiguous states, including most states in the Virginia to Maine corridor. 4
11 The DTR processed an average of 9.1 million toll transactions per month in This is a decrease from 2008 of 173 thousand transactions per month or a 1.6% drop in transactions for the year. Capital Construction Program Aviation Enterprise Fund The Aviation Enterprise Fund initiated its CCP in 1988 to expand, modernize and maintain the Airports. Under the CCP, the Airports Authority has constructed and will continue to construct many of the principal elements of the Reagan National and Dulles International Master Plans. Major projects completed under the Master plan at Reagan National include, among others, two new main terminals connected to a Metrorail station, three parking garages, an airport traffic control tower, and a consolidated communications center. Major capital projects completed under the CCP at Dulles International include, among others, expansion and rehabilitation of the Main Terminal, construction of Concourses A and B, the International Arrivals Building (IAB), runway and road improvements, daily parking garages 1 and 2, the air traffic control tower and the addition of a fourth runway. In 2000, the Airports Authority approved an expansion of the CCP for Dulles International referred to as the Washington Dulles Development (d 2 ) program that was expected to be completed in In the aftermath of the events of September 11, 2001, the Airports Authority reexamined the CCP and revised the expected completion date to 2011, which delayed the start dates of several projects and deferred others. In 2006 the program was rescheduled to be completed in At that time, the CCP was expected to cost $7.1 billion in current dollars. Due to a number of factors, including the current economic conditions and the unprecedented increases in the cost of aviation fuel and their impact on the financial conditions of the airlines, in September 2008, the Airports Authority revised the scope, timing and size of certain CCP projects, including deferring the construction of the Tier 2 Concourse and related facilities, the construction of the consolidated rental car facility and the expansion of the south utility service complex, resulting in a $2.1 billion reduction in the cost of the CCP. The Airports Authority currently estimates the cost of the CCP to be approximately $4.5 billion including $2.8 billion in projects that are currently unscheduled. The projects currently in the program at Dulles International include the AeroTrain (formerly known as the Automated People Mover System) to replace the existing mobile lounges which will move passengers between the Main Terminal and Concourses A, B and C, completion of the construction of the IAB expansion, site preparation for the fifth runway, preservation of the historic air traffic control tower in the Main Terminal, concourse modifications to support the Airbus A380 aircraft and Main Terminal restroom upgrades. The AeroTrain began passenger operations in January At Reagan National, projects include a consolidated communications center, runway and taxiway area improvements, replacement of the parking revenue control system, additional decks on Garages A, B and C, and Terminal B/C restroom upgrades. Dulles Corridor Enterprise Fund With the transfer of the DTR from VDOT, the Airports Authority committed to constructing the Dulles Metrorail Project. This is a 23-mile extension of the existing Metrorail system from near the West Falls Church station to Dulles International west to Ashburn in Loudoun County, Virginia. The project will be operated by 5
12 the Washington Metropolitan Area Transit Authority (WMATA) and serve Tysons Corner, the Reston/Herndon area and provide a one-seat ride from Dulles International to downtown Washington. The Dulles Metrorail Project - Phase 1 will extend 11.7 miles from near the West Falls Church station to Wiehle Avenue in Reston. It includes five new stations and improvements to the existing WMATA Service and Inspection Yard at the West Falls Church station. Construction activities began in March 2009 with full revenue operations to begin in December Utility relocation activities began in the spring of The total project cost is estimated to be $2.8 billion. The Dulles Metrorail Project - Phase 2 will extend the Metrorail system 11.3 miles from Wiehle Avenue in Reston to Dulles International and into Loudoun County. Preliminary engineering began under the direction of the Virginia Department of Rail and Public Transportation (VDRPT) and was deferred before the transfer of the project to the Airports Authority. The Dulles Metrorail Project - Phase 2 preliminary engineering resumed in 2009 following the solicitation and award of a contract. The Dulles Metrorail Project - Phase 2 construction is scheduled to begin in 2011 and be completed in The Airports Authority expects to fund the cost of the Dulles Metrorail Project - Phase 1 with a combination of toll road revenue bonds secured by a pledge of DTR revenues, state and federal grants and contributions from local jurisdictions. The Airports Authority executed a Full Funding Grant Agreement (FFGA) with the FTA for $900.0 million on March 10, The Airports Authority has also executed a design-build contract with Dulles Transit Partners LLC for construction of the Dulles Metrorail Project - Phase 1 and issued a notice to proceed with construction on March 11, The Airports Authority s Internet Web Page The Airports Authority has an Internet web site offering a wide array of information to users, including financial information and operational statistics. Users can obtain direct access to the Airlines serving the Airports, and flight arrival and departure information. The Airports Authority s Comprehensive Annual Financial Report (CAFR), Budget, Master Indenture, Debt Service Review, airline rates and charges and aviation statistics are posted on the web site. Since September 11, 2001, the Airports Authority has posted monthly unaudited financial statements to include discussion of results, and other information for the Airports Authority s bondholders and other interested parties. The financial information for the Airports Authority is available on their website at the following address: The Airports Authority s Operating Budgets The Airports Authority s annual operating budgets are a financial planning tool outlining the estimated revenues and expenses for the Airports and for the DTR at certain levels. The Budgets are not prepared according to generally accepted accounting principles (GAAP). The President and Chief Executive Officer submit the Airports Authority s annual operating budgets to the Board for approval. Budgetary controls and evaluations are affected by comparing actual interim and annual results with the budgets, noting the actual level of activities. The Airports Authority conducts quarterly reviews to ensure compliance with the provisions of the annual operating budgets approved by the Airports Authority s Board of Directors (the Board). In keeping with the requirements of a proprietary fund, budgetary comparisons have not been included in the financial section of this report. 6
13 The Aviation Enterprise Fund Operating Budget In 2009, the Airports Authority continued budget constraints that were first initiated in Overtime was reduced and equipment purchases were curtailed. Other initiatives, including new contracts with rental car companies and additional display advertisement, sought to mitigate decreases in concession revenue. Besides the continuation of budget constraints, a cost allocation study was performed and $5.9 million in Aviation Enterprise Fund budgeted operating expenses was allocated to the DCE Fund. Operating revenues reached 97.8% of budget expectations in 2009, while in 2008, operating revenues, reached 96.3% of budget expectations. Operating expenses reached 90.8% of budget authorization in 2009, while in 2008 expenses reached 91.5% of budget authorization. The Airports Authority s 2009 budget reflected a 3.6% increase in revenues and a 0.8% increase in expenses. As a Percentage Budget Actual* of Budget 2009 Revenues $ 517,645,000 $ 506,022, % 2009 Expenses $ 283,530,100 $ 257,376, % 2008 Revenues $ 499,640,000 $ 481,394, % 2008 Expenses $ 281,389,100 $ 257,435, % * As defined in The Airport Use Agreement and Premises Lease, revenues do not include transfers and expenses include debt service but exclude depreciation. The Dulles Corridor Enterprise Fund Operating Budget The 2009 Operating Budget for the DCE Fund reflects the first full year of operating the DTR. For the period from November 1, 2008 through September 30, 2009, the operations of the DTR were contracted to VDOT. There was start-up costs associated with the transfer of operations including $501 thousand in severance pay for employees whose service with VDOT ended. As of October 1, 2009, the majority of employees of the DTR became employees of the Airports Authority. The cost allocation study allocated $5.9 million of operating expenses budgeted in the Aviation Enterprise Fund to the DCE Fund with $3.2 million of the allocation to the DTR and $2.7 million allocated to the Dulles Metrorail Project. The 2008 Operating Budget for the DTR was adopted in anticipation that the transfer of responsibility for the operation and maintenance of the DTR might occur in early Accordingly, a full year s budget for operation and maintenance costs was approved. The actual date of the transfer of the DTR, however, did not occur until November 1, 2008, resulting in only two months of actual operation and maintenance costs. The budget amounts shown below for 2008 are a pro rata portion of the approved full year s budget, based on the period of operations. 7
14 As a Percentage Budget Actual* of Budget 2009 Revenues $ 65,893,000 $ 64,893, % 2009 Expenses $ 22,911,000 $ 26,099, % 2008 Revenues $ 12,979,167 $ 10,416, % 2008 Expenses $ 3,815,667 $ 9,670, % * Includes transitional cost of $7.2 million in Operating expense related to the DTR in 2008 was $2.4 million or 64.9% of budget. AIRPORTS AUTHORITY S ECONOMIC CONDITION In 2009, the U.S. economy experienced a continuation of the recessionary period that began in December In response, the U.S. government provided an integrated series of solutions to stabilize the economy. The economy began to show signs of improvement towards the end of 2009, and many economists are asserting that the worst is over and have projected a slow return to previous growth levels. A statement released by the Federal Open Market Committee after its December 16, 2009 meeting cited that information received since its November meeting suggests that economic activity has continued to pick up and that the deterioration in the labor market is abating. The Washington, D.C. region has traditionally outperformed the national economy and is expected to continue to do so. As home to the federal government and the fourth largest regional economy in the nation 1, the area is somewhat insulated from national downturns. Population growth in the Metropolitan Washington area has consistently outpaced population growth in the United States. From 1990 through 2008, the population grew at an annual compounded rate of 1.5% compared to 1.1% for the United States. Within the region, the largest concentration of population is in the jurisdictions of Fairfax County, Virginia (18.9%); Montgomery County, Maryland (17.7%); Prince George s County, Maryland (15.3%); and the District of Columbia (11.0%). 2 The region s median household income levels are also extremely high, with Loudoun and Fairfax Counties in Virginia and Howard County in Maryland topping the U.S. Census Bureau s American Community Survey in Activity generated by the federal government provides a solid foundation for the area and economic stimulus and stability to the metropolitan area in both up cycles and down cycles. The federal government s procurement spending in the Washington region statistical area amounted to $66.5 billion in 2008, up $6.1 billion or 10% from 2007; its total spending was $134.8 billion in 2008, representing an increase of $9.9 billion or 7.8%. 4 A significant portion of these purchases are in technology-intensive services. 1 Source: Greater Washington Initiative, Greater Washington 2009 Regional Report, Page 4 2 Source: National Planning Association, Data Services, Inc. Key Indicators of County Growth, , 2009 Edition. 3 Source: U.S. Census Bureau s American Community Survey, Note: The 2009 Survey has not been published yet. 4 From the GMU-CRA Shape of the Recovery presentation dated January 15, 2010, of which 2008 is the most current information available. 8
15 On February 17, 2009, Congress passed the American Recovery and Reinvestment Act (ARRA) which is designed to provide a critical boost to the nation s economy. The stimulus plan provides for $787.0 billion over ten years, and $47.0 billion is intended to be spent by the end of While the stimulus dollars will be disseminated throughout the country, Greater Washington is expected to see a significant portion of the package. In addition to the billions of dollars that Virginia, Maryland, and the District of Columbia will receive for infrastructure projects, energy and clean technology, education, and other projects, Greater Washington will also benefit from the money that will be spent simply to manage the various stimulus programs. In addition to the federal government sector, the Washington region is also home to numerous large and small private companies. In the last 24 months, corporate headquarters from diverse companies, such as Computer Sciences Corp., Hilton Worldwide, Volkswagen North America, and SAIC, have relocated to the Washington region. Additionally, Northrop Grumman announced in 2009 that it will move its corporate headquarters to Fairfax County in And, for the thirteenth consecutive year, the Greater Washington region had the largest number of fastest-growing private companies in the country in 2009 according to Inc. Magazine. A large high-tech corridor stretches along the DTR to Dulles International and beyond into Loudoun County and is one of the largest employers of technology workers. Greater Washington s technology cluster has the country s highest concentration of network and computer systems administrators, database administrators, and computer programmers. The region also has six times the national average of computer scientists and four times the national average of computer software engineers. The region is also home to a sizeable biotech industry, largely located along the I-270 corridor in Montgomery County, Maryland. Statistics from the 2001 recession show that when the national economy lost 1.8 million jobs from the Greater Washington region added 66 thousand jobs. This trend appears to have continued during the current economic downturn. As of November 2009, the Washington Metropolitan Statistical Area had the lowest unemployment rate among the 15 largest job markets in the United States. 5 Furthermore, although the region had a higher monthly unemployment rate during 2009 than during previous years, it still compared favorably to the national monthly average unemployment rate. Air United Air United Year Trade Area States Year Trade Area States % 4.0% % 5.1% % 4.7% % 4.6% % 5.8% % 4.6% % 6.0% % 5.8% % 5.5% % 9.3% Source: United States Department of Labor Bureau of Labor Statistics. Average Annual Unemployment Rate Although the recent economic downturn has impacted the Washington area less than the rest of the country, it has not left the region untouched. Activity levels at both the Aviation Enterprise and the DCE 5 From the GMU-CRA Shape of the Recovery presentation dated January 15,
16 decreased in As a result, the Airports Authority continued measures adopted in mid-2008 throughout 2009 to safeguard itself by scaling back budgeted expenditures. Reagan National had total passenger traffic in 2009 of 17.6 million people. This is a decline from 2008 by 451 thousand total passengers or a decrease of 2.5%. The drop, however, was less than the U.S. industry average decrease of 6.9%. Total aircraft operations, either a take-off or a landing, at the airport decreased from 277 thousand operations in 2008 to 272 thousand in 2009, which was a decrease of 1.9%. Dulles International also experienced a decline in passenger traffic dropping 663 thousand passengers to 23.2 million for This was a 2.8% decrease for the year, but was lower than the U.S. industry average decrease of 6.9%. International passenger traffic at Dulles International increased in 2009 by 12 thousand passengers or 0.2%, far exceeding the North America industry average international rate decrease of 4.6%. Total aircraft operations at Dulles International declined 5.5% in 2009 to 340 thousand operations, from 360 thousand operations in The toll road transactions of million for the DTR in 2009 were a decrease of 1.5 million transactions from the combined VDOT and Airports Authority management of the DTR in The DTR s activity for the final two months of 2008 was 17.4 million toll road transactions in mainline or ramp toll plaza. On an annual basis, the DTR processed million transactions in The DTR activity was only in the Airports Authority s total Business-Type Activities since November 1, Long-Term Financial Planning Aviation Enterprise Fund The Airports Authority s long-term financial planning includes the completion of certain approved capital expenditures, the accumulation of sufficient resources required to service the debt issued to finance these expenditures and to operate and maintain the Airports. Under terms of the Agreement, fees and charges paid by the Airlines are used along with other income from the Airports to service the debt issued to finance the construction program. The Airlines pay operating and maintenance expenses, and debt service coverage equal to 125.0% of debt service (by airline cost center). The Airports Authority s CCP is planned to be $4.5 billion in years which includes $2.8 billion in projects currently unscheduled. It is anticipated that the major portion of the facilities development will be financed with the proceeds of bonds issued under the Master Indenture. For the scheduled program the Airports Authority expects to issue $827.4 million in bonds, which includes $303.9 million issued during The Airports Authority also expects to use approximately $280.5 million of Passenger Facility Charge (PFC) revenues, $269.2 million of federal and state grants, and the Airports Authority s portion of NRR to finance these costs. Because of constraints at Reagan National, much of the future growth in aviation activity for the Washington Metropolitan area will occur at Dulles International. Although the U.S airline industry continues to face financial difficulties in 2010, airline activity is expected to begin to recover. Enplanements at Reagan National are projected to increase to 9.0 million or 2.9%. Dulles International domestic enplanements are projected to increase to 8.6 million or 2.1%. Dulles International s international enplanements are projected to decrease to 3.0 million or 2.8%. The combined enplanements for Dulles International are projected to decrease in 2010 to 11.6 million or 0.2%. 10
17 Since 1988, the Airports Authority has participated in the AIP, the federal government's airport grant program. The AIP provides funding for airport development, airport planning and noise compatibility programs from the Airport and Airway Trust Fund. The AIP also provides both entitlement and discretionary grants for eligible projects. The Airports Authority also receives grants from the Commonwealth. In 1990, Congress approved the Aviation Safety and Capacity Expansion Act, which authorized domestic airports to impose a PFC on enplaning passengers. In May 1991, the FAA issued the regulations for the use and reporting of PFCs. PFCs may be used for airport projects which meet at least one of the following criteria: preserve or enhance safety, security, or capacity of the national air transportation system; reduce noise or mitigate noise impacts resulting from an airport; or furnish opportunities for enhanced competition between or among carriers. The Airports Authority applied for, and was granted, permission to begin collecting a $3.00 PFC effective November 1993 at Reagan National and January 1994 at Dulles International. The Airports Authority applied for, and received in February 2001, the approval to increase the PFC collection from $3.00 to $4.50, effective May In accordance with the regulations, based on the approval date from the FAA and continuing through the PFC collection period, the Airports Authority s share of AIP entitlement grants was reduced by 75.0%. The Airports Authority has submitted and gained approval of four series of PFC applications, with amendments, covering both Airports in the amount of $1.5 billion. In March 2007, the Airports Authority filed a fifth PFC application for approximately $125.0 million. This application allowed the PFCs collected at Reagan National to provide funds for the expansion of the IAB at Dulles International. On February 9, 2009, the Airports Authority also submitted a request for approval of an Amendment to Application No C-01- IAD, which provides PFC funding for the AeroTrain and related projects. The application was originally approved August 15, 2005 and subsequently approved on March 6, In March 2009, the Airports Authority received approval of an additional amendment to restructure the PFC Financing Plan for the AeroTrain to include $87.7 million from the Pay-As-You-Go program, $1.4 billion in new Bond Capital, and $603.0 million in financing and interest cost. Additionally, $821.3 million of the interest cost will be paid by the Airlines through airline rates and charges. All other funding remains the same. In 2010, the Airports Authority expects to collect a total of $89.3 million in PFCs. Dulles Corridor Enterprise Fund The DCE Fund s long-term planning includes the completion of the Dulles Metrorail Project - Phase 1 and Phase 2 and certain approved capital expenditures on the DTR. The Airports Authority anticipates that the funding for the capital expenditures on the DTR and the Dulles Metrorail Project - Phase 1 will include fees and charges collected on the DTR, the issuance of $1.1 billion in DTR bonds, $900.0 million in FTA funding and $651.7 million in state and local grants. OTHER INFORMATION Recognition of Awards and Achievement The GFOA awarded a Certificate of Achievement for Excellence in Financial Reporting to the Airports Authority for its CAFR for the fiscal year ended December 31, This was the twentieth consecutive year 11
18 that the government has achieved this prestigious award. In order to be awarded a Certificate of Achievement, a government must publish an easily readable and efficiently organized CAFR. This report must satisfy both GAAP and applicable legal requirements. A Certificate of Achievement is valid for a period of one year only. We believe that our current CAFR continues to meet the Certificate of Achievement Program s requirements, and we are submitting it to the GFOA to determine its eligibility for another certificate. The Airports Authority has also received the GFOA s Award for Distinguished Budget Presentation for many years since 1991 and the GFOA s Popular Annual Financial Reporting (PAFR) Award for the last three years. Acknowledgments In closing, I would like to thank the President and Chief Executive Officer and the Board for their leadership and support in planning and conducting the financial operations of the Airports Authority. Special thanks are directed to Mark Tune, Cindy Sano, and Diane Lary, for the preparation of the CAFR. Additional staff that deserve recognition for their efforts in completing the CAFR are Andrew Rountree, Wanda Onafuwa, Michael Donaldson, Matthew Wermer, William Bailey, Janice Gardner, Teresa Arnold, Nancy Edwards, David Tucker, Paula Simms, Kris Wenneson, and Susan Abeles as well as all personnel within the Office of Finance. Lynn Hampton, CPA Vice President and Chief Financial Officer 12
19 CERTIFICATEOF ACHIEVEMENT Certificate of Achievement The Government Finance Officers Association of the United States and Canada (GFOA) awarded a Certificate of Achievement for Excellence in Financial Reporting to the Metropolitan Washington Airports Authority for its comprehensive annual financial report for the year ended December 31, In order to be awarded a Certificate of Achievement, a government unit must publish an easily readable and efficiently organized comprehensive annual financial report whose contents conform to program standards. The report must satisfy both generally accepted accounting principles (GAAP) and applicable legal requirements. A Certificate of Achievement is valid for a period of one year only. We believe our current report continues to conform to the Certificate of Achievement program requirements and we are submitting it to GFOA to determine its eligibility for another certificate. 13
20 Organization Chart Board of Directors Charles D. Snelling Chairman James E. Bennett President and Chief Executive Officer Quince T. Brinkley, Jr. VP & Secretary Board of Directors Margaret E. McKeough Executive Vice President & Chief Operating Officer Philip Sunderland VP & General Counsel Valerie Holt VP for Audit Mark Treadaway VP for Air Service Planning & Development J. Paul Malandrino, Jr. VP & Airport Manager Reagan National Christopher Browne VP & Airport Manager Washington Dulles Elmer Tippett, Jr. VP for Public Safety Mark Treadaway Acting VP for Communications Lynn Hampton VP for Finance & Chief Financial Officer Frank Holly VP for Engineering Robert Sullivan Airport Operations Dana Pitts Airport Operations Stephen Holl Police Chief Tara Hamilton Public Affairs Andrew Rountree Deputy Chief Financial Officer Stephan Smith Deputy Vice President Richard Golinowski Engineering & Maintenance Brian Leuck Engineering & Maintenance Gary Mesaris Fire Chief Marcia McAllister Communications Dulles Corridor Metrorail Project Mark Tune Controller Vacant Assistant Vice President Ronald Stange Airport Administration Michael Stewart Airport Administration Claude Rountree Public Safety Administration Pamela Alme Marketing Deborah Lipman Governmental Affairs Luz Cofresi-Howe Deputy Project Director Dulles Corridor Metrorail Project Nancy Edwards Treasury Patrick Nowakowski Executive Director Dulles Corridor Metrorail Project Charles Carnaggio Project Director, Dulles Corridor Metrorail Project Steven Baker VP for Business Administration Cyndi Ward Dulles TollRoad Arl Williams VP for Human Resources George Ellis VP for Info & Telecom Systems Neal Phillips Noise Abatement Margaret Bishop Community Relations Rita Alston Budget Rochelle Cameron Financial Strategy and Analysis William Lebegern Planning Diane Hirsch Design Kenneth Vogel Construction Walter Seedlock Building Codes/ Environmental Richard Gordon Equal Opportunity Michael Natale Risk Management Administrative Services Kathleen Verret Concessions & Property Development E. Fred Seitz, Jr. Procurement & Contracts Vacant Air Carrier Relations Deborah Lockhart Staffing & Records Services Warren Reisig Benefits & Retirement Michael Brogan Organization Development Kenneth Pritchard Compensation John Tapajcik Labor & Employee Relations Syed Ali IT Operations & Services Alisia Billups-O Neill Telecommunications Systems Derek Kelly Wireless & Radio Systems Merrill Phelan IT Systems & Programming 14

21
22
23 INTENTIONALLY LEFT BLANK
24 MANAGEMENT S DISCUSSION AND ANALYSIS (unaudited) INTRODUCTION The following discussion and analysis of the financial performance and activity of the Metropolitan Washington Airports Authority (the Airports Authority) is to provide an introduction and understanding of the basic financial statements of the Airports Authority for the year ended December 31, 2009 with selected comparative information for the years ended December 31, 2008 and December 31, This discussion has been prepared by management, is unaudited and should be read in conjunction with the financial statements, and the notes thereto, which follow this section. Using the Financial Statements The Airports Authority s financial report includes three financial statements: the Statements of Net Assets; the Statements of Revenues, Expenses and Changes in Net Assets; and the Statements of Cash Flows. The financial statements are prepared in accordance with accounting principles generally accepted in the United States of America as promulgated by Governmental Accounting Standards Board (GASB) principles. The financial statements presentation includes two Enterprise Funds. The Aviation Enterprise Fund encompasses the two Airports, Ronald Reagan Washington National Airport (Reagan National) and Washington Dulles International Airport (Dulles International), (collectively, the Airports). The Dulles Corridor Enterprise (DCE) Fund, which commenced November 1, 2008, encompasses the Dulles Toll Road (DTR) and the Dulles Corridor Metrorail Project (Dulles Metrorail Project). The Statements of Net Assets depict the Airports Authority s financial position as of a point in time, December 31, and include all assets and liabilities of the Airports Authority. The Statements of Net Assets demonstrate that the Airports Authority s assets equal liabilities plus net assets. Net assets represent the residual interest in the Airports Authority s assets after liabilities are deducted. Net assets are displayed in three components: invested in capital assets, net of related debt; restricted; and unrestricted. The Statements of Revenues, Expenses and Changes in Net Assets report total operating revenues, operating expenses, non-operating revenues and expenses, and other changes in net assets as of the end of a fiscal period, the year ended December 31. Revenues and expenses are categorized as either operating or nonoperating based upon management's policy as established in accordance with definitions set forth by GASB. Significant recurring sources of the Airports Authority s revenues, including Passenger Facility Charges (PFCs), investment income and federal, state and local grants are reported as non-operating revenues. The Airports Authority s interest expense is reported as non-operating expense. The Statements of Cash Flows present information showing how the Airports Authority s cash and cash equivalents position changed during the fiscal year. The Statements of Cash Flows classify cash receipts and cash payments resulting from operating activities, capital and related financing activities, and investing activities. 17
25 The Airports Authority s Activity Highlights Aviation Enterprise Fund Pursuant to the Airports Authority s Airport Use Agreement and Premises Lease (the Agreement), the Airports Authority has activity-based revenues which include non-airline fees such as parking and rental car and airline based fees such as landing fees, rents, international arrival fees and passenger conveyance fees. There have been many factors and events that have negatively affected the air transportation industry in the past year such as the general economic downturn beginning in the latter part of 2007 and continuing through 2009 resulting in contraction in the economy. In response to this, the Airports Authority has diversified its revenue sources, increased the carriers using its Airports and adhered to the principles of fiscal restraint. In 2008, the U.S. economy experienced uncertainty and instability beginning with the banking crisis and spreading to the major industrial sectors including aviation. The economic recession has resulted in a decrease in air travel in 2008 and Enplanements at Reagan National for the 12 months of 2009 were 8.8 million, compared to 9.0 million for the year 2008 and 9.3 million for the year In 2007, Reagan National experienced record passenger levels and reported record high revenues from other sources such as concessions. The economic recession translated into a severe dislocation of the world credit market and a contraction in the economy with a resulting decrease in air travel. Total enplanements at Dulles International for the 12 months of 2009 were 11.6 million compared to 11.9 million in 2008, and 12.4 million in In 2007, Dulles International was growing rapidly and surpassed all previous years closing the year with growth in total passengers and increased revenues in all areas. International enplanements for the 12 months of 2009 were 3.1 million and were slightly higher than 2008 and 157 thousand higher than Enplanements and Operations Activity for 2007 to Dulles International Enplanements Dulles International Domestic 8,429,500 8,742,530 9,313,161 Dulles International International 3,117,271 3,115,417 2,960,345 Dulles International Non-Commercial 67,557 86, ,310 Total Dulles International Enplanements 11,614,328 11,944,861 12,382,816 Reagan National Enplanements Reagan National Domestic 8,634,011 8,836,467 9,145,554 Reagan National Transborder 133, , ,523 Reagan National Non-Commercial 4,651 4,349 4,230 Total Reagan National Enplanements 8,771,894 8,982,180 9,298,307 Operations Dulles International 340, , ,939 Reagan National 272, , ,433 18


 transferred responsibility for the operation and maintenance of the DTR to the Airports")
26 Total Enplanement Activity for Total Operations Activity for Millions 15,000,000 10,000,000 5,000,000 0 Thousands 400, , , , , , ,000 50, Dulles International Enplanements Reagan National Enplanements Dulles International Reagan National The North American combined domestic and international aviation industry growth rate declined by 6.9% for Both Airports exceeded this rate by more than 3.6% while experiencing a reduction in passengers. Dulles International s international passenger growth rate was 0.1% This growth rate far exceeded the North American industry average international growth rate by 4.7%. Enplanements Growth MWAA North America Difference Dulles International (Domestic) -3.6% -7.2% 3.6% Dulles International (International) 0.1% -4.6% 4.7% Reagan National -2.3% -7.2% 4.9% Dulles Corridor Enterprise Fund On November 1, 2008, the Virginia Department of Transportation (VDOT) transferred responsibility for the operation and maintenance of the DTR to the Airports Authority for an initial term of 50 years. The operations of the DTR were contracted to VDOT under the agreement until September 30, As of October 1, 2009, the employees of the DTR became employees of the Airports Authority, all contracts of the DTR became contracts of the Airports Authority and the Airports Authority s public safety department began providing the primary police and fire service for the DTR. As part of the agreement with the Commonwealth of Virginia (the Commonwealth), the Airports Authority will construct the Dulles Metrorail Project from the vicinity of West Falls Church to Route 772 in Loudoun County and will make other improvements in the Dulles corridor consistent with VDOT and regional plans, using revenues from the DTR to pay the resulting debt service. The DTR is an eight lane (4 lanes in each direction) limited access highway 13.4 miles in length. During 2009, the Airports Authority commenced a public process with the aim of raising the tolls on the DTR. The DTR has 10 exit and entrance ramps. Effective January 1, 2010 the tolls of 75 at the main toll plaza west of the Beltway were raised to $1.00 and the tolls at all other exit and entrance locations were raised from 50 to 75. The toll increases are necessary to support the financing for the Dulles Metrorail Project. The DTR processed million transactions in 2009 a 1.5 million decrease in transactions from The DTR processed an average of 9.1 million transactions per month in This is a decrease from 2008 of 19
27 122 thousand transactions per month or a 1.3% decrease in transactions for the year. Nationally, toll road transactions decreased by 3.4%. Financial Highlights - Aviation Enterprise Fund The overall activity results of 2009 reflect the general slowdown experienced as a result of the recession that started in December The Airports Authority recorded $558.5 million in operating revenues for This was a total increase from 2008 of $7.5 million and from 2007 of $48.0 million. The Airports Authority s revenues are primarily derived from rents and charges for the use of the Airports Authority s facilities, including landing fees received from both Signatory and non-signatory Airlines using the Airports, and concession contracts at the Airports, including off-airport rental car operations. Concessions historically have accounted for a substantial portion of the Airports Authority s revenues. The Agreement requires the Signatory Airlines to pay actual costs plus debt service coverage, while the majority of concessionaires pay a percentage of revenue or a minimum annual guarantee (MAG) payment. Percent of Increase Increase (Decrease) (Decrease) Classifications Revenue Revenue from 2008 from 2008 Concessions $ 217,413,676 $ 223,710,732 $ (6,297,056) (2.8%) Rents 193,736, ,331,285 22,404, % Design fees - 20,363,189 (20,363,189) 100.0% Landing fees 96,934,558 82,289,545 14,645, % Utility sales 13,227,161 13,348,545 (121,384) (0.9%) Passenger fees 30,665,358 28,354,142 2,311, % Other 6,476,626 11,547,405 (5,070,779) (43.9%) Total $ 558,453,459 $ 550,944,843 $ 7,508, % The following is a graphic illustration of operating revenues by source for the years ended December 31, 2009 and 2008: Passenger fees 5.5% Utility sales 2.4% 2009 Revenues Other 1.1% Concessions 38.9% Landing fees, 14.9% 2008 Revenues Passenger fees, Utility sales, 5.2% Other, 2.1% 2.4% Concessions, 40.6% Landing fees 17.4% Rents 34.7% Rents, 31.1% Design Fees, 3.7% 20
28 Airline Revenue In 2009, airline revenues, which consist of landing fees, terminal rents and passenger fees, increased $16.2 million from 2008, principally related to an increase in debt service at Dulles International for the security mezzanine and fourth runway and debt service for Concourse A renovation at Reagan National. Prior-year Transfers, used as an offset to airline revenues (see Note L), decreased $6.6 million. Landing fees increased $14.6 million to $96.9 million or 17.8%. Rent revenue increased $22.4 million, a 13.1% increase from Passenger fees, including International Arrivals Fees and fees paid by the Transportation Security Administration (TSA) increased $2.3 million or 8.2%. As part of its emergence from bankruptcy in 2006, United Airlines (United) agreed to reimburse the Airports Authority over a 10-year period for the expenses incurred by the Airports Authority in designing the Tier 2 Concourse and related facilities. In June 2008, the Airports Authority ceased all design work on the Tier 2 Concourse and related facilities. In conjunction with the cessation of the work on Tier 2 Concourse and related facilities, the Airports Authority recognized the $20.4 million as design fees revenue in the Airports Authority s Statement of Revenue, Expenses and Changes in Net Assets. Other Revenue In 2009, other revenues of $6.5 million decreased $5.1 million from 2008 principally related to $1.8 million received in 2008 for construction right of way and $3.2 million received in 2008 from the Greenway Toll Road for the construction of an entrance ramp. Concession Revenue In 2009, the Airports Authority s concession revenues decreased $6.3 million or 2.8%, from Concession revenues account for 38.9% of total operating revenues, down from 2008 by 1.7%. Car parking revenues rank as the Airports Authority largest concession providing $107.7 million in total revenues for the year. This is a decrease of $7.4 million from last year and reflects the general decrease in passenger traffic. Rental car revenue of $38.9 million increased $2.9 million from 2008 supplemented by the new MAG amounts as negotiated in new contracts for both Reagan National and Dulles International in recent years. Ground transportation revenues of $6.9 million increased by $544 thousand and reflect the new taxi contract in place at Dulles International and new taxi fees at Reagan National. In 2009, the registered traveler program had revenues of $328 thousand before it ceased operations in June In 2008 the registered traveler program had revenues of $534 thousand. Excluding car parking and rental car revenue, all other areas of concession revenue decreased $1.9 million or 2.5% with a 24.4% decrease in duty free revenue, a 6.5% increase in display advertisement, an 8.5% increase in ground transportation and moderate changes in the food and beverage and remaining concession revenue sources. Concession revenue at Reagan National increased in total by $1.1 million in Parking revenues decreased $2.2 million from 2008 at Reagan National. The parking garages at Reagan National experienced a drop in average occupancy from 83.8% in 2007 to 82.9% in 2008 and 75.8% in Parking rates were increased at both airports in June Construction on an additional level to Parking Garages A, B and C began in This additional area will provide approximately 1,424 new public parking spaces when it opens in March When complete there will be 9,829 parking (including handicap) spaces at Reagan National: 475 hourly, 6,243 daily, 2,996 economy, and 115 overflow spaces. In December 2009, Sam & Harry s, a fullservice restaurant opened at Reagan National, and for the first time, a restaurant offers a full-service breakfast. 21
29 In January 2008, National Airport Grill, Einstein Bagel, a second location of Mayorga Coffee and an Auntie Anne s opened at Reagan National. There were no new retail openings in 2009 or Concession revenue at Dulles International decreased $7.4 million from In 2009, parking revenues were $66.0 million, a decrease of $5.2 million from In 2009, there were 27,433 public parking spaces at Dulles International. Public parking is comprised of 1,923 spaces in hourly, 8,325 daily, 830 valet, 12,398 economy, 3,733 in overflow and 224 in the cell phone lot. Overall activity for public parking decreased 9.7% in 2009 compared to Total exits for 2009 were 2.8 million compared to 3.1 million in Total parking revenue decreased 7.2% due to decreased passenger activity. Food and beverage revenue decreased 2.6% over 2008 to $8.5 million, resulting from decreased enplanement activity. In 2009, two new restaurants and one new retail business opened in the expansion of midfield Concourse B. New tenants included Chipotle, City Wok and America!. The following table details concession revenues by major category for years ended December 31, 2009 and December 31, 2008: Concession Revenues Percent of Increase Increase (Decrease) (Decrease) from 2008 from 2008 Parking $ 107,721,718 $ 115,105,856 $ (7,384,138) (6.4%) Rental cars 38,865,186 35,949,215 2,915, % Food and beverage 15,626,929 15,860,110 (233,181) (1.5%) Newsstand and retail 11,900,883 11,921,105 (20,222) (0.2%) Duty free 2,881,047 3,810,294 (929,247) (24.4%) Display advertising 8,243,796 7,737, , % Inflight caterers 6,705,056 6,872,934 (167,878) (2.4%) Fixed base operator 12,353,018 12,712,051 (359,033) (2.8%) Ground transportation 6,913,108 6,368, , % All other 6,202,935 7,373,352 (1,170,417) (15.9%) Total $ 217,413,676 $ 223,710,732 $ (6,297,056) (2.8%) Operating Expense Operating expenses for the Aviation Enterprise Fund, for fiscal year ended December 31, 2009 were $502.5 million, a decrease of $53.1 million or 9.6% over In 2009, the Airports Authority continued the budget constraints that were first initiated in The alignment of office workforce and workload was reviewed and alternative approaches to fulfilling the requirements of vacant positions were enacted. Initiatives were taken to reduce overtime, and equipment purchases were curtailed. As a result of these cost containment measures, materials, equipment, supplies, contract services and other is the largest expenditure area and closed the year $14.4 million less than 2008 and $34.2 million lower than
30 A cost allocation study was performed in 2009 to recognize the work performed by Aviation Enterprise for the Dulles Toll Road and Dulles Metrorail Project. As a result of this allocation study, $5.9 million of Aviation Enterprise Fund operating expenses was allocated to the DCE Fund. The 2008 expenses reflect the one-time reduction of $7.4 million in previously recorded expenses to be repaid to the Aviation Enterprise Fund from the DCE Fund primarily $7.2 million for costs incurred to-date associated with the pursuit and transfer of the DTR and Dulles Metrorail Project and additional $200 thousand in operating expense. In 2008, the Airports Authority recognized a one-time transaction to record a write off of design costs incurred on the Tier 2 Concourse and related facilities. In 2008, the Airports Authority ceased all design work on the Tier 2 Concourse and related facilities. If the Airports Authority was to proceed with the Tier 2 Concourse in the future, the Tier 2 Concourse and related facilities are likely to be substantially different from what is reflected in the designs and plans developed to date. Consistent with GASB Statement No. 42 Accounting and Financial Reporting for Impairment of Capital Assets and for Insurance Recoveries (GASB 42), the Airports Authority recorded $66.2 million in impairment losses as period expenses in The Airports Authority continued its process of implementing a new Enterprise Resource Planning (ERP) system. In March 2009, the Airports Authority selected Oracle EBusiness Solutions as the ERP software. According to accounting principles as promulgated in GASB Statement No. 51, Accounting and Financial Reporting for Intangible Assets (GASB 51), the Airports Authority was in the developmental stage of the implementation program in early 2009 and all of 2008 and expensed the costs through the Statements of Revenues, Expenses and Changes in Net Assets. In March 2009, the Airports Authority began capitalizing the ERP, and as of December 31, 2009, $14.5 million was included in work in progress for the project. The Airports Authority experienced a record snow event in December of 2009 incurring $5.0 million in snow-related expenses over a period of three days. The Governor of Virginia declared the snow event an emergency, and the Airports Authority has filed initial paperwork to receive reimbursement for the cost. In 2008, the year of implementation for GASB Statement No. 49, Accounting and Financial Reporting for Pollution Remediation Obligations (GASB 49), pollution remediation costs residing in the Airports Authority s construction in progress accounts were expensed. The 2008 expenses of $2.6 million reflect the implementation expenses, as well as other current year pollution remediation work, consistent with GASB 49. Pollution remediation expense in 2009 was $1.6 million. The Airports Authority s utility expenditures for 2009 were $28.1 million, an increase of $2.7 million from 2008 and an increase of $7.0 million from In 2009 fuel prices began to moderate throughout the world resulting in a leveling of the cost of utilities purchased by the Airports Authority. Salaries and related benefits expenses of $140.1 million resulted in an increase of $3.6 million from 2008 and $11.7 million from When compared to 2008, health insurance expenses of $13.6 million increased $331 thousand and regular salaries increased $2.6 million. Overtime increased in 2009 by $897 thousand with the increase related to the record snowstorm experienced in December The Airports Authority continues its funding of the Other Post-Employment Benefits (OPEB) program and recorded $6.6 million in expenses for 2009, $5.9 million in expenses for 2008, and $5.9 million for The contribution percentages to the Airports Authority s retirement plans decreased to 6.4% in 2009 from 6.8% of eligible earnings in 2008 for the general plan and increased to 13.0% in 2009 from 12.4% of eligible earnings in


 (8.9%) Impairment loss/design costs - 66,170,165 (66,170,165) (100.0%) Salaries and related benefits 140,138,903 136,508,033 3,630,870 2.")
31 for the police and firefighter plan. The Funded Ratio as of the Actuarial Valuation Date of December 31, 2008 was 107.8% for the general plan and 98.8% for the police and firefighters plan. Depreciation and amortization expense in 2009 was $181.2 million. This is an increase of $20.9 million from 2008 and $39.2 million from In 2009 the Airports Authority completed and put into service at Dulles International the passenger security mezzanine which is the first element of the automated train system, the AeroTrain, and the first phase of the expanded International Arrivals Building. Aviation Enterprise Operating Expenses Expense Classification Percent of Increase Increase (Decrease) (Decrease) from 2008 from 2008 Materials, equipment, supplies, contract services and other $ 147,883,400 $ 162,254,215 $ (14,370,815) (8.9%) Impairment loss/design costs - 66,170,165 (66,170,165) (100.0%) Salaries and related benefits 140,138, ,508,033 3,630, % Utilities 28,141,680 25,402,257 2,739, % Lease from U.S. Government 5,066,069 4,958, , % Depreciation and amortization 181,234, ,256,762 20,977, % Total $ 502,464,427 $ 555,549,712 $ (53,085,285) (9.6%) The following is a graphic illustration of the total operating expenses by source for the years ended December 31, 2009 and 2008: 2009 Expenses 2008 Expenses Lease from U.S. Government 1.0% Utilities 5.6% Depreciation and amortization 36.1% Salaries and related benefits 27.9% Materials, supplies, equipment, other 29.4% Lease from U.S. Government 0.9% Utilities, 4.6% Salaries and related benefits 24.6% Impairment loss/design costs 11.9% Depreciation and amortization 28.8% Materials, supplies, equipment, other 29.2% 24
32 Changes in Net Assets The 2009 operating income was $56.0 million, an increase of $60.6 million from 2008 and $24.1 million from The results primarily reflect the reduction in materials, supplies, and services and non-capital project expenses realized from the budget constraints applied during the year and in comparison to 2008, the write off of the design cost for Tier 2. Non-operating revenues of $119.2 million are comprised of $139.5 million in Fair Value Gains on swaps less $35.0 million in swap termination payouts and $14.7 million in investment income. On April 1, 2009, concurrent with the closing of the Series 2009A-B bonds, the Airports Authority terminated the two Bank of Montreal swaps with effective dates of July 15, 2009 and the Wachovia swap with an effective date of July 15, 2009 and made a combined termination payment of $35.0 million. When compared to 2008 and 2007, nonoperating revenues are up by $81.2 million and $63.6 million, respectively. The continued reduction in interest rates, as seen in 2009, has had a direct effect on investment income with a decrease of $23.2 million and $40.8 million when compared to 2008 and 2007, respectively. In fiscal year 2009, the Federal Reserve kept interest rates low to help the U.S. economy recover. To minimize the risk of the loss of financial assets, the Airports Authority has adopted an investment policy. The investment policy is designed to be conservative and protect the financial assets of the Authority. The investment policy goals are the safety of principal, liquidity and lastly yield. The investment policy limits investments to highly rated fixed income securities with maturities matching the Airports Authority s cash requirements. Further the Airports Authority s bond proceeds are invested according to the permitted investments in Master Bond Indentures. The debt service reserve funds are primarily invested in guaranteed investment contracts (GICs) that invest in permitted investments. The GICs must maintain collateral of 103.0% of principal in a third party trust account. The market values of the GICs are monitored by the Treasurer. If the counterparty to the GIC were to default, the securities in the GIC would be available to the Airports Authority for sale and reinvestment. There would be a discontinuation of the interest paid by the counterparty to the Airports Authority. Non-operating expenses, primarily interest expense and financing charges, were $145.5 million for the year. In fiscal year 2008 the traditional relationship of LIBOR and variable municipal bond interest rates moved in opposite directions where London International Bank Offered Rate (LIBOR) interest rates were lower and municipal interest rates increased resulting in a $158.4 million unrealized loss on the outstanding swaps. Interest expenses and finance charges were $146.2 million for 2009 which is an increase from 2008 of $20.8 million and $30.7 million from In 2001, the Airports Authority began a risk management program to assist in managing the interest cost on outstanding and future debt. The Airports Authority s derivatives consist of interest rate swaps used to modify interest rates on outstanding and future debt. Based on the Airports Authority s International Swaps and Derivatives Association Agreement (Swap Agreement), the Airports Authority owes interest calculated at a notional amount multiplied by a fixed rate to the counter parties. In return, the counter parties owe the Airports Authority interest based on the notional amount multiplied by a variable rate equal to 72.0% of LIBOR. Only the net difference in interest payments is actually exchanged with the counter parties. The Airports Authority continues to pay interest to the bondholders at the variable rate provided by the bonds associated with the swap. 25
33 During the term of the Swap Agreement, the Airports Authority pays, or receives, the difference between the fixed rate on the swaps and 72.0% of LIBOR. For the year ended December 31, 2008, the Airports Authority implemented GASB Statement No. 53, Accounting and Financial Reporting for Derivative Instruments (GASB 53). According to GASB 53, all of the Aviation Enterprise s forward-starting swap transactions and those swap transactions associated with issued debt were determined to be ineffective in 2008 and are recognized at fair value on the Statements of Net Assets. GASB 53 states that if LIBOR, or a percentage of LIBOR, is employed as a hedge of tax-exempt debt, hedge effectiveness should be evaluated using one of the quantitative methods. For the year ended December 31, 2008, the Airports Authority applied the synthetic instrument method to determine swap effectiveness. GASB 53 requires that if a derivative instrument is found to be ineffective in the first reporting period, evaluation of effectiveness in subsequent reporting periods should not be performed. Therefore, since all of the Airports Authority s derivatives were found to be ineffective at the end of December 31, 2008, its first reporting period, hedge accounting ceased permanently, and the changes in the value of this instrument will be reported in the Statements of Revenues, Expenses and Changes in Net Assets as Fair Value (Loss) Gain. In 2008, subsequent to the bankruptcy of Lehman Brothers, the 2001 and 2006 Lehman Brothers Swaps were terminated. The Airports Authority paid Lehman Brothers the calculated value of $10.6 million and $5.9 million, respectively. In 2008, three 2005 Swaps, with an effective date of October 1, 2008, were amended to extend the effective date to January 15, 2009 and increase the fixed-payer rate. On January 7, 2009, the three 2005 swaps were again amended to extend the effective date to July 15, 2009 and increase the fixed-payer rate. In connection with the issue of the Series 2009B Airport System Revenue Bonds, on April 1, 2009, the Airports Authority terminated the three outstanding 2005 Swaps with a notional amount of $175.0 million for a total termination payment of $35.0 million. On October 1, 2009, the Airports Authority began paying the counterparties for the two 2006 swaps, J.P. Morgan and Bank of America, 4.1%, and began to receive from the counterparties interest based on the total notional amount of $300.0 million multiplied by a variable rate equal to 72.0% of LIBOR. 26
34 The following table provides information on the Airports Authority s Swaps as of December 31, 2008, and December 31, Effective Date/Termination Date (Final Notional Amount Fixed Fair Market Fair Market Change in Fair Trade Date Maturity) Counterparty ($millions) Rate Value at 12/31/08 Value at 12/31/09 Market Value 07/31/2001 8/29/02-10/01/21 Merrill Lynch $ % $ (11,587,964) $ (6,922,472) $ 4,665,492 05/13/2005 1/15/09-10/1/31 Wachovia 3.966% (14,517,184) Terminated 14,517,184 Bank of Montreal 4.059% (7,880,152) Terminated 7,880,152 1/15/09-10/1/36 Bank of Montreal 3.911% (17,008,939) Terminated 17,008,939 06/15/ /1/09-10/1/39 JP Morgan Chase % (54,400,169) (24,258,893) 30,141,276 Bank of America (31,903,537) (14,174,632) 17,728,905 06/15/ /1/10-10/1/40 Wachovia % (46,433,048) (17,885,122) 28,547,926 05/13/ /1/11-10/1/39 Wachovia % (24,940,948) (5,945,956) 18,994,992 $ $ (208,671,941) $ (69,187,075) $ 139,484,866 Capital contributions include PFCs, federal and state grants and other capital property acquired. PFC revenue for 2009 was $78.5 million, $66 thousand greater than 2008 and $4.3 million less than This reduction in receipts from 2007 reflects the general downturn in air travel predicated by the overall general economic conditions in 2009 and Federal and state grants were $348.1 million in 2009, $89.3 million in 2008, and $32.3 million in In 2009, the Airports Authority received $7.5 million in Airport Improvement Program (AIP) grants primarily reimbursed the capital cost of the construction of the fourth runway at Dulles International and received American Recovery and Reinvestment Act (ARRA) grants of $10.9 million for Runway Rehabilitation at Dulles International and for $400 thousand for TSA Surveillance closed circuit TV and In-line Baggage Electronic Detection Systems. The change in net assets is an indicator of the overall fiscal condition of the Airports Authority. Net assets increased in 2009 by $136.9 million. This increase includes the effects of the combined loss on hedge termination and the Fair Value Gain on swaps of $104.5 million. 27
35 The following represents a summary of the Statements of Revenues, Expenses and Changes in Net Assets for the Aviation Enterprise: Aviation Enterprise Operating revenues Concessions $ 217,413,676 $ 223,710,732 $ 217,486,823 Rents 193,736, ,331, ,301,027 Design fees - 20,363,189 - Landing fees 96,934,558 82,289,545 78,682,496 Utility sales 13,227,161 13,348,545 11,778,736 Passenger fees 30,665,358 28,354,142 28,684,113 Other 6,476,626 11,547,405 6,542,935 Total operating revenues 558,453, ,944, ,476,130 Operating expenses Material, equipment, supplies contract services, and other 147,883, ,254, ,096,091 Impairment loss/design costs - 66,170,165 - Salaries and related benefits 140,138, ,508, ,465,267 Utilities 28,141,680 25,402,257 21,134,317 Lease from U.S. Government 5,066,069 4,958,280 4,830,121 Depreciation and amortization 181,234, ,256, ,030,354 Total operating expenses 502,464, ,549, ,556,150 Operating income (loss) 55,989,032 (4,604,869) 31,919,980 Non-operating revenues Investment income 14,725,255 37,965,692 55,557,746 Fair value gains on swaps 104,466, Total non-operating revenues 119,192,121 37,965,692 55,557,746 Non-operating expenses Interest expense (144,510,068) (122,984,332) (111,534,092) Passenger facility charges, financing costs (944,806) (2,330,507) (3,968,842) Fair value losses on swaps - (178,810,699) (24,577,653) Total non-operating expenses (145,454,874) (304,125,538) (140,080,587) Income/(Loss) before capital contributions 29,726,279 (270,764,715) (52,602,861) Capital contributions 107,142, ,592, ,674,180 Increase (decrease) in net assets $ 136,868,848 $ (140,172,186) $ 66,071,319 28
36 Financial Highlights - Dulles Corridor Enterprise Fund Operating Revenue On November 1, 2008, VDOT transferred responsibility for the operation and maintenance of the DTR to the Airports Authority for an initial term of 50 years. As part of its agreement with the Commonwealth, the Airports Authority will construct the Dulles Metrorail Project from the vicinity of West Falls Church to Route 772 in Loudoun County and will make other improvements in the Dulles corridor consistent with VDOT and regional plans. These two functions operate as a single Business-Type Activity and are reported in the DCE Fund. On October 1, 2009, Commonwealth employees of the Dulles Toll Road became Airports Authority employees, all contracts of the Dulles Toll Road were transferred to the Airports Authority and the primary responsibility for the public safety of the Dulles Toll Road was transferred to the Airports Authority. The DTR is an eight lane (4 lanes in each direction) limited access highway 13.4 miles in length. The DTR has 10 exit and entrance ramps with tolls in 2009 of 75 at the main toll plaza west of the Beltway and 50 at other exit and entrance locations for 2 axle vehicles. It has 59 collection lanes, 33 toll booths and 8 E-ZPass dedicated only lanes. All toll booths are equipped with E-ZPass (recognized from Virginia to Maine) electronic toll collection systems. For the year ended December 31, 2009, the Airports Authority recorded Toll Road revenue of $64.9 million consisting of Automated Vehicle Identification (AVI) or electronic toll collections of $45.1 million, cash collections of $19.2 million and violations revenues of $547 thousand. AVI collections as a percentage of total operating revenues were 69.6%. The Airports Authority in November and December of 2008 recorded revenue of $10.4 million consisting of AVI or electronic toll collections of $7.1 million, cash collections of $3.2 million and violations revenues of $109 thousand. AVI collections as a percent of total operating revenues were 68.6%. DCE Operating Revenues Cash revenues $ 19,199,661 $ 3,166,176 Automated vehicle identification revenues 45,146,685 7,141,495 Violation revenues 547, ,827 Total tolls and other $ 64,893,554 $ 10,416,498 Operating Expenses For the year ended December 31, 2009, the DCE Fund recorded $30.1 million in operating expenses of the DTR and Dulles Metrorail project. Operating expenses of $24.8 million in Supplies and Materials include $9.5 million paid to VDOT for operations of the DTR through September 30, 2009, and $5.3 million in electronic toll collection fees paid to the processor of the AVI transactions. The Airports Authority contracted with VDOT to continue to operate the DTR from November 1, 2008 through September 30, For the year ended December 31, 2008, the DCE Fund recorded $10.2 million in operating expenses from the date of transfer, November 1, 2008 to the end of the reporting period. Materials, equipment, supplies, contract services and other included $7.2 million in expenses to be repaid to the Aviation Enterprise Fund from the DCE Fund for costs incurred associated with the pursuit and transfer of the DTR and Dulles Metrorail project. This payment was made in Operating expenses also include $788 thousand in electronic toll collection fees paid to the processor of the AVI transactions and $1.5 million paid to VDOT. 29
37 The majority of costs related to the DCE Fund are directly charged to the fund. In certain instances, overhead costs for the Airports Authority are initially paid from the Aviation Enterprise Fund, but are appropriately allocable to the DCE Fund as costs associated with operation of the DTR or as costs of the Dulles Metrorail Project. In 2009 the Airports Authority completed a cost allocation plan. The purpose of the CAP is to identify and quantify all indirect and overhead costs appropriately allocable to the DCE Fund and to appropriately allocate those costs. In 2009, $5.9 million was allocated from the Aviation Enterprise Fund to the DCE Fund with $3.2 million allocated to the DTR and $2.7 million to the Dulles Metrorail Project. DCE Operating Expenses Materials, supplies, equipment, contract services and other $ 24,836,947 $ 10,028,145 Salaries and related benefits 4,071, ,627 Utilities 67,989 - Depreciation and amortization 1,118,482 8,204 Total $ 30,094,845 $ 10,248,976 The DCE Fund closed 2009 with total net assets of $666.5 million. The following represents a summary of the Statements of Revenues, Expenses and Changes in Net Assets of the DCE Fund: Dulles Corridor Enterprise Operating revenues Tolls and other $ 64,893,554 $ 10,416,498 Total operating revenues 64,893,554 10,416,498 Operating expenses Materials, equipment, supplies contract services, and other 24,836,947 10,028,145 Salaries and related benefits 4,071, ,627 Utilities 67,989 - Depreciation and amortization 1,118,482 8,204 Total operating expenses 30,094,845 10,248,976 Operating income 34,798, ,522 Non-operating revenues Investment income 422,349 26,126 Total non-operating revenues 422,349 26,126 Gain before capital contributions 35,221, ,648 Capital contributions 321,813, ,241,103 Increase in net assets $ 357,034,671 $ 309,434,751 30
38 Changes in Net Assets Operating income for the DCE Fund, for the year ended December 31, 2009 was $34.8 million. Fiscal year 2008 operating income for the two-month period ended December 31, 2008 was $168 thousand. The 2008 operating results reflect a shortened operating period and the one time addition of $7.4 million in expenses to be repaid to the Aviation Enterprise Fund from the DCE Fund for costs associated with the pursuit and transfer of the DTR and Dulles Metrorail Project. With the transfer on November 1, 2008, a number of one-time accounting entries were necessary. The Airports Authority received and recognized at fair value DTR related assets and liabilities transferred from VDOT on November 1, These included cash, accounts receivable, liabilities, and personal property. The transfer of these items resulted in the recognition, in accordance with GASB Statement No. 33, Accounting and Financial Reporting for Non-Exchange Transactions (GASB 33), of capital contributions in the amount of $17.3 million. Upon transfer of the DTR, the Airports Authority also received from the Virginia Department of Rail and Public Transportation (VDRPT) a one-time transfer of existing construction in progress for the Dulles Metrorail Project. This resulted in capital contributions in the amount of $254.8 million, and for DCE, for the year, total capital contributions of $309.2 million. For fiscal year ending December 31, 2009, the DCE Federal and state grants were $322.5 million inclusive of the $77.3 million in ARRA funding to the Dulles Metrorail Project. The Commonwealth transferred $50.0 million of the $125.0 million in bond funds to the Airports Authority for use on project expenses. As of the end of December, the Airports Authority had expended approximately $34.8 million of the Commonwealth funding. Fairfax County provided the first $25.0 million in funding to the Airports Authority on June 11, As of the end of December, the Airports Authority had expended all the $25.0 million of Fairfax County funds. Statements of Net Assets Aviation Enterprise Fund and Dulles Corridor Enterprise Fund The Statements of Net Assets present the financial position of the Airports Authority at the end of the fiscal year. The Statements include all assets and liabilities of the Airports Authority. Net assets are the difference between total assets and total liabilities and are an indicator of the current fiscal health of the Airports Authority. A summarized comparison of the Airports Authority s assets, liabilities and net assets on December 31, 2009, 2008, and 2007, is as follows: 31
39 Current assets $ 1,413,466,567 $ 662,511,761 $ 849,502,892 Non-current assets Capital assets, net 5,889,869,511 5,307,658,368 4,616,109,321 Other non-current assets 735,134, ,420, ,617,047 Total Assets 8,038,470,330 6,526,590,959 5,907,229,260 Liabilities Current liabilities 334,335, ,590, ,593,920 Non-current liabilities Long-term debt outstanding and other restricted liabilities 6,038,000,414 4,898,769,249 4,588,666,516 Total Liabilities 6,372,335,422 5,354,359,570 4,904,260,436 Net Assets Invested in capital assets, net of debt 880,078, ,351, ,206,611 Restricted 379,767, ,285, ,983,454 Unrestricted 406,288, ,594, ,778,759 Total Net Assets $ 1,666,134,908 $ 1,172,231,389 $ 1,002,968,824 Statements of Net Assets Current assets increased $751.0 million from 2008 and $582.2 million from Current assets for the Aviation Enterprise Fund increased $72.8 million primarily as a result of the increase in cash and cash equivalents of $20.9 million and in unrestricted investments of $30.9 million, both related to the Airports Authority s goal to increase the days of cash on hand. Restricted current assets for the Aviation Enterprise Fund increased $6.8 million with a decrease of restricted cash and cash equivalents and an increase in PFCs. Current assets for the DCE Fund increased $678.2 million. In 2009 capital assets increased $582.2 million. The Aviation Enterprise Fund continued its construction program in 2009 recording an increase, net of depreciation, of $199.3 million in capital assets. The DCE Fund recorded an increase of $382.9 million in capital assets (see Note G). This increase includes the $380.2 million in construction in progress for the Dulles Metrorail Project. In total, the Dulles Metrorail Project includes $742.5 million in CIP.. Current liabilities decreased $121.3 million from 2008 and increased $18.7 million from The decrease in current liabilities for 2008 relates to the repayment of the $150 million bond anticipation notes. The DCE Fund provided $46.7 million in accounts payable and accrued expenses primarily for the Dulles Metrorail Project. The Aviation Enterprise Fund saw a decrease in accounts payable and accrued expenses, restricted and unrestricted of $11.0 million from 2008 in response to reduced spending for both the operational budget and the CCP. In 2009, long-term liabilities increased $1.1 billion. Bonds payable increased $1.7 billion as a result of the issuance of $851.3 million in Airport System Revenue Bonds less a principal payment of $90.5 million on the outstanding bonds, the refunding of $432.0 million in PFC bank participation notes and the issuance of $972.3 million in Dulles Toll Revenue Bonds. In 2008, the Airports Authority reduced other liabilities by $
40 million with the recognition of deferred revenue as income in the Statements of Revenues, Expenses and Changes in Net Assets of the design fees United Airlines (United) agreed to reimburse the Airports Authority for the expenses incurred by the Aviation Enterprise Fund in designing the Tier 2 Concourse and related facilities. The Airports Authority had a net decrease in its outstanding commercial paper by $2.5 million in The DCE Fund bonds payable was $967.1 million at year ended December 31, 2009 as a result of the issuance of $972.3 million in Series 2009A through D bonds and related discounts of $5.2 million and $9.0 million accretion from capital appreciation bonds. The DCE Fund did not have any long-term debt at year ended December 31, In 2009, the DCE Fund reduced other liabilities by $157.2 million with the payment to the Aviation Enterprise of $7.4 million for the cost of the pursuit and transfer of the DTR and Dulles Metrorail Project and the repayment of the $150.0 million bond anticipation notes. As of December 31, 2009, the DCE liability of $6.3 million was due to the Aviation Enterprise Fund for services provided to the DCE in the normal course of business, including the cost allocation plan. Total net assets, which represent the residual interest in the Airports Authority assets after liabilities are deducted, increased $493.9 million from 2008 and $663.1 million from The DCE Fund provided a $357.0 million increase in total net assets for 2009 and the Aviation Enterprise Fund recorded an increase of $136.9 million in total net assets for The account Invested in Capital Assets, Net of Related Debt increased $181.7 million from 2008 and $324.9 million from For the Aviation Enterprise Fund, capital assets, net of depreciation, increased $199.3 million. This was offset by a net increase in debt related to capital expenditures of $132.1 million, resulting in an overall increase for the Aviation Enterprise Fund of $67.2 million and an increase of $114.6 million for the DCE Fund. For the DCE Fund, capital assets increased $383.0 million. At the year ended December 31, 2009, total restricted net assets of $379.8 million consist of unspent debt proceeds, including debt service reserve funds, and unspent PFC funds. This was an overall increase from 2008 of $248.5 million. The Aviation Enterprise Fund s restricted net assets increased $33.8 million. Restricted assets and restricted liabilities increased $855.4 million and $606.9 million, respectively. Current restricted investments increased $341.4 million reflecting the increase in the value of the Airports Authority s swaps offset by continued construction spending. Restricted debt related to unspent bond proceeds increased $1.7 billion. An increase of accounts payable and accrued expenses of $20.6 million also occurred in The DCE Fund restricted net assets of $251.7 million had $368.6 million in cash, $434.2 million in investments and $80.4 million in grants receivables at year end. These were offset by $42.3 million in restricted accounts payable and accrued expense and $613.9 million in debt related to unspent debt proceeds. Total unrestricted net assets at the end of the reporting period for the Airports Authority were $406.3 million. This is an overall increase of $63.7 million from These net assets may be used to meet any of the Airports Authority s ongoing operational needs for the Aviation Fund and DCE Fund, subject to approval by the Airports Authority s Board of Directors (the Board). Unrestricted net assets for the Aviation Enterprise Fund increased $35.9 million. As a result of operations, cash, investments and accounts receivable increased $20.9 million, $24.2 million, and $12.6 million, respectively, offset by an increase in accounts payable and accrued expenses of $18.1 million. 33
41 The DCE Fund unrestricted net assets were $22.6 million as of December 31, This was primarily operational cash derived from the DTR activities and prepaid expenses of $1.7 million offset by unrestricted accounts payable and accrued expenses of $10.7 million. Capital Financing and Debt Management Aviation Enterprise Fund As a result of the ARRA of 2009 the Airports Authority, as all U.S. airports, was able to issue bonds that had full federal tax-exemption, with the interest income to the investors not subject to the alternative minimum tax. During 2009, the Airports Authority issued four series of aviation bonds and two series of commercial paper with the ARRA tax provisions. The $163.2 million Series 2009A Airport System Revenue Bonds refunded the Commercial Paper (CP) Notes Series One and CP Notes Series Two. The $236.8 million Series 2009B bonds refinanced a portion of the CP Notes Series One and provided funds for the capital construction program. The $314.4 million Series 2009C Bonds and the $136.8 million Series 2009D variable rate bonds refinanced the outstanding PFC Notes Series A, B, C and D. In October 2009, Series Two CP was expanded to create two sub-series, A-1 and C, with $21.0 million and $17.5 million issued in a full federal tax-exempt status. In November 2009, an additional $86.5 million of Series two CP was issued to fund the capital construction program including capitalized interest. At December 31, 2009, the Aviation Enterprise Fund had $90.0 million outstanding in Series One CP Notes and $125.0 million of Series Two CP Notes outstanding. In 2009, the total available CP was reduced by $75.0 million to $345.0 million in recognition of the reduced capital construction program. As of December 31, 2009, the Airports Authority has available but not issued $130.0 million CP. As of December 31, 2009, the Airports Authority Aviation Enterprise Fund had $4.9 billion in outstanding Airport System Revenue Bonds. The Airports Authority s Aviation Enterprise Fund s long-term uninsured bonds are rated AA by Fitch, Aa3 by Moody s, and AA- by Standard & Poor s Rating Services (S&P). Fitch affirmed the Airports Authority s rating with a Stable Outlook on June 2, Moody s affirmed the Airports Authority s rating with a Stable outlook on May 29, On June 23, 2009 S&P affirmed the AA- rating with a Stable Outlook. S&P assigned the Airports Authority an overall Debt Derivative Profile rating of 1.5 on a scale of 1 to 4, with 1 representing the lowest risk and 4 representing the highest risk. The Airports Authority is financing its Aviation Enterprise Fund CCP through a combination of revenues, entitlement, and discretionary grants received from the Federal Aviation Administration (FAA), state grants, PFCs, and revenue bonds. Long-term debt is the principal source of funding for the CCP. The Airports Authority, through its Master Indenture, has agreed to maintain debt service coverage of not less than 1.25x. Debt service coverage is calculated based on a formula included in the Master Indenture and the Agreement with the Airlines. Historically, the Airports Authority has maintained a coverage ratio significantly higher than its requirement. During 2009 and 2008, the Airports Authority s debt service coverage was 1.49x and 1.57x, respectively. 34
42 Dulles Corridor Enterprise Fund On November 1, 2008 the Airports Authority DCE Fund issued bond anticipation notes for $150.0 million to provide short-term financing for the Dulles Metrorail Project. On August 5, 2009, $972.3 million in Dulles Toll Road Revenue Bonds Series A, B, C and D were issued to refund the bond anticipation notes and to provide funding for the Dulles Metrorail Project and certain capital improvements to the DTR; $198.0 million Series A are current interest bonds, $212.1 million Series B are capital appreciation bonds, $162.2 million Series C are convertible capital appreciation bonds which convert to current interest bonds beginning October 1, 2016, and $400.0 million Series D are Build America Bonds. Build America Bonds are taxable bonds, where the Airports Authority DCE Fund will pay taxable interest to the investor and receive a payment of 35.0% of the interest cost from the federal government. No other debt financings occurred in Federal and State Grant Activity Aviation Enterprise Fund and Dulles Corridor Enterprise Fund In March 2007, the Airports Authority submitted a PFC application for the International Arrivals Building (IAB) at Dulles International. This application was approved in On February 9, 2009, the Airports Authority submitted a request for approval of an Amendment to Application No C-01-IAD, which was originally approved August 15, 2005 and subsequently approved on March 6, The Airports Authority restructured the PFC Financing Plan for the AeroTrain to include $87.7 million from the Pay-As-You- Go program, $1.4 billion in new Bond Capital, and $603.0 million in financing and interest cost to be paid from PFC. The remaining $821.3 million interest cost for the AeroTrain will be paid by the Airlines through Airline Rates and Charges. As of December 31, 2009, the Airports Authority has drawn down a total of $113.9 million out of the $200.0 million award under the 2006 FAA Letter of Intent (LOI) funding for the fourth runway project at Dulles International. The TSA has allocated an additional $9.0 million to the South Baggage Basement In-Line Screening Explosive Detection System at Dulles International. The additional funding brings the total federal share to $42.0 million. As of December 31, 2009, the Airports Authority received a total of $5.0 million from TSA as 100.0% reimbursement for the design phase of the project and billed TSA for our first invoice of $496 thousand on the construction phase of the project. The East and West Baggage In-Line Screening System application at Dulles International was approved for $154.0 million TSA funding in The Reagan National In-Line Screening Baggage application was not funded in Fiscal Year The FAA continues to review the eligibility requirements to meet the AIP eligibility for reimbursement of the acquisition cost of the land purchased for the fourth runway at Dulles International. The FTA awarded the Final Design Grant for the Dulles Metrorail Project in September 2008 with a total cost of $159.0 million. As of December 2009, the Airports Authority drew a total of $115.1 million from the Final Design Grant. The $900.0 million Full Funding Grant Agreement (FFGA) was approved by the FTA on March 10, 2009 and is inclusive of all previously awarded grants for the Dulles Metrorail Project. On May 18, 2009, the United States Department of Transportation (USDOT) announced its intention to allocate $77.3 million in ARRA funding to the Dulles Metrorail Project. These funds will replace Section 5309 funds that are scheduled to be received in the final year (2016) of the FFGA. The grant was executed on August 26, As of December 17, 2009, the ARRA grant was fully drawn down by the Airports Authority. 35
43 Cash and Investment Management Aviation Enterprise Fund and Dulles Corridor Enterprise Fund The Airports Authority s cash and cash equivalents increased $277.2 million to $600.2 million as of December 31, 2009 as a result of the available cash both restricted and unrestricted in the DCE Fund. Cash and cash equivalents with an original maturity of three months or less are considered highly liquid investments. Restricted investments increased by $483.9 million from 2008 primarily as a result of investments related to the proceeds of DCE Bonds. The following summary shows the major sources and use of cash: Cash received from operations $ 612,535,087 $ 560,453,406 Cash expended from operations (325,915,915) (358,051,337) Net cash provided by operations 286,619, ,402,069 Net cash from noncapital financing activities (17,005) 15,108,417 Net cash provided (used) by capital and related financing activities 522,046,834 (416,124,468) Net cash provided (used) by investing activities (489,532,057) 309,352,703 Net cash provided (used) by capital financing and investing activities 32,497,772 (91,663,348) Net increase in cash and cash equivalents 319,116, ,738,721 Cash and cash equivalents, beginning of year 335,666, ,927,684 Cash and cash equivalents, end of year $ 654,783,349 $ 335,666,405 Cash temporarily idle during 2009 was invested in demand deposits, certificates of deposit, commercial paper, United States Government and agency obligations, mutual funds, repurchase agreements collateralized by the United States Government or agency obligations, and other permitted investments as listed in the Master Indenture for the Airports Authority s outstanding bonds. During 2009, the Airports Authority s Aviation Enterprise Fund operating account average portfolio balance was $303.3 million and the average yield on investments was 0.86%. The capital funds are held by an agent for the Trustee, but managed by the Airports Authority. For 2009, the capital funds had an average portfolio balance of $514.0 million and an average yield of 2.28%. During 2009, the Airports Authority s DCE Fund operating account average portfolio balance was $30.2 million and the average yield on investments was 0.05%. The capital funds are held by an agent for the Trustee, but the Airports Authority directs the investments. For 2009, the capital funds had an average portfolio balance of $653.6 million and an average yield of 0.25%. Certain Airports Authority funds that will be used for bond requirements (see Note F) and capital projects are invested in long-term instruments. An annual cash flow projection for capital projects is developed for all bond proceeds and investments are matched to maximize investment income while ensuring cash is available for capital project expenses. All investments must be made following the investment policy that was adopted by the Airports Authority s Board. An investment committee meets quarterly to review the portfolios for compliance with the investment policy (see Note C). 36
44 Capital Construction During 2009, the Aviation Enterprise expended $358.3 million in its ongoing CCP compared to an expenditure budget of $474.2 million. The Aviation Enterprise capitalized $518.2 million in projects in 2009, principally the security mezzanine and International Arrivals Building expansion at Dulles International. Projects that are continuing that were completed in early 2010 include the AeroTrain system and the additional decks on the parking garages at Reagan National. Projects continuing in 2010 and beyond include the further expansion of the International Arrivals Building and in-line baggage systems at Dulles and runway safety areas at Reagan National. Average monthly capital construction spending in 2009 was approximately $29.6 million. Contacting the Airports Authority s Financial Management The financial report is designed to provide the Airports Authority s Board, management, investors, creditors and customers with a general view of the Airports Authority s finances and to demonstrate the Airports Authority s accountability for the funds it receives and expends. For additional information about this report, or for additional financial information, please contact Lynn Hampton, Vice President and Chief Financial Officer, at the following address: 1 Aviation Circle, Washington, DC, or BondholdersInformation@mwaa.com. 37
45 STATEMENTS OF NET ASSETS As of December 31, 2009 Total Aviation Dulles Corridor Business-Type Enterprise Enterprise Activities ASSETS Current assets Unrestricted assets: Cash and cash equivalents $ 47,928,844 $ 31,476,254 $ 79,405,098 Investments 266,348, ,348,779 Accounts receivable, net 35,140, ,643 35,254,120 Inventory 8,061,986 32,795 8,094,781 Prepaid expenses and other current assets 8,006,423 1,705,504 9,711,927 Total unrestricted assets 365,486,509 33,328, ,814,705 Restricted assets: Cash and cash equivalents 152,253, ,559, ,813,767 Passenger facility charges cash 54,564,484-54,564,484 Passenger facility charges receivable 6,422,745-6,422,745 Grants receivable 7,140,958 80,425,796 87,566,754 Prepaid expenses and other current assets - 17,952 17,952 Investments 3,185, ,080, ,266,160 Total restricted assets 223,567, ,084,268 1,014,651,862 Total current assets 589,054, ,412,464 1,413,466,567 Non-current assets Capital assets: Land and other non-depreciable assets 121,734, ,734,710 Construction in progress 1,630,063,189 2,216,052 1,632,279,241 Construction in progress, Metrorail project - 742,560, ,560,712 Buildings, systems and equipment 5,030,351, ,943 5,031,113,184 Less: accumulated depreciation (1,637,640,970) (177,366) (1,637,818,336) Capital assets, net 5,144,508, ,361,341 5,889,869,511 Long-term investments 65,005,339-65,005,339 Other long-term assets 16,553,865-16,553,865 Net pension asset and other post-employment benefits asset 3,528,691-3,528,691 Total non-current unrestricted assets 85,087,895-85,087,895 Restricted assets: Long-term investments 451,355,340 92,127, ,482,451 Bond issuance costs, net 67,299,782 39,264, ,563,906 Total non-current restricted assets 518,655, ,391, ,046,357 Total non-current assets 5,748,251, ,752,576 6,625,003,763 Total assets $ 6,337,305,290 $ 1,701,165,040 $ 8,038,470,330 The accompanying notes are an integral part of these financial statements. 38
46 STATEMENTS OF NET ASSETS (continued) As of December 31, 2009 LIABILITIES AND NET ASSETS Total Aviation Dulles Corridor Business-Type Enterprise Enterprise Activities Current liabilities Payable from unrestricted: Accounts payable and accrued expenses $ 71,688,570 $ 4,419,033 $ 76,107,603 Due to/due from other funds (6,293,407) 6,293,407 - Operating lease obligations 341, ,140 Total unrestricted 65,736,303 10,712,440 76,448,743 Payable from restricted assets: Accounts payable and accrued expenses 36,271,474 42,288,064 78,559,538 Accrued interest payable 57,660,321 14,536,406 72,196,727 Bonds payable 107,130, ,130,000 Total restricted 201,061,795 56,824, ,886,265 Total current liabilities 266,798,098 67,536, ,335,008 Non-current liabilities Payable from unrestricted: Other liabilities 1,160,156 5,698 1,165,854 Payable from restricted: Other liabilities 1,615,164 38,130 1,653,294 Commercial paper notes 215,000, ,000,000 Interest rate swaps payable 69,187,075-69,187,075 Bonds payable, net 4,783,879, ,114,880 5,750,994,191 Total restricted 5,069,681, ,153,010 6,036,834,560 NET ASSETS Total non-current liabilities 5,070,841, ,158,708 6,038,000,414 Total liabilities 5,337,639,804 1,034,695,618 6,372,335,422 Invested in capital assets, net of related debt 487,966, ,112, ,078,950 Restricted: Bond/debt funds 42,400,392 31,210,473 73,610,865 Passenger facility charges 75,768,210-75,768,210 Grants 9,852, ,536, ,388,881 Total restricted 128,020, ,747, ,767,956 Unrestricted 383,677,943 22,610, ,288,002 Total net assets 999,665, ,469,422 1,666,134,908 Total net assets and liabilities $ 6,337,305,290 $ 1,701,165,040 $ 8,038,470,330 The accompanying notes are an integral part of these financial statements. 39
47 STATEMENTS OF NET ASSETS (continued) As of December 31, 2008 Total Aviation Dulles Corridor Business-Type Enterprise Enterprise Activities ASSETS Current assets Unrestricted assets: Cash and cash equivalents $ 26,982,791 $ 11,011,856 $ 37,994,647 Investments 235,399, ,399,596 Accounts receivable, net 22,541, ,287 23,085,767 Inventory 6,796,319-6,796,319 Prepaid expenses and other current assets 7,812,490 3,821,244 11,633,734 Total unrestricted assets 299,532,676 15,377, ,910,063 Restricted assets: Cash and cash equivalents 170,767, ,300, ,067,201 Passenger facility charges cash 12,604,557-12,604,557 Passenger facility charges and interest receivable 5,581,130 1,710 5,582,840 Grants receivable 23,906,251 15,690,443 39,596,694 Prepaid expenses and other current assets - 848, ,277 Investments 3,902,129-3,902,129 Total restricted assets 216,761, ,840, ,601,698 Total current assets 516,293, ,217, ,511,761 Non-current assets Capital assets: Land and other non-depreciable assets 121,734, ,734,710 Construction in progress 1,776,370,046-1,776,370,046 Construction in progress, Metrorail project - 362,322, ,322,546 Buildings, systems and equipment 4,508,943, ,963 4,509,110,199 Less: accumulated depreciation (1,461,796,180) (82,953) (1,461,879,133) Capital assets, net 4,945,251, ,406,556 5,307,658,368 Long-term investments 71,747,636-71,747,636 Other long-term assets 18,192,128-18,192,128 Net pension asset and other post-employment benefits asset 4,755,914-4,755,914 Total non-current unrestricted assets 94,695,678-94,695,678 Restricted assets: Long-term investments 400,987, ,987,362 Bond issuance costs, net 60,712,709 25,081 60,737,790 Total non-current restricted assets 461,700,071 25, ,725,152 Total non-current assets 5,501,647, ,431,637 5,864,079,198 Total assets $ 6,017,941,361 $ 508,649,598 $ 6,526,590,959 The accompanying notes are an integral part of these financial statements. 40
48 STATEMENTS OF NET ASSETS As of December 31, 2008 LIABILITIES AND NET ASSETS Total Aviation Dulles Corridor Business-Type Enterprise Enterprise Activities Current liabilities Payable from unrestricted: Accounts payable and accrued expenses $ 53,560,971 $ 1,863,476 $ 55,424,447 Due to/due from other funds (7,413,995) 7,413,995 - Operating lease obligations 341, ,140 Total unrestricted 46,488,116 9,277,471 55,765,587 Payable from restricted assets: Accounts payable and accrued expenses 65,398,716 39,550, ,949,206 Accrued interest payable 54,013, ,886 54,400,528 Bonds payable 90,475,000-90,475,000 Bond anticipation notes - 150,000, ,000,000 Total restricted 209,887, ,937, ,824,734 Total current liabilities 256,375, ,214, ,590,321 Non-current liabilities Payable from restricted: Other liabilities 3,106,529-3,106,529 Passenger facility charge bank participation notes 432,000, ,000,000 Commercial paper notes 217,500, ,500,000 Interest rate swaps payable 208,671, ,671,941 Bonds payable, net 4,037,490,779-4,037,490,779 Total restricted 4,898,769,249-4,898,769,249 NET ASSETS Total non-current liabilities 4,898,769,249-4,898,769,249 Total liabilities 5,155,144, ,214,847 5,354,359,570 Invested in capital assets, net of related debt 420,814, ,537, ,351,703 Restricted: Bond/debt funds 42,731,922-42,731,922 Passenger facility charges 19,506,449-19,506,449 Grants 32,003,866 37,042,984 69,046,850 Total restricted 94,242,237 37,042, ,285,221 Unrestricted 347,740,238 (5,145,773) 342,594,465 Total net assets 862,796, ,434,751 1,172,231,389 Total net assets and liabilities $ 6,017,941,361 $ 508,649,598 $ 6,526,590,959 The accompanying notes are an integral part of these financial statements. 41
49 STATEMENTS OF REVENUES, EXPENSES AND CHANGES IN NET ASSETS For the year ended December 31, 2009 Total Aviation Dulles Corridor Business-Type Enterprise Enterprise Activities OPERATING REVENUES Concessions $ 217,413,676 $ - $ 217,413,676 Tolls and other - 64,893,554 64,893,554 Rents 193,736, ,736,080 Landing fees 96,934,558-96,934,558 Utility sales 13,227,161-13,227,161 Passenger fees 30,665,358-30,665,358 Other 6,476,626-6,476,626 Total operating revenues 558,453,459 64,893, ,347,013 OPERATING EXPENSES Materials, equipment, supplies, contract services, and other 147,883,400 24,836, ,720,347 Salaries and related benefits 140,138,903 4,071, ,210,330 Utilities 28,141,680 67,989 28,209,669 Lease from U. S. Government 5,066,069-5,066,069 Depreciation and amortization 181,234,375 1,118, ,352,857 Total operating expenses 502,464,427 30,094, ,559,272 OPERATING INCOME 55,989,032 34,798,709 90,787,741 NON-OPERATING REVENUES (EXPENSES) Passenger facility charges, financing costs (944,806) - (944,806) Investment income 14,725, ,349 15,147,604 Interest expense (144,510,068) - (144,510,068) Fair value gains on swaps 104,466, ,466,866 Total non-operating revenues (expenses) (26,262,753) 422,349 (25,840,404) GAIN BEFORE CAPITAL CONTRIBUTIONS (DISTRIBUTIONS) 29,726,279 35,221,058 64,947,337 CAPITAL CONTRIBUTIONS (DISTRIBUTIONS) Passenger facility charges 78,520,764-78,520,764 Federal, state and local grants 25,643, ,463, ,107,673 Other capital property contributed (distributed) 2,977,990 (650,245) 2,327,745 Total capital contributions 107,142, ,813, ,956,182 NET ASSETS Increase in net assets 136,868, ,034, ,903,519 Total net assets, beginning of year 862,796, ,434,751 1,172,231,389 Total net assets, end of year $ 999,665,486 $ 666,469,422 $ 1,666,134,908 The accompanying notes are an integral part of these financial statements. 42
50 STATEMENTS OF REVENUES, EXPENSES AND CHANGES IN NET ASSETS For the year ended December 31, 2008 Total Aviation Dulles Corridor Business-Type Enterprise Enterprise Activities OPERATING REVENUES Concessions $ 223,710,732 $ - $ 223,710,732 Tolls and other - 10,416,498 10,416,498 Rents 171,331, ,331,285 Design fees 20,363,189-20,363,189 Landing fees 82,289,545-82,289,545 Utility sales 13,348,545-13,348,545 Passenger fees 28,354,142-28,354,142 Other 11,547,405-11,547,405 Total operating revenues 550,944,843 10,416, ,361,341 OPERATING EXPENSES Materials, equipment, supplies, contract services, and other 162,254,215 10,028, ,282,360 Impairment loss/design costs 66,170,165-66,170,165 Salaries and related benefits 136,508, , ,720,660 Utilities 25,402,257-25,402,257 Lease from U. S. Government 4,958,280-4,958,280 Depreciation and amortization 160,256,762 8, ,264,966 Total operating expenses 555,549,712 10,248, ,798,688 OPERATING INCOME (LOSS) (4,604,869) 167,522 (4,437,347) NON-OPERATING REVENUES (EXPENSES) Passenger facility charges, financing costs (2,330,507) - (2,330,507) Investment income 37,965,692 26,126 37,991,818 Interest expense (122,984,332) - (122,984,332) Fair value losses on swaps (178,810,699) - (178,810,699) Total non-operating revenues (expenses) (266,159,846) 26,126 (266,133,720) GAIN (LOSS) BEFORE CAPITAL CONTRIBUTIONS (270,764,715) 193,648 (270,571,067) CAPITAL CONTRIBUTIONS Passenger facility charges 78,455,218-78,455,218 Federal, state and local grants 52,137,311 37,168,479 89,305,790 Other capital property contributed - 272,072, ,072,624 Total capital contributions 130,592, ,241, ,833,632 NET ASSETS Increase (decrease) in net assets (140,172,186) 309,434, ,262,565 Total net assets, beginning of year 1,002,968,824-1,002,968,824 Total net assets, end of year $ 862,796,638 $ 309,434,751 $ 1,172,231,389 The accompanying notes are an integral part of these financial statements. 43
51 STATEMENTS OF CASH FLOWS (continued) For the year ended December 31, 2009 Total Aviation Dulles Corridor Business-Type Enterprise Enterprise Activities NET CASH FROM OPERATING ACTIVITIES: Operating cash receipts from customers $ 547,210,889 $ 65,324,198 $ 612,535,087 Cash receipts (payments) for interfund services 6,856,153 (6,856,153) - Cash payments to suppliers for goods and services (167,383,896) (17,303,198) (184,687,094) Cash payments to employees for services (140,763,814) (465,007) (141,228,821) NET CASH PROVIDED BY OPERATING ACTIVITIES 245,919,332 40,699, ,619,172 NET CASH FROM NONCAPITAL FINANCING ACTIVITIES Cash provided to state agency - (650,244) (650,244) Government grants 633, ,239 NET CASH PROVIDED (USED) BY NONCAPITAL FINANCING ACTIVITIES 633,239 (650,244) (17,005) NET CASH FROM CAPITAL AND RELATED FINANCING ACTIVITIES: Proceeds from issuance of bonds/notes 855,598, ,045,533 1,813,644,231 Principal payments on commercial paper (2,500,000) - (2,500,000) Principal payments on bonds/notes (90,475,000) (150,000,000) (240,475,000) Payments for capital expenditures and construction in progress (327,812,062) (357,234,847) (685,046,909) Swap payments (35,018,000) - (35,018,000) Proceeds from sale of capital assets 300, ,847 Payments of bond issuance costs (10,584,814) (40,305,634) (50,890,448) Interest paid on bonds and commercial paper (218,365,978) (1,164,975) (219,530,953) Government grants in aid of construction 41,775, ,728, ,504,373 Passenger facility charge receipts 77,679,700-77,679,700 Passenger facility charge principal, expenses and interest (435,621,007) - (435,621,007) NET CASH PROVIDED(USED) BY CAPITAL AND RELATED FINANCING ACTIVITIES (145,021,748) 667,068, ,046,834 NET CASH FROM INVESTING ACTIVITIES: Interest received on investments 4,782,101 1,449,868 6,231,969 Decrease in short term investments, net (17,149,560) (342,035,595) (359,185,155) Proceeds from long-term investment maturities 203,152,774 89,582, ,735,118 Purchase of long-term investments (247,923,358) (181,390,631) (429,313,989) NET CASH USED BY INVESTING ACTIVITIES (57,138,043) (432,394,014) (489,532,057) NET INCREASE IN CASH AND CASH EQUIVALENTS 44,392, ,724, ,116,944 CASH AND CASH EQUIVALENTS, Beginning of year 210,354, ,312, ,666,405 CASH AND CASH EQUIVALENTS, End of year $ 254,747,185 $ 400,036,164 $ 654,783,349 The accompanying notes are an integral part of these financial statements. 44
52 STATEMENTS OF CASH FLOWS For the year ended December 31, 2009 Total Aviation Dulles Corridor Business-Type Enterprise Enterprise Activities RECONCILIATION OF OPERATING INCOME TO NET CASH PROVIDED BY OPERATING ACTIVITIES: Operating income $ 55,989,032 $ 34,798,709 $ 90,787,741 Adjustments to reconcile operating income to net cash provided by operating activities: Depreciation and amortization 181,234,375 1,118, ,352,857 Decrease in allowance for doubtful accounts (141,251) - (141,251) Loss on disposal of assets (237,476) - (237,476) Decrease (increase) in accounts receivable (13,442,588) 430,644 (13,011,944) Increase in inventory (1,265,668) (32,795) (1,298,463) Decrease (increase) in prepaid expenses and other current assets (193,932) 2,946,066 2,752,134 Decrease in other long-term assets 2,865,487-2,865,487 Increase in long-term liabilities 1,160,156 43,828 1,203,984 Increase in accounts payable and accrued expenses 18,830,608 2,515,495 21,346,103 Increase (decrease) in due to/due from other funds 1,120,589 (1,120,589) - NET CASH PROVIDED BY OPERATING ACTIVITIES $ 245,919,332 $ 40,699,840 $ 286,619,172 NONCASH INVESTING, CAPITAL AND FINANCING ACTIVITIES: Unrealized gain (loss) on investments $ (1,144,903) $ 318,824 $ (826,079) Other capital property acquired (distributed) Non-cash working capital transferred from (to) state agency $ - $ (650,245) $ (650,245) Buildings and improvements received from tenants 2,977,990-2,977,990 Capital construction costs payable $ 31,758,647 $ 41,746,431 $ 73,505,078 Fair value gain on swaps $ 139,484,866 $ - $ 139,484,866 The accompanying notes are an integral part of these financial statements. 45
53 STATEMENTS OF CASH FLOWS (continued) For the year ended December 31, 2008 Total Aviation Dulles Corridor Business-Type Enterprise Enterprise Activities NET CASH FROM OPERATING ACTIVITIES: Operating cash receipts from customers $ 550,034,022 $ 10,419,384 $ 560,453,406 Cash payments to suppliers for goods and services (217,889,584) (2,127,013) (220,016,597) Cash payments to employees for services (137,957,996) (76,744) (138,034,740) NET CASH PROVIDED BY OPERATING ACTIVITIES 194,186,442 8,215, ,402,069 NET CASH FROM NONCAPITAL FINANCING ACTIVITIES Cash received from state agency - 13,740,869 13,740,869 Government grants 1,367,548-1,367,548 NET CASH PROVIDED BY NONCAPITAL FINANCING ACTIVITIES 1,367,548 13,740,869 15,108,417 NET CASH FROM CAPITAL AND RELATED FINANCING ACTIVITIES: Proceeds from issuance of bonds/notes 253,074, ,000, ,074,886 Principal payments on commercial paper (42,500,000) - (42,500,000) Principal payments on bonds (86,570,000) - (86,570,000) Payments for capital expenditures and construction in progress (512,917,416) (68,116,851) (581,034,267) Proceeds from sale of capital assets 337, ,261 Payments of bond issuance costs (3,757,913) (30,097) (3,788,010) Interest paid on bonds and commercial paper (222,556,489) - (222,556,489) Government grants in aid of construction 27,959,748 21,478,036 49,437,784 Passenger facility charge receipts 81,132,857-81,132,857 Passenger facility charge expenses and interest (13,658,490) - (13,658,490) NET CASH PROVIDED(USED) BY CAPITAL AND RELATED FINANCING ACTIVITIES (519,455,556) 103,331,088 (416,124,468) NET CASH FROM INVESTING ACTIVITIES: Interest received on investments 38,205,965 24,416 38,230,381 Decrease in short term investments, net 320,875, ,875,762 Proceeds from long-term investment maturities 493,505, ,505,823 Purchase of long-term investments (543,259,263) - (543,259,263) NET CASH PROVIDED BY INVESTING ACTIVITIES 309,328,287 24, ,352,703 NET (DECREASE) INCREASE IN CASH AND CASH EQUIVALENTS (14,573,279) 125,312, ,738,721 CASH AND CASH EQUIVALENTS, Beginning of year 224,927, ,927,684 CASH AND CASH EQUIVALENTS, End of year $ 210,354,405 $ 125,312,000 $ 335,666,405 The accompanying notes are an integral part of these financial statements. 46
54 STATEMENTS OF CASH FLOWS For the year ended December 31, 2008 Total Aviation Dulles Corridor Business-Type Enterprise Enterprise Activities RECONCILIATION OF OPERATING INCOME TO NET CASH PROVIDED BY OPERATING ACTIVITIES: Operating income (loss) $ (4,604,869) $ 167,522 $ (4,437,347) Adjustments to reconcile operating income to net cash provided by operating activities: Impairment loss, design costs 66,170,165-66,170,165 Depreciation and amortization 160,256,762 8, ,264,966 Decrease in allowance for doubtful accounts (40,829) - (40,829) Loss on disposal of assets 2,981,105-2,981,105 Decrease (increase) in accounts receivable 18,011,863 (538,554) 17,473,309 Increase in inventory (1,762,622) - (1,762,622) Increase in prepaid expenses and other current assets (1,002,308) (1,375,013) (2,377,321) Increase in other long-term assets (104,860) - (104,860) Decrease in long-term liabilities (20,363,189) - (20,363,189) Increase (decrease) in accounts payable and accrued - expenses (17,940,781) 2,539,473 (15,401,308) Increase (decrease) in due to/due from other funds (7,413,995) 7,413,995 - NET CASH PROVIDED BY OPERATING ACTIVITIES $ 194,186,442 $ 8,215,627 $ 202,402,069 NONCASH INVESTING, CAPITAL AND FINANCING ACTIVITIES: Unrealized gain on investments $ 14,213,721 $ - $ 14,213,721 Other capital property acquired Construction in progress and non-cash working capital transferred from state agency $ - $ 258,201,628 $ 258,201,628 Capital construction costs payable $ 65,398,716 $ 38,968,796 $ 104,367,512 Fair value losses on swaps $ (158,374,462) $ - $ (158,374,462) The accompanying notes are an integral part of these financial statements. 47
55 INTENTIONALLY LEFT BLANK
56 NOTES TO FINANCIAL STATEMENTS A. SUMMARY OF SIGNIFICANT ACCOUNTING POLICIES Reporting Entity The (the Airports Authority) is an independent interstate agency created by the Commonwealth of Virginia (the Commonwealth) and the District of Columbia with the consent of the United States Congress. The Commonwealth and the District of Columbia enacted essentially identical legislation creating the Airports Authority for the purpose of operating Ronald Reagan Washington National Airport (Reagan National) and Washington Dulles International Airport (Dulles International), collectively, the Airports. The Airports Authority is governed by a Board of Directors (the Board) with members from the Commonwealth, the District of Columbia, the State of Maryland, and three members appointed by the President of the United States. On June 7, 1987, Reagan National s and Dulles International s properties were transferred to the Airports Authority under a long-term lease authorized by the Metropolitan Washington Airports Act of 1986, Title VI of Public Law All personal property was transferred to the Airports Authority without condition. Prior to the transfer, the Airports were operated by the Federal Aviation Administration (FAA) of the United States Department of Transportation. On November 1, 2008, the Virginia Department of Transportation (VDOT) transferred responsibility for the operation and maintenance of the Dulles Toll Road (DTR) to the Airports Authority for an initial term of 50 years. In connection with the transfer, the Airports Authority will construct the Dulles Corridor Metrorail Project (Dulles Metrorail Project) and will make other improvements in the Dulles Corridor consistent with VDOT and regional plans. These two functions operate as a single Business- Type Activity and are reported in the Dulles Corridor Enterprise (DCE) Fund (see Notes B and G). Only the accounts of the Airports Authority are included in the reporting entity. There are no U.S. or state government agency finances that should be considered for inclusion in the Airports Authority s financial reporting entity. Basis of Accounting The accompanying financial statements have been prepared on the accrual basis. The Airports Authority reports as two Business-Type Activities, as defined by the Governmental Accounting Standards Board (GASB). Business-Type Activities are those that are financed in whole or in part by fees charged to external parties for goods or services. The Airports Authority s activities are accounted for similar to those often found in the private sector using the flow of an economic resources measurement focus and the accrual basis of accounting. All assets, liabilities, net assets, revenues, and expenses are accounted for through two enterprise funds with revenues recorded when earned and expenses recorded at the time liabilities are incurred. Current assets include cash and amounts convertible to cash during the next normal operating cycle, or one year. Current liabilities include those obligations to be liquidated with current assets. 49
57 Revenues from airlines, concessions, rental cars, parking and toll collections are reported as operating revenues. Capital, grants, financing or investing related transactions are reported as non-operating revenues. All expenses related to operating the Airports Authority are reported as operating expenses. Interest expense and financing costs are reported as non-operating expenses. Net Assets Net assets represent the residual interest in the Aviation Enterprise Fund and the DCE Fund assets after the liabilities are deducted and they consist of three sections: Invested in capital assets, net of related debt; restricted; and unrestricted. Net assets invested in capital assets, net of related debt includes capital assets, restricted and unrestricted, net of accumulated depreciation, reduced by outstanding debt attributable to acquisition. Net assets are reported as restricted when constraints are imposed by third parties or enabling legislation. The Airports Authority s restricted assets are expendable. All other net assets are unrestricted. Proprietary Accounting and Financial Reporting In accordance with GASB Statement No. 20, Accounting and Financial Reporting for Proprietary Funds and Other Governmental Entities That Use Proprietary Fund Accounting (GASB 20), the Airports Authority follows all GASB pronouncements issued on, before, or after November 30, 1989, as well as all Financial Accounting Standards Board (FASB) Statements and Interpretations, Accounting Principal Board Opinions and Accounting Research Bulletins issued on, before, or after November 30, 1989, unless they contradict GASB guidance. Budgeting Requirements The Airports Authority s annual budgeting process is a financial planning tool used to establish the estimated revenues and expenditures for both Airports and the DTR. The Airports Authority s annual budget is not prepared in accordance with generally accepted accounting principles. In keeping with the requirements of a proprietary fund, budget comparisons have not been included in the financial section of this report. Revenue Recognition Aviation Enterprise Fund Rentals, passenger fees and concession fees are generated from airlines, Transportation Security Administration (TSA), parking structures and lots, food, rental cars, fixed base operators, and other commercial tenants. Leases with the Airlines are based on full cost recovery plus debt service coverage, through rates and charges as described in Note L. Other leases are for terms from one to 15 years and generally require rentals based on the volume of business, with specified minimum rentals. Rental revenue is recognized over the life of the respective leases, and concession revenue is recognized partially based on reported concession revenue and partially based on minimum rental guarantee. Rental revenue and concession revenue are recognized as operating revenues on the Statements of Revenues, Expenses and Changes in Net Assets. 50
58 Landing fees are principally generated from scheduled airlines and non-scheduled commercial airlines and are based on the landed weight of aircraft. The scheduled airline fee structure is determined annually based on full cost recovery of airside related charges pursuant to an agreement between the Airports Authority and the Signatory Airlines. Landing fees are recognized as part of operating revenues when airline related facilities are utilized. Several airlines represent concentrations of revenues for the Airports Authority. At Reagan National, US Airways, Delta Air Lines (Delta), and American Airlines (American) comprise approximately 70.0% of airline revenues during At Dulles International, United Airlines (United), Delta and American comprise approximately 63.3% of airline revenues during These Airlines combined represent approximately 70.3% of the total airline revenues, during 2009, for the Airports Authority. Actual airline revenues for 2009 represent approximately 50.0% of the Aviation Enterprise s total operating revenues. Dulles Corridor Enterprise Fund Tolls and other revenues represent tolls collected from vehicles on the DTR. The DTR has 10 exit and entrance ramps with tolls during 2009 and 2008 of 75 at the main toll plaza west of the Beltway and 50 at other exit and entrance locations for two-axle vehicles. Tolls and other revenue include Automated Vehicle Identification (AVI) or electronic toll collections, cash collections and violations revenues. Tolls and other revenue are recognized in the period in which the toll road transaction occurred. Cash and Cash Equivalents For purposes of reporting cash flows, cash and cash equivalents include cash on hand, demand deposits, certificates of deposit, commercial paper (CP), United States Government and agency obligations, mutual funds, and repurchase agreements collateralized by United States Government or agency obligations with an original maturity of three months or less, including restricted assets. Investments Investments with an original maturity greater than one year are recorded at their fair value with all investment income, including changes in the fair value of investments, reported as investment income in the financial statements. Investments with an original maturity of less than one year are carried at amortized cost. Fair value equals quoted market prices, if available. If a quoted market value is not available, fair value is estimated based upon quoted market prices for securities with similar characteristics. Investments consist of certificates of deposit, commercial paper, United States Government and agency obligations, interest rate swaps, and repurchase agreements collateralized by United States Government or agency obligations, with an original maturity greater than three months. 51
59 Swaps The Airports Authority enters into interest rate swap agreements to modify interest rates on outstanding debt. In 2008, the Airports Authority implemented GASB Statement No. 53, Accounting and Financial Reporting for Derivative Instruments (GASB 53). The Airports Authority reports the changes in fair value of derivative instruments that are used for investment purposes or that are reported as investment derivative instruments because of ineffectiveness within the investment revenue classification. Inventory and Prepaid Items Inventory consists of spare parts and some bulk items, such as sand and salt stored at the Airports and is stated at the lower of cost or market value, using the first-in, first-out method. Inventories are recorded as expenditures when consumed rather than when purchased. Certain payments to vendors reflect costs applicable to future accounting periods and are recorded as prepaid items in the financial statements. Capital Assets Personal property, the ownership of which was transferred from the United States Government to the Airports Authority on June 7, 1987 and the ownership of which transferred from VDOT to the Airports Authority on November 1, 2008, is recorded at fair value at the date of transfer. Assets acquired subsequent to the transfer are stated at historical cost and include the expenditure of federal grants to construct and improve the facilities of the Airports Authority. The costs for property and facilities include net interest expense incurred from the date of issuance of the debt to finance construction until the completion of the capital project (see Note G). Tenants have funded construction and improvements of airport facilities from their own working capital. Under agreements with the Airports Authority, the property reverts to the Airports Authority upon termination or expiration of the Airport Use Agreement and Premises Lease (the Agreement). Terms range from 15 to 40 years. These assets obtained by the Airports Authority are recorded at fair market value as of the date of transfer. Major improvements and replacements of property are capitalized. Maintenance, repairs, and minor improvements and replacements are expensed as incurred. Provision for depreciation has been calculated using the straight-line method over the estimated useful lives of the assets. The estimated useful lives and corresponding capitalization thresholds are as follows: Threshold Equipment 5-7 years $ 10,000 Motor vehicles 3-5 years $ 10,000 Buildings years $ 25,000 Systems and structures years $ 25,000 52
60 Impaired Capital Assets In accordance with GASB Statement No. 42, Accounting and Financial Reporting for Impairment of Capital Assets and for Insurance Recoveries (GASB 42), capital assets that have potential for meeting the definition of impairment are identified and tested for impairment. Permanently impaired capital assets that will continue to be used by the Airports Authority are written down to the measured impaired value. The carrying amount of impaired capital assets that are idle are disclosed in the notes to the financial statements and impaired capital assets that are no longer used by the Airports Authority are reported at the lower of carrying value or fair value. Intangible Assets In accordance with GASB Statement No. 51, Accounting and Financial Reporting for Intangible Assets (GASB 51), intangible assets are recognized as capital assets in the Statements of Net Assets if they are identifiable. The amortization of capital assets is determined by legal or contractual provisions. If there are no factors that limit the useful life of an intangible asset, these assets may be considered to have indefinite lives and no amortization of the costs occurs. Intangible assets with indefinite lives are presented in the Statements of Net Assets as a component of Land and non-depreciable assets. The Airports Authority is in the practice of amortizing the cost of internally developed software and other assets, as required in GASB 51, and identifying certain assets, such as easements, as having indefinite lives. Pollution Remediation and Control Obligations In 2008, the Airports Authority implemented GASB Statement No. 49, Accounting and Financial Reporting for Pollution Remediation Obligations (GASB 49). In compliance with GASB 49, the Airports Authority capitalizes pollution remediation outlays only if the outlays are incurred to prepare property for sale in anticipation of a sale, prepare property for use when the property was acquired with known or suspected pollution that was expected to be remediated, to perform pollution remediation that restores a pollution-caused decline in service utility that was recognized as an asset impairment, or to acquire property, plant and equipment that have a future alternative use other than remediation efforts. Pollution remediation obligations that do not qualify for capitalization are accrued as liabilities and expensed when a range of expected outlays is reasonably estimable or upon receipt of goods and services (see Note G). Bond Issuance Costs Bond issuance costs represent expenses incurred in the process of issuing bonds and are amortized over the life of the related bond issue, using the interest method. Long-Term Debt Refundings The Airports Authority periodically refunds its debt. The difference between the reacquisition price and the net carrying amount of the old debt is deferred and amortized as a component of interest expense 53
61 over the life of the old or new debt, whichever is shorter. The amount deferred is reported as a deduction from the new debt liability. Compensated Absences The Airports Authority employees are granted paid vacation at rates of 13 to 30 days per year, depending on their length of employment. General employees may accumulate up to a maximum of 30 days or 240 hours. Firefighters who work a 56-hour week may accumulate up to a maximum of 336 hours. Employees exceeding a specified pay scale, executive type employees, are entitled to accumulate up to 480 hours or 60 days. Upon termination, employees are paid for any unused accumulated vacation. The accumulated vacation is recorded as a liability when earned and is reflected in accrued expenses. The calculation of the liability is based on the pay or salary rates in effect as of the end of the fiscal period, normally the year ended December 31. An additional amount has been accrued for the liability of salary related payments. Such salary related payments include the employer s share of Social Security, Medicare and unemployment taxes and the employer s contributions to the Airports Authority retirement and pension plans. Balance as of December 31, 2008 Vacation used during the year Vacation earned during the year Balance as of December 31, 2009 $ $ 7,002,052 (7,108,459) 7,661,536 7,555,129 Current liability Non-current liability $ $ 6,351,144 1,203,985 7,555,129 The Airports Authority employees earn 13 days of sick leave per year. Unused sick leave for employees enrolled in the Airports Authority s retirement plan is counted at retirement as additional time worked for calculation of the pension benefit. There is no liability of unpaid accumulated sick leave, since the Airports Authority does not have a policy to pay any amounts when employees separate from service. Capital Contributions - Passenger Facility Charges (PFCs) In 1990, Congress approved the Aviation Safety and Capacity Expansion Act which authorized domestic airports to impose a Passenger Facility Charge (PFC) on enplaning passengers. In May 1991, the FAA issued the regulations for the use and reporting of PFCs. PFCs may be used for airport projects that meet at least one of the following criteria: preserve or enhance safety, security, or capacity of the national air transportation system; reduce noise or mitigate noise impacts resulting from an airport; or furnish opportunities for enhanced competition between or among carriers. The Airports Authority was granted permission to begin collecting a $3.00 PFC effective November 1, 1993, at Reagan National and January 1, 1994, at Dulles International. The Airports Authority applied for and received approval in February 2001 to increase the PFC collection from $3.00 to $4.50, effective May 1, The charges, less an administrative fee charged by the Airlines for processing, are collected by the Airlines and remitted on a monthly basis to the Airports Authority. The Airports 54
62 Authority accounts for the net charges on an accrual basis, based on the month the charges were collected by the Airlines. Due to their restricted use, PFCs are categorized as non-operating revenues. Capital Contributions Federal, State and Local Grants The Airports Authority receives federal, state and local grants in support of its Capital Construction Program (CCP) and in support of the Dulles Metrorail Project. Grants are recognized as related expenditures are made and all eligibility requirements are met. Grants for capital asset acquisition, facility development, rehabilitation of facilities and long-term planning are reported as capital contributions in the Statements of Revenues, Expenses and Changes in Net Assets, after non-operating revenues and expenses. Management Estimates The preparation of financial statements in conformity with accounting principles generally accepted in the United States of America requires management, where necessary, to make estimates and assumptions that affect the reported amounts of assets and liabilities and disclosure of contingent assets and liabilities at the date of the financial statements, and the reported amounts of revenues and expenses during the reporting period. Actual results could differ from those estimates. Reclassifications Certain amounts in the 2008 financial statements have been reclassified to conform to the current year s presentation. The value of the interest rate swaps has been reclassified from non-current assets, longterm investments, restricted to non-current liabilities, interest rate swap payable. B. TRANSFER OF THE DULLES TOLL ROAD AND CONSTRUCTION OF THE DULLES METRORAIL PROJECT On December 20, 2005, the Airports Authority proposed to the Commonwealth that the Airports Authority (i) assume the responsibility for operating the DTR and constructing the Dulles Metrorail Project and (ii) use revenues from the DTR to fund construction of the Dulles Metrorail Project with an eastern terminus near the West Falls Church Metrorail station on I-66 and a western terminus of Virginia Route 772 in Loudoun County (approximately 1.5 miles northwest of Dulles International) (the Dulles Corridor) and other transportation improvements within the area in Northern Virginia. By Memorandum of Understanding (the MOU) entered into as of March 24, 2006), the Commonwealth generally accepted the Airports Authority s proposal. In accordance with the MOU, the Airports Authority and VDOT entered into the Master Transfer Agreement relating to the DTR and the Dulles Metrorail Project, dated December 29, 2006 (the Transfer Agreement), and the Permit and Operating Agreement, dated December 29, 2006, as amended). On November 1, 2008, VDOT (i) granted to the Airports Authority a permit to operate the Dulles Toll Road, to set and collect Tolls, and to receive and use the Toll Road Revenues, and (ii) assigned to the Airports Authority, for the 50-year term of the Permit and Operating Agreement, substantially all of the right and interest of VDOT in and to the Dulles Toll Road. Concurrent with this transfer of rights and 55
63 responsibility, VDOT contributed to the Airports Authority approximately $272.1 million of capital property, including $254.8 million of construction in progress, for the Dulles Metrorail Project. The Airports Authority accounted for the transfer in accordance with GASB Statement No. 33, Accounting and Financial Reporting for Nonexchange Transaction. The Airports Authority established a DCE Fund to account for the activity of the DTR and the Dulles Metrorail Project separately from the aviation activity of the Airports, which is accounted for within the Aviation Enterprise Fund. Under the Permit and Operating Agreement, the Airports Authority is obligated to use its best efforts to finance and complete the Dulles Metrorail Project within certain time parameters. In addition, the Airports Authority is authorized to finance and construct other transportation improvements within the Dulles Corridor, including construction, modification, replacement and reconstruction of the DTR and other roadways within the Dulles Corridor (excluding the Dulles International Airport Access Highway). The Airports Authority is responsible for setting toll rates and collecting tolls following its process for issuing regulations and in consultation with the Dulles Corridor Advisory Committee. Effective upon transfer, the Airports Authority adopted the existing toll structure established by the Commonwealth and contracted with VDOT for the interim operation of the DTR. In 2009, the Airports Authority amended its regulation that sets toll rates for the DTR. The amendment provides for annual toll rate increases effective January 1 in the years 2010, 2011 and Effective October 1, 2009, the Airports Authority assumed full responsibility for operations of the DTR and discontinued the services of VDOT as a contracted operator. Pursuant to the Agreement, the Airports Authority is limited to $10.0 million of airport revenue that can be used for construction of the Dulles Metrorail Project at Dulles International. Further, the Agreement prohibits the payment of Metrorail operating and maintenance costs from funds other than the capital fund without written agreement from a majority-in-interest (MII) of the Signatory Airlines at Dulles International. The Airports Authority also has no claim on the DTR revenues to support the activities of the Airports. To this end, the Airports Authority amended the Airport System Revenue Bonds Master Trust Indenture (the Indenture) to treat DTR revenues as Released Revenues under the Indenture, thereby excluding the DTR revenues from the revenues and the pledge and lien on the Net Revenues securing these bonds. The Airports Authority also amended the Agreement with each of the Airlines serving the Airports to exclude the DTR revenues from the definition of Revenues under the Agreement. C. DEPOSITS AND INVESTMENTS Deposits The Airports Authority s investment policy, as approved by the Board, requires that deposits in excess of the federally insured amount be held at institutions with a Liquidity, Asset Quality, Capital and Earnings (LACE) Financial Institutions Rating Service of B or above. In the event a financial institution s rating falls below this level, the deposits are reduced to the federally insured amount. The Airports Authority s practice is to sweep all demand deposits at the close of each business day into overnight repurchase agreements. 56
64 As of December 31, 2009 and 2008, the Airports Authority had various certificates of deposit in the amount of $5.5 million and $5.3 million, respectively, that were not covered by insurance and were not collateralized with securities held by the pledging financial institutions. These certificates of deposit are held at institutions with a LACE Financial Institutions Rating Service of B or above. These certificates of deposit are part of the Airports Authority s Link Deposit Program whereby a portion of the reserve funds are deposited with banks that have an outstanding Community Reinvestment Act rating. The Airports Authority maintains multiple imprest cash funds in certain departments at each Airport. These amounts are not covered by insurance and are not collateralized. These funds totaled $208 thousand and $234 thousand as of December 31, 2009 and 2008, respectively. Investments The Airports Authority had the following investments in its portfolio as of December 31, 2009: Weighted Average Credit Carrying Maturity % of 2009 Investments Rating 1 Value (years) Portfolio Treasury - $ 417,101, % Fannie Mae Aaa/AAA 187,423, % Freddie Mac Aaa/AAA 137,130, % Farmer Mac Aaa 39,913, % Federal Home Loan Bank Aaa 139,391, % MBIA Guaranteed Invest Contract 2 Ba3/BB- 36,274, % FSA Guaranteed Invest Contract 2 A+ 67,075, % Bank of America-Forward Purchase Agreement A/A2 7,716, % Overnight Repurchase Agreements 3 A-1/P-1 263,322, % Debt Service Reserve Repurchase Agreements: Bank of America Repo A/A2 16,333, % Morgan Stanley Repo A/A2 72,406, % $ 1,384,089, % 1 The ratings in this table are from Fitch, Moody s or S&P. 2 Underlying rating of the counterparties. 3 Collateralized by Federal Agency Notes 57
65 The Airports Authority had the following investments in its portfolio as of December 31, 2008: Weighted Average Credit Carrying Maturity % of 2008 Investments Rating 1 Value (years) Portfolio Treasury - $ 53,432, % Fannie Mae Aaa/AAA 103,728, % Freddie Mac Aaa/AAA 54,594, % Farmer Mac Aaa/AAA 34,645, % Farm Credit Aaa 10,000, % Federal Home Loan Bank Aaa 149,238, % Commercial Paper A-1/P-1 17,500, % MBIA Guaranteed Invest Contract 2 A-/Ba1 36,274, % FSA Guaranteed Invest Contract 2 A+/A3 67,075, % Bank of America-Forward Purchase Agreement A+/A1 7,716, % Overnight Repurchase Agreements 3 A-1/P-1 129,499, % Debt Service Reserve Repurchase Agreements: Bank of America Repo A+/A1 16,333, % Morgan Stanley Repo A/A2 72,406, % $ 752,445, % 1 The ratings in this table are from Fitch, Moody s or S&P. 2 Underlying rating of the counterparties. 3 Collateralized by Federal Agency Notes Credit Risk Credit Risk is the risk that the Airports Authority will lose money because of the default of the security of the issuer or investment counterparty. The primary objectives of the Airports Authority s investment policy are the safety of capital, the liquidity of the portfolio and the yield of investments. Bond proceeds (see Note F) may be invested in securities as permitted in the bond indentures, otherwise, assets of the Airports Authority may be invested in United States Treasury securities; short-term obligations of the United States Government agencies; short-term obligations of the Commonwealth, the State of Maryland, and the District of Columbia; certificates of deposit with banks that have a LACE rating of B or better, or that are fully insured or collateralized; prime CP rated A1 and P1 by Standard & Poor s Rating Services (S&P) and Moody s Investors Service Inc. (Moody s), respectively; prime bankers acceptance notes; repurchase agreements whose underlying collateral consists of the foregoing; money market or mutual funds or other such securities or obligations that may be approved by the Finance Committee by modification of the Airports Authority s policy. 58
66 The tables on the previous pages show the carrying value and the credit quality of the Airports Authority s investment portfolio, by investment type, as of December 31, 2009 and Custodial Credit Risk Custodial credit risk is the risk that, in the event of a failure of the counterparty, the Airports Authority would not be able to recover the value of its deposits, investments or collateral securities that were in the possession of an outside party. Deposits are exposed to custodial credit risk if they are uninsured and uncollateralized. Investment securities are exposed to custodial credit risk if they are uninsured or not registered in the name of the Airports Authority and are held by either the counterparty or the counterparty s trust department or agent but not in the Airports Authority s name. The Airports Authority s investment policy requires that securities be insured or registered investments or securities held by the Airports Authority or its agent in the Airports Authority s name. As of December 31, 2009 and 2008, all the Airports Authority s securities are held by the Airports Authority or its agent in the Airports Authority s name and are fully insured or registered investments. Repurchase agreements and guaranteed investment contracts are required to be collateralized at 103.0% and require the collateral to be Authorized Investments as described in the Investment Policy and the Master Bond Indenture. The Airports Authority s forward purchase agreement is collateralized at 100.0% with securities delivered monthly. The collateral is required to be approved Airports Authority investments, as described in the Master Bond Indenture. The fair value of the collateral for overnight repurchase agreements was $271.0 million on December 31, The fair value of the collateral for the guaranteed investment contracts was $113.6 million on December 31, The fair value of the collateral for the forward purchase agreements was $7.7 million on December 31, The fair value of the collateral for the Debt Service Reserve repurchase agreements was $92.2 million as of December 31, All the collateral for these contracts was held by the Airports Authority s agent in the Airports Authority s name. Interest Rate Risk The Airports Authority s investment policy as approved by the Board is designed to maximize investment earnings, while protecting the security of the principal and providing adequate liquidity. The overriding policy for investment decisions is to have funds available as needed for construction and general operating expenses. The Airports Authority s investment committee meets quarterly and determines the investment horizon for each fund based on the current construction or operating needs and the prevailing market conditions. Each investment transaction shall seek to first ensure that capital losses are avoided, whether they are from securities defaults or erosion of market value. The Airports Authority manages interest rate risk by managing the weighted average maturity of each portfolio type to best meet liquidity needs. 59
67 Concentration of Credit Risk The Airports Authority, as previously described, is limited to investments allowed by the bond indentures and the authorized Investment Policy. However, the Investment Policy does not limit the aggregation of investments in any one type of security. There are providers of securities in which the Airports Authority has invested individually more than 5.0% of the total portfolio. In accordance with the provisions of GASB Statement No. 31, Accounting and Reporting For Certain Investments and For External Investments Pools (GASB 31), investments with an original maturity greater than one year are recorded at their fair value and all investment income, including changes in the fair value of investments, are reported as investment income in the financial statements. As permitted by GASB 31, investments with an original maturity of less than one year are carried at amortized cost. Fair values are determined through quoted market prices. The tables below present the Airports Authority s investments in accordance with GASB 31: Cost December 31, 2009 Carrying Value Securities with original maturity 1 year and over $ 520,436,134 $ 520,224,220 Securities with original maturity less than 1 year 864,019, ,865,770 $ 1,384,456,116 $ 1,384,089,990 Cost December 31, 2008 Carrying Value Securities with original maturity 1 year and over $ 356,006,134 $ 360,135,141 Securities with original maturity less than 1 year 394,194, ,310,640 $ 750,200,194 $ 752,445,781 Change in carrying value from December 31, 2008 to December 31, 2009: Carrying value at December 31, 2009 $ 1,384,089,990 Add: Proceeds from investments sold in ,728,360 Less: Cost of investments purchased in 2009 (1,620,198,647) Less: Carrying value at December 31, 2008 (752,445,781) Change in carrying value of investments $ (826,078) 60
68 Change in carrying value from December 31, 2007 to December 31, 2008: Carrying value at December 31, 2008 $ 752,445,781 Add: Proceeds from investments sold in ,330,987,756 Less: Cost of investments purchased in 2008 (1,148,303,920) Less: Carrying value at December 31, 2007 (920,915,896) Change in carrying value of investments $ 14,213,721 Reconciliation to Comparative Statements of Net Assets A reconciliation of deposits and investments to the comparative Statements of Net Assets is as follows: December 31, Deposits $ 86,100,505 $ 71,462,478 Money market 397,443, ,794,869 Certificates of Deposit 7,252,000 7,000,000 Securities 1,384,089, ,445,781 $ 1,874,886,078 $ 1,047,703,128 Cash and cash equivalents $ 79,405,098 $ 37,994,647 Cash and cash equivalents, restricted 520,813, ,067,201 Passenger facility charges, restricted cash 54,564,484 12,604,557 Investments, restricted 345,266,160 3,902,129 Investments 266,348, ,399,596 Long-term investments 65,005,339 71,747,636 Long-term investments, restricted 543,482, ,987,362 $ 1,874,886,078 $ 1,047,703,128 D. INTEREST RATE SWAPS In 2001, the Airports Authority began a risk management program to assist in managing the interest cost on outstanding and future debt. The Airports Authority s derivatives consist of interest rate swaps used to modify interest rates on outstanding and future debt. Based on the Airports Authority s International Swaps and Derivatives Association Agreement (Swap Agreement), the Airports Authority owes interest calculated at a notional amount multiplied by a fixed rate, to the counterparties. In return, the counterparties owe the Airports Authority interest, based on the notional amount multiplied by a variable rate equal to 72 percent of London International Bank Offered Rate (LIBOR). Only the net difference in interest payments is actually exchanged with the counterparties. The Airports Authority continues to pay interest to the bondholders at the variable rate provided by the bonds associated with the swap. During the term of the Swap Agreement, the Airports Authority pays or receives the difference between the fixed rate on the Swaps and 72.0% of LIBOR. For the year ended December 31, 2008, the Airports Authority implemented GASB 53. The Airports Authority s derivatives to which GASB 53 is applicable consist of interest rate swaps used to modify interest rates on outstanding and future debt. According to GASB 53, all of the Aviation Enterprise s 61
69 forward-starting swap transactions and those swap transactions associated with issued debt were determined to be ineffective in 2008 and are recognized at fair value on the Statements of Net Assets. GASB 53 requires that if a derivative instrument is found to be ineffective in the first reporting period, evaluation of effectiveness in subsequent reporting periods should not be performed. Therefore, since all of the Airports Authority s derivatives were found to be ineffective at the end of December 31, 2008, its first reporting period, hedge accounting ceased permanently, and the changes in the value of this instrument will be reported in the Statements of Revenues, Expenses and Changes in Net Assets as a Fair value gain (loss). Hedging Derivative Instruments During the year ended December 31, 2001, the Airports Authority entered into two forward-starting interest rate Swap Agreements (collectively, the 2001 Swaps) to modify interest rates on future outstanding debt. In October 2002, the 2001 Swaps were used to hedge $241.8 million of the Series 2002C Bonds. Based on the 2001 Swaps, the Airports Authority contracted to pay interest calculated at a fixed rate of 4.46% and 4.45% to the counterparties to the 2001 Swaps: Lehman Brothers and Merrill Lynch. In return, the counterparties owed the Airports Authority interest based on the notional amount multiplied by a variable rate equal to 72.0% of LIBOR. In 2008, the Airports Authority s 2001 Swap with Merrill Lynch was reviewed for hedge effectiveness pursuant to the requirements of GASB 53 and found not to be an effective hedge. As required by GASB 53, the monthly change in the fair value of this swap agreement is recorded as Fair value gain (loss) in the Statements of Revenues, Expenses and Changes in Net Assets. On May 13, 2005, the Airports Authority entered into four forward floating-to-fixed interest rate Swap Agreements (collectively, the 2005 Swaps) with Wachovia Bank, N.A. and Bank of Montreal. Two of the 2005 Swaps had an effective date of October 1, 2006 and notional amounts of $65.0 million (Wachovia) and $35.0 million (Bank of Montreal). These were amended on August 30, 2006, to provide a hedge against rising interest rates for a portion of the financings the Airports Authority expected to undertake in The two remaining 2005 Swaps were amended effective October 1, The start date for the $75.0 million 2005 Swap with the Bank of Montreal was extended to October 1, The start date for the $125.0 million 2005 Swap with Wachovia was extended to October 1, In 2008, three of the 2005 Swap Agreements with notional amounts of $65.0 million (Wachovia Bank, N.A.), $35.0 million (Bank of Montreal), and $75.0 million (Bank of Montreal) scheduled to become effective October 1, 2008, were amended to extend the effective date to January 15, 2009, and then again to July 15, 2009, increasing the fixed-payer rate to 3.966%, 4.059%, and 3.911%, respectively. In connection with the issue of the Series 2009B Airport System Revenue Bonds, on April 1, 2009, the Airports Authority terminated the three outstanding 2005 Swaps with a notional amount of $175.0 million for a total termination payment of $35.0 million. During the year ended December 31, 2006, the Airports Authority entered into four forward-starting interest rate Swap Agreements (collectively, the 2006 Swaps) to modify interest rates on future outstanding debt. The 2006 Swaps that had an effective date of October 1, 2009 have notional amounts of $190.0 million and $110.0 million with Bear Sterns and Bank of America, respectively. In May 2008, JP Morgan completed the acquisition of Bears Stearns and on March 4, 2009, the Airports Authority approved the assignment of the Bears Stearns swap to JPMorgan Chase Bank. On October 1, 2009, the Airports Authority began paying the counterparties for the two 2006 Swaps, J.P. Morgan and 62
70 Bank of America, 4.1%, and began to receive interest from the counterparties based on the total notional amount of $300.0 million multiplied by a variable rate equal to 72.0% of LIBOR. In 2008, the Airports Authority s 2006 Swap with JP Morgan Chase and Bank of America was reviewed for hedge effectiveness pursuant to the requirements of GASB 53 and found not to be an effective hedge. As required by GASB 53, the monthly change in the fair value of this swap agreement is recorded as Fair value gain (loss) in the Statements of Revenues, Expenses and Changes in Net Assets. The Airports Authority links the swaps to its $163.2 million Series 2009A and $136.8 million Series 2009D variable rate bonds to meet requirements of the United States Internal Revenue Service. The Airports Authority held an interest rate swap agreement with Lehman Brothers Special Financing Inc. (LBSF) with an original notional amount of $161.2 million and an effective date of August 29, 2002, and a forward starting interest rate swap agreement with Lehman Brothers Commercial Bank (LBCB) with an original notional amount of $80.0 million and an effective date of October 1, Due to an event of default under the LBSF swap agreement and an additional termination event under the LBCB swap agreement caused by the bankruptcy protection filing, and the resulting ratings downgrade of Lehman Brothers Holdings, Inc., the credit support provider under the LBSF swap agreement, the Airports Authority terminated both swap agreements on October 3, 2008, and made termination payments to LBSF and LBCB in the aggregate amount of $16.6 million. Investment Derivative Instruments At December 31, 2009, the Airports Authority had two outstanding swaps serving as Investment Derivative Instruments. A 2006 Swap is a future-starting swap and is reported as investment derivative instruments with the changes in the fair values reported within investment income on the Statements of Revenues, Expenses and Changes in Net Assets. This 2006 Swap has an effective date of October 1, 2010, and a notional amount of $170.0 million with Wachovia Bank. Based on the 2006 Swaps agreements, the Airports Authority owes interest calculated at a fixed rate of 4.112% to Wachovia Bank, the counterparty. In return, the counterparty owes the Airports Authority interest based on the notional amount multiplied by a variable rate equal to 72.0% of LIBOR. The 2005 Swap is a future starting swap with an effective date of October 1, 2011 and a notional amount of $125.0 million with Wachovia Bank. Based on the 2005 Swaps agreements, the Airports Authority owes interest calculated at a fixed rate of 3.862% to Wachovia Bank, the counterparty. In return, the counterparty owes the Airports Authority interest based on the notional amount multiplied by a variable rate equal to 72.0% of LIBOR. In 2008, the Airports Authority s forward-starting swap agreements were also reviewed for hedge effectiveness pursuant to the requirements of GASB 53 and found not to be effective hedges. Consistent with paragraph 29 of GASB 53, the hedge effectiveness of the forward-starting swaps were evaluated as if current payments under the swaps were being made and they were associated with variable rate bonds that had been issued. As required by GASB 53, the monthly change in the fair value of the swaps is recorded as a Fair value gain (loss) in the Statements of Revenues, Expenses and Changes in Net Assets. As of the years ended December 31, 2009 and 2008, all of the Airports Authority s interest rate swaps are recognized on the Statements of Net Assets in liabilities at fair value. The fair value of the Airports 63
71 Authority Swaps on December 31, 2009 and 2008 is a loss of $69.2 million and $208.7 million, respectively. This represents the maximum loss that would be recognized if all counterparties failed to perform as contracted. The change in fair value of the Airports Authority s Swaps in 2009 and 2008 is a fair value gain of $139.5 million and a fair value loss of $158.4 million, respectively. Changes in the fair value of the Airports Authority s Swaps are recorded as fair value gains or losses on the Statements of Revenue, Expenses and Changes in Net Assets. In addition, net interest payments to the counterparties are recorded in the financial statements. The fair value of the Airports Authority s Swaps as of December 31, 2009, and 2008 are as follows: Notional Amount Fair Value as of 12/31/2009 Fair Value as of 12/31/2008 Change in Fair Value Maturity Hedging Derivative Instruments 2001 Merrill Lynch $ 59,250, $ (6,922,472) $ (11,587,964) $ 4,665, J.P. Morgan Chase 190,000, (24,258,893) (54,400,169) 30,141,276 Bank of America 110,000, (14,174,632) (31,903,537) 17,728,905 Total 300,000,000 (38,433,525) (86,303,706) 47,870,181 Total Live Swaps 359,250,000 (45,355,997) (97,891,670) 52,535,673 Investment Derivative Instruments July 2009 Wachovia (Terminated in 2009) - - (14,517,184) 14,517,184 Bank of Montreal (Terminated in 2009) - - (7,880,152) 7,880,152 Bank of Montreal (Terminated in 2009) - - (17,008,939) 17,008,939 Total - - (39,406,275) 39,406,275 October 2010 Wachovia 170,000, (17,885,122) (46,433,048) 28,547,926 Total 170,000,000 (17,885,122) (46,433,048) 28,547,926 October 2011 Wachovia 125,000, (5,945,956) (24,940,948) 18,994,992 Total 125,000,000 (5,945,956) (24,940,948) 18,994,992 Total Forward Settling 295,000,000 (23,831,078) (110,780,271) 86,949,193 Grand Total $ 654,250,000 $ (69,187,075) $ (208,671,941) $ 139,484,866 64
72 The fair value gains on swaps for 2009 of $104.5 million are comprised of the $139.5 million change in fair value less the $35.0 million in termination payments. The fair value losses on swaps for 2008 of $178.8 million are comprised entirely of the change in fair value. Risks Credit Risk Each of the Airports Authority s Swaps is held with a counterparty as indicated in the following table. The credit ratings for each of the counterparties are as follows: Counterparty Credit Ratings 1 Notional Amount Merrill Lynch A2/A/A+ $ 59,250,000 Wachovia 2 Aa2/AA/AA- 295,000,000 JP Morgan Chase Aa3/A+/AA- 190,000,000 Bank of America A2/A/A+ $ 110,000, ,250,000 1 Long-term ratings 2 Ratings of parent company: Wells Fargo Company. The Airports Authority s Swaps do not require the Airports Authority to post collateral for any reason. The counterparties to the Swaps are required to post collateral if their credit ratings fall below Aa3/AAbut only if the Swaps are positive in the Airports Authority s favor. As of December 31, 2009, all outstanding swap values are in the counterparty s favor, so no collateral has been posted. The Airports Authority does not enter into any master netting agreements. Interest Rate Risk - The Airports Authority is exposed to interest rate risk on its interest rate swaps. On its pay-fixed, received-variable interest rate swaps, as LIBOR decreases, the Airports Authority s net payment on the swap increases. Basis Risk - The Airports Authority is exposed to basis risk on its pay-fixed interest rate swap because the variable-rate payments received by the Airports Authority on this hedging derivative instrument is based on a rate or index other than the interest rates the Airports Authority pays on its hedged variablerate debt on which the interest rate resets every week. As of December 31, 2009, the weighted average interest rate on the Airports Authority s hedged variable-rate debt is %, and 72.0% of LIBOR was % on December 31, Termination Risk - The Airports Authority or its counterparties may terminate a swap if the other party fails to perform under the terms of the contract. 65
73 E. ACCOUNTS RECEIVABLE Trade accounts receivable consists of the following: December 31, Trade accounts receivable $ 36,060,843 $ 24,033,741 Less: allowance for doubtful accounts (806,723) (947,974) $ 35,254,120 $ 23,085,767 In 2008, Frontier Airlines, Gemini Air Cargo, MN Airlines (dba Sun Country Airlines) and ATA Holdings, Inc. filed for bankruptcy. The Airports Authority s accounts receivable for this pre-petition debt totaled $169 thousand. In 2009, Frontier Airlines emerged from bankruptcy, paying the Airports Authority all pre-petition debts. Accounts receivable as of December 31, 2009, for the remaining airlines pre-petition debts totaled $88 thousand. The Airports Authority has sufficient reserves to cover these potentially uncollectable receivables. The Airports Authority s accounts receivables are 78.3% trade receivables due from concessionaires and airlines. The remaining 21.7% are notes and other receivables such as interest receivable. The allowance for doubtful accounts is specific to the Aviation Enterprise Fund. F. RESTRICTED ASSETS The Master Indenture securing the Revenue Bonds of the Airports Authority requires segregation of certain assets into restricted accounts. The Airports Authority has also included PFC assets in restricted assets. Restricted assets consist of the following: December 31, Construction accounts $ 716,076,883 $ 204,197,324 Dulles Corridor enterprise escrow accounts 37,744,034 - Debt service reserve accounts 543,482, ,987,362 Interest accounts 76,878,577 53,254,984 Sinking fund accounts 27,962,055 23,776,457 DTR extraordinary maintenance and repair fund 7,418,379 7,740,565 Passenger facility charge accounts 54,564,484 12,604,557 Prepaid expenses and other current assets 17, ,277 Passenger facility charges 6,422,745 5,582,840 Grants receivable 87,566,754 39,596,694 Bond issuance costs, net 106,563,906 60,737,790 $ 1,664,698,219 $ 809,326,850 66
74 The construction accounts include the funds available for the design and construction of capital improvements for the Airports and for the Dulles Metrorail Project. The debt service reserve accounts contain the maximum amount of required principal payments for the bonds scheduled to come due in one year. The debt service reserve accounts are revalued each year in October. Any amounts in excess of the debt service requirements are transferred to the applicable construction fund or taken into the revenue funds of the Airports Authority if the construction funds have been expended. If the debt service reserve is undervalued, the Airports Authority transfers funds into the accounts. The debt service reserve accounts were over funded by $858 thousand as of December 31, 2009 and $6.8 million as of December 31, The interest account contains the interest amounts required for the semiannual interest payments. The sinking fund accounts represent the principal for the annual October bond payments. The PFC and grant receivables represent amounts collectable as of December 31, 2009 and The bond issuance costs are costs incurred and paid by bond funds to complete the bond deal. They are amortized over the life of the related bond issue. G. CHANGES IN CAPITAL ASSETS A summary of changes in capital assets for the years ended December 31, 2009 and 2008 are as follows: Beginning Ending Balance Transfers and Transfers and Balance January 1, 2009 Additions Deletions December 31, 2009 Capital assets not being depreciated: Construction in progress $ 1,776,370,046 $ 370,373,980 $ (514,464,785) $ 1,632,279,241 Construction in progress, Metrorail project 362,322, ,238, ,560,712 Land and other non-depreciable assets 121,734, ,734,710 Total capital assets not being depreciated 2,260,427, ,612,146 (514,464,785) 2,496,574,663 Other capital assets: Equipment 64,668,539 5,412,559 (1,178,662) 68,902,436 Motor vehicles 90,376, ,602 (164,592) 90,424,296 Buildings 2,515,808, ,403,342-2,937,212,160 Systems and structures 1,838,256,556 96,429,697 (111,961) 1,934,574,292 Total other capital assets 4,509,110, ,458,200 (1,455,215) 5,031,113,184 Less accumulated depreciation: A/D equipment 45,505,275 5,580,004 (1,020,230) 50,065,049 A/D motor vehicles 76,069,258 3,089,308 (217,131) 78,941,435 A/D buildings 640,655,372 76,313, ,969,092 A/D systems and structures 699,649,228 92,305,493 (111,961) 791,842,760 Total accumulated depreciation 1,461,879, ,288,525 (1,349,322) 1,637,818,336 Other capital assets, net 3,047,231, ,169,675 (105,893) 3,393,294,848 Totals $ 5,307,658,368 $ 1,096,781,821 $ (514,570,678) $ 5,889,869,511 67
75 Beginning Ending Balance Transfers and Transfers and Balance January 1, 2008 Additions Deletions December 31, 2008 Capital assets not being depreciated: Construction in progress $ 1,915,881,901 $ 290,681,788 $ (430,193,643) $ 1,776,370,046 Construction in progress, Metrorail project - 362,322, ,322,546 Land and other non-depreciable assets 121,534, , ,734,710 Total capital assets not being depreciated 2,037,416, ,204,334 (430,193,643) 2,260,427,302 Other capital assets: Equipment 59,460,093 8,229,458 (3,021,012) 64,668,539 Motor vehicles 92,275, ,243 (2,603,487) 90,376,286 Buildings 2,315,713, ,577,655 (22,482,600) 2,515,808,818 Systems and structures 1,440,873, ,382,837-1,838,256,556 Total other capital assets 3,908,323, ,894,193 (28,107,099) 4,509,110,199 Less accumulated depreciation: A/D equipment 43,617,182 4,764,315 (2,876,222) 45,505,275 A/D motor vehicles 75,458,102 3,215,918 (2,604,762) 76,069,258 A/D buildings 588,730,005 71,107,861 (19,182,494) 640,655,372 A/D systems and structures 621,825,106 77,824, ,649,228 Total accumulated depreciation 1,329,630, ,912,216 (24,663,478) 1,461,879,133 Other capital assets, net 2,578,692, ,981,977 (3,443,621) 3,047,231,066 Totals $ 4,616,109,321 $ 1,125,186,311 $ (433,637,264) $ 5,307,658,368 For the year ended December 31, 2009, interest costs of $77.4 million less interest earned of $1.0 million were capitalized in the Aviation Enterprise Fund as part of the cost of construction in progress and interest costs of $24.4 million less interest earned of $1.4 million was capitalized in the DCE Fund as part of the cost of construction in progress. For the year ended December 31, 2008, interest costs of $87.2 million less interest earned of $11.8 million were capitalized as part of the cost of construction in progress. Depreciation expense for the year ended December 31, 2009 was $177.2 million for the Aviation Enterprise Fund and $52 thousand for the DCE Fund. As of December 31, 2008, depreciation expense for the Aviation Enterprise Fund was $156.9 million. As of December 31, 2009, the Airports Authority s construction in progress account includes only costs expended on work for projects that are in an active status. Included in these active status projects is the construction of a facility for the National Oceanic and Atmospheric Administration (NOAA) which will be exchanged for 40 acres of land at Dulles International. While the building was occupied in September 2008, by NOAA personnel, the quitclaim deed for the land has not been received as of December 31, The total amount of construction in progress related to this facility as of December 31, 2009 is $20.4 million. The land which the Airports Authority will receive in exchange for this building will be appraised in 2010, which is when the exchange is expected to be finalized. Other capital assets - buildings includes an Automated People Mover Maintenance Facility that was completed in 2006, but not put into service as of the end of This asset for $36.9 million is available to the train operator for fit-out but is not in use for its intended purpose and is therefore idle as of December 31, No depreciation expense has been recognized for this asset during the years ended December 31, 2009 and
76 The Airports Authority Aviation Enterprise Fund initiated its CCP in 1988 to expand, modernize and maintain the Airports. Under the CCP, the Airports Authority has constructed and will continue to construct many of the principal elements of the Reagan National and Dulles International Master Plans. Major projects completed under the Master plan at Reagan National include, among others, two new main terminals connected to a Metrorail station, three parking garages, an airport traffic control tower and a consolidated communications center. Major capital projects completed under the CCP at Dulles International include, among others, expansion and rehabilitation of the Main Terminal, a fourth runway, construction of Concourses A and B, the International Arrivals Building (IAB), runway and road improvements, two daily parking garages and an air traffic control tower. In 2000, the Airports Authority approved an expansion of the CCP for Dulles International referred to as the Washington Dulles Development (d 2 ) program expected to be completed in In the aftermath of the events of September 11, 2001, the Airports Authority reexamined the CCP program and revised the expected completion date to 2011 and delayed the start dates of several projects and deferred some other projects. However, due to the growth in passenger enplanements at Dulles International in recent years, the CCP program has been rescheduled to 2016 and an additional $2.1 billion of projects were added. In total, the CCP program is expected to cost $7.1 billion. The Airports Authority s approved capital budget for the CCP is $4.5 billion. The projects currently in the program at Dulles International include the AeroTrain system to replace the existing mobile lounges which will move passengers between the Main Terminal and Concourses A, B and C, completion of the construction of the IAB expansion, conveyor and building changes to accommodate in-line baggage screening, site preparation for the fifth runway, preservation of the historic air traffic control tower in the Main Terminal, concourse modifications to support the Airbus A380 aircraft and an Enterprise Resource Program (ERP). At Reagan National, projects include runway and taxiway area improvements, building modifications to accommodate in-line baggage screening, additional decks on Garages A, B, and C, and an ERP. With the transfer of the DTR from VDOT, the Airports Authority committed to constructing the Dulles Metrorail Project. This is a 23.1-mile extension of the existing Metrorail system from near the West Falls Church station to Dulles International west to Ashburn in Loudoun County, Virginia. Upon completion, this system will be operated by the Washington Metropolitan Area Transit Authority (WMATA) and serve Tysons Corner, the Reston/Herndon area, and provide a one-seat ride from Dulles International to downtown Washington. The Dulles Metrorail Project - Phase 1 will extend 11.7 miles from near the West Falls Church station to Wiehle Avenue in Reston. It includes five new stations and improvements to the existing WMATA Service and Inspection Yard at the West Falls Church station. Utility relocation activities began in the spring of 2008 and construction began in March The total Dulles Metrorail Project - Phase 1 cost is budgeted at $2.8 billion. The Dulles Metrorail Project - Phase 2 will extend the Metrorail system an additional 11.4 miles from Wiehle Avenue to Ashburn in Loudoun County. It includes six new stations and a new service and inspection yard at Dulles International. Preliminary engineering began in December The preliminary estimate for the Dulles Metrorail Project - Phase 2 is $2.5 billion. 69
77 In 2008, the Airports Authority recognized a one-time transaction to write off design costs incurred on the Tier 2 Concourse and related facilities. In 2008 the Airports Authority ceased all design work on the Tier 2 Concourse and related facilities. If the Airports Authority were to proceed with the project in the future, the Tier 2 Concourse and related facilities are likely to be substantially different from what is reflected in the designs and plans developed to date. Consistent with GASB 42, in 2008, the Airports Authority recorded $66.2 million in impairment loss, which is included in transfers and deletions in the preceding 2008 table summarizing the changes in capital assets for the year. Pollution Remediation Obligations In 2008, the Airports Authority implemented GASB 49. Prior year financial statements were not restated since there were no material previously unrecorded liabilities. As of December 31, 2009 and 2008, the Airports Authority has two sites which require further evaluation of potential contamination. Due to the burning of waste containing hazardous material at a former fire training area in 1989, Dulles International is subject to Resource Conservation and Recovery Act (RCRA) corrective action regulatory requirements. RCRA corrective action activities are being conducted under the direction of the Environmental Protection Agency (EPA) Region 3 with assistance from the Virginia Department of Environmental Quality (VDEQ). On March 19, 2007, the EPA requested the Airports Authority to submit a work plan to address Phase I Environmental Indicator Information Needs. The Airports Authority submitted a work plan on April 30, 2007 and implemented the work plan in May of 2007, subsequently submitting reports of investigation in August, October and November of that year. On November 27, 2007, the Airports Authority submitted a work plan for additional investigations. The EPA is reviewing that work plan. Thus far, only one investigated area has contained contamination that requires further evaluation for the environmental indicators. Acetone has been found in groundwater north of the Shop #2 maintenance complex. Further evaluation of the concentration of acetone is needed to determine necessary pollution remediation efforts, if any. As of December 31, 2009, it is unknown what additional studies and/or site work, if any, will be required. Therefore, no liabilities have been established as of December 31, During July of 2007, a petroleum release was discovered at the Shop #1 Used Oil Tank Site located at Dulles International. The 1,000 gallon double wall fiberglass tank was originally installed in It is believed the release originated from the remote fill piping located within the Shop #1 Complex. Subsequent actions included the preparation of an Initial Abatement Report in July, 2007, followed by the preparation of a Site Characterization Report in February, 2008, and the approval of the Corrective Action Plan (CAP) in July, The CAP approved by VDEQ required the Airports Authority to properly close (remove) the tank, begin free product recovery activities, and to establish remedial endpoints for the site. These reports and the tank removal activities were performed under the direction of VDEQ. The Authority continues to conduct free product recovery activities at the site and is required to submit Quarterly Monitoring and Remediation Reports to VDEQ. The free product recovery and reporting activities will continue through 2010, until the remedial endpoints have been achieved for the site. As of December 31, 2009, an estimated potential liability in the amount of $63 thousand has been recognized. 70
78 H. ACCOUNTS PAYABLE The accounts payable and accrued expenses balance as of December 31, 2009, of $154.7 million, is 50.8% payable from restricted funds and 49.2% payable from general operating funds. The restricted fund payables are primarily trade accounts payable related to the Airports Authority s ongoing construction programs. Building construction costs payable are $78.1 million as of December 31, 2009 and $101.2 million as of December 31, The unrestricted accounts payable and accrued expenses are 16.1% accrued salaries and benefits, 42.9% payables to vendors, 33.7% deferred revenue and expenses, with the remaining 7.3% reserves for insurance claims as of December 31, For the year ended December 31, 2008, the Aviation Enterprise financial statements reflect the one-time reduction of $7.2 million in previously recorded expenses for costs incurred in connection with the transfer of the DTR to the Airports Authority and the reduction of $200 thousand in operating expense, primarily payroll, both of which were repaid from the DCE Fund in I. PENSION PLANS AND DEFERRED COMPENSATION PLAN The Airports Authority participates in two United States Government pension plans: the Civil Service Retirement System (CSRS) and the Federal Employees Retirement System (FERS). Each is considered a cost-sharing multiple employer public employee retirement system. Employees hired before December 31, 1983 are members of the CSRS unless they elected to transfer to FERS either before December 31, 1987 or during the special enrollment period from July 1, 1998 through December 31, In addition, the Airports Authority maintains single employer-defined benefit pension plans that cover all of its police and fire employees and its regular employees hired on or after June 7, 1987, excluding employees working less than 20 hours a week and other temporary employees. Government Pension Plans Under the CSRS, employees contribute 7.0% of their base pay (7.5% for firefighters) and the Airports Authority matches the employees contributions. Retirement benefits are based on length of service and the average of the employee s three highest years of base pay. Employees can retire at age 55 with 30 years of service; age 60 with 20 years of service; or age 62 with five years of service. Firefighters can retire at age 50 with 20 years of firefighting service. Retirement annuities range from 7.5% of the average high three-year base pay to a maximum of 80.0% depending on years of service. Effective April 1, 1987, the CSRS added a Thrift Savings Plan. CSRS participants can contribute a percentage of their salary on a tax-deferred basis up to the statutory limit of $16,500 in There are 35 regular employees and 5 police and firefighter employees enrolled in CSRS as of December 31, The FERS provides benefits from three different sources: a Basic Benefit Plan, Social Security, and the Thrift Savings Plan. The Basic Benefit Plan employees deduction ranges from 0.8% of base pay for regular employees to 1.3% for firefighters. The Airports Authority contributes from 10.7% for regular employees to 23.3% for firefighters. There were 39 regular employees and 12 police and firefighter employees currently enrolled in the FERS as of December 31,
79 Employees retiring under the FERS are entitled to annual maximum retirement benefits equal to 1.1% of the employee's highest three-year average salary for every year of service. Regular employees are eligible for retirement when they have 10 years of service and have reached the minimum retirement age (ranging from 55 to 57 years old), based on a birth date. Firefighters can retire at age 50 with 20 years of firefighting service or at any age with 25 years of service. These employees are entitled to an annual retirement benefit of 1.7% of the employee s highest three-year average salary for every year of service up to 20 years and 1.0% for years of service over 20. FERS participants enrolled in the Thrift Savings Plan can now contribute up to 15.0% of their salary on a tax-deferred basis. The Airports Authority s base payroll for employees covered by the CSRS and the FERS for the year ended December 31, 2009 was $8.3 million. Employee contributions for the federal pension plans were $304 thousand for 2009, $337 thousand for 2008, and $352 thousand for The employer contributions for these plans were $976 thousand for 2009, $1.1 million for 2008, and $1.1 million for These contributions represent 100.0% of required contributions for each of the respective years. The Airports Authority s total base payroll for all employees, including employees covered by CSRS, FERS and DCE employees was $92.6 million in The Airports Authority Pension Plans Effective January 1, 1989, the Airports Authority established a retirement benefits program for employees hired on or after June 7, 1987, which provides income in the event of retirement or death where a surviving spouse remains. Employee coverage and service credit was retroactive to June 7, The program includes the Airports Authority General Employee Retirement Plan (covering regular employees) and the Airports Authority Retirement Plan for Police Officers and Firefighters (the Plans), both single employer defined benefit plans. Any amendment to these plans must be approved by the Airports Authority s Board. As of December 31, 2009, the number of employees participating in the Plans was: Current participants Regular Police/Fire Total Vested Non-vested Retirees/disabled employees currently receiving benefits Terminated vested participants Total 1, ,721 The Airports Authority contributed 6.3% to the Regular Plan and 13.0% to the Police and Fire Plan in The Airports Authority s base payroll in 2009 for the Regular Plan was approximately $63.9 million and $20.4 million for the Police and Fire Plan. The Airports Authority s base payroll in 2008 for the Regular Plan was approximately $60.5 million and $20.2 million for the Police and Fire Plan. In 2009, the Airports Authority contributed $4.0 million to the Regular Plan and $2.7 million to the Police and Fire Plan. In 2008, the Airports Authority contributed $4.1 million to the Regular Plan and $2.5 million to the Police and Fire Plan. Employees do not contribute to the Regular Plan. Financial statements and required supplementary information for the Plans can be obtained by writing to the Manager, Benefits,, 1 Aviation Circle, Washington, DC
80 The Plans provide retirement benefits as well as death benefits. Regular employees who retire at or after age 60 with five years of credited service are entitled to an annual retirement benefit, payable monthly for life, in an amount equal to 1.2% of final-average salary up to covered compensation and 1.6% of final-average salary which is above covered compensation for each year of credited service (maximum 30 years). Final-average salary is the average of the employee's highest consecutive 78 pay periods in the most recent 260 pay periods, while covered compensation is the 35-year average of the Social Security Wage Bases ending with the year in which the participant attains Social Security normal retirement age. A pre-retirement surviving spouse benefit is payable in the event of death, equal to 50.0% of the benefit which would have been payable had the participant retired, provided the participant had at least five years of service. Benefits can be received as early as age 55 with five years of service with a 5.0% reduction for each year the participant is younger than age 60. Benefits are also adjusted to the lesser of one-half of the CPI or 4.0%. The benefits to police officers and firefighters become payable at age 55 with five years of service or at any age with 25 years of service. Benefits are not reduced if retirement is at or after age 50. The benefit is 2.0% of the final average earnings for service up to 25 years, and 1.0% of the final average earnings for service between 25 and 30 years. Withdrawal, death, and cost of living benefits are similar to those available to regular employees. Police officers and firefighters are required to contribute 1.5% of base pay per year of participation, which is accumulated with a 5.0% interest rate and returned when a benefit is forfeited. The Airports Authority contributes the remaining amounts necessary to fund the Plans using the entry age normal actuarial method in addition to an amount to amortize any unfunded liability. Contributions Required and Made The Airports Authority s funding policy is to provide for periodic employer contributions at actuarially determined rates that, expressed as percentages of annual covered payroll, are designed to accumulate sufficient assets to pay benefits when due. Employer contributions are determined in accordance with the plan provisions and approved by the Airports Authority s Board. Level percentages of payroll employer contribution rates are determined using the entry age actuarial funding method shown in dollars in the following table. Unfunded actuarial accrued liabilities are being amortized over a period of 30 years on an open basis. 73
81 Annual Pension Cost and Net Pension Obligation (Asset) The Airports Authority s pension obligation (asset) for its General Employees and Police and Firefighters pension plans as of December 31, 2009, 2008 and 2007 and for the years then ended, which are based on the then latest actuarial valuations available, are as follows: General Employees 2009 Police and Firefighters Annual required contribution $ 4,030,946 $ 2,657,291 Interest on net pension asset (125,731) (39,071) Adjustment to annual required contribution 132,040 41,032 Annual pension cost 4,037,255 2,659,252 Contributions made 4,030,946 2,657,291 Change in net pension obligation 6,309 1,961 Net pension obligation (asset) beginning of year (1,676,408) (520,949) Net pension obligation (asset) end of year $ (1,670,099) $ (518,988) General Employees 2008 Police and Firefighters Annual required contribution $ 4,117,347 $ 2,508,523 Interest on net pension asset (126,206) (39,219) Adjustment to annual required contribution 132,539 41,187 Annual pension cost 4,123,680 2,510,491 Contributions made 4,117,347 2,508,523 Change in net pension obligation 6,333 1,968 Net pension obligation (asset) beginning of year (1,682,741) (522,917) Net pension obligation (asset) end of year $ (1,676,408) $ (520,949) General Employees 2007 Police and Firefighters Annual required contribution $ 3,433,086 $ 2,084,003 Interest on net pension asset (123,248) (39,367) Adjustment to annual required contribution 129,433 41,343 Annual pension cost 3,439,271 2,085,979 Contributions made 3,508,663 2,050,272 Change in net pension obligation (asset) (69,392) 35,707 Net pension obligation (asset) beginning of year (1,613,349) (558,624) Net pension obligation (asset) end of year $ (1,682,741) $ (522,917) The net pension asset is reported as a non-current unrestricted asset as of December 31, 2009 and
82 Three year trend information is as follows: General Employees Retirement Plan Police Officers and Firefighters Plan Year Annual Percentage Net Pension Annual Percentage Net Pension Pension of APC Obligation Pension of APC Obligation Ended Cost (APC) Contributed (Asset) Cost (APC) Contributed (Asset) 2007 $ 3,439, % $ (1,682,741) $ 2,085, % $ (522,917) 2008 $ 4,123, % $ (1,676,408) $ 2,510, % $ (520,949) 2009 $ 4,037, % $ (1,670,099) $ 2,659, % $ (518,988) Funding Status The actuarial accrued liability (AAL) was determined from the then most recently available actuarial valuation of the Plans. Significant actuarial assumptions used in determining the AAL include: (a) a rate of return on the investment of the present and future assets of 7.5% per year compounded annually, (b) projected salary increases ranging from 5.5% to 9.5% based on years of service and anticipated inflation, (c) post-retirement benefit increases of 1.75% per year, (d) for inflation rate, CPI increases of 3.5% per year (e) amortization method of percentage of projected payroll, and (f) amortization period of 30 years, open. The actuarial value of assets is determined using fair market values with changes smoothed over a five-year period. A copy of the actuarial valuations, plan financial statements and plan documents may be obtained by written request to: MWAA, Benefits Department, 1 Aviation Circle, Washington, DC
83 Actuarial UAAL as a Actuarial Actuarial Accrued Unfunded Percentage of Valuation Value Liability (AAL) AAL Funded Covered Covered Date of Assets - Entry Age (UAAL) Ratio Payroll Payroll General Employees Retirement Plan 12/31/2002 $48,332,275 $37,975,594 ($10,356,681) % $39,377,221 (26.30)% 12/31/2003 $53,164,834 $43,202,420 ($9,962,414) % $41,524,933 (24.00)% 12/31/2004 $58,126,517 $46,229,931 ($11,896,586) % $43,199,684 (27.50)% 12/31/2005 $64,087,361 $53,833,003 ($10,254,358) % $48,218,773 (21.30)% 12/31/2006 $72,341,671 $62,195,419 ($10,146,252) % $52,985,414 (19.10)% 12/31/2007 $82,372,511 $68,958,757 ($13,413,754) % $54,751,207 (24.50)% 12/31/2008 $86,617,649 $80,356,911 ($6,260,738) % $63,672,545 ( 9.83)% Actuarial UAAL as a Actuarial Actuarial Accrued Unfunded Percentage of Valuation Value Liability (AAL) AAL Funded Covered Covered Date of Assets - Entry Age (UAAL) Ratio Payroll Payroll Police Officers and Firefighters Retirement Plan Schedule of Funding Progress 12/31/2002 $21,744,019 $19,020,653 ($2,723,366) % $11,487,047 (23.70)% 12/31/2003 $24,294,170 $21,873,198 ($2,420,972) % $12,679,387 (19.10)% 12/31/2004 $27,168,047 $24,474,697 ($2,693,350) % $14,298,016 (18.80)% 12/31/2005 $30,730,808 $28,546,385 ($2,184,423) % $15,462,439 (14.10)% 12/31/2006 $35,464,226 $34,134,852 ($1,329,374) % $17,799,707 (7.50)% 12/31/2007 $41,245,955 $39,293,637 ($1,952,318) % $18,799,993 (10.40)% 12/31/2008 $44,590,069 $45,128,509 $538, % $20,932, % Annual Pension Percentage of ARC General Employees Retirement Plan Police Officers and Firefighters Retirement Plan Calendar Annual Required Actual Percentage Annual Required Actual Percentage Year Contribution Contribution Contribution Contribution Contribution Contribution 2003 $2,593,255 $2,370, % $1,577,901 $1,443, % 2004 $2,755,413 $2,678, % $1,723,233 $1,684, % 2005 $2,525,154 $3,030, % $1,654,845 $1,950, % 2006 $3,233,610 $3,037, % $1,939,938 $1,890, % 2007 $3,463,046 $3,508, % $2,050,272 $2,050, % 2008 $4,117,347 $4,117, % $2,508,523 $2,508, % 2009 $4,030,946 $4,030, % $2,657,291 $2,657, % Expressing the actuarial value of assets available for benefits as a percentage of the AAL provides an indication of the Plan s funding status on a going-concern basis. Analysis of this percentage over time indicates whether the Plan is becoming financially stronger or weaker. Generally, the greater this 76
84 percentage, the stronger the retirement plan. Trends in assets in excess of AAL and annual covered payroll are both affected by inflation. Expressing the AAL in excess of assets as a percentage of annual covered payroll approximately adjusts for the effects of inflation and aids analysis of progress made in accumulating sufficient assets to pay benefits when due. Generally, the lower this percentage, the stronger the retirement plan. The comparability of trend information is affected by changes in actuarial assumptions, benefit provisions, actuarial funding methods, accounting policies, the size or composition of the population covered by the Plan, and other changes. Those changes usually affect trends in contribution requirements and in ratios that use the AAL as a factor. All assets of the Airports Authority pension plans are held in trust at the Bank of New York Mellon. The assets were transferred to the Bank of New York Mellon on July 2, 2007 from Manufacturers and Traders Trust Company (M&T). The contribution rates for any given year for the Airports Authority General Plan and Police and Firefighter Plan are calculated based on the actuarial valuation done for the year two years prior to the current year. That is, the contribution rates for the 2009 year were calculated using the actuarial valuation done for year ended December 31, For this reason, the Airports Authority contribution rates will not see the activity in the current financial markets reflected in the rates for years 2009 or The contribution rate for the calendar year 2010 will incorporate the changes that took place in the current market in 2008 and any corresponding economic assumptions. Deferred Compensation Plan Effective July 2, 1989, the Airports Authority offered its employees a deferred compensation plan created in accordance with Internal Revenue Code Section 457. This plan, available to all full-time employees, permits employees to defer a portion of their salary until future years. Participation in the plan is optional. The deferred compensation is available to employees at termination, retirement, death, or an unforeseeable emergency. Effective July 17, 2008, the Airports Authority changed its trust agent for the Deferred Compensation Plan to the Vantage Trust Company. Prior to this date, the assets were held in trust by M&T. Investments are managed for participants by the International City/County Management Association Retirement Corporation (ICMA-RC) through one of several investment options, or a combination thereof. The choice of the investment option(s) is made by the participant. Money Purchase Pension Plan Effective December 18, 2007, the Airports Authority established a Money Purchase Pension Plan (MPPP) in accordance with Internal Revenue Code 401 (a) (17). The MPPP is available to all full-time employees. Under the terms of the MPPP, the Airports Authority makes contributions on behalf of eligible employees. The amount of contributions made on behalf of eligible employees depends on whether the employee s pension benefit under the Airports Authority s General Employees Retirement Plan or the Airports Authority s Retirement Plan for Police Officers and Firefighters is limited due to 77
85 compensation limitations imposed by section 401 (a) (17). Eligible employees may not defer a portion of their salary into the MPPP. The Airports Authority serves as trustee of the MPPP. The Airports Authority has entered into an agreement with the ICMA-RC to act as an investment advisor to the MPPP and to provide record keeping services. In 2009, the Airports Authority paid $57 thousand into the MPPP. In 2008, the Airports Authority paid $34 thousand into the MPPP. J. POSTEMPLOYMENT BENEFITS The Airports Authority Plans In addition to pension benefits, the Airports Authority provides post employment benefits of health, dental and life insurance. The Airports Authority s Retired Employees Healthcare Plan (the Healthcare Plan) is a single-employer defined benefit healthcare, dental and life insurance plan administered by the Airports Authority. The Healthcare Plan provides medical, dental and life insurance benefits to eligible retirees and their spouses. The Airports Authority s Board initially provided the benefits package to meet requirements of the federal enabling legislation which created the Airports Authority in Through the budget approval process, the Airports Authority has continued to provide these benefits of insurance to retired employees under the Airports Authority s group plans for health, dental and life insurance. The Airports Authority can establish and amend benefit provisions of the Healthcare Plan. As of December 31, 2009, 344 retired employees were receiving life insurance benefits and 355 retired employees were receiving health insurance benefits under these Airports Authority programs. In accordance with GASB Statement No. 43, Financial Reporting for Postemployment Benefit Plans Other Than Pension Plans (GASB 43) and GASB Statement No. 45, Accounting and Financial Reporting by Employers for Postemployment Benefits Other Than Pensions (GASB 45), the Airports Authority created in February 2005 an Employee Welfare Benefits Trust. This Trust provides a funding mechanism for retiree health, dental and life insurance coverage and other post employment benefits other than pensions. The Airports Authority began funding the trust and fully implemented GASB 43 and GASB 45 in The contribution requirements of the Plan s members and the Airports Authority for the health and dental insurance are established and may be amended by the management of the Airports Authority. The required contribution is based upon projected pay-as-you-go financing requirements and funding for future benefits. The Airports Authority pays 80.0% of the total health insurance premiums costs with the remainder paid by the retired employee. For the years ended December 31, 2009 and December 31, 2008 the Airports Authority s health insurance costs for retired employees totaled $3.9 million and $3.3 million, respectively. Plan participants contributed $810 thousand for fiscal year 2009 and $633 thousand for fiscal year 2008, or 20.0% of the total premiums, through their required monthly contributions: 78
86 Monthly Contributions for Retirees Under 65 for 2009 Retiree Plus Retiree Plus Provider Choices Retiree Only Spouse Child(ren) Family Aetna - HMO $96.00 $ $ $ Aetna - PPO Kaiser Permanente Select HMO MetLife Dental Monthly Contributions for Retirees Over 65 for 2009 One > 65 Two Party Family Provider Choices Retiree Only One < 65 Medicare Medicare Aetna - HMO $84.00 $ $ $ Aetna - PPO Kaiser HMO MetLife Dental The Airports Authority offers two life insurance options to retirees. Under option 1, the Airports Authority pays 100.0% of the retired employee s basic and supplemental life insurance cost. Basic life insurance coverage is reduced to 25.0% of the employee s life insurance in force at the time of retirement. Supplemental life insurance is a multiple of the basic life insurance (1 to 5 times) that the employee had selected prior to retirement. Supplemental life insurance is reduced at a rate of 2.0% each month so that at the end of 50 months, no supplemental life insurance coverage remains in force. Option 2 is available to employees who retire from the Airports Authority on or after May 1, Under option 2, basic life insurance is reduced to 25.0% of the retired employee s basic life insurance in force at the time of retirement. The Airports Authority pays 100.0% of the cost of the basic life insurance. The amount of supplemental life insurance in force remains at the amount the retired employee had at the time of retirement. The amount of supplemental life insurance is reduced by 50.0% at age 70 and another 50.0% at age 75. Retirees pay the entire cost of supplemental life insurance under this option. Of the 355 retired employees, 42 had supplemental insurance coverage as of December 31, For the year ended December 31, 2009, the life insurance costs for retired employees totaled $153 thousand. Of the 340 retired employees, 40 had supplemental insurance coverage as of December 31, For the year ended December 31, 2008, the life insurance costs for retired employees totaled $158 thousand. Annual Other Post Employment Cost and Obligation (Asset) The Airports Authority s obligations (assets) for its post employment benefit plans as of December 31, 2009, 2008, 2007 and for the years then ended, which are based on the then latest actuarial valuations available, are as follows: 79
87 Medical and 2009 Dental Life Insurance Annual required contribution $ 9,210,000 $ 811,900 Annual OPEB cost 9,210, ,900 Contributions made 8,120, ,026 Change in net OPEB obligation 1,089, ,874 Net OPEB obligation (asset) beginning of year (2,492,070) (66,487) Net OPEB obligation (asset) end of year $ (1,402,991) $ 63,387 Medical and 2008 Dental Life Insurance Annual required contribution $ 7,980,000 $ 746,600 Annual OPEB cost 7,980, ,600 Contributions made 8,262, ,827 Change in net OPEB obligation (asset) (282,070) 27,773 Net OPEB obligation (asset) beginning of year (2,210,000) (94,260) Net OPEB obligation (asset) end of year $ (2,492,070) $ (66,487) Medical and 2007 Dental Life Insurance Annual required contribution $ 7,904,439 $ 754,384 Annual OPEB cost 7,904, ,384 Contributions made 7,754, ,962 Change in net OPEB obligation 150, Net OPEB obligation (asset) beginning of year (2,360,000) (94,682) Net OPEB obligation (asset) end of year $ (2,210,000) $ (94,260) The OPEB asset is reported as a non-current unrestricted asset as of December 31, 2009 and Funding Status The Airports Authority began funding the Plan in 2005 and in addition to funding insurance costs for retired employees (see above), contributed $5.0 million, $5.4 million and $5.2 million for the years ended December 31, 2009, 2008, and 2007, respectively, to the Trust for medical and dental insurance. The Airports Authority also contributed approximately $540 thousand, $570 thousand and $550 thousand for the years ended December 31, 2009, 2008, and 2007, respectively, to the Trust for life insurance. 80
88 Schedule of Funding Progress for Medical Insurance Actuarial UAAL as a Actuarial Actuarial Accrued Percentage of Valuation Value Liability (AAL) Unfunded Funded Covered Covered Date of Assets - Entry Age UAAL Ratio Payroll Payroll 01/01/ $65,790,000 $65,790, % $58,820, % 01/01/2006 $6,500,000 $76,080,000 $69,580, % $64,100, % 01/01/2007 $13,090,000 $81,930,000 $68,840, % $69,770, % 01/01/2008 $19,450,000 $85,170,000 $65,720, % $68,620, % 01/01/2009 $25,190,000 $103,980,000 $78,790, % $73,960, % Schedule of Funding Progress for Life Insurance Actuarial UAAL as a Actuarial Actuarial Accrued Percentage of Valuation Value Liability (AAL) Unfunded Funded Covered Covered Date of Assets - Entry Age UAAL Ratio Payroll Payroll 01/01/ $5,380,500 $5,380, % $59,739, % 01/01/2006 $554,100 $5,941,900 $5,387, % $64,148, % 01/01/2007 $1,152,000 $6,722,000 $5,570, % $69,770, % 01/01/2008 $1,711,700 $6,822,000 $5,110, % $68,616, % 01/01/2009 $2,217,400 $7,578,300 $5,360, % $73,961, % Annual Percentage of ARC Medical Insurance Calendar Annual Required Actual Percentage Year Contribution Contribution Contribution 2005 $6,390,000 $8,750, % 2006 $7,400,000 $7,400, % 2007 $7,904,439 $7,754, % 2008 $7,980,000 $8,262, % 2009 $9,210,000 $8,120, % Annual Percentage of ARC Life Insurance Calendar Annual Required Actual Percentage Year Contribution Contribution Contribution 2005 $680,000 $853, % 2006 $709,500 $631, % 2007 $754,384 $753, % 2008 $746,600 $718, % 2009 $811,900 $682, % 81
89 Actuarial valuations of an ongoing plan involve estimates of the value of reported amounts and assumptions about the probability of occurrence of events far into the future. Examples include assumptions about future employment, mortality, and the healthcare cost trend. Actuarially determined amounts are subject to continual revision as actual results are compared with past expectations and new estimates are made about the future. The schedule of funding progress presents multi-year trend information about whether the actuarial value of plan assets is increasing or decreasing over time relative to the AAL for benefits. Actuarial Methods and Assumptions Projections of benefits for financial reporting purposes are based on the substantive plan (the Plan as understood by the employer and the Plan members) and include the types of benefits provided at the time of each valuation and the historical pattern of sharing the benefit costs between the employer and plan members to that point. The actuarial methods and assumptions used include techniques that are designed to reduce the effects of short-term volatility in AAL and the actuarial value of assets, consistent with the long-term perspective of the calculations. The actuarial value of future assets will be determined using fair market values. In the January 1, 2009 actuarial valuation, the entry age actuarial cost method was used. The actuarial assumptions included a 7.5% investment rate of return (net of administrative expenses) and an annual healthcare cost trend rate of 11.0% initially, reduced by decrements to an ultimate rate of 5.0% after seven years. The Life Insurance rate includes a 3.0% inflation assumption. The initial unfunded AAL is being amortized as a level dollar amount over a period of 30 years. A copy of the actuarial valuation and plan document may be obtained by written request to: Metropolitan Washington Airports Authority, Benefits Department, 1 Aviation Circle, Washington, DC There are no separate stand alone financial reports issued. K. CAPITAL DEBT Commercial Paper Notes The Airports Authority s Board adopted Resolution No on April 2, 2000, allowing the issuance of $250.0 million in CP Notes. The principal amount was to pay or provide for certain capital improvements at the airports or refunding other forms of indebtedness principal and interest thereof. On May 2, 2001, the Airports Authority Board adopted Resolution No allowing the issuance of CP Notes not to exceed $500.0 million. The Airports Authority currently has in place credit facilities allowing it to draw up to $345.0 million in CP Notes for the Aviation Enterprise at any given time. Series One CP Notes are authorized pursuant to the Amended and Restated Eleventh Supplemental Indenture dated as of November 1, 2004 and amended on March 1, 2005 and further amended on January 6, 2010 between the Airports Authority and the Trustee. The Series One CP Notes are structured as Short-term/Demand Obligations under the Indenture and collateralized by certain pledged funds including Net Revenues on parity with the Bonds. They are further collateralized by an irrevocable direct pay letter of credit for $220.0 million issued by JP Morgan Chase Bank, which expires in March The Airports Authority s obligation to repay amounts drawn under such letter of credit is collateralized by a promissory note issued by the Airports Authority to JP Morgan Chase 82
90 Bank and is collateralized by and payable from Net Revenues and other pledged funds on a parity with the Series One CP Notes and the Bonds. As of December 31, 2009, $90.0 million of the Series One CP Notes were outstanding. The proceeds are being used to provide interim financing for authorized projects at Reagan National and Dulles International airports. The weighted average interest rate on the Series One CP Notes as of December 31, 2009 was 0.40% on sub-series A, and 0.39% on sub-series A- 2. Series Two CP Notes are authorized pursuant to the Twenty-second Supplemental Indenture dated as of January 1, 2005 and amended on March 1, 2007 and further amended on October 1, 2009 between the Airports Authority and the Trustee. The Series Two CP Notes are structured as Short-term/Demand Obligations under the Indenture and are collateralized by certain pledged funds including Net Revenues on parity with the Bonds. They were further collateralized by an irrevocable direct pay letter of credit issued on a several but not joint basis by WestLB-AG acting through its New York Branch, and Landesbank Baden-Wurttemberg (LBBW), acting through its New York Branch (collectively, the Banks), which expires in December 2015, but allows the Banks under certain circumstances to terminate the facility every five years beginning on January 12, On October 1, 2009, the Series Two CP Notes direct letter of credit was amended to eliminate WestLB-AG as a party to the Series Two irrevocable direct letter of credit as of October 26, 2009 and continue LBBW s commitment at $125.0 million, reducing the Maximum Stated Amount of the Series Two CP irrevocable direct letter of credit from $200.0 million to $125.0 million. The Airports Authority s obligation to repay amounts drawn under such letter of credit is collateralized by a promissory note issued by the Airports Authority to the Bank and is collateralized by and payable from Net Revenues and other pledged funds on parity with the Series Two CP Notes and the Bonds. As of December 31, 2009, the Airports Authority has all of the $125.0 million Series Two CP Notes outstanding. The proceeds are used to provide interim financing for authorized projects at Reagan National and Dulles International. The weighted average interest rate on the Series Two CP Notes as of December 31, 2009 was 0.37% on sub-series A-1, and 0.46% on sub-series C. As of December 31, 2009 all of the Airports Authority s CP Notes are rated P-1 short-term by Moody s, A-1+ short-term by S&P, and F1+ short-term by Fitch. Changes in Commercial Paper Notes Balances Series One Series Two Total Balance as of December 31, 2008 $ 150,000,000 $ 67,500,000 $ 217,500,000 Commercial Paper Notes Refunded (130,000,000) (67,500,000) (197,500,000) Commercial Paper Notes Issued 70,000, ,000, ,000,000 Balance as of December 31, 2009 $ 90,000,000 $ 125,000,000 $ 215,000,000 PFC Bank Participation Notes The Airports Authority issued Flexible Term PFC Revenue Notes (bank participation notes) to finance PFC approved projects, of which $432.0 million were outstanding as of December 31, On July 2, 2009, proceeds from Airport System Revenue Series 2009C-D Bonds were used to refund the $432.0 million Flexible Term PFC Revenue Notes. The bank participation notes had various maturity dates and interest rates that varied from 0.95% to 1.70%. The bank participation notes required the Airports 83
91 Authority to maintain a reserve account. The reserve account at December 31, 2008, was $3.6 million and is included in PFCs, restricted cash on the Statements of Net Assets. The bank participation notes were backed by a Bank of America, N.A. letter of credit that would have expired on November 16, 2010, but was terminated concurrent with the refunding. Total interest cost for the years ended December 31, 2009 and December 31, 2008 were $3.5 million and $11.5 million, respectively. Balance as of December 31, 2008 $ 432,000,000 PFC Bank Participation Notes Issued - PFC Bank Participation Notes Refunded (432,000,000) Balance as of December 31, 2009 $ - Bond Anticipation Notes On November 1, 2008, the Airports Authority received the proceeds of $150.0 million for a Bond Anticipation Note (BAN) with the Bank of America. The proceeds were used to fund a portion of the Dulles Metrorail Project Phase 1. The BAN was refunded with proceeds from the Series 2009 DTR Revenue Bonds on August 12, Balance as of December 31, 2008 $ 150,000,000 Bond Anticipation Notes Issued - Bond Anticipation Notes Refunded (150,000,000) Balance as of December 31, 2009 $ - Bonds Payable A Master Indenture was created in 1990 for the Aviation Enterprise Fund of the Airports Authority. This Master Indenture was amended effective September 1, 2001, to in part, change the definition of Annual Debt Service to accommodate the issuance of secured commercial paper, to permit the Airports Authority to release certain revenues from the definition of revenues, and to expand the list of permitted investments to include new, safe investment vehicles designed to increase the return on the Airports Authority investments. Under this amended Master Indenture, all bonds are collateralized by a pledge of Net Revenues of the Airports Authority which is senior to the subordinated pledge given by the Airports Authority in connection with the issuance of its bonds prior to In August of 2009, a Master Indenture was created for the DCE Fund of the Airports Authority. Under this Master Indenture, all bonds are secured by a pledge of the Toll Road Revenues derived by the Airports Authority from the operation of the DTR. The pledge of the Toll Road Revenues securing the Series 2009A Bonds, however, is senior to the pledge to Toll Road Revenues securing the Series 2009B Bonds, the Series 2009C Bonds and the Series 2009D Bonds and any additional DTR Second Senior Lien Revenue Bonds or Subordinate Bonds. 84
92 Bonds Payable (Aviation Enterprise Fund) The Aviation Enterprise Fund s long-term bonds issued and outstanding as of December 31, 2009 and 2008 were as follows: Issue Interest Maturing On Outstanding at December 31, Aviation Enterprise Senior Debt Date Rates October 1 Amount Series 1998B Revenue & Refunding Bonds 06/15/1998 Serial 4.700%-5.250% $ 56,305,000 Term 5.000% ,040,000 Term 5.000% ,660,000 Series 1999A Revenue Refunding Bonds 04/15/1999 Serial 4.500% 2010 $ 1,635,000 Term 5.250% ,510,000 Term 5.250% ,885,000 Term 5.250% ,300,000 Serial 5.000% ,320,000 Term 5.000% ,180,000 Series 2001A Revenue Bonds 04/01/2001 Serial 4.375%-5.500% $ 111,105,000 Term 5.500% ,190,000 Term 5.000% ,820,000 Series 2001B Revenue Bonds 04/01/2001 Serial 4.125%-4.750% $ 2,930,000 Term 5.000% ,920,000 Term 5.000% ,005,000 Term 5.000% ,830,000 Series 2002A Revenue Bonds 06/04/2002 Serial 4.300%-5.750% $ 82,125,000 Term 5.125% ,780,000 Term 5.250% ,075,000 Series 2002B Revenue Bonds 06/04/2002 Serial 4.100%-4.300% $ 1,875,000 Series 2002C Refunding Bonds 08/28/2002 Term Variable $ 194,650,000 $ 198,005,000 $ 207,680,000 $ 86,830,000 $ 88,395,000 $ 246,115,000 $ 252,010,000 $ 11,685,000 $ 11,990,000 $ 195,980,000 $ 200,260,000 $ 1,875,000 $ 2,450,000 $ 194,650,000 $ 206,460,000 85
93 Bonds Payable (continued) Issue Interest Maturing On Outstanding at December 31, Aviation Enterprise Senior Debt Date Rates October 1 Amount Series 2002D Refunding Bonds 08/28/2002 Serial 3.750%-5.375% $ 31,890,000 Term 5.000% ,270,000 Term 5.000% ,685,000 Series 2003A Revenue & Refunding Bonds 10/01/2003 Serial 3.750%-5.500% $ 87,615,000 Term 5.125% ,935,000 Term 5.000% ,590,000 Series 2003B Refunding Bonds 10/01/2003 Serial 3.400%-5.250% $ 34,230,000 Series 2003C Revenue & Refunding Bonds 10/01/2003 Serial 4.620%-5.390% $ 14,985,000 Term 5.740% ,935,000 Term 6.000% ,880,000 Series 2003D Revenue Bonds 10/01/2003 Term Variable $ 135,425,000 Series 2004A Refunding Bonds 08/26/2004 Term 3.750% 2014 $ 50,000 Serial 4.50%-5.000% ,510,000 Series 2004B Revenue Bonds 05/18/2004 Serial 5.000% 2027 $ 25,000,000 Serial 5.050% ,330,000 Term 5.000% ,670,000 Series 2004C-1 Refunding Bonds 07/07/2004 Serial 5.000% $ 56,900,000 Series 2004C-2 Revenue Bonds 08/12/2004 Term 5.000% 2022 $ 32,605,000 Serial 5.000% ,690,000 $ 93,845,000 $ 96,050,000 $ 165,140,000 $ 168,735,000 $ 34,230,000 $ 34,230,000 $ 40,800,000 $ 42,920,000 $ 135,425,000 $ 138,175,000 $ 13,560,000 $ 13,570,000 $ 250,000,000 $ 250,000,000 $ 56,900,000 $ 56,900,000 $ 99,295,000 $ 99,390,000 86
94 Bonds Payable (continued) Issue Interest Maturing On Outstanding at December 31, Aviation Enterprise Senior Debt Date Rates October 1 Amount Series 2004D Refunding Bonds 08/26/2004 Serial 4.100%-5.250% $ 201,885,000 Series 2005A Revenue Bonds 04/12/2005 Serial 3.600%-5.250% $ 118,410,000 Term 4.750% ,290,000 Term 5.000% ,740,000 Series 2005B Refunding Bonds 04/12/2005 Serial 3.500%-5.250% $ 19,775,000 Series 2005C Revenue Bonds 04/12/2005 Serial 5.590% 2025 $ 8,315,000 Serial 5.690% ,350,000 Serial 5.730% ,335,000 Series 2005D Revenue Bonds 10/12/2005 Serial 5.000% 2010 $ 1,330,000 Serial 5.000% ,650,000 Series 2006A Revenue Bonds 01/25/2006 Serial 4.750% 2030 $ 12,500,000 Term 5.000% ,555,000 Term 5.000% ,945,000 Series 2006B Revenue Bonds 12/06/2006 Serial 4.550% 2031 $ 59,020,000 Serial 5.000% ,710,000 Term 5.000% ,270,000 Series 2006C Refunding Bonds 12/06/2006 Serial 3.750%-5.000% $ 25,730,000 Term 4.375% ,595,000 Series 2007A Refunding Bonds 07/03/2007 Serial 4.750%-5.000% $ 150,205,000 $ 201,885,000 $ 217,120,000 $ 290,440,000 $ 298,365,000 $ 19,775,000 $ 19,775,000 $ 30,000,000 $ 30,000,000 $ 8,980,000 $ 10,245,000 $ 300,000,000 $ 300,000,000 $ 400,000,000 $ 400,000,000 $ 37,325,000 $ 37,865,000 $ 150,205,000 $ 157,505,000 87
95 Bonds Payable (continued) Issue Interest Maturing On Outstanding at December 31, Aviation Enterprise Senior Debt Date Rates October 1 Amount Series 2007B Revenue Bonds 09/27/2007 Serial 4.000%-5.000% $ 418,135,000 Serial 4.750% ,150,000 Term 5.000% ,225,000 Term 5.000% ,360,000 Series 2008A Revenue Bonds 06/24/ %-5.750% $ 250,000,000 Series 2009A Revenue Bonds Term 04/01/2009 Variable $ 163,175,000 Series 2009B Revenue Bonds 04/01/2009 Serial 3.000%-5.250% $ 173,920,000 Term 5.000% ,450,000 Term 5.000% ,455,000 $ 508,870,000 $ 519,665,000 $ 250,000,000 $ 250,000,000 $ 163,175,000 $ - $ 236,825,000 $ - Series 2009C Revenue Bonds 07/02/2009 Serial 3.000%-5.25% $ 181,905,000 Term 5.125% ,405,000 Term 5.125% ,125,000 Term 5.625% ,000,000 $ 314,435,000 $ - Series 2009D Revenue Bonds Term 07/02/2009 Variable $ 136,825,000 $ 136,825,000 $ - $ 4,873,075,000 $ 4,109,755,000 Plus (less) unamortized discount/premium, net $ 20,469,311 $ 18,210,779 Total Aviation Enterprise Senior Debt $ 4,893,544,311 $ 4,127,965,779 * Portions of Series 1998A and 2002B Revenue Bonds were refunded on December 6, 2006, with fixed rate debt. 88
96 Bonds Payable (Dulles Corridor Enterprise Fund) Issue Interest Maturing On Outstanding at December 31, Dulles Corridor Enterprise Date Rates October 1 Amount Series 2009A Revenue Bonds 08/12/2009 Term 5.125% 2032 $ 22,140,000 Term 5.000% ,735,000 Term 5.250% ,125,000 Series 2009B Revenue Bonds Term 08/12/ %-7.910% $ 212,127,142 Series 2009C Revenue Bonds 08/12/2009 Serial 6.500% $ 162,212,626 $ 198,000,000 $ - $ 212,127,142 $ - $ 162,212,626 $ - Series 2009D Revenue Bonds 08/12/2009 Serial 7.462% $ 400,000,000 $ 400,000,000 $ - $ 972,339,768 $ - Plus (less) unamortized discount/premium, net $ (5,224,888) $ - Total Dulles Corridor Enterprise Debt $ 967,114,880 $ - Changes in Bonds Payable Balances Aviation Enterprise Senior Debt Balance as of December 31, 2009 $ 4,127,965,779 Bonds issued Series 2009A Revenue Bonds $ 163,175,000 Series 2009B Revenue Bonds $ 236,825,000 Series 2009C Revenue Bonds $ 314,435,000 Series 2009D Revenue Bonds $ 136,825, ,260,000 Principal payments (90,475,000) Change in unamortized discount/premium, net 2,258,532 Balance as of December 31, 2009 $ 4,891,009,311 Balance as of December 31, short-term 107,130,000 Balance as of December 31, long-term 4,783,879,311 Total Aviation Enterprise Senior Debt $ 4,891,009,311 89
97 Dulles Corridor Enterprise Balance as of December 31, 2009 $ - Bonds issued Series 2009A Revenue Bonds $ 198,000,000 Series 2009B Revenue Bonds $ 207,056,688 Series 2009C Revenue Bonds $ 158,234,960 Series 2009D Revenue Bonds $ 400,000, ,291,648 Accretion of Capital Appreciation Bonds 9,048,120 Change in unamortized discount/premium, net (5,224,888) Balance as of December 31, 2009 $ 967,114,880 Balance as of December 31, short-term - Balance as of December 31, long-term 967,114,880 Total Dulles Corridor Enterprise Debt $ 967,114,880 Recent Bond Issues In March of 2009, the Airports Authority issued $163.2 million of Airport System Revenue Variable Rate Series 2009A Bonds, the proceeds of which were used to refund a portion of outstanding commercial paper, and issued $236.8 million of fixed rate Airport System Revenue Series 2009B Bonds, the proceeds of which were used to refund a portion of outstanding commercial paper, to fund the swap termination payment, and to fund Capital Construction Program expenditures. In August 2009, the Airports Authority issued $314.4 million of Airport System Revenue Series 2009C Bonds and $136.8 million of Airport System Revenue Variable Rate Series 2009D Bonds to refinance the Flexible Term PFC Revenue Notes. Also in August 2009, the Airports Authority issued $963.3 million of Dulles Toll Road Revenue Bonds Series 2009A-D, the proceeds of which were used to pay a portion of the Dulles Metrorail Project, Dulles Toll Road Capital Improvements, and refund the $150.0 million Dulles Toll Road BAN. Insurers The Airports Authority reviews each bond sale to determine if there is value in providing investors municipal bond insurance. Aviation Enterprise bonds insurance is provided in part by American Municipal Bond Assurance Corporation (Ambac), Berkshire Hathaway (BHAC), Financial Guaranty Insurance Company (FGIC), National Public Finance Guarantee Corporation, previously known as Municipal Bond Investors Assurance Corporation (MBIA), Financial Security Assurance (FSA), and Syncora Guarantee, previously known as XL Capital Assurance (XL). The Dulles Corridor Enterprise bonds insurance is provided in part by Assured Guaranty (AG). 90
98 The following table details the Airports Authority s outstanding debt noting insured and uninsured bonds. Bond Principal Uninsured Insured Insurance Series Outstanding Bonds Bonds Provider Aviation Enterprise Senior Debt 1998B $ 198,005,000 $ - $ 198,005,000 MBIA 1999A 86,830,000-86,830,000 FGIC 2001A 246,115, ,115,000 MBIA 2001B 11,685,000-11,685,000 MBIA 2002A 195,980, ,980,000 FGIC 2002B 1,875,000-1,875,000 FGIC 2002C 194,650, ,650,000 FSA 2002D 93,845,000-93,845,000 FSA 2003A 165,140, ,140,000 FGIC 2003B 31,695,000-31,695,000 FGIC 2003C 40,800,000-40,800,000 FGIC 2003D 135,425, ,425,000 XL 2004A 13,560,000-13,560,000 MBIA 2004B 250,000, ,000,000 FSA 2004C-1 56,900,000-56,900,000 FSA 2004C-2 99,295,000-99,295,000 FSA 2004D 201,885,000 20,570, ,315,000 MBIA 2005A 290,440, ,440,000 MBIA 2005B 19,775,000-19,775,000 MBIA 2005C 30,000,000-30,000,000 MBIA 2005D 8,980,000-8,980,000 Ambac 2006A 300,000, ,000,000 FSA 2006B 400,000, ,000,000 FGIC 2006C 37,325,000-37,325,000 FGIC 2007A 150,205, ,205,000 Ambac 2007B 508,870, ,870,000 Ambac 2008A 250,000, ,000, A 163,175, ,175, B 236,825, ,625, ,200,000 BHAC 2009C 314,435, ,435, D 136,825, ,825, Total Aviation Enterprise Senior Debt $ 4,870,540,000 $ 1,009,630,000 $ 3,860,910,000 Dulles Corridor Enterprise 2009A $ 198,000,000 $ 198,000,000 $ B 212,127,142 19,361, ,765,318 AG 2009C 162,212, ,212,627 AG 2009D 400,000, ,000, Total Dulles Corridor Enterprise Debt $ 972,339,769 $ 617,361,824 $ 354,977,945 $ 5,842,879,769 $ 1,626,991,824 $ 4,215,887,945 91
99 The following is a summary of the maturities and sinking fund requirements, not including any unamortized discount or premium. Scheduled principal payments on long term bonds are due annually on October 1. Aviation Enterprise Senior Debt Year Ending Total December 31 Principal Interest Debt Service 2010 $ 107,130,000 $ 239,859,819 $ 346,989, ,450, ,878, ,328, ,200, ,715, ,915, ,645, ,625, ,270, ,155, ,133, ,288, ,140, ,868,528 1,802,008, ,375, ,395,019 1,724,770, ,770, ,678,372 1,376,448, ,167,555, ,092,055 1,445,647,055 Thereafter 420,120,000 41,738, ,858,757 $ 4,870,540,000 $ 3,706,985,709 $ 8,577,525,709 Dulles Corridor Enterprise Debt Year Ending Total December 31 Principal Interest Debt Service 2010 $ - $ 45,434,205 $ 45,434, ,990,987 39,990, ,822,305 39,990,987 45,813, ,174,435 39,990,988 49,165, ,270,929 39,990,987 44,261, ,266, ,661, ,927, ,013, ,131, ,145, ,439, ,131, ,571, ,122, ,628, ,750,049 Thereafter 765,230, ,999,915 1,251,230,062 $ 972,339,769 $ 1,779,950,799 $ 2,752,290,568 Total interest costs for the years ended December 31, 2009 and 2008 were $219.9 million and $201.8 million, respectively. The current portion of the Airports Authority s bond payable, in the amount of $107.1 million, is due on October 1, Special Facility Revenue Bonds In March 1991, the Airports Authority issued $14.2 million of Special Facility Revenue Bonds on behalf of Caterair International Corporation (Caterair). The bonds were issued to finance the construction of an In-flight Kitchen Facility at Reagan National. 92
100 The Special Facility Revenue Bonds and related costs are payable only with funds from Caterair. Since these bonds do not represent a claim on the Airports Authority s assets, nor do they require the Airports Authority to incur future obligations, they have not been recorded in the Airports Authority s financial statements. Arbitrage - Rebate Liability The United States Treasury has issued regulations on calculating the rebate due to the United States Government on arbitrage profits and determining compliance with the arbitrage rebate provisions of the Tax Reform Act of Arbitrage profits arise when the Airports Authority temporarily invests the proceeds of tax exempt debt in securities with higher yields. The Airports Authority has an estimated liability on December 31, 2009 and 2008 of $1.6 million and $3.1 million, respectively. L. AIRPORT USE AGREEMENT AND PREMISES LEASE In February 1990, the Airports Authority entered into a long-term agreement with the major Airlines serving the Airports. The Agreement is for a term of 25 years, subject to cancellation rights by the Airports Authority after 15 years, and annually thereafter, at the option of the Airports Authority. The Agreement provides for the calculation of annual rates and charges, with rate adjustments at midyear, or any time revenues fall 5.0% or more below projections to provide for full cost recovery plus debt service coverage. The Agreement also provides for an annual settlement whereby the rates and charges are recalculated using audited financial data to determine any airline over/underpayment. For the year ended December 31, 2009, the settlement resulted in a net charge to the Airlines of $7.9 million. Rates and charges are established to provide net revenues before the payment of debt service of at least 125.0% of debt service. Net Remaining Revenues (NRR) are defined as revenues less all operating and maintenance expenses, debt service, specified reserves, and other requirements. Subsequent to the final determination, NRR is allocated between the Airports Authority and the Airlines in accordance with the Agreement. The Airports Authority s share of NRR is reflected in the Airports Authority s Capital Fund and is available for repair and rehabilitation projects or any other lawful purpose. The Airlines share of NRR, called Transfers, is used in the calculation of the subsequent year s rates and charges. All calculations are done in accordance with the Agreement. To calculate Transfers, the Agreement establishes a plateau amount of $8.0 million at Reagan National and $12.0 million at Dulles International, escalated by the implicit price deflator index from the base year of 1989 to the current year. NRR is shared approximately 50/50 until reaching the plateau. When the Transfer amount to the Airlines reaches the plateau, the amount over the plateau is allocated 75.0% to the Airlines and 25.0% to the Airports Authority. For the years ended December 31, 2009 and 2008, at Dulles International, the Transfer exceeded the plateau amount by $13.4 million and $16.9 million, respectively. For the year ended December 31, 2009, at Reagan National, the Transfer did not exceed the plateau amount. For the year ended December 31, 2008 at Reagan National, the Transfer exceeded the plateau amount by $1.5 million. These amounts were allocated accordingly and are included in the Airlines and the Airports Authority s share. For the years ended December 31, 2009 and 2008, the Airlines Transfer was $65.8 million and $72.4 million, respectively, and the Airports Authority s share of NRR was $40.7 million and $37.9 million, respectively. 93
101 M. NET ASSETS Net assets consist of the following: Invested in Capital Assets Net of Related Debt consists of the following: Aviation 2009 Total Business- Enterprise DCE Type Activities Long-term assets Land and other non-depreciable assets $ 121,734,710 $ - $ 121,734,710 Construction in progress 1,630,063,189 2,216,052 1,632,279,241 Construction in progress, Metrorail project - 742,560, ,560,712 Buildings, systems and equipment 5,030,351, ,943 5,031,113,184 Less: accumulated depreciation (1,637,640,970) (177,366) (1,637,818,336) Total capital assets 5,144,508, ,361,341 5,889,869,511 Less: related liabilities Current portion bonds payable 107,130, ,130,000 Commercial paper notes 215,000, ,000,000 Bonds payable, net 4,334,411, ,249,297 4,687,660,561 Total liabilities 4,656,541, ,249,297 5,009,790,561 Invested in capital assets,net of related debt $ 487,966,906 $ 392,112,044 $ 880,078,950 Restricted assets consists of the following: Restricted assets Cash and cash equivalents $ 152,253,857 $ 368,559,910 $ 520,813,767 Passenger facility charges cash 54,564,484-54,564,484 Passenger facility charges receivable 6,422,745-6,422,745 Grants receivable 7,140,958 80,425,796 87,566,754 Long-term investments 451,355,340 92,127, ,482,451 Bond issuance costs, net 67,299,782 39,264, ,563,906 Prepaid expenses and other current assets - 17,952 17,952 Investments 3,185, ,080, ,266,160 Total assets 742,222, ,475,503 1,664,698,219 Less: liabilities payable from restricted assets Accounts payable and accrued expenses 36,271,474 42,288,064 78,559,538 Accrued interest payable 57,660,321 14,536,406 72,196,727 Other liabilities 1,615,164 38,130 1,653,294 Interest rate swaps payable 69,187,075-69,187,075 Debt related to unspent bond proceeds 449,468, ,865,584 1,063,333,629 Total liabilities 614,202, ,728,184 1,284,930,263 Restricted net assets $ 128,020,637 $ 251,747,319 $ 379,767,956 94
102 Unrestricted assets consists of the following: Aviation 2009 Total Business- Enterprise DCE Type Activities Current assets Cash and cash equivalents $ 47,928,844 $ 31,476,254 $ 79,405,098 Investments 266,348, ,348,779 Accounts receivables, net 35,140, ,643 35,254,120 Inventory 8,061,986 32,795 8,094,781 Prepaid expenses and other current assets 8,006,423 1,705,504 9,711,927 Total current assets 365,486,509 33,328, ,814,705 Long-term assets Long-term investments 65,005,339-65,005,339 Net pension assets and other post-employment benefits assets 3,528,691-3,528,691 Other long-term assets 16,553,865-16,553,865 Total unrestricted assets 450,574,404 33,328, ,902,600 Less: current liabilities Accounts payable and accrued expenses 71,688,570 4,419,033 76,107,603 Due to/due from other funds (6,293,407) 6,293,407 - Operating lease obligations 341, ,140 Total current liabilities 65,736,303 10,712,440 76,448,743 Less: Non-current liabilities Other liabilities 1,160,156 5,698 1,165,854 Unrestricted net assets $ 383,677,943 $ 22,610,059 $ 406,288,003 95
103 Invested in Capital Assets Net of Related Debt consists of the following: Aviation DCE Total Business- Enterprise Enterprise Type Activities Long-term assets Land and other non-depreciable assets $ 121,734,710 $ - $ 121,734,710 Construction in progress 1,776,370,046-1,776,370,046 Construction in progress, Metrorail project - 362,322, ,322,546 Buildings, systems and equipment 4,508,943, ,963 4,509,110,199 Less: accumulated depreciation (1,461,796,180) (82,953) (1,461,879,133) Total capital assets 4,945,251, ,406,556 5,307,658,368 Less: related liabilities Current portion bonds payable 90,475,000-90,475,000 Bank participation notes/bond anticipation notes 432,000,000 84,869, ,869,016 Commercial paper notes 217,500, ,500,000 Bonds payable, net 3,784,462,649-3,784,462,649 Total liabilities 4,524,437,649 84,869,016 4,609,306,665 Invested in capital assets,net of related debt $ 420,814,163 $ 277,537,540 $ 698,351,703 Restricted assets consists of the following: Restricted assets Cash and cash equivalents $ 170,767,057 $ 114,300,144 $ 285,067,201 Passenger facility charges, cash 12,604,557-12,604,557 Passenger facility charges and interest receivables 5,581,130 1,710 5,582,840 Grants receivable 23,906,251 15,690,443 39,596,694 Long-term investments 400,987, ,987,362 Bond issuance costs, net 60,712,709 25,081 60,737,790 Prepaid expenses and other current assets - 848, ,277 Investments 3,902,129-3,902,129 Total assets 678,461, ,865, ,326,850 Less: liabilities payable from restricted assets Accounts payable and accrued expenses 65,398,716 39,550, ,949,206 Accrued interest payable 54,013,642-54,013,642 Other liabilities 3,106,529-3,106,529 Interest rate swaps payable 208,671, ,671,941 Debt related to unspent bond proceeds 253,028,130 54,272, ,300,311 Total liabilities 584,218,958 93,822, ,041,629 Restricted net assets $ 94,242,237 $ 37,042,984 $ 131,285,221 96
104 Unrestricted assets consists of the following: Aviation DCE Total Business- Enterprise Enterprise Type Activities Current assets Cash and cash equivalents $ 26,982,791 $ 11,011,856 $ 37,994,647 Investments 235,399, ,399,596 Accounts receivables, net 22,541, ,287 23,085,767 Inventory 6,796,319-6,796,319 Prepaid expenses and other current assets 7,812,490 3,821,244 11,633,734 Total current assets 299,532,676 15,377, ,910,063 Long-term assets Long-term investments 71,747,636-71,747,636 Net pension assets and other post-employment benefits asset 4,755,914-4,755,914 Other long-term assets 18,192,128-18,192,128 Total unrestricted assets 394,228,354 15,377, ,605,741 Less: current liabilities Accounts payable and accrued expenses 53,560,971 1,863,476 55,424,447 Due to/due from other funds (7,413,995) 7,413,995 - Operating lease obligations 341, ,140 Total current liabilities 46,488,116 9,277,471 55,765,587 Less: Non-current liabilities Debt related to unspent bond proceeds - 11,245,689 11,245,689 Unrestricted net assets $ 347,740,238 $ (5,145,773) $ 342,594,465 N. LEASE COMMITMENTS Property Held for Lease The Airports Authority has entered into various operating leases with tenants for the use of space at the Airports Authority s facilities including buildings, terminals, and customer service areas. The lease terms include a minimum fixed fee as well as contingent fees based on the tenants volume of business. All the leases provide for a periodic review and redetermination of the rental amounts. Minimum future rentals scheduled to be received on operating leases that have initial or remaining non-cancelable terms in excess of one year are: 97
105 Year ending December 31, 2010 $ 338,072, ,842, ,635, ,778, ,799, and thereafter 1,325,405,870 Total minimum future rentals $ 2,895,534,545 The above amounts do not include contingent rentals and fees in excess of minimums, which amounted to $13.7 million for the year ended December 31, The portion of property associated with minimum rentals derived from operating leases was capitalized prior to June 7, 1987, and ownership was retained by the United States Government. Use of this property is provided to the Airports Authority under its operating lease with the United States Government. Accordingly, the cost of this property is not reflected in the financial statements of the Airports Authority. On December 15, 2003, the operating period of the lease of land and provision for services to the Stephen F. Udvar-Hazy Center (the Center) began. The lease agreement grants the Smithsonian Institute the right to occupy, develop, operate, control and use the Center premises located on land at Dulles International and obtain services from the Airports Authority for police, fire, emergency, and ambulance needs. This lease expires in The operating period was preceded by a construction period. Commencing with the operating period the Smithsonian Institute will pay the Airports Authority for the services provided. The lease provides for periodic reconciliation payments and updated payments for services provided. Property Leased from Others On June 7, 1987, the United States Government transferred Reagan National s and Dulles International s real properties to the Airports Authority under a 50-year lease, with extensions negotiable. The lease was amended effective June 17, 2003, to extend the term from 50 to 80 years, with expiration date of June 6, Upon expiration of the lease, the Airports and facilities, including improvements, will be returned to the United States Government. The lease requires annual rental payments of $3.0 million, with subsequent annual rental payments adjusted for inflation. The Airports Authority invests the monthly lease payments in repurchase agreements or certificates of deposit and makes semi-annual payments, including interest, to the United States Government. The 2009 and 2008 payments to the United States Government, including interest, total $5,067,887 and $4,973,788, respectively. Minimum future rentals scheduled to be paid on the operating leases in effect on December 31, 2009, as calculated in 2009 dollars are: 98
106 Year ending December 31, 2010 $ 5,066, ,066, ,066, ,066, ,066, and thereafter 268,501,671 Total minimum future rentals $ 293,832,016 Total rental expense for the years ended December 31, 2009 and 2008 were $5.1 million and $5.0 million, respectively. On July 23, 2007, the Airports Authority entered into a lease with the California State Teachers Retirement System for approximately 26,084 rentable square feet of office space located at 1593 Spring Hill Road, Vienna, Virginia, The rent commencement date was January 1, 2008, and the lease term expires on July 31, This office space is used by the Dulles Metrorail Project personnel and expenditures are capitalized as construction in progress. The lease was amended on February 25, 2008, to extend the Airports Authority s one-time right of early termination from March 1, 2008 to June 1, The lease was further amended on September 25, 2009, to add approximately 5,949 rentable square feet, and extending the lease term until February 28, The rent commencement date on the additional 5,949 rentable square feet was January 1, The 2009 and 2008 capitalized expenditures related to the space leased from the California State Teachers Retirement System totaled $885 thousand and $861 thousand, respectively. Minimum future rent payments, as calculated in 2009 dollars are: Year Ending December 31, 2010 $ 1,076, ,108, ,141, , ,899 Total minimum future rentals $ 4,017,083 O. OTHER COMMITMENTS AND CONTINGENCIES At December 31, 2009, the Aviation Enterprise had outstanding commitments for capital expenditures in connection with its CCP in the amount of $265.7 million and the DCE had $1.4 billion in outstanding commitments for capital expenditures associated with its Dulles Metrorail Project. However, services have not been provided as of December 31, 2009, and accordingly no liability has been recorded in the accompanying financial statements. 99
107 P. GOVERNMENT GRANTS The Airports Authority receives, on a cost-reimbursement basis, grants from the United States government and the Commonwealth for certain operating and capital construction programs. As a recipient of federal and state financial assistance, the Airports Authority is responsible for maintaining an internal control structure that ensures compliance with all laws and regulations related to these programs. Total federal and state grant expenditures for the years ended December 31, 2009 and 2008 were $349.8 million and $90.6 million, respectively. All grant expenditures are subject to financial and compliance audits by the grantors as well as during the Airports Authority s annual Office of Management and Budget (OMB) A-133 Single Audit process. The Airports Authority estimates that no material disallowances will result from any such audits. In fiscal years 2009 and 2008, the Airports Authority recognized federal and state grants for operating and capital programs as summarized below: Aviation Operating Programs Award Remaining Award Recognized December 31, Law Enforcement Officer Reimbursement Program $ 3,511,783 $ 1,259,953 $ 1,278,646 DHS TSA National Explosives Detection Canine Team Program 1,931, , ,500 Drug Seizure Program (DEA) - 238, ,902 Drug Seizure Program (Drug Funds) - 217, Drug Seizure Program (ICE) - 141,210 75,052 Department of Justice (Presidental Inaugural Activities) - 103,051 - Arlington County Grant (HIDTA Task Force) - 43,902 14,254 Department of the Interior (Presidental Inaugural Activities) - 15,416 - Disaster Relief and Emergency Assistance - 1,537 22,377 Contract Baggage Handler Demonstration Program ,263 Homeland Security Grant Program - - 1,281 Bureau of Justice (Bulletproof Vest Partnership Program) The Law Enforcement Officer Reimbursement Program offsets expenses incurred by the Airports Authority s Public Safety personnel serving a support role to the TSA. Explosives detection funds are used to offset the expense of training and caring for canines used in explosives detection. The Drug Enforcement Agency (DEA) Drug Seizures Program and the U.S. Customs Drug Seizures Program are collaborative efforts between the Agencies and the Airports Authority s police department wherein both entities share in the proceeds from the sale of confiscated items. The Airports Authority s proceeds may only be used for certain types of expenses defined by the DEA and Customs. 100
108 Capital Programs Aviation Capital Program Award Remaining Award Recognized December 31, Federal grants for construction - Runway Rehabilitation 1C/19C $ 7,472,051 $ 14,345,894 $ - Federal grants for construction - 4th Runway 86,324,828 3,798,520 - Federal grants for construction - SBB In-Line Baggage EDS Project 34,710,844 3,487,021 2,844,568 Federal grants for construction - Closed Circuit Television Camera Installation 11,368, ,285 - Federal grants for construction - Runway Safety Area Improvement 291, ,667 - Federal grants for construction - Under Vehicle Inspection System - Gatekeeper - 7,500 - State grants for construction - Virginia Department of Aviation 2,000,000 2,666,667 1,358,333 DCE Capital Program Award Remaining Award Recognized December 31, Federal grants for construction - Dulles Corridor Metrorail Project $ 691,043,702 $ 192,375,293 $ 84,155,512 State grants for construction - Commonwealth Transportation Bonds 66,586,913 50,000,000 - Local funds for construction - Fairfax County 498,750,000 76,021,168 - Build America Bonds - construction interest, and subsidy - 4,067,398 - The Airports Authority Aviation Enterprise Fund receives federal and state grants in support of its CCP. The federal programs, primarily through the FAA s Airport Improvement Program (AIP), including annual entitlement grants, provide funding for airport development, airport planning and noise compatibility programs from the Airports and Airways Trust Funds in the form of entitlement and discretionary grants for eligible projects. The Commonwealth also provides discretionary funds for capital programs. The Airports Authority also participated in a pilot program with the TSA designed to improve the effectiveness of the TSA s baggage screening process. The DCE Fund receives federal, state and county grants in support of its Dulles Metrorail Project. The federal program is primarily through the FTA. Q. LITIGATION Legal counsel has advised that, while a number of claims in the normal course of business are outstanding, there were no matters outstanding which could have a material adverse effect on the financial statements of the Airports Authority. R. PASSENGER FACILITY CHARGES As described in Note A, PFCs are collected in accordance with the FAA regulations allowing airports to impose a $4.50 PFC. For the years ended December 31, 2009 and 2008, the Airports Authority earned PFCs of $34.9 million and $35.0 million for Reagan National, respectively, and $43.6 million and $
109 million for Dulles International, respectively. In accordance with the regulations, based on the approval date from the FAA and continuing through the PFC collection period, the FAA reduces the Airports Authority s share of entitlement grants by 75.0%. S. RISK MANAGEMENT The Airports Authority is exposed to a variety of risks or losses related to operations (i.e., injuries to employees, injuries to members of the public or damage to their property, and damage to the Airports Authority s property). Since 2002, the Airports Authority has maintained accruals to finance its selfinsured risk of loss. The Airports Authority purchases commercial insurance for claims in excess of amounts provided by these accounts. All offices within the Airports Authority are covered under these accounts. The accruals are determined by the Risk Management Department based on insurance claim practices and actuarial estimates for prior and current-year claims. The overall accrual for losses is $5.6 million and $5.2 million as of December 31, 2009 and 2008, respectively, and is included in accounts payable and accrued expenses in the Statements of Net Assets. This is based on the requirements of GASB Statement No. 30, Risk Financing Omnibus (GASB 30), which requires that a liability for claims be reported if information prior to the issuance of the financial statements indicates that it is probable that a liability has been incurred at the date of the financial statements and the amount of the loss can be reasonably estimated. Changes in the claim liability accounts in fiscal years 2009 and 2008 and 2007 were: Fiscal Beginning Claims and Changes Claim Ending Year Balance in Estimates Payments Balance 2007 $4,478,933 $2,475,680 $1,682,027 $5,272, $5,272,586 $2,624,925 $2,682,772 $5,214, $5,214,739 $4,027,539 $3,657,577 $5,584,701 Settlements did not exceed insurance coverage for the past three years. T. FAIR VALUE OF FINANCIAL INSTRUMENTS The following methods and assumptions were used to estimate the fair value of each class of financial instruments for which it is practicable to estimate that value: Cash and Short Term Investments The carrying amount of cash and short-term investments approximates fair value because the maturity of those instruments is three months or less. 102
110 Long-Term Investments For securities held as long-term investments, fair value equals quoted market prices, if available. If a quoted market price is not available, fair value is estimated based upon quoted market prices for securities with similar characteristics (see Note C). Long-Term Debt The fair value of the Airports Authority s long-term debt is estimated based on the quoted market prices for the same or similar issues or on the current rates offered to the Airports Authority for debt of the same remaining maturities. The carrying value of the Airports Authority s Bonds payable and CP Notes payable as of December 31, 2009, is $6.1 billion with an estimated market value of $6.2 billion. Interest Rate Swap The fair value of interest rate swaps is the estimated amount that the Airports Authority would pay (or receive) to terminate the Swap Agreements at the reporting date, taking into account current interest rates and the current creditworthiness of the swap counterparties (see Note D). U. Voluntary Separation Incentive Program In 2009, the Airports Authority established a Voluntary Separation Incentive Program (VSIP) for up to forty-eight employees in its Mobile Lounge department at Dulles International. The VSIP offered each employee a one-time special payment allowance of $25 thousand and the right to continue medical and dental benefits under the continuation health coverage provisions of Title X of the Consolidated Omnibus Budget Reconciliation Act of 1986 (COBRA) or, if eligible, enroll in the retiree medical and dental insurance plans upon separation from service. In exchange, the employee agreed to separation or retirement from the Authority within fourteen days following the date upon which the AeroTrain became operational. Forty-one employees entered into an agreement with the Airports Authority and fulfilled their obligations to the Airports Authority under the terms of this VSIP. In accordance with GASB Statement No. 47, Accounting for Termination Benefits (GASB 47), as this was a voluntary termination agreement, a liability was established when the employees accepted the offer and the amounts could be determined. The total liability established was $1.1 million and included the one-time special payment allowance and associated payroll taxes. No liability was established for the continuation of medical and dental benefits, as COBRA benefits are paid by the employee, less a 65.0% subsidy provided by the Federal government through the American Recovery and Reinvestment Act (ARRA) of 2009, as extended by the Temporary Extension Act of 2010, or through postemployment benefits for employees who retired (see Note J). The liability of $1.1 million was outstanding as of December 31,
111 INTENTIONALLY LEFT BLANK
112
113 Statistical This part of the Airports Authority s comprehensive annual financial report presents detailed information as a context for understanding what the information in the financial statements and note disclosures says about the Airports Authority s overall financial health. Contents Page Financial Trends: These schedules contain trend information to help the reader understand how the Airports Authority s financial performance and well being have changed over time. S-1 Total Annual Revenues, Expenses and Changes in Net Assets S-2 Operating Expenses by Function Revenue Capacity: These schedules contain information to help the reader assess the factors affecting the Airports Authority s ability to generate airline and non-airline revenues. S-3 Revenues by Source S Ronald Reagan Washington National Airport Revenues S Washington Dulles International Airport Revenues S-6 Scheduled Airlines Rates and Charges Debt Capacity: These schedules present information to help the reader assess the affordability of the Airports Authority s current levels of outstanding debt and the Airports Authority s ability to issue additional debt in the future. S-7 Ratios of Outstanding Debt S-8 Revenue Bond Debt Service Coverage S-9 Revenue Bond Coverage Demographic and Economic Information: These schedules offer demographic and economic indicators to help the reader understand the environment within which the Airports Authority s financial activities take place and to help make comparisons over time and with other airports. S-10 Airport Information Ronald Reagan Washington National S-11 Airport Information Washington Dulles International S-12 Major Private Employers in Primary Air Trade Area
114 S-13 Employment by Industry S-14 Population Trends Operating Information: These schedules contain information about the Airports Authority s operations and resources to help the reader understand how the Airports Authority s financial information relates to the services the Airports Authority provides and the activities it performs. S-15 Airports Authority Employee Strength S-16 Aircraft Operations by Airport S-17 Landed Weights Ronald Reagan Washington National S-18 Landed Weights Washington Dulles International S-19 Enplanements Ronald Reagan Washington National S-20 Enplanements Washington Dulles International S-21 Enplanement Market Share Ronald Reagan Washington National S-22 Enplanement Market Share Washington Dulles International S-23 Cargo Market Share Enplaned Ronald Reagan Washington National S-24 Cargo Market Share Enplaned Washington Dulles International S-25 Passenger Facility Charges S-26 Primary Origination and Destination Passenger Markets Ronald Reagan Washington S-27 Primary Origination and Destination Passenger Markets Washington Dulles International S-28 Dulles Toll Road Transactions S-29 Schedule of Insurance ( ) Operations Program S-30 Schedule of Insurance ( ) Dulles Toll Road & Dulles Rail Program (Specific) S-31 Schedule of Insurance ( ) OCWIP Program S-32 Schedule of Insurance ( ) Utility Relocation & Non-Dulles Transit Partners Construction (Dulles Rail) 106
115 Annual Revenues, Expenses and Changes in Net Assets Exhibit S-1 (Expressed in Thousands) TOTAL REVENUES OPERATING REVENUES Concessions $ 217,413.7 $ 223,710.7 $ 217,486.8 $ 199,011.3 $ 198,691.2 $ 173,962.7 $ 146,095.9 $ 132,817.9 $ 124,641.5 $ 144,060.8 Tolls and other 64, , Rents 193, , , , , , , , , ,658.5 Design fees , Landing fees 96, , , , , , , , , ,757.5 Utility sales 13, , , , , , , , , ,113.0 Passenger fees 30, , , , , , , , , ,898.1 Other 6, , , , , , , , , ,000.6 TOTAL OPERATING REVENUES 623, , , , , , , , , ,488.5 TOTAL EXPENSES OPERATING EXPENSES Materials, equipment, supplies, contract services and other 172, , , , , , , , , ,389.7 Impairment loss/design costs , Salaries and related benefits 144, , , , , , , , , ,970.5 Utilities 28, , , , , , , , , ,592.4 Lease from U.S. Government 5, , , , , , , , , ,058.4 Depreciation and amortization 182, , , , , , , , , ,726.6 TOTAL OPERATING EXPENSES 532, , , , , , , , , ,737.6 OPERATING INCOME 90,787.9 (4,437.3) 31, , , , , , , ,750.9 NON-OPERATING REVENUES (EXPENSES) Passenger facility charges, financing costs (944.8) (2,330.5) (3,968.8) (2,026.4) (1,497.1) (1,525.0) (1,137.7) (2,029.2) (4,537.8) (7,028.9) Investment income 15, , , , , , , , , ,551.9 Interest expense (144,510.1) (122,984.3) (111,534.1) (96,999.8) (103,561.3) (89,368.8) (95,610.1) (98,256.1) (93,132.4) (96,627.0) Federal compensation net of transfers , , Fair value gain (loss) on swaps 104,466.9 (178,810.7) (24,577.7) (14,572.3) 1,205.8 (2,060.7) 5,572.3 (26,024.2) (1,567.0) 0.0 TOTAL NON-OPERATING REVENUES (EXPENSES) (25,840.4) (266,133.7) (84,522.8) (68,563.3) (83,658.1) (82,568.7) (85,279.3) (110,246.1) (43,352.2) (78,104.0) GAIN (LOSS) BEFORE CAPITAL CONTRIBUTIONS (DISTRIBUTIONS) 64,947.5 (270,571.0) (52,602.8) (20,430.9) (20,845.7) (18,576.4) (60,947.3) (82,057.8) (16,005.1) (12,353.1) CAPITAL CONTRIBUTIONS Passenger facility charges 78, , , , , , , , , ,367.1 Federal and state grants 348, , , , , , , , , ,351.5 Other capital property acquired 2, , , , , TOTAL CAPITAL CONTRIBUTIONS 428, , , , , , , , , ,718.6 INCREASE IN NET ASSETS $ 493,903.7 $ 169,262.6 $ 66,071.3 $ 116,529.9 $ 79,208.4 $ 86,210.9 $ 17,913.9 $ (8,373.0) $ 48,285.1 $ 51,365.5 NET ASSETS AT YEAR END COMPOSED OF: Invested in capital assets, net of related debt 880, , , , , , , , , ,552.0 Restricted 379, , , , , , , , , ,927.3 Unrestricted 406, , , , , , , , , ,642.7 TOTAL NET ASSETS $ 1,666,135.0 $ 1,172,231.3 $ 1,002,968.8 $ 936,897.5 $ 820,367.6 $ 741,159.3 $ 654,948.3 $ 637,034.4 $ 645,407.3 $ 597,122.0 Source: Authority's audited financial statements. 107
116 Operating Expenses By Business Unit Exhibit S-2 (Expressed in Thousands) NATIONAL Materials, equipment, supplies, contract services, and other $ 43,901.1 $ 49,004.0 $ 58,393.0 $49,285.6 $44,273.9 $43,028.1 $42,379.1 $41,932.7 $38,775.9 $39,825.9 Salaries and related benefits 56, , , , , , , , , ,439.0 Utilities 9, , , , , , , , , ,417.3 Travel Insurance 3, , , , , , , , , ,550.1 Proceeds/loss from sale of capital asset (121.7) (132.0) (45.1) (67.8) (321.6) (269.6) Non-Capitalized facility projects , , , , ,077.3 Lease from U.S. Government 2, , , , , , , , , ,029.2 Depreciation and amortization 12, , , , , , , , , ,349.4 Total National Expenses $129,541.5 $135,195.8 $140,256.9 $122,646.9 $118,061.4 $111,580.0 $106,282.2 $102,823.7 $95,826.8 $92,834.5 DULLES Materials, equipment, supplies, contract services, and other $ 83,773.3 $ 82,344.3 $ 87,758.6 $82,318.7 $76,630.2 $70,323.6 $68,998.1 $65,348.7 $56,719.3 $55,616.5 Salaries and related benefits 83, , , , , , , , , ,981.1 Utilities 18, , , , , , , , , ,734.9 Travel Insurance 3, , , , , , , , , ,550.1 Proceeds/loss from sale of capital asset (115.8) (24.2) ,054.4 (333.4) Non-Capitalized facility projects , Lease from U.S. Government 2, , , , , , , , , ,029.2 Depreciation and amortization 33, , , , , , , , , ,925.2 Total Dulles Expenses $225,808.5 $217,778.1 $212,600.3 $194,885.3 $190,665.4 $172,562.8 $164,094.3 $154,620.0 $143,096.2 $134,192.0 DULLES CORRIDOR ENTERPRISE FUND Materials, equipment, supplies, contract services, and other $ 24,836.9 $10,028.1 $0.0 $0.0 $0.0 $0.0 $0.0 $0.0 $0.0 $0.0 Salaries and related benefits 4, Utilities Depreciation and amortization 1, Total Dulles Corridor Enterprise Fund $30,094.8 $10,248.9 $0.0 $0.0 $0.0 $0.0 $0.0 $0.0 $0.0 $0.0 WASHINGTON FLYER Washington Flyer expenses $0.0 $0.0 $0.0 $176.5 $1,428.6 $1,359.7 $1,477.1 $1,897.9 $4,682.8 $5,420.6 Total Washington Flyer Expenses $0.0 $0.0 $0.0 $176.5 $1,428.6 $1,359.7 $1,477.1 $1,897.9 $4,682.8 $5,420.6 WASHINGTON FLYER MAGAZINE 1 Washington Flyer Magazine expenses Total Washington Flyer Magazine Expenses $0.0 $0.0 $0.0 $0.0 $0.0 $352.0 $905.8 $728.5 $1,506.8 $1,982.2 Magazine Expenses $0.0 $0.0 $0.0 $0.0 $0.0 $352.0 $905.8 $728.5 $1,506.8 $1,982.2 BOND FUNDS Financing expenses $0.0 $0.0 $0.0 $0.0 $0.0 $0.0 $13.1 $37.5 $75.0 $0.0 Legal fees , Materials, Equipment, Supplies Contract services, and other 2, , , , ,469.5 (568.0) 2, Non-Cash expenses 0.0 3, , (1.0) Non-Capitalized facility projects 2, , , Depreciation and amortization 135, , , , , , , , , ,398.7 Total Bond Expenses $140,600.0 $195,222.2 $118,890.1 $98,620.8 $97,393.3 $85,968.0 $85,058.0 $72,694.9 $67,149.2 $64,397.7 TELECOMMUNICATIONS Telephone expenses $5,083.6 $5,606.8 $5,361.9 $5,441.5 $5,558.6 $5,324.8 $6,257.8 $6,213.1 $5,917.2 $5,039.3 Total Telecommunication Exp $5,083.6 $5,606.8 $5,361.9 $5,441.5 $5,558.6 $5,324.8 $6,257.8 $6,213.1 $5,917.2 $5,039.3 FAA AIR TRAFFIC CONTROL TOWER 3 Air Traffic Control Tower expenses $232.0 $340.7 $213.2 $30.6 $0.0 $0.0 $0.0 $0.0 $0.0 $0.0 Total Air Traffic Control Tower Exp. $232.0 $340.7 $213.2 $30.6 $0.0 $0.0 $0.0 $0.0 $0.0 $0.0 JP MORGAN CHASE BUILDING 2 JP Morgan Chase Building Expenses $1,198.9 $1,406.1 $1,233.7 $1,234.6 $1,302.0 $1,146.5 $1,231.1 $1,671.5 $1,288.8 $871.3 Total JP Morgan Chase Building Exp $1,198.9 $1,406.1 $1,233.7 $1,234.6 $1,302.0 $1,146.5 $1,231.1 $1,671.5 $1,288.8 $871.3 TOTAL EXPENSES $532,559.3 $565,798.7 $478,556.1 $423,036.2 $414,409.3 $378,293.8 $365,306.3 $340,649.6 $319,467.8 $304, The Authority converted the Washington Flyer Magazine Program to a management contract in Separate reporting has been discontinued. 2 JP Morgan Chase Building is inclusive of all expense classifications. 3 FAA Air Traffic Control Tower completed in
117 Revenues By Source Exhibit S-3 (Expressed in Thousands) NATIONAL Airline: Rents $ 75,177.7 $ 66,111.6 $ 67,234.2 $63,938.0 $63,568.0 $62,236.9 $53,802.5 $60,453.8 $62,948.2 $60,659.8 Landing fees 32, , , , , , , , , ,392.1 Passenger fees/security , ,943.4 Total Airline Revenues $108,106.1 $98,401.8 $97,383.4 $95,995.9 $93,013.5 $93,565.1 $80,257.5 $88,578.2 $90,992.6 $90,995.3 Non-Airline: Concessions: Parking $ 41,764.0 $ 43,980.2 $ 44,569.9 $40,459.6 $37,647.4 $35,285.0 $32,381.8 $26,236.4 $27,289.8 $32,954.1 Rental cars 23, , , , , , , , , ,232.6 Terminal concessions Food and beverage 7, , , , , , , , , ,645.9 News stands 2, , , , , , , , ,514.7 Retail 2, , , , , , , , , ,115.6 Display advertising 4, , , , , , , , , Ground transportation 2 3, , ,373.4 Services Inflight catering , , ,907.0 Fixed base operator , ,433.3 Duty free All other , , , , , , ,117.1 Total Concessions $87,429.2 $86,369.3 $84,589.1 $75,829.3 $71,225.6 $64,746.3 $61,181.7 $53,373.1 $48,481.4 $61,118.9 Rents 8, , , , , , , , , ,219.3 Security , , Utility sales 2, , , , , , , , , ,175.6 Other 1, , , , , , , , ,679.9 Total Non-Airline Revenue $100,564.5 $99,680.2 $96,417.0 $87,434.6 $86,528.1 $78,040.3 $71,260.9 $61,947.4 $55,241.6 $73,193.7 Total National Revenues $208,670.6 $198,082.0 $193,800.4 $183,430.5 $179,541.6 $171,605.4 $151,518.4 $150,525.6 $146,234.2 $164,189.0 DULLES Airline: Rents $ 88,820.3 $ 78,287.5 $ 74,974.8 $71,961.8 $69,886.1 $62,372.3 $62,281.5 $55,332.7 $48,685.3 $46,686.0 Landing fees 64, , , , , , , , , ,365.4 International Arrival Building fees 11, , , , , , , , , ,274.6 Passenger Fees 17, , , , , , , , , ,680.0 Design Fees , Total Airline Revenues $182,231.9 $175,723.5 $150,902.7 $137,451.4 $142,523.6 $135,563.8 $128,710.3 $115,555.4 $100,867.2 $100,006.0 Non-Airline: Concessions: Parking $ 65,957.7 $ 71,125.6 $ 71,958.9 $ 68,608.0 $ 75,769.0 $64,396.8 $47,408.0 $42,923.2 $39,942.8 $46,411.9 Rental cars 15, , , , , , , , , ,177.5 Terminal concessions Food and beverage 8, , , , , , , , , ,751.0 News stands 4, , , , , , , , , ,442.1 Retail 2, , , , , , , , , ,477.8 Display advertising 4, , , , , , , , , Ground transportation 2 3, , ,410.6 Services 4, , , , , , , , , ,058.9 Inflight catering 5, , , , , , , , , ,499.3 Fixed base operator 11, , , , , , , , , ,414.5 Duty free 2, , , , , , , , , ,455.2 All other , , , , ,101.5 Total Concessions $129,984.5 $137,341.5 $132,897.7 $123,151.2 $127,168.0 $108,970.5 $84,697.2 $79,317.3 $75,776.7 $82,434.7 Rents $ 20, $17,948.5 $ 15,346.8 $ 11,396.1 $ 10,358.8 $ 8,066.0 $ 6,117.7 $ 4,888.4 $ 4,943.6 $ 3,987.5 Security , , Utility sales 6, , , , , , , , , ,305.0 Other 4, , , , , , , , , ,299.5 Total Non-Airline Revenues $162,056.7 $171,515.0 $158,867.1 $144,668.6 $147,912.0 $126,256.9 $100,120.3 $93,796.1 $87,587.9 $94,026.7 Total Dulles Revenues $344,288.6 $347,238.5 $309,769.8 $282,120.0 $290,435.6 $261,820.7 $228,830.6 $209,351.5 $188,455.1 $194,032.7 DULLES CORRIDOR ENTERPRISE FUND Tolls and other $64,893.5 $10,416.5 $0.0 $0.0 $0.0 $0.0 $0.0 $0.0 $0.0 $0.0 Total Dulles Corridor Enterprise Fund $64,893.5 $10,416.5 $0.0 $0.0 $0.0 $0.0 $0.0 $0.0 $0.0 $0.0 WASHINGTON FLYER Ground Transportation: Rents $0.0 $0.0 $0.0 $5.6 $67.2 $67.2 $67.2 $67.2 $67.2 $63.3 Concessions Ground Transportation - other , , , , ,431.8 Total Ground Transportation $0.0 $0.0 $0.0 $118.5 $2,007.0 $1,575.7 $1,243.0 $1,276.3 $2,700.9 $3,995.1 Magazine Advertising - other $0.0 $0.0 $0.0 $0.0 $4.7 $352.0 $722.1 $974.1 $1,151.0 $1,576.1 Total Magazine Revenues $0.0 $0.0 $0.0 $0.0 $4.7 $352.0 $722.1 $974.1 $1,151.0 $1,576.1 TELECOMMUNICATIONS Total Telephone Revenues $4,119.3 $4,179.9 $4,414.7 $3,900.0 $3,673.6 $5,345.7 $5,361.0 $4,485.5 $5,835.7 $5,632.7 VASTERA BUILDING Total Vastera Bldg. Revenues 1 $1,375.0 $1,444.5 $2,491.2 $1,599.6 $1,559.2 $1,586.6 $1,963.1 $2,225.0 $2,438.1 $1,062.9 TOTAL REVENUES $623,347.0 $561,361.4 $510,476.1 $471,168.6 $477,221.7 $442,286.1 $389,638.2 $368,838.0 $346,815.0 $370, Vastera Building revenues include rents and utilities. 2 Ground transportation was reported as other revenue in years prior to


118 2009 Ronald Reagan Washington National Airport Revenues Exhibit S-4 Security, 0.4% Rents, 39.9% Concessions, 41.9% Utility Sales, 1.2% Other 0.9% Landing Fees, 15.8% 110


119 2009 Washington Dulles International Airport Revenues Exhibit S-5 Passenger Fees 5.1% Security 0.1% International Arrivals Fees 3.5% Concessions 37.8% Rents 31.7% Utility Sales 1.9% Landing Fees 18.6% Other 1.3% 111
COMPREHENSIVE ANNUAL FINANCIAL REPORT. For the Fiscal Year Ended December 31, 2011
 2011_CAFR_Cover_rev.pdf 1 3/26/12 3:36 PM 2011 COMPREHENSIVE ANNUAL FINANCIAL REPORT For the Fiscal Year Ended December 31, 2011 Intentionally Left Blank METROPOLITAN WASHINGTON AIRPORTS AUTHORITY COMPREHENSIVE
METROPOLITAN WASHINGTON AIRPORTS AUTHORITY COMPREHENSIVE ANNUAL FINANCIAL REPORT YEAR ENDED DECEMBER 31, 2007 BOARD OF DIRECTORS
 METROPOLITAN WASHINGTON AIRPORTS AUTHORITY COMPREHENSIVE ANNUAL FINANCIAL REPORT YEAR ENDED DECEMBER 31, 2007 BOARD OF DIRECTORS The Honorable H.R. Crawford, Chairman Mame Reiley, Immediate Past Chairman
Metropolitan Washington Airports Authority (MWAA)
") RONALD REAGAN WASHINGTON NATIONAL DULLES TOLL ROAD DULLES METRORAIL WASHINGTON DULLES INTERNATIONAL Metropolitan Washington Airports Authority (MWAA) Andrew Rountree Chief Financial Officer & Vice President
RONALD REAGAN WASHINGTON NATIONAL DULLES TOLL ROAD DULLES METRORAIL WASHINGTON DULLES INTERNATIONAL Metropolitan Washington Airports Authority (MWAA) Andrew Rountree Chief Financial Officer & Vice President
Distinguished Budget Presentation
 GOVERNMENT FINANCE OFFICERS ASSOCIATION Distinguished Budget Presentation Award PRESENTED TO Metropolitan Washington Airports Authority Virginia For the Fiscal Year Beginning January 1, 2007 President
2016 COMPREHENSIVE ANNUAL FINANCIAL REPORT Metropolitan Washington Airports Authority INTENTIONALLY LEFT BLANK
 INTENTIONALLY LEFT BLANK METROPOLITAN WASHINGTON AIRPORTS AUTHORITY COMPREHENSIVE ANNUAL FINANCIAL REPORT FOR THE FISCAL YEARS ENDED DECEMBER 31, 2016 and DECEMBER 31, 2015 BOARD OF DIRECTORS as of December
Report to the Finance Committee Comprehensive Annual Financial Report. Prepared by the Office of Finance April 2017
 Report to the Finance Committee 2016 Comprehensive Annual Financial Report Prepared by the Office of Finance April 2017 Audit Opinion date March 31, 2017 Unmodified or clean audit opinion on financial
Proposed Dulles Toll Road Rate Adjustments
 Proposed Dulles Toll Road Rate Adjustments Dulles Corridor Advisory Committee Meeting October 5, 2012 Discussion Outline Regulatory Process for Changing Toll Rates Information Provided at Public Hearings
2017 COMPREHENSIVE ANNUAL FINANCIAL REPORT Metropolitan Washington Airports Authority INTENTIONALLY LEFT BLANK
 INTENTIONALLY LEFT BLANK METROPOLITAN WASHINGTON AIRPORTS AUTHORITY COMPREHENSIVE ANNUAL FINANCIAL REPORT FOR THE FISCAL YEARS ENDED DECEMBER 31, 2017 and DECEMBER 31, 2016 BOARD OF DIRECTORS as of December
Committee for Dulles. June 9, Jack Potter, MWAA President & CEO
 Committee for Dulles June 9, 2016 Jack Potter, MWAA President & CEO Dulles International is the Premier International Gateway to the Capital Region Dom Intl Total Mainline Airlines 10 29 37* Destinations
Report to the Dulles Corridor Advisory Committee
 Report to the Dulles Corridor Advisory Committee Information Report on Dulles Toll Road Toll Rate Adjustment Process and Tentative Schedule and Overview of Traffic and Revenue Study Update May 2018 Purpose
National Society of Professional Engineers. Charles S. Carnaggio, PE Project Director July 2, 2014
 National Society of Professional Engineers Charles S. Carnaggio, PE Project Director July 2, 2014 Phase 1 Opening Date: July 26, 2014 Dulles Corridor Metrorail Project At-a-Glance Seamless integration
Dulles Corridor Metrorail Project Update Dulles Area Transportation Association August 25, 2009
 Dulles Corridor Metrorail Project Update Dulles Area Transportation Association August 25, 2009 Patty Nicoson President Dulles Corridor Rail Association Proposed Toll Rate Increase on Dulles Toll Road
ACI LEGAL COMMITTEE MEETING
 ACI LEGAL COMMITTEE MEETING MWAA S RAIL TO DULLES PROJECT: WHAT IS IT AND HOW DOES IT FIT WITH THE PRINCIPLES OF REVENUE DIVERSION PHIL SUNDERLAND MWAA GENERAL COUNSEL TWO GOALS FOR THE NEXT TEN MINUTES
Dulles Corridor Improvements. Drive to Ride
 Dulles Corridor Improvements Dulles Corridor Improvements Status Update v Condition assessment of Toll Road facilities is complete v Dulles Airport Access Highway/I-495 Interchange Safety Improvements
Technical Report Economic Impact Study
 Technical Report 2009 Economic Impact Study Prepared for: Metropolitan Washington Airports Authority 1 Aviation Circle Washington, DC 20001 Prepared by: The Louis Berger Group, Inc. 2445 M Street, NW Washington,
Jacksonville Aviation Authority Annual Report The Power Within.
 Jacksonville Aviation Authority Annual Report 2007 The Power Within. Board of Directors & Executive Team Cyrus Jollivette Chairman 1 John D. Clark Executive Director / CEO Jim McCollum Vice-Chairman 2
CONTACT: Investor Relations Corporate Communications
 NEWS RELEASE CONTACT: Investor Relations Corporate Communications 435.634.3200 435.634.3553 Investor.relations@skywest.com corporate.communications@skywest.com SkyWest, Inc. Announces Fourth Quarter 2017
OPERATING AND FINANCIAL HIGHLIGHTS. Subsequent Events
 Copa Holdings Reports Net Income of $103.8 million and EPS of $2.45 for the Third Quarter of 2017 Excluding special items, adjusted net income came in at $100.8 million, or EPS of $2.38 per share Panama
Dulles Toll Road Rate Setting Process
 Dulles Toll Road Rate Setting Process Public Hearings Slides FOR HNTB June 22, 2018 Dulles Toll Road Operations The Dulles Toll Road is a critical transportation link to the region s infrastructure. On
Historical Statistics
 Historical Statistics FedEx Corporation Financial and Operating Statistics FY 2005 FY 2014 This report is a statistical supplement to FedEx s interim financial reports and is prepared quarterly. Additional
CONTACT: Investor Relations Corporate Communications
 NEWS RELEASE CONTACT: Investor Relations Corporate Communications 435.634.3200 435.634.3553 Investor.relations@skywest.com corporate.communications@skywest.com SkyWest, Inc. Announces Second Quarter 2016
CONTACT: Investor Relations Corporate Communications
 NEWS RELEASE CONTACT: Investor Relations Corporate Communications 435.634.3200 435.634.3553 Investor.relations@skywest.com corporate.communications@skywest.com SkyWest, Inc. Announces Second Quarter 2017
Copa Holdings Reports Record Earnings of US$41.8 Million for 4Q06 and US$134.2 Million for Full Year 2006
 Copa Holdings Reports Record Earnings of US$41.8 Million for 4Q06 and US$134.2 Million for Full Year 2006 Panama City, Panama --- March 7, 2007. Copa Holdings, S.A. (NYSE: CPA), parent company of Copa
MIRAMAR, Fla., April 29, 2015 (GLOBE NEWSWIRE) -- Spirit Airlines, Inc. (Nasdaq:SAVE) today reported first quarter 2015 financial results.
 -- Spirit Airlines, Inc. (Nasdaq:SAVE) today reported first quarter 2015 financial results.") April 29, 2015 Spirit Airlines Announces First Quarter 2015 Results; Adjusted Net Income Increases 87.1 Percent to $70.7 Million and Pre-Tax Margin Increases 900 Basis Points to 22.7 Percent MIRAMAR, Fla.,
April 29, 2015 Spirit Airlines Announces First Quarter 2015 Results; Adjusted Net Income Increases 87.1 Percent to $70.7 Million and Pre-Tax Margin Increases 900 Basis Points to 22.7 Percent MIRAMAR, Fla.,
METROPOLITAN WASHINGTON AIRPORTS AUTHORITY
 METROPOLITAN WASHINGTON AIRPORTS AUTHORITY + BOARD OF DIRECTORS MEETING Minutes of December 7,2011 The regular meeting of the Board of Directors was held in the first floor Conference Rooms la, 1B and
Spirit Airlines Reports Fourth Quarter and Full Year 2016 Results
 Spirit Airlines Reports Fourth Quarter and Full Year 2016 Results MIRAMAR, FL. (February 7, 2017) - Spirit Airlines, Inc. (NASDAQ: SAVE) today reported fourth quarter and full year 2016 financial results.
COUNTY OF ORANGE, CALIFORNIA AIRPORT REVENUE BONDS, SERIES 2009 A & B ANNUAL REPORT FOR FISCAL YEAR ENDED JUNE 30, 2013
 COUNTY OF ORANGE, CALIFORNIA AIRPORT REVENUE BONDS, SERIES 2009 A & B ANNUAL REPORT FOR FISCAL YEAR ENDED JUNE 30, 2013 Dated: January 28, 2014 COUNTY OF ORANGE, CALIFORNIA AIRPORT REVENUE BONDS, SERIES
OPERATING AND FINANCIAL HIGHLIGHTS SUBSEQUENT EVENTS
 Copa Holdings Reports Net Income of US$6.2 Million and EPS of US$0.14 for the Third Quarter of 2015 Excluding special items, adjusted net income came in at $37.4 million, or EPS of $0.85 per share Panama
SKYWEST, INC. ANNOUNCES THIRD QUARTER 2014 RESULTS
 NEWS RELEASE For Further Information Contact: Investor Relations Telephone: (435) 634-3203 Fax: (435) 634-3205 FOR IMMEDIATE RELEASE: October 29, 2014 SKYWEST, INC. ANNOUNCES THIRD QUARTER 2014 RESULTS
Investor Update Issue Date: April 9, 2018
 Investor Update Issue Date: April 9, 2018 This investor update provides guidance and certain forward-looking statements about United Continental Holdings, Inc. (the Company or UAL ). The information in
Copa Holdings Reports Net Income of $57.7 million and EPS of $1.36 for the Third Quarter of 2018
 Copa Holdings Reports Net Income of $57.7 million and EPS of $1.36 for the Third Quarter of 2018 November 14, 2018 PANAMA CITY, Nov. 14, 2018 /PRNewswire/ -- Copa Holdings, S.A. (NYSE: CPA), today announced
SKYWEST, INC. ANNOUNCES THIRD QUARTER 2012 RESULTS
 NEWS RELEASE For Further Information Contact: Michael J. Kraupp Chief Financial Officer and Treasurer Telephone: (435) 634-3212 Fax: (435) 634-3205 FOR IMMEDIATE RELEASE: November 7, 2012 SKYWEST, INC.
Spirit Airlines Reports First Quarter 2017 Results
 Spirit Airlines Reports First Quarter 2017 Results MIRAMAR, Fla., April 28, 2017 - Spirit Airlines, Inc. (NASDAQ: SAVE) today reported first quarter 2017 financial results. GAAP net income for the first
AIR CANADA REPORTS 2010 THIRD QUARTER RESULTS; Operating Income improved $259 million or 381 per cent from previous year s quarter
 AIR CANADA REPORTS 2010 THIRD QUARTER RESULTS; Operating Income improved $259 million or 381 per cent from previous year s quarter MONTRÉAL, November 4, 2010 Air Canada today reported operating income
Business Plan INTRODUCTION AIRPORT ENTERPRISE FUND OVERVIEW. Master Plan Guiding Principles
 5 Business Plan INTRODUCTION Just as previous chapters have outlined plans for the airport s physical development, this chapter outlines a plan for the airport s financial development. More specifically,
SkyWest, Inc. Announces First Quarter 2018 Profit
 NEWS RELEASE CONTACT: Investor Relations Corporate Communications 435.634.3200 435.634.3553 Investor.relations@skywest.com corporate.communications@skywest.com SkyWest, Inc. Announces First Quarter 2018
Spirit Airlines Reports Second Quarter 2018 Results
 Spirit Airlines Reports Second Quarter 2018 Results MIRAMAR, Fla., July 25, 2018 - Spirit Airlines, Inc. (NYSE: SAVE) today reported second quarter 2018 financial results. GAAP net income for the second
METROPOLITAN WASHINGTON AIRPORTS AUTHORITY. January 1 through December 31, With
 METROPOLITAN WASHINGTON AIRPORTS AUTHORITY 2016 January 1 through December 31, 2016 Your With Reagan National Airport Dulles International Airport Dulles Corridor Metrorail Dulles Toll Road Geographically
Columbus Regional Airport Authority. Financial Statements. March 31, Respectfully Submitted. Randy Bush, CPA, CIA. Chief Financial Officer
 Columbus Regional Airport Authority Financial Statements March 31, 2018 Respectfully Submitted Randy Bush, CPA, CIA Chief Financial Officer Unaudited for internal purposes CRAA Operating Revenue & Expenses
Greater Orlando Aviation Authority
 Greater Orlando Aviation Authority Orlando International Airport & Orlando Executive Airport Budgets Fiscal Year 2017-2018 Greater Orlando Aviation Authority Orlando, Florida Greater Orlando Aviation Authority
RECOMMENDATION TO THE DULLES CORRIDOR AND FINANCE COMMITTEES
 RECOMMENDATION TO THE DULLES CORRIDOR AND FINANCE COMMITTEES Proposed Amendment to the Regulation that Establishes Toll Rates for Use of the Dulles Toll Road November 2018 Purpose To brief the Dulles Corridor
Chapter 9: Financial Plan Draft
 Chapter 9: Draft TABLE OF CONTENTS 9... 5 9.2.1 ABIA Accounting... 6 9.2.2 Legal Environment... 6 9.2.3 Governing Documents... 8 9.3.1 FAA AIP Grants... 13 9.3.2 Local ABIA Funds... 14 9.4.1 Defer or Delay
Thank you for participating in the financial results for fiscal 2014.
 Thank you for participating in the financial results for fiscal 2014. ANA HOLDINGS strongly believes that safety is the most important principle of our air transportation business. The expansion of slots
SECTION 106 ACTIVITIES ANNUAL REPORT
 SECTION 106 ACTIVITIES ANNUAL REPORT FOR THE YEAR ENDING DECEMBER 31, 2014 Metropolitan Washington Airports Authority 198 Van Buren Street, Suite 300 Herndon, Virginia 20170 JANUARY 2015 Introduction The
OPERATING AND FINANCIAL HIGHLIGHTS
 Copa Holdings Reports Financial Results for the Fourth Quarter of 2015 Excluding special items, adjusted net income came in at $31.7 million, or EPS of $0.73 per share Panama City, Panama --- February
Cathay Pacific Airways Limited Abridged Financial Statements
 To provide shareholders with information on the results and financial position of the Group s significant listed associated company, Cathay Pacific Airways Limited, the following is a summary of its audited
Columbus Regional Airport Authority. Financial Statements. April 30, Respectfully Submitted. Randy Bush, CPA, CIA. Chief Financial Officer
 Columbus Regional Airport Authority Financial Statements April 30, 2018 Respectfully Submitted Randy Bush, CPA, CIA Chief Financial Officer Unaudited for internal purposes CRAA Operating Revenue & Expenses
CHAPTER 1 EXECUTIVE SUMMARY
 CHAPTER 1 EXECUTIVE SUMMARY 1 1 EXECUTIVE SUMMARY INTRODUCTION William R. Fairchild International Airport (CLM) is located approximately three miles west of the city of Port Angeles, Washington. The airport
Financial Feasibility Analysis Terminal Programming Study Des Moines Airport Authority
 Financial Feasibility Analysis Terminal Programming Study Des Moines Airport Authority September 12, 2017 Contents 1. Funding Sources for Airport Projects 2. Financial Metrics 3. CIP Summary and Funding
Columbus Regional Airport Authority. Financial Statements. September 30, Respectfully Submitted. Randy Bush, CPA, CIA. Chief Financial Officer
 Columbus Regional Airport Authority Financial Statements September 30, 2018 Respectfully Submitted Randy Bush, CPA, CIA Chief Financial Officer Unaudited for internal purposes CRAA Operating Revenue &
PUBLIC ACCOUNTABILITY PRINCIPLES FOR CANADIAN AIRPORT AUTHORITIES
 PUBLIC ACCOUNTABILITY PRINCIPLES FOR CANADIAN AIRPORT AUTHORITIES The Canadian Airport Authority ( CAA ) shall be incorporated in a manner consistent with the following principles: 1. Not-for-profit Corporation
Q1 Fiscal 2018 Statistics
 Q1 Fiscal 2018 Statistics FedEx Corporation Financial and Operating Statistics First Quarter Fiscal 2018 September 19, 2017 This report is a statistical supplement to FedEx s interim financial reports
AIR CANADA REPORTS THIRD QUARTER RESULTS
 AIR CANADA REPORTS THIRD QUARTER RESULTS THIRD QUARTER OVERVIEW Operating income of $112 million compared to operating income of $351 million in the third quarter of 2007. Fuel expense increased 49 per
RECOMMENDED 2013 BUDGET
 RECOMMENDED 2013 BUDGET December 12, 2012 Budget Highlights Draft October 17, 2012 Aviation Operation & Maintenance (O&M) Expenses 1.5 percent overall O&M increase (including debt service) 2013 Salary
 Existing Conditions AIRPORT PROFILE Passenger Terminal Complex 57 air carrier gates 11,500 structured parking stalls Airfield Operations Area 9,000 North Runway 9L-27R 6,905 Crosswind Runway 13-31 5,276
Copa Holdings Reports Net Income of $136.5 million and EPS of $3.22 for the First Quarter of 2018
 Copa Holdings Reports Net Income of $136.5 million and EPS of $3.22 for the First Quarter of 2018 May 9, 2018 PANAMA CITY, May 9, 2018 /PRNewswire/ -- Copa Holdings, S.A. (NYSE: CPA), today announced financial
Finance and Implementation
 5 Finance and Implementation IMPLEMENTATION The previous chapters have presented discussions and plans for development of the airfield, terminal, and building areas at Sonoma County Airport. This chapter
Columbus Regional Airport Authority. Financial Statements. July 31, Respectfully Submitted. Randy Bush, CPA, CIA. Chief Financial Officer
 Columbus Regional Airport Authority Financial Statements July 31, 2018 Respectfully Submitted Randy Bush, CPA, CIA Chief Financial Officer Unaudited for internal purposes CRAA Operating Revenue & Expenses
OPERATING AND FINANCIAL HIGHLIGHTS
 Copa Holdings Reports Financial Results for the Fourth Quarter of 2018 Excluding special items, adjusted net profit came in at $44.0 million, or Adjusted EPS of $1.04 Panama City, Panama --- February 13,
Columbus Regional Airport Authority. Financial Statements. August 31, Respectfully Submitted. Randy Bush, CPA, CIA. Chief Financial Officer
 Columbus Regional Airport Authority Financial Statements August 31, 2018 Respectfully Submitted Randy Bush, CPA, CIA Chief Financial Officer Unaudited for internal purposes CRAA Operating Revenue & Expenses
RECOMMENDED 2013 BUDGET AS SUBMITTED TO THE FINANCE COMMITTEE
 M E T R O P O L I T A N W A S H I N G T O N A I R P O R T S A U T H O R I T Y RECOMMENDED 2013 BUDGET AS SUBMITTED TO THE FINANCE COMMITTEE November 14, 2012 M E T R O P O L I T A N W A S H I N G T O N
Investor Update September 2017 PARTNER OF CHOICE EMPLOYER OF CHOICE INVESTMENT OF CHOICE
 Investor Update September 2017 PARTNER OF CHOICE EMPLOYER OF CHOICE INVESTMENT OF CHOICE 1 Forward Looking Statements In addition to historical information, this presentation contains forward-looking statements
NAIOP. Marcia McAllister Metropolitan Washington Airports Authority
 NAIOP Marcia McAllister Metropolitan Washington Airports Authority 1 The Vision Realized Northern Virginia Today Tysons Corner is the largest employment center in the Commonwealth Larger than central business
OPERATING AND FINANCIAL HIGHLIGHTS SUBSEQUENT EVENTS
 Copa Holdings Reports Financial Results for the Third Quarter of 2016 Excluding special items, adjusted net income came in at $55.3 million, or adjusted EPS of $1.30 per share Panama City, Panama --- November
Establishes a fare structure for Tacoma Link light rail, to be implemented in September 2014.
 RESOLUTION NO. R2013-24 Establish a Fare Structure and Fare Level for Tacoma Link MEETING: DATE: TYPE OF ACTION: STAFF CONTACT: PHONE: Board 09/26/2013 Final Action Ric Ilgenfritz, Executive Director,
Q3 Fiscal 2017 Statistics
 Q3 Fiscal 2017 Statistics FedEx Corporation Financial and Operating Statistics Third Quarter Fiscal 2017 February 28, 2017 This report is a statistical supplement to FedEx s interim financial reports and
Chapter Seven COST ESTIMATES AND FUNDING A. GENERAL
 Chapter Seven COST ESTIMATES AND FUNDING A. GENERAL This chapter delineates the recommended 2005 2024 Sussex County Airport Capital Improvement Program (CIP). It further identifies probable construction
Adjusted net income of $115 million versus an adjusted net loss of $7 million in the second quarter of 2012, an improvement of $122 million
 Air Canada Reports Record Second Quarter 2013 Results Highest Adjusted Net Income, Operating Income and EBITDAR Results for Second Quarter in Air Canada s History Adjusted net income of $115 million versus
CLASS SPECIFICATION 5/12/11 SENIOR AIRPORT ENGINEER, CODE 7257
 Form PDES 8 THE CITY OF LOS ANGELES CIVIL SERVICE COMMISSION CLASS SPECIFICATION 5/12/11 SENIOR AIRPORT ENGINEER, CODE 7257 Summary of Duties: A Senior Airport Engineer performs the more difficult and
Fort Wayne International Airport Master Plan Study. Executive Summary
 Fort Wayne International Airport Master Plan Study Executive Summary March 2012 Introduction Airport Background Forecast of Aviation Activity Development Plans Recommended Airfield & Access Development
EXHIBIT K TERMINAL PROJECT PROCEDURES PHASE I - DEVELOPMENT OF TERMINAL PROGRAM & ALTERNATIVES
 EXHIBIT K TERMINAL PROJECT PROCEDURES PHASE I - DEVELOPMENT OF TERMINAL PROGRAM & ALTERNATIVES Over the term of the Master Amendment to the Airline Use and Lease Agreement, the Kansas City Aviation Department
OPERATING AND FINANCIAL HIGHLIGHTS. Subsequent Events
 Copa Holdings Reports Net Income of US$113.1 Million and EPS of US$2.57 for the First Quarter of 2015 Excluding special items, adjusted net income came in at US$106.0 million, or EPS of US$2.41 per share
Q4 Fiscal 2017 Statistics
 Q4 Fiscal 2017 Statistics FedEx Corporation Financial and Operating Statistics Fourth Quarter Fiscal 2017 July 17, 2017 This report is a statistical supplement to FedEx s interim financial reports and
OPERATING AND FINANCIAL HIGHLIGHTS. Subsequent Events
 Copa Holdings Reports Financial Results for the First Quarter of 2016 Excluding special items, adjusted net income came in at US$69.9 million, or EPS of US$1.66 per share Panama City, Panama --- May 5,
EMBARGOED FOR 5AM ET JUNE 5, 2017 PRESIDENT DONALD J. TRUMP S PRINCIPLES FOR REFORMING THE U.S. AIR TRAFFIC CONTROL SYSTEM.
 EMBARGOED FOR 5AM ET JUNE 5, 2017 PRESIDENT DONALD J. TRUMP S PRINCIPLES FOR REFORMING THE U.S. AIR TRAFFIC CONTROL SYSTEM Overview The U.S. Air Traffic Control (ATC) system is one of the most important
COMMONWEALTH PORTS AUTHORITY
 REPORT ON COMPLIANCE AND INTERNAL CONTROL OVER COMPLIANCE WITH REQUIREMENTS APPLICABLE TO THE PASSENGER FACILITY CHARGE PROGRAM YEAR ENDED SEPTEMBER 30, 2015 Deloitte & Touche LLC P.O. Box 500308 Saipan,
SECURITIES AND EXCHANGE COMMISSION Washington, D.C Form 10-Q SKYWEST, INC.
 SECURITIES AND EXCHANGE COMMISSION Washington, D.C. 20549 Form 10-Q QUARTERLY REPORT UNDER SECTION 13 OR 15(d) OF THE SECURITIES EXCHANGE ACT OF 1934 For the quarterly period ended June 30, 2013 OR TRANSITION
Cathay Pacific Airways Limited Abridged Financial Statements
 To provide shareholders with information on the results and financial position of the Group s significant listed associated company, Cathay Pacific Airways Limited, the following is a summary of its audited
THIRD QUARTER RESULTS 2017
 THIRD QUARTER RESULTS 2017 KEY RESULTS In the 3Q17 Interjet total revenues added $5,835.1 million pesos that represented an increase of 22.0% over the revenue generated in the 3Q16. In the 3Q17, operating
Silver Line Operating Plan
 Customer Service and Operations Committee Information Item IV-A December 6, 2012 Silver Line Operating Plan Washington Metropolitan Area Transit Authority Board Action/Information Summary Action Information
Historical Statistics
 Historical Statistics FedEx Corporation Financial and Operating Statistics FY 2006 FY 2015 This report is a statistical supplement to FedEx s interim financial reports and is prepared annually. Additional
AIRPORT NOISE AND CAPACITY ACT OF 1990
 AIRPORT NOISE AND CAPACITY ACT OF 1990 P. 479 AIRPORT NOISE AND CAPACITY ACT OF 1990 SEC. 9301. SHORT TITLE This subtitle may be cited as the Airport Noise and /Capacity Act of 1990. [49 U.S.C. App. 2151
January 1 through December 31, 2017
 2017 Budget Book Cover Final-12-12-2016.pdf 1 12/12/16 10:04 AM 2017 January 1 through December 31, 2017 REAGAN NA ATIONAL AIRPORT DULL LES CORRIDOR METRORAIL DULLES T OLL ROAD DULLES INTERNAT A IONAL
Copa Holdings Reports Net Income of $49.9 million and EPS of $1.18 for the Second Quarter of 2018
 Copa Holdings Reports Net Income of $49.9 million and EPS of $1.18 for the Second Quarter of 2018 Panama City, Panama --- Aug 8, 2018. Copa Holdings, S.A. (NYSE: CPA), today announced financial results
Welcome Fairfax County Transportation Advisory Commission and FC-DOT Staff
 Welcome Fairfax County Transportation Advisory Commission and FC-DOT Staff July 29, 2014 Metropolitan Washington Airports Authority MWAA was created through a bi-state compact between the Commonwealth
Spirit Airlines Reports Third Quarter 2017 Results
 Spirit Airlines Reports Third Quarter 2017 Results MIRAMAR, Fla., October 26, 2017 - Spirit Airlines, Inc. (NASDAQ: SAVE) today reported third quarter 2017 financial results. GAAP net income for the third
Copa Holdings Reports Fourth Quarter and Full Year 2007 Results
 Copa Holdings Reports Fourth Quarter and Full Year 2007 Results Panama City, Panama --- February 21, 2008. Copa Holdings, S.A. (NYSE: CPA), parent company of Copa Airlines and Aero Republica, today announced
OFFICE OF THE AUDITOR
 OFFICE OF THE AUDITOR DEPARTMENT OF AVIATION (FORMERLY AMERICAN TRANS AIR, INC.) REVENUE AND CONTRACT COMPLIANCE AUDIT JUNE 2006 Dennis J. Gallagher Auditor Dennis J. Gallagher Auditor City and County
SECTION 106 ACTIVITIES ANNUAL REPORT
 SECTION 106 ACTIVITIES ANNUAL REPORT FOR THE YEAR ENDING DECEMBER 31, 2011 Metropolitan Washington Airports Authority 1593 Spring Hill Road, Suite 300 Vienna, Virginia 22182 JANUARY 2012 Introduction The
Spirit Airlines Reports First Quarter 2018 Results
 Spirit Airlines Reports First Quarter 2018 Results MIRAMAR, Fla., April 26, 2018 - Spirit Airlines, Inc. (NYSE: SAVE) today reported first quarter 2018 financial results. For the first quarter 2018, Spirit
PLC. IFRS Summary Financial Statement (excluding Directors Report and Directors Remuneration Report) Year ended November 30, 2006
 Year ended November 30, 2006") C A R N I V A L PLC IFRS Summary Financial Statement (excluding Directors Report and Directors Remuneration Report) Year ended November 30, 2006 Registered number: 4039524 The standalone Carnival plc consolidated
C A R N I V A L PLC IFRS Summary Financial Statement (excluding Directors Report and Directors Remuneration Report) Year ended November 30, 2006 Registered number: 4039524 The standalone Carnival plc consolidated
United Global Performance Commitment 2017
 United Global Performance Commitment 2017 A PERFORMANCE COMMITMENT FOR THE COMPLETE TRAVEL PROCESS OUR COMMITMENT The most comprehensive and competitive performance commitment industry-wide. 1 More On
Washington Dulles Overview Loudoun Chamber of Commerce
 Washington Dulles Overview Loudoun Chamber of Commerce May 2015 Dulles Impact on Loudoun County Almost 19,000 jobs in Loudoun County $796.3 million in labor income $78.4 million in Loudoun taxes Source:
Copa Holdings Reports Net Income of US$113.9 Million for the Fourth Quarter of 2013
 Copa Holdings Reports Net Income of US$113.9 Million for the Fourth Quarter of 2013 Panama City, Panama --- February 12, 2014. Copa Holdings, S.A. (NYSE: CPA), today announced financial results for the
OFFICE OF THE AUDITOR
 OFFICE OF THE AUDITOR DEPARTMENT OF AVIATION REVENUE AND COMPLIANCE AUDIT JANUARY 2005 Dennis J. Gallagher Auditor Dennis J. Gallagher Auditor City and County of Denver 201 West Colfax Ave., Dept. 705
Frequently Asked Questions
 CAA Funding Review Why has CAA s funding been reviewed? New Zealand has a well-regarded civil aviation system and a good aviation safety record. However, both the government and a range of reviews (including
Tulsa Airports Improvement Trust Strategic Plan Update
 Tulsa Airports Improvement Trust Strategic Plan Update 2016-2026 TABLE OF CONTENTS I. Background II. III. IV. Existing Conditions and Future Requirements Mission, Vision, & Goals Strengths, Weakness, Opportunities
AirportInfo. Airport Operating Expenses
 AirportInfo Airport Operating Expenses November 2014 Overview of U.S. Enplanements, Revenues and Expenses Percentage Change from Base Year 2001 80% Enplanements Revenues Expenses 70% 60% 50% 40% 30% 20%
AIRPORT FUND. Description. Summary
 Description In March 1941 construction started for the airport at its present site. After Pearl Harbor, the airport, known as Pinellas Army Airfield, was used as a military flight-training base. After
Office of the Vice Chancellor for Finance and Business. Executive Summarv
 - - State University of New York Memorandum to Presidents Date: From: March 1, 1999 Office of the Vice Chancellor for Finance and Business Vol. 99 No. 1 subject: Income Fund Reimbursable Program Policy