COMPREHENSIVE ANNUAL FINANCIAL REPORT. For the Fiscal Year Ended December 31, 2011
|
|
|
- Opal Ross
- 5 years ago
- Views:
Transcription


1 2011_CAFR_Cover_rev.pdf 1 3/26/12 3:36 PM 2011 COMPREHENSIVE ANNUAL FINANCIAL REPORT For the Fiscal Year Ended December 31, 2011
2 Intentionally Left Blank
3 METROPOLITAN WASHINGTON AIRPORTS AUTHORITY COMPREHENSIVE ANNUAL FINANCIAL REPORT FOR THE FISCAL YEAR ENDED DECEMBER 31, 2011 BOARD OF DIRECTORS As of December 31, 2011 Chairman Charles D. Snelling Vice Chairman The Honorable Thomas M. Davis III Robert Clarke Brown Richard S. Carter The Honorable William W. Cobey Jr. Frank M. Conner III The Honorable H.R. Crawford Michael A. Curto Shirley Robinson Hall Dennis L. Martire Michael L. O Reilly Mame Reiley Warner H. Session Vice President and Secretary Quince T. Brinkley, Jr. EXECUTIVE STAFF John E. Potter Margaret E. McKeough Andrew T. Rountree, CPA Valerie Holt, CPA President and Chief Executive Officer Executive Vice President and Chief Operating Officer Vice President for Finance and Chief Financial Officer Vice President for Audit Prepared by the Office of Finance
4 Intentionally Left Blank

5 METROPOLITAN WASHINGTON AIRPORTS AUTHORITY Comprehensive Annual Financial Report For the Fiscal Year Ended December 31, 2011 TABLE OF CONTENTS I. INTRODUCTORY SECTION Transmittal Letter Certificate of Achievement for Excellence in Financial Reporting Organization Chart II. FINANCIAL SECTION Report of Independent Auditors Management s Discussion and Analysis Basic Financial Statements Statements of Net Assets Statements of Revenues, Expenses and Changes in Net Assets Statements of Cash Flows Notes to Financial Statements 1. Summary of Significant Accounting Policies A. Reporting Entity B. Measurement Focus, Basis of Accounting and Financial Statement Presentation C. Use of Estimates in Preparation of the Financials D. Budgeting Requirements E. Net Assets F. Revenue Recognition G. Allocations of Overhead and Other Indirect Costs and Project Costs H. Cash and Cash Equivalents I. Investments J. Accounts Receivable K. Inventory and Prepaid Items L. Restricted Assets M. Capital Assets N. Capitalization of Interest O. Long-Term Debt P. Federal, State and Local Grants Q. Passenger Facility Charges R. Lease Obligations S. Post-employment Benefits T. Compensated Absences U. Deferred Revenue V. Self-Insurance i
6 W. Taxes X. Recently Issued Accounting Pronouncements Restatement of Prior Years Results Airport Use Agreement and Premises Lease Transfer of the Dulles Toll Road and Construction of the Dulles Metrorail Project Deposits and Investments Accounts Receivable Note Receivable Pension Plans and Deferred Compensation Plan Post-employment Benefits Changes in Capital Assets Accounts Payable Lease Commitments Changes in Non-Current Non-Debt Liabilities Derivatives Capital Debt Net Assets Government Grants Passenger Facility Charges Risk Management Other Commitments and Contingencies Litigation Subsequent Events III. STATISTICAL SECTION Exhibit S -1 Annual Revenues, Expenses and Changes in Net Assets Exhibit S -2 Operating Expenses By Business Unit Exhibit S -3 Revenues By Source Exhibit S -4 Revenue By Source Reagan National Exhibit S -5 Revenue By Source Dulles International Exhibit S -6 Scheduled Rates and Charges Exhibit S -7 Concession Revenue and Enplanements Reagan National Exhibit S -8 Concession Revenue and Enplanements Dulles International Exhibit S -9 Dulles Toll Road Annual Transactions and Revenue Exhibit S -10 Dulles Toll Road Transactions Monthly Exhibit S -11 Top 10 Payors Exhibit S -12 Ratios of Outstanding Debt Exhibit S -13 Other Debt Service Coverage Aviation Enterprise Fund Exhibit S -14 Other Debt Service Coverage Dulles Corridor Enterprise Fund Exhibit S -15 Revenue Bond Coverage Aviation Enterprise Fund Exhibit S -16 Airport Information Reagan National and Dulles International Exhibit S -17 Dulles Toll Road Information Exhibit S -18 Employment by Industry Exhibit S -19 Private Sector Employers in Primary Air Trade Area Exhibit S -20 Population Trends Exhibit S -21 Airports Authority Employee Strength Exhibit S -22 Aircraft Operations By Airport Exhibit S -23 Aircraft Operations by Airport Reagan National Exhibit S -24 Aircraft Operations by Airport Dulles International Exhibit S -25 Commercial Passenger Enplanements ii
7 Exhibit S -26 Commercial Enplanements Exhibit S -27 Market Share by Landed Weight Reagan National Exhibit S -28 Market Share by Landed Weight Dulles International Exhibit S -29 Airline Market Share by Passenger Enplanements Reagan National Exhibit S -30 Airline Market Share by Passenger Enplanements Dulles International Exhibit S -31 Airline Market Share by Enplaned Cargo Weight Reagan National Exhibit S -32 Airline Market Share by Enplaned Cargo Weight Dulles International Exhibit S -33 Passenger Facility Charges Exhibit S -34 Top 30 Passenger Origination and Destination Markets in 2011 Reagan National Exhibit S -35 Top 30 Passenger Origination and Destination Markets in 2011 Dulles International 154 Exhibit S -36 Top 10 Passenger Origination and Destination Markets Reagan National Exhibit S -37 Top 10 Passenger Origination and Destination Markets Dulles International Exhibit S -38 Airline Tenants Both Airports Exhibit S -39 Non-Airline Tenants Reagan National Exhibit S -40 Non-Airline Tenants Dulles International iii
8 Intentionally Left Blank iv


9
10 responsibilities. These restatements have been reflected for comparative reporting in Management s Discussion & Analysis (MD&A), which immediately follows the independent auditor s report and provides a narrative introduction, overview, and analysis of the basic financial statements. The MD&A complements this Transmittal Letter and should be read in conjunction with it. As required by the Acts of the District of Columbia and the Commonwealth of Virginia (the Commonwealth), a firm of independent certified public accountants is retained each year to conduct an audit of the financial statements of the Airports Authority in accordance with auditing standards generally accepted in the United States of America and to meet the requirements of the Federal Single Audit Act of 1984 (pursuant to OMB Circular A-133). The Airports Authority selected the firms of PricewaterhouseCoopers LLP and Bert Smith and Company to perform these audit services. PricewaterhouseCoopers LLP has issued an unqualified ( clean ) opinion on the Airports Authority s financial statements for the years ended December 31, 2011 and The report from PricewaterhouseCoopers LLP is located at the front of the financial section of this CAFR. The Single Audit Report and its opinion from Bert Smith and Company are presented under separate cover. THE AIRPORTS AUTHORITY AND ITS PURPOSE The Airports Authority is a public body politic and corporate, created with the consent of the Congress of the United States by an Act of the District of Columbia and an Act of the Commonwealth for the purpose of operating, maintaining, and improving Ronald Reagan Washington National Airport (Reagan National) and Washington Dulles International Airport (Dulles International), (collectively, the Airports). The Airports had historically been managed by the Federal Aviation Administration (FAA) of the United States Department of Transportation. Pursuant to an Agreement and Deed of Lease, effective June 7, 1987, the Airports were transferred by the U. S. Government to the Airports Authority for an initial term of 50 years. On June 17, 2003, the Agreement and Deed of Lease was extended 30 years to June 6, Pursuant to the Master Transfer Agreement, dated December 29, 2006 and effective November 1, 2008, the Virginia Department of Transportation (VDOT) granted a permit for the operation and maintenance of the Dulles Toll Road to the Airports Authority for a term of 50 years. As part of the agreement with the Commonwealth, the Airports Authority is constructing the Dulles Metrorail Project with an eastern terminus near the West Falls Church Metrorail Station on Interstate 66 and a western terminus of Virginia Route 772 in Loudoun County and is making other improvements in the Dulles Corridor consistent with VDOT and regional plans. The Dulles Corridor is defined as the transportation corridor with an eastern terminus of the East Falls Church Metrorail station at Interstate Route 66 and a western terminus of VA Route 772 in Loudoun County, VA. The Airports Authority is an independent interstate agency. A 13-member Board of Directors (the Board) presently governs the Airports Authority. Five members are appointed by the Governor of Virginia subject to confirmation by the Virginia General Assembly, three are appointed by the Mayor of the District of Columbia subject to confirmation by the Council of the District of Columbia, two are appointed by the Governor of Maryland, and three are appointed by the President of the United States with the advice and consent of the United States Senate. Directors serve staggered, six-year terms without compensation and may be reappointed once. They establish the Airports Authority s policy and appoint the President and Chief Executive Officer. The Board annually elects a Chairman, Vice Chairman, and Secretary. Airports Authority operations are conducted under the supervision of the Airports Authority staff. On July 18, 2011, John E. Potter was appointed by the Board as the President and Chief Executive Officer, replacing E. Lynn Hampton, who had been serving as interim Chief Executive Officer since May 8, In 2
11 this position, Mr. Potter plans and directs all programs and activities of the Airports Authority in accordance with delegated responsibilities from the Board, focusing on current operations as well as the future and the development of long-term business strategies. Aviation Enterprise Fund The Airports Authority operates a two-airport system that provides domestic and international air service for the mid-atlantic region, which is accounted for within the Aviation Enterprise Fund. The Air Trade Area for the Airports Authority is comprised of the District of Columbia, five Maryland counties, nine Virginia counties, six independent Virginia cities, and one West Virginia County. The Aviation Enterprise Fund is selfsupporting, using aircraft landing fees, fees from terminal and other rentals, and revenues from concessions to fund operating and maintenance expenses. The operations of the Airports Authority are not taxpayer-funded. Reagan National opened in Located on 860 acres along the Potomac River in Arlington County, Virginia, it is the oldest commercial airport serving the Air Trade Area. Approximately three miles from downtown Washington, D.C., Reagan National is the Airports Authority s principal domestic air service airport. There were 30 airlines serving Reagan National as of December 31, 2011, providing 282 thousand takeoffs and landings during the year. There is no significant cargo transportation at Reagan National. Dulles International, celebrating its 50 th anniversary in 2012, opened for service in It is situated on approximately 11,830 acres in Fairfax and Loudoun Counties in Virginia. Dulles International is 26 miles from downtown Washington, D.C., from which it is accessible via a 17-mile dedicated four-lane (two lanes in each direction) Access Road and Interstate 66. Dulles International provides a full range of domestic and international air service, including service to destinations in Europe, Asia, South America, and Africa. There were 52 domestic and international airlines serving Dulles International as of December 31, 2011, providing 327 thousand takeoffs and landings during the year. Dulles International also provides facilities for cargo transport. There are 540 thousand square feet of cargo buildings at Dulles International, leased by airlines and other aviation support companies. Cargo operations at Dulles International are a major economic engine for the Air Trade Area. In February 1990, the Airports Authority entered into the Airport Use Agreement and Premises Lease (Use and Lease Agreement) with the major airlines serving Reagan National and Dulles International. The Use and Lease Agreement provides the financial stability necessary for the Airports Authority to operate the Airports and access the capital markets to fund the Capital Construction Program (CCP). The Use and Lease Agreement is for a term of 25 years, subject to annual cancellation rights by the Airports Authority, which started in The Use and Lease Agreement continues a long history of a close working relationship between the Airlines and the Airports Authority and gives the Airlines interest in the positive financial performance of the Airports Authority by sharing in the net remaining revenues (see Note 3 Airport Use Agreement and Premises Lease). The Aviation Enterprise Fund initiated its CCP in 1988 to expand, modernize, and maintain the Airports. Under the CCP, the Airports Authority has constructed and will continue to construct many of the principal elements of the Reagan National and Dulles International Master Plans. Major projects completed under the Master Plan at Reagan National include two main terminals connected to a Metrorail station, three parking garages, an airport traffic control tower, and a consolidated communications center. Major capital projects completed under the CCP at Dulles International include expansion and rehabilitation of the Main Terminal, construction of Concourses A and B, an inter-terminal automated people mover system (the AeroTrain), the International Arrivals Building (IAB), a fourth runway, runway and road improvements, two daily parking garages, and an air traffic control tower. 3
12 Projects currently in the program at Reagan National include immediate improvements to Terminal B/C apron level holdrooms and Terminal A rehabilitation including a new loading bridge, baggage facilities, and other improvements necessary to implement approved slot reallocations. At Dulles International, projects include replacement of the generator for hot water distribution, taxiway improvements to support a maintenance hangar facility, and preservation of the historic air traffic control tower. Dulles Corridor Enterprise Fund Activities related to the Omer L. Hirst-Adelard L. Brault Expressway, also known as the Dulles Toll Road, and the Dulles Metrorail Project, a large capital improvement project extending the existing Metrorail system to Dulles International and beyond into Loudoun County are accounted for within the Dulles Corridor Enterprise Fund. The Dulles Corridor Enterprise Fund is self-supporting, using tolls collected to support the Dulles Toll Road s operations and maintenance and, along with grants from federal, state, and local governments, to finance the Dulles Corridor s ongoing Capital Improvement Program, which includes the construction of the Dulles Metrorail Project. Constructed in 1984, the Dulles Toll Road is an eight-lane (four lanes in each direction) limited-access highway 13.4 miles in length. It was built in 1984 by VDOT and until November 1, 2008 had been maintained and operated solely by VDOT. It begins just inside the Capital Beltway (Interstate 495) near Falls Church, VA at the Interstate 66 connector to Washington, D.C. The Dulles Toll Road then travels westward through Fairfax County past Dulles International and terminates at the entrance to the Dulles Greenway, a privately-owned toll road. The Dulles Toll Road has one main line plaza at the eastern end near the Capital Beltway and 19 ramp plazas. In 2009, 2-axle vehicle toll rates were 75 at the main toll plaza and 50 at other exit and entrance locations. Effective January 1, 2010, toll rates were increased to $1.00 at the main toll plaza and 75 at other exit and entrance locations. On January 1, 2011, the toll rate at the main toll plaza was increased to $1.25, and on January 1, 2012, the toll rate at the main toll plaza was increased to $1.50, concluding the three-year toll schedule approved by the Board in In 2012, the Board of Directors will establish toll rates for 2013 and potentially additional years. The Dulles Toll Road has 59 toll collection lanes, including 9 E-ZPass-only collection lanes. All tollbooths are equipped with E-ZPass, an electronic toll collection system accepted in 14 contiguous states, including most states in the Virginia-to-Maine corridor. On November 1, 2008, VDOT transferred operating and maintenance responsibility of the Dulles Toll Road to the Airports Authority through a permit and operating agreement for a period of 50 years. With the transfer of the Dulles Toll Road from VDOT, the Airports Authority committed to constructing the Dulles Metrorail Project. This 23-mile extension of the existing Metrorail system begins near the West Falls Church station, continues west through Dulles International and into Ashburn, VA in Loudoun County. The project, once completed, will be conveyed to and operated by the Washington Metropolitan Area Transit Authority (WMATA) and will provide a one-seat ride from Dulles International to downtown Washington, D.C. The Dulles Metrorail Project is being constructed in two phases and will include the addition of 128 rail cars. Phase 1 of the Dulles Metrorail Project will extend 11.7 miles from near the West Falls Church station to Wiehle Avenue in Reston, VA. It includes five new stations and improvements to the existing WMATA service and inspection yard at the West Falls Church station. Phase 1 construction activities began in March 2009 with completion expected by December 2013, or earlier. Phase 2 of the Dulles Metrorail Project will extend the Metrorail system an additional 11.3 miles from Wiehle Avenue in Reston to Dulles International and into Loudoun County. Phase 2 of the Metrorail Project is 4
13 expected to include six new stations and a maintenance yard located on Dulles International property. Preliminary engineering began under the direction of the Virginia Department of Rail and Public Transportation but was deferred before the transfer of the project to the Airports Authority. Phase 2 preliminary engineering resumed in 2009 and 100 percent preliminary engineering was completed in March Procurement of the Phase 2 Design-Build contract is expected to be initiated in AIRPORTS AUTHORITY S ECONOMIC ENVIRONMENT In spite of extraordinary volatility in the global economy, the Washington, D.C. region has grown steadily for the past two decades. As home to the federal government and the fifth largest regional economy in the nation, the area currently boasts the second-highest Gross Regional Product per capita in the US. 1 Citing the region s strong economy and low unemployment rate, Dow Jones & Co. s MarketWatch named Washington the Best City for Business. 2 Population growth in the metropolitan Washington area (Air Trade Area) has consistently outpaced population growth in the United States. Within the region, the largest concentrations of population are in the jurisdictions of Fairfax County, Virginia; Montgomery County, Maryland; Prince George s County, Maryland; and the District of Columbia. 3 Air Trade Area Population Concentration of 5.6 Million Residents U.S. Census Bureau, 2010 Other, 20% Fairfax County, VA, 19% Frederick County, MD, 4% Loudoun County, VA, 6% Montgomery County, MD, 17% Prince William County, VA, 7% District of Columbia, 11% Prince George's County, MD, 15% The region s median household income is 69 percent higher than the U.S. median household income, as reported in the Census Bureau s 2010 American Community Survey, 4 and unemployment remains well below the national average. As of December 2011, the Washington Metropolitan Statistical Area had the lowest 1 Source: Greater Washington Initiative, Greater Washington Regional Report 2 Source: Washington tops Best Cities for Business. MarketWatch, December 13, Source: U.S. Census Bureau Population Division, May Source: U.S. Census Bureau s American Community Survey,
14 unemployment rate among the metropolitan areas with a Census 2000 population of one million or more. 5 As of December 2011, the Air Trade Area unemployment rate of 5.8 percent was significantly lower than the 9.0 percent U.S. average. Average Annual Unemployment Rate U.S. Bureau of Labor Statistics 10% 9% 8% 7% 6% 5% 4% 3% 2% 1% 0% Air Trade Area United States Activity generated by the federal government provides a solid foundation and economic stimulus to the metropolitan area in both up and down cycles. The federal government s procurement spending in the Air Trade Area totaled $78.9 billion in 2010, up $3.3 billion or 4 percent from Employment in the region is well-diversified. In addition to the federal government sector, the Air Trade Area is also home to numerous large and small private companies, including 18 Fortune 500 companies by revenue 6. In recent years, Computer Sciences Corporation, Hilton Worldwide, Volkswagen North America, and SAIC have all relocated their corporate headquarters to the Washington region. Additionally, in September 2011, Northrop Grumman moved its headquarters from Los Angeles, California to Falls Church, Virginia. Air Trade Area Employment by Industry Bureau of Labor Statistics Government Professional Business Services Trade, Transportation, and Utilities Education and Health Services Leisure and Hospitality Other Services Financial Services Mining, Logging, and Construction Information Manufacturing Number of Employees (in thousands) 5 Source: U.S. Bureau of Labor Statistics 6 Source: Greater Washington Initiative, Greater Washington Regional Report 6
15 Aviation and Toll Road Activity Although the recent economic downturn has impacted the Air Trade Area less than the rest of the country, it has not left the region untouched. In 2011, system-wide passenger growth at Reagan National and Dulles International was 0.5 percent, marking the third consecutive year of growth. Activity levels at Reagan National reached record levels with total passengers of 18.8 million, representing a 3.9 percent increase over 2010 activity of 18.1 million. The increase in passenger traffic at Reagan National exceeded the U.S. industry average increase of 1.5 percent. Total aircraft operations at the airport increased from 271 thousand operations in 2010 to 282 thousand in In 2011, Dulles International served 23.2 million passengers, a 1.7 percent decrease from 2010 when Dulles served 23.6 million passengers. Although domestic passengers decreased 2.9 percent to 16.6 million in 2011, international passenger traffic at Dulles International increased 1.6 percent to 6.5 million passengers. This marked the eighth consecutive year of international passenger growth at Dulles International, which included new air service to Reykjavik, Iceland. Total aircraft operations at Dulles International declined 3.0 percent in 2011 to 327 thousand operations, from 337 thousand operations in MWAA System-Wide Passengers (In Millions) Reagan National (Total) Dulles (Domestic) Dulles (International) Dulles Toll Road toll transactions totaled million in 2011 compared to million in 2010, which represented a 3.1 percent decline in activity. This decrease was consistent with planned projections and primarily attributed to toll increases that went into effect on January 1, Industry Outlook The downward trend in air traffic levels had been reversing during 2010 and through the first half of However, enplanement growth leveled off in the latter half of Continued economic instability in the U.S. and abroad, reduced federal funding, limited airline expansion capability, and volatile fuel prices may challenge future growth in airline and toll road activity. 7 In light of these projections, the Airports Authority will 7 Source: U.S. Airports: Trends Indicate Another Difficult Year Ahead. Moody s. January 25,
16 continue to closely manage budgeted expenditures in order to minimize increases to airline rates and charges and toll rates. The Airports Authority s Operating Budgets The Airports Authority s annual operating budgets are a financial planning tool outlining the estimated revenues and expenses for the Airports and for the Dulles Toll Road at certain activity levels. The budgets are prepared in a manner consistent with the Use and Lease Agreement, which is not in accordance with generally accepted accounting principles (GAAP). The President and Chief Executive Officer submits the Airports Authority s annual operating budgets to the Board for approval. Budgetary controls and evaluations are effected by comparing actual interim and annual results with the budgets, noting the actual level of activities, and ensuring compliance with the provisions of the annual operating budgets approved by the Board. In keeping with the requirements of a proprietary fund, budgetary comparisons have not been included in the financial section of this report. Aviation Enterprise Fund In 2011, the Airports Authority s budget minimized increases to airline rates and charges, maintained the ability to operate the Airports in a safe and secure manner and met customer service standards, with the goal of sustaining the Airports Authority s long-term financial strength. Operating revenues reached 98.9 percent of budget expectations in 2011 and 99.4 percent in Operating expenses reached 92.8 percent of budget authorization in 2011, while in 2010 expenses reached 93.9 percent of budget authorization. The Airports Authority s 2011 budget reflected an 11.1 percent increase in revenues and a 2.3 percent increase in expenses, as compared to Aviation Enterprise Fund Operating Budget As a Percentage Budget Actual¹ of Budget 2011 Revenues $ 629,559,500 $ 622,548, % 2011 Expenses 2 $ 325,706,000 $ 302,182, % 2010 Revenues $ 566,638,000 $ 563,033, % 2010 Expenses 2 $ 318,292,000 $ 298,743, % ¹ Actual results are stated on a budgetary basis for management purposes, which is not consistent with GAAP 2 Budgeted expenses exclude depreciation expense Dulles Corridor Enterprise Fund The 2011 operating budget for the Dulles Corridor Enterprise Fund reflected the third full year of the Airports Authority s operations of the Dulles Toll Road. Operating revenues reached 96.7 percent of budget expectations in 2011, while in 2010, operating revenues reached percent of budget expectations. Operating expenses reached 90.1 percent of budget authorization in 2011 and percent in The Airports Authority s 2011 budget reflected an 11.3 percent increase in revenues, due to increases in toll rates, and a 12.9 percent increase in expenses, due to an increase in allocated costs, as compared to 2010 amended budgeted amounts. 8
17 Dulles Corridor Enterprise Fund Operating Budget As a Percentage Budget Actual¹ of Budget 2011 Revenues $ 97,847,000 $ 94,659, % 2011 Expenses $ 27,843,000 $ 25,085, % 2010 Revenues $ 87,919,000 $ 88,038, % 2010 Expenses $ 24,652,000 $ 26,247, % ¹Actuals are stated on a budgetary basis for management purposes, which is not consistent with GAAP Long-Term Financial Planning Aviation Enterprise Fund The Airports Authority s long-term financial planning includes the completion of certain approved capital expenditures and the accumulation of sufficient resources required to service the debt issued to finance these expenditures and operate and maintain the Airports. Under terms of the Use and Lease Agreement, fees and charges paid by the Airlines are used along with other income from the Airports to service the debt issued to finance the construction program. It is anticipated that the major portion of future facilities development will be financed with the proceeds of bonds issued under the Master Indenture. In addition, the Airports Authority also expects to use Passenger Facility Charge (PFC) revenues, federal and state grants, and the Airports Authority s portion of net remaining revenues to finance capital development costs. Because of operating constraints at Reagan National, including slot and perimeter regulations, much of the future growth in aviation activity for the Air Trade Area is forecasted to occur at Dulles International. Dulles Corridor Enterprise Fund The Dulles Corridor Enterprise Fund s long-term planning includes the completion of the Dulles Metrorail Project and certain approved capital expenditures on the Dulles Toll Road and in the Dulles Corridor. The Airports Authority anticipates that funding for the capital expenditures in the Dulles Corridor will include tolls and charges collected on the Dulles Toll Road, the issuance of Dulles Toll Road revenue bonds, FTA funding, and continued receipt of state and local grants. OTHER INFORMATION The Airports Authority s Internet Web Page The Airports Authority has an Internet website offering a wide array of information to users, including financial information and operational statistics. Users can obtain direct access to the airlines serving the Airports, as well as flight arrival and departure information. The Airports Authority s CAFR, Budget, Master Indenture, Official Statements, Debt Service Review, airline rates and charges, and aviation statistics are posted on the website. Since September 11, 2001, the Airports Authority has posted monthly unaudited financial statements to include discussion of results and other information for the Airports Authority s bondholders and other interested parties. The financial information for the Airports Authority is available on the website at the following address: 9

18 Recognition of Awards and Achievement The GFOA has awarded a Certificate of Achievement for Excellence in Financial Reporting to the Airports Authority for its CAFR for the year ended December 31, This was the twenty-second consecutive year that the Airports Authority has received this prestigious award. In order to be awarded a Certificate of Achievement, a government must publish an easily readable and efficiently organized CAFR that satisfies both GAAP and applicable legal requirements. A Certificate of Achievement is valid for a period of one year only. We believe that our current CAFR meets the Certificate of Achievement Program s requirements, and we are submitting it to the GFOA to determine its eligibility for another certificate. The Airports Authority has also received the GFOA s Award for Distinguished Budget Presentation eighteen times and the GFOA s Popular Annual Financial Reporting Award for the last six consecutive years. Acknowledgments In closing, I would like to thank the Board of Directors and the President and Chief Executive Officer for their leadership and support in planning and conducting the financial operations of the Airports Authority. Special thanks are expressed to Mark Tune, Controller, Chris Wedding, Assistant Controller, Julia Hodge, Department Manager, Financial Strategy & Analysis, Greg Cohen, Manager, Financial Strategy, and Diane Lary, Financial Technician for the preparation of this year s CAFR. I would also like to thank all personnel within the Office of Finance for their contributions, without whom this CAFR would not be completed. Finally, appreciation is expressed to the firm of PricewaterhouseCoopers LLP for their dedication to completing a timely audit and their work enabling an unqualified opinion for the 2011 Financial Statements. Andrew T. Rountree, CPA Vice President for Finance and Chief Financial Officer 10
19 11
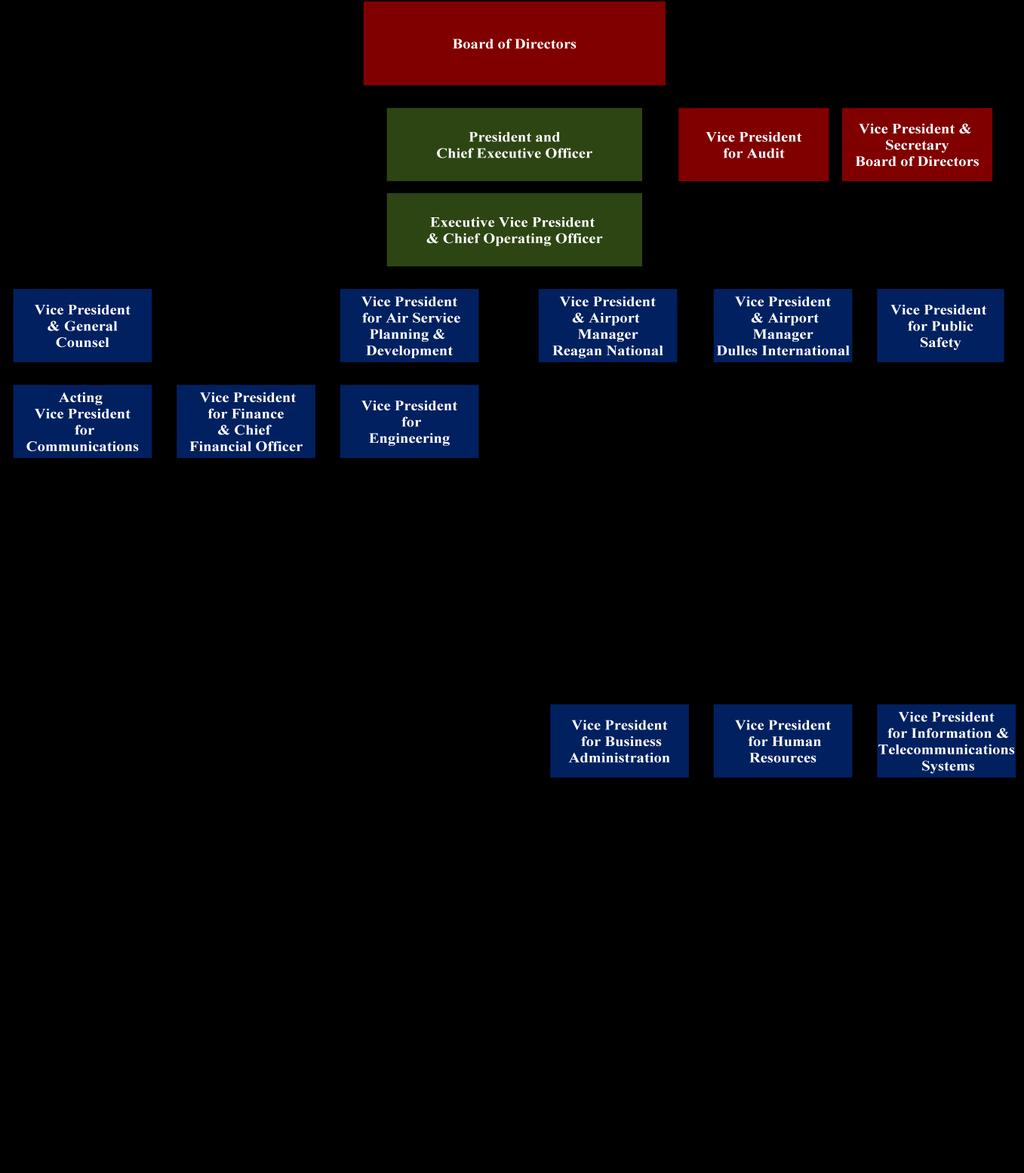
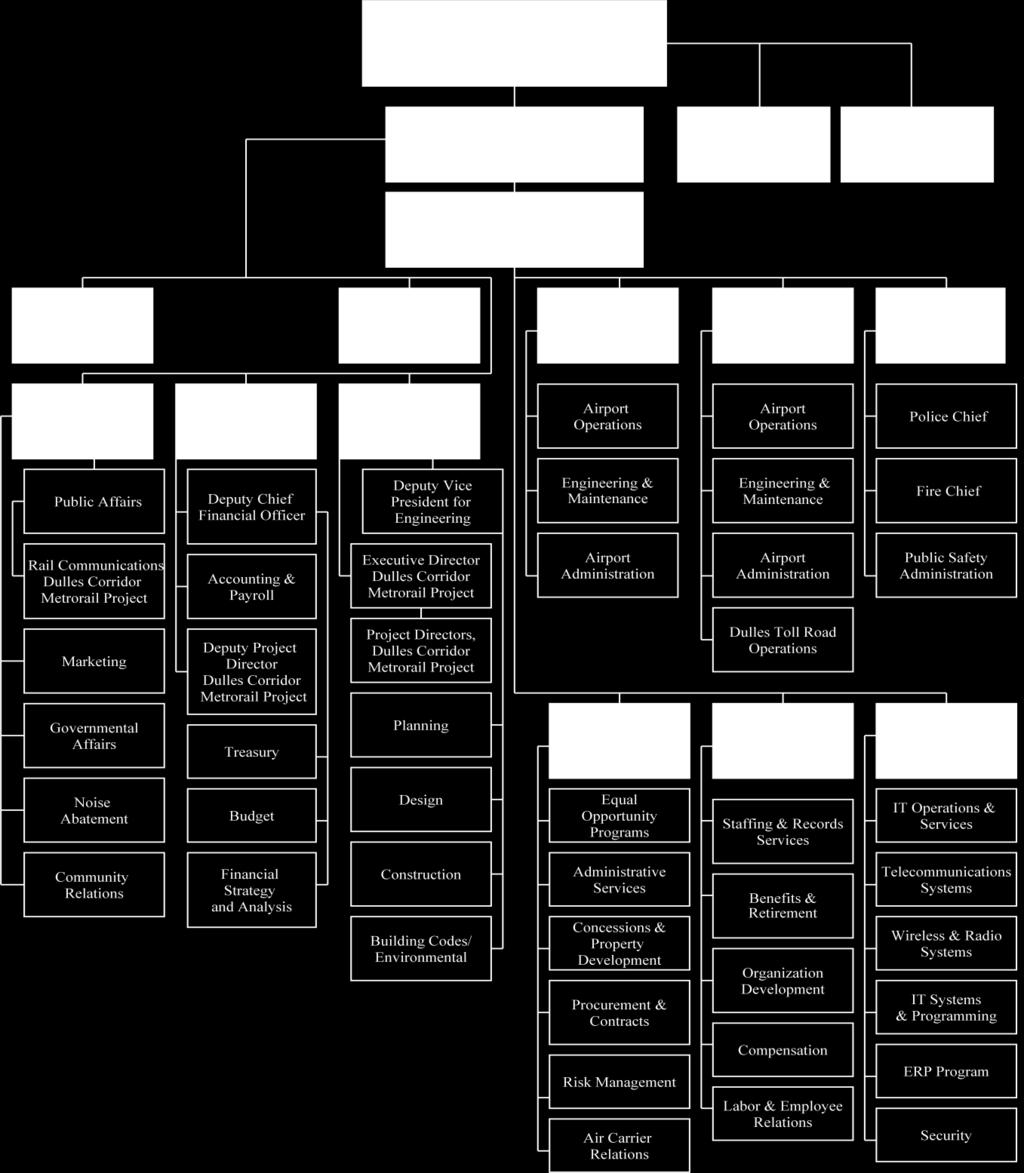
20 12 Organization Chart As of December 31, 2011
 i) Aviation Enterprise, ii) Dulles Corridor Enterprise and")
21 Report of Independent Auditors To the Board of Directors of the Metropolitan Washington Airports Authority In our opinion, the accompanying statements of net assets and the related statements of revenues, expenses and changes in net assets and of cash flows of the Metropolitan Washington Airports Authority (the "Airports Authority") i) Aviation Enterprise, ii) Dulles Corridor Enterprise and iii) Total Business-Type Activities, which collectively comprise the Airports Authority's basic financial statements, present fairly, in all material respects, the respective financial positions of each of the Aviation Enterprise, Dulles Corridor Enterprise and Total Business-Type Activities of the Airports Authority as of December 31, 2011 and December 31, 2010, and the respective changes in financial position and cash flows thereof for the years then ended in conformity with accounting principles generally accepted in the United States of America. These financial statements are the responsibility of the Airports Authority s management. Our responsibility is to express opinions on these financial statements based on our audits. We conducted our audits of these statements in accordance with auditing standards generally accepted in the United States of America. Those standards require that we plan and perform the audit to obtain reasonable assurance about whether the financial statements are free of material misstatement. An audit includes examining, on a test basis, evidence supporting the amounts and disclosures in the financial statements, assessing the accounting principles used and significant estimates made by management, and evaluating the overall financial statement presentation. We believe that our audits provide a reasonable basis for our opinions. As discussed in Note 2 to the basic financial statements, the Airports Authority has restated its 2010 financial statements to correct errors. The Management's Discussion and Analysis (MD&A) on pages 15 through 32 is required by accounting principles generally accepted in the United States of America to supplement the basic financial statements. The required supplementary information, although not part of the basic financial statements, is required by the Government Accounting Standards Board who considers it to be an essential part of financial reporting for placing the basic financial statements in the appropriate operational, economic, or historical context. We have applied certain limited procedures to the required supplementary information in accordance with auditing standards generally accepted in the United States of America, which consisted of inquiries of management about the methods of preparing the information and comparing the information for consistency with management's responses to our inquiries, the basic financial statements, and other knowledge we obtained during our audit of the basic financial statements. We do not express an opinion or provide any assurance on the information because the limited procedures do not provide us with sufficient evidence to express an opinion or provide any assurance. Our audits were conducted for the purpose of forming an opinion on the Airports Authority's basic financial statements described in the first paragraph above. The introductory and statistical sections are presented for purposes of additional analysis and are not a required part of the basic financial statements. Such information has not been subjected to auditing procedures and, accordingly, we express no opinion nor provide any assurance on it. April 30, 2012 PricewaterhouseCoopers LLP, 1800 Tysons Boulevard, McLean, VA T: (703) , F: (703) ,
22 Intentionally Left Blank
23 MANAGEMENT S DISCUSSION AND ANALYSIS (unaudited) INTRODUCTION The purpose of the following discussion and analysis of the financial performance and activity of the Metropolitan Washington Airports Authority (the Airports Authority) is to provide an introduction and overview of the basic financial statements of the Airports Authority for the year ended December 31, 2011 with selected comparative information for the years ended December 31, 2010 and December 31, This discussion has been prepared by management, is unaudited, and should be read in conjunction with the financial statements and the notes thereto, which follow this section. Using the Financial Statements The Airports Authority s financial report includes three financial statements: the Statements of Net Assets; the Statements of Revenues, Expenses and Changes in Net Assets; and the Statements of Cash Flows. The financial statements are prepared in accordance with accounting principles generally accepted in the United States of America as promulgated by the Governmental Accounting Standards Board (GASB). The financial statements presentation includes two enterprise funds. The Aviation Enterprise Fund encompasses the activity of Ronald Reagan Washington National Airport (Reagan National) and Washington Dulles International Airport (Dulles International), collectively, the Airports. The Dulles Corridor Enterprise Fund encompasses the Airports Authority s activity within the Dulles Corridor, which includes, but is not limited to, the Dulles Toll Road and the Dulles Corridor Metrorail Project (Dulles Metrorail Project). The Dulles Corridor is the transportation corridor with an eastern terminus of the East Falls Church Metrorail station at Interstate Route 66 and a western terminus of VA Route 772 in Loudoun County, VA. The Statements of Net Assets depict the Airports Authority s financial position as of a point in time, December 31, and include all assets and liabilities of the Airports Authority. The Statements of Net Assets demonstrate that the Airports Authority s assets equal liabilities plus net assets. Net assets represent the residual interest in the Airports Authority s assets after liabilities are deducted. Net assets are displayed in three components: invested in capital assets, net of related debt; restricted; and unrestricted. The Statements of Revenues, Expenses and Changes in Net Assets report total operating revenues, operating expenses, non-operating revenues and expenses, and other changes in net assets for a fiscal period, the year ended December 31. Revenues and expenses are categorized as either operating or non-operating based upon management's policy as established in accordance with definitions set forth by GASB. Significant recurring sources of the Airports Authority s revenues, including Passenger Facility Charges (PFCs), investment income, and federal, state, and local grants are reported as non-operating revenues or capital contributions. The Airports Authority s interest expense is reported as a non-operating expense. The Statements of Cash Flows present information showing how the Airports Authority s cash and cash equivalents position changed during the fiscal year. The Statements of Cash Flows classify cash receipts and cash payments resulting from operating activities, noncapital financing activities, capital and related financing activities, and investing activities. Prior Period Restatement As discussed in Note 2 to the basic financial statements, the Airports Authority has restated its 2010, 2009 and prior years financial statements principally to correct the accrual of mark-to-market valuations for 15
24 long term investments, to reclassify various long-term liabilities in the determination of net assets, to correct interest expense for non-taxable debt proceeds, and to correct various other accruals. These restatements have been reflected for comparative reporting throughout the Management s Discussion and Analysis and are indicated as such. The Airports Authority s Activity Highlights Aviation Enterprise Fund Pursuant to the Airports Authority s Airport Use Agreement and Premises Lease (Use and Lease Agreement), the Airports Authority has activity-based revenues which include non-airline fees such as those from parking, rental car activities, and other concessions and airline-based fees such as landing fees, rents, international arrival fees, and passenger conveyance fees. There have been many factors and events that have negatively affected the air transportation industry in the recent past, such as the domestic economic downturn beginning in the latter part of 2007 and continuing through 2009 and recent economic crises in Europe. The Airports Authority s budget minimized increases to airline rates and charges, maintained the ability to operate the Airports in a safe and secure manner, and met customer service standards, with the goal of sustaining the Airports Authority s long-term financial strength. Overall system activity remained strong in the face of these economic changes. Enplanements and operations activity for the last three years follows: Enplanements and Operations Activity for 2009 to Reagan National Enplanements Domestic 9,235,899 8,891,204 8,634,011 Transborder 126, , ,232 Non-Commercial 10,398 6,511 4,651 Total Enplanements 9,372,361 9,042,055 8,771,894 Dulles International Enplanements Domestic 8,292,159 8,564,825 8,429,620 International 3,224,432 3,177,235 3,117,151 Non-Commercial 72,597 73,118 67,557 Total Enplanements 11,589,188 11,815,178 11,614,328 Total Operations Reagan National 281, , ,146 Dulles International 327, , ,367 16
25 15 Total Enplanements (In Millions) 400 Total Operations (In Thousands) Reagan National Dulles International Reagan National Dulles International Enplanements at Reagan National for the 12 months of 2011 were 9.4 million, compared to 9.0 million for the year 2010 and 8.8 million for the year The increase in enplanements was primarily attributable to new nonstop service that jetblue and Delta began in November 2010 and continued into In 2010, jetblue added air service from Regan National to Boston, Fort Lauderdale, and Orlando while Delta expanded air service to Hartford, Columbus, Jacksonville, Orlando, Miami, Tampa, and St. Louis. In 2011, Sun Country Airlines added new nonstop service to Lansing, and Spirit Airlines added service to Myrtle Beach. Total enplanements at Dulles International for the 12 months of 2011 were 11.6 million compared to 11.8 million in 2010 and 11.6 million in The decline in domestic enplanements in 2011 was partially attributable to the consolidated operations of United and Continental Airlines, as well as the transfer of select jetblue air service to Reagan National. In 2011, Dulles International welcomed Icelandair with service to Reykjavik. This increased international air service continued a positive trend from 2010, when Turkish Airlines began new nonstop service to Istanbul, AeroSur began weekly nonstop service to Bolivia, and Ethiopian Airlines expanded daily service to Addis Ababa. International enplanements of 3.2 million for the 12 months of 2011 represented a 1.5 percent and 3.4 percent increase over 2010 and 2009 international enplanements, respectively. Total North American domestic and international enplanements increased by 1.5 percent in Domestic enplanements grew 1.5 percent, while international enplanements grew 1.4 percent. Reagan National exceeded the domestic growth rate by 2.4 percent, due to the aforementioned increases in air service. Dulles International s domestic passenger growth rate was -3.2 percent, which was 4.7 percent lower than the industry growth rate. This decline was primarily a result of capacity adjustments by domestic carriers. However, international enplanements growth of 1.5 percent at Dulles International outpaced the industry growth rate in 2011, further solidifying the Airport s position as the international gateway for the region. Airports 2011 Enplanements Growth Authority North America Difference Reagan National (Domestic) 3.9% 1.5% 2.4% Dulles International (Domestic) -3.2% 1.5% -4.7% Dulles International (International) 1.5% 1.4% 0.1% 17
26 Dulles Corridor Enterprise Fund On November 1, 2008, the Virginia Department of Transportation (VDOT) transferred operating and maintenance responsibility of the Dulles Toll Road to the Airports Authority through a permit and operating agreement for a period of 50 years. The Airports Authority contracted operations of the Dulles Toll Road to VDOT from the date of transfer until September 30, As of October 1, 2009, the employees of the Dulles Toll Road became employees of the Airports Authority, all contracts of the Dulles Toll Road became contracts of the Airports Authority, and the Airports Authority s public safety department began providing the primary police and fire service for the Dulles Toll Road. As part of the agreement with the Commonwealth of Virginia (the Commonwealth), the Airports Authority is constructing the Dulles Metrorail Project from the vicinity of the West Falls Church Metrorail station to Route 772 in Loudoun County and will make other improvements in the Dulles Corridor consistent with VDOT and regional plans, using revenues from the Dulles Toll Road to pay the resulting debt service. The Dulles Toll Road has one main line plaza at the eastern end near the Capital Beltway and 19 ramp plazas. In 2009, 2-axle vehicle toll rates were 75 at the main toll plaza and 50 at other exit and entrance locations. Effective January 1, 2010, toll rates were increased to $1.00 at the main toll plaza and 75 at other exit and entrance locations. On January 1, 2011, the toll rate at the main toll plaza increased to $1.25, and on January 1, 2012, the toll rate at the main toll plaza increased to $1.50. These toll increases are necessary to support the financing for the Dulles Metrorail Project. The Dulles Toll Road processed an average of 8.4 million toll transactions per month in This was a decrease from 2010 of 268 thousand transactions per month, or a 3.1 percent drop in transactions for the year. The transaction volume was largely due to higher toll rates that became effective January 1, 2011 and was approximately 97 percent of forecasted transactions. Actual vs. Forecasted Transactions (Millions) Actual Forecast 18 Source: Dulles Toll Road Traffic and Revenue Study (April 15, 2010) Financial Highlights - Aviation Enterprise Fund The overall activity results of 2011 reflect the continued gradual reversal of negative trends experienced across the aviation industry as a result of the recession that started in December The Aviation Enterprise Fund recorded $664.0 million in operating revenues for This was a total increase from 2010 of $60.1 million and an increase from 2009 of $105.5 million. The Aviation Enterprise Fund s revenues are primarily derived from rents and charges for the use of the Airports Authority s facilities, including landing fees received
27 from airlines using the Airports and concession contracts at the Airports, including parking and off-airport rental car operations. Concessions historically have accounted for a substantial portion of the Aviation Enterprise Fund s revenues and comprised 34.3 percent of total operating revenues in Signatory airlines, those that have signed the Use and Lease Agreement, are required to pay actual costs plus debt service coverage, while the majority of concessionaires pay the greater of a percentage of revenue or a minimum annual guarantee (MAG). Aviation Enterprise Fund Operating revenues Rents $ 275,428,113 $ 226,375,685 $ 193,736,080 Concessions 227,599, ,973, ,461,176 Landing fees 110,255, ,637,867 96,934,558 Utility sales 11,979,591 12,464,920 13,227,161 Passenger fees 30,331,231 25,913,521 30,665,358 Other 8,381,229 6,509,225 6,429,128 Total operating revenues $ 663,975,831 $ 603,874,716 $ 558,453,461 Aviation Enterprise Fund Operating Revenues (In Millions) $700 $600 $500 $400 $300 $200 $100 $0 $110 $102 $97 $228 $231 $217 $275 $226 $ Rents Concessions Landing fees Passenger fees Utility sales Other Source: Statement of Revenues, Expenses, and Changes in Net Assets Airline Revenues Airlines that operate at Reagan National and Dulles International pay for the costs to operate the Airports and to service the Airports debt. When operating costs for the Airports Authority increase, there is a corresponding increase in the rates charged to the airlines. In 2011, airline revenues, which consist of terminal rents, landing fees, and passenger fees totaled $416.0 million. This was an increase of $62.1 million, or 17.5 percent, compared to 2010 and an increase of $94.7 million, or 29.5 percent, compared to In 2011, rent revenues totaled $275.4 million, which was an increase of $49.1 million from 2010 and an increase of $81.7 million from The key drivers of increased terminal rents in recent years include higher operating costs as a result of the expanded International Arrivals Building at Dulles International and increases in debt service costs resulting from Terminal A improvements at Reagan National and the Automated People Mover (AeroTrain) that was placed into service at Dulles International in early In 2011, landing fees totaled $110.3 million, which was an increase of $8.6 million and $13.3 million from 2010 and 2009, respectively. The increases in total landing fees were consistent with the increase in combined operations at both Airports. Passenger 19
28 fees, including conveyance, International Arrivals fees, and fees paid by the Transportation Security Administration (TSA) increased $4.4 million, or 17.0 percent, from 2010 and decreased $334 thousand, or 1.1 percent, from The increase in passenger fees over 2010 was driven by an increase in international traffic and corresponding International Arrivals Building fees at Dulles International. In 2011, prior-year transfers, which are used as an offset to revenues paid by the Airlines, remained flat at $61.6 million. Please refer to Note 3 Airport Use Agreement and Premises Lease for more detail. Concessions Revenues The Airports Authority s concession revenues totaled $227.6 million, which was a decrease of $3.4 million, or 1.5 percent, compared to 2010 and an increase of $10.1 million, or 4.7 percent, from In 2011, concession revenues accounted for 34.3 percent of total operating revenues, down 3.9 percent from 2010, as a result of the overall decline in concession revenues and the aforementioned increase in airline revenues. Car parking revenues continued to rank as the Airports Authority s largest concession in 2011, providing $108.9 million in total revenues for the year. This was a decrease of $1.2 million from 2010 but an increase of $1.2 million from The decrease in parking revenues in 2011 was partially attributable to lower domestic passenger enplanements at Dulles International, which declined 3.2 percent from 2010 and 1.6 percent from In 2011, rental car revenues totaled $38.7 million, which decreased $5.6 million and $159 thousand from 2010 and 2009, respectively. In July 2011, a new rental car contract was awarded at Reagan National, which provided for lower MAG amounts than the previous contract. Food and beverage revenues totaled $17.3 million in 2011, which represented an increase of $800 thousand from 2010 and $1.6 million from New concepts in 2011 included Qdoba Mexican Grill at Reagan National. Fixed Base Operator (FBO) revenues of $14.1 million in 2011 increased $1.5 million from 2010 and $1.8 million from Higher MAGs accounted for nearly $1.1 million of the increase over 2010, while percentage revenues increased $427 thousand due to higher prices on fuel sold by the FBOs. All other areas of 2011 concession revenues accounted for a combined net increase of $1.1 million and $5.7 million over 2010 and 2009, respectively. These increases were largely attributable to steady increases in duty free and advertising revenues, which offset moderate declines in other concession revenues. The following table details concession revenues by major category for the years ended December 31, 2011, December 31, 2010 and December 31, 2009: Concession Revenues Parking $ 108,936,324 $ 110,150,990 $ 107,721,718 Rental cars 38,706,628 44,305,092 38,865,186 Food and beverage 17,274,882 16,474,539 15,626,929 Fixed base operator 14,109,352 12,560,170 12,353,018 Display advertising 12,061,771 11,652,665 8,243,796 Newsstand and retail 12,003,769 11,837,876 11,900,884 Ground transportation 7,787,856 8,425,163 7,315,514 Inflight caterers 7,172,499 6,768,559 6,705,056 Duty free 4,009,278 3,200,337 2,881,047 All other 5,537,636 5,598,107 5,848,028 Total $ 227,599,995 $ 230,973,498 $ 217,461,176 20
29 Operating Expenses Operating expenses for the Aviation Enterprise Fund for the fiscal year ended December 31, 2011 totaled $578.8 million, an increase of $4.8 million, or 0.8 percent, over 2010, and $71.9 million, or 14.2 percent, from Materials, equipment, supplies, contract services, and other expenses increased by $7.0 million, or 3.9 percent in This increase was largely a result of contractual spending related to the implementation of a new Oracle Enterprise Resource Planning (ERP) System. Services expenses increased by $7.1 million in 2011, with spending on IT services accounting for $5.2 million of the increase. Project expenses were also higher in 2011 than in 2010, increasing from $5.6 million to $9.6 million as a result of higher non-capitalized project costs associated with ERP implementation. Operating expenses in 2010 increased $67.1 million from 2009 due to record snow events, new contracted operations of the AeroTrain, as well as additional depreciation and amortization expenses. After three years of development, the Airports Authority implemented Oracle EBusiness Solutions as its new ERP System. According to accounting principles as promulgated in GASB Statement No. 51, Accounting and Financial Reporting for Intangible Assets (GASB 51), the Airports Authority was in the developmental stage of the implementation program through early 2009 and expensed the costs through the Statements of Revenues, Expenses and Changes in Net Assets. From 2009 until the system was placed in service in June of 2011, applicable costs were capitalized. All related training and data conversion costs were expensed. Salaries and related benefits expenses declined $202 thousand from 2010 to $148.1 million in Regular full time pay for Airports Authority employees increased by $3.0 million, or 3.2 percent, over In 2011, The Airports Authority s health insurance expenses increased by $1.2 million to $15.3 million. These increases were offset by a 24.8 percent reduction in overtime costs which fell by $2.6 million as a result of lower snowfall, as well as a decline in Other Post Retirement Employee Benefits (OPEB) expenses, which decreased by $1.5 million to $6.8 million in The Airports Authority recorded other post-retirement benefits expenses of $6.8 million and $8.3 million in 2011 and 2010, respectively. The contribution percentages to the Airports Authority s retirement plans decreased to 7.4 percent in 2011 from 7.5 percent of eligible earnings in 2010 for the general plan and decreased to 14.7 percent in 2011 from 16.0 percent of eligible earnings in 2010 for the police and firefighter plan. The funded ratio as of the actuarial valuation date of December 31, 2010 was percent for the general plan and 99.0 percent for the police and firefighters plan. The Airports Authority s utility expenditures for 2011 were $26.5 million, an increase of $2.2 million from The increase in utility expenses was driven principally by higher electricity rates, which resulted in a $3.2 million increase in electricity expense. Spending on natural gas declined by $800 thousand in 2011 due to a decrease in rates, and helped to mitigate the increase in electricity costs. The Airports Authority s utilities expenses in 2010 totaled $24.4 million, a decrease of $3.8 million from In 2010, the Airports Authority joined an energy consortium, which helped reduce utility expenses. Depreciation and amortization expense in 2011 was $211.4 million. This was a decrease of $4.2 million from 2010 and an increase of $26.6 million from In January 2010, the AeroTrain became operational at Dulles International, and in November 2010, the Airports Authority completed the second phase of the International Arrivals Building (IAB). At Reagan National, the parking garage was expanded and runway and taxiway improvements were completed in In 2011, the Airports Authority completed the final phase of the IAB expansion at Dulles International and runway 1/19 improvements at Reagan National. For more information on changes in capital assets, please refer to Note
30 A cost allocation plan is used to identify and quantify all overhead and other indirect costs appropriately allocable to the Dulles Toll Road or to the Dulles Metrorail Project within the Dulles Corridor Enterprise Fund. As a result of this allocation plan, $8.5 and $7.3 million of Aviation Enterprise Fund operating expenses were allocated to the Dulles Corridor Enterprise Fund in 2011 and 2010, respectively. The following presents total operating expenses for the years ended December 31, 2011, December 31, 2010 and December 31, 2009: Aviation Enterprise Fund (Restated) 2009 (Restated) Operating expenses M aterials, equipment, s upplies, contract s ervices, and other $ 187,607, ,632,889 $ 148,303,889 Salaries and related benefits 148,072, ,274, ,545,604 Utilities 26,542,084 24,375,181 28,141,650 Lease from U.S. Government 5,180,558 5,101,119 5,066,069 Depreciation and amortization 211,365, ,536, ,798,166 Total operating expens es $ 578,768,172 $ 573,920,149 $ 506,855,378 $700 Aviation Enterprise Fund Operating Expenses (In Millions) $600 $500 $400 $27 $24 $148 $148 $141 $28 $300 $200 $188 $181 $148 $100 $0 $211 $216 $ (Restated) 2009 (Restated) 22 Depreciation & Amortization Materials, Equipment, Supplies Salaries Utilities Lease Source: Statement of Revenues, Expenses, and Changes in Net Assets Changes in Net Assets Operating income was $85.2 million in 2011, which was a $55.3 million increase from The results primarily reflect the increase in airline and other revenues, which outpaced the increases in operational expenses. Airline rates and charges were increased in 2011, primarily as a result of increased debt service related to the completion of significant capital projects. Higher operating expenses in 2010 caused operating income of $30.0 million in 2010 to decline $21.6 million from When compared to 2010, total non-operating revenues increased $4.0 million and non-operating expenses increased $74.1 million. Non-operating revenues in 2011 was comprised of $24.7 million in investment income and $0.9 million of federal, state, and local grants. Non-operating expenses totaled $318.2
31 million and were comprised of interest expense of $222.0 million and fair value losses on swaps. The change in fair value on swaps for 2011 was a loss of $96.2 million. The change in fair value on swaps for 2010 was a loss of $35.0 million. This indicates the amount of a payment that would be due to the counterparty by the Airports Authority if the swap is terminated in the current market. Please refer to Note 14 Derivatives for more information on the swap portfolio. Capital contributions include PFCs, federal, state, and local grants, and other capital property acquired. PFC revenues for 2011 was $78.6 million, which was a decrease of $1.5 million from PFC revenues in 2010 totaled $80.1 million, which was an increase of $1.6 million from $78.5 million in Federal, state, and local capital contribution grants were $54.8 million in 2011, $61.8 million in 2010, and $24.2 million in In 2011, the Aviation Enterprise Fund received $25.7 million in Airport Improvement Program (AIP) grants primarily to reimburse the capital cost of rehabilitating runway 1/19, improving the safety area of runway 1/19, and constructing the fourth runway at Dulles International. The Aviation Enterprise Fund also received American Recovery and Reinvestment Act (ARRA) grants of $20.9 million for TSA surveillance closed circuit TV and in-line baggage electronic detection systems. The Aviation Enterprise Fund also received $6.3 million from TSA for in-line baggage screening. The change in net assets is an indicator of the overall fiscal condition of the Aviation Enterprise. Net assets decreased in 2011 by $68.8 million and $50.0 million in The 2011 decrease includes the $96.2 million fair value loss on swaps and the 2010 decrease includes the $35.0 million fair value loss on swaps. The following represents a summary of the Statements of Revenues, Expenses and Changes in Net Assets for the Aviation Enterprise Fund: Aviation Enterprise Fund (Restated) 2009 (Restated) Operating income Operating revenues $ 663,975,831 $ 603,874,716 $ 558,453,461 Operating expenses 578,768, ,920, ,855,378 Total operating income 85,207,659 29,954,567 51,598,083 Non-operating revenues Investment income 24,683,618 20,367,841 12,479,026 Federal, state and local grants 874,810 1,192,743 1,415,153 Fair value gains on swaps ,731,481 Total non-operating revenues 25,558,428 21,560, ,625,660 Non-operating expenses Interest expense (221,951,744) (209,147,708) (143,365,937) Passenger facility charges, financing costs - - (944,806) Fair value losses on swaps (96,249,918) (34,978,410) - Total non-operating expenses (318,201,662) (244,126,118) (144,310,743) Income/(Loss) before capital contributions (207,435,575) (192,610,967) 24,913,000 Capital contributions 138,612, ,577, ,727,415 Increase (decrease) in net assets $ (68,823,570) $ (50,033,089) $ 130,640,415 23
32 Financial Highlights - Dulles Corridor Enterprise Fund Operating Revenues For the year ended December 31, 2011, the Dulles Corridor Enterprise Fund recorded toll revenues of $94.7 million, which consisted of Automated Vehicle Identification (AVI) or electronic toll collections of $70.6 million, cash collections of $22.9 million, and violations revenues of $1.1 million. AVI collection as a percentage of total operating revenues was 74.6 percent. In 2010, toll revenues totaled $88.0 million, an increase of $23.1 million from 2009, and consisted of AVI collections of $63.6 million, cash collections of $23.7 million, and violations revenues of $0.7 million. AVI collection as a percent of total operating revenues was 72.2 percent. Overall increases in total operating revenues in 2011 were primarily driven by toll rate increases that went into effect on January 1, Dulles Corridor Enterprise Fund Operating revenues Cash revenues $ 22,905,593 $ 23,715,733 $ 19,199,661 Automated vehicle identification revenues 70,634,124 63,606,906 45,146,685 Violation revenues 1,119, , ,208 Total operating revenues $ 94,659,538 $ 88,038,168 $ 64,893,554 Actual vs. Forecasted Revenues (Millions) $94.7 $97.1 $88.0 $86.3 $64.9 $ Actual Forecast 24 Operating Expenses Source: Dulles Toll Road Traffic and Revenue Study (April 15, 2010) For the years ended December 31, 2011, 2010, and 2009, the Dulles Corridor Enterprise Fund recorded $35.2 million, $34.8 million, and $30.1 million in operating expenses, respectively. In 2011, operating expenses were primarily comprised of materials, supplies, equipment, contract services, and other, which totaled $21.7 million and included $5.1 million in electronic toll collection fees paid to the third party processor of AVI transactions, $4.2 million in maintenance and repair costs, and $1.6 million in consulting services. In 2010, materials, supplies, equipment, contract service, and other totaled $22.8 million, which included $6.2 million in electronic toll collection fees paid to the third party processor of AVI transactions, $3.7 million in maintenance and repair costs, and $1.4 million in contractual snow removal costs.
33 The majority of costs related to the Dulles Corridor Enterprise Fund are directly charged to the Fund. In certain instances, overhead costs for the Airports Authority are initially paid from the Aviation Enterprise Fund but are appropriately allocable to the Dulles Corridor Enterprise Fund as costs associated with operation of the Dulles Toll Road or as costs of the Dulles Metrorail Project. The Airports Authority completed its first cost allocation plan in The purpose of the cost allocation plan is to identify and quantify all indirect and overhead costs appropriately allocable to the Dulles Corridor Enterprise Fund and to appropriately allocate those costs. In 2011, $8.5 million was allocated from the Aviation Enterprise Fund to the Dulles Corridor Enterprise Fund, with $5.0 million allocated to the Dulles Toll Road and $3.5 million allocated to the Dulles Metrorail Project. In 2010, $7.3 million was allocated from the Aviation Enterprise Fund to the Dulles Corridor Enterprise Fund, with $4.6 million allocated to the Dulles Toll Road and $2.7 million to the Dulles Metrorail Project. The increase in allocated costs is attributable to increases in the allocation for the Board, Information Systems and Telecommunications, Business Administration, and Finance expenses. Rail Phase 2 allocated costs increased in 2011 as preliminary engineering activities increased. Salaries and related benefits expense increased $1.0 million from $8.3 million in 2010 to $9.3 million in The increase was due to a $978 thousand increase in allocated salaries and benefits expense. Salaries and benefits expenses increased $4.2 million in 2010 due to a $2.0 million increase in salaries and benefits for Dulles Toll Road and Metrorail Project employees as well as a $2.2 million increase in allocated salaries and benefits expense. Dulles Corridor Enterprise Fund Operating expenses Materials, equipment, supplies, contract services, and other $ 21,744,158 $ 22,827,231 $ 24,839,506 Salaries and related benefits 9,298,144 8,260,815 4,071,427 Utilities 237, ,956 67,989 Depreciation and amortization 3,926,601 3,523,732 1,115,923 Total operating expenses $ 35,205,985 $ 34,801,734 $ 30,094,845 The Dulles Corridor Enterprise Fund closed 2011 with total net assets of $1,275.1 million. The following represents a summary of the Statements of Revenues, Expenses and Changes in Net Assets of the Dulles Corridor Enterprise Fund: 25
34 Dulles Corridor Enterprise Fund (Restated) 2009 (Restated) Operating income Operating revenues $ 94,659,538 $ 88,038,168 $ 64,893,554 Operating expenses 35,205,985 34,801,734 30,094,845 Total operating income 59,453,553 53,236,434 34,798,709 Non-operating revenues Investment income 10,932,190 7,419,127 1,137,968 Federal, state and local grants 107, ,275 - Total non-operating revenues 11,039,754 8,091,402 1,137,968 Non-operating expenses Interest expense (18,060,020) (31,072,729) (11,414,822) Contributions to other governments (1,297,882) (10,086,067) (650,244) Total non-operating expenses (19,357,902) (41,158,796) (12,065,066) Income before capital contributions 51,135,405 20,169,040 23,871,611 Capital contributions 232,311, ,643, ,501,215 Increase in net assets $ 283,446,420 $ 335,812,230 $ 346,372,826 Changes in Net Assets The increase in net assets for the Dulles Corridor Enterprise Fund totaled $283.4 million, $335.8 million, and $346.4 million for the years ended December 31, 2011, 2010, and 2009, respectively. Total operating income for the Dulles Corridor Enterprise Fund was $59.5 million in 2011 $53.2 million in 2010, and $34.8 million in The 11.7 percent increase in total operating income over 2010 was largely driven by toll rate increases that became effective January 1, 2011 while the 53.0 percent increase in operating income from 2009 to 2010 was the result of toll rate increases that became effective January 1, Investment income increased $3.5 million from 2010 as a result of unrealized gains on investments of $3.8 million. Interest expense on bonds payable totaled $18.1 million in Contributions to other governments in 2011 totaled $1.3 million, a decrease of $8.8 million from the prior year because 2010 included a one-time payment of $6.6 million to Fairfax County, VA for the operation of the Fairfax County Express Bus Service. Fairfax County previously received funding from VDOT from Dulles Toll Road revenues, and the Board adopted a resolution to continue payment for this service in In addition, the Airports Authority contributed $1.3 million to VDOT in 2011 for costs related to the Transportation Management Plan, which comprises a set of strategies that are being implemented by VDOT during the construction of the Dulles Metrorail Project. The Airports Authority is contributing $12.5 million to VDOT for the Transportation Management Plan between 2007 and Government grants for the Dulles Corridor Enterprise Fund totaled $232.3 million for the fiscal year ending December 31, 2011 and $315.6 million for the fiscal year ending December 31, Federal grants included $120.0 million related to the Dulles Metrorail Project, while local government contributions totaled $97.7 million. 26
35 Statements of Net Assets Aviation Enterprise Fund and Dulles Corridor Enterprise Fund The Statements of Net Assets present the financial position of the Airports Authority at the end of the fiscal year. The Statements include all assets and liabilities of the Airports Authority. Net assets are the difference between total assets and total liabilities and are an indicator of the current fiscal health of the Airports Authority. A summarized comparison of the Airports Authority s assets, liabilities and net assets on December 31, 2011, 2010, and 2009, follows: Total Business-Type Activities (Restated) 2009 (Restated) Assets Current assets $ 690,918,140 $ 712,984,260 $ 653,874,894 Non-current assets Restricted 999,406,543 1,328,033,151 1,270,719,633 Unrestricted 288,588, ,103, ,999,917 Capital assets, net 7,202,502,470 6,501,983,963 5,831,226,589 Total Assets $ 9,181,415,694 $ 8,782,105,372 $ 7,912,821,033 Liabilities Current liabilities $ 413,978,790 $ 406,950,920 $ 330,269,417 Non-current liabilities 6,730,225,209 6,552,565,607 6,045,741,912 Total Liabilities $ 7,144,203,999 $ 6,959,516,527 $ 6,376,011,329 Net Assets Invested in capital assets, net of related debt $ 1,681,513,627 $ 1,420,180,335 $ 1,099,998,866 Restricted 165,379, ,411, ,904,213 Unrestricted 190,318, ,997, ,906,625 Total Net Assets $ 2,037,211,695 $ 1,822,588,845 $ 1,536,809,704 Current assets decreased $22.1 million from 2010; 2010 current assets increased $59.1 million from Current assets for the Aviation Enterprise Fund decreased $56.8 million in 2011, primarily as a result of the $59.1 million decrease in unrestricted investments, offset by a $28.7 million increase in accounts receivable. Current assets for the Dulles Corridor Enterprise Fund increased 20.2 percent, or $34.8 million, driven by increases in cash and cash equivalents (both restricted and unrestricted). Non-current assets increased $421.4 million from 2010, due to a $700.5 million increase in capital assets, net of depreciation, that was largely related to the Dulles Metrorail Project, offset by a $328.6 million decrease in restricted non-current assets. The Aviation Enterprise Fund recorded a $100.9 million increase in restricted non-current assets primarily due to a $53.1 million increase in investments. Similarly, unrestricted non-current assets for the Aviation Enterprise increased $51.6 million due to a $59.9 million increase in investments. The Dulles Corridor Enterprise Fund recorded an increase of $750.7 million in capital assets, which was largely attributable to the $735.4 million increase in construction in progress for the Dulles Metrorail Project. Non-current assets increased $810.2 million from 2009 to 2010 due to a $670.8 million increase in capital assets, net of depreciation. 27
36 Current liabilities increased $7.0 million from The increase in current liabilities from 2010 was driven by a $16.2 million increase in the current portion of long-term debt in the Aviation Enterprise Fund and $5.7 million increase in the Dulles Corridor Enterprise Fund. The Aviation Enterprise Fund saw a $30.6 million net decrease in accounts payable and accrued expenses, while the Dulles Corridor Enterprise Fund had a $19.8 million increase due to the Dulles Metrorail Project. Current liabilities increased $76.7 million from 2009 to This increase in current liabilities for 2010 was driven by a $12.1 million increase in bonds payable in the Aviation Enterprise Fund and a $71.2 million increase in accounts payable and accrued expenses for the Dulles Corridor Enterprise Fund, primarily for the Dulles Metrorail Project. In 2011, long-term liabilities increased $177.7 million. Non-current bonds payable increased $100.6 million. Activity affecting this account included the issuance of $637.1 million in Airport System Revenue Bonds less a principal payment of $118.9 million on the outstanding bonds and the refunding of $433.5 million in Airport System Revenue and Refunding Bonds. The Airports Authority had a net decrease of $19.5 million in its commercial paper outstanding in Long-term liabilities increased $506.8 million from 2009 to 2010 due to a $629.4 million increase in non-current bonds payable that resulted from the issuance of $979.2 million in Airport System Revenue Bonds less a principal payment of $107.1 million on the outstanding bonds, the refunding of $610.3 million in Airport System Revenue and Refunding Bonds, and the issuance of $342.6 million in Dulles Toll Road Revenue Bonds. The Dulles Corridor Enterprise Fund bonds payable balance was $1.4 billion at December 31, 2011, that includes the $39.1 million accretion from capital appreciation bonds. As of December 31, 2011, the Dulles Corridor Enterprise Fund liability of $1.7 million was due to the Aviation Enterprise Fund for services provided to the Dulles Corridor Enterprise Fund in the normal course of business, including the cost allocation plan. Total net assets, which represent the residual interest in the Airports Authority assets after liabilities are deducted, increased $214.6 million from 2010 and $500.4 million from The Dulles Corridor Enterprise Fund provided a $283.4 million increase in total net assets for 2011, while the Aviation Enterprise Fund recorded a decrease of $68.8 million in total net assets for Net assets invested in capital assets, net of related debt increased $261.3 million from 2010 and $581.5 million from The increase in 2011 was attributable to a $275.6 million increase in the Dulles Corridor Enterprise Fund. At the year ended December 31, 2011, total restricted net assets of $165.4 million consisted of funds restricted for construction, debt service, leases, Dulles Rail latent defects, Dulles Toll Road repairs, and Public Safety. This was an overall increase from 2010 of $58.0 million. The Aviation Enterprise Fund s restricted net assets increased $20.6 million to $85.3 million, primarily due to a $16.0 million increase in net assets restricted for construction. The Dulles Corridor Enterprise Fund s restricted net assets of $80.1 million included $49.9 million in funds restricted for construction at December 31, Total restricted net assets decreased $37.5 million from 2009 to 2010 due to a $34.8 million decrease in net assets restricted for construction in the Aviation Enterprise Fund. Total unrestricted net assets at the end of the reporting period for the Airports Authority were $190.3 million, which represented an overall decrease of $104.7 million from Unrestricted net assets decreased $75.1 million for the Aviation Enterprise Fund and $29.5 million for the Dulles Corridor Enterprise Fund. These net assets may be used to meet any of the Airports Authority s ongoing operational needs and debt service for the Aviation Enterprise Fund and Dulles Corridor Enterprise Fund, subject to approval by the Airports Authority s Board of Directors. Unrestricted net assets increased $3.1 million from 2009 to
37 Capital Financing and Debt Management Aviation Enterprise Fund The Airports Authority is financing its Aviation Enterprise Fund CCP through a combination of revenues, entitlements, and discretionary grants received from the Federal Aviation Administration (FAA), state grants, PFCs, and revenue bonds. Long-term debt is the principal source of funding for the CCP. Please refer to Note 15 Capital Debt for additional detail on the Airports Authority s long-term debt activity. In September 2011, the Airports Authority s Aviation Enterprise Fund issued $637 million of Series 2011A-D Bonds. The Series 2011A Alternative Minimum Tax (AMT) Airport System Revenue and Refunding Bonds par amount was $233.6 million. The Series 2011A Bonds were sold to Wells Fargo Bank, PNC Bank and Union Bank as direct funded indexed obligations. The proceeds were used to pay a portion of the costs of certain Capital Construction Program (CCP) projects, refund a portion of outstanding Commercial Paper One Notes (CP Notes), refund a portion of the Series 2002C Bonds, refund total outstanding Series 2009A Bonds, fund capitalized interest, fund applicable debt service reserve funds, and pay the cost of issuing the bonds. All of the Series 2011A Bonds are hedged by interest rate swap agreements; Series 2011A-1 Bonds are hedged by the 2011 Swap Agreement, Series 2011A-2 are hedged by the 2002 Swap Agreement and Series 2011A-3 are hedged by a portion of the 2009 Swap Agreement. The Series 2011B Non-AMT Airport System Revenue and Refunding Bonds par amount was $207.6 million. The Series 2011B bonds were sold to Citibank as direct funded indexed obligations. The proceeds were used to pay a portion of the costs of certain CCP projects, refund a portion of the Series 2002C Bonds, fund capitalized interest, fund applicable debt service reserve funds, and pay the cost of issuing the bonds. The Series 2011C AMT Airport System Revenue Refunding Bonds par amount was $185.4 million. The proceeds were used to refund the Series 1998B Bonds, refund a portion of the Series 2001A Bonds, fund applicable debt service reserve funds, and pay the cost of issuing the bonds. The Series 2011D Non-AMT Airport System Revenue Refunding Bonds par amount was $10.4 million. The proceeds were used to refund the Series 2001B Bonds, fund applicable debt service reserve funds, and pay the cost of issuing the bonds. In 2011, total available CP was reduced by $19.5 million in recognition of the reduced capital construction program. At December 31, 2011, the Aviation Enterprise Fund had $17.5 million outstanding in Series One CP Notes, $21.0 million of Series Two CP Notes outstanding, and $5.2 billion in outstanding Airport System Revenue Bonds. The Airports Authority s Aviation Enterprise Fund s long-term uninsured bonds are rated AA- by Fitch, Aa3 by Moody s, and AA- by Standard & Poor s Rating Services (S&P). Fitch changed the Airports Authority s rating from AA to AA- and the outlook from Negative to Stable on September 9, Moody s affirmed the Negative outlook on September 8, S&P affirmed the Airports Authority s AA- rating with a Stable Outlook on September 8, On July 2, 2010, S&P assigned the Airports Authority an overall Debt Derivative Profile rating of 1 on a scale of 1 to 4, with 1 representing the lowest risk and 4 representing the highest risk. The overall score of 1 reflects S&P s view that the Airports Authority s swap portfolio reflects minimal credit risk at this time. 29
38 The Airports Authority, through its Master Indenture, has agreed to maintain debt service coverage of not less than 1.25x. Debt service coverage is calculated based on a formula included in the Master Indenture and the Use and Lease Agreement with the Airlines. Historically, the Airports Authority has maintained a coverage ratio significantly higher than its requirement. During 2011 and 2010, the Airports Authority s debt service coverage was 1.37x and 1.47x, respectively. 30 For more information on long-term debt activity, please refer to Note 15 Capital Debt. Dulles Corridor Enterprise Fund The Dulles Corridor Enterprise Fund did not issue any Bonds in In June 2011, the Airports Authority Board authorized the issuance of CP Notes for the Dulles Corridor Enterprise Fund in a not-to-exceed amount of $300.0 million. At December 31, 2011, the Dulles Corridor Enterprise Fund had $550 thousand outstanding in Series One CP notes and $1.4 billion in outstanding bonds payable. Federal and State Grant Activity The Airports Authority receives, on a cost-reimbursement basis, grants from the United States government, the Commonwealth of Virginia, and other local grantors for certain operating and capital construction programs. Aviation Enterprise Fund In 2011, the Aviation Enterprise Fund received $2.1 million in total federal, state, and local grants in support of operations. This included $1.2 million in funding for the Law Enforcement Officer Reimbursement Program, which offsets expenses incurred by the Airports Authority s Public Safety personnel serving a support role to the Transportation Security Administration (TSA). Other federal grants included $751 thousand from TSA, which was used to offset the expense of training and caring for canines used in explosives detection and $106 thousand related to the Drug Seizures Program, which is a collaborative effort between the Airports Authority, the Drug Enforcement Agency, and U.S. Customs and Border Protection. The Aviation Enterprise Fund also recognized $54.8 million in federal, state, and local grants in support of capital programs in Federal programs, including the FAA s Airport Improvement Program, provided $25.7 million for runway construction and rehabilitation, taxiway reconstruction, and runway safety area improvement. TSA funding included $6.3 million for an ongoing in-line baggage screening project. ARRA funds related to capital programs for the Aviation Enterprise Fund totaled $20.9 million in 2011 and were applied to installation of closed circuit television cameras at both Airports and in-line baggage screening. Dulles Corridor Enterprise Fund In 2010, the Airports Authority submitted a claim for reimbursement to the Federal Emergency Management Agency for snow removal costs incurred during the December 2009 and February 2010 severe weather/snow emergencies for the Dulles Toll Road. In 2011 and 2010, $67 thousand and $672 thousand, respectively, were received and accounted for as federal grants in support of operations in the Dulles Corridor Enterprise Fund. In 2011, the Dulles Corridor Enterprise Fund also received a Virginia Commonwealth grant of $41 thousand from the Disaster Relief and Emergency Assistance Program for these snow removal costs. The Federal Transit Authority is the primary grantor to the Dulles Metrorail Project and has committed a total of $900.0 million in federal New Starts funding for the project. The $900.0 million Full Funding Grant
39 Agreement (FFGA) was approved by the FTA on March 10, 2009 and is inclusive of all previously awarded grants for the Dulles Metrorail Project. During 2011, the Dulles Corridor Enterprise Fund recognized $92.2 million of the FFGA award. In 2009, USDOT allocated $77.3 million in ARRA funding to the Dulles Metrorail Project. These funds replace Section 5309 funds that are scheduled to be received in the final year (2016) of the FFGA. As of December 17, 2009, the ARRA grant was fully drawn down by the Airports Authority. While the ARRA grant is fully expended, the grant will not be closed out until the local match requirement has been met. The FTA deferred the local match requirement under the terms and conditions of the grant until three years after August 28, 2009 (August 27, 2012); that deadline may be extended at the FTA s discretion. The Airports Authority began allocating the required local match to the ARRA grant in April The total required local share through December 2011 is $197.5 million with a remaining balance of $1.6 million. The local match was completed in February, State and local funding sources for the Dulles Metrorail Project include transportation bonds issued by the Commonwealth of Virginia and a Fairfax County transportation improvement district property tax. In addition, the Virginia Transportation Act of 2000 dedicated $75.0 million to the project from Surface Transportation Program funds. During 2011, the Dulles Corridor Enterprise Fund recognized $97.7 million of state and local grants in support of capital programs. Cash and Investment Management Aviation Enterprise Fund and Dulles Corridor Enterprise Fund The Airports Authority s cash and cash equivalents decreased $136.5 million to $750.4 million as of December 31, This was driven by an increase in available cash and cash equivalents, both restricted and unrestricted, of $24.8 million in the Aviation Enterprise Fund and a decrease of $161.3 million in the Dulles Corridor Enterprise Fund. Cash and cash equivalents with an original maturity of three months or less are considered highly liquid investments. Restricted and unrestricted investments decreased by $176.9 million in 2011, which was attributable to a $230.7 million decrease in the Dulles Corridor Enterprise Fund. The following summary shows the major sources and use of cash: Total Business-Type Activities Cash received from operations $ 728,180,149 $ 691,691,410 $ 613,985,096 Cash expended from operations (427,944,486) (397,287,786) (330,043,247) Net cash provided by operations 300,235, ,403, ,941,849 Net cash provided (used) by noncapital financing activities 346,296 (7,805,066) 572,387 Net cash provided (used) by capital and related financing activities (651,754,012) (183,156,060) 524,417,761 Net cash provided (used) by investing activities 214,667, ,118,939 (466,222,989) Net (decrease) increase in cash and cash equivalents (136,504,475) 208,561, ,709,008 Cash and cash equivalents, beginning of year 886,936, ,375, ,666,405 Cash and cash equivalents, end of year $ 750,432,375 $ 886,936,850 $ 678,375,413 Cash temporarily idle during 2011 was invested in demand deposits, certificates of deposit, commercial paper, United States government and agency obligations, mutual funds, repurchase agreements collateralized by the United States government or agency obligations, and other permitted investments as listed in the Master Indenture for the Airports Authority s outstanding bonds. During 2011, the Airports Authority s Aviation 31
40 Enterprise Fund operating account average portfolio balance was $387.2 million, and the average yield on investments was 0.31 percent. The capital funds are held by an agent for the Trustee but managed by the Airports Authority. For 2011, the capital funds had an average portfolio balance of $525.1 million and an average yield of 3.93 percent. During 2011, the Airports Authority s Dulles Corridor Enterprise Fund operating account average portfolio balance was $58.2 million and the average yield on investments was 0.03 percent. The capital funds are held by an agent for the Trustee, but the Airports Authority directs the investments. For 2011, the capital funds had an average portfolio balance of $291.4 million and an average yield of 2.61 percent. Certain Airports Authority funds that will be used for bond requirements and capital projects are invested in long-term instruments. An annual cash flow projection for capital projects is developed for all bond proceeds and investments are matched to maximize investment income while ensuring cash is available for capital project expenses. All investments must be made following the investment policy that was adopted by the Airports Authority s Board. An investment committee meets quarterly to review the portfolios for compliance with the investment policy (see Note 5 Deposits and Investments). Capital Construction During 2011, the Aviation Enterprise Fund expended $167.4 million in its ongoing CCP compared to an expenditure budget of $272.2 million. The Aviation Enterprise Fund capitalized $152.4 million in projects in 2011, principally including the implementation of the Airports Authority-wide ERP system, overlay on runway 1/19 at Reagan National, the concourse C/D rehabilitation and International Arrivals Building expansion at Dulles International. The projects continuing in 2012 and beyond include completion of in-line baggage systems, additional improvements to the international arrivals building and taxiway improvements at Dulles International. At Reagan National, projects planned for 2012 and beyond include terminal modifications to accommodate in-line baggage screening systems, Terminal A improvements including improvements to baggage facilities, and runway rehabilitation and safety enhancements to main runway 1/19. The Dulles Corridor Enterprise Fund s Renewal and Replacement program provided funds to address major maintenance requirements including overlays, sound wall repairs, bridge deck replacements, erosion and drainage control, and other maintenance projects. The Renewal and Replacement program is funded from toll road revenues. In addition, the Dulles Corridor Capital Improvement Program funds improvements related to the Dulles Toll Road, its ancillary ramps and interchanges, and the Dulles Rail Project. These projects, which are funded from bond proceeds, Federal Transit Administration grants, and contributions from Fairfax County and the Commonwealth of Virginia, include the Metrorail project, as well as the construction of an Interchange Ramp between the Dulles Corridor and I-495, and other studies and improvements. The total Capital Improvement Program expenditure budget was $923.3 million, of which $821.7 million was allocated for Phase 1 of the Rail project and $46.2 million was allocated for Phase 2. The total expenditure in 2011 was $615.3 million. Contacting the Airports Authority s Financial Management The financial report is designed to provide the Airports Authority s Board, management, investors, creditors, and customers with a general view of the Airports Authority s finances and to demonstrate the Airports Authority s accountability for the funds it receives and expends. For additional information about this report, or for additional financial information, please contact Andrew Rountree, Vice President for Finance and Chief Financial Officer, at the following address: 1 Aviation Circle, Washington, DC, or BondholdersInformation@mwaa.com. 32
41 Intentionally Left Blank
42 STATEMENT OF NET ASSETS As of December 31, 2011 ASSETS Total Aviation Dulles Corridor Business-Type Enterprise Enterprise Activities Current assets Cash and cash equivalents $ 99,501,092 $ 52,697,660 $ 152,198,752 Restricted cash and cash equivalents 207,629, ,750, ,379,962 Accounts receivable, net 61,761, ,965 62,144,758 Investments 101,610, ,610,902 Inventory 8,536, ,587 8,770,143 Prepaid expenses and other current assets 5,315, ,945 5,813,623 Total current assets 484,355, ,562, ,918,140 Non-current assets Restricted: Cash and cash equivalents 80,339, ,514, ,853,661 Accounts receivable 24,472, ,571, ,044,541 Investments 454,042, ,465, ,508,341 Total restricted 558,855, ,551, ,406,543 Unrestricted: Note receivable 11,876,689-11,876,689 Investments 181,174, ,174,135 Net pension assets 3,198,077-3,198,077 Bond issuance costs, net 53,436,256 38,289,847 91,726,103 Other assets 613, ,537 Total unrestricted 250,298,694 38,289, ,588,541 Capital assets: Land and other non-depreciable assets 182,730, ,730,618 Construction in progress 301,655,216 72,012, ,667,270 Construction in Progress - Dulles Metrorail Project - 2,065,582,731 2,065,582,731 Buildings, systems and equipment 6,661,545,877 2,096,741 6,663,642,618 Less: accumulated depreciation (2,082,303,669) (817,098) (2,083,120,767) Capital assets, net 5,063,628,042 2,138,874,428 7,202,502,470 Total non-current assets 5,872,781,899 2,617,715,655 8,490,497,554 Total assets $ 6,357,137,381 $ 2,824,278,313 $ 9,181,415,694 The accompanying notes are an integral part of these financial statements. 34
43 STATEMENT OF NET ASSETS (continued) As of December 31, 2011 LIABILITIES AND NET ASSETS Total Aviation Dulles Corridor Business-Type Enterprise Enterprise Activities Current liabilities Accounts payable and accrued expenses $ 52,158,587 $ 137,361,411 $ 189,519,998 Deferred revenue 11,884,807-11,884,807 Accrued lease obligations 341, , ,227 Accrued interest payable 58,220,940 12,741,238 70,962,178 Due to (due from) other funds (1,691,965) 1,691,965 - Current portion of long-term debt 135,395,000 5,744, ,139,580 Total current liabilities 256,308, ,670, ,978,790 Non-current liabilities Other liabilities 4,805,797 15,704,723 20,510,520 Commercial paper notes 38,500, ,000 39,050,000 Interest rate swaps payable 200,415, ,415,403 Bonds payable, net 5,094,962,202 1,375,287,084 6,470,249,286 NET ASSETS Total non-current liabilities 5,338,683,402 1,391,541,807 6,730,225,209 Total liabilities 5,594,991,911 1,549,212,088 7,144,203,999 Invested in capital assets, net of related debt 456,739,380 1,224,774,247 1,681,513,627 Restricted for: Construction 42,283,653 49,878,840 92,162,493 Debt service 36,497,945 5,524,321 42,022,266 Leases 6,148,457 1,959,376 8,107,833 Dulles Rail latent defects - 15,000,163 15,000,163 Dulles Toll Road repairs - 7,725,294 7,725,294 Public Safety 361, ,325 Total restricted 85,291,380 80,087, ,379,374 Unrestricted 220,114,710 (29,796,016) 190,318,694 Total net assets 762,145,470 1,275,066,225 2,037,211,695 Total net assets and liabilities $ 6,357,137,381 $ 2,824,278,313 $ 9,181,415,694 6,390,018, ,470,977, The accompanying notes are an integral part of these financial statements. 35
44 STATEMENT OF NET ASSETS - Restated As of December 31, 2010 ASSETS Total Aviation Dulles Corridor Business-Type Enterprise Enterprise Activities Current assets Cash and cash equivalents $ 114,502,559 $ 42,352,165 $ 156,854,724 Restricted cash and cash equivalents 217,356, ,957, ,313,856 Accounts receivable, net 33,092, ,622 33,827,007 Investments 160,751, ,751,777 Inventory 8,655,687 77,925 8,733,612 Prepaid expenses and other current assets 6,824, ,121 7,503,284 Total current assets 541,182, ,801, ,984,260 Non-current assets Restricted: Cash and cash equivalents 30,812, ,955, ,768,270 Accounts receivable 26,166, ,911, ,078,042 Investments 400,985, ,201, ,186,839 Total restricted 457,964, ,068,619 1,328,033,151 Unrestricted: Note receivable 14,080,347-14,080,347 Investments 121,241, ,241,415 Net pension assets 2,865,462-2,865,462 Bond issuance costs, net 60,552,823 40,363, ,916,774 Total unrestricted 198,740,047 40,363, ,103,998 Capital assets: Land and other non-depreciable assets 156,407, ,407,176 Construction in progress 288,677,791 27,671, ,349,408 Construction in Progress - Dulles Metrorail Project - 1,369,230,352 1,369,230,352 Buildings, systems and equipment 6,536,866,296 1,505,349 6,538,371,645 Less: accumulated depreciation (1,877,821,627) (552,991) (1,878,374,618) Capital assets, net 5,104,129,636 1,397,854,327 6,501,983,963 Total non-current assets 5,760,834,215 2,308,286,897 8,069,121,112 Total assets $ 6,302,017,095 $ 2,480,088,277 $ 8,782,105,372 The accompanying notes are an integral part of these financial statements. 36
45 STATEMENT OF NET ASSETS - Restated (continued) As of December 31, 2010 LIABILITIES AND NET ASSETS Total Aviation Dulles Corridor Business-Type Enterprise Enterprise Activities Current liabilities Accounts payable and accrued expenses $ 82,773,857 $ 117,570,692 $ 200,344,549 Deferred revenue 15,837,672-15,837,672 Accrued lease obligations 340, ,890 Accrued interest payable 58,220,063 12,997,746 71,217,809 Due to (due from) other funds (807,509) 807,509 - Current portion of long-term debt 119,210, ,210,000 Total current liabilities 275,574, ,375, ,950,920 Non-current liabilities Other liabilities 4,881,771 15,375,999 20,257,770 Commercial paper notes 58,500,000-58,500,000 Interest rate swaps payable 104,165, ,165,486 Bonds payable, net 5,027,925,825 1,341,716,526 6,369,642,351 NET ASSETS Total non-current liabilities 5,195,473,082 1,357,092,525 6,552,565,607 Total liabilities 5,471,048,055 1,488,468,472 6,959,516,527 Invested in capital assets, net of related debt 471,019, ,161,008 1,420,180,335 Restricted for: Construction 26,274,349 30,204,608 56,478,957 Debt service 31,453,877 3,008,910 34,462,787 Leases 6,597,574 1,959,376 8,556,950 Dulles Toll Road repairs - 7,532,133 7,532,133 Public Safety 380, ,538 Total restricted 64,706,338 42,705, ,411,365 Unrestricted 295,243,375 (246,230) 294,997,145 Total net assets 830,969, ,619,805 1,822,588,845 Total net assets and liabilities $ 6,302,017,095 $ 2,480,088,277 $ 8,782,105,372 6,390,018, ,470,977, The accompanying notes are an integral part of these financial statements. 37
46 STATEMENT OF REVENUES, EXPENSES AND CHANGES IN NET ASSETS For the year ended December 31, 2011 Total Aviation Dulles Corridor Business-Type Enterprise Enterprise Activities OPERATING REVENUES Concessions $ 227,599,995 $ - $ 227,599,995 Tolls and other - 94,659,538 94,659,538 Rents 275,428, ,428,113 Landing fees 110,255, ,255,672 Utility sales 11,979,591-11,979,591 Passenger fees 30,331,231-30,331,231 Other 8,381,229-8,381,229 Total operating revenues 663,975,831 94,659, ,635,369 OPERATING EXPENSES Materials, equipment, supplies, contract services, and other 187,607,830 21,744, ,351,988 Salaries and related benefits 148,072,307 9,298, ,370,451 Utilities 26,542, ,082 26,779,166 Lease from U. S. Government 5,180,558-5,180,558 Depreciation and amortization 211,365,393 3,926, ,291,994 Total operating expenses 578,768,172 35,205, ,974,157 OPERATING INCOME 85,207,659 59,453, ,661,212 NON-OPERATING REVENUES (EXPENSES) Investment income 24,683,618 10,932,190 35,615,808 Interest expense (221,951,744) (18,060,020) (240,011,764) Federal, state and local grants 874, , ,374 Fair value loss on swaps (96,249,918) - (96,249,918) Contributions to other governments - (1,297,882) (1,297,882) Total non-operating revenues (expenses) (292,643,234) (8,318,148) (300,961,382) GAIN (LOSS) BEFORE CAPITAL CONTRIBUTIONS (207,435,575) 51,135,405 (156,300,170) CAPITAL CONTRIBUTIONS Passenger facility charges 78,626,926-78,626,926 Federal, state and local grants 54,805, ,311, ,116,094 Other capital property contributed 5,180,000-5,180,000 Total capital contributions 138,612, ,311, ,923,020 NET ASSETS Increase (decrease) in net assets (68,823,570) 283,446, ,622,850 Total net assets, beginning of year, as restated 830,969, ,619,805 1,822,588,845 Total net assets, end of year $ 762,145,470 $ 1,275,066,225 $ 2,037,211,695 The accompanying notes are an integral part of these financial statements. 38
47 STATEMENT OF REVENUES, EXPENSES AND CHANGES IN NET ASSETS - Restated For the year ended December 31, 2010 Total Aviation Dulles Corridor Business-Type Enterprise Enterprise A ctivities OPERATING REVENUES Concessions $ 230,973,498 $ - $ 230,973,498 Tolls and other - 88,038,168 88,038,168 Rents 226,375, ,375,685 Landing fees 101,637, ,637,867 Utility s ales 12,464,920-12,464,920 Passenger fees 25,913,521-25,913,521 Other 6,509,225-6,509,225 Total operating revenues 603,874,716 88,038, ,912,884 OPERATING EXPENSES Materials, equipment, supplies, contract services, and other 180,632,889 22,827, ,460,120 Salaries and related benefits 148,274,437 8,260, ,535,252 Utilities 24,375, ,956 24,565,137 Lease from U. S. Government 5,101,119-5,101,119 Depreciation and amortization 215,536,523 3,523, ,060,255 Total operating expenses 573,920,149 34,801, ,721,883 OPERATING INCOME 29,954,567 53,236,434 83,191,001 NON-OPERATING REVENUES (EXPENSES) Investment income 20,367,841 7,419,127 27,786,968 Interest expense (209,147,708) (31,072,729) (240,220,437) Federal, state and local grants 1,192, ,275 1,865,018 Fair value loss on swaps (34,978,410) - (34,978,410) Contributions to other governments - (10,086,067) (10,086,067) Total non-operating revenues (expenses) (222,565,534) (33,067,394) (255,632,928) GAIN (LOSS) BEFORE CAPITAL CONTRIBUTIONS (192,610,967) 20,169,040 (172,441,927) CAPITAL CONTRIBUTIONS Passenger facility charges 80,088,350-80,088,350 Federal, state and local grants 61,839, ,643, ,482,718 Other capital property contributed 650, ,000 Total capital contributions 142,577, ,643, ,221,068 NET ASSETS Increase (decrease) in net assets (50,033,089) 335,812, ,779,141 Total net assets, beginning of year, as restated 881,002, ,807,575 1,536,809,704 Total net assets, end of year $ 830,969,040 $ 991,619,805 $ 1,822,588,845 The accompanying notes are an integral part of these financial statements. 39
48 STATEMENT OF CASH FLOWS For the year ended December 31, 2011 Total Aviation Dulles Corridor Business-Type Enterprise Enterprise Activities CASH FLOWS FROM OPERATING ACTIVITIES: Operating cash receipts from customers $ 633,557,214 $ 94,622,935 $ 728,180,149 Cash payments to suppliers for goods and services (251,138,052) (19,974,782) (271,112,834) Cash payments to employees for services (154,199,694) (2,621,260) (156,820,954) Cash receipts (payments) for interfund services 7,645,591 (7,656,289) (10,698) NET CASH PROVIDED BY OPERATING ACTIVITIES 235,865,059 64,370, ,235,663 CASH FLOWS FROM NONCAPITAL FINANCING ACTIVITIES Cash provided to other governments - (1,227,946) (1,227,946) Interest refunded from vendors (479) 231 (248) Federal, state and local grants in support of operations 1,078, ,825 1,574,490 NET CASH PROVIDED (USED) BY NONCAPITAL FINANCING ACTIVITIES 1,078,186 (731,890) 346,296 CASH FLOWS FROM CAPITAL AND RELATED FINANCING ACTIVITIES: Proceeds from issuance of bonds/notes 653,565, ,565,000 Proceeds from issuance of commercial paper 47,500, ,000 48,050,000 Payments for refunding of bond notes and commercial paper (501,025,000) - (501,025,000) Principal payments on bonds/notes (135,395,000) - (135,395,000) Principal payments on commercial paper Payments for capital expenditures and construction in progress (147,332,558) (650,346,417) (797,678,975) Proceeds from sale of capital assets 199, ,417 Payments of bond issuance costs 2,604,025 (1,636,193) 967,832 Interest paid on bonds and commercial paper (238,009,844) (52,000,899) (290,010,743) Federal, state and local grants in aid of construction 55,629, ,650, ,279,979 Passenger facility charge receipts 79,292,688-79,292,688 Passenger facility charge expenses and interest NET CASH PROVIDED (USED) BY CAPITAL AND RELATED FINANCING ACTIVITIES (182,971,447) (468,782,565) (651,754,012) CASH FLOWS FROM INVESTING ACTIVITIES: Interest received on investments 19,215,791 4,533,397 23,749,188 Proceeds from short-term investment maturities 328,289, ,307, ,597,515 Purchase of short-term investments (348,934,233) - (348,934,233) Proceeds from long-term investment maturities 154,158, ,158,633 Purchase of long-term investments (181,903,525) - (181,903,525) NET CASH PROVIDED (USED) BY INVESTING ACTIVITIES (29,173,656) 243,841, ,667,578 NET (DECREASE) INCREASE IN CASH AND CASH EQUIVALENTS 24,798,142 (161,302,617) (136,504,475) CASH AND CASH EQUIVALENTS, Beginning of year 362,671, ,265, ,936,850 CASH AND CASH EQUIVALENTS, End of year $ 387,469,943 $ 362,962,432 $ 750,432,375 The accompanying notes are an integral part of these financial statements. 40
49 STATEMENT OF CASH FLOWS (continued) For the year ended December 31, 2011 Total Aviation Dulles Corridor Business-Type Enterprise Enterprise Activities RECONCILIATION OF OPERATING INCOME TO NET CASH PROVIDED BY OPERATING ACTIVITIES: Operating income $ 85,207,659 $ 59,453,553 $ 144,661,212 Adjustments to reconcile operating income to net cash provided by operating activities: Depreciation and amortization 211,365,393 3,926, ,291,994 Decrease (increase) in allowance for doubtful accounts 390, ,296 Loss (gain) on disposal of assets (8,930) - (8,930) Decrease (increase) in accounts receivable (29,059,703) (36,603) (29,096,306) Decrease (increase) in inventory 119,131 (155,662) (36,531) Decrease in prepaid expenses and other current assets 1,508, ,176 1,689,661 Decrease in note receivable 2,203,658-2,203,658 Decrease in net pension and other post-employment benefit assets (332,615) - (332,615) Increase (decrease) in long-term liabilities (75,974) 12,434 (63,540) Increase (decrease) in accounts payable and accrued expenses (30,615,270) 104,649 (30,510,621) Increase (decrease) in due to/due from other funds (884,456) 884,456 - Increase (decrease) in deferred revenue (3,952,865) - (3,952,865) Increase (decrease) in operating lease obligation NET CASH PROVIDED BY OPERATING ACTIVITIES $ 235,865,058 $ 64,370,604 $ 300,235,662 NONCASH INVESTING, CAPITAL AND FINANCING ACTIVITIES: Unrealized gain (loss) on investments $ 5,452,358 $ 8,704,975 $ 14,157,333 Buildings and improvements provided by tenants $ 5,180,000 $ - $ 5,180,000 Capital construction costs payable $ 28,243,458 $ 136,925,883 $ 165,169,341 Fair value loss on swaps $ (96,249,918) $ - $ (96,249,918) The accompanying notes are an integral part of these financial statements. 41
50 STATEMENT OF CASH FLOWS - Restated For the year ended December 31, 2010 Total Aviation Dulles Corridor Business-Type Enterprise Enterprise Activities CASH FLOWS FROM OPERATING ACTIVITIES: Operating cash receipts from customers $ 603,668,892 $ 88,022,518 $ 691,691,410 Cash payments to suppliers for goods and services (220,291,468) (22,068,681) (242,360,149) Cash payments to employees for services (152,353,089) (2,574,548) (154,927,637) Cash receipts (payments) for interfund services 12,767,366 (12,767,366) - NET CASH PROVIDED BY OPERATING ACTIVITIES 243,791,701 50,611, ,403,624 CASH FLOWS FROM NONCAPITAL FINANCING ACTIVITIES Cash provided to other governments - (9,196,341) (9,196,341) Interest paid to vendors (4,496) (827) (5,323) Federal, state and local grants in support of operations 1,396,598-1,396,598 NET CASH PROVIDED (USED) BY NONCAPITAL FINANCING ACTIVITIES 1,392,102 (9,197,168) (7,805,066) CASH FLOWS FROM CAPITAL AND RELATED FINANCING ACTIVITIES: Proceeds from issuance of bonds/notes 1,078,701, ,614,869 1,421,316,212 Principal payments on commercial paper (216,500,000) - (216,500,000) Principal payments on bonds/notes (717,405,000) - (717,405,000) Payments for capital expenditures and construction in progress (385,282,449) (529,437,260) (914,719,709) Proceeds from sale of capital assets 985, ,912 Payments of bond issuance costs 1,943,750 (4,442,496) (2,498,746) Interest paid on bonds and commercial paper (88,919,859) (49,567,539) (138,487,398) Federal, state and local grants in aid of construction 51,500, ,194, ,695,410 Passenger facility charge receipts 79,472,218-79,472,218 Passenger facility charge expenses and interest (14,959) - (14,959) NET CASH PROVIDED (USED) BY CAPITAL AND RELATED FINANCING ACTIVITIES (195,518,355) 12,362,295 (183,156,060) CASH FLOWS FROM INVESTING ACTIVITIES: Interest received on investments 2,067,232 3,926,444 5,993,676 Proceeds from short-term investment maturities 383,090, ,765,864 1,156,856,456 Purchase of short-term investments (283,300,967) (599,922,904) (883,223,871) Proceeds from long-term investment maturities 203,712,518 95,487, ,199,695 Purchase of long-term investments (268,676,272) (205,030,745) (473,707,017) NET CASH PROVIDED BY INVESTING ACTIVITIES 36,893,103 68,225, ,118,939 NET (DECREASE) INCREASE IN CASH AND CASH EQUIVALENTS 86,558, ,002, ,561,437 CASH AND CASH EQUIVALENTS, Beginning of year 276,113, ,262, ,375,413 CASH AND CASH EQUIVALENTS, End of year $ 362,671,801 $ 524,265,049 $ 886,936,850 The accompanying notes are an integral part of these financial statements. 42
51 STATEMENT OF CASH FLOWS - Restated (continued) For the year ended December 31, 2010 Total Aviation Dulles Corridor Business-Type Enterprise Enterprise Activities RECONCILIATION OF OPERATING INCOME TO NET CASH PROVIDED BY OPERATING ACTIVITIES: Operating income $ 20,611,909 $ 53,236,434 $ 73,848,343 Adjustments to reconcile operating income to net cash provided by operating activities: Depreciation and amortization 224,879,181 3,523, ,402,913 Decrease (increase) in allowance for doubtful accounts (106,454) - (106,454) Loss (gain) on disposal of assets (195,616) - (195,616) Decrease (increase) in accounts receivable 668,691 (15,650) 653,041 Decrease (increase) in inventory (593,701) (45,132) (638,833) Decrease in prepaid expenses and other current assets (824,548) 1,206, ,709 Decrease in note receivable 2,473,519-2,473,519 Decrease in net pension and other post-employment benefit assets 726, ,616 Increase (decrease) in long-term liabilities (1,010,879) 320 (1,010,559) Increase (decrease) in accounts payable and accrued expenses (6,084,486) (1,808,141) (7,892,627) Increase (decrease) in due to/due from other funds 5,485,897 (5,485,897) - Increase (decrease) in deferred revenue (2,238,178) - (2,238,178) Increase (decrease) in operating lease obligation (250) - (250) NET CASH PROVIDED BY OPERATING ACTIVITIES $ 243,791,701 $ 50,611,923 $ 294,403,624 NONCASH INVESTING, CAPITAL AND FINANCING ACTIVITIES: Unrealized gain (loss) on investments $ 2,918,098 $ 4,912,747 $ 7,830,845 Buildings and improvements provided by tenants $ 650,000 $ - $ 650,000 Capital construction costs payable $ 34,920,891 $ 135,329,781 $ 170,250,672 Fair value loss on swaps $ (34,978,411) $ - $ (34,978,411) The accompanying notes are an integral part of these financial statements. 43
52 Intentionally Left Blank
53 NOTES TO FINANCIAL STATEMENTS 1. SUMMARY OF SIGNIFICANT ACCOUNTING POLICIES A. Reporting Entity The Metropolitan Washington Airports Authority (the Airports Authority) is an independent interstate agency created by the Commonwealth of Virginia (the Commonwealth) and the District of Columbia with the consent of the United States Congress. The Commonwealth and the District of Columbia enacted essentially identical legislation creating the Airports Authority for the purpose of operating Ronald Reagan Washington National Airport (Reagan National) and Washington Dulles International Airport (Dulles International) (collectively, the Airports). Pursuant to an Agreement and Deed of Lease, effective June 7, 1987, the Airports were transferred by the U.S. Government to the Airports Authority for an initial term of 50 years. On June 17, 2003, the Agreement and Deed of Lease was extended 30 years to June 6, On November 1, 2008, the Virginia Department of Transportation (VDOT) transferred responsibility for the operation and maintenance of the Dulles Toll Road to the Airports Authority for an initial term of 50 years. In connection with the transfer, the Airports Authority is constructing the Dulles Corridor Metrorail Project (Dulles Metrorail Project) and is making other improvements in the Dulles Corridor consistent with VDOT and regional plans. The Airports Authority is governed by a Board of Directors (the Board) with members appointed by the governors of the Commonwealth of Virginia and the State of Maryland, the Mayor of the District of Columbia, and the President of the United States. Only the accounts of the Airports Authority are included in the reporting entity. There are no U.S. or state government agency finances that should be considered for inclusion in the Airports Authority s financial reporting entity. B. Measurement Focus, Basis of Accounting & Financial Statement Presentation The financial statements of the Airports Authority are presented using the economic resources measurement focus and the accrual basis of accounting in accordance with accounting principles generally accepted in the United States of America, as prescribed by the Government Accounting Standards Board (GASB). Under the accrual basis of accounting, revenues are recorded when earned, and expenses are recorded when incurred. For the year ended December 31, 2010, the Airports Authority elected early adoption of GASB Statement No. 62, Codification of Accounting and Financial Reporting Guidance contained in Pre-November 30, 1989, FASB and AICPA Pronouncements (GASB 62) and applied those standards on a retroactive basis. The new GASB codification supersedes GASB Statement No. 20, Accounting and Financial Reporting for Proprietary Funds and Other Governmental Entities that Use Proprietary Fund Accounting. The implementation of the requirements of GASB 62 did not result in any financial statement impact, either for the year ended December 31, 2010, or for any other years presented for comparative purposes. As defined by the GASB, the Airports Authority reports the operations of the Airports and their related improvements, and the Dulles Toll Road and Dulles Corridor related improvements (including the Dulles Metrorail Project) as two separate Business-Type Activities. Business-Type Activities are those that are financed in whole or in part by fees charged to external parties for goods or services. The Airports operate as a single Business-Type Activity and are reported in the Airports Authority s Aviation Enterprise Fund. The 45
54 Dulles Toll Road, the Dulles Metrorail Project, and related improvements in the Dulles Corridor operate as a single Business-Type Activity and are reported in the Dulles Corridor Enterprise Fund. The effects of interfund activity between these two enterprise funds have been eliminated in the total columns of the financial statements. Revenues from airlines, concessions, rental cars, parking and toll collections are reported as operating revenues. Financing and investing related transactions are reported as non-operating revenues. All expenses related to operating the Airports Authority are reported as operating expenses. Interest expense and financing costs are reported as non-operating expenses. C. Use of Estimates in the Preparation of the Financial Statements The preparation of financial statements in conformity with accounting principles generally accepted in the United States of America requires management, where necessary, to make estimates and assumptions that affect the reported amounts of assets and liabilities and disclosure of contingent assets and liabilities at the date of the financial statements and the reported amounts of revenues and expenses during the reporting period. Significant estimates include the useful lives of capital assets and resultant accumulated depreciation, the fair value of derivative financial instruments, an allowance for doubtful accounts, other post-employment benefits obligations, and certain self-insured liabilities. Actual results could differ from those estimates. D. Budgeting Requirements The Airports Authority s annual budgeting process is a financial planning tool used to establish the estimated revenues and expenditures for the Aviation Enterprise Fund and Dulles Corridor Enterprise Fund. The Airports Authority is not required to demonstrate statutory compliance with its annual operating budgets. Accordingly, budgetary data is not included in the basic financial statements. E. Net Assets Net assets represent the residual interest in the Aviation Enterprise Fund and the Dulles Corridor Enterprise Fund assets. Net assets are reported as either: Net assets invested in capital assets, net of related debt, which include capital assets funded from unrestricted and restricted sources, net of accumulated depreciation and outstanding debt attributable to acquisition of the assets; Restricted net assets when constraints are imposed by third parties or enabling legislation on assets, net of any liabilities which will be liquidated with the restricted assets; or Unrestricted net assets, which include all remaining assets and liabilities not included in the preceding two categories. The Airports Authority utilizes proceeds from debt and capital contributions from passenger facility charges and federal, state and local grants to fund capital construction projects. In accordance with GASB Statement No. 34, Basic Financial Statements and Management s Discussion and Analysis for State and Local Governments, the debt attributable to the unspent proceeds should be in the same net assets component as the unspent proceeds. The Airports Authority includes in the determination of the amount of unspent proceeds reimbursements of expenditures made from restricted funding sources, as these reimbursements require funds to be expended before the reimbursements are available. Such reimbursements are obtained from federal, state and local grants and from passenger facility charges. 46
55 F. Revenue Recognition Revenues that result from providing services in connection with the principal ongoing operations of the Airports Authority s enterprises are reported as operating revenues. The Airports Authority s operating revenues are presented in eight major categories as follows: Concessions Concession revenues are generated from public parking facilities and from commercial tenants who provide goods and services to the public or to other tenants of the Airports. Commercial tenant operations include car rentals, food and beverage sales, retail and newsstand sales, display advertising, ground transportation, in-flight catering, fixed-based operations, and other provided services. Revenues earned by the Airports Authority for commercial tenant operations are based on negotiated agreements and are usually based on the greater of a minimum annual guarantee or a percentage of gross receipts. Parking fees are collected directly by the Airports Authority and are reported as revenues at their gross amount. Concession revenues is recognized when services are provided or goods are sold to the public or other tenants of the airport. Tolls and other Tolls and other revenues represent revenues collected from vehicles using the Dulles Toll Road and include automated vehicle identification or electronic toll collections, cash collections and violation revenues. Tolls and other revenues are recognized in the period in which the toll road usage occurred. Rents Rental revenues are earned through leases of Airports Authority terminal and non-terminal property space. Leases with the airlines are based on full cost recovery plus debt service coverage, through rates and charges as described in Note 3 Airport Use Agreement and Premises Lease. Other leases are for terms of one or more years and include contractually established rental rates and provisions for annual rent adjustments. Rental revenues include common area maintenance charges as well as cost recovery for normal utility usage in most cases. Terminal and concourse rental rates at Dulles International include cost recovery and debt service coverage for the Automated People Mover system (the AeroTrain). Rental revenues is recognized over the life of the respective leases. Landing Fees Landing fees are generated principally from the airlines and are based on the landed weight of aircraft. The landing fee structure is determined annually based on full cost recovery of airside related charges pursuant to an agreement between the Airports Authority and the signatory airlines, as described in Note 3 Airport Use Agreement and Premises Lease. Landing fees are recognized as revenues based on the airlines operating activities at the Airports. Utility Sales Utility revenues are generated from metered utility usage for terminal and non-terminal tenants whose utility usage is expected to exceed certain limits. Utility revenues are recognized based on the period of actual usage. Passenger Fees Passenger fee revenues are comprised of fees charged to airlines for use of U.S. Customs and Border Protection Federal Inspection facilities and for use of the mobile lounge passenger conveyance system at Dulles International. Passenger fee revenues also include security fees charged to the Transportation Security Administration. Passenger fee revenues are recognized based on when the facilities and systems are used or when the security services are provided. Customer Facility Charge On April 1, 1993, the Airports Authority began requiring the on-airport car rental companies at Reagan National to charge a Customer Facility Charge (CFC) to be used to pay, or to reimburse the Airports Authority, for costs, fees, and expenses associated with financing, maintaining, and operating the car rental companies Quick Turn-Around Facility, 55 percent of the cost of the south parking structure, 55 percent of the costs of busing service used to transport public parking patrons, and other costs, fees and expenses 47
56 that may be paid from CFC proceeds. The CFC is $2.50 per rental day and is collected by the car rental companies from each of their customers and subsequently remitted to the Airports Authority. In accordance with the concessions contracts between the Airports Authority and the car rental companies, the CFC cannot be used for the Airport Authority s indirect maintenance or administrative costs. CFC revenues are included in the Statements of Revenues, Expenses and Changes in Net Assets as concessions revenues and associated assets are included in the Statements of Net Assets as unrestricted assets. Other Revenues The other revenues category includes employee parking fees, medical service fees, and other miscellaneous revenues. Other revenues are recognized during the period the services are provided. Several airlines represent concentrations of revenues for the Airports Authority. At Reagan National, US Airways, Delta Air Lines (Delta), and American Airlines (American) comprised approximately 75.5 percent of airline revenues during At Dulles International, United Airlines, Delta, and British Airways comprised approximately 65.5 percent of airline revenues during Combined, these five airlines represented approximately 76.9 percent of total airline revenues during 2011 for the Airports Authority. G. Allocations of Overhead and Other Indirect Costs and Project Costs The majority of costs related to the Aviation Enterprise Fund and the Dulles Corridor Enterprise Fund are directly charged to the appropriate fund as a direct cost. Administrative functions, which represent overhead costs for the entire Airports Authority, as well as other indirect costs, such as Public Safety functions, are initially paid from the Aviation Enterprise Fund, but include costs which are appropriately allocable to the Dulles Corridor Enterprise Fund as costs associated with the operation of the Dulles Toll Road or as project management and administration costs for the Dulles Metrorail Project. A cost allocation plan is used to identify and quantify all overhead and other indirect costs appropriately allocable to the Dulles Toll Road or to the Dulles Metrorail Project within the Dulles Corridor Enterprise Fund. All allocated overhead and other indirect costs charged to the Dulles Corridor Enterprise Fund are expensed, while the Aviation Enterprise Fund recognizes the allocated costs as a reduction of expenses. Costs allocated for 2011 and 2010 are recognized within Operating Expenses on the Statements of Revenues, Expenses and Changes in Net Assets as follows: Year ended December 31, Materials, equipment, supplies, contract services, and other $ 1,435,530 $ 1,465,252 Salaries and related benefits 6,590,584 5,612,133 Utilities 32,814 31,562 Depreciation and amortization 481, ,521 Total $ 8,540,744 $ 7,281,468 The Dulles Metrorail Project is being constructed in two phases (see Note 4 Transfer of the Dulles Toll Road and Construction of the Dulles Metrorail Project). Project overhead and other indirect costs are allocated between the two phases of the project based on a cost allocation plan and are capitalized as construction in progress. 48
57 H. Cash and Cash Equivalents For purposes of reporting cash flows, cash and cash equivalents include cash on hand, demand deposits, certificates of deposit, commercial paper, United States government and agency obligations, mutual funds, and repurchase agreements collateralized by United States government or agency obligations with an original maturity of three months or less, including restricted assets. I. Investments The Airports Authority s investment policy is determined by the Board of Directors. Permitted investments are set within the policy. Written investment objectives and procedures are developed by staff in consultation with an Investment Committee. The Investment Committee meets quarterly to review the portfolio performance, confirm compliance to the policy, and formulate an investment plan for the next quarter. Investments with an original maturity greater than one year are recorded at their fair value with all investment income, including changes in the fair value of investments, reported as investment income in the financial statements. Investments with an original maturity of less than one year are carried at amortized cost. Fair value equals quoted market prices, if available. If a quoted market value is not available, fair value is estimated based upon quoted market prices for securities with similar characteristics. Investments consist of certificates of deposit, commercial paper, United States government and agency obligations, guaranteed investment contracts, and repurchase agreements collateralized by United States government or agency obligations with an original maturity greater than three months. J. Accounts Receivable Accounts receivable are reported at their gross value when earned. The Airports Authority s payment terms range from zero to 30 days (60 days for government agencies), depending on the type of service provided. An allowance for doubtful accounts pertains only to the Aviation Enterprise Fund and is based on management estimates of uncollectible revenue billings. As a customer s balance is deemed uncollectible, the receivable is offset against this allowance. Subsequent receipt of a receivable previously written off is applied to this allowance. K. Inventory and Prepaid Items Inventory consists of supplies, maintenance parts, and bulk materials such as sand and salt, all of which are for use at the Airports and Dulles Toll Road. Inventories of materials and supplies are determined both by physical counts and through perpetual inventory systems. Inventories are valued at cost using either the weighted average cost (regular stock inventories) or first-in first-out (FIFO) method (bulk inventories). As of June 1, 2011, the Airports Authority implemented a new inventory system and changed its inventory accounting method for inventories tracked through perpetual inventory systems (regular stock inventories) from the FIFO method to the weighted average cost method. The change in inventory accounting method did not have a material impact on the 2011 financial statements, and because the effect on prior periods presented is not material, they have not been restated. Certain payments to vendors reflect costs applicable to future accounting periods and are recorded as prepaid items in the financial statements. 49
58 L. Restricted Assets Assets restricted to specific purposes by legally enforceable requirements are segregated on the Statement of Net Assets. Requirements include: externally imposed requirements by creditors (such as through debt covenants), grantors or contributors; laws or regulations of other governments; and constitutional provisions or enabling legislation. The Airports Authority s restricted assets are expendable. The Airports Authority s policy is to spend restricted assets before unrestricted assets are spent when both are available for the same purpose. Restricted assets necessary to meet current liability obligations are classified as current assets. Restricted assets that are restricted for disbursement in the acquisition or construction of noncurrent assets or that are segregated for the liquidation of long-term debts are classified as noncurrent assets. Assets restricted for construction include the funds available for the design and construction of capital improvements for the Airports and the Dulles Toll Road as well as for construction of the Dulles Metrorail Project. Assets restricted for construction includes cash, investments and receivables obtained from debt proceeds, grants and passenger facility charges. Assets restricted for debt service includes the cash balances required to pay the semi-annual interest payments as well as the principal for the annual October bond payments. The restricted assets for debt service reserve includes cash and investments totaling the maximum amount of required principal payments for the bonds scheduled to come due in one year. The debt service reserve accounts are revalued each year in October. Any amounts in excess of the debt service requirements are transferred to the applicable construction fund or taken into the operating fund of the Airports Authority if the construction funds have been expended. If the debt service reserve is undervalued, the Airports Authority transfers funds into the accounts. Assets restricted for leases represents funds which have been restricted based on operating lease agreements. Assets restricted for Dulles Rail latent defects and for Dulles Toll Road repairs represent cash and investments which are held in accordance with contractual agreements for the construction of the Dulles Metrorail Project as well as the operation of the Dulles Toll Road (see Note 4 Transfer of the Dulles Toll Road and Construction of the Dulles Metrorail Project). Assets restricted for the benefit of the Airports Authority s Public Safety department represent cash funds obtained through cooperative seizure activities with federal and state justice agencies (see Note 17 Government Grants). M. Capital Assets Capital assets used in operations Capital assets are stated at historical cost, or if acquired upon termination or expiration of tenant leases, fair market value. Costs for capital assets under construction include direct and financing costs incurred. The Airports Authority does not capitalize overhead or other indirect costs in operations construction programs; such costs are expensed as incurred. Provision for depreciation has been calculated using the straight-line method over the estimated useful lives of the assets. The cost of internally developed software and other assets, if amortized, uses the straight-line 50
59 method. The Airports Authority does identify certain intangible assets, such as permanent easements, as having indefinite lives. The estimated useful lives and corresponding capitalization thresholds are as follows: Category Useful Life Threshold Equipment 3-15 years $ 10,000 Motor vehicles 3-15 years $ 10,000 Intangible assets 3-15 years $ 10,000 Buildings 5-50 years $ 25,000 Systems and structures 5-50 years $ 25,000 Maintenance, repairs, and minor improvements and replacements are expensed as incurred. Permanently impaired capital assets that will continue to be used by the Airports Authority are written down to their measured impaired value. Pollution remediation obligations that do not qualify for capitalization are accrued as liabilities and expensed when a range of expected outlays is reasonably estimable or upon receipt of goods and services. Capital assets under construction to be transferred to other governmental agencies Costs for capital assets under construction, which upon completion will be transferred to other governmental agencies, are stated at historical cost and include direct costs, indirect costs, and financing costs. Indirect costs which are capitalized as project costs only include construction administration expenses directly attributable to these specific capital asset programs. The Airports Authority is responsible for acquiring the rights-of-way and property interest, including easements, necessary for the construction of the Dulles Metrorail Project and other projects within the Dulles Corridor. However, the Airports Authority and VDOT are coordinating the acquisition of the property and determining where property interests will be acquired by VDOT in the name of the Commonwealth either through eminent domain or through some other procedure. At the discretion of VDOT, all property in VDOT s control that is needed for these projects will be made available to the Airports Authority in the form of a land use permit. At the completion of the projects, VDOT shall transfer any property in its own name acquired for construction and operation of the projects by deed, easement, or permit to either the Airports Authority or VDOT. Although VDOT may hold the legal title to these acquired property interests, the costs incurred to acquire these property interests are included in construction in process, as the Airports Authority has control of these property interests during the construction period. Pollution remediation liabilities associated with the capital assets under construction to be transferred to other governmental agencies are capitalized as incurred, as these liabilities are incurred to prepare the capital asset for transfer to another governmental agency and the associated property was acquired with known or suspected pollution that was expected to be remediated. Once construction is completed and the asset is accepted by the other government agency, the Airports Authority will account for the transfer in accordance with the relevant accounting requirements. 51
60 N. Capitalization of Interest Interest incurred during the period that relates to the construction or production of capital assets or to the construction of assets which are discrete projects and intended for donation to other entities are capitalized. For interest on tax-exempt debt, the amount of interest to be capitalized is calculated by offsetting interest expense incurred with interest earned on invested debt proceeds, from the date of the borrowing until completion of the project. This net capitalized interest is allocated to completed projects based on the completion date of each project funded with proceeds from that particular debt issue. For interest on taxable debt, the amount of interest capitalized is calculated by applying the interest rate of the debt to the average amount of the accumulated expenditures during the period (Restated) Interest costs incurred $ 299,712,117 $ 298,085,474 Less: interest costs capitalized 59,700,353 60,673,689 Interest costs expensed $ 240,011,764 $ 237,411, Interest income earned $ 5,428,425 $ 5,734,458 Less: interest income capitalized 2,068,293 1,619,335 Interest income recognized $ 3,360,132 $ 4,115,123 O. Long-Term Debt Debt issuance costs represent expenses incurred in the process of issuing bonds, commercial paper notes and interest rate swaps and are amortized over the life of the related debt using the effective-interest method. Original issue discounts or premiums are also amortized using the effective-interest method over the life of the related debt. Interest on capital appreciation debt is accreted using the straight-line method. For debt refundings, the difference between the reacquisition price and the net carrying amount of the refunded debt is deferred and amortized as a component of interest expense using the straight-line method over the remaining life of the refunded debt or the life of the new debt, whichever is shorter. P. Federal, State & Local Grants The Airports Authority receives federal, state, and local grants in support of specific operational programs, its Capital Construction Program (CCP) and the Dulles Metrorail Project. Grants are recognized as related expenditures are made and all eligibility requirements are met. Grants recognized for services provided directly to a government entity are reported as operating revenues in the Statements of Revenues, Expenses and Changes in Net Assets. Grants for reimbursement of operating expenditures which are incurred during the normal course of operations but are not for services provided to any governmental entity are reported as non-operating revenues. Grants for capital asset acquisition, facility development, and/or rehabilitation and long-term planning are reported as capital contributions. Capital contributions are reported in the Statements of Revenues, Expenses and Changes in Net Assets after nonoperating revenues and expenses. 52
61 Q. Passenger Facility Charges In 1990, Congress approved the Aviation Safety and Capacity Expansion Act, which authorized domestic airports to impose a Passenger Facility Charge (PFC) on enplaning passengers. PFCs may be used for airport projects that meet at least one of the following criteria: preserve or enhance safety, security, or capacity of the national air transportation system; reduce noise or mitigate noise impact resulting from an airport; or furnish opportunities for enhanced competition between or among carriers. The Airports Authority has imposed PFCs since November 1993 at Reagan National and since January 1994 at Dulles International. PFCs are collected by the airlines and remitted on a monthly basis to the Airports Authority. The Airports Authority accounts for PFCs on an accrual basis, based on the month the charges were collected by the airlines. Due to their restricted use, PFCs are categorized as capital contributions. R. Lease Obligations The Airports were transferred by the federal government to the Airports Authority under the terms of a lease (the Federal Lease) which transferred a leasehold interest in all of the Airports then-existing real property, including access highways and related facilities, and transferred title to all equipment, materials, furnishings, and other personal property appurtenant to or located on the Airports property (other than particular property required for federal air traffic control responsibilities). Upon expiration of the Federal Lease, the Airports, including improvements, will be returned to the United States government. Since the transfer, the Airports Authority has acquired title to land and aviation easements adjacent to Dulles International for airport expansion. All land acquired after the transfer is not subject to the Federal Lease except that, pursuant to amendments to the Federal Lease, any after-acquired land in the Airports Authority s possession at the expiration of the Federal Lease will revert to the federal government. The Airports Authority accounts for the Federal Lease as an operating lease. The Federal Lease provides for an annual base rental payable to the United States Treasury and is subject to annual adjustment for inflation and interest. The Airports Authority invests the monthly lease payments in repurchase agreements or in certificates of deposits and makes semi-annual payments, including interest, to the United States government. In accordance with generally accepted accounting principles for an operating lease, the property originally transferred under the Federal Lease does not appear on the Statement of Net Assets. The Dulles Toll Road is operated under a permit and operating agreement (the Permit) from VDOT. Under the terms of the Permit, the Airports Authority has the exclusive right to establish, charge, and collect tolls and other user fees for the use of the Dulles Toll Road until the expiration of the term, or earlier termination, of the Permit. Under the terms of the Permit, the revenues from the Dulles Toll Road are to pay for the operation and maintenance of the Dulles Toll Road, to pay the debt service associated with construction of the Dulles Metrorail Project and other Dulles Corridor improvements, and to fund reserves associated with maintaining and preserving the Dulles Toll Road. Any residual amounts are to be paid to VDOT within 180 days of the end of the fiscal year. Upon the expiration of the term, or earlier termination, of the Permit, all facilities of the Dulles Toll Road, including any improvements, will be returned to VDOT in its original or an enhanced condition. Other than the residual amounts which may be owed by the Airports Authority to VDOT, the Permit does not require any significant consideration in exchange for the Airports Authority s access to operate and maintain the Dulles Toll Road. Only the improvements made by the Airports Authority to the Dulles Toll Road, along with related liabilities, appear on the Statement of Net Assets. 53
62 The Airports Authority has entered into leases for office space used exclusively by Dulles Metrorail Project personnel with lease terms consistent with the construction period for the Dulles Metrorail Project. The expenditures under these operating leases are capitalized as construction in progress costs of the Dulles Metrorail Project. S. Post-employment Benefits Post-employment benefits are accounted for under GASB Statement No. 27, Accounting for Pensions by State and Local Governmental Employers (GASB 27), as amended by GASB Statement No. 50, Pension Disclosures. This statement establishes standards for the measurement, recognition, and display of pension expense and related liabilities, assets, note disclosures, and, if applicable, required supplementary information in the financial reports of state and local governmental employers. The Airports Authority discloses the information required by GASB 27 in Note 8 Pension Plans and Deferred Compensation Plan. Post-employment benefits other than pension benefits are accounted for under GASB Statement No. 45, Accounting and Financial Reporting by Employers for Post-employment Benefits Other than Pensions (GASB 45). This statement establishes standards for the measurement, recognition, and display of other postemployment benefits (OPEB) expense and related liabilities, assets, note disclosures, and, if applicable, required supplementary information in the financial reports of state and local governmental employers. The Airports Authority discloses the information required by GASB 45 in Note 9 Post-employment Benefits. T. Compensated Absences Airports Authority employees are granted paid vacation at rates of 13 to 30 days per year, depending on their length of employment. General employees may accumulate up to a maximum of 30 days. Firefighters who work a 56-hour week may accumulate up to a maximum of six weeks. Executive employees exceeding a specified pay scale are entitled to accumulate up to 60 days. At management s discretion, employees may be allowed to accumulate vacation balances in excess of these limitations. The accumulated vacation is accrued when incurred, as employees will be paid for accumulated vacation either during their future service to the Airports Authority or upon their termination of service. The calculation of the liability is based on compensation rates plus related employer-paid benefits in effect as of the end of the current fiscal year. The portion of this liability expected to be paid within the next year is reflected in accrued expenses while the amount expected to be paid out after one year is included in other non-current liabilities. Airports Authority employees earn 13 days of sick leave per year. Unused sick leave for employees enrolled in the Airports Authority s retirement plan is counted at retirement as additional time worked for calculation of the pension benefit. There is no liability for unpaid accumulated sick leave, as the Airports Authority does not pay any amounts when employees separate from service. U. Deferred Revenues Deferred revenues consist of deferred charges for rents, landing fees, and passenger fees to be charged to airlines at both Airports, deferred non-airline rental income at Dulles International, and deferred tenant parking permit charges at both Airports. The deferred charges for rents, landing fees, and passenger fees charged to airlines are determined by the calculation of settlement (see Note 3 - Airport Use and Lease Agreement and Premises Lease). Deferred revenues as a result of settlement are recognized on a straight-line basis over a term of one year. Deferred non-airline rental income represents lease rentals, received in advance, for certain ground leases entered into with developers. Deferred tenant parking permit charges represent amounts not yet earned for tenant employee parking permits. Deferred non-airline rental income and tenant parking permit charges are 54
63 recognized as revenue on a straight-line basis over the terms of the related leases and permits when the term is less than one year. Deferred revenues for leases with developers with terms in excess of one year are recognized using the effective-interest method over the terms of the related agreements. V. Self-Insurance The Airports Authority provides employee group medical and dental insurance through a combination of selfinsured and insured arrangements. Under the self-insured plans, the Airports Authority assumes the financial risk for the payment of employee medical and pharmacy claim expenses incurred by participants. Under the fully insured plans, the Airports Authority pays a fixed premium for employee health care, prescription drugs, and dental insurance, and the insurance company assumes the risk for all claims expenses. Risk management insurance is also provided through a combination of self-insured and insured arrangements (see Note 19 Risk Management). The cost of claims reported and an estimate of claims incurred but not reported is charged to operating expenses. Liabilities for unpaid claims are accrued based on management s estimate using actual costs, historical experience, current trends, and quarterly actuarial reviews. Liabilities for unpaid claims expected to be paid out within the next year are included on the Statements of Net Assets in accounts payable and accrued expenses, while liabilities for unpaid claims which are expected to be paid out in years subsequent to the next year are included in other long-term liabilities. The appropriateness of the selfinsurance accrued liabilities is continually reviewed and updated by management. W. Taxes The Airports Authority is exempt from the payment of federal and state income, property, and certain other taxes. X. Recently Issued Accounting Pronouncements GASB Statement No. 60, Accounting and Financial Reporting for Service Concession Arrangements (GASB 60) establishes guidance for accounting and financial reporting for service concession arrangements (SCA), which are a type of public-private or public-public partnership. GASB 60 applies only to those arrangements in which specific criteria determining whether a transferor has control over the transferred facility are met. The requirements of GASB 60 are effective for fiscal year 2012 and thereafter. The requirements of GASB 60 would not currently impact the Airports Authority s financial statements, as none of the Airports Authority s existing rights and related obligations to provide public services through the use and operation of specific capital assets fulfill all of the requirements necessary to be considered an SCA in accordance with GASB 60. GASB Statement No. 61, The Financial Reporting Entity: Omnibus (GASB 61) modifies certain requirements for inclusion of component units in the financial reporting entity, amends the criteria for reporting component units as if they were part of the primary government in certain circumstances, and clarifies the reporting of equity interests in legally separate organizations. The requirements of GASB 61 are effective for fiscal year 2013 and thereafter. The requirements of GASB 61 would not currently impact the Airports Authority s financial statements, as the Airports Authority does not currently have component units or equity interests in legally separate organizations. GASB Statement No. 63, Financial Reporting of Deferred Outflows of Resources, Deferred Inflows of Resources, and Net Position (GASB 63) provides financial reporting guidance for deferred outflows of resources and deferred inflows of resources, which are distinct from assets and liabilities. The requirements of GASB 63 are effective for fiscal year 2012 and thereafter. The requirements of GASB 63 would not currently 55
64 impact the Airports Authority s financial statements as the Airports Authority does not currently have any deferred inflows or deferred outflows of resources. GASB Statement No. 64, Derivative Instruments: Application of Hedge Accounting Termination Provisions, an amendment of GASB Statement No. 53 (GASB 64) clarifies the circumstances in which hedge accounting should continue when a swap counterparty, or a swap counterparty s credit support provider, is replaced. The requirements of GASB 64 are effective for fiscal year 2012 and thereafter. The requirements of GASB 64 would not currently impact the Airports Authority s financial statements, as the Authority s swaps were found to be ineffective in 2008 when GASB Statement No. 53, Accounting and Financial Reporting for Derivative Instruments, was implemented, and therefore, hedge accounting ceased permanently for the related instruments. GASB Statement No. 65, Items Previously Reported as Assets and Liabilities (GASB 65) establishes accounting and financial reporting standards that reclassify, as deferred outflows of resources or deferred inflows of resources, certain items that were previously reported as assets and liabilities and recognizes, as outflows of resources or inflows of resources, certain items that were previously reported as assets and liabilities. It also limits the use of the term deferred in financial statement presentations. The requirements for GASB 65 are effective for fiscal year 2013 and thereafter. Implementation of GASB 65 by the Airports Authority will result in the recognition as expense for bond issuance costs in the period when incurred, except for prepaid insurance costs associated with the issuance of debt. As the Airports Authority has historically recognized bond issuance costs as assets and amortized these costs over the life of the associated debt, the Airports Authority will recognize a material prior period adjustment upon the implementation of GASB 65 to write-off unamortized bond issuance costs, less any costs related to prepaid insurance costs, as the total amount of unamortized bond issuance costs as of December 31, 2011 was $91.7 million. The amount as of December 31, 2011, of prepaid insurance costs associated with the issuance of debt has not been determined. The write-off of these unamortized bond issuance costs will result in a reduction of unrestricted net assets. GASB Statement No. 66, Technical Corrections 2012 (GASB 66) improves accounting and financial reporting by resolving conflicting guidance that resulted from the issuance of Statements No. 54, Fund Balance Reporting and Governmental Fund Type Definitions, and No. 62, Codification of Accounting and Financial Reporting Guidance Contained in Pre-November 30, 1989 FASB and ACIPA Pronouncements. The requirements for GASB 66 are effective for fiscal year 2013 and thereafter. The requirements of GASB 66 would not currently impact the Airports Authority s financial statements as the amendments included in GASB 66 to previous GASB statements are not currently relevant to the financial statements of the Airports Authority. The Airports Authority will implement these statements as of their effective dates. 2. RESTATEMENT OF PRIOR YEARS RESULTS The Airports Authority has restated its 2010 financial statements to correct errors identified in The cumulative effect of adjustments to correct errors for 2010 is a decrease in the change in net assets for the year ended December 31, 2010, of $3.2 million, or 1.1 percent. The cumulative effect of adjustments to correct errors for years prior to 2010 is a decrease to total beginning net assets for the 2010 year of $59.2 million, or 3.7 percent. Correction of Classification Errors Receivables totaling $1.9 million as of December 31, 2010, have been changed for a classification error from unrestricted current assets to restricted non-current assets. These Aviation Enterprise Fund receivables are restricted for purposes of construction or for Dulles Air Traffic Control Tower expenditures. Receivables 56
65 totaling $684 thousand have been changed for a classification error from restricted non-current assets to unrestricted current assets, as these receivables are for grant reimbursements of operating expenditures. Dulles Corridor Enterprise Fund payments in advance totaling $180 thousand as of December 31, 2010, have been changed for a classification error from restricted non-current assets to unrestricted current assets, as only expendable assets are categorized as restricted assets. The Aviation Enterprise Fund s interest rate swap payable of $104.2 million as of December 31, 2010, has been changed for a classification error from inclusion in the determination of restricted net assets to inclusion in the determination of unrestricted net assets, as resources have not been restricted for possible payment of the fair value of these swaps. However, as the previous inclusion of this liability in the determination of restricted net assets resulted in a negative amount for restricted net assets of $52.2 million which was properly categorized as unrestricted net assets, only the partial amount of $52.0 million of the $104.2 million liability has been changed as a result of the correction of this classification error. The Dulles Corridor Enterprise Fund s debt for the accretion of interest for capital appreciation debt of $41.0 million as of December 31, 2010, has been changed for a classification error from inclusion in the determination of invested in capital assets, net of related debt, to inclusion in the determination of unrestricted net assets, as there were neither proceeds associated with this debt which were subsequently spent on the acquisition, construction or improvement of a capital asset nor any restricted resources accumulated to pay off any portion of this debt at maturity. Debt related to unspent proceeds totaling $449.1 million has been changed for a classification error from inclusion in the determination of invested in capital assets, net of related debt, to inclusion in the determination of restricted net assets as required by relevant accounting standards. The impact of this change is to increase the Dulles Corridor Enterprise Fund s invested in capital assets, net of related debt, by $371.2 million and the Aviation Enterprise Fund s invested in capital assets, net of related debt, by $77.9 million, with offsetting reductions in restricted net assets for each of the Funds. Correction of Errors in the Valuation of Long-Term Investments Long-term investments at market valuations were overstated as of December 31, 2010 by $66.6 million, of which $1.2 million was included in investment income for 2010 and $65.4 million was the accumulation of amounts erroneously included in investment income in prior years since 2003 or earlier. Restatement of restricted long-term investments as of December 31, 2010, resulted in a decrease in restricted net assets of $31.2 million for the Aviation Enterprise Fund and $717 thousand for the Dulles Corridor Enterprise Fund. Restatement of unrestricted long-term investments as of December 31, 2010 resulted in a decrease in the Aviation Enterprise Fund s unrestricted net assets of $34.7 million. Correction of Errors in the Amortization of Bond Premium The amortization of bond premium for debt issued in 2006 by the Aviation Enterprise Fund was corrected, reducing long-term debt by $14.5 million. As the proceeds of this debt were used for construction of capital assets, $6.7 million of the correction of the bond premium amortization was a reduction to capitalizable interest and $7.8 million was a reduction to interest expense, of which $3.5 million related to interest expense recognized in The reduction in capitalizable interest of $6.7 million further resulted in a reduction in interest costs capitalized to building and systems from 2007 through 2010 totaling $4.9 million. The reduction in debt, less the reduction in capital assets, resulted in a net increase of $7.8 million to invested in capital assets, net of related debt. Depreciation and amortization expense for the Aviation Enterprise Fund decreased by $149 thousand due to the decrease in the cost basis of depreciable capital assets of $4.9 million. Of this decrease, 57
66 $105 thousand was recognized in 2010, with the remainder being a reduction of expense for prior years. This decrease resulted in a net increase of $149 thousand to invested in capital assets, net of related debt. Correction of Errors in Recognition of Interest Income and Interest Expense Investment income earned by the Aviation Enterprise Fund was corrected for $1.8 million of interest earned in years prior to 2010 on the note receivable from United Airlines (see Note 8 Note Receivable). As this interest had previously been recorded to construction in progress, the correction had the effect of increasing invested in capital assets, net of related debt. Interest expense of the Dulles Corridor Enterprise Fund was increased in 2010 by $9.9 million for interest costs incurred on the unspent bond proceeds of tax-exempt debt, which previously had been included in construction in progress Dulles Metrorail Project. This restatement had the effect of decreasing invested in capital assets, net of related debt. Correction of Errors in Accrued Liabilities for Capital Asset Additions Accounts payable and accrued expenses were increased in 2010 by $5.0 million for the Aviation Enterprise Fund and $9.0 million for the Dulles Corridor Enterprise Fund for capital asset additions in that year. Correction of Errors in Recognition of Grant Revenues Accrued grant proceeds due from the Federal Transit Administration and Fairfax County were increased as of December 31, 2010, to recognize $10.7 million in additional grant revenues relating to accrued interest costs and Dulles Metrorail Project expenditures which are eligible for grant reimbursement. This restatement had the effect of increasing invested in capital assets, net of related debt. 58
67 The following table summarizes the effects of the restatements in the Statement of Net Assets as of December 31, 2010: ASSETS Total Business- Type Activities As Reported Correction of classification errors Correction of valuation of long-term investments Adjustments Correction of bond premium amortization Correction of interest recognition Correction of capital asset additions Correction of grant revenue accrual Total Business- Type Activities As Restated Total current assets $ 699,954,344 $ (994,095) $ - $ - $ - $ 14,024,011 $ - $ 712,984,260 Non-current assets Restricted 1,362,293, ,095 (31,917,156) - - (14,024,011) 10,687,218 1,328,033,151 Unrestricted 273,782,093 - (34,678,095) ,103,998 Capital assets: Land and other non-depreciable assets 156,407, ,407,176 Construction in progress 316,273, (1,747,989) 1,823, ,349,408 Construction in progress, Metrorail project 1,370,101, (9,894,865) 9,024,011-1,369,230,352 Buildings, systems and equipment 6,538,271, (4,900,342) - 5,000,000-6,538,371,645 Less: accumulated depreciation (1,878,502,538) ,753 - (20,833) - (1,878,374,618) Capital assets, net 6,502,551, (6,499,578) (8,070,991) 14,003,178-6,501,983,963 Total non-current assets 8,138,626, ,095 (66,595,251) (6,499,578) (8,070,991) (20,833) 10,687,218 8,069,121,112 Total assets $ 8,838,580,796 $ - $ (66,595,251) $ (6,499,578) $ (8,070,991) $ 14,003,178 $ 10,687,218 $ 8,782,105,372 LIABILITIES AND NET ASSETS Total current liabilities $ 392,926,909 $ - $ - $ - $ - $ 14,024,011 $ - $ 406,950,920 Total non-current liabilities 6,567,056, (14,491,355) - - 6,552,565,607 Total liabilities 6,959,983, (14,491,355) - 14,024,011-6,959,516,527 NET ASSETS Invested in capital assets, net of related debt 926,200, ,392,705-7,991,777 (8,070,991) (20,833) 10,687,218 1,420,180,335 Total restricted 528,848,684 (389,520,163) (31,917,156) ,411,365 Unrestricted 423,547,782 (93,872,542) (34,678,095) ,997,145 Total net assets 1,878,596,925 - (66,595,251) 7,991,777 (8,070,991) (20,833) 10,687,218 1,822,588,845 Total net assets and liabilities $ 8,838,580,796 $ - $ (66,595,251) $ (6,499,578) $ (8,070,991) $ 14,003,178 $ 10,687,218 $ 8,782,105,372 The following table summarizes the effects of the restatements in the Statement of Revenues, Expenses and Changes in Net Assets for the period ended December 31, 2010: Total Business- Type Activities As Reported Correction of classification errors Correction of valuation of long-term investments Correction of bond premium amortization Adjustments Correction of interest recognition Correction of capital asset additions Correction of grant revenue accrual Total Business- Type Activities As Restated Total operating revenues $ 691,912,884 $ - $ - $ - $ - $ - $ - $ 691,912,884 Total operating expenses 608,805, (104,747) - 20, ,721,883 Operating income 83,107, ,747 - (20,833) - 83,191,001 Non-operating revenues (expenses) (248,061,815) - (1,220,335) 3,544,087 (9,894,865) - - (255,632,928) Total capital contributions 447,571, ,649, ,221,068 NET ASSETS Increase (decrease) in net assets 282,616,479 - (1,220,335) 3,648,834 (9,894,865) (20,833) 10,649, ,779,141 Total net assets, beginning of year 1,595,980,446 - (65,374,916) 4,342,943 1,823,874-37,357 1,536,809,704 Total net assets, end of year $ 1,878,596,925 $ - $ (66,595,251) $ 7,991,777 $ (8,070,991) $ (20,833) $ 10,687,218 $ 1,822,588,845 59
68 The following table summarizes the effects of the restatements in the Statement of Cash Flows for the period ended December 31, 2010: Total Business- Type Activities As Reported Correction of classification errors Correction of valuation of long-term investments Correction of bond premium amortization Adjustments Correction of interest recognition Correction of capital asset additions Correction of grant revenue accrual Total Business- Type Activities As Restated Net cash provided by operating activities $ 294,403,624 $ - $ - $ - $ - $ - $ - $ 294,403,624 Net cash provided (used) by noncapital financing activities (7,805,066) (7,805,066) Net cash provided (used) by capital and related financing activities (183,156,060) (183,156,060) Net cash provided by investing activities 105,118, ,118,939 Net increase in cash and cash equivalents 208,561, ,561,437 Cash and cash equivalents, beginning of year 678,375, ,375,413 Cash and cash equivalents, end of year $ 886,936,850 $ - $ - $ - $ - $ - $ - $ 886,936,850 Noncash investing, capital and financing activities: Unrealized gain (loss) on investments $ 9,051,180 $ - $ (1,220,335) $ - $ - $ - $ - $ 7,830,845 Buildings and improvements provided by tenants: $ 650, $ 650,000 Capital construction costs payable $ 156,226, ,024,011 - $ 170,250,672 Fair value loss on swaps $ (34,978,411) $ (34,978,411) 3. AIRPORT USE AGREEMENT AND PREMISES LEASE In February 1990, the Airports Authority entered into a long-term Airport Use Agreement and Premises Lease (Use and Lease Agreement) with the major airlines (Signatory Airlines) serving the Airports. The Use and Lease Agreement is for a term of 25 years, subject to unilateral termination rights by the Airports Authority beginning in 2004, and annually thereafter, at the option of the Airports Authority. Such termination rights have not been exercised, and the Use and Lease Agreement currently remains in effect. For airline-supported cost centers, rates and charges are established to provide net revenues before the payment of debt service of at least 125 percent of debt service. The Use and Lease Agreement provides for the calculation of annual rates and charges, with rate adjustments at midyear, or any time revenues fall five percent or more below projections to provide for full cost recovery plus debt service coverage. The Use and Lease Agreement also provides for an annual settlement whereby the rates and charges are recalculated using audited financial data to determine any airline over/underpayment for airline-supported cost centers. For the years ended December 31, 2011 and 2010, the settlement resulted in a net charge to the Signatory Airlines of $18.0 million and $6.4 million, respectively. At the conclusion of each year, the amount of any Net Remaining Revenue at each Airport is determined. Net Remaining Revenue is defined as revenues less all operating and maintenance expenses, debt service, deposits to specified reserves, and other requirements. Net Remaining Revenue is allocated between the Airports Authority and the Signatory Airlines in accordance with the Use and Lease Agreement. The Airports Authority s share of Net Remaining Revenue is reflected in the Airports Authority s Capital Fund and is available for repair and rehabilitation projects or any other lawful purpose. The Signatory Airlines share of Net Remaining Revenue, called Transfers, is applied as a credit in the calculation of the ensuing year s rates and charges, in accordance with the Use and Lease Agreement. To calculate Transfers, the Use and Lease Agreement establishes a plateau amount of $8.0 million at Reagan National and $12.0 million at Dulles International, escalated by the implicit price deflator index from the base 60
69 year of 1989 to the current year. Net Remaining Revenue is shared approximately 50/50 until reaching the plateau. When the Transfer amount to the Signatory Airlines reaches the plateau, the amount over the plateau is allocated 75.0 percent to the Signatory Airlines and 25.0 percent to the Airports Authority. For the years ended December 31, 2011 and 2010, at Dulles International, the Transfer amount exceeded the plateau by $10.0 million and $11.3 million, respectively. For the year ended December 31, 2011 at Reagan National, the Transfer amount exceeded the plateau by $1.7 million. For the year ended December 31, 2010, at Reagan National, the Transfer exceeded the plateau by $1.0 million. For the years ended December 31, 2011 and 2010, the Signatory Airlines Transfer amount was $61.6 million, and the Airports Authority s share of Net Remaining Revenue was $40.2 million and $38.6 million, respectively. 4. TRANSFER OF THE DULLES TOLL ROAD AND CONSTRUCTION OF THE DULLES METRORAIL PROJECT Dulles Toll Road On November 1, 2008, the Virginia Department of Transportation (VDOT) transferred operational and financial control of the Dulles Toll Road (Omer L. Hirst Adelard L. Brault Expressway) to the Airports Authority for a term of 50 years, upon the terms and conditions set forth by the Master Transfer Agreement dated December 29, 2006, and the Permit and Operating Agreement dated December 29, 2006, each entered into by and between VDOT and the Airports Authority. Concurrent with this transfer of rights and responsibility, VDOT contributed to the Airports Authority approximately $272.1 million of capital property, including $254.8 million of construction in progress, for the Dulles Metrorail Project. The Airports Authority accounted for the transfer in accordance with GASB Statement No. 33, Accounting and Financial Reporting for Nonexchange Transactions. In exchange for the rights to the revenues from operation of the Dulles Toll Road and certain other revenues described in the VDOT Agreements, the Airports Authority agreed to (i) operate and maintain the Dulles Toll Road, (ii) cause the design and construction of the extension of the Washington Metropolitan Area Transit Authority (WMATA) Metrorail system from the West Falls Church station in Fairfax County, along the Dulles Corridor to Dulles International and beyond into Loudoun County (the Dulles Metrorail Project) and (iii) make other improvements in the Dulles Corridor consistent with VDOT and regional plans. The Dulles Corridor is defined as the transportation corridor with an eastern terminus of the East Falls Church Metrorail station at Interstate Route 66 and a western terminus of VA Route 772 in Loudoun County, VA. The Airports Authority is solely responsible for setting toll rates and collecting tolls on the Dulles Toll Road, following its process for issuing regulations and in consultation with the Dulles Corridor Advisory Committee. The Dulles Corridor Advisory Committee is an eight-member committee, composed of two representatives for each of the Airports Authority, Fairfax County, Loudoun County, and the Commonwealth of Virginia, to provide the Airports Authority with advice on issues related to the management, improvement, and expansion of the Dulles Corridor, as well as changes to the toll rates on the Dulles Toll Road. The Airports Authority may not use any net revenues pledged for payment of the Airport System Revenue Bonds or Notes to support the operation of the Dulles Toll Road or to pay debt service on Dulles Toll Road Revenue Bonds. Likewise, the Airports Authority may not use any revenues pledged for payment of the Dulles Toll Road Revenue Bonds or Notes to support the operation of the Airports or to pay debt service on Airport System Revenue Bonds or Notes. 61
70 Dulles Metrorail Project The Airports Authority is funding and constructing the 23-mile Dulles Metrorail Project in two phases. Phase 1 of the Dulles Metrorail Project will extend 11.7 miles from near the West Falls Church station to Wiehle Avenue in Reston, VA. It includes five new stations and improvements to the existing WMATA Service and Inspection Yard at the West Falls Church station. Phase 2 of the Metrorail Project will extend the Metrorail system an additional 11.3 miles from Wiehle Avenue through Dulles International and west into Loudoun County, VA. Phase 2 of the Metrorail Project is expected to include six new stations and a maintenance yard located on Dulles International Airport property. The Metrorail Project is being funded with a combination of toll road revenue bonds secured by a pledge of Dulles Toll Road revenues, federal grants, and contributions from local jurisdictions. In addition, approximately 4.1 percent of the Phase 2 costs are expected to be paid from Passenger Facility Charges of the Airports. The current Use and Lease Agreement, as more fully described in Note 3 Airport Use Agreement and Premises Lease, limits to $10.0 million the amount of airport capital costs that can be incurred for construction of the Dulles Metrorail Project at Dulles International, unless otherwise agreed upon. As of December 31, 2011, the Airports Authority has issued approximately $1.4 billion of Dulles Toll Road Revenue Bonds, including accretion of Capital Appreciation Bonds (see Note 15 Capital Debt). Upon completion of construction of each phase of the Dulles Metrorail Project and acceptance by WMATA into the Metrorail system, the Airports Authority will transfer, without financial retribution, ownership of the completed phase of the project to WMATA. At that point, WMATA will become the owner and operator of the completed phase and will be solely responsible for its operation and maintenance. None of the operating and maintenance expenses of the completed phase will constitute operating or maintenance expenses of the Airports Authority. Such expenses will be payable entirely from WMATA s operating and other revenues (including revenues derived from the operation of the Dulles Metrorail Project). The debt associated with construction of each phase of the Dulles Metrorail Project will remain with the Airports Authority and will not be transferred to WMATA. Construction in progress amounts related to both phases of the Metrorail Project are disclosed in Note 10 Changes in Capital Assets. 5. DEPOSITS AND INVESTMENTS Deposits The Airports Authority s investment policy, as approved by the Board, requires that deposits in excess of the federally insured amount be held at institutions with a Kroll Bond Rating Agency rating of B or above. In the event a financial institution s rating falls below this level, the deposits are to be reduced to the federally insured amount. The Airports Authority s practice is to sweep all demand deposits at the close of each business day into overnight repurchase agreements. As of December 31, 2011 and 2010, the Airports Authority had various certificates of deposit in the amount of $6.3 million and $3.0 million, respectively, that were not covered by insurance and were not collateralized with securities held by the pledging financial institutions. These certificates of deposit were held at institutions with a Kroll Bond Rating Agency rating of B or above. These certificates of deposit were part of the Airports Authority s Linked Deposit Program, whereby a portion of the reserve funds were deposited with banks that have an outstanding Community Reinvestment Act rating. 62
71 The Airports Authority maintains multiple imprest cash funds in certain departments. These amounts are not covered by insurance and are not collateralized. These funds totaled $200.3 thousand and $189.0 thousand as of December 31, 2011 and 2010, respectively. Investments The carrying value, weighted average maturity and credit quality of the Airports Authority s investment portfolio, by investment type, as of December 31, 2011 was as follows: Weighted Average Credit Carrying Maturity % of 2011 Investments Rating 1 Value (years) Portfolio Treasury $ 546,982, % Fannie Mae Aaa/AAA 35,431, % Freddie Mac Aaa/AAA 19,428, % Farmer Mac 19,997, % Home Loan Aaa 30,378, % Commercial Paper A-1/P-1 14,966, % MBIA GIC B-/B2 36,274, % FSA GIC AA-/Aa3 67,075, % BOA FPA A-/Baa1 7,716, % City First Bank Repo C (Kroll Bond Rating) 750, % Overnight Sweeps A-1/P-1 to A-2/P-2 251,929, % Debt Service Reserve Repurchase Agreements: BOA Repo A-/Baa1 16,333, % Morgan Stanley Repo A-/A2 72,406, % $ 1,119,670, % 1 The ratings in these tables are from Fitch, Moody s or S&P 2 Underlying rating of the counterparties 3 Collateralized by Federal Agency Notes 63
72 The carrying value, weighted average maturity and credit quality of the Airports Authority s investment portfolio, by investment type, as of December 31, 2010 was as follows: Weighted Average Credit Carrying Maturity % of 2010 Investments Rating 1 Value (years) Portfolio Treasury - $ 504,303, % Fannie Mae Aaa/AAA 140,161, % Farmer Mac 40,288, % Farm Credit 28,766, % Federal Home Loan Bank Aaa 120,453, % Commercial Paper P-1 9,977, % MBIA Guaranteed Invest Contract 2 Ba3/B- 36,274, % FSA Guaranteed Invest Contract 2 Aa3/AA+ 67,075, % Bank of America-Forward Purchase Agreement A2/A 7,716, % City First Bank Repurchase Agreement B- (LACE) 750, % Branch Banking and Trust Repurchase Agreement P-1/A-1 750, % Overnight Repurchase Agreements 3 390,837, % Debt Service Reserve Repurchase Agreements: Bank of America Repo A2/A 16,333, % Morgan Stanley Repo A2/A 72,406, % $ 1,436,094, % 1 T he ratings in these tables are from Fitch, Moody s or S&P 2 Underlying rating of the counterparties 3 Collateralized by Federal Agency Notes Credit Risk Credit Risk is the risk that the Airports Authority will lose money due to the default of the issuer or investment counterparty of the security. The primary objectives of the Airports Authority s investment policy are the safety of capital, the liquidity of the portfolio and the yield of investments. Bond proceeds may be invested in securities as permitted in the bond indentures; otherwise, assets of the Airports Authority may be invested in United States Treasury securities; short-term obligations of the United States Government agencies; short-term obligations of the Commonwealth of Virginia, the State of Maryland, and the District of Columbia; certificates of deposit with banks that have a Kroll Rating Agency rating of B or better, or that are fully insured or collateralized; prime CP rated A1 and P1 by Standard & Poor s Rating Services (S&P) and Moody s Investors Service Inc. (Moody s), respectively; prime bankers acceptance notes; repurchase agreements whose underlying collateral consists of the foregoing; money market or mutual funds or other such securities or obligations that may be approved by the Finance Committee by modification of the Airports Authority s policy. Custodial Credit Risk Custodial credit risk is the risk that, in the event of a failure of the counterparty, the Airports Authority would not be able to recover the value of its deposits, investments or collateral securities that were in the possession of an outside party. Deposits are exposed to custodial credit risk if they are uninsured and uncollateralized. 64
73 Investment securities are exposed to custodial credit risk if they are uninsured or not registered in the name of the Airports Authority and are held by either the counterparty or the counterparty s trust department or agent but not in the Airports Authority s name. The Airports Authority s investment policy requires that securities be insured or registered investments or securities held by the Airports Authority or its agent in the Airports Authority s name. As of December 31, 2011 and 2010, all the Airports Authority s securities were held by the Airports Authority or its agent in the Airports Authority s name and were fully insured or registered investments. Repurchase agreements and guaranteed investment contracts are required to be collateralized at percent and require the collateral to be Authorized Investments as described in the Investment Policy and the Master Bond Indenture. The Airports Authority s forward purchase agreement is collateralized at percent with securities delivered monthly. The collateral is required to be an approved Airports Authority investment, as described in the Master Bond Indenture. The fair value of the collateral for overnight repurchase agreements was $259.4 million on December 31, The fair value of the collateral for the guaranteed investment contracts was $119.0 million on December 31, The fair value of the collateral for the forward purchase agreements was $7.7 million on December 31, The fair value of the collateral for the Debt Service Reserve repurchase agreements was $92.6 million as of December 31, All the collateral for these contracts was held by the Airports Authority s agent in the Airports Authority s name. Interest Rate Risk The Airports Authority s investment policy as approved by the Board is designed to maximize investment earnings, while protecting the security of the principal and providing adequate liquidity. The overriding policy for investment decisions is to have funds available as needed for construction and general operating expenses. The Airports Authority s Investment Committee meets quarterly and determines the investment horizon for each fund based on current construction or operating needs and the prevailing market conditions. Each investment transaction shall seek to ensure that capital losses are avoided, whether they are from securities defaults or erosion of market value. The Airports Authority mitigates interest rate risk by managing the weighted average maturity of each portfolio type to best meet liquidity needs. Concentration of Credit Risk The Airports Authority, as previously described, is limited to investments allowed by the bond indentures and the authorized investment policy. However, the policy does not limit the aggregation of investments in any one type of security. There are providers of securities in which the Airports Authority has invested individually more than 5.0 percent of the total portfolio. In accordance with the provisions of GASB Statement No. 31, Accounting and Reporting For Certain Investments and For External Investments Pools (GASB 31), investments with an original maturity greater than one year are recorded at their fair value and all investment income, including changes in the fair value of investments, are reported as investment income in the financial statements. As permitted by GASB 31, investments with an original maturity of less than one year are carried at amortized cost. Fair values are determined through quoted market prices. 65
74 The tables below present the Airports Authority s investments in accordance with GASB 31: As of December 31, 2011 Carrying Cost Value Securites with original maturity 1 year and over $ 669,791,638 $ 692,454,674 Securites with original maturity less than 1 year 427,628, ,216,022 $ 1,097,420,048 $ 1,119,670,696 As of December 31, 2010 Carrying Cost Value Securites with original maturity 1 year and over $ 712,177,062 $ 720,347,380 Securites with original maturity less than 1 year 715,824, ,747,479 $ 1,428,030,449 $ 1,436,094,859 Change in fair value from December 31, 2010 to December 31, 2011: Fair value at December 31, 2011 $ 1,119,670,696 Add: Proceeds of investments sold in ,101,678,120 Less: Cost of investments purchased in 2011 (769,762,432) Less: Fair value at December 31, 2010 (1,436,094,859) Change in fair value of investments $ 15,491,525 Change in fair value from December 31, 2009 to December 31, 2010: Fair value at December 31, 2010 $ 1,436,094,859 Add: Proceeds of investments sold in ,754,965,900 Less: Cost of investments purchased in 2010 (1,797,919,589) Less: Fair value at December 31, 2009 (1,384,089,990) Change in fair value of investments $ 9,051,180 66
75 Reconciliation to Comparative Statements of Net Assets A reconciliation of deposits and investments to the comparative Statements of Net Assets follows: As of December 31, (Restated) Deposits $ 9,548,306 $ 5,958,338 Money market 494,256, ,302,392 Certificates of deposit 6,250,000 5,761,292 Securities 1,119,670,696 1,436,094,859 $ 1,629,725,753 $ 1,943,116,881 Current assets Cash and cash equivalents $ 152,198,752 $ 156,854,724 Restricted cash and cash equivalents 360,379, ,313,856 Investments 101,610, ,751,777 Non-current assets Restricted cash and cash equivalents 237,853, ,768,270 Restricted investments 596,508, ,186,839 Unrestricted investments 181,174, ,241,415 $ 1,629,725,753 $ 1,943,116, ACCOUNTS RECEIVABLE Accounts receivable consisted of the following: As of December 31, (Restated) Trade accounts receivable $ 36,988,325 $ 16,901,114 Less: allowance for doubtful accounts (290,998) (681,294) Trade accounts receivable, net 36,697,327 16,219,820 Settlement due from airline tenants 20,158,220 12,483,524 Operating grants reimbursement receivable 602, ,302 Current portion of note receivable 2,807,804 2,286,545 Other receivables 1,879,267 2,152,816 Total trade accounts receivable $ 62,144,758 $ 33,827,007 Passenger facility charges receivable $ 6,378,002 $ 7,024,100 Capital contribution grants reimbursement receivable 158,314, ,178,941 Other 352, ,001 Total restricted accounts receivable $ 165,044,541 $ 169,078,042 During 2011, American Airlines, Inc. filed for Chapter 11 bankruptcy protection with a pre-petition balance of $605 thousand. During 2010, Mesa Air Group and Sky King filed for Chapter 11 bankruptcy protection, and Mexicana Airlines filed for Chapter 15 bankruptcy protection. The Airports Authority s receivables for pre- 67
76 petition debt for the 2010 bankruptcy filings were $479 thousand, a portion of which were written off against the allowance for doubtful accounts during As of December 31, 2011, the Airports Authority s accounts receivable included $726 thousand of pre-petition debt. The Airports Authority anticipates collection of the majority of the remaining receivables for pre-petition debt and has not established additional reserves specifically for these account balances, as existing reserves are judged sufficient to cover any potentially uncollectible receivables. 7. NOTE RECEIVABLE The Airports Authority has a note receivable from United Airlines (UAL). UAL agreed to reimburse the Airports Authority $20.4 million in design fees incurred by the Airports Authority in connection with the development of a new concourse and related improvements, described and defined as the Tier 2 Package. The terms of this note receivable specify that interest at the rate of 3.87 percent commence in March 2006; that UAL make annual payments of $1.0 million in 2007, 2008, and 2009; and that UAL commence monthly payments in March 2008 of $83,055, subject to annual escalations. Amounts scheduled to be received on this note receivable are: Year ended December 31, 2012 $ 2,807, ,506, ,991, ,924, ,386 Total future payments 16,079,090 Less: interest to be earned 1,394,597 Less: current portion of note receivable 2,807,804 Non-current portion of note receivable $ 11,876, PENSION PLANS AND DEFERRED COMPENSATION PLAN The Airports Authority participates in two United States Government pension plans: the Civil Service Retirement System (CSRS) and the Federal Employees Retirement System (FERS). Each is considered a costsharing, multiple-employer public employee retirement system (PERS). Employees hired before December 31, 1983 are members of the CSRS unless they elected to transfer to the FERS either before December 31, 1987 or during the special enrollment period from July 1, 1998 through December 31, Effective April 1, 1987, a Thrift Savings Plan was added whereby CSRS and FERS members can contribute a percentage of their salaries on a tax-deferred basis up to Internal Revenue Service elective deferral limits ($16,500 in 2011). In addition to the above described Plans, the Airports Authority maintains single-employer defined benefit pension plans that cover its regular employees and its police and fire (public safety) employees hired on or after June 7, 1987 and offers employees a deferred compensation plan and a money purchase pension plan. Under the CSRS, employees contribute 7.0 percent of their base pay (7.5 percent for public safety employees) and the Airports Authority matches the employees contributions. Retirement benefits are based on length of service and the average of the employee s three highest years of base pay. Employees are eligible to retire at age 55 with 30 years of service; age 60 with 20 years of service; or age 62 with 5 years of service. Public safety employees can retire at age 50 with 20 years of service. Retirement annuities range from 7.5 percent to a 68
77 maximum 80.0 percent of the average of the employee s three highest years of base pay depending on an employee s length of service. As of December 31, 2011, there were 27 regular employees and 2 public safety employees enrolled in the CSRS. Under the FERS, employees derive benefits from three different sources: a Basic Benefit Plan (BBP), Social Security, and a Thrift Savings Plan. Employee contributions to the BBP range from 0.8 percent of base pay for regular employees to 1.3 percent for public safety employees. The Airports Authority contribution ranges from 10.7 percent of base pay for regular employees to 23.3 percent of base pay for public safety employees. Employees are eligible to retire when they have 10 years of service and have reached a minimum retirement age based on date of birth and ranging from 55 to 57 years of age. Retirement annuities range from 1.0 percent (less than 20 years of service) to 1.1 percent (20 or more years of service) of the average of the employee s three highest years of base pay for each year of service. Public safety employees can retire at age 50 with 20 years of service or at any age with 25 years of service. These employees receive retirement benefits equal to 1.7 percent of the average of the employee s three highest years of base pay for every year of service up to 20 years plus 1.0 percent of the same average three-year high for every year of service over 20 years. As of December 31, 2011, there were 39 regular employees and 19 public safety employees enrolled in the FERS. The Airports Authority s base pay for employees covered by the CSRS and the FERS for the year ended December 31, 2011 was $7.7 million. Employee contributions to the federal pension plans for 2011, 2010, and 2009 were $253 thousand, $286 thousand, and $304 thousand, respectively. Employer contributions to the federal pension plans for 2011, 2010, and 2009 were $933 thousand, $963 thousand, and $976 thousand, respectively. These contributions represent 100 percent of required contributions for each of the respective years. The Airports Authority s total base pay for all employees, including employees covered by CSRS and FERS, was $99.8 million and $96.1 million in 2011 and 2010, respectively. Plan documents and audited plan financials for the CSRS and FERS plans may be obtained by written request to: U.S. Office of Personnel Management, Retirement Operations Center, P.O. Box 45, Boyers, PA, Airports Authority Pension Plans Effective January 1, 1989, the Airports Authority established a retirement benefits program for employees hired on or after June 7, Employee coverage and service credit was retroactive to June 7, The program includes the Airports Authority s General Employee Retirement Plan (the Regular Plan, covering regular employees) and the Police Officers and Firefighters Retirement Plan (the Police and Firefighter Plan, covering public safety employees) with the exception of employees working less than 20 hours per week and other temporary employees. Collectively, these plans are referred to as the Plans. Both are considered to be singleemployer defined benefit plans. Any amendment to the Plans must be approved by the Airports Authority s Board of Directors. The Plans provide retirement and death benefits to plan members and beneficiaries. As of December 31, 2011, the number of employees participating in the Plans was: Current Participants Regular Public Safety Total Vested Non-vested Retirees/disabled employees currently receiving benefits Terminated vested participants Total 1, ,857 69
78 Regular employees who retire at or after age 60 with five years of credited service are entitled to an annual retirement benefit, payable monthly for life, in an amount equal to 1.2 percent of final-average eligible compensation up to covered compensation and 1.6 percent of final-average base pay above covered compensation for each year of credited service (maximum of 30 years). Eligible compensation includes base pay and shift differential for wage grade employees. Regular employees with at least five years of service can receive benefits starting at age 55 with a 5 percent reduction in benefits for each year the participant is younger than age 60. Employees do not contribute to the Regular Plan. Public safety employees who retire at age 55 with five years of service or at any age with 25 years of service are entitled to an annual retirement benefit of 2.0 percent of final-average base pay for service up to 25 years and 1.0 percent of the final-average base pay for service between 25 and 30 years. Public safety employees with at least 25 years of service can receive benefits starting before age 50; however, the benefit is reduced by 5 percent for each year by which benefits begin prior to age 50. Public safety employees are required to contribute 1.5 percent of base pay per year of participation to the Police and Firefighter Plan. This contributed amount is accumulated with a 5.0 percent interest rate and is returned when a benefit is forfeited. The Airports Authority contributes the remaining amounts necessary to fund the Plans using the entry age normal actuarial method in addition to an amount necessary to amortize any unfunded liability. For the Plans, the final-average base pay is the average of the employee s highest consecutive 36 months in the most recent 120 months, while covered compensation is the 35-year average of the Social Security Wage Bases ending with the year in which the participant attains Social Security normal retirement age. A participant s years of benefit service include the number of hours of accrued unused sick leave at a participant s termination. A pre-retirement surviving spouse benefit is payable in the event of death, equal to 50.0 percent of the benefit which would have been payable had the employee retired, provided the employee had at least five years of service. Retiree benefits are adjusted annually by the lesser of one-half of the Consumer Price Index or 4.0 percent. Contributions Required and Made The Airports Authority s funding policy is to provide for periodic employer contributions at actuarially determined rates that, expressed as percentages of annual covered payroll, are designed to accumulate sufficient assets to pay benefits when due. Employer contributions are determined in accordance with the plan provisions and are approved by the Airports Authority s Board of Directors. Level percentages of payroll employer contribution rates are determined using the entry age actuarial funding method. Unfunded actuarial accrued liabilities are being amortized over a period of 30 years on an open basis. The Airports Authority contributed 7.4 percent of the applicable base payroll to the Regular Plan and 14.7 percent of the applicable base payroll to the Police and Firefighter Plan in The Airports Authority s base payroll for employees covered by the Regular Plan was $69.3 million and $66.4 million for 2011 and 2010, respectively. The base payroll for employees covered by the Police and Firefighter Plan was $22.9 million and $21.6 million for 2011 and 2010, respectively. The Airports Authority contributed $5.1 million and $5.0 million to the Regular Plan and $3.4 million and $3.5 million to the Police and Firefighters Plan in 2011 and 2010, respectively. The following presents the required employer contributions from January 1, 2006 through December 31, 2011: 70
79 General Employees Police Officers & Firefighters Retirement Plan Retirement Plan Calendar Annual Required Percentage Annual Required Percentage Year Contribution Contributed Contribution Contributed 2005 $2,525, % $1,654, % 2006 $3,233, % $1,939, % 2007 $3,463, % $2,050, % 2008 $4,117, % $2,508, % 2009 $4,030, % $2,534, % 2010 $4,977, % $2,898, % 2011 $5,129, % $3,017, % The contribution rates for any given year for the Plans are calculated based on the actuarial valuation done for the year two years prior to the current year. That is, the contribution rates for the 2011 year were calculating using the actuarial valuation done for year ended December 31, For this reason, the Airports Authority contribution rates will not see the activity in the current financial markets reflected in the rates for years 2011 or The contribution rate for the calendar year 2012 will incorporate changes that took place in the current market in 2011 and any corresponding economic assumptions. 71
80 Annual Pension Cost and Net Pension Obligation (Asset) The Airports Authority s net pension obligation (asset) for the Plans as of December 31, 2011, 2010, and 2009 and for the years then ended, which are based on the then latest actuarial valuations available, were as follows: Year ended December 31, General Employees Retirement Plan Annual required contribution $ 5,129,216 $ 4,977,049 $ 4,030,946 Interest on net pension asset (124,786) (125,257) (125,731) Adjustment to annual required contribution 131, , ,040 Annual pension cost 5,135,478 4,983,336 4,037,255 Contributions made 5,129,216 4,977,049 4,030,946 Change in net pension obligation 6,262 6,287 6,309 Net pension obligation (asset) beginning of year (1,663,812) (1,670,099) (1,676,408) Net pension obligation (asset) end of year $ (1,657,550) $ (1,663,812) $ (1,670,099) Year ended December 31, Police Officers & Firefighters Retirement Plan Annual required contribution $ 3,017,012 $ 2,898,694 $ 2,534,647 Interest on net pension asset (90,124) (48,122) (39,071) Adjustment to annual required contribution 94,646 50,537 41,032 Annual pension cost 3,021,534 2,901,109 2,536,608 Contributions made 3,360,411 3,461,127 2,657,291 Change in net pension obligation (338,877) (560,018) (120,683) Prior year adjustment - (122,644) 122,644 Net pension obligation (asset) beginning of year (1,201,650) (518,988) (520,949) Net pension obligation (asset) end of year $ (1,540,527) $ (1,201,650) $ (518,988) The net pension asset is reported as a non-current unrestricted asset as of December 31, 2011 and 2010 in the Statement of Net Assets. 72
81 The Airports Authority s annual pension costs, percent contributed, and net pension obligation (asset) were as follows: Three-Year Trend Information General Employees Retirement Plan Police Officers & Firefighters Retirement Plan Year Annual Percentage Net Pension Annual Percentage Net Pension Ended Pension of APC Obligation Pension of APC Obligation December 31, Cost (APC) Contributed (Asset) Cost (APC) Contributed (Asset) 2009 $ 4,037, % $ (1,670,099) $ 2,536, % $ (518,988) 2010 $ 4,983, % $ (1,663,812) $ 2,901, % $ (1,201,650) 2011 $ 5,135, % $ (1,657,550) $ 3,021, % $ (1,540,527) Funding Status and Funding Progress The actuarial accrued liability (AAL) was determined from the then most recently available actual valuation of the Plans. Significant actuarial assumptions used in determining the AAL were as follows: Valuation Date December 31, 2011 Actuarial Cost Method Entry-age actuarial cost method Amortization Method 30-year level Assets Valuation Method 5-year smooth market Actuarial Assumptions: a. Investment rate of return * 7.5% b. Projected salary increases * Variable rate 5.5% to 6.5% *includes inflation at 3.0% c. Cost of living adjustments 1.5% The following presents the funding progress from January 1, 2005 through December 31, 2010: Schedule of Funding Progress General Employees Retirement Plan Actuarial UAAL as a Actuarial Actuarial Accrued Unfunded Annual Percentage of Valuation Value Liability (AAL) AAL Funded Covered Covered Date of Assets - Entry Age (UAAL) Ratio Payroll Payroll 12/31/2005 $64,087,361 $53,833,003 ($10,254,358) 119.0% $48,218,773 (21.3%) 12/31/2006 $72,341,671 $62,195,419 ($10,146,252) 116.3% $52,985,414 (19.1%) 12/31/2007 $82,372,511 $68,958,757 ($13,413,754) 119.5% $54,751,207 (24.5%) 12/31/2008 $86,617,649 $80,356,911 ($6,260,738) 107.8% $63,672,545 (9.8%) 12/31/2009 $92,271,170 $87,564,793 ($4,706,377) 105.4% $69,012,906 (6.8%) 12/31/2010 $100,170,793 $94,407,358 ($5,763,435) 106.1% $69,900,547 (8.2%) 73
82 Schedule of Funding Progress Police Officers & Firefighters Retirement Plan Actuarial UAAL as a Actuarial Actuarial Accrued Unfunded Percentage of Valuation Value Liability (AAL) AAL Funded Covered Covered Date of Assets - Entry Age (UAAL) Ratio Payroll Payroll 12/31/2005 $30,730,808 $28,546,385 ($2,184,423) 107.7% $15,462,439 (14.1%) 12/31/2006 $35,464,226 $34,134,852 ($1,329,374) 103.9% $17,799,707 (7.5%) 12/31/2007 $41,245,955 $39,293,637 ($1,952,318) 105.0% $18,799,993 (10.4%) 12/31/2008 $44,590,069 $45,128,509 $538, % $20,932, % 12/31/2009 $49,077,816 $49,958,724 $880, % $21,870, % 12/31/2010 $55,342,783 $55,874,563 $531, % $23,749, % Expressing the actuarial value of assets available for benefits as a percentage of the AAL provides an indication of the Plans funding status on a going-concern basis. Analysis of this percentage over time indicates whether the Plans are becoming financially stronger or weaker. Generally, the greater this percentage, the stronger the retirement plan. Trends in assets in excess of AAL and annual covered payroll are both affected by inflation. Expressing the AAL in excess of assets as a percentage of annual covered payroll approximately adjusts for the effects of inflation and aids analysis of progress made in accumulating sufficient assets to pay benefits when due. Generally, the lower this percentage, the stronger the retirement plan. The comparability of trend information is affected by changes in actuarial assumptions, benefit provisions, actuarial funding methods, accounting policies, the size or composition of the population covered by the Plans, and other changes. Those changes usually affect trends in contribution requirements and in ratios that use the AAL as a factor. All assets of the Airports Authority pension plans are held in trust at the Bank of New York Mellon. A copy of the audited financial statements, plan documents, and required supplementary information for the Plans may be obtained by written request to: Metropolitan Washington Airports Authority, Attention: Benefits Department, 1 Aviation Circle, Washington, DC Deferred Compensation Plan The Airports Authority offers its employees a deferred compensation plan created in accordance with Internal Revenue Code Section 457. The plan, effective as of July 2, 1989, is available to all full-time employees and permits the deferral of a portion of regular compensation until future years. Participation in the plan is optional. The Airports Authority matches 100 percent of participant contributions up to the first 2 percent of regular compensation and matches an additional 50 percent of participant contributions between 2 percent and 4 percent of regular compensation. The deferred compensation is not available to employees until termination, retirement, death, or unforeseeable emergency. The assets of the plan are held in custodial and annuity accounts for the exclusive benefit of plan participants, and accordingly, the related assets of the plan are not reflected on the Airports Authority s Statement of Net Assets. The trust agent for the plan is the Vantage Trust Company. Investments are managed for participants by the International City/County Management Association Retirement Corporation (ICMA-RC) through one of several investment options or a combination thereof. The choice of the investment option(s) is made by each participant. Amounts contributed by participants to the deferred compensation plan, along with the Airports Authority s matching contribution, totaled $11.4 million, $8.7 million, and $8.2 million in the years ended December 31, 2011, 2010, and 2009, respectively 74
83 Money Purchase Pension Plan The Airports Authority established a Money Purchase Pension Plan (MPPP) in accordance with Internal Revenue Code 401(a)(17) effective December 18, The MPPP is available to all full-time employees. Under the terms of the MPPP, the Airports Authority makes contributions on behalf of eligible employees. The amount of contributions depends on whether the employee s pension benefit under the Airports Authority s Regular Plan or the Police and Firefighter Plan is subject to compensation limitations imposed by section 401(a)(17). Eligible employees may not defer a portion of their salary into the MPPP. The Airports Authority serves as trustee of the MPPP and has entered into an agreement with the ICMA-RC to act as an investment advisor to the MPPP and to provide record keeping services for the MPPP. The Airports Authority paid $25 thousand, $50 thousand, and $57 thousand into the MPPP in the years ended December 31, 2011, 2010, and 2009, respectively. 9. POST-EMPLOYMENT BENEFITS The Airports Authority provides post-employment group healthcare, dental, and life insurance benefits for its retired employees. The Airports Authority Retired Employees Healthcare Plan (the Healthcare Plan) is a singleemployer defined benefit healthcare, dental, and life insurance plan and is administered by the Airports Authority. The Healthcare Plan provides medical, dental, and life insurance benefits to eligible retirees and their dependents (the Participants). As of December 31, 2011, 398 Participants were receiving health insurance benefits, and 399 Participants were receiving life insurance benefits under the Healthcare Plan. The management of the Airports Authority can establish and amend benefit provisions of the Healthcare Plan. The Airports Authority created and began funding an Employee Welfare Benefits Trust (the Trust) in February 2005 in order to provide a funding mechanism for its other post employment benefit obligations. There are no separate stand-alone financial reports for the Healthcare Plan. A copy of the plan documents may be obtained by written request to: Metropolitan Washington Airports Authority, Attention: Benefits Manager, 1 Aviation Circle, Washington, DC Contributions Required and Made The contribution requirements of the Healthcare Plan s Participants and the Airports Authority for health and dental insurance are established and may be amended by the management of the Airports Authority. The contribution requirements are based upon projected pay-as-you-go financing requirements and funding for future benefits. The Airports Authority pays 80.0 percent of the total health and dental premiums costs, with the retirees paying the remaining 20.0 percent. For the years ended December 31, 2011 and 2010, the Airports Authority s health and dental insurance costs totaled $4.4 million and $3.4 million, respectively. Plan participants contributed $888 thousand and $748 thousand of the total premiums for the years ended December 31, 2011 and 2010, respectively. This represented 20.0 percent of the total premiums. The monthly contribution requirements for participants in the Healthcare Plan depend on several factors including provider choices, participant age, and type of benefit coverage. 75
84 Monthly Contributions for Retirees Under 65 for 2011 Retiree Plus Retiree Plus Provider Choices Retiree Only Spouse Child(ren) Family Aetna - HMO $ $ $ $ Aetna - PPO $ $ $ $ Kaiser Permanente HMO $ $ $ $ MetLife Dental $ $ $ $ One > Age 65 Two Party Family Provider Choices Retiree Only One < Age 65 Medicare Medicare Aetna - HMO $ $ $ $ Aetna - PPO $ $ $ $ Kaiser HMO $ $ $ $ MetLife Dental $ $ $ $ Monthly Contributions for Retirees Over 65 for 2011 The Airports Authority offers two life insurance options to its Participants. Under Option 1, the Airports Authority pays percent of the Participant s basic and supplemental life insurance cost. Basic life insurance cost is reduced to 25.0 percent of the Participant s life insurance in force at the time of retirement. Supplemental life insurance is a multiple of the basic life insurance (1 to 5 times) that the Participant had selected prior to retirement. Supplemental life insurance is reduced at a rate of 2.0 percent each month so that at the end of 50 months, no supplemental life insurance coverage remains in force. Option 2 is available to Participants who retire from the Airports Authority on or after May 1, Under Option 2, the Airports Authority pays percent of the Participant s basic life insurance cost. Basic life insurance cost is reduced to 25.0 percent of the Participant s life insurance in force at the time of retirement. Participants pay percent of the cost of supplemental life insurance. The amount of supplemental life insurance in force remains equal to the amount that the Participant had at the time of retirement but is reduced by 50.0 percent at age 70 and another 50.0 percent at age 75. As of December 31, 2011, 45 out of 399 retired employees had supplemental coverage, and the cost of life insurance totaled $203 thousand. As of December 31, 2010, 34 out of 376 retired employees had supplemental insurance coverage, and the cost of life insurance for retired employees totaled $170 thousand. Actuarial Methods and Assumptions Projections of benefits for financial reporting purposes are based on the substantive plan (the Plan as understood by the employer and the Plan members) and include the types of benefits provided at the time of each valuation as well as the historical pattern of sharing the benefit costs between the employer and plan members to that point. The actual methods and assumptions used include techniques that are designed to reduce the effects of short-term volatility in actuarial accrued liabilities (AAL), consistent with the long-term perspectives of the calculations. The actuarial value of future assets will be determined using fair market values. Actuarial valuations of an ongoing plan involve estimates of the value of reported amounts and assumptions about the probability of occurrence of events far into the future, including but not limited to future employment, mortality, and healthcare cost trends. Actuarially determined amounts are subject to continual revision as actual
85 results are compared with past expectations and new estimates are made about the future. The schedule of funding progress presents multi-year trend information about whether the actuarial value of the plan assets is increasing or decreasing over time relative to the AAL for benefits. Significant actuarial assumptions used in determining the AAL are as follows: Valuation Date January 1, 2011 Actuarial Cost Method Entry age, normal Amortization Method 30-year level dollar Assets Valuation Method 5-year smooth market Actuarial Assumptions: a. Investment rate of return 7.5% b. Mortalilty Rates Retirement Plans 2000 Healthy Mortality Table c. Healthcare Cost Trend Rate 10.0% initially to ultimate rate of 5.0% d. Payroll Growth Rate (*) 6.5% to an ultimate rate of 5.5% e. *includes inflation at 3.0% Other Post-employment Benefit (OPEB) Costs and Obligations The annual non-pension post-employment benefit cost is actuarially determined as is the calculation of the annual required contribution (ARC). The ARC represents the actuarially determined level of funding that, if paid on an ongoing basis, is projected to cover annual benefit costs and the 30-year open amortization of the difference between the AAL and amounts previously recognized. The following reflects the components of the 2011 annual OPEB costs, amounts paid, and changes to the net accrued OPEB obligation based on the January 1, 2011 actuarial valuation: Year ended December 31, Medical/Dental Annual required contribution $ 10,730,000 $ 10,560,000 $ 9,210,000 Interest on net OPEB obligation (asset) 20,000 (100,000) (190,000) Adjustment to annual required contribution (30,000) 110, ,000 Annual OPEB cost 10,720,000 10,570,000 9,220,000 Contributions made 10,730,000 8,837,510 8,120,921 Change in net OPEB obligation (asset) (10,000) 1,732,490 1,099,079 Net OPEB obligation (asset) beginning of year 329,499 (1,402,991) (2,502,070) Net OPEB obligation (asset) end of year $ 319,499 $ 329,499 $ (1,402,991) 77
86 Year ended December 31, Life Insurance Annual required contribution $ 842,100 $ 823,800 $ 811,700 Interest on net OPEB obligation (asset) 5,700 4,800 (5,000) Adjustment to annual required contribution (6,000) (5,000) 5,200 Annual OPEB Cost 841, , ,900 Contributions made 842, , ,026 Change in net OPEB obligation (asset) (300) 13, ,874 Net OPEB obligation (asset) beginning of year 76,423 63,387 (66,487) Net OPEB obligation (asset) end of year $ 76,123 $ 76,423 $ 63,387 The net OPEB obligation liabilities are reported as non-current liabilities as of December 31, 2011 and 2010 in the Statement of Net Assets. The Airport Authority s annual OPEB cost, the percentage of annual OPEB cost contributed to the plan, and the net OPEB obligation for the year ended December 31, 2011 and the two preceding years, were as follows: Three-Year Trend Information - Medical Insurance Year Percentage of Net OPEB Ended Annual OPEB Annual OPEB Obligation December 31, Cost Cost Contributed (Asset) 2009 $ 9,220, % $ (1,402,991) 2010 $ 10,570, % $ 329, $ 10,720, % $ 319,499 Year Percentage of Net OPEB Ended Annual OPEB Annual OPEB Obligation December 31, Cost Cost Contributed (Asset) 2009 $ 811, % $ 63, $ 823, % $ 76, $ 841, % $ 76,123 Funding Status and Funding Progress Three-Year Trend Information - Life Insurance The Airports Authority began funding the Plan in 2005, and in addition to funding insurance costs for Participants, contributed $6.1 million, $6.2 million, and $5.0 million for the years ended December 31, 2011, 2010, and 2009, respectively to the Trust for medical and dental insurance. The Airports Authority also contributed $625 thousand, $645 thousand, and $540 thousand for the years ended December 31, 2011, 2010, and 2009, respectively, to the Trust for life insurance. 78
87 Schedule of Funding Progress - Medical Insurance Actuarial UAAL as a Actuarial Actuarial Accrued Annual Percentage Valuation Value Liability (AAL) Unfunded Funded Covered of Covered Date of Assets - Entry Age UAAL Ratio Payroll Payroll 1/1/ $ 65,790,000 $ 65,790, % $ 58,820, % 1/1/2006 $ 6,500,000 $ 76,080,000 $ 69,580, % $ 64,100, % 1/1/2007 $ 13,090,000 $ 81,930,000 $ 68,840, % $ 69,770, % 1/1/2008 $ 19,450,000 $ 85,170,000 $ 65,720, % $ 68,620, % 1/1/2009 $ 25,190,000 $ 103,980,000 $ 78,790, % $ 73,960, % 1/1/2010 $ 31,420,000 $ 116,870,000 $ 85,450, % $ 78,170, % 1/1/2011 $ 38,960,000 $ 130,230,000 $ 91,270, % $ 92,170, % Schedule of Funding Progress - Life Insurance Actuarial UAAL as a Actuarial Actuarial Accrued Percentage Valuation Value Liability (AAL) Unfunded Funded Covered of Covered Date of Assets - Entry Age UAAL Ratio Payroll Payroll 1/1/ $ 5,380,500 $ 5,380, % $ 59,739, % 1/1/2006 $ 554,100 $ 5,941,900 $ 5,387, % $ 64,148, % 1/1/2007 $ 1,152,000 $ 6,722,000 $ 5,570, % $ 69,770, % 1/1/2008 $ 1,711,700 $ 6,822,000 $ 5,110, % $ 68,616, % 1/1/2009 $ 2,217,400 $ 7,578,300 $ 5,360, % $ 73,961, % 1/1/2010 $ 2,765,800 $ 8,161,500 $ 5,395, % $ 78,171, % 1/1/2011 $ 3,608,900 $ 9,777,600 $ 6,168, % $ 92,169, % 79
88 10. CHANGES IN CAPITAL ASSETS Capital asset activity for the years ended December 31, 2011 and 2010 was as follows: Balance as of Transfers and Transfers and Balance as of January 1, 2011 Additions Deletions December 31, 2011 Capital assets not being depreciated: Land and other non-depreciable assets $ 156,407,176 $ 56,476,729 $ (30,153,287) $ 182,730,618 Construction in progress 316,349, ,426,643 (159,108,781) 373,667,270 Construction in progress - Dulles Metrorail project - Phase 1 1,340,698, ,978,197-1,989,676,569 Construction in progress - Dulles Metrorail project - Phase 2 28,531,980 47,374,182-75,906,162 Total capital assets not being depreciated 1,841,986, ,255,751 (189,262,068) 2,621,980,619 Other capital assets: Buildings 3,493,305, ,303,711 (1,194,070,579) 2,467,538,599 Systems and structures 2,885,380,436 3,982,282,699 (2,833,435,511) 4,034,227,624 Equipment 68,543,192 37,989,254 (2,730,940) 103,801,506 Motor vehicles 91,142,550 3,198,611 (36,266,272) 58,074,889 Total other capital assets 6,538,371,645 4,191,774,275 (4,066,503,302) 6,663,642,618 Less accumulated depreciation: Buildings 862,032,015 (34,096,462) - 827,935,553 Systems and structures 883,152, ,888,134-1,138,040,186 Cumulative balance for change in depreciation - (19,453,903) (431,665) (19,885,568) Equipment 52,679,743 42,649,873 (781,731) 94,547,885 Motor vehicles 80,510,808 (36,918,486) (1,109,611) 42,482,711 Total accumulated depreciation 1,878,374, ,069,156 (2,323,007) 2,083,120,767 Totals $ 6,501,983,963 $ 4,953,960,870 $ (4,253,442,363) $ 7,202,502,470 Balance as of Transfers and Transfers and Balance as of January 1, 2010 Additions Deletions December 31, 2010 (Restated) (Restated) (Restated) (Restated) Capital assets not being depreciated: Land and other non-depreciable assets $ 135,842,243 $ 20,564,933 $ - $ 156,407,176 Construction in progress 1,508,361, ,733,885 (1,540,745,831) 316,349,408 Construction in progress - Dulles Metrorail project - Phase 1 735,246, ,472,943 (21,362) 1,340,698,372 Construction in progress - Dulles Metrorail project - Phase 2 182,629 28,349,351-28,531,980 Total capital assets not being depreciated 2,379,633,017 1,003,121,112 (1,540,767,193) 1,841,986,936 Other capital assets: Buildings 3,026,522, ,782,493-3,493,305,467 Systems and structures 1,936,211, ,247,483 (3,078,723) 2,885,380,436 Equipment 68,902,437 1,799,278 (2,158,523) 68,543,192 Motor vehicles 90,424,295 1,920,949 (1,202,694) 91,142,550 Total other capital assets 5,122,061,382 1,422,750,203 (6,439,940) 6,538,371,645 Less accumulated depreciation: Buildings 784,157,604 79,505,438 (1,631,027) 862,032,015 Systems and structures 757,303, ,903,960 1,944, ,152,052 Equipment 50,065,048 5,479,858 (2,865,163) 52,679,743 Motor vehicles 78,941,434 2,055,478 (486,104) 80,510,808 Total accumulated depreciation 1,670,467, ,944,734 (3,037,926) 1,878,374, Totals $ 5,831,226,589 $ 2,214,926,581 $ (1,544,169,207) $ 6,501,983,963
89 Depreciation expense was incurred by the Business-Type Activities of the Airports Authority during the fiscal years as follows: (Restated) Aviation Enterprise Fund $ 206,852,851 $ 210,830,619 Dulles Corridor Enterprise Fund 216, ,116 Total Depreciation Expense $ 207,069,156 $ 210,944,735 The Airports Authority had active capital asset construction and development projects as of December 31, Within the Aviation Enterprise Fund the Enterprise Resource Planning system was implemented authority-wide. In addition, at Reagan National, the overlay on runway 1/19 was completed. At Dulles International, completed projects include the rehabilitation of concourse C/D and the International Arrivals Buildings expansion Phase 3. The Airports Authority also had in development as of December 31, 2011 modifications for the south baggage basement in-line baggage screening at Dulles International. As of December 31, 2011, the Aviation Enterprise Fund s commitments with contractors for capital asset construction and development projects were $119.2 million. Within the Dulles Corridor Enterprise Fund, these projects included the Dulles Metrorail Project, Phases 1 and 2, an Interstate 495 interchange ramp, and other Dulles Corridor mobility and capacity improvements. As of December 31, 2011, the Dulles Corridor Enterprise Fund s commitments with contractors for capital asset construction and development projects were $960.7 million. Services for the above amounts had not been provided as of December 31, 2011, and accordingly, no liability has been recorded in the accompanying financial statements. Construction projects are financed by revenue bonds secured by aviation and toll road revenues, passenger facility charges, and grants. With the implementation of a new financial system in 2011, life-to-date accumulated depreciation was recalculated for all Airports Authority s capital assets. This recalculation resulted in a $19.9 million addition to the balance of accumulated depreciation, primarily as a result of changes in prospective depreciation adjustments and estimates of useful lives. This cumulative balance for change in depreciation will be amortized over a future period consistent with the useful lives of the related capital assets. 11. ACCOUNTS PAYABLE A detail of accounts payable and accrued expenses as of December 31, 2011 and 2010 follows: As of December 31, (Restated) Trade accounts payable and accruals $ 173,407,527 $ 183,319,532 Accrued compensation and benefits 12,253,986 12,839,936 Current portion of claims 2,619,305 2,820,687 Security deposits 1,239,180 1,364,394 Total accounts payable and accrued expenses $ 189,519,998 $ 200,344,549 81
90 12. LEASE COMMITMENTS Property Held for Lease The Airports Authority has entered into various operating leases with tenants for the use of space at the Airports Authority s facilities, including buildings, terminals, and airfield areas. Leases with minimum annual guarantee provisions provide for minimum lease amounts as well as contingent fees based on the tenants volume of business at the Airports. These leases have various lease terms, may include provisions for annual increases in the minimum annual guarantee amounts, and may be reviewed periodically to ensure compliance with payments of the contingent fees and other terms of the leases. Most concession leases at the Airports have minimum annual guarantee provisions. The Use and Lease Agreement (See Note 3 Airport Use Agreement and Premises Lease) provides for terminal and other facility and space rentals by the airlines at the Airports. Airlines that have signed the Use and Lease Agreement are responsible for full cost recovery plus debt service coverage for these facilities until the termination date of the Use and Lease Agreement. The Use and Lease Agreement is scheduled to terminate on September 30, 2014, subject to annual cancellation rights at the option of the Airports Authority. For purposes of calculating future minimum rents under the terms of the Use and Lease Agreement, estimates of future costs and debt service coverage have been used. The Airports Authority has also entered into various fixed rate lease agreements with tenants for facilities and space at the Airports. These leases have various lease terms and usually include provisions for annual rent increases. Minimum future rentals scheduled to be received on operating leases that have initial or remaining noncancelable terms in excess of one year, as calculated in 2011 dollars, are: Year ending December 31, Minimum Annual Guaranteed Leases Airline Terminal Leases Fixed Rate Leases 2012 $ 62,654,133 $ 272,216,000 $ 26,648,162 $ 361,518, ,730, ,497,000 19,753, ,981, ,857, ,550,000 16,190, ,598, ,212,222-16,377,802 34,590, ,596,915-6,777,153 13,374, and thereafter 79,715, ,940, ,656,506 Total minimum future rentals $ 220,767,199 $ 769,263,000 $ 195,688,369 $ 1,185,718,568 Total The above amounts do not include contingent rentals and fees in excess of minimums, which amounted to $24.5 million and $22.3 million for the years ended December 31, 2011 and 2010, respectively. Total income from leases, including minimum annual guarantees and contingent rentals and fees, totaled $390.0 million and $338.5 million for the years ended December 31, 2011 and 2010, respectively. 82
91 Property Leased from Others The Airports Authority has an 80 year lease (the Federal Lease), with negotiable extensions, with the United States Government for the Airports. This lease is due to expire on June 6, The lease requires an annual inflation-adjusted base amount and interest earned on funds reserved monthly in a lease payment reserve account to be paid on a semi-annual basis. The Airports Authority invests the monthly lease payments in repurchase agreements or certificates of deposit. The payments to the United States Government, including interest, totaled $5.2 million and $5.1 million respectively, for the years ended December 31, 2011 and The Airports Authority has entered into a non-cancellable office space leases in Vienna, Virginia. This office lease, as amended, is for 26,084 rentable square feet and 5,949 rentable square feet, with expiration dates of July 31, 2013 and February 28, 2014, respectively. Minimum future rentals scheduled to be paid on the operating leases in effect on December 31, 2011, as calculated in 2011 dollars, are: Year ending December 31, Federal Lease Office Space Lease Total 2012 $ 5,180,558 $ 1,418,464 $ 6,599, ,180, ,333 6,128, ,180,558 75,605 5,256, ,180,558-5,180, ,180,558-5,180, and thereafter 264,208, ,208,454 Total minimum future rentals $ 290,111,244 $ 2,442,402 $ 292,553,646 Total rental expense for the years ended December 31, 2011 and 2010 was $5.2 million and $5.1 million, respectively. The 2011 and 2010 capitalized expenditures related to the office space lease totaled $1.2 million and $0.9 million, respectively. 83
92 13. CHANGES IN NON-CURRENT NON-DEBT LIABILITIES Activity for non-current liabilities, other than for capital debt, for the years ended December 31, 2011 and 2010 was as follows: Activity during year ended December 31, 2011 As of December 31, 2011 Beginning Balance Additions Reductions Ending Balance Due Within One Year Due After One Year Compensated absences $ 8,185,530 $ 9,662,946 $ 9,516,583 $ 8,331,893 $ 7,085,513 $ 1,246,380 Claims¹ 5,282,245 1,879,178 2,086,186 5,075,237 2,619,306 2,455,931 Lease obligations 314,200-97, , ,087 85,286 Construction retainage 15,124, ,077-15,540,221-15,540,221 Net OPEB obligation² 405,922-10, , ,622 Deferred rent revenue 787, , ,080 $ 30,099,121 $ 11,958,201 $ 11,710,896 $ 30,346,426 $ 9,835,906 $ 20,510, Activity during year ended December 31, 2010 As of December 31, 2010 Beginning Balance Additions Reductions Ending Balance Due Within One Year Due After One Year Compensated absences $ 7,555,129 $ 10,070,047 $ 9,439,646 $ 8,185,530 $ 6,920,360 $ 1,265,170 Claims¹ 5,584,701 2,531,808 2,834,264 5,282,245 2,820,687 2,461,558 Lease obligations 379,736-65, , , ,896 Construction retainage 15,000, ,144-15,124,144-15,124,144 Net OPEB obligation² 63, , , ,922 Deferred rent revenue 793,241-6, , ,080 $ 29,376,194 $ 13,068,534 $ 12,345,607 $ 30,099,121 $ 9,841,351 $ 20,257,770 ¹See Note 19 - Risk Management ²See Note 9 - Post-Employment Benefits 14. DERIVATIVES In 2001, the Airports Authority began a risk management program to assist in managing the interest cost on outstanding and future debt. The Airports Authority has entered into a number of interest rate swap agreements (collectively, the Swap Agreements) to hedge against potential future increases in interest rates. All of the Airports Authority s Swap Agreements were entered into in connection with the planned issuance of variable rate debt and represent floating-to-fixed rate agreements. The agreements were written on a forward-starting basis to either hedge future new money bonds or to synthetically advance refund bonds that could not be advance refunded on a conventional basis because of their tax status. Based on the Swap Agreements, the Airports Authority owes interest calculated at a notional amount multiplied by a fixed rate to the counterparties. In return, the counterparties owe the Airports Authority interest, based on the notional amount multiplied by a variable rate equal to 72 percent of the 1-month London International Bank Offered Rate (LIBOR). The variable rate received from the counterparties is intended to closely correlate to the interest rate the Airports Authority pays on the underlying variable rate debt. Only the net difference in interest payments is actually exchanged with the counterparties, while the Airports Authority continues to pay interest to
93 the bondholders at the variable rate provided by the bonds associated with the swap. During the term of the Swap Agreement, the Airports Authority pays or receives the difference between the fixed rate on the swaps and 72 percent of the 1-month LIBOR. The chart below provides summary information with respect to the Airports Authority s Swap Agreements: Trade Effective Original Outstanding Hedged Termination Fixed Date Date Counterparty Ratings 1 Notional Amount Notional Amount Series Value 2 Rate 07/31/01 08/29/02 Bank of America, N.A. A2/A/A+ $ 80,590,000 $ 51,660, A-2 $ (9,395,591) 4.445% 06/15/06 10/01/09 J.P. Morgan Chase Bank Aa1/A+/AA- 190,000, ,999, A-3 (61,679,555) 4.099% 06/15/06 10/01/09 Bank of America, N.A. A2/A/A+ 110,000, ,525, D/2010C-2 (35,631,785) 4.099% 06/15/06 10/01/10 Wells Fargo Bank, N.A. Aa3/AA-/AA- 170,000, ,392, D (57,733,964) 4.112% 05/13/05 10/01/11 Wells Fargo Bank, N.A. Aa3/AA-/AA- 125,000, ,000, A-1 (35,974,508) 3.862% Total $ 675,590,000 $ 634,577,201 $ (200,415,403) 1 Long-term ratings of Moody's, S&P, and Fitch, respectively, as of December 31, Amounts as of December 31, 2011; A negative value represents a payment by the Airports Authority to the counterparty if the swap is terminated in the current market; a positive value represents a receipt by the Airports Authority if the swap is unwound in the current market. As shown in the table above, the Airports Authority had five live Swap Agreements associated with various series of variable rate debt (hedging derivative instruments) as of December 31, GASB 53, Accounting and Financial Reporting for Derivative Instruments Beginning in 2008, the Airports Authority implemented GASB 53, Accounting and Financial Reporting for Derivative Instruments. According to GASB 53, all of the Aviation Enterprise s forward-starting swap transactions and those swap transactions associated with issued debt were determined to be ineffective in 2008 and are recognized at fair value on the Statements of Revenue, Expenses and Changes in Net Assets. GASB 53 requires that if a derivative instrument is found to be ineffective in the first reporting period, evaluation of effectiveness in subsequent reporting periods should not be performed. Therefore, since all of the Airports Authority s derivatives were found to be ineffective at the end of December 31, 2008, hedge accounting ceased permanently, and the changes in the value of the instruments are reported in the Statements of Revenue, Expenses and Changes in Net Assets as a fair value gain or (loss). Derivative Fair Value Summary For the years ended December 31, 2011 and 2010, all of the Airports Authority s interest rate swaps were recognized on the Statements of Revenue, Expenses and Changes in Net Assets in liabilities at fair value. The fair value of the swaps on December 31, 2011 and 2010 was a loss of $200.4 million and $104.2 million, respectively. This represents the maximum loss that would be recognized if all counterparties failed to perform as contracted. The change in fair value of the Airports Authority s swaps in 2011 and 2010 was a fair value loss of $96.2 million and a fair value loss of $35.0 million, respectively. Changes in the fair value of the Airports Authority s swaps are recorded as fair value gains or losses on the Statements of Revenue, Expenses and Changes in Net Assets. In addition, net interest payments to the counterparties are recorded in the financial statements. 85
94 The fair value of the Airports Authority s swaps as of December 31, 2011, and 2010 was as follows: Effective Date Counterparty Outstanding Notional Amount Maturity Fair Value as of 12/31/2011 Fair Value as of 12/31/2010 Change in Fair Value 2002 Bank of America, N.A. $ 51,660, $ (9,395,591) $ (7,874,294) $ (1,521,297) 2009 J.P. Morgan Chase Bank 183,999, (61,679,555) (32,431,473) (29,248,082) 2009 Bank of America, N.A. 106,525, (35,631,785) (18,904,829) (16,726,956) 2010 Wells Fargo Bank, N.A. 167,392, (57,733,964) (30,333,346) (27,400,618) 2011 Wells Fargo Bank, N.A. 125,000, (35,974,508) (14,621,544) (21,352,964) Total $ 634,577,201 $ (200,415,403) $ (104,165,486) $ (96,249,917) Debt Derivative Rating Standard & Poor s (S&P) has assigned the Airports Authority an overall Debt Derivative Profile of 1 on a scale of 1 to 4 with 1 representing lowest risk and 4 representing the highest risk. Risks Credit Risk The Airports Authority is exposed to the creditworthiness of the swap counterparties. To manage this risk, the Airports Authority will only enter into Swap Agreements with counterparties having a rating of at least A. The Airports Authority s Swap Agreements do not require the Airports Authority to post collateral for any reason. The counterparties to the swaps are required to post collateral if their credit ratings fall below Aa3/AAbut only if the fair values of the swaps are positive, or in the Airports Authority s favor. As of December 31, 2011, all outstanding swap fair values were negative, or in the counterparty s favor, so no collateral has been posted. The Airports Authority does not enter into any master netting agreements. Interest Rate Risk The Airports Authority is exposed to interest rate risk on its swaps. On its pay-fixed, received-variable interest rate swaps, as LIBOR decreases, the Airports Authority s net payment on the swap increases. Basis Risk The Airports Authority may be exposed to basis risk when the payments received from a counterparty are not sufficient to completely offset the debt service payments on the underlying variable rate bonds. As of December 31, 2011, the weighted average interest rate on the Airports Authority s hedged variable-rate debt was 0.74 percent, and 72 percent of LIBOR was 0.20 percent. Termination Risk The Airports Authority or its counterparties may terminate a swap if the other party fails to perform under the terms of the contract. In the event that the swap is terminated prior to maturity, the Airports Authority may owe a make-whole termination payment to a counterparty or receive a termination payment from a counterparty that could be substantial. Tax Risk The Airports Authority is exposed to the risk that future tax law changes or trading relationships lead to an increase in the ratio of tax-exempt to taxable yields. 86
95 15. CAPITAL DEBT The Airports Authority issues taxable and tax-exempt debt. The Internal Revenue Service (IRS) has set up rules for the investment of bond proceeds of tax-exempt debt limiting the interest arbitrage that can be earned. All of the Airports Authority s tax-exempt debt follows the IRS rules for calculation and rebate of arbitrage. As of December 31, 2011 and 2010, the Airports Authority had liabilities of $72 thousand and $0, respectively, for arbitrage. Recent Bond Issues In September 2011, the Airports Authority s Aviation Enterprise Fund issued $637 million of Series 2011A-D Bonds. The Series 2011A Alternative Minimum Tax (AMT) Airport System Revenue and Refunding Bonds par amount was $233.6 million. The Series 2011A Bonds were sold to Wells Fargo Bank, PNC Bank, and Union Bank as direct funded indexed obligations. The proceeds were used to pay a portion of the costs of certain Capital Construction Program (CCP) projects, refund a portion of outstanding Commercial Paper One Notes (CP Notes), refund a portion of the Series 2002C Bonds, refund total outstanding Series 2009A Bonds, fund capitalized interest, fund applicable debt service reserve funds, and pay the cost of issuing the bonds. All of the Series 2011A Bonds are hedged by interest rate swap agreements; Series 2011A-1 Bonds are hedged by the 2011 Swap Agreement, Series 2011A-2 are hedged by the 2002 Swap Agreement, and Series 2011A-3 are hedged by a portion of the 2009 Swap Agreement. The Series 2011B Non-AMT Airport System Revenue and Refunding Bonds par amount was $207.6 million. The Series 2011B bonds were sold to Citibank as direct funded indexed obligations. The proceeds were used to pay a portion of the costs of certain CCP projects, refund a portion of the Series 2002C Bonds, fund capitalized interest, fund applicable debt service reserve funds, and pay the cost of issuing the bonds. The Series 2011C AMT Airport System Revenue Refunding Bonds par amount was $185.4 million. The proceeds were used to refund the Series 1998B Bonds, refund a portion of the Series 2001A Bonds, fund applicable debt service reserve funds, and pay the cost of issuing the bonds. On September 29, 2011, $165.7 million of Series 2001A Bonds maturing and $30.2 million of outstanding Series 1998B bonds maturing were refunded. The Airports Authority s present value savings of this refunding was $19.4 million. The Airports Authority will realize cash flow savings of $18.8 million with this transaction. The portion of the 2001A Bonds was redeemed at a price of percent plus accrued interest. The outstanding Series 1998B Bonds were redeemed at a price of percent plus accrued interest. The Series 2011D Non-AMT Airport System Revenue Refunding Bonds par amount was $10.4 million. The proceeds were used to refund the Series 2001B Bonds, fund applicable debt service reserve funds, and pay the cost of issuing the bonds. On September 29, 2011, $11.4 million of Series 2001B Bonds maturing were refunded. The Airports Authority s present value savings of this refunding was $1.2 million, and the Airports Authority will realize cash flow savings of $1.5 million with this transaction. The bonds were redeemed at a price of percent plus accrued interest. 87
96 Ratings The Airports Authority s underlying ratings as of December 31, 2011 are depicted in the table below: Rating Rating Moody's / S&P / Fitch Enterprise Fund Mode Lien Position Moody's / S&P 1 / Fitch Enhanced Aviation Fixed Senior Aa3 / AA- / AA- Aviation Variable, CP Aviation Variable, VRDO 2 3,4 Senior P-1 / A-1+ / F1+ Senior Aa1/VMIG1 AAA/A-1+ AAA/F1+ Aviation Variable, Index Floaters 5 Senior Aa3 / AA- / NR Dulles Corridor Fixed First Senior A2 / A / NR Dulles Corridor Fixed Second Senior Baa1 / BBB+ / NR Aa2 / AAA / NR Dulles Corridor Fixed Subordinate Baa2 / BBB / NR Dulles Corridor Variable, CP Second Senior P-1 / A-1+ / NR 1 LBBW has requested that S&P withdraw their ratings on the CP One Notes 2 Includes CP One and Two Notes 3 Includes Series 2003D, 2009D, and 2010C Bonds 4 Joint Default Analysis with Moody's, Joint Criteria Rating with S&P, Dual Party Pay Criteria with Fitch 5 Direct Funded Indexed Obligations, Series 2010D, 2011A (S&P rated) and 2011B (Moody's & S&P rated) Bonds Interim Financing Instruments Aviation Enterprise Fund s Commercial Paper Notes. On May 2, 2001, the Airports Authority Board adopted Resolution No allowing the issuance of CP Notes for the Aviation Enterprise Fund in a not-to-exceed amount of $500.0 million. The principal purpose of the CP Notes is to pay or provide for certain capital improvements at the Airports or to refund other forms of indebtedness principal and interest. The Airports Authority had two credit facilities in place as of December 31, 2011 and 2010 to support the issuance of up to $271 million in CP Notes for the Aviation Enterprise Fund at any given time. The CP Notes are structured as Short-term Demand Obligations under the Amended and Restated Eleventh Supplemental Indenture and the Twenty-second Supplemental Indenture. They are collateralized by certain pledged funds, including Net Revenues on parity with the bonds. They are further collateralized by irrevocable direct pay letter of credit (LoC) facilities. The Airports Authority s obligation to repay amounts drawn under such LoCs is collateralized by a promissory note issued by the Airports Authority to each provider. The CP Notes are issued in two series: Series One CP Notes. The issuance of up to $250 million of the Series One CP Notes was authorized in 2004, and amended in 2005, 2007, 2010 and As noted above, the Series One CP Notes are further collateralized by an irrevocable direct pay LoC issued by JP Morgan Chase Bank, which expires in March As of December 31, 2011, $17.5 million of the Series One CP Notes was outstanding. The proceeds are being used to provide interim financing for authorized projects at Reagan National and Dulles International Airports. Series Two CP Notes. The issuance of up to $21 million of Series Two CP Notes was authorized in 2005 and amended in 2007, 2009 and The CP Notes are further collateralized by an irrevocable direct pay LoC issued by Landesbank Baden-Wurttemberg (LBBW), acting through its New York Branch. The LOC expires in 88
97 December As of December 31, 2011, the Airports Authority had $21.0 million Series Two CP Notes outstanding. Series One Series Two Total Balance as of December 31, 2009 $ 90,000,000 $ 125,000,000 $ 215,000,000 Commercial Paper Notes Refunded (130,000,000) (86,500,000) (216,500,000) Commercial Paper Notes Issued 60,000,000-60,000,000 Balance as of December 31, 2010 $ 20,000,000 $ 38,500,000 $ 58,500,000 Commercial Paper Notes Refunded (50,000,000) (17,500,000) (67,500,000) Commercial Paper Notes Issued 47,500,000-47,500,000 Balance as of December 31, 2011 $ 17,500,000 $ 21,000,000 $ 38,500,000 Dulles Corridor Enterprise Fund s Commercial Paper Notes. On June 8, 2011, the Airports Authority Board adopted Resolution No allowing the issuance of CP Notes for the Dulles Corridor Enterprise Fund in a not-to-exceed amount of $300.0 million. The principal purpose of the CP Notes is to provide funds to finance the costs of the Dulles Metrorail Project and certain Capital Improvements Program (CIP) projects, refund other forms of indebtedness principal and interest and fund costs of issuance of the CP Notes. The CP Notes are structured as Short-term Demand Obligations under the Seventh Supplemental Indenture. They are collateralized by certain pledged funds, including Net Revenues on parity with the bonds. They are further collateralized by irrevocable direct pay LoC facilities. The Airports Authority s obligation to repay amounts drawn under such LoCs is collateralized by a promissory note issued by the Airports Authority. Series CP One Notes. The CP Notes are further collateralized by an irrevocable direct pay LoC issued by J.P. Morgan Chase Bank, National Association. The LOC expires in August As of December 31, 2011, the Airports Authority had $0.55 million Series One CP Notes outstanding. Series One Total Balance as of December 31, 2010 $ - $ - Commercial Paper Notes Refunded - - Commercial Paper Notes Is s ued 550, ,000 Balance as of December 31, 2011 $ 550,000 $ 550,000 Bonds Payable Aviation Enterprise Fund. A Master Indenture of Trust was created in 1990 to secure Airport System Revenue Bonds issued by the Aviation Enterprise of the Airports Authority. This Master Indenture was amended effective September 1, 2001, to, in part, change the definition of Annual Debt Service to accommodate the issuance of secured commercial paper, to permit the Airports Authority to release certain revenues from the definition of revenues, and to expand the list of permitted investments to include new, safe investment vehicles designed to increase the return on the Airports Authority s investments. Under this amended Master Indenture, all bonds are collateralized by a pledge of Net Revenues of the Airports Authority which is senior to the subordinated pledge given by the Airports Authority in connection with the issuance of its bonds prior to
98 The Aviation Enterprise Fund s long-term bonds issued and outstanding as of December 31, 2011 and 2010 were as follows: BONDS PAYABLE AVIATION ENTERPRISE FUND Issue Interest Maturing on Outstanding at December 31, Date Rates October 1 Amount Series 1998B Revenue & Refunding 06/15/98 Bonds Series 2001A Revenue Bonds 04/01/01 Term 5.000% 2031 $67,820,000 $ - $ 30,210,000 67,820, ,970,000 Series 2001B Revenue Bonds 04/01/01-11,370,000 Series 2002A Revenue Bonds 06/04/02 Serial 4.500%-5.750% $72,895,000 Term 5.125% ,780,000 Term 5.250% ,075,000 Series 2002B Revenue Bonds 06/04/02 Serial 4.300%-4.300% 2012 $650, ,750, ,480, ,000 1,275,000 Series 2002C Refunding Bonds 08/28/02-182,270,000 Series 2002D Refunding Bonds 08/28/02 Serial 4.000%-5.375% $27,240,000 Term 5.000% ,270,000 Term 5.000% ,685,000 Series 2003A Revenue & Refunding 10/01/03 Bonds Serial 4.000%-5.500% $79,900,000 Term 5.125% ,935,000 Term 5.000% ,590,000 Series 2003B Refunding Bonds 10/01/03 Serial 3.900%-5.250% $26,370,000 Series 2003C Revenue & Refunding 10/01/03 Bonds Serial 5.020%-5.390% $10,460,000 Term 5.740% ,935,000 Term 6.000% ,880,000 Series 2003D-1 Revenue Bonds 10/01/03 Term Variable (0.140%) $64,825,000 Series 2004A Refunding Bonds 08/26/04 Term 3.750% 2014 $30,000 Serial 4.50%-5.000% ,510,000 89,195,000 91,565, ,425, ,375,000 26,370,000 29,075,000 36,275,000 38,585,000 64,825,000 66,350,000 13,540,000 13,550,000 90
99 BONDS PAYABLE AVIATION ENTERPRISE FUND (continued) Issue Interest Maturing on Outstanding at December 31, Date Rates October 1 Amount Series 2004B Revenue Bonds 05/18/04 Serial 5.000% 2027 $25,000,000 Serial 5.050% ,330,000 Term 5.000% ,670,000 $ 245,000,000 $ 245,000,000 Series 2004C-1 Refunding Bonds 07/07/04 Serial 5.000% $31,300,000 Series 2004C-2 Revenue Bonds 08/12/04 Term 5.000% 2022 $32,400,000 Serial 5.000% ,690,000 31,300,000 31,300,000 94,090,000 94,195,000 Series 2004D Refunding Bonds 08/26/04 Serial 4.100%-5.250% $168,070,000 Series 2005A Revenue Bonds 04/12/05 Serial 4.375%-5.250% $91,655,000 Term 4.750% ,290,000 Term 5.000% ,740,000 Series 2005B Refunding Bonds 04/12/05 Serial 3.625%-5.250% $18,120,000 Series 2005C Revenue Bonds 04/12/05 Serial 5.590% 2025 $8,315,000 Serial 5.690% ,350,000 Serial 5.730% ,335,000 Series 2005D Revenue Bonds 10/12/05 Serial 5.000% $7,650,000 Series 2006A Revenue Bonds 01/25/06 Serial 4.750% 2030 $12,500,000 Term 5.000% ,555,000 Term 5.000% ,945,000 Series 2006B Revenue Bonds 12/06/06 Serial 4.550% 2031 $59,020,000 Serial 5.000% ,030,000 Term 5.000% ,270,000 Series 2006C Refunding Bonds 12/06/06 Serial 3.750%-5.000% $24,585,000 Term 4.375% ,595, ,070, ,875, ,685, ,410,000 18,120,000 19,775,000 30,000,000 30,000,000 7,650,000 7,650, ,000, ,000, ,320, ,320,000 36,180,000 36,765,000 91
100 BONDS PAYABLE AVIATION ENTERPRISE FUND (continued) Issue Interest Maturing on Outstanding at December 31, Date Rates October 1 Amount Series 2007A Refunding Bonds 07/03/07 Serial 4.750%-5.000% $134,495,000 Series 2007B Revenue Bonds 09/27/07 Serial 4.000%-5.000% $351,010,000 Serial 4.750% ,150,000 Term 5.000% ,225,000 Term 5.000% ,420,000 Series 2008A Revenue Bonds 06/24/08 Serial 4.100%-5.750% $229,965,000 $ 134,495,000 $ 142,540, ,805, ,670, ,965, ,965,000 Series 2009A Revenue Bonds 04/01/09-58,295,000 Series 2009B Revenue Bonds 04/01/09 Serial 3.000%-5.250% $168,530,000 Term 5.000% ,450,000 Term 5.000% ,455,000 Series 2009C Revenue Bonds 07/02/09 Serial 3.000%-5.125% $171,755,000 Term 5.125% ,405,000 Term 5.125% ,125,000 Term 5.625% ,000,000 Series 2009D-1-2 Revenue Bonds 07/02/09 Term Variable (4.099%) $132,505,000 Series 2010A Revenue Bonds 07/28/10 Serial 3.000%-5.000% $202,665,000 Term 4.625% ,100,000 Term 5.000% ,305,000 Term 5.000% ,505,000 Series 2010B Revenue Refunding 07/28/10 Bonds Serial 3.000%-5.000% $217,720,000 Series 2010C-1-2 Revenue Refunding 09/22/10 Bonds Term Variable C-1 (0.090%) $62,445,000 Term Variable C-2 (4.099%) ,250, ,435, ,150, ,285, ,435, ,505, ,715, ,575, ,400, ,720, ,005, ,695, ,000,000 Series 2010D Revenue Bonds 09/22/10 Term Variable (4.112%) $167,390, ,390, ,000,000 92
101 BONDS PAYABLE AVIATION ENTERPRISE FUND (continued) Issue Interest Maturing on Outstanding at December 31, Date Rates October 1 Amount Series 2010F-1 Revenue Refunding 11/17/10 Bonds Serial 3.410%-4.500% $61,820,000 $ 61,820,000 $ 61,820,000 Series 2011A Revenue & Refunding 09/21/11 Bonds Variable A-1 (3.862%) $233,635,000 Variable A-2 (4.445%) 7 233,635,000 - Variable A-3 (4.099%) 8 Series 2011B Revenue & Refunding 09/21/11 Bonds Variable (0.650%) $207,640,000 Series 2011C Revenue Refunding 09/29/11 Bonds Serial 2.000%-5.000% $185,390, ,640, ,390,000 - Series 2011D Revenue Refunding 09/29/11 Bonds Serial 2.000%-5.000% $10,385,000 10,385,000 - $ 5,217,005,000 $ 5,132,360,000 Plus (Less) unamortized discount/premium, net 13,352,202 14,775,825 Total Aviation Enterprise Debt $ 5,230,357,202 $ 5,147,135,825 1 Interest rates on Series 2003D-1 are reset weekly by the Remarketing Agent. As of 12/31/11, the rate was 0.140%. 2 3, 4 5 Interest rates on Series 2009D-1 are reset weekly, and interest rates on Series 2009D-2 are reset daily by the Remarketing Agent. The Bonds are hedged with a Swap Agreement at a fixed rate of 4.099%. Refer to Note 14 for information on the Airports Authority's swaps. Interest rates on Series 2010C-1 are reset every two days, and rates on Series 2010C-2 are reset weekly by the Remarketing Agent. As of 12/31/11, the rate on Series 2010C-1 was 0.090%. The 2010C-2 Bonds are hedged with a Swap Agreement. Interest rates on Series 2010D are reset weekly by the Remarketing Agent. The Bonds are hedged with a Swap Agreement at a fixed rate of 4.112%. Refer to Note 14 for information on the Airports Authority's swaps. 6, 7, 8 9 Interest rates on Series 2011A Bonds are calculated weekly using 72% of the 1-month LIBOR Index Rate plus a spread of.82% rounded to five decimal points. As of 12/31/11, the rate was %. The 2011A-1 Bonds are hedged with a Swap Agreement at a fixed rate of 3.862%. The 2011A-2 Bonds are hedged with a Swap Agreement at a fixed rate of 4.445%. The 2011A-3 Bonds are hedged with a Swap Agreement at a rate of 4.099%. Refer to Note 14 for information on the Airports Authority's swaps. Interest rates on the 2011B Bonds are calculated weekly using the 1-month SIFMA Index Rate plus a spread of.55%. As of 12/31/11, the rate was %. Source: Airports Authority Records 93
102 Changes to the Aviation Enterprise Fund s Bonds Payable balances during 2011 and 2010 were as follows: Balance as of December 31, 2009 (Restated) $4,880,247,581 Bonds Issued Series 2010A Revenue Bonds 348,400,000 Series 2010B Revenue Refunding Bonds 229,005,000 Series 2010C Revenue Bonds 170,000,000 Series 2010D Revenue Refunding Bonds 170,000,000 Series 2010F-1 Revenue Refunding Bonds 61,820, ,225,000 Bonds Refunded Series 1998B Revenue & Refunding Bonds (157,615,000) Series 1999A Revenue Refunding Bonds (85,195,000) Series 2003D Revenue Bonds (66,175,000) Series 2004B Revenue Bonds (5,000,000) Series 2004C Revenue Bonds (30,600,000) Series 2004D Refunding Bonds (1,010,000) Series 2005A Revenue Bonds (9,715,000) Series 2006A Revenue Bonds (55,000,000) Series 2006B Revenue Bonds (24,680,000) Series 2007B Revenue Bonds (52,885,000) Series 2008A Revenue Bonds (20,035,000) Series 2009A Revenue Bonds (102,365,000) (610,275,000) Principal Payments (107,130,000) Change in Unamortized Discount/Premium 5,068,244 Balance as of December 31, 2010 (Restated) $5,147,135,825 Bonds Issued Series 2011A Revenue & Refunding Bonds 233,635,000 Series 2011B Revenue & Refunding Bonds 207,640,000 Series 2011C Revenue Refunding Bonds 185,390,000 Series 2011D Revenue Refunding Bonds 10,385, ,050,000 Bonds Refunded Series 1998B (30,210,000) Series 2001A (165,670,000) Series 2001B (11,370,000) Series 2002C (169,300,000) Series 2009A (56,975,000) (433,525,000) Principal Payments (118,880,000) Change in Unamortized Discount/Premium (1,423,623) Balance as of December 31, 2011 $5,230,357,202 Balance as of December 31, Short Term $135,395,000 Balance as of December 31, Long Term 5,094,962,202 $5,230,357,202 94
103 Dulles Corridor Enterprise Fund. In August of 2009, a Master Indenture of Trust was created to secure Dulles Toll Road Revenue Bonds issued by the Dulles Corridor Enterprise of the Airports Authority. Under this Master Indenture, all bonds are secured by a pledge of the Toll Road Revenues derived by the Airports Authority from the operation of the Dulles Toll Road. The pledge of the Toll Road Revenues securing the Series 2009A Bonds (First Senior Lien), however, is senior to the pledge of Toll Road Revenues securing the Series 2009B-C-D Bonds and Series 2010A-B Bonds (Second Senior Lien). Following the Second Senior Lien pledge are the bonds that were issued on a Subordinate Lien, the Series 2010D Bonds. The Dulles Corridor Enterprise Fund s long-term bonds issued and outstanding as of December 31, 2011 and 2010 were as follows: Issue Interest Maturing on Outstanding at December 31 Date Rates October 1 Amount Series 2009A Revenue Bonds 08/12/09 CIBs Term 5.125% 2032 $22,140,000 CIBs Term 5.000% ,735,000 CIBs Term 5.250% ,125,000 $ 198,000,000 $ 198,000,000 Series 2009B Revenue Bonds 08/12/ %-7.910% $240,201,249 CABs 240,201, ,791,875 Series 2009C Revenue Bonds 08/12/ % $184,468,394 Convertible CABs 184,468, ,929,224 Series 2009D Revenue Bonds 08/12/ % $400,000,000 Build America Bonds 400,000, ,000,000 Series 2010A Revenue Bonds 05/27/ % $60,823,583 CABs Term 60,823,583 56,986,071 Series 2010B Revenue Bonds 05/27/ % $152,617,225 Convertible CABs Term 152,617, ,160,825 Series 2010D Revenue Bonds 05/27/ % $150,000,000 Build America Bonds 150,000, ,000,000 $ 1,386,110,451 $ 1,346,867,995 Plus (Less) unamortized discount/premium, net (5,078,787) (5,151,469) Total Dulles Corridor Enterprise Debt $ 1,381,031,664 $ 1,341,716,526 95
104 Changes to the Dulles Corridor Enterprise Fund s Bonds Payable balances during 2011 and 2010 were as follows: Balance as of December 31, 2009 $ 967,114,881 Bonds Issued in Series 2010 A Revenue Bonds 54,813,219 Series 2010 B Revenue Bonds 137,801,650 Series 2010 C Revenue Bonds 150,000, ,614,869 Plus: Change in Accretion of Capital Appreciation Bonds 31,913,358 Change in unamortized (discount) or premium, net 73,418 Balance as of December 31, 2010 $ 1,341,716,526 Bonds Issued in Plus Change in Accretion of Capital Appreciation Bonds 39,242,456 Change in unamortized (discount) or premium, net 72,683 Balance as of December 31, 2011 $ 1,381,031,665 Balance as of December 31, Short Term 5,744,580 Balance as of December 31, Long Term 1,375,287,084 Total Dulles Corridor Enterprise Debt $ 1,381,031,665 Insurers The Airports Authority reviews each bond sale to determine if there is value in providing investors municipal bond insurance. As of December 31, 2011, the Airports Authority s Aviation Enterprise Fund had $2.8 billion or 54.0 percent of its bonds insured by American Municipal Bond Assurance Corporation (Ambac), Berkshire Hathaway (BHAC), Financial Guaranty Insurance Company (FGIC), National Public Finance Guarantee Corporation, previously known as Municipal Bond Investors Assurance Corporation (MBIA), Financial Security Assurance (FSA), and Syncora Guarantee, previously known as XL Capital Assurance (XL). As of December 31, 2011, the Airports Authority s Dulles Corridor Enterprise Fund had $401.1 million or 29.0 percent of its bonds insured by one insurance provider, Assured Guaranty (AG). The following tables depict the Airports Authority s insured debt for each Enterprise Fund: Aviation Enterprise Fund Amount Insured Percent of Total Insurer at December 31, 2011 Debt Outstanding Ambac $ 574,950, % Berkshire Hathaway 112,200, % FGIC 818,970, % FSA 704,585, % MBIA 541,675, % XL 64,825, % $ 2,817,205, % Dulles Corridor Enterprise Fund Amount Insured Percent of Total Insurer at December 31, 2011 Debt Outstanding Assured Guaranty $ 401,106, % 96
105 Maturities and Sinking Fund Requirements The following is a summary of the maturities and sinking fund requirements, not including any unamortized discount or premium. Scheduled principal payments on long term bonds are due annually on October 1. Aviation Enterprise Fund Senior Debt Year Ending Total December 31 Principal Interest Debt Service 2012 $ 135,395,000 $ 251,000,968 $ 386,395, ,995, ,957, ,952, ,825, ,210, ,035, ,160, ,112, ,272, ,725, ,602, ,327, ,095, ,968,297 1,968,063, ,891, ,900,185 1,737,791, ,102,052, ,156,041 1,603,208, ,150,965, ,879,378 1,355,844,933 Thereafter 223,900,000 22,735, ,635,818 $ 5,217,005,000 $ 3,646,524,185 $ 8,863,529,185 Dulles Corridor Enterprise Fund Senior Debt Year Ending Total December 31 Principal Interest Debt Service 2012 $ 5,744,580 $ 52,487,086 $ 58,231, ,041,632 52,841,154 61,882, ,201,882 52,434,810 56,636, ,687,272 52,964,745 61,652, ,588,182 52,900,975 60,489, ,351, ,057, ,408, ,929, ,409, ,338, ,082, ,184, ,267, ,438, ,482, ,920,685 Thereafter 1,006,841, ,388,091 1,626,229,903 $ 1,305,906,518 $ 2,543,150,079 $ 3,849,056,597 97
106 16. NET ASSETS Net assets consisted of the following: Invested in Capital Assets, Net of Related Debt Debt Service Reserve As of December 31, 2011 Restricted for Dulles Rail Latent Defects Dulles Toll Road Repairs Public Safety Total Business- Type Activities Construction Debt Service Leases Unrestricted Current assets Cash and cash equivalents $ - $ - $ - $ - $ - $ - $ - $ - $ 152,198,752 $ 152,198,752 Accounts receivable, net ,144,758 62,144,758 Investments ,610, ,610,902 Inventory ,770,143 8,770,143 Prepaid expenses and other current assets ,813,623 5,813,623 Due to (due from) other funds ,425 (362,425) - Non-current assets Restricted Cash and cash equivalents * - 426,087, ,984,444 35,142,608 8,553,470 15,000, , ,233,623 Accounts receivable - 164,692, , ,044,541 Investments - 105,189, ,059, ,259, ,508,341 Unrestricted: Note receivable ,876,689 11,876,689 Investments ,174, ,174,135 Net pension assets ,198,077 3,198,077 Bond issuance costs, net ,726,103 91,726,103 Other assets , ,537 Capital assets 7,202,502, ,202,502,470 Total Assets $ 7,202,502,470 $ 695,968,630 $ 112,984,444 $ 519,202,146 $ 8,905,828 $ 15,000,163 $ 7,725,294 $ 362,425 $ 618,764,294 $ 9,181,415,694 Current liabilities Accounts payable and accrued expenses $ 148,266,188 $ - $ - $ - $ 10,915 $ - $ - $ 1,100 $ 41,241,795 $ 189,519,998 Deferred revenue ,884,807 11,884,807 Operating lease obligations , ,227 Accrued interest payable ,962, ,962,178 Current portion of long-term debt 141,139, ,139,580 Non-current liabilities Other liabilities 15,665, , ,057,784 20,510,520 Commercial paper notes 39,050, ,050,000 Interest rate swaps payable ,415, ,415,403 Bonds payable, net 5,176,867, ,806, ,202, ,373,584 6,470,249,286 Total Liabilities 5,520,988, ,806,137 70,962, ,202, , , ,445,600 7,144,203,999 Net Assets $ 1,681,513,627 $ 92,162,493 $ 42,022,266 - $ 8,107,833 $ 15,000,163 $ 7,725,294 $ 361,325 $ 190,318,694 $ 2,037,211,695 * Includes the portion of restricted cash and cash equivalents classified as current on the Statement of Net Assets Invested in Capital Assets, Net of Related Debt As of December 31, 2010 (Restated) Debt Service Reserve Restricted for Dulles Rail Latent Defects Dulles Toll Road Repairs Public Safety Total Business- Type Activities Construction Debt Service Leases Unrestricted Current assets Cash and cash equivalents $ - $ - $ - $ - $ - $ - $ - $ - $ 156,854,724 $ 156,854,724 Accounts receivable, net ,827,007 33,827,007 Investments ,751, ,751,777 Inventory ,733,612 8,733,612 Prepaid expenses and other current assets ,503,284 7,503,284 Due to (due from) other funds ,538 (380,538) - Non-current assets Restricted Cash and cash equivalents * - 602,298, ,680,596 13,356,215 8,474, , ,082,126 Accounts receivable - 168,203, , ,078,042 Investments - 244,538, ,389, ,259, ,186,839 Unrestricted: Note receivable ,080,347 14,080,347 Investments ,241, ,241,415 Net pension assets ,865,462 2,865,462 Bond issuance costs, net ,916, ,916,774 Capital assets 6,501,983, ,501,983,963 Total Assets $ 6,501,983,963 $ 1,015,039,658 $ 105,680,596 $ 535,745,235 $ 9,349,385 $ - $ 7,532,133 $ 380,538 $ 606,393,864 $ 8,782,105,372 Current liabilities Accounts payable and accrued expenses $ 154,880,692 $ - $ - $ - $ 5,355 $ - $ - $ - $ 45,458,502 $ 200,344,549 Deferred revenue ,837,672 15,837,672 Operating lease obligations , ,890 Accrued interest payable ,217, ,217,809 Current portion of long-term debt 119,210, ,210,000 Non-current liabilities Other liabilities 15,369, , ,100,709 20,257,770 Commercial paper notes 58,500, ,500,000 Interest rate swaps payable ,165, ,165,486 Bonds payable, net 4,733,842, ,560, ,745, ,493,460 6,369,642,351 Total Liabilities 5,081,803, ,560,701 71,217, ,745, , ,396,719 6,959,516,527 Net Assets $ 1,420,180,335 $ 56,478,957 $ 34,462,787 - $ 8,556,950 $ - $ 7,532,133 $ 380,538 $ 294,997,145 $ 1,822,588,845 * Includes the portion of restricted cash and cash equivalents classified as current on the Statement of Net Assets 98
107 The Aviation Enterprise Fund s debt service reserve accounts were over-funded by $9.3 million as of December 31, 2011 and $4.4 million as of December 31, The Dulles Corridor Enterprise Fund s debt service reserve accounts were over-funded by $11.8 million as of December 31, 2011 and $1.7 million as of December 31, Over-funded amounts can only be withdrawn from the Aviation Enterprise Fund s debt service reserve accounts once a year, based on balances as of October 1 st, while over-funded amounts can be withdrawn from the Dulles Corridor Enterprise Fund s debt service reserve accounts twice a year, based on balances as of April 1 st and October 1 st. 17. GOVERNMENT GRANTS The Airports Authority receives, on a cost-reimbursement basis, grants from the United States government, the Commonwealth of Virginia, and other local grantors for certain operating and capital construction programs. Government grants recorded by the Airports Authority during the years ended December 31, 2011 and 2010 totaled $293.3 million and $376.7 million, respectively. In fiscal years 2011 and 2010, the Airports Authority recognized federal, state and local grants for operating and capital programs as summarized below: Operating Programs The Law Enforcement Officer Reimbursement Program, which is recorded as Operating Revenue, offsets expenses incurred by the Airports Authority s Public Safety personnel serving a support role to the Transportation Security Administration (TSA). Explosives detection funds are used to offset the expense of training and caring for canines used in explosives detection. The Drug Enforcement Agency (DEA) Drug Seizures Program and the U.S. Customs (Customs) Drug Seizures Program are collaborative efforts between the Agencies and the Airports Authority s police department wherein both entities share in the proceeds from the sale of confiscated items. The Airports Authority s proceeds may only be used for certain types of expenses defined by the DEA and Customs. Award Recognized Award Year Ended Dec. 31, Remaining Grants in Support of Operations Dec. 31, 2011 Operating Revenue - Passenger Fees TSA - Law Enforcement Officer Reimbursement Program $ 1,246,792 $ 1,248,430 $ 1,793,261 Grants recognized as operating revenues 1,246,792 1,248,430 1,793,261 Federal Grants TSA - National Explosive Detection Canine Team Program FEMA - Disaster Relief and Emergency Assistance Program Customs - Drug Seizure Program DEA - Drug Seizure Program 750, , ,500 66, , , , ,179 - State Grants Commonwealth of Virginia - Drug Seizure Program ,792 - Disaster Relief and Emergency Assistance Program 40, Local Grants Arlington County - HIDTA Task Force 17,204 21,546 N/A Fairfax County - IMT support EOC - 1,063 N/A Grants recognized as non-operating revenues 982,374 1,865, ,500 Total federal, state, and local grants in support of operations $ 2,229,166 $ 3,113,448 $ 2,693,761 99
108 Capital Programs The Airports Authority Dulles Corridor Enterprise Fund receives grants in support of its Dulles Metrorail Project. The Federal Transit Authority (FTA) is the primary grantor, with total federal New Starts funding commitments for the project totaling $900 million. The state and local funding sources for the Dulles Corridor Metrorail Project include transportation bonds issued by the Commonwealth of Virginia and a Fairfax County transportation improvement district property tax. In addition, the Virginia Transportation Act of 2000 dedicated $75 million to the project from Surface Transportation Program (STP) funds. In 2009, USDOT allocated $77.26 million in ARRA funding to the project. These funds replace Section 5309 funds that are scheduled to be received in the final year (2016) of the FFGA. As of December 17, 2009, the ARRA grant was fully drawn down by the Airports Authority. While the ARRA grant is fully expended, the grant will not be closed out until the local match requirement has been met. The FTA deferred the local match requirement under the terms and conditions of the grant until three years after August 28, 2009 (August 27, 2012); that deadline may be extended at the FTA s discretion. The Airports Authority began allocating the required local match to the ARRA grant in April The total required local share through December 2011 is $197.5 million with a remaining balance of $1.6 million. The Airports Authority Aviation Enterprise Fund receives federal and state grants in support of its construction program. The federal programs, primarily through the FAA s Airport Improvement Program (AIP), including annual entitlement grants, provide funding for airport development, airport planning, and noise compatibility programs from the Airports and Airways Trust Funds in the form of entitlement and discretionary grants for eligible projects. The Commonwealth also provides discretionary funds for capital programs. The Airports Authority also participated in a pilot program with the TSA designed to improve the effectiveness of the TSA s baggage screening process. Current projects from the TSA include ARRA funds to install new closed circuit television cameras and provide enhancements to the east and west baggage in-line explosive detection system. 100
109 Award Recognized Year Ended Dec. 31, Grants in Support of Capital Programs (Restated) Federal Grants Federal Aviation Administration AIP - 4th runway $ 6,662,414 10,662,414 Award Remaining Dec. 31, 2011 $ $ 69,000,000 AIP - Runway rehabilitation 1C/19C - 1,761,909 91,274 ARRA - Runway rehabilitation 1C/19C - 4,003, ,686 AIP - Reconstruction of south taxiway Z 292,959 1,307, ,384 AIP - Runway safety area improvement - 291,136 - AIP - Improve Runway 1/19 Safety Area (Phase 2) 8,617,821-1,432,179 AIP - Improve Runway 1/19 Safety Area (Phase 3) 2,086, ,079 2,047,147 AIP - Rehabilitate Runway Runway 1/19 8,005,672-2,402,654 AIP - Rehabilitate taxiways F, J, K, M, N, S and ramp 1-6,157,421 - Transportation Security Administration ARRA Closed circuit television camera installation 5,427,183 4,263,051 1,688,472 Airport perimeter security - 1,066,885 - In-Line Baggage EDS project 6,263,687 15,728,462 12,386,287 ARRA In-Line Baggage EDS project 15,449,145 14,397, ,058,982 Federal Transit Administration FFGA - Dulles Corridor Metrorail Project 92,207, ,921, ,190,335 STP - Dulles Metrorail Project 27,781,891 47,218,109 - Internal Revenue Service IRS - Build America Bonds Interest Subsidy 14,646,801 12,909,695 - State Grants VA Department of Aviation - AeroTrain 2,000,000 2,000,000 - VA Transportation Bonds - Dulles Corridor Metrorail Project - 51,400,000 - Local Grant Fairfax County - Dulles Corridor Metrorail Project 97,675,300 89,193, ,661,383 Total federal, state, and local grants in support of capital programs $ 287,116,094 $ 377,482,718 $ 836,506, PASSENGER FACILITY CHARGES As of December 31, 2011, the Federal Aviation Administration (FAA) has approved nine Passenger Facility Charge (PFC) applications for a total authority of $3.0 billion for the Airports Authority s Aviation Enterprise Fund. Each PFC application is approved by individual airport. However, PFC fees may be imposed at one airport and used for approved projects at either airport. PFC activity for 2010 and 2011 was as follows: Reagan National Dulles International Total Applications $ 600,053,032 $ 2,442,654,150 $ 3,042,707,182 PFC Revenue 2010 $ 36,154,641 $ 43,933,709 $ 80,088,350 PFC Revenue 2011 $ 36,993,974 $ 41,632,952 $ 78,626,926 PFC Revenue Received Through 12/31/11 $ 496,635,558 $ 576,545,601 $ 1,073,181,159 Estimated Final Collection Date March 1, 2015 December 31, 2038 A portion of future PFC collections has been pledged towards future debt service, with $40.0 million pledged towards debt service payments in 2012 and $40.0 million pledged annually toward debt service payments during the years Total 101
110 In accordance with the regulations, based on the approval date from the FAA and continuing through the PFC collection period, the FAA reduces the Airports Authority s share of entitlement grants by 75.0 percent. 19. RISK MANAGEMENT The Airports Authority is exposed to a variety of risks or losses related to operations (i.e., injuries to employees or to members of the public or damage to Airports Authority or public property). This exposure is managed through a combination of self-insured and insured arrangements. Risk management insurance includes workers compensation, airport owners liability (inclusive of builders risk), equipment breakdown, pollution/environmental impairment, public officials, employment practices, law enforcement, crime, fiduciary, executive risk, and automobile liability. The Airports Authority is self-insured for the first $500,000 of each workers compensation loss and for the first $100,000 to $1,000,000 (depending on type) of all other risk management insurance losses. Settlements did not exceed insurance coverage for the past three years. Accruals are maintained to recognize the self-insured risk of loss and encompass all offices within the Airports Authority. The accruals are determined based on insurance claim practices and actuarial estimates for prior and current year claims. The appropriateness of the accruals is continually reviewed and updated by management on a quarterly basis. The overall accrual for potential losses as of December 31, 2011 and December 31, 2010 was $5.1 million and $5.3 million, respectively. Changes in the claim liability accounts in fiscal years 2011, 2010 and 2009 were as follows: Claims and Fiscal Year Beginning Balance Changes in Estimates Claim Payments Ending Balance 2009 $5,214,739 $4,027,539 $3,657,577 $5,584, $5,584,701 $2,531,808 $2,834,264 $5,282, $5,282,245 $1,879,178 $2,086,186 $5,075, OTHER COMMITMENTS AND CONTINGENCIES Grants Amounts received or receivable from grant agencies, principally the U.S. government, the Commonwealth and Fairfax County, are subject to audit and adjustment by the grantor agencies. Any disallowed claims, including for amounts already collected, may constitute a liability of the applicable funds. The amount, if any, of expenditures that may be disallowed by the grantor cannot be determined at this time, although the Airports Authority expects such amounts, if any, to be immaterial. Pollution Remediation The Airports Authority continually monitors its properties to identify polluted sites for which the Airports Authority would be named a responsible party. Identified pollution remediation obligations as of December 31, 2011 and 2010 were $210 thousand and $0, respectively. Routine pollution prevention, control, and monitoring costs are expensed as incurred. Pollution prevention, control, and monitoring expenses for the years ended December 31, 2011 and 2010 were $3.8 million and $2.0 million, respectively. 102
111 Rights-of-Way Purchases The Airports Authority acquires property interests for the Dulles Metrorail Project through negotiated settlement or through the Commonwealth of Virginia Department of Transportation s Commissioner of Highways power of eminent domain. The Airports Authority is responsible for all costs associated with such proceedings and for the payment of all compensation and damages for the properties acquired. As of December 31, 2011, the Airports Authority had acquired twenty property interests through the power of eminent domain for a total of $12 million, and three property interests through negotiated settlement for a total of $257 thousand, for which the final compensation and damages were not settled. No estimate of the final compensation and damages for these acquired properties was recorded as of December 31, Northern Virginia Criminal Justice Training Academy The Airports Authority is a member of the Northern Virginia Criminal Justice Training Academy (the Academy), which provides criminal justice training to 14 participating police and sheriff agencies from Northern Virginia. Academy members cannot withdraw from the Academy while any bonds of the Academy are issued and outstanding. As of June 30, 2010, the most recent period for which audited financials were available, the Academy had $16.3 million in outstanding debt. Payments by the Airports Authority to the Academy for training services totaled $276 thousand and $265 thousand during the years ended December 31, 2011 and 2010, respectively. 21. LITIGATION In April 2011, two users of the Dulles Toll Road filed a lawsuit in federal district court against the Airports Authority claiming that the setting of tolls by the Airports Authority violates various rights and privileges they enjoy under the United States Constitution. The plaintiffs also sought to have the district court certify a class of all current and past users of the Dulles Toll Road since May 2005 and a refund to all class members of tolls paid since May 2005 in excess of the toll rates then in effect. In July 2011, in response to the Airports Authority s motion, the district court dismissed the plaintiffs complaint. The court initially determined that plaintiffs lacked prudential standing to bring any of their claims. The court then proceeded to address the claims on the merits. The court concluded, specifically as to each claim, that plaintiffs had failed, as a matter of law, to state a valid claim as to which any relief could be granted and, more generally, that the setting of tolls by the Airports Authority does not violate the federal constitution. Following the ruling, plaintiffs appealed the district court s dismissal to the United States Court of Appeals for the Federal Circuit, where the appeal is now being briefed. 22. SUBSEQUENT EVENTS Aerosur ceased operations on March 31, The Airports Authority s accounts receivable as of this date were $16 thousand, of which $15 thousand related to operating activities in Pinnacle Airlines Corporation, with operations under the names Pinnacle Airlines, Colgan Air, and Mesaba Aviation, filed for Chapter 11 bankruptcy on April 1, The Airports Authority s trade accounts receivable included $1.0 million of pre-petition debts as of the bankruptcy filing date, of which $422 thousand were included in trade accounts receivable as of December 31,
112 Intentionally Left Blank
113 Statistical This part of the Airports Authority s comprehensive annual financial report presents detailed information as a context for understanding what the information in the financial statements and note disclosures says about the Airports Authority s overall financial health. Contents Financial Trends: These schedules contain trend information to help the reader understand how the Airports Authority s financial performance and well being have changed over time. S-1 Annual Revenues, Expenses and Changes in Net Assets S-2 Operating Expenses by Business Unit Revenues Capacity: These schedules contain information to help the reader assess the factors affecting the Airports Authority s ability to generate airline and non-airline revenues. S-3 Revenues by Source S-4 Revenues by Source Reagan National S-5 Revenues by Source Dulles International S-6 Scheduled Rates and Charges S-7 Concession Revenue & Enplanements Reagan National S-8 Concession Revenue & Enplanements Dulles International S-9 Dulles Toll Road Annual Transactions and Revenue S-10 Dulles Toll Road Transactions Monthly S-11 Top 10 Payors Debt Capacity: These schedules present information to help the reader assess the affordability of the Airports Authority s current levels of outstanding debt and the Airports Authority s ability to issue additional debt in the future. S-12 Ratios of Outstanding Debt S-13 Other Debt Service Coverage Aviation Enterprise Fund S-14 Other Debt Service Coverage Dulles Corridor Enterprise Fund S-15 Revenue Bond Coverage Aviation Enterprise Fund Demographic and Economic Information: These schedules offer demographic and economic indicators to help the reader understand the environment within which the Airports Authority s financial activities take place and to help make comparisons over time and with other airports. S-16 Airport Information a. Ronald Reagan Washington National b. Washington Dulles International S-17 Dulles Toll Road Information S-18 Employment by Industry S-19 Private Sector Employers in Primary Air Trade Area S-20 Population Trends Page
114 Operating Information: These schedules contain information about the Airports Authority s operations and resources to help the reader understand how the Airports Authority s financial information relates to the services the Airports Authority provides and the activities it performs. S-21 Airports Authority Employee Strength S-22 Aircraft Operations by Airport Takeoffs and Landings S-23 Aircraft Operations by Airport Reagan National S-24 Aircraft Operations by Airport Dulles International S-25 Commercial Passenger Enplanements S-26 Commercial Enplanements S-27 Market Share by Landed Weight Reagan National S-28 Market Share by Landed Weight Dulles International S-29 Airline Market Share by Passenger Enplanements Reagan National S-30 Airline Market Share by Passenger Enplanements Dulles International S-31 Airline Market Share by Enplaned Cargo Weight Reagan National S-32 Airline Market Share by Enplaned Cargo Weight Dulles International S-33 Passenger Facility Charges S-34 Top 30 Passenger Origination and Destination Markets in 2011 Reagan National S-35 Top 30 Passenger Origination and Destination Markets in 2011 Dulles International S-36 Top 10 Passenger Origination and Destination Markets Ten-Year History Reagan National S-37 Top 10 Passenger Origination and Destination Markets Ten-Year History Dulles International S-38 Airline Tenants Both Airports S-39 Non-Airline Tenants Reagan National S-40 Non-Airline Tenants Dulles International
115 Intentionally Left Blank
116 ANNUAL REVENUES, EXPENSES AND CHANGES IN NET ASSETS (Expressed in Thousands) (Restated) (Restated) OPERATING REVENUES Concessions $ 227,600.0 $ 230,973.6 $ 217,461.2 $ 223,710.7 $ 217,486.8 $ 199,011.3 $ 198,691.2 $ 173,962.7 $ 146,095.9 $ 132,817.9 Tolls and other 94, , , , Rents 275, , , , , , , , , ,555.0 Design fees , Landing fees 110, , , , , , , , , ,967.4 Utility sales 11, , , , , , , , , ,589.1 Passenger fees 30, , , , , , , , , ,521.3 Other 8, , , , , , , , , ,387.3 TOTAL OPERATING REVENUES 758, , , , , , , , , ,838.0 OPERATING EXPENSES Materials, equipment, supplies, contract services and other 209, , , , , , , , , ,970.3 Impairment loss/design costs , Salaries and related benefits 157, , , , , , , , , ,748.0 Utilities 26, , , , , , , , , ,657.4 Lease from U.S. Government 5, , , , , , , , , ,238.2 Depreciation and amortization 215, , , , , , , , , ,035.8 TOTAL OPERATING EXPENSES 613, , , , , , , , , ,649.7 OPERATING INCOME (LOSS) 144, , ,396.8 (26,899.3) 31, , , , , ,188.3 NON-OPERATING REVENUES (EXPENSES) Passenger facility charges, financing costs - - (944.8) (2,330.5) (3,968.8) (2,026.4) (1,497.1) (1,525.0) (1,137.7) (2,029.2) Investment income 35, , , , , , , , , ,277.8 Interest expense (240,011.8) (240,220.4) (154,780.8) (143,787.3) (111,534.1) (96,999.8) (103,561.3) (89,368.8) (95,610.1) (98,256.1) Federal compensation net of transfers ,785.6 Federal, state and local grants , , Fair value gain (loss) on swaps (96,249.9) (34,978.4) 103,731.4 (158,374.5) (24,577.7) (14,572.3) 1,205.8 (2,060.7) 5,572.3 (26,024.2) Contributions to other governments (1,297.9) (10,086.1) (650.2) TOTAL NON-OPERATING REVENUES (EXPENSES) (300,961.4) (255,632.9) (37,612.2) (265,185.1) (84,522.8) (68,563.3) (83,658.1) (82,568.7) (85,279.3) (110,246.1) GAIN (LOSS) BEFORE CAPITAL CONTRIBUTIONS (156,300.2) (172,441.9) 48,784.6 (292,084.4) (52,602.8) (20,430.9) (20,845.7) (18,576.4) (60,947.3) (82,057.8) CAPITAL CONTRIBUTIONS Passenger facility charges 78, , , , , , , , , ,071.3 Federal, state and local grants 287, , , , , , , , , ,613.5 Other capital property acquired 5, , , , , , TOTAL CAPITAL CONTRIBUTIONS 370, , , , , , , , , ,684.8 INCREASE (DECREASE) IN NET ASSETS $ 214,622.9 $ 285,779.1 $ 477,013.2 $ 146,800.5 $ 66,071.3 $ 116,529.9 $ 79,208.4 $ 86,210.9 $ 17,913.9 $ (8,373.0) NET ASSETS AT YEAR END COMPOSED OF: Invested in capital assets, net of related debt 1,681, ,420, ,099, , , , , , , ,037.8 Restricted 165, , , , , , , , , ,646.5 Unrestricted 190, , , , , , , , , ,350.1 TOTAL NET ASSETS $ 2,037,211.7 $ 1,822,588.8 $ 1,536,809.7 $ 1,117,891.8 $ 1,002,968.8 $ 936,897.5 $ 820,367.6 $ 741,159.3 $ 654,948.3 $ 637,
117 Exhibit S-1 The 2010, 2009 and prior years operating expenses, non-operating revenues and expenses, capital contributions, and changes in net assets have been revised as follows: (Expressed in thousands) Years prior to (cumulative) Total net assets, as previously stated $ 1,878,596.9 $ 1,595,980.4 $ 1,117,891.8 Increase (decrease) in operating expenses Materials, equipment, supplies, contract services, and other 1 $ - $ 1,716.5 $ - Depreciation and amortization 2 (83.9) (32.6) (11.4) Total increase (decrease) in operating expenses (83.9) 1,683.9 (11.4) Increase (decrease) in operating income 83.9 (1,683.9) 11.4 Changes in non-operating revenues (expenses) Investment income 3, 4 (1,220.3) (2,530.1) (60,556.5) Interest expense 5,6 (6,350.8) 1, ,449.8 Total increase in non-operating revenues (expenses) (7,571.1) (681.0) (58,106.7) Increases (decreases) in capital contributions Federal, state and local grants 7 10, Total increase (decrease) in capital contributions 10, Increase (decrease) in net assets, due to restatement 3,162.7 (2,364.9) (58,095.3) Net assets, as restated $ 1,822,588.8 $ 1,536,809.7 $ 1,059,796.5 Explanations of these restatements are as follows: 1 Capital project costs associated with construction activities which do not qualify for capitalization were expensed. 2 Capitalized interest expense for projects placed in service in prior years was reduced, resulting in reductions to depreciation expense. 3 Investment income was reduced as a result of correcting mark-to-market accruals for long-term investment valuations. 4 Investment income was increased for interest income on a note receivable. This interest income had previously been capitalized as construction in progress. 5 Amortization of a bond premium was revised, resulting in a reduction of interest expense. 6 Interest expense was increased for the interest costs incurred on the unspent bond proceeds of tax-exempt debt. These interest costs had previously been capitalized. 7 Additional grant revenue was accrued based upon accrued interest expenses, which had been previously omitted from inclusion in the determination of costs eligible for grant reimbursement. Source: Airports Authority Records 109
118 OPERATING EXPENSES BY BUSINESS UNIT (Expressed in Thousands) 2011 REAGAN NATIONAL Materials, equipment, supplies, contract services, and other 56, (Restated) 2009 (Restated) $ $ 55,848.8 $ 47,846.1 $ 49,691.4 $ 58,393.0 $ 49,285.6 $ 44,273.9 $ 43,028.1 $ 42,379.1 $ 41,932.7 Salaries and related benefits 59, , , , , , , , , ,727.9 Utilities 8, , , , , , , , , ,402.1 Travel Insurance 3, , , , , , , , , ,718.5 Loss (proceeds) from disposal of capital assets (46.8) (116.7) (115.4) (132.0) (45.1) (67.8) (321.6) Non-capitalized facility projects 1, , , , , , Lease from U.S. Government 2, , , , , , , , , ,119.1 Depreciation and amortization 6, , , , , , , , , ,080.6 Total Reagan National Expenses 139, , , , , , , , , ,823.7 DULLES INTERNATIONAL Materials, equipment, supplies, contract services, and other 101, , , , , , , , , ,348.7 Salaries and related benefits 88, , , , , , , , , ,802.3 Utilities 18, , , , , , , , , ,061.6 Travel Insurance 3, , , , , , , , , ,718.5 Loss (proceeds) from disposal of capital assets (67.8) (111.2) (117.2) (24.2) Non-capitalized facility projects ,205.6 (26.0) , Lease from U.S. Government 2, , , , , , , , , ,119.1 Depreciation and amortization 9, , , , , , , , , ,433.3 Total Dulles International Expenses 224, , , , , , , , , ,620.0 DULLES TOLL ROAD Materials, equipment, supplies, contract services, and other 17, , , , Salaries and related benefits 6, , , Utilities Travel Insurance , Loss (proceeds) from disposal of capital assets (2.7) (6.2) (0.7) Non-capitalized facility projects Depreciation and amortization Total Dulles Toll Road Expenses 26, , , , DULLES METRORAIL PROJECT Materials, equipment, supplies, contract services, and other 1, , , Salaries and related benefits 2, , , Utilities Travel Insurance Loss (proceeds) from disposal of capital assets (1.4) (2.9) (4.2) Non-capitalized facility projects (4.4) Depreciation and amortization Total Dulles Metrorail Project Expenses 4, , , $0.0 $0.0 $0.0 $0.0 $0.0 $0.0 WASHINGTON FLYER Washington Flyer expenses , , , , Total Washington Flyer Expenses , , , , WASHINGTON FLYER MAGAZINE 1 Washington Flyer Magazine expenses Total Washington Flyer Magazine Expenses TELECOMMUNICATIONS Telephone expenses 4, , , , , , , , , ,213.1 Total Telecommunication Expenses 4, , , , , , , , , ,213.1 FAA AIR TRAFFIC CONTROL TOWER 2 Air Traffic Control Tower expenses Total Air Traffic Control Tower Expenses AVIATION DRIVE Aviation Drive expenses 1, , , , , , , , , ,671.5 Total Aviation Drive Expenses 1, , , , , , , , , ,671.5 CONSTRUCTION PROGRAMS 4 Financing expenses Legal fees , Materials, equipment, supplies, contract services, and other 6, , , , , , ,469.5 (568.0) 2, Loss (proceeds) from disposal of capital assets , , Non-capitalized facility projects 7, , , , , Depreciation and amortization 198, , , , , , , , , ,613.9 Total Construction Programs Expenses 212, , , , , , , , , ,694.9 TOTAL EXPENSES $ 613,974.2 $ 608,721.9 $ 536,950.2 $ 588,260.9 $ 478,556.1 $ 423,036.2 $ 414,409.3 $ 378,293.8 $ 365,306.3 $ 340, The Airports Authority converted the Washington Flyer Magazine Program to a management contract in Separate reporting has been discontinued. 2 FAA Air Traffic Control Tower was completed in Aviation Drive is inclusive of all expense classifications. 4 Construction programs consists of the Aviation Enterprise Capital Construction Program and the Dulles Corridor Capital Improvement Program. 110
119 Exhibit S-2 The 2010, 2009 and prior years operating expenses have been restated as follows: (Expressed in thousands) Total expenses, as previously stated $ 608,805.8 $ 536,982.9 Years prior to 2009 (cumulative) 6 Increases (decreases) in operating expenses Depreciation and amortization 5 (83.9) (32.7) (11.4) Total increase (decrease) in operating expenses (83.9) (32.7) (11.4) Expenses, as restated $ 608,721.9 $ 536,950.2 Explanations of these restatements are as follows: 5 Capitalized interest expense for projects placed in service in prior years was reduced, resulting in reductions to depreciation expense. 6 Amounts for years prior to 2009 have been restated in total, rather than by individual year. Source: Airports Authority Records 111
120 REVENUES BY SOURCE Exhibit S-3 (Expressed in Thousands) (Restated) REAGAN NATIONAL Airline: Rents $ 85, , (Restated) $ $ 73,828.0 $ 66,302.8 $ 67,234.1 $ 63,938.0 $ 63,568.0 $ 62,236.9 $ 53,802.5 $ 60,453.8 Landing fees 41, , , , , , , , , ,527.4 Passenger fees/security Total Airline Revenues 127, , , , , , , , , ,578.2 Non-Airline: Concessions: Parking 44, , , , , , , , , ,236.4 Rental cars 21, , , , , , , , , ,239.8 Terminal concessions: Food and beverage 7, , , , , , , , , ,677.0 News stands 3, , , , , , , , , ,653.1 Retail 2, , , , , , , , , ,640.7 Display advertising 5, , , , , , , , , ,229.0 Ground transportation 1 4, , , , , Services Inflight catering ,149.1 Fixed base operator 1, Duty free All other , , , , ,858.0 Total Concessions 92, , , , , , , , , ,373.1 Rents 7, , , , , , , , , ,588.1 Security , ,197.0 Utility sales 2, , , , , , , , , ,516.1 Other 2, , , , , , , , ,273.1 Total Non-Airline Revenue 105, , , , , , , , , ,947.4 Total Reagan National Revenues 233, , , , , , , , , ,525.6 DULLES INTERNATIONAL Airline: Rents 159, , , , , , , , , ,332.7 Landing fees 68, , , , , , , , , ,440.0 International Arrival Building fees 21, , , , , , , , , ,526.6 Passenger Fees 7, , , , , , , , , ,256.1 Design Fees , Total Airline Revenues 257, , , , , , , , , ,555.4 Non-Airline: Concessions: Parking 64, , , , , , , , , ,923.2 Rental cars 17, , , , , , , , , ,410.8 Terminal concessions: Food and beverage 9, , , , , , , , , ,563.1 News stands 3, , , , , , , , , ,441.5 Retail 2, , , , , , , , , ,384.1 Display advertising 6, , , , , , , , , ,203.2 Ground transportation 1 2, , , , , Services 3, , , , , , , , , ,867.1 Inflight catering 6, , , , , , , , , ,079.0 Fixed base operator 13, , , , , , , , , ,546.9 Duty free 3, , , , , , , , , ,732.3 All other 1, , , , , , ,166.1 Total Concessions 135, , , , , , , , , ,317.3 Rents 18, , , , , , , , , ,888.4 Security , ,944.7 Utility sales 5, , , , , , , , , ,586.8 Other 5, , , , , , , , , ,058.9 Total Non-Airline Revenues 165, , , , , , , , , ,796.1 Total Dulles International Revenues 422, , , , , , , , , ,351.5 DULLES TOLL ROAD Tolls and other 94, , , , Total Dulles Toll Road 94, , , , WASHINGTON FLYER Ground Transportation: , , , ,276.3 Total Ground Transportation , , , ,276.3 WASHINGTON FLYER MAGAZINE Advertising - other Total Magazine Revenues TELECOMMUNICATIONS 3, , , , , , , , , ,485.5 Total Telephone Revenues 3, , , , , , , , , ,485.5 FAA AIR TRAFFIC CONTROL TOWER 3, , , , , Total FAA Air Traffic Control Tower Revenues 3, , , , , AVIATION DRIVE , , , , , , , , ,225.0 Total Aviation Drive Revenues , , , , , , , , ,225.0 TOTAL REVENUES $ 758,635.4 $ 691,912.9 $ 623,347.0 $ 561,361.4 $ 510,476.1 $ 471,168.6 $ 477,221.7 $ 442,286.1 $ 389,638.2 $ 368, Ground transportation was reported as other revenue in years prior to Aviation Drive revenues include rents and utilities. Source: Airports Authority Records 112
121 2011 REVENUES BY SOURCE REAGAN NATIONAL Exhibit S-4 Other Non-Airline, 5.7% Terminal Concessions, 11.1% Rental Car, 9.3% Airline Rents, 36.8% Parking, 19.2% Landing Fees, 17.9% Source: Airports Authority Records 113
122 2011 REVENUES BY SOURCE DULLES INTERNATIONAL Exhibit S-5 Other Non-Airline, 7.1% Terminal Concessions, 12.8% Airline Rents, 37.8% Rental Car, 4.0% Parking, 15.2% Passenger Fees, 1.8% Landing Fees, 16.2% Int'l Arrivals Fees, 5.1% Source: Airports Authority Records 114
123 SCHEDULED RATES AND CHARGES Exhibit S-6 Ronald Reagan Washington National Airport Rates Signatory Airline Rates Landing Fee $ 3.42 $ 3.16 $ 2.81 $ 2.55 $ 2.34 $ 2.26 $ 2.16 $ 2.41 $ 2.34 $ 2.65 Signatory Airline Cost Per Enplanement $ $ $ $ $ $ $ $ $ $ Terminal A - Average Rate $ $ $ $ $ $ $ $ $ $ Terminal B & C - Average Rate $ $ $ $ $ $ $ $ $ $ Type 6 - Covered/Unenclosed $ 5.55 $ 5.42 $ 5.35 $ 6.00 $ 5.85 $ 5.68 $ 5.49 $ 5.21 $ 5.09 $ 5.32 Type 7 - Uncovered/Unenclosed $ 1.39 $ 1.35 $ 1.34 $ 1.50 $ 1.46 $ 1.42 $ 1.37 $ 1.30 $ 1.27 $ 1.33 Non-Signatory Airline Rates General Aviation Landing Fees $ 3.59 $ 3.52 $ 2.93 $ 2.89 $ 2.82 $ 2.66 $ 2.40 $ 2.80 $ 2.45 $ 3.01 Landing Fees $ 4.48 $ 4.40 $ 3.66 $ 3.61 $ 3.52 $ 3.33 $ 3.00 $ 2.80 $ 2.45 $ 3.01 Terminal A $ $ $ $ $ $ $ $ $ $ Terminal B & C $ $ $ $ $ $ $ $ $ $ Rental Car Customer Facility Charge Customer Facility Charge (Per Rental Day) $ 2.50 $ 2.50 $ 2.50 $ 2.50 $ 2.50 $ 2.50 $ 2.50 $ 2.50 $ 2.50 $ 2.50 Washington Dulles International Airport Rates Signatory Airline Rates Landing Fee $ 3.50 $ 3.44 $ 3.14 $ 2.60 $ 2.37 $ 2.06 $ 2.00 $ 2.52 $ 2.82 $ 2.39 Signatory Airline Cost Per Enplanement $ $ $ $ $ $ $ $ $ $ Concourse C & D $ $ $ $ $ $ $ $ $ $ Concourse B $ $ $ $ $ $ $ $ $ $ Main Terminal $ $ $ $ $ $ $ $ $ $ Concourse A $ $ $ $ $ $ $ $ $ $ Z-Gates $ $ $ $ $ $ $ N/A N/A N/A Type 6 - Covered/Unenclosed $ 5.42 $ 5.42 $ 5.35 $ 6.00 $ 5.85 $ 5.68 $ 5.49 $ 5.21 $ 5.09 $ 5.32 Type 7 - Uncovered/Unenclosed $ 1.36 $ 1.35 $ 1.34 $ 1.50 $ 1.46 $ 1.42 $ 1.37 $ 1.30 $ 1.27 $ 1.33 Airside Operations Building $ $ $ $ $ $ $ $ $ $ International Arrivals Building $ 6.59 $ 6.55 $ 4.10 $ 3.53 $ 3.61 $ 4.09 $ 4.50 $ 5.57 $ 5.68 $ 5.49 Apron Operations Building N/A N/A N/A N/A N/A N/A N/A $ $ $ Concourse C International Arrival Building $ 6.52 $ 4.72 $ 2.98 $ 1.78 $ 2.04 $ 2.33 $ 1.73 $ 6.53 $ 6.79 $ 6.30 Passenger Conveyance $ 2.40 $ 2.20 $ 2.02 $ 2.02 $ 1.92 $ 1.74 $ 1.61 $ 1.54 $ 1.73 $ 1.86 Non-Signatory Airline Rates General Aviation Landing Fees $ 4.23 $ 4.09 $ 4.32 $ 3.54 $ 3.20 $ 2.90 $ 2.71 $ 2.43 $ 3.05 $ 2.53 Landing Fees $ 5.56 $ 5.38 $ 5.68 $ 4.66 $ 4.21 $ 3.81 $ 3.57 $ 2.43 $ 3.05 $ 2.53 Concourse C & D $ $ $ $ $ $ $ $ $ $ Concourse B $ $ $ $ $ $ $ $ $ $ Main Terminal $ $ $ $ $ $ $ $ $ $ International Arrivals Building $ 7.61 $ 7.18 $ 5.28 $ 4.74 $ 4.72 $ 5.25 $ 5.86 $ 5.65 $ 6.75 $ 6.57 Concourse C International Arrival Building $ 8.40 $ 7.71 $ 4.80 $ 3.43 $ 3.81 $ 4.31 $ 4.31 $ 7.33 $ 9.05 $ 6.64 Concourse A $ $ $ $ $ $ $ $ $ $ Z-Gates $ $ $ $ $ $ $ N/A N/A N/A Passenger Facility Charges Washington Reagan National $ 4.50 $ 4.50 $ 4.50 $ 4.50 $ 4.50 $ 4.50 $ 4.50 $ 4.50 $ 4.50 $ 4.50 Washington Dulles International $ 4.50 $ 4.50 $ 4.50 $ 4.50 $ 4.50 $ 4.50 $ 4.50 $ 4.50 $ 4.50 $ 4.50 Dulles Toll Road Toll Rates Two-Axle Vehicles Main Plaza $ 1.25 $ 1.00 $ 0.75 $ 0.75 $ 0.75 $ 0.75 $ 0.75 $ 0.50 $ 0.50 $ 0.50 Ramp Plaza $ 0.75 $ 0.75 $ 0.50 $ 0.50 $ 0.50 $ 0.50 $ 0.50 $ 0.25 $ 0.25 $ 0.25 Airline rates and charges are calculated pursuant to the formulas set forth in the Airport Use Agreement and Premises Lease (Use and Lease Agreement). The Use and Lease Agreement provides the calculation of the annual rates and charges, with rate adjustments at midyear, or any time revenues fall 5% or more below projections. The rates presented in the above tables are average rates, as calculated at the time of settlement. The cost per enplanement increased at both Airports in Terminal rents increased at Dulles International due to the opening of the AeroTrain. Passenger Facility Charges (PFCs) were increased from $3.00 to $4.50 in May 2001 and have been flat at $4.50 at both Airports for the last eleven years. Although the rates shown are the amounts collected by the airlines on the Airport Authority's behalf, the Airports Authority records PFCs net of a handling fee which is retained by the airlines. Toll rates were increased on the Dulles Toll Road in 2011 to $1.25 at the mainline plaza; the ramp plaza toll rate of $0.75 was unchanged from The increase was the second of three Board-approved increases, effective January 1 of 2010, 2011, and 2012, necessary to service debt associated with the Dulles Metrorail Project. Source: Airports Authority Records 115
124 CONCESSION REVENUE & ENPLANEMENTS REAGAN NATIONAL Exhibit S-7 Reagan National Concession Revenue & Enplanements (in Millions) Concession Revenue ($M) $100 $90 $80 $70 $60 $50 $40 $30 $20 $10 $ Number of Enplaned Passengers (M) Parking Rental Cars Terminal and Other Enplanements Annual enplanements include domestic and transborder passengers for both commercial and non-commercial (including military, general aviation, and charter) flights. Enplanements are a measurement of an airport's usage and are influenced by many factors including availability of air service, price of airfare, location of the airport, and macroeconomic factors. Enplanements at Reagan National set a new record in Concession revenues make up the vast majority of the Airports Authority's non-airline revenues. The Airports Authority retains all risk related to the fluctuation of parking revenues, its largest concession revenue source. Parking revenue is highly dependent on passenger traffic and varies year to year. However, the majority of the Airports Authority's rental car and terminal concession contracts contain a fixed component as well as a variable component. In most cases, the Airports Authority is guaranteed a minimum payment by a tenant and then shares excess revenue with the tenant if sales exceed a predetermined amount. In 2011, the fixed component of the rental cars contract was renegotiated as part of a new contract, which helps to explain the decline in total concession revenue in 2011 despite the increase in passenger enplanements. Source: Airports Authority Records 116
125 CONCESSION REVENUE & ENPLANEMENTS DULLES INTERNATIONAL Exhibit S-8 Dulles International Concession Revenue & Enplanements (in Millions) Concession Revenue ($M) $160 $140 $120 $100 $80 $60 $40 $20 $ Number of Enplaned Passengers (M) Parking Rental Cars Terminal and Other Enplanements Annual enplanements include domestic and transborder passengers for both commercial and noncommercial (including military, general aviation, and charter) flights. Enplanements are a measurement of an airport's usage and are influenced by many factors including availability of air service, price of airfare, location of the airport, and macroeconomic variables. Enplanements at Dulles International fell in 2011 due to declining domestic enplanements. Enplanements grew rapidly in 2004 and 2005, largely due to Independence Air's operations but fell sharply after the airline ceased operations in Concession revenues make up the vast majority of the Airports Authority's non-airline revenues. The Airports Authority retains all risk related to the fluctuation of parking revenues, its largest concession revenue source. Parking revenue is highly dependent on passenger traffic and varies year to year. However, the majority of the Airports Authority's rental car and terminal concession contracts contain a fixed component as well as a variable component. In most cases, the Airports Authority is guaranteed a minimum payment by a tenant and then shares excess revenue with the tenant if sales exceed a predetermined amount. This has helped the Airports Authority maintain stable concession revenue despite lower enplanement figures in recent years. Although Dulles International's all-time high enplanements of 13.5 million occurred in 2005, concession revenues peaked in 2008, when the airport served 11.9 million enplaned passengers. Source: Airports Authority Records 117
126 DULLES TOLL ROAD ANNUAL TRANSACTIONS AND REVENUE Exhibit S Dulles Toll Road Annual Transactions & Revenue Millions Toll Rate Increase January 2010 Toll Rate Increase January Toll Rate Increase May 2004 Number of Transactions Revenue (in $) Annual transactions include the number of revenue transactions (i.e., each recorded toll payment, whether mainline or ramp) and violations (i.e., each transaction where the full toll amount was not collected at the time of the transaction, whether due to avoidance, electronic misreading, or otherwise, and where the amount was subsequently collected) processed in the calendar year ending December 31. Transactions measure roadway usage and are impacted by toll rate increases. The first toll rate increase in the roadway's history became effective in May 2005 while the Dulles Toll Road was under the operation of Virginia Department of Transportation (VDOT). A second toll rate increase became effective in January 2010, and a third in January The Dulles Toll Road was transferred to the Airports Authority on November 1, Historical transactional and revenue data on a calendar year basis is not available prior to The chart above includes VDOT data for years and Airports Authority data for years Source: Airports Authority Records, VDOT 118
127 DULLES TOLL ROAD TRANSACTIONS MONTHLY Exhibit S January 7,775,951 8,251,555 8,412,824 9,207,781 9,198,057 9,109,306 9,196,216 February 7,717,175 6,619,570 8,366,392 8,709,460 8,023,545 8,422,303 8,786,162 March 8,962,370 9,298,049 9,234,614 9,351,455 9,686,308 9,941,362 10,111,654 April 8,430,331 9,147,728 9,283,838 9,585,976 9,246,736 9,120,164 9,948,766 May 8,779,051 9,065,336 9,306,946 9,578,599 9,856,502 9,779,415 9,906,511 June 8,896,641 9,338,635 9,579,031 9,385,082 9,581,354 9,756,929 9,872,015 July 8,327,582 8,963,929 9,462,994 9,478,858 9,338,507 9,192,347 9,251,263 August 8,632,451 8,985,395 9,255,019 9,158,359 9,698,127 9,706,925 9,698,296 September 8,425,345 8,698,688 9,126,570 9,185,049 9,087,941 9,066,103 9,228,605 October 8,671,364 9,089,789 9,524,392 9,731,826 9,903,111 9,692,059 9,483,395 November 8,119,289 8,373,040 8,666,127 8,482,507 9,030,545 8,976,611 9,041,300 December 8,168,916 8,290,144 8,499,460 8,943,949 8,634,873 8,959,341 8,959,171 Total 100,906, ,121, ,718, ,798, ,285, ,722, ,483,354 Notes: 1) Toll rates were adjusted in May 2005, January 2010, and January ) Non-revenue transactions such as police, emergency vehicles, military vehicles, etc. are not included in the table above. 3) Transactions includes violations 4) Monthly transactional data prior to 2005 is not available Sources: VDOT for 2005-October 2008 data; Airports Authority Records for November
128 TOP 10 PAYORS Exhibit S-11 PAYOR United Airlines $ 132,761,970 $ 117,389,911 $ 97,782,264 $ 91,135,655 $ 84,680,832 $ 67,790,432 $ 56,420,978 $ 72,633,370 $ 61,798,327 $ 51,105,295 US Airways 43,538,638 39,941,628 38,060,253 36,106,513 36,461,505 33,401,313 35,626,226 34,225,469 32,861,624 31,766,870 Delta Airlines 31,832,207 24,763,314 17,974,561 15,845,321 15,585,067 15,311,065 17,962,266 22,576,592 20,083,033 19,162,505 American Airlines 25,628,008 22,380,543 20,472,606 19,362,364 19,237,901 18,470,865 18,058,028 20,408,805 18,036,993 18,776,582 JC Deceaux / AK Media 11,969,794 11,751,277 8,245,804 8,364,731 * * 7,155,910 5,775,000 6,300,000 6,055,815 Hertz Rent-A-Car 11,749,340 12,397,487 11,751,506 10,910,269 10,084,507 9,451,974 8,897,173 9,833,202 7,933,316 7,598,132 JetBlue Airways 10,399,704 * * * * * * * * * Landmark Aviation 10,093,319 * * 8,319,844 8,624,059 8,566,513 * * * * Continental Airlines 9,984,056 8,267,352 8,161,420 * 8,286,042 7,669,611 7,875,267 8,607,773 7,030,103 6,902,000 Signature Flight Support 9,654,269 8,282,227 9,202,521 8,904,302 8,261,740 * * * * * Vanguard Car Rental USA - 9,737,445 8,518,193 * * * * * * * Avis Rent-A-Car - 8,658,845 8,293,921 8,056,239 7,788,421 7,207,607 7,236,566 7,260,490 6,469,176 5,738,815 Northwest Airlines - * * 8,218,269 8,173,164 7,932,314 7,531,302 9,008,103 8,702,245 9,030,783 Mesa Airlines - * * * * 7,952,342 * * * * Atlantic Coast Airlines / Independence Air - * * * * * 22,306,764 13,858,908 7,726,624 11,280,089 TOTAL $ 297,611,305 $ 263,570,028 $ 228,463,047 $ 215,223,507 $ 207,183,237 $ 183,754,036 $ 189,070,480 $ 204,187,712 $ 176,941,441 $ 167,416,886 * Payor did not comprise top ten for the given year, and as such, revenue is not presented for comparative purposes. Source: Airports Authority Records 120
129 Intentionally Left Blank
130 RATIOS OF OUTSTANDING DEBT AVIATION ENTERPRISE FUND (Restated) 2009 (Restated) 2008 Debt Ratios Outstanding debt by type: Bonds Payable, Net $ 5,230,357,202 $ 5,147,135,825 $ 4,880,247,581 $ 4,127,965,779 Commercial Paper 38,500,000 58,500, ,000, ,500,000 Bond Anticipation Commercial Paper Notes PFC Bank Participation Notes ,000,000 Total Outstanding Debt $ 5,268,857,202 $ 5,205,635,825 $ 5,095,247,581 $ 4,777,465,779 Debt factors: Enplaned Passengers 1 20,961,549 20,857,233 20,386,222 20,927,041 Operating Revenue $ 663,975,831 $ 603,874,716 $ 558,453,461 $ 550,944,844 Total Assets $ 6,357,137,381 $ 6,302,017,095 $ 6,206,328,428 $ 5,960,495,235 Total MSA Population 2 5,582,200 5,582,200 5,476,500 5,378,000 Ratios: Outstanding Debt per Enplaned Passenger $ $ $ $ Outstanding Debt to Operating Revenue $ 7.94 $ 8.62 $ 9.12 $ 8.67 Outstanding Debt to Total Assets $ 0.83 $ 0.83 $ 0.82 $ 0.80 Outstanding Debt per Capita $ $ $ $ Pledged Revenue Coverage Gross revenue 3 $ 688,659,449 $ 624,242,557 $ 570,932,487 $ 589,277,243 Operating expenses excluding depreciation & amortization $ (367,402,779) (358,383,626) (322,057,212) (413,156,541) Net Available Revenues $ 321,256,670 $ 265,858,931 $ 248,875,275 $ 176,120,702 Principal and interest requirement $ 290,663,194 $ 237,068,089 $ 229,060,179 $ 204,496,362 Coverage Ratio DULLES CORRIDOR ENTERPRISE FUND Debt Ratios Outstanding debt by type: Bonds Payable, Net $ 1,381,031,664 $ 1,341,716,526 $ 967,114,881 $ - Bond Anticipation Notes ,000,000 Commercial Paper 550,000 Total Outstanding Debt $ 1,381,581,664 $ 1,341,716,526 $ 967,114,881 $ 150,000,000 Debt factors: Toll Road Revenue Transactions 100,906, ,121, ,718, ,798,901 Operating Revenue $ 94,659,538 $ 88,038,168 $ 64,893,554 $ 10,416,497 Total Assets $ 2,824,278,313 $ 2,480,088,277 $ 1,706,492,605 $ 508,649,598 Total MSA Population 2 5,582,200 5,582,200 5,476,500 5,378,000 Ratios: Outstanding Debt per Transaction $ $ $ 8.90 $ 1.35 Outstanding Debt to Operating Revenue $ $ $ $ Outstanding Debt to Total Assets $ 0.49 $ 0.54 $ 0.57 $ 0.29 Outstanding Debt per Capita $ $ $ $ Pledged Revenue Coverage Gross revenue 3 $ 105,591,728 $ 95,457,295 $ 66,031,522 $ 10,442,624 Operating expenses excluding depreciation & amortization $ (31,279,384) (31,278,002) (28,978,922) (10,240,774) Net Available Revenues $ 74,312,344 $ 64,179,293 $ 37,052,600 $ 201,850 Principal and interest requirement 4 $ 29,428,208 $ 28,148,227 $ 10,739,077 $ - Coverage Ratio N/A TOTAL AIRPORTS AUTHORITY DEBT Total Outstanding Debt $ 6,650,438,866 $ 6,547,352,351 $ 6,062,362,462 $ Total MSA Population 2 5,582,200 5,582,200 5,476,500 Total Debt Per Capita $ 1,191 $ 1,173 $ 1,107 $ 1 Enplaned passengers includes total commercial and non-commercial passengers. 4,927,465,779 5,378, Total MSA population for 2011 is shown using 2010 figures, the most recent data available at the time of publication. 3 Gross Revenue includes Operating Revenues and Interest Income for Fiscal Years The principal and interest requirement shown for the Dulles Corridor Enterprise is net of the federal subsidy received for the Build America Bonds. This Exhibit presents key ratios regarding the Airports Authority s ability to support debt issued for the Aviation and Dulles Corridor Enterprise Funds. It is important to note that this exhibit is for statistical purposes only, and revenues, expenses, and debt service coverage shown differ significantly from those used to calculate coverage according to the Master Indentures of Trust for the Aviation Enterprise and Dulles Corridor Enterprise Bonds. The Master Indentures of Trust specify specific operating expenses that are excluded when calculating debt service coverage ratios as well as additional revenues that may be pledged. Aviation debt per enplaned passenger increased slightly in 2011 but has increased substantially from 2006 due to an increased debt burden and enplaned passengers that were only slightly higher in 2011 than they were in Outstanding debt per operating revenue declined in 2011 due a $60 million increase in operating revenue. Debt service coverage ratio has declined in recent years due to higher debt service requirements as a result of the completion of significant capital projects. For the Dulles Corridor Enterprise Fund, debt per transaction increased in 2011 as a 3.0% increase in totaldebt outstandingwas coupled with a 3.1% decline in revenue transactions. Debt per dollar of operating revenue declined in 2011 due to a 7.5% increase in total operating revenue due to toll increases that went into effect January 1, Source: Airports Authority Records 122
131 Exhibit S $ 3,962,873,327 $ 3,483,377,453 $ 2,828,462,510 $ 2,528,738,687 $ 2,327,168,578 $ 2,016,923, ,000, ,000, ,000, ,000, ,000, ,000, ,000, ,000, ,000, ,700, ,700, ,200,000 $ 4,654,873,327 $ 4,083,377,453 $ 3,414,462,510 $ 2,866,438,687 $ 2,664,868,578 $ 2,437,123,324 21,681,123 20,739,630 22,415,046 19,386,283 15,565,042 15,061,353 $ 510,476,130 $ 471,168,637 $ 477,221,696 $ 442,286,071 $ 389,638,253 $ 368,837,992 $ 5,907,229,260 $ 5,182,899,267 $ 4,388,114,142 $ 3,732,665,604 $ 3,427,868,108 $ 3,194,786,708 5,312,900 5,264,900 5,229,400 5,158,800 5,086,400 5,014,600 $ $ $ $ $ $ $ 9.12 $ 8.67 $ 7.15 $ 6.48 $ 6.84 $ 6.61 $ 0.79 $ 0.79 $ 0.78 $ 0.77 $ 0.78 $ 0.76 $ $ $ $ $ $ $ 566,033,876 $ 516,203,795 $ 497,416,177 $ 452,671,846 $ 395,534,438 $ 382,115,805 (336,525,796) (289,929,805) (281,984,780) (252,115,995) (250,355,746) (235,613,837) $ 229,508,080 $ 226,273,990 $ 215,431,397 $ 200,555,851 $ 145,178,692 $ 146,501,968 $ 184,246,617 $ 163,354,637 $ 164,667,568 $ 140,079,210 $ 141,828,530 $ 135,250, $ 4,654,873,327 $ 4,083,377,453 $ 3,414,462,510 $ 2,866,438,687 $ 2,664,868,578 $ 2,437,123,324 5,312,900 5,264,900 5,229,400 5,158,800 5,086,400 5,014,600 $ 876 $ 776 $ 653 $ 556 $ 524 $
132 OTHER DEBT SERVICE COVERAGE AVIATION ENTERPRISE FUND Exhibit S NET REVENUE: Revenue Including Transfers $ 703,358,488 $ 641,063,255 $ 602,757,114 $ 581,513,665 $ 569,829,729 $ 519,599,653 $ 503,200,118 $ 438,554,221 $ 388,713,440 $ 386,875,940 LESS: Direct Operating Expenses (304,529,128) (292,848,589) (261,679,979) (259,511,002) (253,398,028) (229,349,624) (229,469,720) (203,698,452) (189,109,158) (187,918,976) Net Revenue Available for Debt Service 398,829, ,214, ,077, ,002, ,431, ,250, ,730, ,855, ,604, ,956,965 DEBT SERVICE 1990A Airport System Revenue Bonds A Airport System Revenue Bonds ,729, A Airport System Revenue & Refunding Bonds ,993,757 4,350,565 4,903, B Airport System Revenue & Refunding Bonds ,565,300 3,402, A Airport System Revenue Bonds ,257,594 35,119,965 35,289, A Airport System Revenue Bonds ,072 1,257,695 2,142,909 2,952,191 2,945,565 2,655, B Airport System Revenue Bonds ,556,063 14,484,458 15,248,622 12,842,186 14,370,024 14,741, C Airport System Revenue & Refunding Bonds A Airport System Revenue Bonds , ,826 1,287,357 1,322,236 1,318,158 1,330,610 1,297, B Airport System Revenue & Refunding Bonds 1,131,638 12,232,774 18,080,308 18,762,102 17,942,588 18,369,760 19,710,594 18,124,292 18,603,575 18,568, A Airport System Revenue & Refunding Bonds - 3,498,470 5,533,497 5,934,291 5,891,335 5,855,002 5,946,837 5,841,298 5,874,163 5,833, A Airport System Revenue Bonds 13,958,418 17,088,664 15,642,420 15,183,505 14,291,817 13,623,715 13,976,834 6,905,090 11,718,857 13,619, B Airport System Revenue Bonds 664, , , , , , , , , , A Airport System Revenue Bonds 10,176,763 8,959,111 8,276,261 7,647,018 8,556,496 7,794,227 6,320,872 5,615,081 6,173,644 3,022, B Airport System Revenue Bonds 678, , , , , , ,395 1,085,449 1,515, , C Airport System Revenue Variable Rate Refunding Bonds 12,988,294 15,543,684 16,894,925 19,909,292 19,857,135 19,442,226 19,758,330 19,934,028 19,158,357 5,037, D Airport System Revenue Refunding Bonds 6,539,153 5,735,734 5,653,245 5,138,941 5,267,806 4,884,026 2,596,248 2,994,667 5,739,300 1,807, A Airport System Revenue Refunding Bonds 10,759,464 9,127,960 9,204,996 9,432,168 7,490,702 5,886,411 10,185,205 9,433,874 2,841, B Airport System Revenue Refunding Bonds 4,090,647 4,093,404 4,080,345 4,044,855 4,000,040 4,012,211 4,050,272 2,603, , C Taxable Airport System Revenue Refunding Bonds 3,351,651 3,355,828 3,346,857 3,304,686 3,266,384 3,275,036 3,295,935 3,330,846 1,114, D Airport System Revenue Variable Rate Bonds 1,047,095 1,329,203 3,033,369 4,610,424 4,754,407 3,366,517 3,230,574 2,656,903 1,227, A Airport System Revenue Refunding Bonds 663, , , , , , , , B Airport System Revenue Bonds 11,074,530 10,932,881 8,513,411 2,687,609 5,104,256 1,482,108 4,819,952 2,535, C-1 Airport System Revenue Refunding Bonds 1,564,943 2,670,647 2,304,178 13,086,451 16,369,182 16,156,121 8,049,634 2,353, C-2 Airport System Revenue Refunding Bonds 4,814,541 5,042,973 4,524,687 4,951,434 4,924,855 4,992,470 14,346,612 5,161, D Airport System Revenue Refunding Bonds 26,087,988 26,108,986 24,379,800 14,950,296 11,187,696 11,219,448 11,183,139 3,885, A Airport System Revenue Bonds 19,311,222 17,455,181 18,369,390 18,734,984 16,966,776 12,701,790 9,863, B Airport System Revenue Bonds 2,517,176 1,276, , , , , , C Taxable Airport System Revenue Bonds 1,703,567 1,703,547 1,700,941 1,085, ,964 1,677,884 1,647, D Airport System Revenue Bonds 382,489 1,427,855 1,773,881 1,758, , , , A Airport System Revenue Bonds 9,012,953 5,311,454 8,392,188 5,604,803 5,810, B Airport System Revenue Bonds 14,347,548 10,644,288 9,946,372 5,746,532 7,854, C Airport System Revenue Refunding Bonds 2,259,501 2,244,344 1,903,483 1,485,981 1,732, A Airport System Revenue Bonds 15,102,592 15,072,933 13,723,351 13,816,874 5,557, B Airport System Revenue Bonds 26,508,630 19,948,918 20,751,616 14,659,468 3,194, A Airport System Revenue Bonds 12,508,425 9,151,564 2,495,585 6,964, A Airport System Revenue Bonds 926,568 1,777,662 3,874, B Airport System Revenue Bonds 11,812,024 5,874,908 3,497, C Airport System Revenue Bonds 747,333-8,278, D Airport System Revenue Bonds - - 1,200, A Airport System Revenue Bonds 13,840,460 5,703, B Airport System Revenue Refunding Bonds 22,718,966 7,594, C Airport System Revenue Variable Rate Refunding Bonds 3,646,635 1,077, D Airport System Revenue Variable Rate Bonds 10,159,919 1,765, F-1 Airport System Revenue Refunding Bonds 3,166, , A Airport System Revenue and Refuding Bonds 2,628, B Airport System Revenue and Refunding Bonds 3,417, C Airport System Revenue Refunding Bonds 3,851, D Airport System Revenue Refunding Bonds 196, Series A Bond Anticipation Commercial Paper Notes ,910, ,742 4,579,243 4,044,030 3,994,287 Series B Bond Anticipation Commercial Paper Notes ,934,188 2,595,462 Series One Airport System Revenue Commercial Paper Notes 197, , ,104 1,401,056 75, , ,844,833 Series Two Airport System Revenue Commercial Paper Notes 107,862 46,916 58, , ,833 1,712,774 3,305, Net Debt Service $ 290,663,193 $ 237,068,089 $ 229,060,179 $ 204,496,362 $ 184,246,617 $ 163,354,637 $ 164,667,568 $ 140,079,210 $ 141,828,530 $ 135,250,234 DEBT SERVICE COVERAGE This Exhibit shows debt service coverage calculations for the Aviation Enterprise Fund as defined in the Master Indenture of Trust for Airport System Revenue Bonds. The Master Indenture includes a rate covenant provision specifying that the Airports Authority will fix and adjust fees and other charges for use of the Airports Authority, including services rendered by the Airports Authority pursuant to the Airline Use Agreement and Premises Lease calculated to be at least sufficient to produce net revenues to provide for the larger of the following: (i) amounts needed for making required deposits to various accounts in the fiscal year; or (ii) an amount not less than 125 percent of the annualdebt service with respect to Airport Revenue Bonds. Debt service coverage calculations for all years shown in this Exhibit exceed the minimum requirement as defined in the Master Indenture; however, coverage levels have steadily declined over the past few years as major projects in Dulles International s Capital Construction Program have been completed. It is important to note that net revenue, revenue, and expenses are presented in this Exhibit in accordance with definitions found in the Master Indenture. Additionally, debt service does not include debt paid from bond funds for capitalized interest or debt service paid from interest earnings. Sources: Master Indenture of Trust for Airport System Revenue Bonds and Airports Authority Records 124
133 OTHER DEBT SERVICE COVERAGE Exhibit S-14 DULLES CORRIDOR ENTERPRISE FUND NET REVENUE Total Toll Road Gross Revenue $ 94,659,538 $ 88,038,168 $ 64,893,554 LESS: Operation and Maintenance Expenses (25,018,410) (26,147,421) (25,823,259) ADD: Interest Income 200, ,545 $ 16,486 Net Revenue Available for Debt Service 69,841,436 62,022,292 39,086,781 DEBT SERVICE LIEN 2009A Dulles Toll Road Revenue Bonds (Current Interest Bonds) First Senior 10,142,637 10,372,010 3,686, B Dulles Toll Road Revenue Bonds (Capital Appreciation Bonds) Second Senior C Dulles Toll Road Revenue Bonds (Convertible Capital Appreciation Bonds) Second Senior D Dulles Toll Road Revenue Bonds (Current Interest Bonds, Build America Bonds) Second Senior 21,000,781 21,264,762 10,849, D Dulles Toll Road Revenue Bonds (35% Subsidy) Second Senior (6,789,836) (7,442,667) (3,797,329) 2010A Dulles Toll Road Revenue Bonds (Capital Appreciation Bonds) Second Senior B Dulles Toll Road Revenue Bonds (Convertible Capital Appreciation Bonds) Second Senior Commercial Paper Series One Second Senior 4, D Dulles Toll Road Revenue Bonds (Current Interest Bonds) Subordinate 7,799,718 6,083, D Dulles Toll Road Revenue Bonds (35% Subsidy) Subordinate (2,729,901) (2,129,142) - Net Debt Service $ 29,428,207 $ 28,148,226 $ 10,739,077 LIEN DEBT SERVICE COVERAGE BY LIEN REQUIREMENT First Senior Lien Second Senior Lien Subordinate Lien N/A This Exhibit shows debt service coverage calculations for the Dulles Corridor Enterprise Fund as defined in the Master Indenture of Trust for Dulles Toll Road Revenue Bonds. The Airports Authority has covenanted in the Master Indenture that it will establish, charge, and collect Tolls for the privilege of traveling on the Dulles Toll Road at rates sufficient to meet the Operation and Maintenance Expenses and produce Net Revenues that are at least at the debt service levels set forth in the table above. If either (i) the annual budget adopted by the Airports Authority for any Fiscal Year is inadequate to meet the rate covenant for that year; or (ii) the audited financial statements regarding the Dulles Toll Road show that the Airports Authority did not satisfy the rate covenant for any Fiscal Year, then the Airports Authority is required to engage a Toll Road Consultant to conduct a study and take the actions recommended by the Toll Road Consultant. Debt service coverage calculations for all years shown in this Exhibit exceed the minimum requirement as defined in the Master Indenture; however, coverage levels are expected to decline as work on the Dulles Metrorail Project continues and additional bonds are issued. Sources: Master Indenture of Trust for Dulles Toll Road Revenue Bonds and Airports Authority Records 125
134 REVENUE BOND COVERAGE AVIATION ENTERPRISE FUND Exhibit S-15 DIRECT NET REVENUE TOTAL OPERATING AVAILABLE FOR DEBT SERVICE REQUIREMENTS YEAR REVENUES 1 EXPENSES 2 DEBT SERVICE Principal Interest Total Coverage , , , , , , , , ,214 87, , , , , ,077 87, , , , , ,003 83, , , , , , ,322 73, , , , ,250 68,137 95, , , , ,730 61, , , , , ,856 58,893 81, , , , ,604 51,875 89, , , , ,957 43,478 91, , ¹Total revenues include transfers ²Operating expenses include Telecommunications, Washington Flyer Ground Transportation subsidy, and Washington Flyer Magazine subsidy Source: Airports Authority Records 126
135 REAGAN NATIONAL AIRPORT INFORMATION Exhibit S-16a Ronald Reagan Washington National Airport Location: Acres: Three miles south from downtown Washington, D.C. along the Potomac River in Arlington County, VA 860 +/- acres Airport Code: DCA Runways: 1/19 6,869 feet 15/33 5,204 feet 4/22 4,911 feet Aircraft Capability: Group IV - Boeing Terminal: Terminal A 63,735 square feet Terminal B/C 1,000,000 square feet Total Terminal Space 1,063,735 square feet Number of Passenger Gates 44 Parking: Garage Parking 6,620 spaces Surface Parking 2,483 spaces Cell Phone Waiting Area Parking 33 spaces Total Public Parking 9,136 spaces Tenant Employee Parking 3,200 spaces Total Parking 12,336 spaces Cargo: Number of Cargo Buildings 1 Cargo Space 47,882 square feet International: Tower: No facilities TRACON - Vint Hill, VA - Operating 24 Hours/Day 7 Days/Week Intermodal Access: George Washington Parkway, VA State Route 233 Washington DC Metrorail System - Blue and Yellow Lines Virginia Railway Express Data as of December 31, 2011 Source: Airports Authority Records 127
136 DULLES INTERNATIONAL AIRPORT INFORMATION Exhibit S-16b Washington Dulles International Airport Location: Acres: Twenty-six miles west from downtown Washington, D.C., located in Fairfax and Loudoun Counties, VA 11,830 +/- acres Airport Code: IAD Runways: 1C/19C 11,500 feet 1R/19L 11,500 feet 12/30 10,500 feet 1L/19R 9,400 feet Aircraft Capability: Group VI - Airbus A-380 Terminal: Main Terminal 1,100,000 square feet Concourse A 412,000 square feet Concourse B 546,000 square feet Concourse C/D 608,627 square feet Total Terminal Space 2,666,627 square feet Number of Passenger Gates 123 Parking: Garage Parking 8,325 spaces Surface Parking 18,884 spaces Cell Phone Waiting Area Parking 224 spaces Total Public Parking 27,433 spaces Tenant Employee Parking 6,529 spaces Total Parking 33,962 spaces Cargo: Number of Cargo Buildings 6 Cargo Space 540,051 square feet International: Tower: Customs/Immigration Federal Inspection Facility TRACON - Vint Hill, VA - Operating 24 Hours/Day 7 Days/Week Intermodal Access: Dulles Access Highway, VA State Routes 267 and 28 Washington Flyer Bus Service from West Falls Church Metrorail Station Metro Bus 5A - D.C. - Dulles Line Data as of December 31, 2011 Source: Airports Authority Records 128
 and the western terminus is the Dulles Greenway. Roadway Length: 13.")
137 DULLES TOLL ROAD INFORMATION Exhibit S-17 Dulle s Toll Road Location: Eight-lane limited access highway that is situated on Virginia State Route 267. The Dulles Toll Road's eastern terminus is inside the Capital Beltway (Interstate 495) and the western terminus is the Dulles Greenway. Roadway Length: miles Year of Construction: 1984 Toll Collection Plazas: Mainline: 1 Exit Ramp: 19 Toll Collection Methods: Cash and Electronic Toll Collection (E-ZPass) Number of Toll Collection Lanes: 59 E-ZPass Only Collection Lanes: 9 Intersecting Roadways: Chain Bridge Road (SR 123) Wiehle Avenue (SR 828) Capital Beltway (I-495) Reston Parkway (SR 602) Spring Hill Road (SR 684) Fairfax County Parkway (SR 7100) Leesburg Pike (SR 7) Monroe Street Trap Road Centreville Road (SR 657) Hunter Mill Road (SR 674) Sully Road (SR 28) Parallel Roadways: Interstate 66 Leesburg Pike (SR 7) US Route 29 State Route 236 US Route 50 Data as of December 31, 2011 Source: Airports Authority Records 129
Metropolitan Washington Airports Authority (MWAA)
") RONALD REAGAN WASHINGTON NATIONAL DULLES TOLL ROAD DULLES METRORAIL WASHINGTON DULLES INTERNATIONAL Metropolitan Washington Airports Authority (MWAA) Andrew Rountree Chief Financial Officer & Vice President
RONALD REAGAN WASHINGTON NATIONAL DULLES TOLL ROAD DULLES METRORAIL WASHINGTON DULLES INTERNATIONAL Metropolitan Washington Airports Authority (MWAA) Andrew Rountree Chief Financial Officer & Vice President
2009 Comprehensive Annual Financial Report
 2009 Comprehensive Annual Financial Report Washington Dulles International Airport Ronald Reagan Washington National Airport Dulles Corridor METROPOLITAN WASHINGTON AIRPORTS AUTHORITY COMPREHENSIVE ANNUAL
2016 COMPREHENSIVE ANNUAL FINANCIAL REPORT Metropolitan Washington Airports Authority INTENTIONALLY LEFT BLANK
 INTENTIONALLY LEFT BLANK METROPOLITAN WASHINGTON AIRPORTS AUTHORITY COMPREHENSIVE ANNUAL FINANCIAL REPORT FOR THE FISCAL YEARS ENDED DECEMBER 31, 2016 and DECEMBER 31, 2015 BOARD OF DIRECTORS as of December
Report to the Finance Committee Comprehensive Annual Financial Report. Prepared by the Office of Finance April 2017
 Report to the Finance Committee 2016 Comprehensive Annual Financial Report Prepared by the Office of Finance April 2017 Audit Opinion date March 31, 2017 Unmodified or clean audit opinion on financial
2017 COMPREHENSIVE ANNUAL FINANCIAL REPORT Metropolitan Washington Airports Authority INTENTIONALLY LEFT BLANK
 INTENTIONALLY LEFT BLANK METROPOLITAN WASHINGTON AIRPORTS AUTHORITY COMPREHENSIVE ANNUAL FINANCIAL REPORT FOR THE FISCAL YEARS ENDED DECEMBER 31, 2017 and DECEMBER 31, 2016 BOARD OF DIRECTORS as of December
Distinguished Budget Presentation
 GOVERNMENT FINANCE OFFICERS ASSOCIATION Distinguished Budget Presentation Award PRESENTED TO Metropolitan Washington Airports Authority Virginia For the Fiscal Year Beginning January 1, 2007 President
METROPOLITAN WASHINGTON AIRPORTS AUTHORITY COMPREHENSIVE ANNUAL FINANCIAL REPORT YEAR ENDED DECEMBER 31, 2007 BOARD OF DIRECTORS
 METROPOLITAN WASHINGTON AIRPORTS AUTHORITY COMPREHENSIVE ANNUAL FINANCIAL REPORT YEAR ENDED DECEMBER 31, 2007 BOARD OF DIRECTORS The Honorable H.R. Crawford, Chairman Mame Reiley, Immediate Past Chairman
Jacksonville Aviation Authority Annual Report The Power Within.
 Jacksonville Aviation Authority Annual Report 2007 The Power Within. Board of Directors & Executive Team Cyrus Jollivette Chairman 1 John D. Clark Executive Director / CEO Jim McCollum Vice-Chairman 2
Committee for Dulles. June 9, Jack Potter, MWAA President & CEO
 Committee for Dulles June 9, 2016 Jack Potter, MWAA President & CEO Dulles International is the Premier International Gateway to the Capital Region Dom Intl Total Mainline Airlines 10 29 37* Destinations
Report to the Dulles Corridor Advisory Committee
 Report to the Dulles Corridor Advisory Committee Information Report on Dulles Toll Road Toll Rate Adjustment Process and Tentative Schedule and Overview of Traffic and Revenue Study Update May 2018 Purpose
Technical Report Economic Impact Study
 Technical Report 2009 Economic Impact Study Prepared for: Metropolitan Washington Airports Authority 1 Aviation Circle Washington, DC 20001 Prepared by: The Louis Berger Group, Inc. 2445 M Street, NW Washington,
Dulles Corridor Metrorail Project Update Dulles Area Transportation Association August 25, 2009
 Dulles Corridor Metrorail Project Update Dulles Area Transportation Association August 25, 2009 Patty Nicoson President Dulles Corridor Rail Association Proposed Toll Rate Increase on Dulles Toll Road
Welcome Fairfax County Transportation Advisory Commission and FC-DOT Staff
 Welcome Fairfax County Transportation Advisory Commission and FC-DOT Staff July 29, 2014 Metropolitan Washington Airports Authority MWAA was created through a bi-state compact between the Commonwealth
Dulles Corridor Improvements. Drive to Ride
 Dulles Corridor Improvements Dulles Corridor Improvements Status Update v Condition assessment of Toll Road facilities is complete v Dulles Airport Access Highway/I-495 Interchange Safety Improvements
ACI LEGAL COMMITTEE MEETING
 ACI LEGAL COMMITTEE MEETING MWAA S RAIL TO DULLES PROJECT: WHAT IS IT AND HOW DOES IT FIT WITH THE PRINCIPLES OF REVENUE DIVERSION PHIL SUNDERLAND MWAA GENERAL COUNSEL TWO GOALS FOR THE NEXT TEN MINUTES
METROPOLITAN WASHINGTON AIRPORTS AUTHORITY
 METROPOLITAN WASHINGTON AIRPORTS AUTHORITY + BOARD OF DIRECTORS MEETING Minutes of December 7,2011 The regular meeting of the Board of Directors was held in the first floor Conference Rooms la, 1B and
Columbus Regional Airport Authority. Financial Statements. March 31, Respectfully Submitted. Randy Bush, CPA, CIA. Chief Financial Officer
 Columbus Regional Airport Authority Financial Statements March 31, 2018 Respectfully Submitted Randy Bush, CPA, CIA Chief Financial Officer Unaudited for internal purposes CRAA Operating Revenue & Expenses
Dulles Toll Road Rate Setting Process
 Dulles Toll Road Rate Setting Process Public Hearings Slides FOR HNTB June 22, 2018 Dulles Toll Road Operations The Dulles Toll Road is a critical transportation link to the region s infrastructure. On
CONTACT: Investor Relations Corporate Communications
 NEWS RELEASE CONTACT: Investor Relations Corporate Communications 435.634.3200 435.634.3553 Investor.relations@skywest.com corporate.communications@skywest.com SkyWest, Inc. Announces Fourth Quarter 2017
Copa Holdings Reports Record Earnings of US$41.8 Million for 4Q06 and US$134.2 Million for Full Year 2006
 Copa Holdings Reports Record Earnings of US$41.8 Million for 4Q06 and US$134.2 Million for Full Year 2006 Panama City, Panama --- March 7, 2007. Copa Holdings, S.A. (NYSE: CPA), parent company of Copa
OPERATING AND FINANCIAL HIGHLIGHTS. Subsequent Events
 Copa Holdings Reports Net Income of $103.8 million and EPS of $2.45 for the Third Quarter of 2017 Excluding special items, adjusted net income came in at $100.8 million, or EPS of $2.38 per share Panama
MIRAMAR, Fla., April 29, 2015 (GLOBE NEWSWIRE) -- Spirit Airlines, Inc. (Nasdaq:SAVE) today reported first quarter 2015 financial results.
 -- Spirit Airlines, Inc. (Nasdaq:SAVE) today reported first quarter 2015 financial results.") April 29, 2015 Spirit Airlines Announces First Quarter 2015 Results; Adjusted Net Income Increases 87.1 Percent to $70.7 Million and Pre-Tax Margin Increases 900 Basis Points to 22.7 Percent MIRAMAR, Fla.,
April 29, 2015 Spirit Airlines Announces First Quarter 2015 Results; Adjusted Net Income Increases 87.1 Percent to $70.7 Million and Pre-Tax Margin Increases 900 Basis Points to 22.7 Percent MIRAMAR, Fla.,
Columbus Regional Airport Authority. Financial Statements. April 30, Respectfully Submitted. Randy Bush, CPA, CIA. Chief Financial Officer
 Columbus Regional Airport Authority Financial Statements April 30, 2018 Respectfully Submitted Randy Bush, CPA, CIA Chief Financial Officer Unaudited for internal purposes CRAA Operating Revenue & Expenses
Columbus Regional Airport Authority. Financial Statements. August 31, Respectfully Submitted. Randy Bush, CPA, CIA. Chief Financial Officer
 Columbus Regional Airport Authority Financial Statements August 31, 2018 Respectfully Submitted Randy Bush, CPA, CIA Chief Financial Officer Unaudited for internal purposes CRAA Operating Revenue & Expenses
Spirit Airlines Reports First Quarter 2017 Results
 Spirit Airlines Reports First Quarter 2017 Results MIRAMAR, Fla., April 28, 2017 - Spirit Airlines, Inc. (NASDAQ: SAVE) today reported first quarter 2017 financial results. GAAP net income for the first
National Society of Professional Engineers. Charles S. Carnaggio, PE Project Director July 2, 2014
 National Society of Professional Engineers Charles S. Carnaggio, PE Project Director July 2, 2014 Phase 1 Opening Date: July 26, 2014 Dulles Corridor Metrorail Project At-a-Glance Seamless integration
OPERATING AND FINANCIAL HIGHLIGHTS SUBSEQUENT EVENTS
 Copa Holdings Reports Net Income of US$6.2 Million and EPS of US$0.14 for the Third Quarter of 2015 Excluding special items, adjusted net income came in at $37.4 million, or EPS of $0.85 per share Panama
Spirit Airlines Reports Second Quarter 2018 Results
 Spirit Airlines Reports Second Quarter 2018 Results MIRAMAR, Fla., July 25, 2018 - Spirit Airlines, Inc. (NYSE: SAVE) today reported second quarter 2018 financial results. GAAP net income for the second
Columbus Regional Airport Authority. Financial Statements. July 31, Respectfully Submitted. Randy Bush, CPA, CIA. Chief Financial Officer
 Columbus Regional Airport Authority Financial Statements July 31, 2018 Respectfully Submitted Randy Bush, CPA, CIA Chief Financial Officer Unaudited for internal purposes CRAA Operating Revenue & Expenses
Spirit Airlines Reports Fourth Quarter and Full Year 2016 Results
 Spirit Airlines Reports Fourth Quarter and Full Year 2016 Results MIRAMAR, FL. (February 7, 2017) - Spirit Airlines, Inc. (NASDAQ: SAVE) today reported fourth quarter and full year 2016 financial results.
Proposed Dulles Toll Road Rate Adjustments
 Proposed Dulles Toll Road Rate Adjustments Dulles Corridor Advisory Committee Meeting October 5, 2012 Discussion Outline Regulatory Process for Changing Toll Rates Information Provided at Public Hearings
Columbus Regional Airport Authority. Financial Statements. September 30, Respectfully Submitted. Randy Bush, CPA, CIA. Chief Financial Officer
 Columbus Regional Airport Authority Financial Statements September 30, 2018 Respectfully Submitted Randy Bush, CPA, CIA Chief Financial Officer Unaudited for internal purposes CRAA Operating Revenue &
COUNTY OF ORANGE, CALIFORNIA AIRPORT REVENUE BONDS, SERIES 2009 A & B ANNUAL REPORT FOR FISCAL YEAR ENDED JUNE 30, 2013
 COUNTY OF ORANGE, CALIFORNIA AIRPORT REVENUE BONDS, SERIES 2009 A & B ANNUAL REPORT FOR FISCAL YEAR ENDED JUNE 30, 2013 Dated: January 28, 2014 COUNTY OF ORANGE, CALIFORNIA AIRPORT REVENUE BONDS, SERIES
CONTACT: Investor Relations Corporate Communications
 NEWS RELEASE CONTACT: Investor Relations Corporate Communications 435.634.3200 435.634.3553 Investor.relations@skywest.com corporate.communications@skywest.com SkyWest, Inc. Announces Second Quarter 2017
CONTACT: Investor Relations Corporate Communications
 NEWS RELEASE CONTACT: Investor Relations Corporate Communications 435.634.3200 435.634.3553 Investor.relations@skywest.com corporate.communications@skywest.com SkyWest, Inc. Announces Second Quarter 2016
Copa Holdings Reports Fourth Quarter and Full Year 2007 Results
 Copa Holdings Reports Fourth Quarter and Full Year 2007 Results Panama City, Panama --- February 21, 2008. Copa Holdings, S.A. (NYSE: CPA), parent company of Copa Airlines and Aero Republica, today announced
Spirit Airlines Reports First Quarter 2018 Results
 Spirit Airlines Reports First Quarter 2018 Results MIRAMAR, Fla., April 26, 2018 - Spirit Airlines, Inc. (NYSE: SAVE) today reported first quarter 2018 financial results. For the first quarter 2018, Spirit
EXHIBIT E to Signatory Airline Agreement for Palm Beach International Airport RATE AND FEE SCHEDULE
 EXHIBIT E to Signatory Airline Agreement for Palm Beach International Airport RATE AND FEE SCHEDULE SECTION I - DEFINITIONS The following words, terms and phrases used in this Exhibit E shall have the
RECOMMENDED 2013 BUDGET
 RECOMMENDED 2013 BUDGET December 12, 2012 Budget Highlights Draft October 17, 2012 Aviation Operation & Maintenance (O&M) Expenses 1.5 percent overall O&M increase (including debt service) 2013 Salary
OFFICE OF THE AUDITOR
 OFFICE OF THE AUDITOR DEPARTMENT OF AVIATION REVENUE AND CONTRACT COMPLIANCE AUDIT JUNE 2006 Dennis J. Gallagher Auditor Dennis J. Gallagher Auditor City and County of Denver 201 West Colfax Ave., Dept.
METROPOLITAN WASHINGTON AIRPORTS AUTHORITY. January 1 through December 31, With
 METROPOLITAN WASHINGTON AIRPORTS AUTHORITY 2016 January 1 through December 31, 2016 Your With Reagan National Airport Dulles International Airport Dulles Corridor Metrorail Dulles Toll Road Geographically
PORT OF SEATTLE PRESENTATION TO THE WESTERN STATES INSTITUTIONAL INVESTORS CONFERENCE MAY 15, 2018
 PORT OF SEATTLE PRESENTATION TO THE WESTERN STATES INSTITUTIONAL INVESTORS CONFERENCE MAY 15, 2018 Elizabeth Morrison, Port of Seattle Director of Corporate Finance 0 OVERVIEW Regional Economy Port Financial
Spirit Airlines Reports Third Quarter 2017 Results
 Spirit Airlines Reports Third Quarter 2017 Results MIRAMAR, Fla., October 26, 2017 - Spirit Airlines, Inc. (NASDAQ: SAVE) today reported third quarter 2017 financial results. GAAP net income for the third
SkyWest, Inc. Announces First Quarter 2018 Profit
 NEWS RELEASE CONTACT: Investor Relations Corporate Communications 435.634.3200 435.634.3553 Investor.relations@skywest.com corporate.communications@skywest.com SkyWest, Inc. Announces First Quarter 2018
Investor Update Issue Date: April 9, 2018
 Investor Update Issue Date: April 9, 2018 This investor update provides guidance and certain forward-looking statements about United Continental Holdings, Inc. (the Company or UAL ). The information in
AIRPORT FUND. Description. Summary
 Description In March 1941 construction started for the airport at its present site. After Pearl Harbor, the airport, known as Pinellas Army Airfield, was used as a military flight-training base. After
OPERATING AND FINANCIAL HIGHLIGHTS
 Copa Holdings Reports Financial Results for the Fourth Quarter of 2015 Excluding special items, adjusted net income came in at $31.7 million, or EPS of $0.73 per share Panama City, Panama --- February
OPERATING AND FINANCIAL HIGHLIGHTS. Subsequent Events
 Copa Holdings Reports Net Income of US$113.1 Million and EPS of US$2.57 for the First Quarter of 2015 Excluding special items, adjusted net income came in at US$106.0 million, or EPS of US$2.41 per share
 Existing Conditions AIRPORT PROFILE Passenger Terminal Complex 57 air carrier gates 11,500 structured parking stalls Airfield Operations Area 9,000 North Runway 9L-27R 6,905 Crosswind Runway 13-31 5,276
OPERATING AND FINANCIAL HIGHLIGHTS SUBSEQUENT EVENTS
 Copa Holdings Reports Financial Results for the Third Quarter of 2016 Excluding special items, adjusted net income came in at $55.3 million, or adjusted EPS of $1.30 per share Panama City, Panama --- November
Spirit Airlines Reports Highest Second Quarter Pre-Tax Margin in Company History
 July 24, 2013 Spirit Airlines Reports Highest Second Quarter Pre-Tax Margin in Company History MIRAMAR, Fla., July 24, 2013 (GLOBE NEWSWIRE) -- Spirit Airlines, Inc. (Nasdaq:SAVE) today reported second
SECTION 106 ACTIVITIES ANNUAL REPORT
 SECTION 106 ACTIVITIES ANNUAL REPORT FOR THE YEAR ENDING DECEMBER 31, 2014 Metropolitan Washington Airports Authority 198 Van Buren Street, Suite 300 Herndon, Virginia 20170 JANUARY 2015 Introduction The
Business Plan INTRODUCTION AIRPORT ENTERPRISE FUND OVERVIEW. Master Plan Guiding Principles
 5 Business Plan INTRODUCTION Just as previous chapters have outlined plans for the airport s physical development, this chapter outlines a plan for the airport s financial development. More specifically,
OFFICE OF THE AUDITOR
 OFFICE OF THE AUDITOR DEPARTMENT OF AVIATION (FORMERLY AMERICAN TRANS AIR, INC.) REVENUE AND CONTRACT COMPLIANCE AUDIT JUNE 2006 Dennis J. Gallagher Auditor Dennis J. Gallagher Auditor City and County
Copa Holdings Reports Net Income of US$113.9 Million for the Fourth Quarter of 2013
 Copa Holdings Reports Net Income of US$113.9 Million for the Fourth Quarter of 2013 Panama City, Panama --- February 12, 2014. Copa Holdings, S.A. (NYSE: CPA), today announced financial results for the
RECOMMENDED 2013 BUDGET AS SUBMITTED TO THE FINANCE COMMITTEE
 M E T R O P O L I T A N W A S H I N G T O N A I R P O R T S A U T H O R I T Y RECOMMENDED 2013 BUDGET AS SUBMITTED TO THE FINANCE COMMITTEE November 14, 2012 M E T R O P O L I T A N W A S H I N G T O N
CHAPTER 1 EXECUTIVE SUMMARY
 CHAPTER 1 EXECUTIVE SUMMARY 1 1 EXECUTIVE SUMMARY INTRODUCTION William R. Fairchild International Airport (CLM) is located approximately three miles west of the city of Port Angeles, Washington. The airport
OPERATING AND FINANCIAL HIGHLIGHTS
 Copa Holdings Reports Financial Results for the Fourth Quarter of 2018 Excluding special items, adjusted net profit came in at $44.0 million, or Adjusted EPS of $1.04 Panama City, Panama --- February 13,
Copa Holdings Reports Net Income of US$51.9 Million for the Fourth Quarter of 2008 and US$152.2 Million for Full Year 2008
 Copa Holdings Reports Net Income of US$51.9 Million for the Fourth Quarter of 2008 and US$152.2 Million for Full Year 2008 Panama City, Panama --- February 19, 2009. Copa Holdings, S.A. (NYSE: CPA), parent
Financial Proposal for Gwinnett County Airport Briscoe Field
 Financial Proposal for Gwinnett County Airport Briscoe Field Financial Proposal For the Lease, Operation and Improvement RP039-11 of GWINNETT COUNTY AIRPORT BRISCOE FIELD Presented To Gwinnett County Board
THIRD QUARTER RESULTS 2017
 THIRD QUARTER RESULTS 2017 KEY RESULTS In the 3Q17 Interjet total revenues added $5,835.1 million pesos that represented an increase of 22.0% over the revenue generated in the 3Q16. In the 3Q17, operating
CLASS SPECIFICATION 5/12/11 SENIOR AIRPORT ENGINEER, CODE 7257
 Form PDES 8 THE CITY OF LOS ANGELES CIVIL SERVICE COMMISSION CLASS SPECIFICATION 5/12/11 SENIOR AIRPORT ENGINEER, CODE 7257 Summary of Duties: A Senior Airport Engineer performs the more difficult and
Historical Statistics
 Historical Statistics FedEx Corporation Financial and Operating Statistics FY 2005 FY 2014 This report is a statistical supplement to FedEx s interim financial reports and is prepared quarterly. Additional
PLC. IFRS Summary Financial Statement (excluding Directors Report and Directors Remuneration Report) Year ended November 30, 2006
 Year ended November 30, 2006") C A R N I V A L PLC IFRS Summary Financial Statement (excluding Directors Report and Directors Remuneration Report) Year ended November 30, 2006 Registered number: 4039524 The standalone Carnival plc consolidated
C A R N I V A L PLC IFRS Summary Financial Statement (excluding Directors Report and Directors Remuneration Report) Year ended November 30, 2006 Registered number: 4039524 The standalone Carnival plc consolidated
Spirit Airlines Reports Third Quarter 2015 Pre-Tax Margin of 26.9 Percent
 October 27, 2015 Spirit Airlines Reports Third Quarter 2015 Pre-Tax Margin of 26.9 Percent MIRAMAR, Fla., Oct. 27, 2015 (GLOBE NEWSWIRE) -- Spirit Airlines, Inc. (NASDAQ:SAVE) today reported third quarter
Copa Holdings Reports Net Income of $57.7 million and EPS of $1.36 for the Third Quarter of 2018
 Copa Holdings Reports Net Income of $57.7 million and EPS of $1.36 for the Third Quarter of 2018 November 14, 2018 PANAMA CITY, Nov. 14, 2018 /PRNewswire/ -- Copa Holdings, S.A. (NYSE: CPA), today announced
OPERATING AND FINANCIAL HIGHLIGHTS
 Copa Holdings Reports Net Income of US$18.6 Million and EPS of US$0.42 for the Second Quarter of 2010 Excluding special items, adjusted net income came in at $26.3 million, or $0.60 per share Panama City,
Chapter 9: Financial Plan Draft
 Chapter 9: Draft TABLE OF CONTENTS 9... 5 9.2.1 ABIA Accounting... 6 9.2.2 Legal Environment... 6 9.2.3 Governing Documents... 8 9.3.1 FAA AIP Grants... 13 9.3.2 Local ABIA Funds... 14 9.4.1 Defer or Delay
AIR CANADA REPORTS THIRD QUARTER RESULTS
 AIR CANADA REPORTS THIRD QUARTER RESULTS THIRD QUARTER OVERVIEW Operating income of $112 million compared to operating income of $351 million in the third quarter of 2007. Fuel expense increased 49 per
OPERATING AND FINANCIAL HIGHLIGHTS. Subsequent Events
 Copa Holdings Reports Financial Results for the First Quarter of 2016 Excluding special items, adjusted net income came in at US$69.9 million, or EPS of US$1.66 per share Panama City, Panama --- May 5,
FOURTH QUARTER RESULTS 2017
 FOURTH QUARTER RESULTS 2017 KEY RESULTS In the 4Q17 Interjet total revenues added $5,824.8 million pesos that represented an increase of 10.8% over the revenue generated in the 4Q16. In the 4Q17, operating
RECOMMENDATION TO THE DULLES CORRIDOR AND FINANCE COMMITTEES
 RECOMMENDATION TO THE DULLES CORRIDOR AND FINANCE COMMITTEES Proposed Amendment to the Regulation that Establishes Toll Rates for Use of the Dulles Toll Road November 2018 Purpose To brief the Dulles Corridor
AIR CANADA REPORTS 2010 THIRD QUARTER RESULTS; Operating Income improved $259 million or 381 per cent from previous year s quarter
 AIR CANADA REPORTS 2010 THIRD QUARTER RESULTS; Operating Income improved $259 million or 381 per cent from previous year s quarter MONTRÉAL, November 4, 2010 Air Canada today reported operating income
Copa Holdings Reports Net Income of $49.9 million and EPS of $1.18 for the Second Quarter of 2018
 Copa Holdings Reports Net Income of $49.9 million and EPS of $1.18 for the Second Quarter of 2018 Panama City, Panama --- Aug 8, 2018. Copa Holdings, S.A. (NYSE: CPA), today announced financial results
PUBLIC ACCOUNTABILITY PRINCIPLES FOR CANADIAN AIRPORT AUTHORITIES
 PUBLIC ACCOUNTABILITY PRINCIPLES FOR CANADIAN AIRPORT AUTHORITIES The Canadian Airport Authority ( CAA ) shall be incorporated in a manner consistent with the following principles: 1. Not-for-profit Corporation
JANUARY 2018 BOARD INFORMATION PACKAGE
 JANUARY 2018 BOARD INFORMATION PACKAGE MEMORANDUM TO: Members of the Airport Authority FROM: Lew Bleiweis, Executive Director DATE: January 19, 2018 Financial Report (document) Informational Reports: A.
Greater Orlando Aviation Authority
 Greater Orlando Aviation Authority Orlando International Airport & Orlando Executive Airport Budgets Fiscal Year 2017-2018 Greater Orlando Aviation Authority Orlando, Florida Greater Orlando Aviation Authority
A component unit of the City of Knoxville, Tennessee for the fiscal year ended June 30, 2012
 metropolitan knoxville airport authority 2012 Comprehensive Annual Financial Report A component unit of the City of Knoxville, Tennessee for the fiscal year ended June 30, 2012 1937 2012 2012 Comprehensive
NORWEGIAN AIR SHUTTLE ASA QUARTERLY REPORT FIRST QUARTER 2004 [This document is a translation from the original Norwegian version]
![NORWEGIAN AIR SHUTTLE ASA QUARTERLY REPORT FIRST QUARTER 2004 [This document is a translation from the original Norwegian version]](/thumbs/87/95085804.jpg "NORWEGIAN AIR SHUTTLE ASA QUARTERLY REPORT FIRST QUARTER 2004 [This document is a translation from the original Norwegian version]") NORWEGIAN AIR SHUTTLE ASA QUARTERLY REPORT 2004 IN BRIEF At the start of 2003, Norwegian has become a pure low-fare airline. The Fokker F-50 operations have been terminated, and during the quarter the
NORWEGIAN AIR SHUTTLE ASA QUARTERLY REPORT 2004 IN BRIEF At the start of 2003, Norwegian has become a pure low-fare airline. The Fokker F-50 operations have been terminated, and during the quarter the
FORECASTING FUTURE ACTIVITY
 EXECUTIVE SUMMARY The Eagle County Regional Airport (EGE) is known as a gateway into the heart of the Colorado Rocky Mountains, providing access to some of the nation s top ski resort towns (Vail, Beaver
January 1 through December 31, 2017
 2017 Budget Book Cover Final-12-12-2016.pdf 1 12/12/16 10:04 AM 2017 January 1 through December 31, 2017 REAGAN NA ATIONAL AIRPORT DULL LES CORRIDOR METRORAIL DULLES T OLL ROAD DULLES INTERNAT A IONAL
Thank you for participating in the financial results for fiscal 2014.
 Thank you for participating in the financial results for fiscal 2014. ANA HOLDINGS strongly believes that safety is the most important principle of our air transportation business. The expansion of slots
Silver Line Operating Plan
 Customer Service and Operations Committee Information Item IV-A December 6, 2012 Silver Line Operating Plan Washington Metropolitan Area Transit Authority Board Action/Information Summary Action Information
SECTION 106 ACTIVITIES ANNUAL REPORT
 SECTION 106 ACTIVITIES ANNUAL REPORT FOR THE YEAR ENDING DECEMBER 31, 2011 Metropolitan Washington Airports Authority 1593 Spring Hill Road, Suite 300 Vienna, Virginia 22182 JANUARY 2012 Introduction The
Copa Holdings Reports Earnings of US$30.3 Million and EPS of US$0.70 for 3Q08
 Copa Holdings Reports Earnings of US$30.3 Million and EPS of US$0.70 for 3Q08 Panama City, Panama --- November 13, 2008. Copa Holdings, S.A. (NYSE: CPA), parent company of Copa Airlines and Aero Republica,
Investor Update September 2017 PARTNER OF CHOICE EMPLOYER OF CHOICE INVESTMENT OF CHOICE
 Investor Update September 2017 PARTNER OF CHOICE EMPLOYER OF CHOICE INVESTMENT OF CHOICE 1 Forward Looking Statements In addition to historical information, this presentation contains forward-looking statements
THIRD QUARTER RESULTS 2018
 THIRD QUARTER RESULTS 2018 KEY RESULTS In the 3Q18 Interjet total revenues added $ 6,244.8 million pesos that represented an increase of 7.0% over the revenue generated in the 3Q17. In the 3Q18, operating
OFFICE OF THE AUDITOR
 OFFICE OF THE AUDITOR DEPARTMENT OF AVIATION REVENUE AND COMPLIANCE AUDIT JANUARY 2005 Dennis J. Gallagher Auditor Dennis J. Gallagher Auditor City and County of Denver 201 West Colfax Ave., Dept. 705
COMMONWEALTH PORTS AUTHORITY
 REPORT ON COMPLIANCE AND INTERNAL CONTROL OVER COMPLIANCE WITH REQUIREMENTS APPLICABLE TO THE PASSENGER FACILITY CHARGE PROGRAM YEAR ENDED SEPTEMBER 30, 2015 Deloitte & Touche LLC P.O. Box 500308 Saipan,
Rates & Charges Analysis
 Aeronautics Division Rates & Charges Analysis Executive Summary Executive Summary In This Report: Airlines Rates and Charges Other Building Rental Rates Landing Fees Parking Rates Tie-Downs Special Use
Copa Holdings Reports Net Income of $136.5 million and EPS of $3.22 for the First Quarter of 2018
 Copa Holdings Reports Net Income of $136.5 million and EPS of $3.22 for the First Quarter of 2018 May 9, 2018 PANAMA CITY, May 9, 2018 /PRNewswire/ -- Copa Holdings, S.A. (NYSE: CPA), today announced financial
MGM Resorts International Reports Second Quarter Financial Results
 NEWS RELEASE MGM Resorts International Reports Second Quarter Financial Results 8/5/2014 Consolidated Adjusted EBITDA Increased 8%, Led By 10% Growth In Wholly Owned Domestic Resorts MGM China Declares
Criteria for an application for and grant of, or variation to, an ATOL: Financial
 Consumer Protection Group Air Travel Organisers Licensing Criteria for an application for and grant of, or variation to, an ATOL: Financial ATOL Policy and Regulations 2016/01 Contents Contents... 1 1.
Financial Feasibility Analysis Terminal Programming Study Des Moines Airport Authority
 Financial Feasibility Analysis Terminal Programming Study Des Moines Airport Authority September 12, 2017 Contents 1. Funding Sources for Airport Projects 2. Financial Metrics 3. CIP Summary and Funding
Adjusted net income of $115 million versus an adjusted net loss of $7 million in the second quarter of 2012, an improvement of $122 million
 Air Canada Reports Record Second Quarter 2013 Results Highest Adjusted Net Income, Operating Income and EBITDAR Results for Second Quarter in Air Canada s History Adjusted net income of $115 million versus
State of the Airport Robert S. Bowen, Executive Director October 18, 2018
 Robert S. Bowen, Executive Director October 18, 2018 A Year of Change The last year will be remembered as a period when the airlines, bolstered by a growing national economy, moderate fuel prices and changing
SECURITIES AND EXCHANGE COMMISSION Washington, D.C Form 10-Q SKYWEST, INC.
 SECURITIES AND EXCHANGE COMMISSION Washington, D.C. 20549 Form 10-Q QUARTERLY REPORT UNDER SECTION 13 OR 15(d) OF THE SECURITIES EXCHANGE ACT OF 1934 For the quarterly period ended June 30, 2013 OR TRANSITION
OPERATING AND FINANCIAL HIGHLIGHTS
 Copa Holdings Reports Net Income of US$32.0 Million and EPS of US$0.72 for the Second Quarter of 2012 Excluding special items, adjusted net income came in at $58.6 million, or EPS of $1.32 per share Panama
British Columbia. property society. Annual report unclaimedpropertybc.ca
 British Columbia Unclaimed property society Annual report 2014 unclaimedpropertybc.ca Reuniting Forgotten Dollars with their Rightful Owners Message from the Chair and Executive Director At the BC Unclaimed
Feasibility Study Federal Inspection Service Facility at Long Beach Airport
 Feasibility Study Federal Inspection Service Facility at Long Beach Airport 13 December 2016 Long Beach City Council PLEASE NOTE: The information, analysis, assessments and opinions contained in this presentation