METROPOLITAN WASHINGTON AIRPORTS AUTHORITY COMPREHENSIVE ANNUAL FINANCIAL REPORT YEAR ENDED DECEMBER 31, 2007 BOARD OF DIRECTORS
|
|
|
- Clifton Lester
- 5 years ago
- Views:
Transcription
1
2 METROPOLITAN WASHINGTON AIRPORTS AUTHORITY COMPREHENSIVE ANNUAL FINANCIAL REPORT YEAR ENDED DECEMBER 31, 2007 BOARD OF DIRECTORS The Honorable H.R. Crawford, Chairman Mame Reiley, Immediate Past Chairman Charles D. Snelling, Vice Chairman James L. Banks, Jr. Robert Clarke Brown The Honorable William W. Cobey Jr. Anne Crossman Mamadi Diané Michael David Epstein Weldon H. Latham Leonard Manning Michael L. O Reilly The Honorable David G. Speck EXECUTIVE STAFF James E. Bennett, President and Chief Executive Officer Margaret E. McKeough, Executive Vice President and Chief Operating Officer Lynn Hampton, CPA, Vice President for Finance and Chief Financial Officer Andrew T. Rountree, CPA, Deputy Chief Financial Officer Anne M. Field, CPA, Controller Prepared by the Office of Finance
3 (THIS PAGE INTENTIONALLY LEFT BLANK)
4 METROPOLITAN WASHINGTON AIRPORTS AUTHORITY Comprehensive Annual Financial Report Year Ended December 31, 2007 TABLE OF CONTENTS Introductory Section Page Transmittal Letter Certificate of Achievement Organization Chart Financial Section Report of Independent Auditors Management s Discussion and Analysis Financial Statements Statements of Net Assets Statements of Revenues, Expenses and Changes in Net Assets Statements of Cash Flows Notes to Financial Statements A. Summary of Significant Accounting Policies B. Deposits and Investments C. Interest Rate Swaps D. Accounts Receivable E. Restricted Assets F. Changes in Capital Assets G. Accounts Payable H. Pension Plans and Deferred Compensation Plan I. Postemployment Benefits J. Other Short Term Liabilities K. Capital Debt L. Airport Use Agreement and Premises Lease M. Net Assets N. Lease Commitments O. Other Commitments and Contingencies P. Government Grants Q. Litigation R. Passenger Facility Charges S. Risk Management T. Fair Value of Financial Instruments U. Dulles Corridor Proposal V. Subsequent Events i
5 METROPOLITAN WASHINGTON AIRPORTS AUTHORITY Comprehensive Annual Financial Report Year Ended December 31, 2007 TABLE OF CONTENTS (continued) Statistical Section Exhibit Page S - 1 Annual Revenues, Expenses and Changes in Net Assets S - 2 Operating Expenses By Function S - 3 Revenues By Source S - 4 Ronald Reagan Washington National Airport Revenues S - 5 Washington Dulles International Airport Revenues S - 6 Scheduled Airlines Rates and Charges S - 7 Ratios of Outstanding Debt S - 8 Revenue Bond Debt Service Coverage S - 9 Airport Information - Reagan National S -10 Airport Information - Washington Dulles S - 11 Airports Authority Employee Strength S - 12 Population Trends S -13 Aircraft Operations By Airport S -14 Landed Weights at Reagan National S -15 Landed Weights at Washington Dulles S -16 Enplanements at Reagan National S -17 Enplanements at Washington Dulles S -18 Enplanement Market Share at Reagan National S -19 Enplanement Market Share at Washington Dulles S -20 Cargo Market Share Enplaned at Reagan National S -21 Cargo Market Share Enplaned at Washington Dulles S - 22 Passenger Facility Charges S - 23 Primary Origination and Destination Passenger Markets S - 24 Primary Origination and Destination Passenger Markets S -25 Major Private Employers in Primary Air Trade Area S - 26 Employment by Industry S - 27 Revenue Bond Coverage S -28 Insurance Program for Operations S -29 Insurance Program for Construction ii
6
7
8 The Airports Authority s Office of Audit functions include coordination of the annual financial statement audit performed by external auditors as well as internal audits of internal controls. The Office of Audit conducts internal audits to provide the Airports Authority s management and the Board of Directors (the Board) with reasonable assurance that, 1) risks are being managed; 2) management and delivery capacity are being maintained; 3) adequate control is being exercised; and, 4) appropriate results are being achieved. The Office of Audit operates under the direction of Valerie Holt, CPA, Vice President for Audit. This position has dual reporting responsibilities to the President and Chief Executive Officer and the Audit Committee of the Board. The Audit Committee of the Board has an important role in the oversight of the financial reporting to ensure the Airports Authority s financial reports are reliable, consistent and of high quality. As required by the Acts of the District of Columbia and the Commonwealth of Virginia, a firm of independent certified public accountants is retained each year to conduct an audit of the financial statements of the Airports Authority in accordance with auditing standards generally accepted in the United States of America and to meet the requirements of the Federal Single Audit Act of 1984 (pursuant to OMB Circular A-133). The Airports Authority selected the firms of PricewaterhouseCoopers LLP and Bert Smith and Company to perform these audit services. The opinion of the financial statements is presented in the financial section of this report. The Single Audit Report and its opinion are presented under separate cover. Each year, the firms meet with the Audit Committee of the Board to review the results of the audit. The MD&A provides a narrative introduction, overview and analysis of the basic financial statements. The MD&A complements this Transmittal Letter and should be read in conjunction with it. REPORTING ENTITY AND ITS SERVICES The Airports Authority is a public body politic and corporate, created with the consent of the Congress of the United States by an Act of the District of Columbia and an Act of the Commonwealth of Virginia for the purpose of operating, maintaining, and improving Ronald Reagan Washington National Airport (Reagan National) and Washington Dulles International Airport (Washington Dulles), collectively, the Airports. The Airports had historically been managed by the Federal Aviation Administration (FAA) of the United States Department of Transportation. Pursuant to an agreement and Deed of Lease, effective June 7, 1987, the Airports were transferred by the U. S. Government to the Airports Authority for an initial term of 50 years. On June 17, 2003, the Agreement and the Deed of Lease were extended 30 years to June 6, The Airports Authority is an independent interstate agency. A 13-member Board presently governs the Airports Authority. Five members are appointed by the Governor of Virginia, three are appointed by the Mayor of the District of Columbia subject to confirmation by the Council of the District of Columbia, two are appointed by the Governor of Maryland, and three are appointed by the President of the United States with the advice and consent of the Senate. Directors serve staggered, six-year overlapping terms without compensation. They establish the Airports Authority s policy and appoint the Chief Executive Officer. The Board annually elects a Chairman, Vice Chairman, and Secretary. James E. Bennett became the President and Chief Executive Officer of the Airports Authority on May 3, In this position, Mr. Bennett plans and directs all programs and activities of the Airports Authority, focusing 2
9 on the future and the development of long-term business strategies. Mr. Bennett was formerly the Executive Vice President and Chief Operating Officer of the Airports Authority. Margaret McKeough became the Executive Vice President and Chief Operating Officer of the Airports Authority on April 1, In this position, Ms. McKeough plans and directs the operations of the Airports Authority, including airport management. Ms. McKeough was formerly the Vice President for Business Administration of the Airports Authority. Christopher U. Browne became the Vice President and Airport Manager of Washington Dulles on April 2, He was the former Vice President and Airport Manager of Reagan National. Washington Dulles, which opened in 1962, is situated on 11,830 acres in Fairfax and Loudoun Counties, Virginia. Washington Dulles is 26 miles from downtown Washington, D.C., and is accessible via a 17-mile dedicated dual-laned Access Road and Interstate Route 66. Washington Dulles is the Airports Authority s international airport, served by 52 domestic and international airlines, providing a full range of domestic services with international service to Europe, Asia, South America, and Africa. J. Paul Malandrino, Jr. assumed the position of Vice President and Airport Manager of Reagan National on July 24, Before joining the Airports Authority, he served as the Federal Security Director for the Baltimore- Washington International Thurgood Marshall Airport for four years. Prior to that time he served as the Manager of the Operations Department for Washington Dulles. Reagan National, which opened in 1941, is the oldest commercial airport serving the Washington, D.C. area and is located on 860 acres along the Potomac River in Arlington County, Virginia. Approximately three miles from downtown Washington, D.C., Reagan National is the Airports Authority s principal domestic airport served by 28 airlines. The Airports Authority operates a two-airport system that provides domestic and international air service for the mid-atlantic region. The Airports Authority is self-supporting, using aircraft landing fees, fees from terminal and other rentals, and revenue from concessions to fund operating expenses. The Airports Authority is not taxpayerfunded. The organization consists of 1,246 full and part-time employees in a structure that includes central administration, airports management and operations, and public safety. In February 1990, the Airports Authority entered into a long-term agreement with the major airlines serving Reagan National and Washington Dulles the Airport Use Agreement and Premises Lease (the Agreement). The Agreement provides the financial stability necessary for the Airports Authority to operate the airports and access the capital markets to fund the Capital Construction Program (CCP). The Agreement is for a term of 25 years, subject to annual cancellation rights by the Airports Authority starting in In 2003, the Airports Authority began a review of the Agreement and entered into discussions with the airlines to determine if changes could be made to improve the operations of the Airports. These discussions continue. The Agreement continues a long history of a close working relationship between the Airlines and the Airports Authority. The Agreement gives the Airlines interest in the positive financial performance of the Airports Authority by sharing in the net remaining revenues (NRR). (See Note L) The Airports Authority s mission to develop the Airports is the driving force behind its continuing aggressive efforts of air service development. While the facility and service enhancement improvements at Reagan National and Washington Dulles are notable, the Airports Authority s goal to prepare the dual airport system for the world 3
10 of tomorrow would not be fulfilled without a concentrated effort to attract airline service for new domestic and international destinations. The Air Trade Area for the Airports Authority is a subset of the Washington-Baltimore Consolidated Metropolitan Statistical Area and is comprised of the District of Columbia, five Maryland counties, nine Virginia counties, six independent Virginia cities, and the West Virginia county of Jefferson. There are over 80 airlines serving the Airports providing 275,433 flights per year at Reagan National and 343,243 domestic flights per year and 39,696 international flights per year at Washington Dulles. In addition to passenger traffic, Washington Dulles provides facilities for cargo transport. There are 525,124 square feet of cargo buildings at Washington Dulles, leased by eleven airlines and aviation support companies. Washington Dulles increased the occupancy of the cargo facilities to 95.4% in 2007, with only 23,960 square feet of vacancy. In 2007, total cargo weight at Washington Dulles increased by 2.2% to 358,526 tons of cargo. The cargo facilities at Washington Dulles are a major economic engine for the Washington Region. There is no significant cargo transportation at Reagan National. Capital Construction Program The Airports Authority initiated its Capital Construction Program (CCP) in 1988 to expand, modernize and maintain the Airports. Under the CCP, the Airports Authority has constructed and will continue to construct many of the principal elements of the Reagan National and Washington Dulles Master Plans. Major projects completed under the Master plan at Reagan National include, among others, two new main terminals connected to a Metrorail station, three parking garages and an airport traffic control tower. Major capital projects completed under the CCP at Washington Dulles include, among others, expansion and rehabilitation of the Main Terminal, construction of Concourse A and B, an international arrivals building, runway and road improvements, daily parking garages 1 and 2 and the air traffic control tower. In 2000, the Airports Authority approved an expansion of the CCP for Washington Dulles referred to as the Washington Dulles Development (d 2 ) program expected to be completed in In the aftermath of the events of September 11, 2001 the Airports Authority reexamined the CCP and revised the expected completion date to 2011, delayed the start dates of several projects and deferred others. However, on account of the growth in passenger enplanements at Washington Dulles in recent years, an additional $2.1 billion of projects was added to the CCP and the program has been rescheduled to be completed in In total, the CCP is expected to cost $7.1 billion. The projects currently in the program at Washington Dulles include an automated people mover system (APM) to replace the existing mobile lounges which will move passengers between the Main Terminal and Concourses A, B and C, construction of the Tier 2 Concourse, construction of a 4th runway, a federal inspection facility and a consolidated rental car facility. At Reagan National, projects include a consolidated communications center, runway safety area improvements, rehabilitation of the Terminal A baggage handling system, replacement of the parking revenue control system, and additional decks on Garages A, B and C. 4
11 The Airports Authority s Internet Web Page The Airports Authority has an Internet web site offering a wide array of information to users, including financial information and operational statistics. Users can obtain direct access to the airlines serving the Airports, and flight arrival and departure information. The Airports Authority s CAFR, Budget, Master Indenture, Debt Service Review, airline rates and charges and aviation statistics are posted on the web site. Since September 11, 2001, the Airports Authority has posted monthly unaudited financial statements to include discussion of results, and other information for the Airports Authority s bondholders and other interested parties. The Airports Authority s financial information is available at The Airports Authority s Budget The Airports Authority s annual budget is a financial planning tool outlining the estimated revenues and expenses for the Airports at certain passenger levels. The Budget is not prepared according to generally accepted accounting principles (GAAP). The President and Chief Executive Officer submit the Airports Authority s annual budget to the Board for approval. Budgetary controls and evaluations are affected by comparing actual interim and annual results with the budget, noting the actual level of passenger activities. The Airports Authority conducts quarterly reviews to ensure compliance with the provisions of the annual operating budget approved by the Board. In keeping with the requirements of a proprietary fund, budgetary comparisons have not been included in the financial section of this report. Operating revenues reached 95.2% of budget expectations in 2007, while in 2006, operating revenues, reached 91.6% of budget expectations. Operating expenses reached 94.3% of budget authorization in 2007, while in 2006, expenses reached 91.2% of budget authorization. The Airports Authority s 2007 budget reflected a 4.0% increase in revenues and a 6.4% increase in expenses. As a Percentage Budget Actual 1 of Budget 2007 Revenues $483,010,000 $459,777, % 2007 Expenses $267,599,300 $253,027, % 2006 Revenues $464,279,000 $425,051, % 2006 Expenses $251,541,000 $229,386, % 1 As defined in the Agreement. Revenues do not include transfers. AIRPORTS AUTHORITY S ECONOMIC CONDITION Many factors and events affect the air transportation industry, most of which the industry cannot control. Following the general economic downturn in the latter part of 2000 and the resulting recession, the air carrier industry continues to face high operating costs, intense competition between legacy and low-cost carriers and other complex challenges in an evolving industry, including continuous airline consolidation and changes to their business model. 5
12 The year 2005 saw Northwest and Delta enter bankruptcy; U.S. Airways emerged from bankruptcy and merged with America West. Independence Air filed for bankruptcy protection on November 7, 2005, ceased operations on January 5, 2006 and liquidated under Chapter 7 of the U.S. Bankruptcy Code in In 2007, Delta and Northwest emerged from bankruptcy but MAXjet filed for bankruptcy on December 24, The Airports, however, supported by the Metropolitan Washington Statistical Area saw many positive developments in spite of the industry s challenges. In October 2006, Southwest Airlines began operations at Washington Dulles. Southwest continued into 2007, adding 8,366 operations for a total of 739,711 passengers. Other carriers, such as Virgin America and Qatar Amiri Air began operations in 2007 adding over 50,000 new passengers throughout the year. Washington Dulles ended the year with 24,737,528 total passengers, an increase of 7.5% over 2006, and well ahead of the U.S. industry average growth rate of 1.4%. Washington Dulles s year end international and transborder passenger traffic growth rate of 13.7% was well ahead of the North America s industry average growth rate of 4.4%. Reagan National continues its trend of record high passenger levels. In 2006, Reagan National set a new record for passenger traffic. In 2007, Reagan National exceeded this record ending the year with total passenger traffic of 18,679,343. This was an increase of 0.7% from The Greater Washington Area continues to be a leading national economic region. It is the 4th largest metropolitan region in the country and leads the nation in several categories: median household income, education attainment (adults with bachelor s degree and higher) and gross regional product per capita. Over 6.1 million people call the Greater Washington region home. Nearly 46% of the area s residents have at least a bachelor s degree and 21.4% have a graduate degree. Gross regional product was $359.3 billion in 2006 almost 5% over the previous year. The median household income was $74,600 in 2006 an increase of 20% since 2000 and the highest among the nation s largest metro areas. For ten consecutive years, the Greater Washington area has led the nation with the most firms (46 in 2006) on the Inc. 500 list. The region is home to 23 Fortune 1000 companies with combined yearly revenues exceeding $194 billion. The overall federal spending in the area in 2006 topped $116.5 billion increasing 47% since The area added over 59,300 jobs in 2006 and unemployment remains low at 3.1% lower than the national average of 4.6%. The Greater Washington area is home to many private sector industries such as Aerospace, Bioscience and Information Technology. The area has 56 aerospace related companies employing at least 100 employees. The region is home to 3,650 Aerospace engineers and home to over 800 aerospace companies. The aerospace industry has 33 Research and Development facilities and is the home to the top five aerospace associations with a combined membership of 14,200. Close proximity to the Pentagon, 11 military installations and 10 federal agencies engaged in aerospace and defense work fuel this industry. 6
13 The Bioscience industry is aided by the National Institutes of Health (NIH) located in Montgomery County, MD. The NIH is a focal point for health research and spends $28.5 billion each year in bioscience research. It annually awards over $1.0 billion to researchers in the Greater Washington and Baltimore area. This industry employs nearly 21,000 workers. There is a state of the art research facility in Loudoun County, VA and Fort Detrick, located in Frederick County, MD is the U.S. Army s location for its Medical Research Institute of Infectious Diseases. The Greater Washington Area has the highest concentration of network and computer system administrators, database administrators and computer programmers. The Information Technology industry had a workforce of over 219,950 in 2005 and it is expected to grow to 281,540 by year Approximately 2,000 companies belong to one of the three major technology associations in the region. Population in the Metropolitan Washington area has consistently outpaced population growth in the United States. Over the last 11 years, the population grew at an annual compounded rate of 1.6% compared to 1.1% for the United States. Within the region, the largest concentration of population is in the combined jurisdictions of Fairfax County, the cities of Fairfax and Falls Church, Virginia (19.73%); Montgomery County, Maryland (17.62%); Prince George s County, Maryland (15.90%); and the District of Columbia (10.99%). Average Annual Unemployment Rate Year Air Trade Area United States % 4.9% % 4.5% % 4.2% % 4.0% % 4.7% Year Air Trade Area United States % 5.8% % 6.0% % 5.5% % 5.1% % 4.6% Source: United States Department of Labor Bureau of Labor Statistics. Long-Term Financial Planning The Airports Authority s long term financial planning includes the completion of certain approved capital expenditures, the accumulation of sufficient resources required to service the debt issued to finance these expenditures and to operate and maintain the airports. Under terms of the Agreement, fees and charges paid by the Airlines are used along with other income from the Airports to service the debt issued to finance the construction program. The Airlines pay operating and maintenance expenses, and debt service coverage equal to 125% of debt service (by airline cost center). The Airports Authority s CCP, as discussed earlier, is expected to be $7.1 billion in years It is anticipated that the major portion of the facilities development will be financed with the proceeds of bonds issued under the Master Indenture. The Airports Authority expects to issue a total of $5.1 billion in bonds during this time 7
14 frame. The Airports Authority also expects to use approximately $1.7 billion of PFC revenues, $598 million of federal and state grants, and the Airports Authority s portion of NRR to finance a portion of these costs. Because of constraints at Reagan National, much of the future growth in aviation activity for the Washington Metropolitan area will occur at Washington Dulles. In 2008, airline activity at both Airports is expected to grow over Enplanements at Reagan National are projected to grow 0.7%. Washington Dulles domestic enplanement growth rates are projected to increase 6.0% in 2008 over Washington Dulles international enplanements are projected to grow 8.7% based on new and expanded international service. The combined enplanements increase for the Airports in 2008 is projected at 4.1%. Since 1988, the Airports Authority has participated in the AIP, the federal government's airport grant program. The AIP provides funding for airport development, airport planning and noise compatibility programs from the Airport and Airway Trust Fund. The AIP also provides both entitlement and discretionary grants for eligible projects. The Airports Authority also receives grants from the Commonwealth of Virginia. In 1990, Congress approved the Aviation Safety and Capacity Expansion Act, which authorized domestic airports to impose a PFC on enplaning passengers. In May 1991, the FAA issued the regulations for the use and reporting of PFCs. PFCs may be used for airport projects which meet at least one of the following criteria: preserve or enhance safety, security, or capacity of the national air transportation system; reduce noise or mitigate noise impacts resulting from an airport; or furnish opportunities for enhanced competition between or among carriers. The Airports Authority applied for, and was granted, permission to begin collecting a $3.00 PFC effective November 1993 at Reagan National and January 1994 at Washington Dulles. The Airports Authority applied for, and received in February 2001, the approval to increase the PFC collection from $3.00 to $4.50, effective May In accordance with the regulations, based on the approval date from the FAA and continuing through the PFC collection period, the Airports Authority s share of AIP entitlement grants was reduced by 75%. The Airports Authority has submitted and gained approval of four series of PFC applications, with amendments, covering both airports in the amount of $1.5 billion. In March 2007, the Airports Authority filed a fifth PFC application for approximately $125.0 million. This application would allow the PFC s collected at Reagan National to provide funds for the expansion of the International Arrivals Building at Washington Dulles. In 2008, the Airports Authority expects to collect a total of $94.8 million in PFCs. On December 20, 2005, the Airports Authority announced its proposal to operate the Dulles Toll road (DTR) and oversee the construction of the Dulles Corridor Metrorail Extension Project. Under the proposal, the Airports Authority would issue bonds backed by revenue from the DTR which together with federal grants, PFCs and participation from Fairfax and Loudoun Counties, would fund the Project. On March 24, 2006, the Commonwealth of Virginia and the Airports Authority entered into a Memorandum of Understanding (MOU) to begin negotiations for the transfer. On December 29, 2006, the Airports Authority signed a Master Transfer Agreement and a Permit and Operating Agreement with the Virginia Department of Transportation (VDOT). The Agreements transfer the operation and maintenance responsibilities of the DTR, as well as rights to the DTR revenues, to the Airports Authority. In exchange, the Airports Authority will construct the Dulles Corridor Metrorail Extension Project from the vicinity of West Falls Church to Route 772 in Loudoun County, and will make other improvements in the Dulles 8
15 Corridor consistent with VDOT and regional plans. The transfer will be effective upon the completion of certain conditions, among which is the award of a Final Design Grant for the Metrorail Extension Project from the Federal Transit Administration (FTA). In January 2008, the FTA advised the Airports Authority that the Metrorail Extension Project may not meet the FTA s criteria for entry into Final Design, citing various reasons. The FTA requested additional information from the Airports Authority to enable it to make a final determination. The Airports Authority provided the additional information to the FTA, but the FTA s final determination remains pending. The Airports Authority has not determined whether it will proceed with the Dulles Corridor Metrorail Extension Project if the federal grant funds from the FTA are not available. If the project proceeds, upon transfer of the DTR, the Airports Authority will delegate the operation of the DTR to VDOT on behalf of the Airports Authority until a Full Funding Grant Agreement for the Metrorail Extension Project is executed with the FTA. The term of the Agreement for the Airports Authority to operate and maintain the DTR is 50 years. The Airports Authority will be responsible for collecting tolls and setting toll rates following its regulatory process and with consultation of a Dulles Corridor Advisory Committee. The Airports Authority has established a separate Dulles Corridor Enterprise Fund to account for the activity of the DTR and the Metrorail Extension Project upon transfer. OTHER INFORMATION Recognition of Awards and Achievement The Government Finance Officers Association of the United States and Canada (GFOA) awarded a Certificate of Achievement for Excellence in Financial Reporting to the Airports Authority for its comprehensive annual financial report for the fiscal year ended December 31, This was the eighteenth consecutive year that the government has achieved this prestigious award. In order to be awarded a Certificate of Achievement, a government must publish an easily readable and efficiently organized comprehensive annual financial report. This report must satisfy both generally accepted accounting principles and applicable legal requirements. A Certificate of Achievement is valid for a period of one year only. We believe that our current comprehensive annual financial report continues to meet the Certificate of Achievement Program s requirements and we are submitting it to the GFOA to determine its eligibility for another certificate. The Airports Authority received the GFOA Award for outstanding achievement in Popular Annual Financial Reporting (PAFR) for its 2005 and 2006 Annual Report. The Airports Authority has also received the GFOA s Award for Distinguished Budget Presentation for many years since
16 Acknowledgments In closing, I would like to thank the President and Chief Executive Officer and the Board of Directors for their leadership and support in planning and conducting the financial operations of the Airports Authority. Special thanks are directed to Anne M. Field, the Controller for the Airports Authority, for the preparation of the CAFR. Additional staff that deserve recognition for their efforts in completing the CAFR are Andrew Rountree, Mark Tune, William Bailey, Janice Gardner, Teri Arnold, Nancy Edwards, David Tucker, Paula Simms, Kris Wenneson, Susan Abeles and Diane Lary as well as all the personnel within the Office of Finance. Lynn Hampton, CPA Vice President and Chief Financial Officer 10

17 Certificate of Achievement The Government Finance Officers Association of the United States and Canada (GFOA) awarded a Certificate of Achievement for Excellence in Financial Reporting to the Metropolitan Washington Airports Authority for its comprehensive annual financial report for the year ended December 31, In order to be awarded a Certificate of Achievement, a government unit must publish an easily readable and efficiently organized comprehensive annual financial report whose contents conform to program standards. The report must satisfy both generally accepted accounting principles (GAAP) and applicable legal requirements. A Certificate of Achievement is valid for a period of one year only. We believe our current report continues to conform to the Certificate of Achievement program requirements and we are submitting it to GFOA to determine its eligibility for another certificate. 11
18 Organization Chart Board of Directors H.R. Crawford Chairman James E. Bennett President and Chief Executive Officer Philip Sunderland VP & Secretary Board of Directors Margaret E. McKeough Executive Vice President & Chief Operating Officer Edward Faggen VP & General Counsel Valerie Holt VP for Audit Mark Treadaway VP for Air Service Planning & Development J. Paul Malandrino, Jr. VP & Airport Manager Reagan National Christopher Browne VP & Airport Manager Washington Dulles Elmer Tippett, Jr. VP for Public Safety Mark Treadaway Acting VP for Communications Lynn Hampton VP for Finance & Chief Financial Officer Frank Holly VP for Engineering Robert Sullivan Airport Operations Dana Pitts Airport Operations Stephen Holl Police Chief Tara Hamilton Public Affairs Andrew Rountree Deputy Chief Financial Officer Stephan Smith Deputy Vice President Richard Golinowski Engineering & Maintenance Brian Leuck Engineering & Maintenance Gary Mesaris Fire Chief Pamela Alme Marketing Anne Field Controller & Payroll Vacant Assistant Vice President Ronald Stange Airport Administration Kim Crego (Acting) Airport Administration Claude Rountree Public Safety Administration Michael Cooper State & Local Government Affairs Neal Phillips Noise Abatement Margaret Bishop Community Relations Vacant Congressional & Regulatory Affairs Marcia McAllister Rail Communications Mgr., Dulles Corridor Metrorail Project Jennifer Mitchell Deputy Project Director Dulles Corridor Metrorail Project Nancy Edwards Treasury Rita Alston Budget Rochelle Cameron Financial Strategy and Analysis William Lebegern Planning Diane Hirsch Design Kenneth Vogel Construction Walter Seedlock Building Codes/ Environmental Charles Carnaggio Project Director, Dulles Corridor Metrorail Project Steven Baker VP for Business Administration Richard Gordon Equal Opportunity Michael Natale (Acting) Administrative Services T. Paul Dorrington Concessions & Property Development E. Fred Seitz, Jr. Procurement & Contracts Michael Natale Risk Management Arl Williams VP for Human Resources Deborah Lockhart Staffing & Records Services Warren Reisig Benefits & Retirement Michael Brogan Organization Development Kenneth Pritchard Compensation John Tapajcik Labor & Employee Relations George Ellis VP for Information & Telecommunications Systems Syed Ali IT Operations & Services Alisia Billups-O Neill Telecommunications Systems Derek Kelly Wireless & Radio Systems Merrill Phelan IT Systems & Programming Michael Stewart Air Carrier Relations 12

19

20
21 (THIS PAGE INTENTIONALLY LEFT BLANK)
22 MANAGEMENT S DISCUSSION AND ANALYSIS (unaudited) INTRODUCTION The following discussion and analysis of the financial performance and activity of the Metropolitan Washington Airports Authority (the Airports Authority) is to provide an introduction and understanding of the basic financial statements of the Airports Authority for the year ended December 31, 2007 with selected comparative information for the years ended December 31, 2006 and December 31, This discussion has been prepared by management, is unaudited and should be read in conjunction with the financial statements, and the notes thereto, which follow this section. Using the Financial Statements The Airports Authority s financial report includes three financial statements: the Statements of Net Assets; the Statements of Revenues, Expenses and Changes in Net Assets; and the Statements of Cash Flows. The financial statements are prepared in accordance with accounting principles generally accepted in the United States of America as promulgated by Governmental Accounting Standards Board (GASB) principles. In 2007, the Airports Authority early implemented GASB Statement No. 51, Accounting and Financial Reporting for Intangible Assets. The Airports Authority is in the practice of amortizing the cost of internally developed software and other assets as required in GASB No. 51, and identifying certain assets such as easements as having indefinite lives. No prior year restatements were required in the year of implementation. Intangible assets with indefinite lives are presented in the Statement of Net Assets as a component of Land and other non-depreciable assets. In 2007, the Airports Authority also early implemented GASB Statement No. 50, Pension Disclosures, An Amendment of GASB Statement No. 25 and No. 27. The Statements of Net Assets depict the Airports Authority s financial position as of December 31, and include all assets and liabilities of the Airports Authority. The Statements of Net Assets demonstrate that the Airports Authority s assets equal liabilities plus net assets. Net assets represent the residual interest in the Airports Authority s assets after liabilities are deducted. Net assets are displayed in three components: invested in capital assets, net of related debt, restricted and unrestricted. The Statements of Revenues, Expenses and Changes in Net Assets report total operating revenues, operating expenses, non-operating revenues and expenses, and other changes in net assets as of the end of a fiscal period, December 31. Revenues and expenses are categorized as either operating or non-operating based upon management's policy as established in accordance with definitions set forth by GASB. Significant recurring sources of the Airports Authority s revenues, including Passenger Facility Charges (PFCs), investment income and federal, state and local grants are reported as non-operating revenues. The Airports Authority s interest expense is reported as non-operating expense. The Statements of Cash Flows present information showing how the Airports Authority s cash and cash equivalents position changed during the fiscal year. The Statements of Cash Flows classify cash receipts and cash payments resulting from operating activities, capital and related financing activities, and investing activities. 15
23 The Airports Authority s Activity Highlights The Airports Authority has activity-based revenues which include non-airline fees such as parking and rental car and airline based fees such as landing fees, international arrival fees and passenger conveyance fees. Although there have been many factors and events that have negatively affected the air transportation industry in the past years such as the general economic downturn in the latter part of 2000 and the resulting recession, the terrorist attacks of September 11, 2001, the conflicts in the Middle East, the continued threat of domestic and international terrorist attacks, and the significant increases in fuel prices, the Airports Authority continues its efforts to diversify its revenues, increase the carriers using its airports and adhere to the principles of fiscal restraint. After two years of reduced enplanement activity beginning in 2001, the monthly activity levels at Washington Dulles International Airport (Washington Dulles) and Ronald Reagan Washington National Airport (Reagan National) (collectively, the Airports) began rebounding by year-end For the full year 2004, and again in 2005, passenger activity at the Airports exceeded passenger activity in all previous years. In 2006, Reagan National continued this trend and again reported record high passenger levels. Washington Dulles, however, experienced reduced passenger activity in Independence Air, a low-fare airline, who began operations at Washington Dulles in June 2004, adding significant passenger and operations activity at the Airport, ceased operating on January 5, Passenger activity for Washington Dulles began to rebound in the last quarter of 2006, with the introduction of the low-cost carrier, Southwest Airlines. In the year 2007, Reagan National again surpassed the prior years record passenger levels and reported record high revenues from other sources such as concessions. In 2007, Southwest continued its operations at Washington Dulles with 8,366 operations and 739,177 passengers. In addition, other carriers, domestic and international added activity allowing Washington Dulles to close its year with a 7.5% growth in total passengers and increased revenues in all other areas. Enplanements at Reagan National for the 12 months of 2007 were 9,298,307, compared to 9,242,480 for the year 2006, resulting in an increase of 0.7%. After the events of September 11, 2001, general aviation activity of non-scheduled, privately owned aircraft was prohibited at Reagan National and the prohibition continued until it was lifted in part on October 18, General Aviation operations in 2007 were 5,272; an increase of 2,100 over Total enplanements at Washington Dulles for the 12 months of 2007 were 12,382,816 compared to 11,497,150 in 2006, resulting in a 7.7% increase. International enplanements for the 12 months of 2007 were 2,960,345 compared to 2,594,682 in 2006, a 14.0% increase. 16
24 Enplanements and Operations Activity for 2005 to Enplanements Washington Dulles Domestic 9,313,161 8,797,384 10,947,383 Washington Dulles International 2,960,345 2,594,861 2,448,994 Washington Dulles Non-Commercial 109, , ,436 Reagan National Domestic 9,145,554 9,054,485 8,736,725 Reagan National Transborder 148, , ,549 Operations Washington Dulles 382, , ,652 Reagan National 275, , ,056 Total Enplanement Activity for 2005 to 2007 Total Operations Activity for 2005 to ,000, ,000 Million 12,000,000 10,000,000 8,000,000 6,000,000 4,000,000 2,000,000 Million 500, , , , , Washington Dulles Reagan National Washington Dulles Cargo Reagan National Cargo In comparing the airports to the North American aviation industry average growth rate, Washington Dulles exceeded this growth rate significantly. For domestic activity, Washington Dulles experienced 7.5% growth versus the North American aviation trend of 1.4%. For international traffic, Washington Dulles growth rate of 13.7% far exceeded the industry growth rate of 4.4%. Reagan National s traffic, while setting new high passenger levels for the airport, did not meet the industry growth rate of 1.4% realizing a growth rate of 0.7% for the year. Enplanements Growth MWAA North America Difference Washington Dulles Domestic 7.5% 1.4% 6.1% Washington Dulles International 13.7% 4.4% 9.3% Reagan National 0.7% 1.4% (0.7)% Financial Highlights The overall financial results of 2007 reflect the increase of passenger and airline activity at Washington Dulles and the continued stabilization of passenger and airline activity at Reagan National. The majority of the operating revenues at the Airports are directly related to the number of passengers and aircraft operations. Operating 17
25 revenues for 2007 were $510.5 million, an increase of $39.3 million from operating revenues in 2006, the highest year in Airports Authority history. The Airports Authority s revenues are primarily derived from rents and charges for the use of the Airport s facilities, including landing fees received from both signatory and non-signatory airlines using the Airports, and concession contracts at the Airports, including off-airport rental car operations. Concessions historically have accounted for a substantial portion of the Airports Authority s revenues. The Airport Use Agreement and Premises Lease (the Agreement) requires the Signatory Airlines to pay actual costs while the majority of concessionaires pay a percentage of revenue or a minimum annual guarantee payment. Landing fees increased $5.3 million to $78.7 million or 7.2%, principally related to the increased passenger activity at both Airports. Rent revenue increased $11.1 million, a 7.1% increase from 2006 with additional space available to the Airlines, an increase in overall rental rates and a scheduled increase in the rental of the new Air Traffic Control Tower to the FAA. Passenger fees, including fees paid by the Transportation Security Administration (TSA) increased $3.2 million or 12.6%, as a result of the increased passenger traffic at Washington Dulles and a slight increase in rates. Other revenues increased 11.0%, with fees from parking permits increasing $0.3 million from last year Increase Percent of Revenue Revenue (Decrease) Increase Classifications Amount Amount from 2006 from 2006 Concessions $217,486,823 $ 199,011,305 $ 18,475, % Rents 167,301, ,164,079 11,136, % Landing fees 78,682,496 73,375,458 5,307, % Utility sales 11,778,736 11,248, , % Passenger fees 28,684,113 25,474,908 3,209, % Other 6,542,935 5,893, , % Total $510,476,130 $ 471,168,637 $ 39,307, % 18
26 The following is a graphic illustration of operating revenues by source for the years ended December 31, 2007 and 2006: 2007 Revenues 2006 Revenues Landing Fees, 15.4% Utility Sales, 2.3% Passenger fees, 5.6% Other, 1.3% Concessions, 42.6% Landing Fees, 15.6% Utility Sales, 2.4% Passenger fees, 5.4% Other, 1.3% Concessions, 42.2% Rents, 32.8% Rents, 33.1% Concession Revenue In 2007, concession revenues increased $18.5 million or 9.3% from Concession revenues now account for 42.6% of total operating revenues, up from 2006 by 0.4%. Parking revenues were $116.5 million in 2007, up $7.5 million and providing over 54% of the Airports Authority s total concession revenues. Rental car revenue increased $4.2 million in 2007 to end the year at $34.4 million. Terminal revenues, food & beverage, retail, newsstand, duty free and other concessions increased by $6.8 million. Concession revenue at Reagan National increased in total by $8.8 million. Parking revenues increased $4.3 million from 2006 at Reagan National, in spite of a drop from 87.8% in 2006 to 83.8% in 2007 in the average occupancy for all public parking. The parking garages, themselves, at Reagan National experienced a slight decrease in average occupancy of 88.5% in 2006, to 88.1% in Parking rates were increased in November Currently there are 8,390 parking spaces at Reagan National: 455 hourly, 4,749 daily, 2,956 economy and 230 valet. The Airport added a cell phone parking lot in 2006, which offers roughly 30 spaces of no charge parking while waiting for passengers arriving at the terminal. Construction on an additional level to Parking Garages A, B, and C is scheduled to begin in This additional area will provide approximately 1,424 new public parking spaces. Terminal concession revenue at Reagan National increased $0.7 million from In 2007, Reagan National had 17 new or renovated food and beverage concessions. Of the 17, four were new food and beverage locations such as Five Guys, CIBO, Gordon Biersch, and Fuddruckers and the remainder were renovations and new concepts for the Airport. Rental car revenue increased 14% or $4.2 million in 2007, primarily due to increases in the minimum annual guarantees for the rental car companies. At Washington Dulles, Parking revenues increased to $73.8 million, an increase of $3.6 million from In 2007, there were 26,125 parking spaces at Washington Dulles: 1,923 hourly, 8,325 daily, 830 valet and 12,378 19
27 economy. An overflow economy lot provides an additional 2,499 parking spaces during peak holiday periods. The cell phone parking lot offers 170 spaces of no charge parking while waiting for passengers arriving at the terminal. Although overall parking activity remained unchanged from 2006 with approximately 3.3 million exits from all lots, total revenue increased as a result of the shift in patrons parking preferences from the economy lot to the daily garages which require a higher fee. There was also some reduced activity in the hourly lot which coincided with the increase in the usage of the cell phone parking lot. Food and beverage revenue increased 28.0% over 2006 to $8,184,734, resulting from increased passenger traffic and the completion of the food and beverage renovation program, which added some restaurant space and improved the quality and variety of dining choices for passengers. Additions included Five Guys and Mayorga Coffee in Concourse A and Villa Pizza, Cuisine D Avion and Nelson s Pub in Concourse D. The following table details concession revenues by major category for the past two years: Concession Revenues (in thousands) Increase Percent of (Decrease) Increase from 2006 (Decrease) from 2006 Parking $ 116,528,833 $109,067,495 $ 7,461, % Rental cars 34,418,480 30,202,008 4,216, % Food and beverage 14,985,742 12,755,501 2,230, % Newsstand and retail 11,354,093 10,519, , % Duty free 3,422,389 2,928, , % Display advertising 7,356,054 6,300,000 1,056, % Inflight caterers 6,242,548 5,666, , % Fixed base operator 11,985,065 10,583,623 1,401, % All other 11,193,619 10,987, , % Total $ 217,486,823 $199,011,305 $18,475, % Operating Expense Operating expenses for fiscal year ended December 31, 2007 were $478.6 million, an increase of $55.5 million or 13.1% over Depreciation and amortization expense of $142.0 million, an increase of $8.9 million over 2006, accounted for 29.7% of operating expenses. Depreciation and amortization expense increased primarily as a result of a number of projects that came on line in Materials, equipment, supplies, contract services and other increased $31.1 million from In 2007, the Airports Authority completed the demolition of Concourse G, originally built by United Airlines and purchased by the Airports Authority in The loss on the demolition of the asset was $12.7 million and was recognized in October United Airlines is reimbursing the Airports Authority, for Concourse G, through their customary rental rates. Reagan National in 2007 rehabilitated some of the terminal restrooms and repaired the moving walkways. Washington Dulles made expenditures to rehabilitate the baggage belt system and replace carpets. In addition, Washington Dulles provided temporary employees to the TSA, for baggage handling services, but is receiving payment from TSA for the additional expenses. In late 2005, the Airports Authority announced its proposal to operate the Dulles Toll Road. In 2006, the Airports Authority undertook the process of moving this proposal to completion. This process continued in The Airports Authority incurred in 2006 and 2007, among other expenses, costs for legal services and other 20
28 management support services. The Airports Authority incurred $5.1 million in expense in 2006 and $6.8 million in The Airports Authority received from the Virginia Department of Rail and Public Transportation in 2007 a reimbursement of costs for $5.8 million. This reimbursement was credited against incurred costs for 2007, leaving reported expenses for 2007 of $1.0 million. The Airports Authority began in 2006 and continued in 2007, the process of implementing a new Enterprise Resource Planning system. Accounting principles, promulgated in GASB Statement No. 51, Accounting and Financial Reporting for Intangible Assets require costs incurred through the Airports Authority s current phase of this implementation be expensed through the Statement of Changes in Net Assets. For 2007, the Airports Authority incurred $4.4 million in associated expenses. Salaries and related benefits for 2007 increased $14.5 million. Salaries increased $8.4 million from 2006 reflecting a $5.2 million expected growth based on approved wage increases related to performance in the prior year and $1.8 million in additional overtime associated with snow events in Additional expense was incurred in 2007 for the special program employees hired during the peak summer time period to assist passengers as they travel through the airports. This program was expanded in 2007 increasing the program levels by $0.5 million. Benefits increased $6.1 million in 2007 and did not include, as they had in 2006, the reduction of $2.5 million for the over funding of the annual Other Post-Employment Benefits (OPEB) costs in In addition, the Airports Authority s retirement committee increased the contributions to the Airports Authority s general and police and firefighter plans from 6.2% and 11.5% of eligible earnings in 2006, to 6.6% and 11.8% of eligible earnings in Increased claims in the insurance market since September 11, 2001, resulted in insurance quotes that were significantly higher than in previous years. The Airports Authority responded to the increase in insurance costs by negotiating higher retention levels while increasing related insurance reserves. General liability, property insurance and workers compensation insurance costs in 2007 and 2006 were $6.6 million and $5.8 million, respectively. Property insurance premiums increased $431.4 thousand and liability insurance premiums increased $188.7 thousand. Claims expenses increased $1.3 million reflecting a $793.7 thousand increase in the Airports Authority s reserves. The cost of providing utilities to the Airports increased just 3.8% in Natural gas costs decreased 10.9% or $0.7 million while electricity costs increased 10.0%, water costs increased 17.6% and sewerage costs increased 14.6%. Percent of Increase Increase Expense (Decrease) (Decrease) Classification from 2006 from 2006 Materials, supplies, equipment, contract services and other $ 182,096,091 $151,009,792 $31,086, % Salaries and related benefits 128,465, ,870,907 14,594, % Utilities 21,134,317 20,359, , % Lease from United States Government 4,830,121 4,689, , % Depreciation and amortization 142,030, ,106,378 8,923, % Total $ 478,556,150 $423,036,183 $55,519, % 21
29 The following is a graphic illustration of the total operating expenses by source for the years ended December 31, 2007 and 2006: 2007 Expenses 2006 Expenses Lease from U.S. Government, 1.0% Depreciation and amortization, 29.7% Lease from U.S. Government, 1.1% Depreciation and amortization, 31.5% Utilities, 4.4% Utilities, 4.8% Salaries and related benefits, 26.9% Materials, supplies, equipment, other, 38.0% Salaries and related benefits, 26.9% Materials, supplies, equipment, other, 35.7% Changes in Net Assets Fiscal year 2007 operating income was $31.9 million, a decrease of $16.2 million compared to The operating results of 2007 reflect the increase in passenger traffic less the Airports Authority s increased expenses, including the $12.7 million loss on the demolition of Concourse G. In 2007, non-operating revenues of $174.2 million were $7.8 million lower than in 2006, principally because of decreased grant revenue. The Airports Authority received a $200.2 million letter of intent from the FAA as partial funding of the fourth runway at Washington Dulles. The first $36.9 million award was received and expended in 2006 and the AIP Program of 2007 was $26.7 million as compared to $50.1 million in Investment income increased $10.5 million from last year with higher interest rates overall on the Airports Authority s reserves for debt and interest earnings on an advance refunding of $175.7 million. In 2001, the Airports Authority began a risk management program to assist in managing the interest cost on outstanding and future debt. In August 2001, the Airports Authority entered into a swap transaction to assure that the interest on bonds issued to refund the Series 1992A Bonds would not exceed an interest rate of 5.0%. In May 2005, the Airports Authority entered into four interest rate swap transactions (2005 Swaps) to hedge against rising interest rates. In 2006, the Airports Authority amended the 2005 swap agreement with an effective date of October 1, 2006, and extended the effective date of the agreement to October 1, In September 2007, the Airports Authority amended the 2005 Swap agreement with a start date of October 1, 2007 and extended the start date of $75 million with Bank of Montreal to October 1, 2008 and $125 million with Wachovia to October 1, In conjunction with this amendment, the Airports Authority monetized the then unrealized increase in the market value of this swap in September 2007, which resulted in the recognition of a realized gain of $2.06 million. 22
30 The change in the market value of the swaps in 2007 was an unrealized loss of $23.2 million, compared to an unrealized loss of $12.7 million in The combined market value of the swaps on December 31, 2007, was a $50.3 million loss. (See Note C) In 2007, non-operating expenses of $140.1 million increased by $26.5 million from 2006, as a result of increased debt and the related interest expense and an unrealized loss on the Airports Authority s swaps of $23.2 million. (See Note J) Capital contributions include PFCs, federal and state grants, and other capital property acquired. PFC revenue in 2007 was $82.9 million; $1.4 million higher than in 2006, and reflect the increased passenger activity at the Airports. PFCs are imposed when an airline ticket is purchased and they do not mirror the enplanement activity of an airport. Federal and state grants of $32.3 million were $21.9 million lower than 2006 grant revenues, as a result of new awards received in 2006 and the overall reduction in 2007 of AIP eligible expenditures. Grants received in 2007 include $26.7 million in FAA Airport Improvement Program grants, and $2.0 million in Virginia Aviation grants. PFCs and federal and state grants provide partial funding for certain capital construction projects. (See Note P) The change in net assets is an indicator of whether the overall fiscal condition of the Airports Authority has improved or declined during the year. The change in net assets for the years ended December 31, 2007 and 2006 was an increase of $66.1 million and an increase of $116.5 million, respectively. 23
31 The following represents a summary of the Statements of Revenues, Expenses and Changes in Net Assets: Operating revenues Concessions $ 217,486,823 $ 199,011,305 $ 198,691,232 Rents 167,301, ,164, ,865,079 Landing fees 78,682,496 73,375,458 76,359,090 Utility sales 11,778,736 11,248,988 10,934,616 Passenger fees 28,684,113 25,474,908 26,973,143 Other 6,542,935 5,893,899 10,398,536 Total operating revenues 510,476, ,168, ,221,696 Operating expenses Material, equipment, supplies contract services, and others 182,096, ,009, ,107,372 Salaries and related benefits 128,465, ,870, ,878,086 Utilities 21,134,317 20,359,248 21,493,887 Lease from U.S. Government 4,830,121 4,689,858 4,505,435 Depreciation and amortization 142,030, ,106, ,424,537 Total operating expenses 478,556, ,036, ,409,317 Operating income 31,919,980 48,132,454 62,812,379 Non-operating revenues Investment income 55,557,746 45,035,158 20,194,481 Unrealized swap gain - - 6,062,129 Total non-operating revenues 55,557,746 45,035,158 26,256,610 Non-operating expenses Interest expense (111,534,092) (96,999,795) (103,561,330) Passenger facility charges, financing costs (3,968,842) (2,026,385) (1,497,097) Swap payments (1,353,696) (1,854,177) (4,856,288) Unrealized swap loss (23,223,957) (12,718,126) - Total non-operating expenses (140,080,587) (113,598,483) (109,914,715) Loss before capital contributions (52,602,861) (20,430,871) (20,845,726) Capital contributions 118,674, ,960, ,054,076 Increase in net assets $ 66,071,319 $ 116,529,882 $ 79,208,350 24
32 Statements of Net Assets The Statements of Net Assets present the financial position of the Airports Authority at the end of the fiscal year. The Statements include all assets and liabilities of the Airports Authority. Net assets are the difference between total assets and total liabilities and are an indicator of the current fiscal health of the Airports Authority. A summarized comparison of the Airports Authority s assets, liabilities and net assets on December 31, 2007, 2006, and 2005 is as follows: Current assets $ 849,502,892 $ 810,642,733 $ 678,298,711 Non-current assets Capital assets, net 4,616,109,321 4,018,568,661 3,443,263,293 Other non-current assets 441,617, ,687, ,552,138 Total Assets 5,907,229,260 5,182,899,267 4,388,114,142 Liabilities Current liabilities 315,593, ,084, ,205,610 Non-current liabilities Long-term debt outstanding and other restricted 4,588,666,516 4,010,917,453 3,345,227,510 Other non-current liabilities, unrestricted ,399 Total Liabilities 4,904,260,436 4,246,001,762 3,567,746,519 Net Assets Invested in capital assets, net of debt 555,206, ,949, ,384,514 Restricted 114,983,454 46,083,312 65,337,686 Unrestricted 332,778, ,864, ,645,423 Total Net Assets $ 1,002,968,824 $ 936,897,505 $ 820,367,623 For the year-ended December 31, 2007, and in its twentieth full year of operations, the Airports Authority s financial position remained strong with total assets of $5.9 billion and liabilities of $4.9 billion. Current assets increased by $38.9 million from Since September 11, 2001, the Airports Authority has maintained five months of its operating cash portfolio in securities that mature within six months to provide extra liquidity. At December 31, 2007, the Airports Authority had $4.6 billion in capital assets (net of depreciation), an increase of $597.5 million from December 31, On December 24, 2007, MAXjet filed for bankruptcy. The Airports Authority s accounts receivable included $141,953 in pre-petition debt for this Airline. The Airports Authority has reserved for this pre-petition debt. Current liabilities increased by $80.6 million, principally from a $51.6 million increase in unrestricted and restricted accounts payable related to increased construction activity and an increase of $14.1 million in the current portion of bonds payable. 25
33 Net assets, which represent the residual interest in the Airports Authority s assets after liabilities are deducted, were $1.0 billion on December 31, 2007, an increase of $66.1 million from 2006 and a $182.6 million increase from The account Invested in Capital Assets, Net of Related Debt decreased by $43.7 million to $555.2 million because the increase in the capital assets was less than the increase in the corresponding debt. As of December 31, 2007, $255.7 million in unspent proceeds were reclassified to Restricted Assets to offset the assets still available from the bond proceeds. The restricted and unrestricted remaining net assets are derived from the Airports Authority operations since the Airports Authority s inception in 1987, as well as grant and PFC collections. The 2007 restricted net assets of $115.0 million are subject to external restrictions on how they may be used under the Master Indenture of Trust (Master Indenture) and federal regulations. A debt service reserve of $278.0 million, maintained in accounts held by the Airports Authority s Trustee offset by the corresponding debt, is included in Restricted Net Assets. The remaining 2007 unrestricted assets of $332.8 million, an increase of $40.9 million from 2006, may be used to meet any of the Airports Authority s ongoing operations, subject to approval by the Airports Authority s Board of Directors. Capital Financing and Debt Management The Airports Authority s long-term uninsured bonds are rated AA by Fitch, Aa3 by Moody s, and AA- by Standard & Poor s Rating Services (S&P). Moody s assigned the Airports Authority an Aa3 rating with Stable Outlook on April 14, Moody s changed the outlook to Positive on March 15, 2005, back to Stable on January 4, 2006, and back to Positive on November 3, Moody s affirmed the Airports Authority s rating with a Positive outlook on August 24, S&P assigned the Airports Authority s debt an A+ with a Stable outlook on April 14, S&P changed the outlook to Positive on March 15, On November 3, 2006, S&P upgraded the rating to AA- rating with a Stable outlook and affirmed this rating on August 24, Fitch assigned the Airports Authority an AA- rating with Stable outlook on April 14, Fitch upgraded the Airports Authority s rating on August 27, 2007, to an AA rating with Stable outlook. As of December 31, 2007, the Airports Authority had $3.9 billion outstanding Airport System Revenue Bonds, $260.0 million in outstanding Commercial Paper Series Two, and $432.0 million in PFC notes. (See Note J) Of the $3.9 billion in outstanding Senior Bonds, $3.89 billion is insured and $47.2 million is uninsured. S&P assigned the Airports Authority an overall Debt Derivative Profile rating of 1 on a scale of 1 to 4, with 1 representing the lowest risk and 4 representing the highest risk. The Airports Authority is financing its construction program through a combination of revenues, entitlement, and discretionary grants received from the FAA, state grants, PFCs, and revenue bonds. Long-term debt is the principal source of funding for the CCP. The Airports Authority, through its Master Indenture, has agreed to maintain a debt service coverage of not less than Debt service coverage is calculated based on a formula included in the Master Indenture and the Agreement with the Airlines. Historically, the Airports Authority has maintained a coverage ratio significantly higher than its requirement. During 2007 and 2006, the Airports Authority s debt service coverage was 1.72 and 1.78, respectively. During 2007, the Airports Authority issued $164.5 million in Series 2007A Airport System Revenue Refunding Bonds. The 2007A Revenue Refunding Bonds refunded certain maturities of the outstanding Series 1997B Bonds and the Airports Authority realized a net present value savings of $6.9 million from the refunding. In September 2007, the Airports Authority also issued Series 2007B Airport System Revenue Bonds for $530.0 million. These Bonds were used to finance the Airports Authority s on-going construction program. 26
34 In August 2007, the Airports Authority issued $60 million in Commercial Paper Series One. This financing provided the Airports Authority funds for on-going capital construction needs. As of the year ended December 31, 2007 the Airports Authority had $200 million CP Series Two, $60 million in CP Series One, and $432 million in PFC Notes. Additionally, the Airports Authority had $160 million authorized but not issued CP available for construction needs. As a result of these transactions, as well as principal payments of $66.2 million, long-term debt outstanding increased by $465.4 million and long-term CP Notes and PFC Notes outstanding of $692.0 million increased $92.0 million. Detailed information on the long-term debt of the Airports Authority can be found in the Notes to the Financial Statements. (See Note K) Federal and State Grant Activity During 2005, the Airports Authority applied for approval to impose and use $146.6 million in PFCs at Reagan National. The PFC Application is funding the 12-gate expansion at Washington Dulles and projects associated with the fourth runway. FAA approval of the application was received in March In March 2007, the Airports Authority submitted a PFC application for the International Arrivals Building at Washington Dulles. This application is still under review. The Airports Authority applied for a $207.0 million Letter of Intent (LOI) with the FAA to issue grants to fund the fourth runway at Washington Dulles. On February 21, 2006, the Airports Authority received approval of a $200.2 million LOI. In October 2007, the Airports Authority requested 75% funding under the TSA s new LOI allocation for the in-line baggage systems at Reagan National and Washington Dulles. This is still under review with the TSA. Cash and Investment Management The Airports Authority s cash and cash equivalents decreased $35.1 million to $224.9 million as of December 31, 2007, from $260.0 million as of December 31, 2006, as a result of transferred investments and increased spending of the CCP. Cash and cash equivalents with an original maturity of three months or less are considered highly liquid investments. Unrestricted investments increased by $39.8 million from 2006 and restricted investments increased by $80.2 million from
35 The following summary shows the major sources and use of cash: Cash received from operations $ 493,952,169 $ 473,743,148 Cash expended from operations (296,983,493) (296,036,365) Net cash provided by operations 196,968, ,706,783 Net cash used in capital and related financing activities (163,196,469) (18,190,471) Net cash used by investing activities (68,866,260) (281,510,000) Net cash used by capital financing and investing activities (232,062,729) (299,700,471) Net decrease in cash and cash equivalents (35,094,053) (121,993,688) Cash and cash equivalents, beginning of year 260,021, ,015,425 Cash and cash equivalents, end of year $ 224,927,684 $ 260,021,737 Cash temporarily idle during 2007 was invested in demand deposits, certificates of deposit, commercial paper, United States Government and agency obligations, mutual funds, repurchase agreements collateralized by the United States Government or agency obligations, and other permitted investments as listed in the Master Indenture for the Airports Authority s outstanding bonds. During 2007, the Airports Authority s operating account average portfolio balance was $249.9 million and the average yield on investments was 5.0%. The capital funds are held by an agent for the Trustee, but managed by the Airports Authority. For 2007, the capital funds had an average portfolio balance of $511.7 million and an average yield of 4.9%. Certain Airports Authority funds that will be used for bond requirements (See Note E) and capital projects are invested in long-term instruments. An annual cash flow projection for capital projects is developed for all bond proceeds and investments are matched to maximize investment income while ensuring cash is available for capital project expenses. All investments must be made following the investment policy that was adopted by the Airports Authority s Board. An investment committee meets quarterly to review the portfolios for compliance with the investment policy. (See Note B) Capital Construction During 2007, the Airports Authority expended $714.7 million in its ongoing CCP compared to an amended budget of $754.4 million. The Airports Authority capitalized $212.1 million in projects in 2007, including a single operating tank at the fuel settling tank farm, improvements and expansion of the north area roads system, a south utility substation and distribution center and some significant rehabilitation in Concourse C&D. Projects that are continuing in 2008, and scheduled for completion in 2008, or beyond, include Concourse B 12-gate addition, fuel settling tank farm, AeroTrain system, fourth runway and associated taxiway and the international arrivals building. Average monthly capital construction spending in 2007 was approximately $59.6 million. 28
36 Contacting the Airports Authority s Financial Management The financial report is designed to provide the Airports Authority s Board, management, investors, creditors and customers with a general view of the Airports Authority s finances and to demonstrate the Airports Authority s accountability for the funds it receives and expends. For additional information about this report, or for additional financial information, please contact Lynn Hampton, Vice President and Chief Financial Officer, 1 Aviation Circle, Washington, DC, , or BondholdersInformation@mwaa.com. 29
37 STATEMENTS OF NET ASSETS (continued) As of December ASSETS Current assets Unrestricted assets: Cash and cash equivalents $ 36,128,525 $ 26,013,856 Investments 230,873, ,608,097 Accounts receivables, net 43,199,310 23,290,488 Inventory 5,033,697 3,637,337 Prepaid expenses and other current assets 6,810,182 7,086,182 Total unrestricted assets 322,045, ,635,960 Restricted assets: Cash and cash equivalents, restricted 173,596, ,855,164 Passenger facility charges, restricted cash 15,202,225 14,152,717 Accounts receivables, passenger facility charges and other, restricted 9,354,533 11,258,351 Investments, restricted 329,304, ,740,541 Total restricted assets 527,457, ,006,773 Total current assets 849,502, ,642,733 Non-current assets Capital assets: Land and other non-depreciable assets 121,534, ,144,707 Construction in progress 1,915,881,901 1,389,283,792 Buildings, systems and equipment 3,908,323,105 3,705,348,760 Less: accumulated depreciation (1,329,630,395) (1,194,208,598) Capital assets, net 4,616,109,321 4,018,568,661 Long-term investments 80,463,199 29,973,880 Long-term investments, restricted 278,008, ,395,532 Other long-term assets 18,333,264 - Net pension asset and other post-employment benefits asset 4,509,918 4,955,615 Bond issuance costs, net, restricted 60,302,530 55,362,846 Total non-current assets 5,057,726,368 4,372,256,534 Total assets $ 5,907,229,260 $5,182,899,267 The accompanying notes are an integral part of these financial statements. 30
38 STATEMENTS OF NET ASSETS LIABILITIES AND NET ASSETS Current liabilities Payable from unrestricted: Accounts payable and accrued expenses $ 71,868,458 $ 44,359,480 Operating lease obligations 341, ,140 Total unrestricted 72,209,598 44,700,620 Current liabilities payable from restricted assets: Accounts payable and accrued expenses 100,843,888 76,770,235 Accrued interest payable 55,970,434 41,153,454 Bonds payable 86,570,000 72,460,000 Total restricted 243,384, ,383,689 Total current liabilities 315,593, ,084,309 Non-current liabilities Payable from unrestricted: Deferred revenue 20,363,189 - Payable from restricted: Passenger facility charge bank participation notes 432,000, ,000,000 Commercial paper notes 260,000, ,000,000 Bonds payable, net 3,876,303,327 3,410,917,453 Total restricted 4,568,303,327 4,010,917,453 NET ASSETS Total non-current liabilities 4,588,666,516 4,010,917,453 Total liabilities 4,904,260,436 4,246,001,762 Invested in capital assets, net of related debt 555,206, ,949,358 Restricted: Bond funds 94,274,698 21,429,855 Passenger facility charges 19,612,520 23,217,174 Grants 1,096,236 1,436,283 Total restricted 114,983,454 46,083,312 Unrestricted 332,778, ,864,835 Total net assets 1,002,968, ,897,505 Total net assets and liabilities $5,907,229,260 $ 5,182,899,267 The accompanying notes are an integral part of these financial statements. 31
39 STATEMENTS OF REVENUES, EXPENSES AND CHANGES IN NET ASSETS Years Ended December 31, 2007 December 31, 2006 OPERATING REVENUES Concessions $ 217,486,823 $199,011,305 Rents 167,301, ,164,079 Landing fees 78,682,496 73,375,458 Utility sales 11,778,736 11,248,988 Passenger fees 28,684,113 25,474,908 Other 6,542,935 5,893,899 Total operating revenues 510,476, ,168,637 OPERATING EXPENSES Materials, equipment, supplies, contract services, and other 182,096, ,009,792 Salaries and related benefits 128,465, ,870,907 Utilities 21,134,317 20,359,248 Lease from U. S. Government 4,830,121 4,689,858 Depreciation and amortization 142,030, ,106,378 Total operating expenses 478,556, ,036,183 OPERATING INCOME 31,919,980 48,132,454 NON-OPERATING REVENUES (EXPENSES) Passenger facility charges, financing costs (3,968,842) (2,026,385) Investment income 55,557,746 45,035,158 Interest expense (111,534,092) (96,999,795) Swap payments (1,353,696) (1,854,177) Unrealized swap loss (23,223,957) (12,718,126) Total non-operating revenues (expenses) (84,522,841) (68,563,325) LOSS BEFORE CAPITAL CONTRIBUTIONS (52,602,861) (20,430,871) CAPITAL CONTRIBUTIONS Passenger facility charges 82,858,846 81,489,704 Federal and state grants 32,317,161 54,239,498 Other capital property contributed 3,498,173 1,231,551 Total capital contributions 118,674, ,960,753 NET ASSETS Increase in net assets 66,071, ,529,882 Total net assets, beginning of year 936,897, ,367,623 Total net assets, end of year $ 1,002,968,824 $936,897,505 The accompanying notes are an integral part of these financial statements. 32
40 STATEMENTS OF CASH FLOWS (continued) Years Ended December 31, 2007 December 31, 2006 NET CASH FROM OPERATING ACTIVITIES: Operating cash receipts from customers $ 493,952,169 $ 473,743,148 Cash payments to suppliers for goods and services (171,155,537) (181,950,447) Cash payments to employees for services (125,827,956) (114,085,918) NET CASH PROVIDED BY OPERATING ACTIVITIES 196,968, ,706,783 NET CASH FROM CAPITAL AND RELATED FINANCING ACTIVITIES: Proceeds from issuance of bonds 722,216, ,533,168 Proceeds from the issuance of commercial paper 60,000,000 14,000,000 Principal payments on bonds (235,575,000) (108,335,000) Payments for capital expenditures and construction in progress (654,182,938) (639,942,164) Proceeds from sale of capital assets 170, ,628 Payments of bond issuance costs (7,981,001) (11,713,387) Interest paid on bonds and commercial paper (182,537,019) (157,739,940) Government grants in aid of construction 32,650,197 53,394,785 Passenger facility charge receipts 84,430,990 80,947,807 Borrowing on passenger facility charge bank participation notes 32,000,000 - Passenger facility charge expenses, interest, and other (14,388,535) (15,749,368) NET CASH USED BY CAPITAL AND RELATED FINANCING ACTIVITIES (163,196,469) (18,190,471) NET CASH FROM INVESTING ACTIVITIES: Interest received on investments 52,011,628 42,359,987 Increase in short term investments, net (54,828,848) (254,217,579) Proceeds from long-term investment maturities 404,796, ,778,231 Purchase of long-term investments (470,845,416) (358,430,639) NET CASH USED BY INVESTING ACTIVITIES (68,866,260) (281,510,000) NET DECREASE IN CASH AND CASH EQUIVALENTS (35,094,053) (121,993,688) CASH AND CASH EQUIVALENTS, Beginning of year 260,021, ,015,425 CASH AND CASH EQUIVALENTS, End of year $ 224,927,684 $ 260,021,737 The accompanying notes are an integral part of these financial statements. 33
41 STATEMENTS OF CASH FLOWS Years Ended December 31, 2007 December 31, 2006 RECONCILIATION OF OPERATING INCOME TO NET CASH PROVIDED BY OPERATING ACTIVITIES: Operating income $ 31,919,980 $ 48,132,454 Adjustments to reconcile operating income to net cash provided by operating activities: Depreciation and amortization 142,030, ,106,378 Increase (decrease) in allowance for doubtful accounts (178,868) 107,611 (Gain) loss on sale of assets 12,707,987 (414,477) Decrease (increase) in accounts receivable (18,344,893) 2,746,982 Increase in inventory (1,396,360) (204,868) Increase in prepaid expenses and other current assets (340,121) (1,268,210) Increase in other long-term assets (17,271,446) (3,025,545) Decrease (increase) in long-term liabilities 20,363,189 (313,399) (Decrease) increase in accounts payable and accrued expenses 27,478,854 (1,160,143) NET CASH PROVIDED BY OPERATING ACTIVITIES $ 196,968,676 $ 177,706,783 NONCASH INVESTING, CAPITAL AND FINANCING ACTIVITIES: Unrealized gain (loss) $ (947,117) $ 2,673,248 Other capital property acquired Equipment received by tenant and improvements $ 3,498,173 $ 1,231,551 Capital construction costs payable $ 100,843,888 $ 76,770,235 The accompanying notes are an integral part of these financial statements. 34
42 NOTES TO FINANCIAL STATEMENTS A. SUMMARY OF SIGNIFICANT ACCOUNTING POLICIES Reporting Entity The (the Airports Authority) is an independent interstate agency created by the Commonwealth of Virginia and the District of Columbia with the consent of the United States Congress. The Commonwealth of Virginia and the District of Columbia enacted essentially identical legislation creating the Airports Authority for the purpose of operating Ronald Reagan Washington National Airport (Reagan National) and Washington Dulles International Airport (Washington Dulles), collectively, the Airports. The Airports Authority is governed by a Board of Directors (Board) with members from the Commonwealth of Virginia, the District of Columbia, the State of Maryland, and three members appointed by the President of the United States. On June 7, 1987, Reagan National s and Washington Dulles properties were transferred to the Airports Authority under a long-term lease authorized by the Metropolitan Washington Airports Act of 1986, Title VI of Public Law (See Note L). All personal property was transferred to the Airports Authority without condition. Prior to the transfer, the Airports were operated by the Federal Aviation Administration (FAA) of the United States Department of Transportation. Only the accounts of the Airports Authority are included in the reporting entity. There are no U.S. government agency finances that should be considered for inclusion in the Airports Authority s financial reporting entity. Basis of Accounting The accompanying financial statements have been prepared on the accrual basis. The Airports Authority reports as a Business Type Activity, as defined by the Governmental Accounting Standards Board (GASB). Business Type Activities are those that are financed in whole or in part by fees charged to external parties for goods or services. The Airports Authority s activities are accounted for similar to those often found in the private sector using the flow of an economic resources measurement focus and the accrual basis of accounting. All assets, liabilities, net assets, revenues, and expenses are accounted for through a single enterprise fund with revenues recorded when earned and expenses recorded at the time liabilities are incurred. Current assets include cash and amounts convertible to cash during the next normal operating cycle, or one year. Current liabilities include those obligations to be liquidated with current assets. Revenues from airlines, concessions, rental cars and parking are reported as operating revenues. Capital, grants, financing or investing related transactions are reported as non-operating revenues. All expenses related to operating the Airports Authority are reported as operating expenses. Interest expense and financing costs are reported as non-operating. 35
43 Net Assets Net assets represent the residual interest in the Airports Authority s assets after liabilities are deducted and consists of three sections: Invested in capital assets, net of related debt; Restricted; and Unrestricted. Net assets invested in capital assets, net of related debt includes capital assets, restricted and unrestricted, net of accumulated depreciation, reduced by outstanding debt attributable to acquisition. Net assets are reported as restricted when constraints are imposed by third parties or enabling legislation. The Airports Authority s restricted assets are expendable. All other net assets are unrestricted. Proprietary Accounting and Financial Reporting In accordance with GASB Statement No. 20, Accounting and Financial Reporting for Proprietary Funds and Other Governmental Entities That Use Proprietary Fund Accounting, the Airports Authority follows all GASB pronouncements issued on, before, or after November 30, 1989, as well as all Financial Accounting Standards Board (FASB) Statements and Interpretations, Accounting Principal Board Opinions and Accounting Research Bulletins issued on, before, or after November 30, 1989, unless they contradict GASB guidance. Budgeting Requirements The Airports Authority s annual budgeting process is a financial planning tool used to establish the estimated revenues and expenditures for both Airports. The Airports Authority s annual budget is not prepared in accordance with generally accepted accounting principles (GAAP). In keeping with the requirements of a proprietary fund, budget comparisons have not been included in the financial section of this report. Revenue Recognition Rentals and concession fees are generated from airlines, parking structures and lots, food, rental cars, fixed base operators, and other commercial tenants. Leases with the airlines are based on full cost recovery, through rates and charges as described below. Other leases are for terms from one to 15 years and generally require rentals based on the volume of business, with specified minimum rentals. Rental revenue is recognized over the life of the respective leases, and concession revenue is recognized partially based on reported concession revenue and partially based on minimum rental guarantee. Rental revenue and concession revenue are recognized as operating revenues on the Statements of Revenues, Expenses and Changes in Net Assets. Landing fees are principally generated from scheduled airlines and non-scheduled commercial aviation and are based on the landed weight of aircraft. The scheduled airline fee structure is determined annually based on full cost recovery pursuant to an agreement between the Airports Authority and the Signatory Airlines. Landing fees are recognized as part of operating revenues when airline related facilities are utilized. Several airlines represent concentrations of revenues for the Airports Authority. At Reagan National, US Airways, Delta Air Lines, and American Airlines comprise approximately 71.0% of annual airline revenues. At Washington Dulles, United, Delta Air Lines and American Airlines comprise approximately 65.4% of annual airline revenues. These airlines combined represent approximately 72.2% of the total annual airline 36
44 revenues for the Airports Authority. Actual airline revenues for 2007 represent approximately 48.4% of the Airports Authority s total operating revenues. Cash and Cash Equivalents For purposes of reporting cash flows, cash and cash equivalents include cash on hand, demand deposits, certificates of deposit, commercial paper, United States Government and agency obligations, mutual funds, and repurchase agreements collateralized by United States Government or agency obligations with an original maturity of three months or less, including restricted assets. Investments Investments with an original maturity greater than one year are recorded at their fair value with all investment income, including changes in the fair value of investments, reported as investment income in the financial statements. Investments with an original maturity of less than one year are carried at amortized cost which approximates fair value. Investments consist of certificates of deposit, commercial paper, United States Government and agency obligations, interest rate swaps, and repurchase agreements collateralized by United States Government or agency obligations, with an original maturity greater than three months. Swaps The Airports Authority enters into interest rate swap agreements to modify interest rates on outstanding debt. The Swaps are recognized at fair value on the Statements of Net Assets in investments. Changes in the fair value of the Swaps are recorded as unrealized gains or losses on the Statements of Revenues, Expenses and Changes in Net Assets. In addition, net interest expenditures are also recorded in the Statements of Revenues, Expenses and Changes in Net Assets. Inventory and Prepaid Items Inventory consists of spare parts and some bulk items, such as sand and salt stored at the Airports, and is stated at the lower of cost or market value, using the first-in, first-out method. Inventories are recorded as expenditures when consumed rather than when purchased. Certain payments to vendors reflect costs applicable to future accounting periods and are recorded as prepaid items in the financial statements. Capital Assets Personal property, the ownership of which was transferred from the United States Government to the Airports Authority on June 7, 1987, is recorded at fair value at the date of transfer. Assets acquired subsequent to the transfer are stated at historical cost and include the expense of federal grants to construct and improve the facilities of the Airports Authority. The costs for property and facilities include net interest 37
45 expense incurred from the date of issuance of the debt to finance construction until the completion of the capital project (See Notes F and N). Tenants have funded construction and improvements of airport facilities from their own working capital. Under agreements with the Airports Authority, the property reverts to the Airports Authority upon termination or expiration of the Airport Use Agreement and Premises Lease (the Agreement). Terms range from 15 to 40 years. These assets obtained by the Airports Authority are recorded at fair market value as of date of transfer. Major improvements and replacements of property are capitalized. Maintenance, repairs, and minor improvements and replacements are expensed as incurred. Provision for depreciation has been calculated using the straight-line method over the estimated useful lives of the assets. The estimated useful lives and corresponding capitalization thresholds are as follows: Threshold Equipment 5-7 years $10,000 Motor Vehicles 3-5 years 10,000 Buildings years 25,000 Systems and Structures years 25,000 Impaired Capital Assets In accordance with GASB Statement No. 42, Accounting and Financial Reporting for Impairment of Capital Assets and for Insurance Recoveries, capital assets that have potential for meeting the definition of impairment are identified and tested for impairment. Permanently impaired capital assets that will continue to be used by the Airports Authority are written down to the measured impaired value. The carrying amount of impaired capital assets that are idle are disclosed in the notes to the financial statements and impaired capital assets that are no longer used by the Airports Authority are reported at the lower of carrying value or fair value. Intangible Assets In accordance with GASB Statement No. 51, Accounting and Financial Reporting for Intangible Assets, intangible assets are recognized as capital assets in the statement of net assets if they are identifiable. The amortization of intangible assets is determined by legal or contractual provisions. If there are no factors that limit the useful life of an intangible asset, these assets may be considered to have indefinite lives and no amortization of the costs occurs. Intangible assets with indefinite lives are presented in the Statement of Net Assets as a component of Land and other non-depreciable assets. The Airports Authority is in the practice of amortizing the cost of internally developed software and other assets as required in GASB No. 51, and identifying certain assets such as easements as having indefinite lives. No prior year restatements were required in the year of implementation. Bond Issuance Costs Bond issuance costs represent expenses incurred in the process of issuing bonds and are amortized over the life of the related bond issue, using the interest method. 38
46 Long-Term Debt Refundings The Airports Authority periodically refunds its debt. The difference between the reacquisition price and the net carrying amount of the old debt is deferred and amortized as a component of interest expense over the life of the old or new debt, whichever is shorter. The amount deferred is reported as a deduction from the new debt liability. Compensated Absences The Airports Authority employees are granted paid vacation at rates of 13 to 30 days per year, depending on their length of employment. General employees may accumulate up to a maximum of 30 days or 240 hours. Employees exceeding a specified pay scale, executive type employees, are entitled to accumulate up to 480 hours or 60 days. Upon termination, employees are paid for any unused accumulated vacation. The accumulated vacation is recorded as a liability when earned and is reflected in accrued expenses. The calculation of the liability is based on the pay or salary rates in effect as of the end of the fiscal period, normally the year ended December 31. An additional amount has been accrued for the liability of salary related payments. Such salary related payments include the employer s share of social security, medicare and unemployment taxes and the employer s contributions to the Airports Authority retirement and pension plans. Balance as of December 31, 2006 $ 6,245,329 Vacation used during the year (6,348,800) Vacation earned during the year 6,421,043 Balance as of December 31, 2007 $ 6,317,572 The Airports Authority employees earn 13 days of sick leave per year. Unused sick leave for employees enrolled in the Airports Authority s retirement plan is counted at retirement as additional time worked for calculation of the pension benefit. Arbitrage - Rebate Liability The United States Treasury has issued regulations on calculating the rebate due to the United States Government on arbitrage profits and determining compliance with the arbitrage rebate provisions of the Tax Reform Act of Arbitrage profits arise when the Airports Authority temporarily invests the proceeds of tax exempt debt in securities with higher yields. The Airports Authority had no estimated liability on December 31, 2007 and no estimated liability on December 31, Capital Contributions - Passenger Facility Charges (PFCs) In 1990, Congress approved the Aviation Safety and Capacity Expansion Act which authorized domestic airports to impose a PFC on enplaning passengers. In May 1991, the FAA issued the regulations for the use and reporting of PFCs. PFCs may be used for airport projects that meet at least one of the following criteria: preserve or enhance safety, security, or capacity of the national air transportation system; reduce noise or mitigate noise impacts resulting from an airport; or furnish opportunities for enhanced competition between or among carriers. 39
47 The Airports Authority was granted permission to begin collecting a $3.00 PFC effective November 1, 1993, at Reagan National and January 1, 1994, at Washington Dulles. The charges, less an administrative fee charged by the airlines for processing, are collected by the airlines and remitted on a monthly basis to the Airports Authority. Due to their restricted use, PFCs are categorized as non-operating revenues and are accounted for on the accrual basis. The Airports Authority applied for and received approval in February 2001, to increase the PFC collection from $3.00 to $4.50, effective May Capital Contributions - Federal and State Grants The Airports Authority receives federal and state grants in support of its Capital Construction Program (CCP). The federal program provides funding for airport development, airport planning and noise compatibility programs from the Airport and Airways Trust Fund in the form of both entitlement and discretionary grants for eligible projects. The Commonwealth of Virginia also provides discretionary funds for capital programs. Grants for capital asset acquisition, facility development, rehabilitation of facilities and long-term planning are reported in the Statements of Revenues, Expenses and Changes in Net Assets, after non-operating revenues and expenses as capital contributions. Management Estimates The preparation of financial statements in conformity with accounting principles generally accepted in the United States of America requires management, where necessary, to make estimates and assumptions that effect the reported amounts of assets and liabilities and disclosure of contingent assets and liabilities at the date of the financial statements, and the reported amounts of revenues and expenses during the reporting period. Actual results could differ from those estimates. Reclassifications Certain amounts in the 2006 financial statements have been reclassified to conform to the current year s presentation. B. DEPOSITS AND INVESTMENTS Deposits The Airports Authority s investment policy requires that deposits in excess of the federally insured amount be held at institutions with a LACE (Liquidity, Asset Quality, Capital and Earnings) Financial Institutions Rating service rating B or above. In the event a financial institution s rating falls below this level, the deposits are reduced to the federally insured amount. The Airports Authority s practice is to sweep all demand deposits at the close of each business day into overnight repurchase agreements. As of December 31, 2007 and 2006, the Airports Authority had various Certificates of Deposit in the amount of $6,300,000 and $6,300,000, respectively, that were not covered by insurance and were not collateralized with securities held by the pledging financial institutions. These Certificates of Deposit are held at 40
48 institutions with a LACE Financial Institutions Rating service of B or above. These Certificates of Deposit are part of the Airports Authority s Link Deposit Program whereby a portion of the reserves funds are deposited with banks that have an outstanding Community Reinvestment Act rating. The Airports Authority maintains multiple imprest cash funds in certain departments at each airport. These amounts are not covered by insurance and are not collateralized. These funds totaled $126,910 and $130,800 as of December 31, 2007 and 2006, respectively. In addition, small deposits in the Airports Authority s flexible spending account were not covered by insurance and not collateralized. These funds totaled $23,306 and $2,859 as of December 31, 2007 and 2006, respectively. Investments The Airports Authority had the following investments in its portfolio as of December 31, 2007: Weighted Carrying Average 2007 Investments Credit Rating 1 Value Maturity (years) % of Portfolio Treasury Aaa/AAA $ 34,988, % Fannie Mae Aaa/AAA 219,239, % Freddie Mac Aaa/AAA 135,404, % Farmer Mac Aaa/AAA 15,433, % Federal Home Loan Bank Aaa 215,170, % Commercial Paper A-1/P-1 87,101, % MBIA Guaranteed Invest Contract 2 Aa2/AA 36,274, % FSA Guaranteed Invest Contract 2 Aaa/AAA 67,075, % Bank of America-Forward Purchase AA2/AA- 7,716, % Agreement Overnight Repurchase Agreements 3 A-1/P-1 13,771, % Debt Service Reserve Repurchase Agreements: Bank of America Repo AA2/AA- 16,333, % Morgan Stanley Repo Aa3/AA- 72,406, % $ 920,915, % 41
49 The Airports Authority had the following investments in its portfolio as of December 31, 2006: Weighted Carrying Average 2006 Investments Credit Rating 1 Value Maturity (years) % of Portfolio U.S. Treasury Bonds/Notes $ 147,016, % Fannie Mae Aaa/AAA 183,466, % Freddie Mac Aaa/AAA 214,039, % Federal Home Loan Bank Aaa 48,937, % Commercial Paper A-1/P-1 34,788, % MBIA Guaranteed Invest Contract 2 Aa2/AA 36,274, % FSA Guaranteed Invest Contract 2 Aaa/AAA 25,849, % Bank of America-Forward Purchase AA2/AA- 7,716, % Agreement Overnight Repurchase Agreements 3 A-1/P-1 16,221, % Debt Service Reserve Repurchase Agreements: Bank of America AA2/AA- 16,333, % Morgan Stanley Aa3/AA- 72,406, % $ 803,051, % 1 The ratings in this table are from Moody s and S&P, respectively. 2 Underlying rating of the counterparties. 3 Collateralized by Federal Agency Notes. Credit Risk Credit Risk is the risk that the Airports Authority will lose money because of the default of the security of the issuer or investment counterparty. The primary objectives of the Airports Authority s investment policy are the safety of capital, the liquidity of the portfolio and the yield of investments. Bond proceeds (See Note E) may be invested in securities as permitted in the bond indentures, otherwise, assets of the Airports Authority may be invested in United States Treasury securities; short-term obligations of the United States Government agencies; short term obligations of the Commonwealth of Virginia, the State of Maryland, and the District of Columbia; certificates of deposit with banks that have a LACE rating of B or better, or that are fully insured or collateralized; prime commercial paper rated A1 and P1 by Standard & Poor s Rating Services (S&P) and Moody s, respectively; prime bankers acceptance notes; repurchase agreements whose underlying collateral consists of the foregoing; money market or mutual funds or other such securities or obligations that may be approved by the Finance Committee by modification of the Airports Authority s policy. The table above shows the fair value and the credit quality of the Airports Authority s investment portfolio, by investment type as of December 31,
50 Custodial Credit Risk Custodial credit risk is the risk that, in the event of a failure of the counterparty, the Airports Authority would not be able to recover the value of its deposits, investments or collateral securities that were in the possession of an outside party. Deposits are exposed to custodial credit risk if they are uninsured and uncollateralized. Investment securities are exposed to custodial credit risk if they are uninsured or not registered in the name of the Airports Authority and are held by either the counterparty or the counterparty s trust department or agent but not in the Airports Authority s name. The Airports Authority s investment policy requires securities be insured or registered investments, or securities held by the Airports Authority or its agent in the Airports Authority s name. As of December 31, 2007 and 2006, all the Airports Authority s securities are held by the Airports Authority or its agent in the Airports Authority s name and are fully insured or registered investments. Repurchase agreements and guaranteed investment contracts are required to be collateralized by the counterparty at 103%, and the Airports Authority requires the collateral to be Authorized Investments as described in the Investment Policy and the Master Bond Indenture. The Airports Authority s forward purchase agreement is collateralized at 100% with securities delivered monthly. The collateral is required to be approved Airports Authority investments as described in the Master Bond Indenture. The fair value of the collateral for overnight repurchase agreements was $14,063,881 on December 31, The fair value of the collateral for the guaranteed investment contracts was $112,127,236 on December 31, The fair value of the collateral for the forward purchase agreements was $7,716,000 on December 31, All the collateral for these contracts was held by the Airports Authority s agent in the Airports Authority s name. The fair value of the collateral for the Debt Service Reserve repurchase agreements was $96,212,949 as of December 31, Interest Rate Risk The Airports Authority s investment policy is designed to maximize investment earnings, while protecting the security of the principal and providing adequate liquidity. The overriding policy for investment decisions is to have funds available as needed for construction and general operating expenses. The Airports Authority s investment committee meets quarterly and determines the investment horizon for each fund based on the current construction or operating needs and the prevailing market conditions. Each investment transaction shall seek to first ensure that capital losses are avoided, whether they are from securities defaults or erosion of market value. The Airports Authority manages interest rate risk by managing the weighted average maturity of each portfolio type to best meet liquidity needs. The Bank of America Forward Purchase Agreement pays a variable interest rate of 75.5 basis points over the BMA Municipal Swap Index yield and is reset weekly. The collateral is comprised of Federal Agency notes maturing monthly on the variable rate s (Series 2003D Bonds) interest payment date. (See Note V) 43
51 Concentration of Credit Risk The Airports Authority as detailed above is limited to investments allowed by the bond indentures and the investment policy. However, the Investment Policy does not limit the aggregation of investments in any one type of security. There are providers of securities in which the Airports Authority has invested individually more than 5% of the total portfolio. In accordance with the provisions of GASB Statement No. 31, Accounting and Reporting For Certain Investments and For External Investments Pools, investments with an original maturity greater than one year are recorded at their fair value with all investment income, including changes in the fair value of investments, reported as investment income in the financial statements. As permitted by GASB Statement No. 31, investments with an original maturity of less than one year are carried at amortized cost. Fair values are determined through quoted market prices. The tables below present the Airports Authority s investments in accordance with GASB Statement No. 31: December 31, 2007 Carrying Cost Value Securities with original maturity 1 year and over $289,056,134 $289,289,904 Securities with original maturity less than 1 year 637,740, ,625,992 $926,796,323 $920,915,896 December 31, 2006 Carrying Cost Value Securities with original maturity 1 year and over $245,330,597 $245,015,309 Securities with original maturity less than 1 year 566,064, ,035,906 $811,395,290 $803,051,215 Change in carrying value from December 31, 2006 to December 31, 2007 Carrying value at December 31, 2007 $ 920,915,896 Add: Proceeds from investments sold in ,523,983,618 Less: Cost of investments purchased in 2007 (1,619,571,459) Less: Carrying value at December 31, 2006 (803,051,215) Change in carrying value of investments $ 22,276,840 Change in carrying value from December 31, 2005 to December 31, 2006 Carrying value at December 31, 2006 $ 803,051,215 Add: Proceeds from investments sold in ,599,540,223 Less: Cost of investments purchased in 2006 (1,711,213,018) Less: Carrying value at December 31, 2005 (675,987,045) Change in carrying value of investments $ 15,391,375 44
52 Reconciliation to Comparative Statements of Net Assets A reconciliation of deposits and investments to the comparative statements of net assets is as follows: December 31, Deposits $ 16,058,217 $ 8,746,591 Money Market 199,602, ,941,980 Certificates of Deposit 7,000,000 7,000,000 Securities 920,915, ,051,215 $1,143,576,505 $1,058,739,786 Cash and cash equivalents $ 36,128,525 $ 26,013,856 Cash and cash equivalents, restricted 173,596, ,855,164 Passenger facility charges, restricted cash 15,202,225 14,152,717 Investments, restricted 329,304, ,740,541 Investments 230,873, ,608,097 Long-term investments 80,463,199 29,973,880 Long-term investments, restricted 278,008, ,395,532 $1,143,576,505 $1,058,739,786 C. INTEREST RATE SWAPS During the year ended December 31, 2001, the Airports Authority entered into two forward starting interest rate swap agreements (the 2001 Swaps) to modify interest rates on future outstanding debt. In 2002, the 2001 Swaps were used to hedge $241.8 million of the Series 2002C Bonds. Based on the swap agreement, the Airports Authority owes interest calculated at a fixed rate of 4.45% and 4.46% to the counter parties to the 2001 Swap, Lehman Brothers and Merrill Lynch. In return, the counter parties owe the Airports Authority interest based on a variable rate equal to 72% of LIBOR (London International Bank Offered Rate). Only the net difference in interest payments is actually exchanged with the counter parties. The Airports Authority continues to pay interest to the bondholders at the variable rate provided by the Bonds, and during the term of the swap agreement, the Airports Authority pays the difference between the fixed rate on the 2001 Swaps and 72% of LIBOR. On May 13, 2005, the Airports Authority entered into forward floating-to-fixed interest rate swap agreements (collectively the 2005 Swaps ) with Wachovia Bank, N.A. and Bank of Montreal. The 2005 Swaps that had an effective date of October 1, 2006 and notional amounts of $65.0 million and $35.0 million respectively, were amended on August 30, The Airports Authority amended the 2005 Swaps with Wachovia Bank and Bank of Montreal to provide protection against rising interest rates for a portion of the financings the Airports Authority expects to undertake in The 2005 Swaps now have an effective date of October 1, 2008 and notional amounts of $65.0 million with Wachovia Bank, N.A. and $35.0 million with Bank of Montreal. Based on the Swap agreements, the Airports Authority owes interest calculated at a fixed rate of 3.84% to these counterparties of the 2008 Swaps. In return, the counterparties owe the Airports Authority interest based on a variable rate equal to 72.0% of the one month U.S. dollar LIBOR-BBA. Only the net difference in interest payments is actually exchanged with the counterparties. In September 2007, 45
53 the Airports Authority amended the 2005 Swap Agreement with a start date of October 1, 2007, and extended the start date of $75.0 million with Bank of Montreal to October 1, 2008, and $125 million with Wachovia to October 1, In conjunction with this amendment, the Airports Authority monetized the then unrealized increase in the market value of this swap in September 2007, which resulted in the recognition of a realized gain of $2.06 million. On July 11, 2006, the Airports Authority entered into forward floating-to-fixed interest rate swap agreements (collectively, the 2006 Swaps ) with Bear Stearns Companies, Inc., Lehman Brothers, Wachovia Bank and Bank of America to provide protection against rising interest rates for a portion of the financings the Airports Authority expects to undertake in 2009 and 2010 to fund ongoing capital needs. The 2006 Swaps that have an effective date of October 1, 2009 have notional amounts of $190.0 million and $110.0 million with Bear Stearns and Bank of America, respectively. Based on the Swap agreement, the Airports Authority owes interest calculated at a fixed rate of 4.099% to the counterparties of the 2006 Swaps, Bear Stearns and Bank of America. In return, these counterparties owe the Airports Authority interest based on a variable rate equal to 72.0% of U.S. dollar LIBOR-BBA. Only the net difference in interest payments is actually exchanged with the counterparties. The 2006 Swaps that have an effective date of October 1, 2010 have notional amounts of $170.0 million and $80.0 million with Wachovia Bank and Lehman Brothers, respectively. Based on the Swap agreement, the Airports Authority owes interest calculated at a fixed rate of 4.112% to these counterparties of the 2006 Swaps, Wachovia Bank and Lehman Brothers. In return, these counterparties owe the Airports Authority interest based on a variable rate equal to 72.0% of U.S. dollar LIBOR-BBA. Only the net difference in interest payments is actually exchanged with the counterparties. All of the Airports Authority s interest rate swap agreements are recognized on the Statement of Net Assets in investments at fair value. Changes in the fair value of the Airports Authority s interest rate swaps agreements are recorded as unrealized gains or losses on the Statement of Revenue, Expenses and Changes in Net Assets. In addition, net interest expenditures are recorded in the financial statements. The fair value of the Airports Authority s Swaps as of December 31, 2007 and 2006 are as follows: December 31, Net Change For Swaps Effective date October 1, 2002 $ (16,150,187) $ (11,294,622) $ (4,855,565) 2005 Swaps Effective date October 1, 2008 (1,860,878) 1,075,175 (2,936,053) Effective date October 1, 2011 (1,409,153) 1,952,168 (3,361,321) Effective date October 1, 2008 (3,616,583) (1,056,748) (2,559,835) 2006 Swaps Effective date October 1, 2009 (16,191,075) (10,057,145) (6,133,930) Effective date October 1, 2010 (11,069,604) (7,692,351) (3,377,253) $ (50,297,480) $ (27,073,523) $ (23,223,957) 46
54 D. ACCOUNTS RECEIVABLE Trade accounts receivable consists of the following: December 31, Trade accounts receivable $ 44,188,113 $ 24,458,160 Less: allowance for doubtful accounts (988,803) (1,167,672) $ 43,199,310 $ 23,290,488 On September 14, 2005, Delta and its affiliates and Northwest and its affiliates filed for bankruptcy and remained in bankruptcy throughout The Airports Authority s accounts receivable included $1.65 million in pre-petition debt for these airlines. In 2007, both Delta and Northwest emerged from bankruptcy and satisfied their pre-petition debt. On December 24, 2007, MAXjet filed for bankruptcy. The Airports Authority s accounts receivable included $141,953 in pre-petition debt for this airline. The Airports Authority has sufficient reserves to cover this debt. The Airports Authority s accounts receivables are 34% trade receivables due from concessionaires and airlines. The remaining 66% are notes and other receivables such as interest receivable and amounts due from the Commonwealth of Virginia for reimbursement of costs related to the Dulles Toll Road and Metrorail Extension Projects. (See Note U) E. RESTRICTED ASSETS The Master Indenture securing the Revenue Bonds of the Airports Authority, requires segregation of certain assets into restricted accounts. The Airports Authority has also included PFC assets in restricted assets. Restricted assets consist of the following: December 31, Construction $ 425,887,269 $ 425,520,628 Debt service reserve accounts 278,008, ,395,532 Interest accounts 54,345,763 37,955,267 Sinking fund accounts 22,667,937 20,119,810 Passenger facility charge accounts 15,202,225 14,152,717 Passenger facility charges and grant receivables 9,354,533 11,258,351 Bond issuance costs 60,302,530 55,362,846 $ 865,768,393 $ 827,765,151 The construction accounts include the funds available for the design and construction of capital improvements for the Airports. The debt service reserve accounts contain the maximum amount of required principal payments for the bonds scheduled to come due in one year. The debt service reserve accounts are revalued each year in October. Any amounts in excess of the debt service requirements are transferred to the 47
55 applicable construction fund or taken into the revenue funds of the Airports Authority if the construction funds have been expended. If the debt service reserve is undervalued, the Airports Authority transfers funds into the accounts. The debt service reserve accounts were over funded by $2,866,392 as of December 31, 2007 and $2,370,883 as of December 31, The interest account contains the interest amounts required for the semi-annual interest payments. The sinking fund accounts represent the principal for the annual October bond payments. The PFC and grant receivables represent amounts collectable at the years ended December 31, 2007 and The bond issuance costs are costs incurred and paid by bond funds to complete the bond deal. They are amortized over the life of the related bond issue. F. CHANGES IN CAPITAL ASSETS A summary of changes in capital assets for the years ended December 31, 2007 and 2006 are as follows: Beginning Ending Balance Transfers and Transfers and Balance January 1, 2007 Additions Deletions December 31, 2007 Capital assets not being depreciated Construction in progress $ 1,389,283,792 $ 736,046,481 $ (209,448,372) $ 1,915,881,901 Land and other non-depreciable assets 118,144,707 3,390, ,534,710 Total capital asset not being depreciated 1,507,428, ,436,484 (209,448,372) 2,037,416,611 Other capital assets Equipment 52,482,671 9,037,417 (2,059,995) 59,460,093 Motor vehicles 89,677,779 2,701,208 (103,457) 92,275,530 Buildings 2,282,922,260 47,073,837 (14,282,334) 2,315,713,763 Systems and structures 1,280,266, ,607,669-1,440,873,719 Total other capital assets 3,705,348, ,420,131 (16,445,786) 3,908,323,105 Less accumulated depreciation: A/D equipment 41,793,631 3,825,832 (2,002,281) 43,617,182 A/D motor vehicles 72,308,759 3,273,681 (124,338) 75,458,102 A/D buildings 524,406,317 65,764,309 (1,440,621) 588,730,005 A/D systems & structures 555,699,891 66,125, ,825,106 Total accumulated depreciation 1,194,208, ,989,037 (3,567,240) 1,329,630,395 Other capital assets, net 2,511,140,162 80,431,094 (12,878,546) 2,578,692,710 Totals $ 4,018,568,661 $ 819,867,578 $ (222,326,918) $ 4,616,109,321 48
56 Beginning Ending Balance Transfers and Transfers and Balance January 1, 2006 Additions Deletions December 31, 2006 Capital assets not being depreciated Construction in progress $ 978,540,556 $ 665,451,285 $ (254,708,049) $ 1,389,283,792 Land and other non-depreciable assets 105,349,826 12,794, ,144,707 Total capital asset not being depreciated 1,083,890, ,246,166 (254,708,049) 1,507,428,499 Other capital assets Equipment 48,752,599 5,147,237 (1,417,165) 52,482,671 Motor vehicles 81,288,656 10,487,233 (2,098,110) 89,677,779 Buildings 2,102,466, ,456,138-2,282,922,260 Systems and structures 1,191,412,732 88,853,318-1,280,266,050 Total other capital assets 3,423,920, ,943,926 (3,515,275) 3,705,348,760 Less accumulated depreciation: A/D equipment 39,923,443 3,302,112 (1,431,924) 41,793,631 A/D motor vehicles 70,566,848 3,826,112 (2,084,201) 72,308,759 A/D buildings 460,088,307 64,318, ,406,317 A/D systems & structures 493,968,600 61,731, ,699,891 Total accumulated depreciation 1,064,547, ,177,525 (3,516,125) 1,194,208,598 Other capital assets, net 2,359,372, ,766, ,511,140,162 Totals $ 3,443,263,293 $ 830,012,567 $ (254,707,199) $ 4,018,568,661 For the year ended December 31, 2007, interest costs of $87,770,624 less interest earned of $20,117,143 were recorded as part of the cost of construction in progress. For the year ended December 31, 2006 interest costs of $73,797,176 less interest earned of $12,875,145 were recorded as part of the cost of construction in progress. Depreciation and amortization expense for the years ended December 31, 2007 and 2006 was $142,030,354 and $133,106,378 respectively. The Airports Authority s construction in progress account includes only costs expended on work for projects that are in an active status. Other capital assets, buildings, includes an Automated People Mover Maintenance Facility that was completed in 2006, but not put into service as of the end of This asset ($36.9 million as of December 31, 2007) is available to the train operator for fit-out but is not in use for its intended purpose and is therefore idle as of December 31, No depreciation expense has been recognized for this asset during the years ended December 31, 2007 and The Airports Authority initiated its Capital Construction Program (CCP) in 1988 to expand, modernize and maintain the Airports. Under the CCP, the Airports Authority has constructed and will continue to construct many of the principal elements of the Reagan National and Washington Dulles Master Plans. Major projects completed under the Master plan at Reagan National include, among others, two new main terminals connected to a Metrorail station, three parking garages and an airport traffic control tower. Major capital projects completed under the CCP at Washington Dulles include, among others, expansion and rehabilitation of the Main Terminal, construction of Concourse A and B, and international arrivals building and runway and road improvements, two daily parking garages and an air traffic control tower. 49
57 In 2000, the Airports Authority approved an expansion of the CCP for Washington Dulles referred to as the Washington Dulles Development (d 2 ) program expected to be completed in In the aftermath of the events of September 11, 2001 the Airports Authority reexamined the CCP program and revised the expected completion date to 2011 and delayed the start dates of several projects and deferred some other projects. However, due to the growth in passenger enplanements at Washington Dulles in recent years the CCP program has been rescheduled to 2016 and an additional $2.1 billion of projects were added. In total, the CCP program is expected to cost $7.1 billion. The projects currently in the program at Washington Dulles include an automated people mover system (APM) to replace the existing mobile lounges which will move passengers between the Main Terminal and Concourses A, B and C, construction of the Tier 2 Concourse, construction of a 4th runway, a federal inspection facility and a consolidated rental car facility. At Reagan National, projects include a south hangar line and runway overlay projects. Of the remaining projects, design plans and costs are evaluated on a periodic basis and should it be determined that the projects will not go forward or the designs are no longer usable, the associated costs will be written off. G. ACCOUNTS PAYABLE The accounts payable and accrued expenses balance as of December 31, 2007, is 58.39% payable from restricted funds and 41.61% payable from the general operating fund. The restricted fund payables are primarily trade accounts payable related to the Airports Authority s ongoing construction program. Building construction costs payable are $118.5 million as of December 31, 2007 and $77.0 million as of December 31, The unrestricted accounts payables and accrued expenses are 6.9% accrued salaries and benefits, 80.3% payables to vendors, 9.75% deferred revenue and expenses, with the remaining 3.05% reserves for insurance claims. H. PENSION PLANS AND DEFERRED COMPENSATION PLAN The Airports Authority participates in two United States Government pension plans: the Civil Service Retirement System (CSRS) and the Federal Employees Retirement System (FERS). Each is considered a cost-sharing multiple employer public employee retirement system. Employees hired before December 31, 1983 are members of the CSRS unless they elected to transfer to FERS either before December 31, 1987 or during the special enrollment period from July 1, 1998, through December 31, In addition, the Airports Authority maintains single employer-defined benefit pension plans that cover all of its police and fire employees and its regular employees hired on or after June 7, 1987, excluding employees working less than 20 hours a week and other temporary employees. 50
58 Government Pension Plans Under the CSRS, employees contribute 7.0% of their base pay (7.5% for firefighters) and the Airports Authority matches the employees contributions. Retirement benefits are based on length of service and the average of the employee s three highest years of base pay. Employees can retire at age 55 with 30 years of service; age 60 with 20 years of service; or age 62 with five years of service. Firefighters can retire at age 50 with 20 years of firefighting service. Retirement annuities range from 7.5% of the average high three-year base pay to a maximum of 80.0% depending on years of service. Effective April 1, 1987, the CSRS added a Thrift Savings Plan. CSRS participants can contribute a percentage of their salary on a tax-deferred basis up to the statutory limit of $15,500 in There are 51 regular employees and 6 police and firefighter employees currently enrolled in CSRS, as of December 31, The FERS provides benefits from three different sources: a Basic Benefit Plan, Social Security, and the Thrift Savings Plan. The Basic Benefit Plan employees deduction ranges from 0.8% of base pay for regular employees to 1.3% for firefighters. The Airports Authority contributes from 10.7% for regular employees to 23.3% for firefighters. There are 44 regular employees and 26 police and firefighter employees currently enrolled in the FERS, as of December 31, Employees retiring under the FERS are entitled to annual maximum retirement benefits equal to 1.1% of the employee's highest three-year average salary for every year of service. Regular employees are eligible for retirement when they have 10 years of service and have reached the minimum retirement age (ranging from 55 to 57 years old), based on a birth date. Firefighters can retire at age 50 with 20 years of firefighting service or at any age with 25 years of service. These employees are entitled to an annual retirement benefit of 1.7% of the employee s highest three-year average salary for every year of service up to 20 years and 1.0% for years of service over 20. FERS participants enrolled in the Thrift Savings Plan can now contribute up to 15.0% of their salary on a tax-deferred basis. The Airports Authority s base payroll for employees covered by the CSRS and the FERS for the year ended December 31, 2007 was $9,274,561. The Airports Authority s total base payroll for all employees was $79,120,133 in Employee contributions for these federal pension plans were $352,401 for 2007, $408,849 for 2006, and $462,373 for The employer contributions for these plans were $1,099,979 for 2007, $1,227,053 for 2006 and $1,307,589 for These contributions represent 100% of required contributions for each of the respective years. In March 2003, the United States Office of Personnel Management (OPM) notified the Airports Authority that they had completed the calculation of the cost of providing enhanced retirement benefits to the Airports Authority s police officers under Public Law Provisions of this law allowed the Airports Authority s police officers that were employed while the Airports Authority was part of the United States Department of Transportation, to elect to be treated as law enforcement officers for purposes of retirement. OPM calculated that the past service cost with interest is $2.9 million and according to the law, is payable in five annual installments with the first payment of $646,493, which was made on May 31, 2003, the second payment of $646,493, which was made on February 11, 2004, and the third payment of $646,493, which was made on June 15, The fourth annual installment of $646,493 was made on May 12, The final installment of $646,493 was paid on April 12,
59 The U.S. Office of Personnel Management administers both the CSRS and the FERS. Copies of the financial statements of these pension plans may be obtained from the United States OPM. Actuarial information for these federal pension plans is not available. The Airports Authority Pension Plans Effective January 1, 1989, the Airports Authority established a retirement benefits program for employees hired on or after June 7, 1987, which provides income in the event of retirement or death where a surviving spouse remains. Employee coverage and service credit was retroactive to June 7, The program includes the Airports Authority Retirement Plan (covering regular employees) and the Airports Authority Retirement Plan for Police Officers and Firefighters (the Plans), both single employer defined benefit plans. Any amendment to these plans must be approved by the Airports Authority s Board. As of December 31, 2007, the number of employees participating in the Plans was: Current participants Regular Police/Fire Total Vested Non-vested Retirees/disabled employees currently receiving benefits Terminated vested participants Total 1, ,567 The Airports Authority contributed 6.6% to the Regular Plan and 11.8% to the Police and Fire Plan in The Airports Authority s base payroll in 2007 for the Regular Plan was approximately $52.5 million and $17.4 million for the Police and Fire Plan. The Airports Authority s base payroll in 2006 for the Regular Plan was approximately $48.1 million and $15.7 million for the Police and Fire Plan. In 2007, the Airports Authority contributed $3,508,663 to the Regular Plan and $2,050,272 to the Police and Fire Plan. In 2006, the Airports Authority contributed $2,978,907 to the Regular Plan and $1,803,848 to the Police and Fire Plan. Employees do not contribute to the Regular Plan. The Plans provide retirement benefits as well as death benefits. Regular employees who retire at or after age 60 with 5 years of credited service are entitled to an annual retirement benefit, payable monthly for life, in an amount equal to 1.2% of final-average salary up to covered compensation and 1.6% of final-average salary which is above covered compensation for each year of credited service (maximum 30 years). Final-average salary is the average of the employee's highest consecutive 78 pay periods in the most recent 260 pay periods, while covered compensation is the 35-year average of the Social Security Wage Bases ending with the year in which the participant attains Social Security normal retirement age. A pre-retirement surviving spouse benefit is payable in the event of death, equal to 50.0% of the benefit which would have been payable had the participant retired, provided the participant had at least five years of service. Benefits can be received as early as age 55 with five years of service with a 5.0% reduction for each year the participant is younger than age 60. Benefits are also adjusted to the lesser of one-half of the CPI or 4.0%. The benefits to police officers and firefighters become payable at age 55 with five years of service or at any age with 25 years of service. Benefits are not reduced if retirement is at or after age 50. The benefit is 2.0% 52
60 of the final average earnings for service up to 25 years, and 1.0% of the final average earnings for service between 25 and 30 years. Withdrawal, death, and cost of living benefits are similar to those available to regular employees. Police officers and firefighters are required to contribute 1.5% of base pay per year of participation, which is accumulated with a 5.0% interest rate and returned when a benefit is forfeited. The Airports Authority contributes the remaining amounts necessary to fund the Plans using the entry age normal actuarial method in addition to an amount to amortize any unfunded liability. Contributions Required and Made The Airports Authority s funding policy is to provide for periodic employer contributions at actuarially determined rates that, expressed as percentages of annual covered payroll, are designed to accumulate sufficient assets to pay benefits when due. Employer contributions are determined in accordance with the plan provisions and approved by the Airports Authority s Board. Level percentages of payroll employer contribution rates are determined using the entry age actuarial funding method shown in dollars in the following table. Unfunded actuarial accrued liabilities are being amortized over a period of 30 years on an open basis. Annual Pension Cost and Net Pension Obligation The Airports Authority s pension obligation (asset) for its General Employees and Police and Firefighters pension plans as of December 31, 2007, 2006, 2005 and for the years then ended, which are based on the then latest actuarial valuations available, are as follows: 2007 General Police and Employees Firefighters Annual required contribution (ARC) $ 3,433,086 $2,084,003 Interest on net pension obligation (123,248) (39,367) Adjustment to annual required contribution 129,433 41,343 Annual pension cost 3,439,271 2,085,979 Contributions made 3,508,663 2,050,272 Change in net pension obligation (69,392) 35,707 Net pension obligation (asset) beginning of year (1,613,349) (558,624) Net pension obligation (asset) end of year $(1,682,741) $ (522,917) 53
61 2006 General Police and Employees Firefighters Annual required contribution $ 3,204,841 $1,821,394 Interest on net pension obligation (138,467) (4,229) Adjustment to annual required contribution 145,417 4,441 Annual pension cost 3,211,791 1,821,606 Contributions made 2,978,907 1,803,848 Change in net pension obligation (asset) 232,884 17,758 Net pension obligation (asset) beginning of year (1,846,233) (576,382) Net pension obligation (asset) end of year $(1,613,349) $ (558,624) 2005 General Police and Employees Firefighters Annual required contribution $ 2,525,154 $1,654,845 Interest on net pension obligation (100,969) (21,145) Adjustment to annual required contribution 106,037 22,206 Annual pension cost 2,530,222 1,655,906 Contributions made 3,030,185 1,950,353 Change in net pension obligation (asset) (499,963) (294,447) Net pension obligation (asset) beginning of year (1,346,270) (281,935) Net pension obligation (asset) end of year $ (1,846,233) $ (576,382) Three year trend information is as follows: General Employees Retirement Plan Police Officers and Firefighters Plan Annual Percentage Net Pension Annual Percentage Net Pension Year Pension of APC Obligations Pension of APC Obligations Ended Cost (APC) Contributed (Assets) Cost (APC) Contributed (Assets) 2005 $2,530, % ($1,846,233) $1,655, % ($576,382) 2006 $3,211, % ($1,613,349) $1,821, % ($558,624) 2007 $3,439, % ($1,682,741) $2,085, % ($522,917) Funding Status The actuarial accrued liability was determined from the then most recently available actuarial valuation of the Plans. Significant actuarial assumptions used in determining the actuarial accrued liability include: (a) a rate of return on the investment of the present and future assets of 7.5% per year compounded annually, (b) projected salary increases ranging from 5.5% to 9.5% based on years of service and anticipated inflation, (c) post-retirement benefit increases of 1.75% per year, (d) for inflation rate, CPI increases of 3.5% per year (e) amortization method of percentage of projected payroll, and (f) amortization period of 30 years, open. The actuarial value of assets is determined using fair market values with changes smoothed over a five-year period. A copy of the actuarial valuations, plan financial statements and plan documents may be obtained by written request to: MWAA, Benefits Department, 1 Aviation Circle, Washington, DC
62 Schedule of Funding Progress Actuarial UAAL as a Actuarial Actuarial Accrued Unfunded Percentage of Valuation Value Liability (AAL) AAL Funded Covered Covered Date of Assets - Entry Age (UAAL) Ratio Payroll Payroll General Employees Retirement Plan 12/31/00 $39,569,099 $29,069,920 $(10,499,179) 136.1% $34,926,769 (30.1)% 12/31/01 44,776,250 33,126,203 (11,650,047) 135.2% 37,458,710 (31.1)% 12/31/02 48,332,275 37,975,594 (10,356,681) 127.3% 39,377,221 (26.3)% 12/31/03 53,164,834 43,202,420 (9,962,414) 123.1% 41,524,933 (24.0)% 12/31/04 58,126,517 46,229,931 (11,896,586) 125.7% 43,199,684 (27.5)% 12/31/05 64,087,361 53,833,003 (10,254,358) 119.0% 48,218,773 (21.3%) 12/31/06 72,341,671 62,195,419 (10,146,252) 116.3% 52,985,414 (19.1%) Police Officers and Firefighters Retirement Plan 12/31/00 $17,262,191 $14,026,353 $(3,235,838) 123.1% $ 8,882,707 (36.4)% 12/31/01 19,772,489 16,145,289 (3,627,200) 122.5% 9,705,378 (37.4)% 12/31/02 21,744,019 19,020,653 (2,723,366) 114.3% 11,487,047 (23.7)% 12/31/03 24,294,170 21,873,198 (2,420,972) 111.1% 12,679,387 (19.1)% 12/31/04 27,168,047 24,474,697 (2,693,350) 111.0% 14,298,016 (18.8)% 12/31/05 30,730,808 28,546,385 (2,184,423) 107.7% 15,462,439 (14.1)% 12/31/06 35,464,226 34,134,852 (1,329,374) 103.9% 17,799,707 (7.5)% Annual Pension Percentage of ARC General Employees Retirement Plan Police Officers and Firefighters Retirement Plan Calendar Annual Required Actual Percentage Annual Required Actual Percentage Year Contribution Contribution Contribution Contribution Contribution Contribution 2001 $2,321,148 $2,602, % $1,232,277 $1,294, % ,084,956 2,410, % 1,280,205 1,356, % ,593,255 2,370, % 1,577,901 1,443, % ,755,413 2,678, % 1,723,233 1,684, % ,525,154 3,030, % 1,654,845 1,950, % ,233,610 3,037, % 1,939,938 1,890, % ,463,046 3,508, % 2,050,272 2,050, % Expressing the actuarial value of assets available for benefits as a percentage of the actuarial accrued liability provides an indication of the Plan s funding status on a going-concern basis. Analysis of this percentage over time indicates whether the Plan is becoming financially stronger or weaker. Generally, the greater this percentage, the stronger the retirement plan. Trends in assets in excess of actuarial accrued liability and annual covered payroll are both affected by inflation. Expressing the actuarial accrued liability in excess of assets as a percentage of annual covered payroll approximately adjusts for the effects of inflation and aids 55
63 analysis of progress made in accumulating sufficient assets to pay benefits when due. Generally, the lower this percentage, the stronger the retirement plan. The comparability of trend information is affected by changes in actuarial assumptions, benefit provisions, actuarial funding methods, accounting policies, the size or composition of the population covered by the Plan, and other changes. Those changes usually affect trends in contribution requirements and in ratios that use the AAL as a factor. Deferred Compensation Plan Effective July 2, 1989, the Airports Authority offered its employees a deferred compensation plan created in accordance with Internal Revenue Code Section 457. The plan, available to all full-time employees, permits employees to defer a portion of their salary until future years. Participation in the plan is optional. The deferred compensation is available to employees at termination, retirement, death, or an unforeseeable emergency. Effective January 1, 1997, the Board voted to enter into a trust agreement with Allfirst Trust (now Manufacturers and Traders Trust Company) (M&T) for the assets of the Deferred Compensation Plan. All assets were transferred to Allfirst Trust during 1997 and accordingly, are not included in the Airports Authority s assets and liabilities. Investments are managed for participants by ICMARC under one of several investment options, or a combination thereof. The choice of the investment option(s) is made by the participant. The investments are held in trust by M&T. Money Purchase Pension Plan Effective December 18, 2007, the Airports Authority established a Money Purchase Pension Plan in accordance with Internal Revenue Code 401 (a). The Plan is available to all full-time employees. Under the terms of the Money Purchase Plan, the Airports Authority makes contributions on behalf of eligible employees. The amount of contributions made on behalf of eligible employees depends on whether the employee s pension benefit under the Airports Authority s General Employees Retirement Plan or the Airports Authority s Retirement Plan for Police Officers and Firefighters is limited due to compensation limitations imposed by section 4021 (a) (17). Eligible employees may not defer a portion of their salary into the Plan. The Airports Authority serves as trustee of the Plan. The Airports Authority has entered into an agreement with the International City/County Management Association Retirement Corporation (ICMA-RC) to act as an investment advisor to the Plan and to provide record keeping services. In 2007, the Airports Authority paid $44,113 into this Plan. 56
64 I. POSTEMPLOYMENT BENEFITS The Airports Authority Plans In addition to pension benefits, the Airports Authority provides post employment benefits of health, dental and life insurance. The Retired Employees Healthcare Plan (the Plan) is a single-employer defined benefit healthcare, dental and life insurance plan administered by the Airports Authority. The Plan provides medical, dental and life insurance benefits to eligible retirees and their spouses. The Airports Authority s Board initially provided the benefits package to meet requirements of the federal enabling legislation which created the Airports Authority in Through the budget approval process, the Airports Authority has continued to provide these benefits of insurance to retired employees under the Airports Authority group plans for health, dental and life insurance. The Airports Authority can establish and amend benefit provisions of the Plan. As of December 31, 2007, 326 retired employees were receiving life insurance benefits and 312 retired employees were receiving health insurance benefits under these Airports Authority programs. In accordance with GASB Statement No. 43, Financial Reporting for Postemployment Benefit Plans Other Than Pension Plans and GASB Statement No. 45, Accounting and Financial Reporting by Employers for Postemployment Benefits Other Than Pensions, the Airports Authority created in February 2005 an Employee Welfare Benefits Trust. This trust provides a funding mechanism for retiree health, dental and life insurance coverage and other post employment benefits other than pensions. The Airports Authority began funding the trust and fully implemented GASB Statement No. 43 and GASB Statement No. 45 in The contribution requirements of plan members and the Airports Authority for the health and dental insurance are established and may be amended by the management of the Airports Authority. The required contribution is based upon projected pay-as-you-go financing requirements and funding for future benefits. The Airports Authority pays 80% of the total health insurance premiums costs with the remainder paid by the retired employee. For the years ended December 31, 2007 and December 31, 2006 the Airports Authority s health insurance costs for retired employees totaled $3,210,653 and $2,718,957, respectively. Plan participants contributed $626,215 for fiscal year 2007 and $525,879 for fiscal year 2006, or 20 percent of the total premiums, through their required monthly contributions: Monthly Contributions for Retirees Under 65 for 2007 Retiree Plus Retiree Plus Provider Choices Retiree Only Spouse Child(ren) Family Care First BC/BS PPO $90.38 $ $ $ Kaiser Permanente Select HMO $73.22 $ $ $ Care First BC/BS Dental $18.10 $37.52 $34.41 $
65 Monthly Contributions for Retirees Over 65 for 2007 One > 65 Two Party Family Provider Choices Retiree Only One < 65 Medicare Medicare Care First BC/BS PPO $75.15 $ $ $ Kaiser Permanente Non-Senior Advantage $46.09 $ $92.17 $ Care First BC/BS Dental $17.62 $43.27 $29.71 $54.15 The Airports Authority pays 100% of the retired employee s reduced basic and supplemental life insurance. Basic life insurance coverage is reduced to 25% of the employee s life insurance in force at the time of retirement. Supplemental life insurance is a multiple of the basic life insurance (1 to 5 times) that the employee had selected prior to retirement. The supplemental life insurance is reduced at a rate of 2.0% each month so that at the end of 50 months, no supplemental life insurance coverage is in force. Of the 326 retired employees, 54 had supplemental insurance coverage as of December 31, For the year ended December 31, 2007 the life insurance costs for retired employees totaled $210,025. Of the 304 retired employees, 54 had supplemental insurance coverage as of December 31, For the year ended December 31, 2006, the life insurance costs for retired employees totaled $338,104. Annual Other Post Employment Cost and Obligation The Airports Authority s obligations (assets) for its post employment benefit plans as of December 31, 2007, 2006 and for the years then ended, which are based on the then latest actuarial valuations available, are as follows: Medical and 2007 Dental Life Insurance Annual required contribution $ 7,904,439 $ 754,384 Interest on net OPEB obligation - - Adjustment to annual required contribution - - Annual OPEB cost 7,904, ,384 Contributions made 7,754, ,962 Change in net OPEB obligation (asset) 150, Net OPEB obligation (asset) beginning of year (2,360,000) (94,682) Net OPEB obligation (asset) end of year $ (2,210,000) $ (94,260) Medical and 2006 Dental Life Insurance Annual required contribution $ 7,400,000 $ 709,500 Interest on net OPEB obligation - - Adjustment to annual required contribution - - Annual OPEB cost 7,400, ,500 Contributions made 7,400, ,182 Change in net OPEB obligation (asset) - 78,318 Net OPEB obligation (asset) beginning of year (2,360,000) (173,000) Net OPEB obligation (asset) end of year $ (2,360,000) $ (94,682) 58
66 Medical and 2005 Dental Life Insurance Annual required contribution $ 6,390,000 $ 680,000 Interest on net OPEB obligation - - Adjustment to annual required contribution - - Annual OPEB cost 6,390, ,000 Contributions made 8,750, ,000 Change in net OPEB obligation (asset) (2,360,000) (173,000) Net OPEB obligation (asset) beginning of year - - Net OPEB obligation (asset) end of year $ (2,360,000) $ (173,000) Funding Status The Airports Authority began funding the plan in 2005 and, in addition to funding insurance costs for retired employees (see above), contributed $5,170,000, $6,500,000 and $5,200,000 for the years ended December 31, 2007, 2006, and 2005, respectively, to the Trust for medical and dental insurance. The Airports Authority also contributed approximately $550 thousand, $544 thousand and $300 thousand for the years ended December 31, 2007, 2006, and 2005, respectively, to the Trust for life insurance. Schedule of Funding Progress for Medical Insurance Actuarial UAAL as a Actuarial Actuarial Accrued Unfunded Percentage of Valuation Value Liability (AAL) AAL Funded Covered Covered Date of Assets - Entry Age (UAAL) Ratio Payroll Payroll 1/01/05 - $65,790,000 $65,790, % $58,820, % 1/01/06 $ 6,500,000 $76,080,000 $69,580, % $64,100, % 1/01/07 $ 13,090,000 $81,930,000 $68,840, % $69,770, % Schedule of Funding Progress for Life Insurance Actuarial UAAL as a Actuarial Actuarial Accrued Unfunded Percentage of Valuation Value Liability (AAL) AAL Funded Covered Covered Date of Assets - Entry Age (UAAL) Ratio Payroll Payroll 1/01/05 - $5,380,500 $5,380, % $59,739, % 1/01/06 $ 554,100 $5,941,900 $5,387, % $64,148, % 1/01/07 $1,152,000 $6,722,000 $5,570, % $69,770, % Annual Percentage of ARC Medical & Dental Calendar Annual Required Actual Percentage Year Contribution Contribution Contribution 2005 $6,390,000 $8,750, % 2006 $7,400,000 $7,400, % 2007 $7,904,439 $7,754, % 59
67 Annual Percentage of ARC Life Insurance Calendar Annual Required Actual Percentage Year Contribution Contribution Contribution 2005 $680,000 $853, % 2006 $709,500 $631, % 2007 $754,384 $753, % Actuarial valuations of an ongoing plan involve estimates of the value of reported amounts and assumptions about the probability of occurrence of events far into the future. Examples include assumptions about future employment, mortality, and the healthcare cost trend. Actuarially determined amounts are subject to continual revision as actual results are compared with past expectations and new estimates are made about the future. The schedule of funding progress presents multi-year trend information about whether the actuarial value of plan assets is increasing or decreasing over time relative to the actuarial accrued liability for benefits. Actuarial Methods and Assumptions Projections of benefits for financial reporting purposes are based on the substantive plan (the plan as understood by the employer and the plan members) and include the types of benefits provided at the time of each valuation and the historical pattern of sharing the benefit costs between the employer and plan members to that point. The actuarial methods and assumptions used include techniques that are designed to reduce the effects of short-term volatility in actuarial accrued liabilities and the actuarial value of assets, consistent with the long-term perspective of the calculations. The actuarial value of future assets will be determined using fair market values. In the January 1, 2007 actuarial valuation, the entry age actuarial cost method was used. The actuarial assumptions included a 7.5% investment rate of return (net of administrative expenses) and an annual healthcare cost trend rate of 13.0% initially, reduced by decrements to an ultimate rate of 5.0% after ten years. The Life Insurance rate includes a 3.5% inflation assumption. The initial unfunded actuarial accrued liability is being amortized as a level dollar amount over a period of 30 years. A copy of the actuarial valuation and plan document may be obtained by written request to: MWAA, Benefits Department, 1 Aviation Circle, Washington, DC There are no separate stand alone financial reports issued. J. OTHER SHORT TERM LIABILITIES Other short term liabilities included amounts due to the Office of Personnel Management for the Airports Authority s portion of the enhanced retirement benefits to Airports Authority police officers under Public Law Under 636(f) the Airports Authority had to reimburse the Civil Service Retirement and Disability Fund and the Federal Employees Retirement System for supplemental liability resulting from the enactment of the enhanced retirement provisions. The total estimated liability was $3,017,586. Total estimated liability $3,017,586 Payment year 2003 (646,493) Payment year 2004 (646,493) Payment year 2005 (646,493) 60
68 Payment year 2006 (646,493) Balance as of December 31, ,614 Payment year 2007 (646,493) Plus liability for officers not contributing in ,879 Balance as of December 31, 2007 $ - K. CAPITAL DEBT Commercial Paper Notes The Airports Authority s Board adopted Resolution No on April 2, 2000, allowing the issuance of $250,000,000 in Commercial Paper Notes. The principal amount was to pay or provide for certain capital improvements at the airports or refunding other forms of indebtedness principal and interest thereof. On May 2, 2001, the Airports Authority Board adopted Resolution No allowing the issuance of Commercial Paper Notes not to exceed $500,000,000. The Airports Authority currently has in place credit facilities allowing it to draw up to $420 million in Commercial Paper notes at any given time. Series One Commercial Paper Notes are authorized pursuant to the Amended and Restated Eleventh Supplemental Indenture dated as of November 1, 2004 and further amended on March 1, 2005 between the Airports Authority and the Trustee. The Series One CP Notes are structured as Short Term/Demand Obligations under the Indenture and collateralized by certain pledged funds including Net Revenues on parity with the Bonds. They are further collateralized by an irrevocable direct pay letter of credit issued by JP Morgan Chase Bank, which expires in March The Airports Authority s obligation to repay amounts drawn under such letter of credit is collateralized by a promissory note issued by the Airports Authority to JP Morgan Chase Bank and is collateralized by and payable from Net Revenues and other pledged funds on a parity with the Series One CP Notes and the Bonds. As of December 31, 2007 $60 million of the Series One CP Notes were outstanding. The proceeds are being used to provide interim financing for authorized projects at Reagan National and Washington Dulles airports. The weighted average interest rate on the Series One CP Notes was 3.52%. Series Two Commercial Paper Notes are authorized pursuant to the Twenty-second Supplemental Indenture dated as of January 1, 2005, between the Airports Authority and the Trustee. The Series Two CP Notes are structured as Short Term/Demand Obligations under the Indenture and are collateralized by certain pledged funds including Net Revenues on parity with the Bonds. They are further collateralized by an irrevocable direct pay letter of credit issued on several but not joint basis by WestLB AG acting through its New York Branch, individually and as an agent, and Landesbank Baden-Wurttemberg, acting through its New York Branch (collectively, the Banks ), which expires in December 2015, but allows the Banks under certain circumstances to terminate the facility every five years beginning on January 12, The Airports Authority s obligation to repay amounts drawn under such letter of credit is collateralized by a promissory note issued by the Airports Authority to the Banks and is collateralized by and payable from Net Revenues and other pledged funds on parity with the Series Two CP Notes and the Bonds. As of December 31, 2006 and December 31, 2007, the Airports Authority has $200 million in Series Two CP Notes outstanding. The proceeds are used to provide interim financing for authorized projects at Reagan National and Washington 61
69 Dulles. The weighted average interest rate on the Series Two CP Notes at December 31, 2007 was 3.55% on sub-series A and 5.18% on sub-series C. All of the Airports Authority s Commercial Paper Notes are rated P-1 short-term by Moody s, A-1+ short-term by S&P, and F1+ short term by Fitch. Changes in Commercial Paper Notes Balances Balance as of December 31, 2006 $ 200,000,000 Commercial Paper Notes Issued, Series One 60,000,000 Balance as of December 31, 2007 $ 260,000,000 PFC Bank Participation Notes The Airports Authority issued Flexible Term PFC Revenue Notes (bank participation notes) of $495,900,000 to finance PFC approved projects. The bank participation notes have various maturity dates and interest rates that vary from 2.95% to 3.72%. The bank participation notes required the Airports Authority to maintain a reserve account. The reserve account at December 31, 2007 and December 31, 2006 was $5,714,308 and $3,260,274, respectively, and is included in PFCs, restricted cash on the Statements of Net Assets. The bank participation notes are backed by a Bank of America, N.A. letter of credit that expires on November 16, Bank participation notes outstanding at December 31, 2007 and 2006 were $432,000,000 and $400,000,000. Total interest cost for the years ended December 31, 2007 and December 31, 2006 were $16,999,845 and $15,245,780. Changes in PFC Bank Participation Notes Balance as of December 31, 2006 $ 400,000,000 PFC Bank Participation Notes Issued 32,000,000 PFC Bank Participation Notes Refunded - Balance as of December 31, 2007 $ 432,000,000 Bonds Payable A Master Indenture was created in 1990 for the Airports Authority. The Master Indenture was amended effective September 1, 2001, to in part, change the definition of Annual Debt Service to accommodate the issuance of secured commercial paper, to permit the Airports Authority to release certain revenues from the definition of revenues, and to expand the list of permitted investments to include new, safe investment vehicles designed to increase the return on the Airports Authority s investments. Under this amended Master Indenture, all bonds are collateralized by a pledge of Net Revenues of the Airports Authority which is senior to the subordinated pledge given by the Airports Authority in connection with the issuance of its bonds prior to
70 The Airports Authority s long-term bonds issued and outstanding as of December 31, 2007 and 2006 were as follows: Issue Interest Maturing On Outstanding at December 31, Airport System Senior Debt Date Rates October 1 Amount Series 1997A Revenue Bonds 05/15/ % 2007 Series 1997B* Revenue Bonds 05/15/ %-5.750% $ - $ - $ - $ 1,235,000 - $ 169,355,000 Series 1998A Revenue Bonds 06/15/98 Serial 4.250% 2008 $ 495,000 Series 1998B Revenue & Refunding Bonds 06/15/98 Serial 4.500%-5.500% $ 75,165,000 Term 5.000% ,040,000 Term 5.000% ,660,000 Series 1999A Revenue Refunding Bonds 04/15/99 Serial 4.300%-4.500% $ 4,700,000 Term 5.250% ,510,000 Term 5.250% ,885,000 Term 5.250% ,300,000 Serial 5.000% ,320,000 Term 5.000% ,180,000 Series 2001A Revenue Bonds 04/01/01 Serial 4.100%-5.200% $122,620,000 Term 5.500% ,190,000 Term 5.000% ,820,000 Series 2001B Revenue Bonds 04/01/01 Serial 3.875%-4.750% $ 3,525,000 Term 5.000% ,920,000 Term 5.000% ,005,000 Term 5.000% ,830,000 Series 2002A Revenue Bonds 06/04/02 Serial 4.000%-5.750% $ 90,475,000 Term 5.125% ,780,000 Term 5.250% ,075,000 $ 495,000 $ 970,000 $ 216,865,000 $ 225,585,000 $ 89,895,000 $ 91,335,000 $ 257,630,000 $ 262,990,000 $ 12,280,000 $ 12,560,000 $ 204,330,000 $ 208,210,000 63
71 Bonds Payable (continued) Issue Interest Maturing On Outstanding at December 31, Airport System Senior Debt Date Rates October 1 Amount Series 2002B Revenue Bonds 06/04/02 Serial 3.900%-4.300% $ 3,005,000 Series 2002C Refunding Bonds 08/28/02 Term Variable $ 217,730,000 Series 2002D Refunding Bonds 08/28/02 Serial 3.250%-5.375% $ 36,230,000 Term 5.000% ,270,000 Term 5.000% ,685,000 Series 2003A Revenue & Refunding Bonds 10/01/03 Serial 3.000%-5.500% $ 94,660,000 Term 5.125% ,935,000 Term 5.000% ,590,000 Series 2003B Refunding Bonds 10/01/03 Serial 2.800%-5.250% $ 36,705,000 Series 2003C Revenue & Refunding Bonds 10/01/03 Serial 3.880%-5.390% $ 19,150,000 Term 5.740% ,935,000 Term 6.000% ,880,000 Series 2003D Revenue Bonds 10/01/03 Term Variable $ 140,775,000 Series 2004A Refunding Bonds 08/26/04 Term 3.750% 2014 $ 70,000 Serial 4.50%-5.000% ,510,000 Series 2004B Revenue Bonds 05/18/04 Serial 5.000% 2027 $ 25,000,000 Serial 5.050% ,330,000 Term 5.000% ,670,000 Series 2004C-1 Refunding Bonds 07/07/04 Serial 5.000% 2008 $ 14,275,000 Serial 5.000% ,900,000 $ 3,005,000 $ 3,540,000 $ 217,730,000 $ 228,485,000 $ 98,185,000 $ 100,240,000 $ 172,185,000 $ 175,495,000 $ 36,705,000 $ 39,115,000 $ 44,965,000 $ 46,940,000 $ 140,775,000 $ 143,225,000 $ 13,580,000 $ 13,590,000 $ 250,000,000 $ 250,000,000 $ 71,175,000 $ 84,775,000 64
72 Bonds Payable (continued) Issue Interest Maturing On Outstanding at December 31, Airport System Senior Debt Date Rates October 1 Amount Series 2004C-2 Revenue Bonds 08/12/04 Term 5.000% 2022 $ 32,795,000 Serial 5.000% ,690,000 Series 2004D Refunding Bonds 08/26/04 Serial 3.000%-5.250% $ 217,570,000 Series 2005A Revenue Bonds 04/12/05 Serial 3.250%-5.250% $ 133,890,000 Term 4.750% ,290,000 Term 5.000% ,740,000 Series 2005B Refunding Bonds 04/12/05 Serial 3.500%-5.250% $ 19,775,000 Series 2005C Revenue Bonds 04/12/05 Serial 5.590% 2025 $ 8,315,000 Serial 5.690% ,350,000 Serial 5.730% ,335,000 Series 2005D Revenue Bonds 10/12/05 Serial 5.000% $ 3,800,000 Serial 5.000% ,650,000 Series 2006A Revenue Bonds 01/25/06 Serial 4.750% 2030 $ 12,500,000 Term 5.000% ,555,000 Term 5.000% ,945,000 Series 2006B Revenue Bonds 12/06/06 Serial 4.550% 2031 $ 59,020,000 Serial 5.000% ,710,000 Term 5.000% ,270,000 Series 2006C Refunding Bonds 12/06/06 Serial 3.750%-5.000% $ 26,270,000 Term 4.375% ,595,000 Series 2007A Refunding Bonds 07/03/07 Serial 4.750%-5.000% $ 164,460,000 $ 99,485,000 $ 99,575,000 $ 217,570,000 $ 218,005,000 $ 305,920,000 $ 313,125,000 $ 19,775,000 $ 19,775,000 $ 30,000,000 $ 30,000,000 $ 11,450,000 $ 11,450,000 $ 300,000,000 $ 300,000,000 $ 400,000,000 $ 400,000,000 $ 37,865,000 $ 37,865,000 $ 164,460,000-65
73 Bonds Payable (continued) Issue Interest Maturing On Outstanding at December 31, Airport System Senior Debt Date Rates October 1 Amount Series 2007B Revenue Bonds 09/27/07 Serial 4.000%-5.000% $ 439,265,000 Term ,150,000 Term ,225,000 Term ,360,000 $ 530,000,000 $ - 3,946,325,000 3,487,440,000 Plus (less) unamortized discount/premium, net 16,548,327 (4,062,547) $ 3,962,873,327 $ 3,483,377,453 * Series 1997B Revenue Bonds were refunded on July 3, 2007, with fixed rate debt. Changes in Bonds Payable Balances Balance as of December 31, 2006 $ 3,483,377,453 Bonds issued Series 2007A Revenue Refunding Bonds $ 164,460,000 Series 2007B Revenue Bonds 530,000, ,460,000 Bonds refunded Series 1997B Revenue Bonds (169,355,000) (169,355,000) Principal payments (66,220,000) Change in unamortized discount/premium, net 20,610,874 Balance as of December 31, 2007 $ 3,962,873,327 Balance as of December 31, short-term 86,570,000 Balance as of December 31, long-term 3,876,303,327 $ 3,962,873,327 Recent Bond Issues On January 25, 2006, the Airports Authority issued Airport System Revenue Bonds, Series 2006A for $300,000,000. These bonds were used in part to refund $90 million of the Airports Authority s Series One CP Notes and $75 million of the Series Two CP Notes. Of the outstanding Series One CP Notes, $25 million were repaid on January 26, 2006 and $65 million were repaid on January 30, Of the outstanding Series Two CP Notes, $75 million were repaid on January 26, In addition, the bonds provided ongoing funding for the Airports Authority capital construction program at Reagan National and Washington Dulles. On December 6, 2006, the Airports Authority issued Airport System Revenue Bonds, Series 2006B for $400,000,000 and Airport System Revenue Refunding Bonds, Series 2006C for $37,865,000. The Series 66
74 2006B bonds were issued to finance capital improvements at Reagan National and Washington Dulles. The proceeds of the Series 2006C bonds were used to advance refund a portion of the Airports Authority s outstanding Airport System Revenue Bonds, Series 1998A and the Airports Authority s outstanding Airport System Revenue Bonds, Series 2002B. Of the Series 1998A bonds, $16,720,000, were advanced refunded with the 2006C Bonds on December 6, The outstanding bonds in this series are scheduled to mature on October 1, 2009 through 2028 and were subject to optional redemption on October 1, The bonds will be redeemed at a price of 101.0%. The Airports Authority s present value savings of this refunding was $1.5 million. The Airports Authority will realize cash flow savings of $1,512,631 with this transaction. Of the Series 2002B Bonds, $21,990,000 were advance refunded with the 2006C Series Bonds on December 6, The refunded Series 2002B Bonds were scheduled to mature on October 1, 2013 through 2032 subject to redemption on October 1, The bonds will be redeemed at 100%. The Airports Authority s present value savings of this refunding was $2.2 million. The Airports Authority will realize cash flow savings of $2,194,400 with this transaction. On July 3, 2007, the Airports Authority received the proceeds of $164,460,000 from the Airport System Revenue Refunding Bonds, Series 2007A. These proceeds together with other available funds (the Debt Service Interest Account and the Debt Service Principal Account of the refunded Bonds) were used to refund all of the Airports Authority s outstanding Airport System Revenue Bonds, Series 1997B. The outstanding bonds maturing 2007 through 2023 of the Series 1997B of $169,355,000 were refunded on October 1, The Airports Authority s present value savings of this refunding was $6.9 million. The Airports Authority will realize cash flow savings of $10,086,453 with this transaction. The refunded Series 1997B Bonds were scheduled to mature on October 1, 2007 through 2023 and were subject to optional redemption on October 1, The bonds were redeemed at a price of 101% plus accrued interest. On September 27, 2007, the Airports Authority issued Airport System Revenue Bonds, Series 2007B bonds for $530,000,000. The proceeds from these bonds will be used to finance capital improvements at Reagan National and Washington Dulles. The Airports Authority reviews each bond sale to determine if there is value in providing investors municipal bond insurance. Insurance is provided in part by Financial Guaranty Insurance Company (FGIC), Municipal Bond Investors Assurance Corporation (MBIA), Financial Security Assurance (FSA), and XL Capital Assurance (XL). The following table details the Airports Authority s outstanding debt noting insured and uninsured bonds. (See Note V) Bond Principal Uninsured Insured Insurance Series Outstanding Bonds Bonds Provider 1998A $ 495,000 $ 495,000 $ - n/a 1998B 216,865, ,865,000 MBIA 1999A 89,895,000-89,895,000 FGIC 2001A 257,630, ,630,000 MBIA 2001B 12,280,000-12,280,000 MBIA 2002A 204,330, ,330,000 FGIC 2002B 3,005,000-3,005,000 FGIC 2002C 217,730, ,730,000 FSA 2002D 98,185,000-98,185,000 FSA 67
75 (continued) Bond Principal Uninsured Insured Insurance Series Outstanding Bonds Bonds Provider 2003A $ 172,185,000 $ - $ 172,185,000 FGIC 2003B 36,705,000 5,010,000 31,695,000 FGIC 2003C 44,965,000-44,965,000 FGIC 2003D 140,775, ,775,000 XL 2004A 13,580,000-13,580,000 MBIA 2004B 250,000, ,000,000 FSA 2004C-1 71,175,000-71,175,000 FSA 2004C-2 99,485,000-99,485,000 FSA 2004D 217,570,000 20,570, ,000,000 MBIA 2005A 305,920, ,920,000 MBIA 2005B 19,775,000-19,775,000 MBIA 2005C 30,000,000-30,000,000 MBIA 2005D 11,450,000-11,450,000 Ambac 2006A 300,000, ,000,000 FSA 2006B 400,000, ,000,000 FGIC 2006C 37,865,000-37,865,000 FGIC 2007A 164,460, ,460,000 Ambac 2007B 530,000,000 21,130, ,870,000 Ambac $3,946,325,000 $ 47,205,000 $3,899,120,000 On January 24, 2008, Fitch downgraded the Bond Insurer s rating for the Airports Authority s 2003D bonds from AAA to A and placed the Bond Insurer on a Negative Watch. On February 7, 2008, Moody s downgraded the Bond Insurer s rating from Aaa to A3 with a negative rating outlook. As a result, Fitch and Moody s replaced the Bond Insurer s rating on the 2003D Bonds with the Airports Authority s underlying rate of AA. (See Note V) The following is a summary of the maturities and sinking fund requirements, not including any unamortized discount or premium. Scheduled principal payments on long term bonds are due annually on October 1. Year ending Total December 31 Principal Interest Debt Service 2008 $ 86,570,000 $ 195,514,287 $ 282,084, ,475, ,182, ,657, ,830, ,926, ,756, ,735, ,364, ,099, ,500, ,675, ,175, ,385, ,136,160 1,412,521, ,415, ,236,323 1,370,651, ,185, ,144,842 1,095,329, ,115, ,872,792 1,152,987,792 Thereafter 656,115,000 71,210, ,325,223 $ 3,946,325,000 $ 3,222,263,670 $ 7,168,588,670 68
76 Total interest costs for the years ended December 31, 2007 and 2006 were $180,395,398 and $153,983,954, respectively. The current portion of the Airports Authority s bond payable, in the amount of $86,570,000, is due on October 1, Special Facility Revenue Bonds In March 1991, the Airports Authority issued $14,200,000 of Special Facility Revenue Bonds on behalf of Caterair International Corporation (Caterair). The bonds were issued to finance the construction of an Inflight Kitchen Facility at Reagan National. The Special Facility Revenue Bonds and related costs are payable only with funds from Caterair. Since these bonds do not represent a claim on the Airports Authority s assets, nor do they require the Airports Authority to incur future obligations, they have not been recorded in the Airports Authority s financial statements. L. AIRPORT USE AGREEMENT AND PREMISES LEASE In February 1990, the Airports Authority entered into a long-term agreement with the major airlines serving the Airports. The Agreement is for a term of 25 years, subject to cancellation rights by the Airports Authority after 15 years, and annually thereafter, at the option of the Airports Authority. The Agreement provides for the calculation of annual rates and charges, with rate adjustments at midyear, or any time revenues fall 5% or more below projections. The Agreement also provides for an annual settlement whereby the rates and charges are recalculated using audited financial data to determine any airline over/underpayment. For the year ended December 31, 2007, the settlement resulted in a charge to the airlines of $1,178,572 which was reflected as a reduction in accounts payable and accrued expenses. For the year ended December 31, 2006, the settlement resulted in a charge to the airlines of $3,950,370 which was reflected as a reduction of accounts payable and accrued expenses. Rates and charges are established to provide net revenues of at least 125% of debt service. Net remaining revenues (NRR) are defined as revenues less all operating and maintenance expenses, debt service, specified reserves, and other requirements. Subsequent to the final determination, NRR is allocated between the Airports Authority and the Airlines in accordance with the Agreement which shares NRR approximately 50/50 between the Airports Authority and the Airlines. The Airports Authority s share of NRR is reflected in the Airports Authority s Capital Fund as a reservation of retained earnings in the subsequent year, and is available for repair and rehabilitation projects or any other lawful purpose. The Airlines share of NRR is recorded prospectively and reduces the subsequent year s rates and charges. All calculations are done in accordance with the Agreement. In addition, the Agreement establishes an index amount at each Airport. When the transfer amount to the airlines reaches this level, the amount over the plateau is allocated 75% to the Airlines and 25% to the Airports Authority. For the years ended December 31, 2007 and 2006, at Washington Dulles, the transfer amount exceeded the plateau amount by $46,698,883 and $40,324,380, respectively. For the years ended December 31, 2007 and 2006, at Reagan National, the transfer amount exceeded the plateau amount by $2,496,636 and $6,382,149, respectively. These amounts were allocated accordingly and are included in the Airlines and the Airports Authority s share. For the years ended December 31, 2007 and 2006, the Airlines 69
77 share of NRR was $77,989,244 and $74,681,804, respectively, and the Airports Authority s share was $46,689,368 and $45,112,197, respectively. M. NET ASSETS Net assets consists of the following: Invested in Capital Assets Net of Related Debt consists of the following: Long-term assets Capital assets Land and other non-depreciable assets $ 121,534,710 $ 118,144,707 Construction in progress 1,915,881,901 1,389,283,792 Buildings, systems and equipment 3,908,323,105 3,705,348,760 Less: accumulated depreciation (1,329,630,395) (1,194,208,598) Capital assets, net 4,616,109,321 4,018,568,661 Bond issuance costs, net 60,302,530 55,362,846 Total capital assets 4,676,411,851 4,073,931,507 Less: related liabilities Current portion bonds payable 86,570,000 72,460,000 PFC bank participation notes 432,000, ,000,000 Commercial paper notes 260,000, ,000,000 Bonds payable, net 3,342,635,240 2,802,522,149 Total liabilities 4,121,205,240 3,474,982,149 Invested in capital assets, net of related debt $ 555,206,611 $ 598,949,358 Restricted assets consists of the following: Restricted assets Cash and cash equivalents, restricted $ 173,596,934 $ 219,855,164 Passenger facility charges, restricted 15,202,225 14,152,717 Accounts receivables, passenger facility charges and other, restricted 9,354,533 11,258,351 Long-term investments, restricted 278,008, ,395,532 Investments, restricted 329,304, ,740,541 Total assets 805,465, ,402,305 Less: liabilities from restricted assets Accounts payable and accrued expenses 100,843,888 76,770,235 Debt related to unspent bond proceeds 533,668, ,395,304 Accrued interest payable 55,970,434 41,153,454 Total liabilities 690,482, ,318,993 Restricted net assets $ 114,983,454 $ 46,083,312 70
78 Unrestricted assets consists of the following: Current assets Cash and cash equivalents $ 36,128,525 $ 26,013,856 Investments 230,873, ,608,097 Accounts receivables, net 43,199,310 23,290,488 Inventory 5,033,697 3,637,337 Prepaid expenses and other current assets 6,810,182 7,086,182 Total current assets 322,045, ,635,960 Long-term assets Long-term investments 80,463,199 29,973,880 Net pension asset and other post-employment benefits assets 4,509,918 4,955,615 Other long-term assets 18,333,264 - Total unrestricted assets 425,351, ,565,455 Less: current liabilities Accounts payable and accrued expenses 71,868,458 44,359,480 Operating lease obligations 341, ,140 Total current liabilities 72,209,598 44,700,620 Less: deferred revenue 20,363,189 - Total liabilities payable from unrestricted assets 92,572,787 44,700,620 Unrestricted net assets $ 332,778,759 $ 291,864,835 N. LEASE COMMITMENTS Property Held for Lease The Airports Authority has entered into various operating leases with tenants for the use of space at the Airports Authority s facilities including buildings, terminals, and customer service areas. The lease terms include a minimum fixed fee as well as contingent fees based on the tenants volume of business. All the leases provide for a periodic review and redetermination of the rental amounts. Minimum future rentals scheduled to be received on operating leases that have initial or remaining noncancelable terms in excess of one year are: Year ending December 31, 2008 $ 271,523, ,551, ,882, ,137, ,002, and thereafter 2,298,889,482 Total minimum future rentals $ 3,902,987,867 71
79 The above amounts do not include contingent rentals and fees in excess of minimums, which amounted to $13,034,171 for the year ended December 31, The portion of property associated with minimum rentals derived from operating leases was capitalized prior to June 7, 1987, and ownership was retained by the United States Government. Use of this property is provided to the Airports Authority under its operating lease with the United States Government. Accordingly, the cost of this property is not reflected in the financial statements of the Airports Authority. On December 15, 2003, the operating period of the lease of land and provision for services to the Stephen F. Udvar-Hazy Center (Center) began. The lease agreement grants the Smithsonian Institute the right to occupy, develop, operate, control and use the Center premises located on land at Washington Dulles and obtain services from the Airports Authority for police, fire, emergency, and ambulance needs. This lease expires in The operating period was preceded by a construction period. Commencing with the operating period the Smithsonian Institute will pay the Airports Authority for the services provided. The lease provides for periodic reconciliation payments and updated payments for services provided. Property Leased from Others On June 7, 1987, the United States Government transferred Reagan National s and Washington Dulles real properties to the Airports Authority under a 50-year lease, with extensions negotiable. The lease was amended effective June 17, 2003, to extend the term from 50 to 80 years, with an expiration date of June 6, Upon expiration of the lease, the Airports and facilities, including improvements, will be returned to the United States Government. The lease requires annual rental payments of $3,000,000, with subsequent annual rental payments adjusted for inflation. The Airports Authority invests the monthly lease payments in Repurchase Agreements or Certificates of Deposit and makes semi-annual payments, including interest, to the United States Government. The 2007 payment to the United States Government, including the interest was $4,878,022. Minimum future rentals scheduled to be paid on the operating lease in effect on December 31, 2007, as calculated in 2007 dollars are: Year ending December 31, 2008 $ 4,830, ,830, ,830, ,830, ,830, and thereafter 265,656,628 Total minimum future rentals $ 289,807,233 Total rental expense for the years ended December 31, 2007 and 2006 were $4,830,121 and $4,689,858, respectively. 72
80 O. OTHER COMMITMENTS AND CONTINGENCIES Construction Commitments At December 31, 2007, the Airports Authority had outstanding commitments for capital expenditures in connection with its CCP in the amount of $383.2 million. However, services have not been provided as of December 31, 2007, and accordingly no liability has been recorded in the financial statements. In connection with the CCP and Capital, Operating and Maintenance Investment Programs (COMIP), and normal operations of Reagan National and Washington Dulles, the Airports Authority recognizes the need to address environmental concerns and currently oversees a number of ongoing environmental projects. Management has estimated that the cost to continuously monitor and inspect these environmental concerns ranges between $20 million and $25 million, of which a portion is expected to be funded by the FAA. The Airports Authority has budgeted and expects to fund any remaining costs principally through the CCP. P. GOVERNMENT GRANTS In Aid of Construction The Airports Authority receives, on a cost-reimbursement basis, grants from the United States government and the Commonwealth of Virginia for certain operating and capital construction programs. As a recipient of federal and state financial assistance, the Airports Authority is responsible for maintaining an internal control structure that ensures compliance with all laws and regulations related to these programs. Total federal and state grant expenditures for years ended December 31, 2007 and 2006 were $33,875,903 and $55,874,620, respectively. All grant expenditures are subject to financial and compliance audits by the grantors as well as during the Airports Authority s annual OMB A-133 Single Audit process. The Airports Authority estimates that no material disallowances will result from any such audits. In fiscal years 2007 and 2006, the Airports Authority received federal and state grants for operating and capital programs as summarized in the tables below: Operating Programs Law Enforcement Officer Reimbursement Program $1,289,520 $ 1,302,873 Reagan National Explosives Detection Canine Team Program 500, ,305 State Homeland Security Program 554, ,194 Disaster Relief and Emergency Assistance 15, ,766 Homeland Security Grant Program 853, ,700 Drug Seizure Program (ICE) 34,195 79,552 Drug Seizure Program (DEA) 219, ,698 Arlington County Grant 15,356 8,025 Contract Baggage Handler Demonstration Program 247, ,623 Clean Cities Program - 10,000 Drug Seizure Program (Drug Funds) 15,682 - Bureau of Justice (Bulletproof Vest Partnership Program) In-line Baggage EDS Project 1,389,297-73
81 The Law Enforcement Officer Reimbursement Program offsets expenses incurred by the Airports Authority s Public Safety personnel serving a support role to the Transportation Security Administration. Explosives detection funds are used to offset the expense of training and caring for canines used in explosives detection. Funds received from the State Homeland Security Program and Homeland Security Grant Program allow the Airports Authority to procure equipment and participate in training programs to prepare for and more effectively respond to events which may threaten public safety. Severe weather in the summer of 2006 damaged several facilities at Reagan National and Washington Dulles airports. Emergency repair and recovery costs were reimbursed by the Federal Emergency Management Agency. The Drug Enforcement Agency Drug Seizures Program, and the U.S. Customs Drug Seizures Program are collaborative efforts between the agencies and the Airports Authority s police department wherein both entities share in the proceeds from the sale of confiscated items. The Airports Authority s proceeds may only be used for certain types of expenses defined by the DEA and Customs. The Airports Authority also participated in a pilot program with the Transportation Security Administration designed to improve the effectiveness of the TSA s baggage screening process. Funds were also received for the acquisition of a natural gas station to fuel a portion of the Airports Authority s vehicle fleet. Capital Program Federal grants for construction $ 26,739,300 $ 50,094,884 State grants for construction 2,000,020 2,000,000 The Airports Authority receives federal and state grants in support of its CCP. The federal programs, primarily through the Federal Aviation Administration s Airport Improvement Program, provide funding for airport development, airport planning and noise compatibility programs from the Airports and Airways Trust Funds in the form of entitlement and discretionary grants for eligible projects. The Commonwealth of Virginia also provides discretionary funds for capital programs. Grants for capital asset acquisition, facility development, rehabilitation of facilities and long-term planning are reported in the Statements of Revenues, Expenses and Changes in Net Assets as Capital Contributions. Q. LITIGATION The Airports Authority is a defendant in two suits arising from the September 11, 2001, terrorist hijacking and crash of an airplane into the Pentagon. In accordance with federal law, these suits have been consolidated into a single proceeding in the Southern District of New York. The Airports Authority is defending itself vigorously in this litigation against the allegations that it had a legal duty to prevent terrorists from hijacking American Airlines Flight 77 from Washington Dulles. Also, the Airports Authority believes that under Section 201 of the Aviation Security Act, the liability of the Airports Authority for all claims, whether compensatory or punitive, arising from the terrorist related aircraft crash of September 11, 2001, cannot be an amount greater than the liability insurance coverage maintained by the Airports Authority on the date of the event. The Airports Authority is not able to predict the outcome of such litigation or the extent to which such litigation may have a material impact on the financial condition of the Airports Authority. 74
82 Legal counsel has advised that, while a number of claims in the normal course of business are outstanding, there were no matters outstanding which could have a material adverse effect on the financial statements of the Airports Authority. R. PASSENGER FACILITY CHARGES As described in Note A, PFCs are collected in accordance with the FAA regulations allowing airports to impose a $4.50 PFC. For the years ended December 31, 2007 and 2006, the Airports Authority earned PFCs of $36,843,392 and $37,231,040 for Reagan National, respectively, and $46,015,454 and $44,258,664 for Washington Dulles, respectively. In accordance with the regulations, based on the approval date from the FAA and continuing through the PFC collection period, the Airports Authority s share of entitlement grants will be reduced 75%. S. RISK MANAGEMENT The Airports Authority is exposed to a variety of risks or losses related to operations (i.e., injuries to employees, injuries to members of the public or damage to their property, and damage to the Airports Authority s property). Since 2002, the Airports Authority has maintained accruals to finance its self-insured risk of loss. The Airports Authority purchases commercial insurance for claims in excess of amounts provided by these accounts. All offices within the Airports Authority are covered under these accounts. The accruals are determined by the Risk Management Department based on insurance claim practices and actuarial estimates for prior and current-year claims. The overall accrual for losses was $5,272,586 and $4,478,933 as of December 31, 2007 and 2006, respectively, and is included in the accounts payable and accrued expenses line item. This is based on the requirements of GASB Statement No. 30, Risk Financing Omnibus, which requires that a liability for claims be reported if information prior to the issuance of the financial statements indicates that it is probable that a liability has been incurred at the date of the financial statements and the amount of the loss can be reasonably estimated. Changes in the claim liability accounts in fiscal years 2007 and 2006 were: Fiscal Beginning Claims and Changes Claim Ending Year Balance in Estimates Payments Balance 2005 $ 3,814,673 $1,793,168 $1,493,392 $ 4,114, $ 4,114,449 $2,563,518 $2,199,034 $ 4,478, $ 4,478,933 $2,475,680 $1,682,027 $ 5,272,586 Settlements did not exceed insurance coverages for the past three years. T. FAIR VALUE OF FINANCIAL INSTRUMENTS The following methods and assumptions were used to estimate the fair value of each class of financial instruments for which it is practicable to estimate that value: 75
83 Cash and Short Term Investments The carrying amount approximates the fair value because of the short maturity of those instruments (See Note B). Long-Term Investments For securities held as long-term investments, fair value equals quoted market prices, if available. If a quoted market price is not available, fair value is estimated based upon quoted market prices for securities with similar characteristics. (See Note B) Long-Term Debt The fair value of the Airports Authority s long-term debt is estimated based on the quoted market prices for the same or similar issues or on the current rates offered to the Airports Authority for debt of the same remaining maturities. The carrying value of the Airports Authority s Bonds Payable and CP Notes Payable as of December 31, 2007, is $4,206,325,000 with an estimated market value of $4,396,719,771. Interest Rate SWAP The fair value of the interest rate swap is the estimated amount that the Airports Authority would pay (or receive) to terminate the swap agreements at the reporting date, taking into account current interest rates and the current creditworthiness of the swap counter parties (See Note C). U. DULLES CORRIDOR PROPOSAL On December 20, 2005, the Airports Authority announced its proposal to operate the Dulles Toll Road (DTR) and oversee the construction of the Dulles Corridor Metrorail Extension Project. Under the proposal, the Airports Authority would issue bonds backed by revenue from the DTR which together with federal grants, PFCs and participation from Fairfax and Loudoun Counties, would fund the Project. On March 24, 2006, the Commonwealth of Virginia and the Airports Authority entered into a Memorandum of Understanding (MOU) to begin negotiations for the transfer of operational and maintenance responsibilities of the DTR. On December 29, 2006, the Airports Authority signed a Master Transfer Agreement and a Permit and Operating Agreement with the Virginia Department of Transportation (VDOT). The Agreements transfer the operation and maintenance responsibilities of the DTR, as well as rights to the DTR revenues, to the Airports Authority. In exchange, the Airports Authority will construct the Dulles Corridor Metrorail Extension Project from the vicinity of West Falls Church to Route 772 in Loudoun County, and will make other improvements in the Dulles Corridor consistent with VDOT and regional plans. The transfer will be effective upon the completion of certain conditions, among which is the award of a Final Design Grant for the Metrorail Extension Project from the Federal Transit Administration (FTA). In January 2008, the FTA advised the Airports Authority that the Metrorail Extension Project may not meet the FTA s criteria for entry 76
84 into Final Design, citing various reasons. The FTA requested additional information from the Airports Authority to enable it to make a final determination. The Airports Authority provided the additional information to the FTA, but the FTA s final determination remains pending. The Airports Authority has not determined whether it will proceed with the Dulles Corridor Metrorail Extension Project if the federal grant funds from the FTA are not available. If the project proceeds, upon transfer of the DTR, the Airports Authority will delegate the operation of the DTR to VDOT on behalf of the Airports Authority until a Full Funding Grant Agreement for the Metrorail Extension Project is executed with the FTA. The term of the Agreement for the Airports Authority to operate and maintain the DTR is 50 years. The Airports Authority will be responsible for collecting tolls and setting toll rates following its regulatory process and with consultation of a Dulles Corridor Advisory Committee. The Airports Authority has established a separate Dulles Corridor Enterprise Fund to account for the activity of the DTR and the Dulles Corridor Metrorail Extension Project upon transfer. Also upon transfer, the Airports Authority will receive any existing cash reserves associated with the toll road, if any, and the Airports Authority will be obligated to pay to the Commonwealth of Virginia sufficient funds to cause existing debt of the Dulles Toll Road to be defeased. The amount required to defease existing Dulles Toll Road debt is expected to be between $35 and $45 million, depending upon the actual transfer date. The Airports Authority expects to enter into an interim financing instrument in the form of a Bond Anticipation Note on or about the transfer date for up to $150 million to finance the defeasance of debt and to provide initial working capital. The interim debt would be supported by a pledge of Toll Road revenues. V. SUBSEQUENT EVENTS The Airport System Revenue Bonds, Series 2003D-1, experienced a failed auction on February 13, As a result, the interest rate converted to the maximum rate of 275% of LIBOR, or approximately 7.8%. This resulted in additional interest costs to the Airports Authority of approximately $200 thousand. On March 13, 2008, the Airports Authority completed conversion of its Series 2003D Bonds from auction rate mode to weekly reset mode. Fitch, Moody s and Standard & Poors Rating Services reaffirmed the Airports Authority s underlying rating given in August 2007 for this transaction. The Airports Authority retained the insurance policy with XL Capital Assurance Inc. for the transaction but wrapped the insurance policy and provided liquidity through two letters of credit (LOC) from Wachovia Bank, National Association for the Series 2003D-1 Bonds and Regions Bank for the Series 2003D-2 Bonds. The transaction carried a joint credit rating of AAA, based on a combined assessment of the Airports Authority s underlying rating and the LOC banks ratings. The interest rates on the converted Series 2003D Bonds will be reset by the remarketing agents (Goldman Sachs and Morgan Stanley) each Wednesday. The initial rate set on March 12 was 2.30%. On March 16, 2008 JP Morgan Chase announced that it is acquiring the Bear Stearns Companies, Inc. The Boards of Directors of both companies unanimously approved the transaction, and it is awaiting shareholder approval. On July 11, 2006, the Airports Authority entered into a forward floating-to-fixed interest rate hedge agreement with Bear Stearns Financial Products, Inc., a subsidiary of Bear Stearns Companies, Inc. The swap has a notional amount of $190.0 million and an effective date of October 1, In March 2008, Bear Stearns Companies, Inc. was downgraded by major rating agencies as a result of reported liquidity and other financial issues. While the parent Bear Stearns Companies, Inc. was downgraded, Bear Stearns Financial 77
85 Products, Inc. continues to be rated triple-a by virtue of its collateralization structure. Under the provisions of the 2006 Swap agreement, so long as the counterparty maintains ratings above A1/A+, it is not required to post collateral representing the periodic market value of the swap. In accordance with the requirements of the rating agencies a contingent manager has been appointed for Bear Stearns Financial Products, Inc. to manage its assets. Therefore, the Airports Authority management has no reason to believe that the swap arrangement will be terminated. In addition, another Bear Stearns subsidiary, Bear Stearns & Co., Inc., is the dealer for the Airports Authority Commercial Paper Series One in the amount of $220.0 million. The outstanding amount, $60.0 million, continues to be remarketed by Bear Stearns & Co., Inc. The Airports Authority has three debt service reserve account surety bonds issued by FGIC. The Airports Authority s bond indenture requires debt service reserve accounts be funded immediately with cash if the credit ratings of a bond insurer are not maintained at specified levels. As a result of credit downgrades of FGIC in early 2008, the Airports Authority transferred $13.0 million on February 26, 2008 to satisfy this requirement. 78
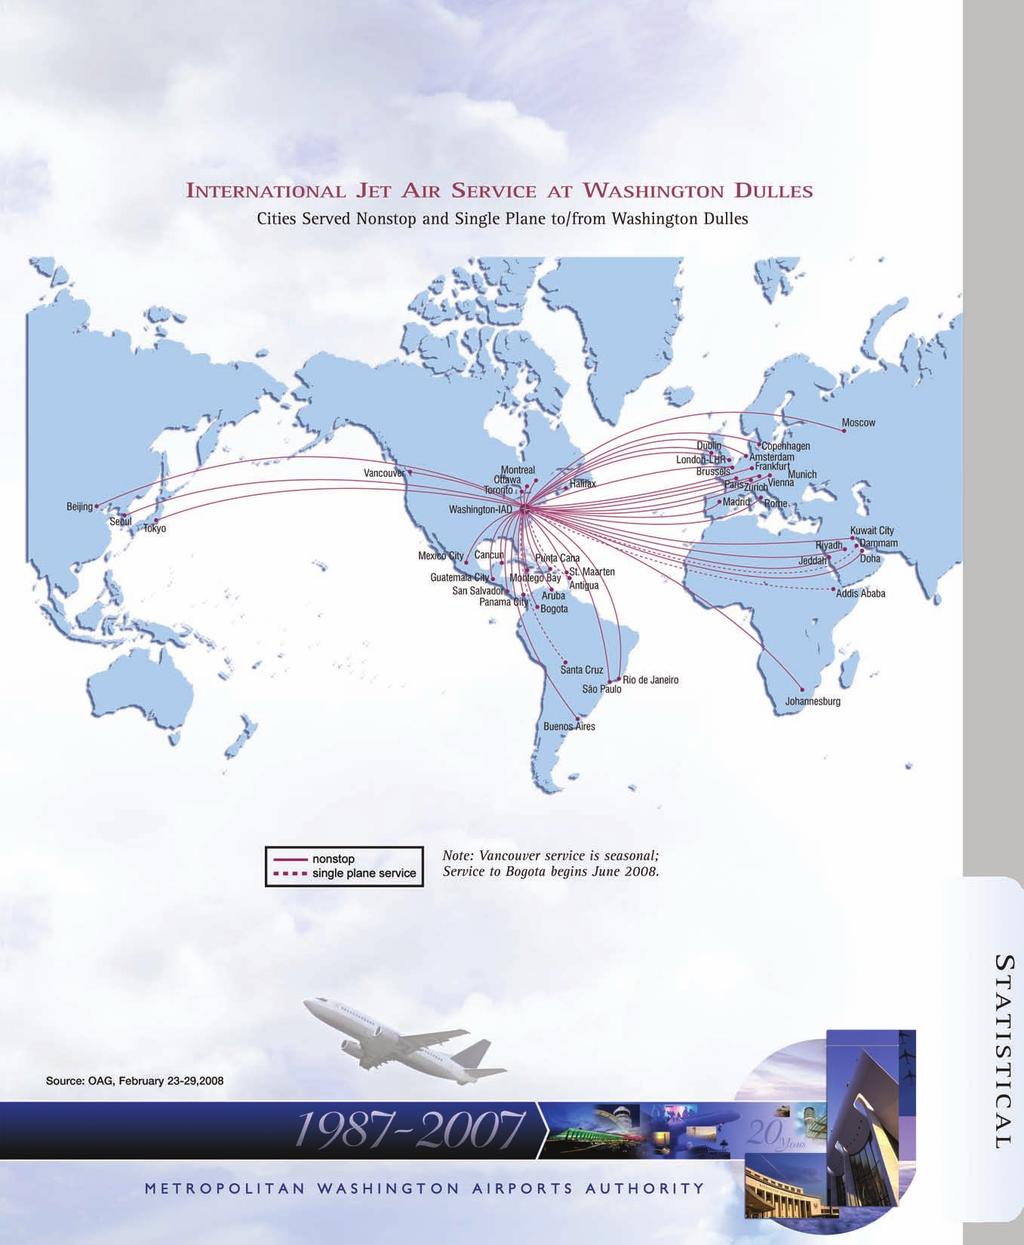
86
87 Statistical This part of the Airports Authority s comprehensive annual financial report presents detailed information as a context for understanding what the information in the financial statements and note disclosures says about the Airports Authority s overall financial health. Contents Page Financial Trends: These schedules contain trend information to help the reader understand how the Airports Authority s financial performance and well being have changed over time. Total Annual Revenues, Expenses and Changes in Net Assets Operating Expenses by Function Revenue Capacity: These schedules contain information to help the reader assess the factors affecting the Airports Authority s ability to generate airline and non-airline revenues. Revenues by Source Ronald Reagan Washington National Airport Revenues Washington Dulles International Airport Revenues Scheduled Airlines Rates and Charges Debt Capacity: These schedules present information to help the reader assess the affordability of the Airports Authority s current levels of outstanding debt and the Airports Authority s ability to issue additional debt in the future. Ratios of Outstanding Debt Revenue Bond Debt Service Coverage Revenue Bond Coverage Demographic and Economic Information: These schedules offer demographic and economic indicators to help the reader understand the environment within which the Airports Authority s financial activities take place and to help make comparisons over time and with other airports. Airport Information Ronald Reagan Washington National Airport Information Washington Dulles International Airports Authority Employee Strength Major Private Employers in Primary Air Trade Area Employment by Industry Population Trends
88 Operating Information: These schedules contain information about the Airports Authority s operations and resources to help the reader understand how the Airports Authority s financial information relates to the services the Airports Authority provides and the activities it performs. Aircraft Operations by Airport Landed Weights Ronald Reagan Washington National Landed Weights Washington Dulles International Enplanements Ronald Reagan Washington National Enplanements Washington Dulles International Enplanement Market Share Ronald Reagan Washington National Enplanement Market Share Washington Dulles International Cargo Market Share Enplaned Ronald Reagan Washington National Cargo Market Share Enplaned Washington Dulles International Passenger Facility Charges Primary Origination and Destination Passenger Markets Ronald Reagan Washington Primary Origination and Destination Passenger Markets Washington Dulles International Insurance Program for Operations Insurance Program for Construction
89 ANNUAL REVENUES, EXPENSES AND CHANGES IN NET ASSETS Exhibit S-1 (Expressed in Thousands) TOTAL REVENUES OPERATING REVENUES Concessions $ 217,486,823 $ 199,011,305 $ 198,691,232 $ 173,962,671 $ 146,095,903 $ 132,817,916 $ 92,378,269 $ 114,466,859 Rents 167,301, ,164, ,865, ,389, ,802, ,554, ,382, ,658,542 Landing fees 78,682,496 73,375,458 76,359,090 76,274,293 67,637,206 63,967,382 55,780,359 58,757,490 Utility sales 11,778,736 11,248,988 10,934,616 12,035,206 11,867,943 10,589,091 12,322,825 13,113,004 Passenger fees 28,684,113 25,474,908 26,973,143 29,474,743 27,878,919 27,521,305 24,445,948 24,898,129 Other 6,542,935 5,893,899 10,398,536 7,149,375 5,355,589 6,387,300 7,242,324 10,000,628 TOTAL OPERATING REVENUES 510,476, ,168, ,221, ,286, ,638, ,837, ,551, ,894,652 NON-OPERATING REVENUES Investment income 55,557,746 45,035,158 20,194,481 10,385,775 5,896,185 13,277,813 17,536,753 25,551,888 Unrealized swap income - - 6,062,129 1,601,347 5,572, Federal compensation ,064,970 40,000,000 - TOTAL NON-OPERATING REVENUES 55,557,746 45,035,158 26,256,610 11,987,122 11,468,519 16,342,783 57,536,753 25,551,888 TOTAL REVENUES 566,033, ,203, ,478, ,273, ,106, ,180, ,088, ,446,540 TOTAL EXPENSES OPERATING EXPENSES Materials, equipment, supplies, contract services and other 182,096, ,009, ,107, ,127, ,105, ,970,251 81,659,446 76,795,781 Salaries and related benefits 128,465, ,870, ,878,086 98,858,597 95,192,233 91,748,027 84,481,594 78,970,537 Utilities 21,134,317 20,359,248 21,493,887 18,754,511 16,754,386 15,657,374 17,568,654 21,592,399 Lease from U.S. Government 4,830,121 4,689,858 4,505,435 4,375,347 4,303,764 4,238,185 4,169,260 4,058,360 Depreciation and amortization 142,030, ,106, ,424, ,177, ,950, ,035,788 99,325,739 93,726,636 TOTAL OPERATING EXPENSES 478,556, ,036, ,409, ,293, ,306, ,649, ,204, ,143,713 NON-OPERATING EXPENSES Passenger facility charges, financing costs 3,968,842 2,026,385 1,497,097 1,525,026 1,137,715 2,029,218 4,537,821 7,028,863 Interest expense 111,534,092 96,999, ,561,330 89,368,779 95,610,127 98,256,099 93,132,374 96,627,010 Federal compensation transfer ,370 1,651,663 - Swap payments 1,353,696 1,854,177 4,856,288 3,662, Unrealized swap loss 23,223,957 12,718, ,024,249 1,566,958 - TOTAL NON-OPERATING EXPENSES 140,080, ,598, ,914,715 94,555,823 96,747, ,588, ,888, ,655,873 TOTAL EXPENSES 618,636, ,634, ,324, ,849, ,054, ,238, ,093, ,799,586 CAPITAL CONTRIBUTIONS Passenger facility charges 82,858,846 81,489,704 88,315,311 76,060,174 58,438,038 59,071,341 47,233,127 48,367,121 Federal and state grants 32,317,161 54,239,498 11,738,765 28,727,167 14,378,325 14,613,471 16,819,846 15,351,455 Other capital property contributed 3,498,173 1,231, ,044, ,237 - TOTAL CAPITAL CONTRIBUTIONS 118,674, ,960, ,054, ,787,341 78,861,263 73,684,812 64,290,210 63,718,576 INCREASE (DECREASE) IN NET ASSETS $ 66,071,319 $ 116,529,882 $ 79,208,350 $ 86,210,949 $ 17,913,960 $ (8,372,974) $ 48,285,325 $ 51,365,530 NET ASSETS AT YEAR END COMPOSED OF: Invested in capital assets, net of related debt 555,206,611 $ 598,949,358 $ 492,384,514 $ 344,583,615 $ 428,497,669 $ 418,037,820 $ 418,474,478 $ 388,552,054 Restricted 114,983,454 46,083,312 65,337, ,526,342 36,158,318 34,646,503 44,033,502 53,927,290 Unrestricted 332,778, ,864, ,645, ,049, ,292, ,350, ,899, ,642,669 TOTAL NET ASSETS $ 1,002,968,824 $ 936,897,505 $ 820,367,623 $ 741,159,273 $ 654,948,324 $ 637,034,364 $ 645,407,338 $ 597,122,013 Source: Authority's audited financial statements. Note: The Airports Authority is presenting only those years since implementation of GASB Statements 34 and 35 beginning in
90 OPERATING EXPENSES BY FUNCTION (Expressed in Thousands) Exhibit S-2 CY 2007 CY 2006 CY 2005 CY 2004 CY 2003* CY 2002* CY 2001* CY 2000* CY 1999* CY 1998 CY 1997 NATIONAL Materials, equipment, supplies, contract services, and other $ 58,393.0 $49,285.6 $44,273.9 $43,028.1 $42,379.1 $41,932.7 $38,775.9 $39,825.9 $39,163.7 $23,498.0 $18,760.7 Salaries and related benefits 53, , , , , , , , , , ,304.6 Utilities 7, , , , , , , , , , ,441.9 Travel Insurance 4, , , , , , , , , , ,067.6 Non-Cash expenses (45.1) (67.8) (321.6) (269.6) (228.5) (168.9) Non-Capitalized facility projects 1, , , , , Lease from U.S. Government 2, , , , , , , , , , ,000.9 Depreciation and amortization 11, , , , , , , , , , ,423.9 Total National Expenses $140,256.9 $122,646.9 $118,061.4 $111,580.0 $106,282.2 $102,823.7 $95,826.8 $92,834.5 $89,228.3 $70,424.4 $64,375.3 DULLES Materials, equipment, supplies, contract services, and other $ 87,758.6 $82,318.7 $76,630.2 $70,323.6 $68,998.1 $65,348.7 $56,719.3 $55,616.5 $52,689.2 $26,748.6 $19,712.1 Salaries and related benefits 75, , , , , , , , , , ,395.7 Utilities 13, , , , , , , , , , ,052.1 Travel Insurance 4, , , , , , , , , , ,067.6 Non-Cash expenses 78.4 (24.2) ,054.4 (333.4) Non-Capitalized facility projects 1, Lease from U.S. Government 2, , , , , , , , , , ,000.9 Depreciation and amortization 27, , , , , , , , , , ,045.8 Total Dulles Expenses $212,600.3 $194,885.3 $190,665.4 $172,562.8 $164,094.3 $154,620.0 $143,096.2 $134,192.0 $125,704.3 $94,181.8 $82,074.4 WASHINGTON FLYER Materials, equipment, supplies, contract services, and other $0.0 $125.4 $1,114.4 $1,034.8 $1,088.9 $1,208.1 $3,480.3 $4,108.8 $4,185.9 $4,076.0 $4,066.5 Salaries and related benefits Telecommunications Utilities Travel Insurance Non-Cash expenses 0.0 (9.1) 0.1 (2.9) (11.4) (3.4) (17.4) (113.5) 2.8 Non-Capitalized facility projects Depreciation Total Washington Flyer Expenses $0.0 $176.5 $1,428.6 $1,359.7 $1,477.1 $1,897.9 $4,682.8 $5,420.6 $5,720.6 $5,401.1 $5,158.9 WASHINGTON FLYER MAGAZINE 1 Materials, equipment, supplies, contract services, and other $0.0 $0.0 $0.0 $351.8 $905.1 $969.6 $1,546.6 $1,784.4 $1,890.3 $1,084.4 $997.0 Salaries and related benefits Utilities Travel Insurance Non-Cash expenses (241.1) (74.3) Depreciation Total Washington Flyer Magazine Expenses $0.0 $0.0 $0.0 $352.0 $905.8 $728.5 $1,506.8 $1,982.2 $2,079.6 $1,554.4 $1,548.5 BOND FUNDS Financing expenses $0.0 $0.0 $0.0 $0.0 $13.1 $37.5 $75.0 $0.0 $0.0 $0.0 $0.0 Legal Fees , Materials, Equipment, Supplies Contract services, and other 3, , ,469.5 (568.0) 2, Non-Cash expenses 12, (1.0) 0.0 2, Non-Capitalized facility projects , Depreciation and amortization 102, , , , , , , , , , ,605.3 Total Bond Expenses $118,890.1 $98,620.8 $97,393.3 $85,968.0 $85,058.0 $72,694.9 $67,149.2 $64,397.7 $60,794.3 $59,961.3 $45,493.2 TELECOMMUNICATIONS Telephone expenses $5,361.9 $5,441.5 $5,558.6 $5,324.8 $6,257.8 $6,213.1 $5,917.2 $5,039.3 $4,306.6 $5,069.3 $0.0 Total Telecommunication Exp $5,361.9 $5,441.5 $5,558.6 $5,324.8 $6,257.8 $6,213.1 $5,917.2 $5,039.3 $4,306.6 $5,069.3 $0.0 FAA AIR TRAFFIC CONTROL TOWER 3 Air Traffic Control Tower Expenses $213.2 $30.6 $0.0 $0.0 $0.0 $0.0 $0.0 $0.0 $0.0 $0.0 $0.0 Total Air Traffic Control Tower Exp. $213.2 $30.6 $0.0 $0.0 $0.0 $0.0 $0.0 $0.0 $0.0 $0.0 $0.0 JP MORGAN CHASE BUILDING 2 JP Morgan Chase Building Expenses $1,233.7 $1,234.6 $1,302.0 $1,146.5 $1,231.1 $1,671.5 $1,288.8 $871.3 $0.0 $0.0 $0.0 Total JP Morgan Chase Building Exp $1,233.7 $1,234.6 $1,302.0 $1,146.5 $1,231.1 $1,671.5 $1,288.8 $871.3 $0.0 $0.0 $0.0 TOTAL EXPENSES $478,556.1 $423,036.2 $414,409.3 $378,293.8 $365,306.3 $340,649.6 $319,467.8 $304,737.6 $287,833.7 $236,592.3 $198, The Airports Authority converted the Washington Flyer Magazine Program to a management contract in Separate reporting has been discontinued. 2 JP Morgan Chase Building is inclusive of all expense classifications. 3 FAA Air Traffic Control Tower completed in * Concession management expenses included in Materials, equipment, supplies and contract services for years 2004, 2003, 2002, 2001, 2000 and All other years remain unchanged. Source: Office of Finance 82
91 REVENUES BY SOURCE (Expressed in Thousands) Exhibit S-3 CY 2007 CY 2006 CY 2005 CY 2004 CY 2003* CY 2002* CY 2001* CY 2000* CY 1999* CY 1998 CY 1997 NATIONAL Airline: Rents $ 67,234.2 $63,938.0 $63,568.0 $62,236.9 $53,802.5 $60,453.8 $62,948.2 $60,659.8 $54,567.9 $57,865.6 $39,322.3 Landing fees 30, , , , , , , , , , ,693.2 Passenger fees/security , , , , ,514.1 Total Airline Revenues $97,383.4 $95,995.9 $93,013.5 $93,565.1 $80,257.5 $88,578.2 $90,992.6 $90,995.3 $81,992.2 $84,012.4 $63,529.6 Non-Airline: Concessions: Parking $ 44,590.1 $40,459.6 $37,647.4 $35,285.0 $32,381.8 $26,236.4 $27,289.8 $32,954.1 $26,250.6 $17,269.0 $13,753.9 Rental cars 19, , , , , , , , , , ,969.2 Terminal concessions Food and beverage 6, , , , , , , , , , ,929.5 News stands 2, , , , , , , , Retail 2, , , , , , , , , , ,864.1 Display advertising 3, , , , , , , Services ,047.6 Inflight catering , , , , , ,439.6 Fixed base operator , , , , Duty free All other , , , , , , , , Total Concessions $81,235.9 $75,829.3 $71,225.6 $64,746.3 $61,181.7 $53,373.1 $48,481.4 $61,118.9 $53,365.0 $41,273.4 $37,092.6 Rents 7, , , , , , , , , , ,322.3 Security , , Utility sales 1, , , , , , , , , , ,396.4 Other 5, , , , , , , , Total Non-Airline Revenue $96,417.0 $87,434.6 $86,528.1 $78,040.3 $71,260.9 $61,947.4 $55,241.6 $73,193.7 $69,498.0 $51,927.6 $48,496.8 Total National Revenues $193,800.4 $183,430.5 $179,541.6 $171,605.4 $151,518.4 $150,525.6 $146,234.2 $164,189.0 $151,490.2 $135,940.0 $112,026.4 DULLES Airline: Rents $ 74,974.8 $71,961.8 $69,886.1 $62,372.3 $62,281.5 $55,332.7 $48,685.3 $46,686.0 $45,596.7 $38,674.3 $32,392.7 Landing fees 48, , , , , , , , , , ,111.2 International Arrival Building fees 9, , , , , , , , , , ,090.7 Passenger Fees 18, , , , , , , , , , ,621.6 Total Airline Revenues $150,902.7 $137,451.4 $142,523.6 $135,563.8 $128,710.3 $115,555.4 $100,867.2 $100,006.0 $89,498.9 $81,893.9 $64,216.2 Non-Airline: Concessions: Parking $ 71,960.0 $ 68,608.0 $ 75,769.0 $64,396.8 $47,408.0 $42,923.2 $39,942.8 $46,411.9 $46,331.4 $23,584.2 $19,551.1 Rental cars 14, , , , , , , , , , ,389.5 Terminal concessions Food and beverage 8, , , , , , , , , , ,960.7 News stands 3, , , , , , , , , , Retail 2, , , , , , , , , Display advertising 3, , , , , , , Services 5, , , , , , , , , , ,022.5 Inflight catering 5, , , , , , , , , , ,776.5 Fixed base operator 11, , , , , , , , , , ,339.6 Duty free 3, , , , , , , , , , ,104.7 All other 4, , , , , , Total Concessions $135,997.9 $123,151.2 $127,168.0 $108,970.5 $84,697.2 $79,317.3 $75,776.7 $82,434.7 $81,464.9 $50,502.9 $42,442.2 Rents $15,346.8 $11,396.1 $10, , , , , , , , ,451.6 Security , , Utility sales 5, , , , , , , , , , ,983.7 Other 1, , , , , , , , , ,074.2 Total Non-Airline Revenues $158,867.1 $144,668.6 $147,912.0 $126,256.9 $100,120.3 $93,796.1 $87,587.9 $94,026.7 $92,132.2 $60,666.9 $49,951.7 Total Dulles Revenues $309,769.8 $282,120.0 $290,435.6 $261,820.7 $228,830.6 $209,351.5 $188,455.1 $194,032.7 $181,631.1 $142,560.8 $114,167.9 WASHINGTON FLYER Ground Transportation: Rents $0.0 $5.6 $67.2 $67.2 $67.2 $67.2 $67.2 $63.3 $71.5 $84.3 $69.9 Concessions Ground Transportation - other , , , , , , , ,751.8 Total Ground Transportation $0.0 $118.5 $2,007.0 $1,575.7 $1,243.0 $1,276.3 $2,700.9 $3,995.1 $4,338.6 $4,830.4 $4,950.7 Magazine Advertising - other $0.0 $0.0 $4.7 $352.0 $722.1 $974.1 $1,151.0 $1,576.1 $1,509.8 $1,041.7 $928.7 Total Magazine Revenues $0.0 $0.0 $4.7 $352.0 $722.1 $974.1 $1,151.0 $1,576.1 $1,509.8 $1,041.7 $928.7 TELECOMMUNICATIONS Total Telephone Revenues $4,414.7 $3,900.0 $3,673.6 $5,345.7 $5,361.0 $4,485.5 $5,835.7 $5,632.7 $3,710.8 $3,171.7 $0.0 JP MORGAN CHASE BUILDING Total JP Morgan Chase Building Revenues 1 $2,491.2 $1,599.6 $1,559.2 $1,586.6 $1,963.1 $2,225.0 $2,438.1 $1,062.9 $0.0 $0.0 $0.0 TOTAL REVENUES $510,476.1 $471,168.6 $477,221.7 $442,286.1 $389,638.2 $368,838.0 $346,815.0 $370,488.5 $342,680.5 $287,544.6 $232,073.7 * Concession Management expenses included as operating expenses for years 2003, 2002, 2001, 2000 and All other years remain unchanged. 1 JP Morgan Chase Building revenues include rents and utilities. Source: Office of Finance 83
92 Exhibit S RONALD REAGAN WASHINGTON NATIONAL AIRPORT REVENUES Security 0.5% Rents 38.4% Concessions 41.9% Utility Sales 1.0% Landing Fees 15.6% Other 2.6% 84
93 Exhibit S WASHINGTON DULLES INTERNATIONAL AIRPORT REVENUES Passenger Fees 5.9% Security 0.1% International Arrivals Fees 2.9% Concessions 43.9% Rents 29.2% Utility Sales 1.8% Landing Fees 15.7% Other 0.5% 85
94 SCHEDULED AIRLINES RATES AND CHARGES Exhibit S-6 Ronald Reagan Washington National Airport Signatory Airline Rates Landing Fee $ 2.34 $ 2.26 $ 2.16 $ 2.41 $ 2.34 $ 2.65 $ 2.68 $ 2.12 $ 2.13 $ 2.02 Signatory Airline Cost Per Enplanement $ $ $ $ $ $ $ $ $ $ Terminal A - Average Rate $ $ $ $ $ $ $ $ $ $ Terminal B & C - Average Rate $ $ $ $ $ $ $ $ $ $ Type 6 - Covered/Unenclosed $ 5.85 $ 5.68 $ 5.49 $ 5.21 $ 5.09 $ 5.32 $ 5.28 $ 5.15 $ 5.02 $ 5.07 Type 7 - Uncovered/Unenclosed $ 1.46 $ 1.42 $ 1.37 $ 1.30 $ 1.27 $ 1.33 $ 1.32 $ 1.29 $ 1.26 $ 1.27 NonSignatory Airline Rates General Aviation Landing Fees $ 2.82 $ 2.66 $ 2.40 $ 2.80 $ 2.45 $ 3.01 $ 2.94 $ 2.34 N/A N/A Landing Fees $ 3.52 $ 3.33 $ 3.00 $ 2.80 $ 2.45 $ 3.01 $ 2.94 $ 2.34 $ 2.48 $ 2.24 Terminal A $ $ $ $ $ $ $ $ $ $ Terminal B & C $ $ $ $ $ $ $ $ $ $ Washington Dulles International Airport Signatory Airline Rates Landing Fee $ 2.37 $ 2.06 $ 2.00 $ 2.52 $ 2.82 $ 2.39 $ 1.78 $ 1.45 $ 1.00 $ 1.30 Signatory Airline Cost Per Enplanement $ $ $ $ $ $ $ $ 8.48 $ 8.83 $ 9.66 Concourse C&D $ $ $ $ $ $ $ $ $ $ Concourse B $ $ $ $ $ $ $ $ $ $ Main Terminal $ $ $ $ $ $ $ $ $ $ Concourse A $ $ $ $ $ $ $ $ $ N/A Z-Gates $ $ $ N/A N/A N/A N/A N/A N/A N/A Type 6 - Covered/Unenclosed $ 5.85 $ 5.68 $ 5.49 $ 5.21 $ 5.09 $ 5.32 $ 5.28 $ 5.15 $ 5.02 $ 5.07 Type 7 - Uncovered/Unenclosed $ 1.46 $ 1.42 $ 1.37 $ 1.30 $ 1.27 $ 1.33 $ 1.32 $ 1.29 $ 1.26 $ 1.27 Airside Operations Building $ $ $ $ $ $ $ $ $ 8.31 $ International Arrivals Building $ 3.61 $ 4.09 $ 4.50 $ 5.57 $ 5.68 $ 5.49 $ 5.80 $ 3.82 $ 4.47 $ 2.84 Apron Operations Building N/A N/A N/A $ $ $ $ (1.66) $ 9.66 $ 9.06 $ 8.19 Concourse C International Arrival Building $ 2.04 $ 2.33 $ 1.73 $ 6.53 $ 6.79 $ 6.30 $ 5.55 $ 5.69 $ 4.35 $ 5.44 Passenger Conveyance $ 1.34 $ 1.37 $ 1.34 $ 1.32 $ 1.29 $ 1.38 $ 1.39 $ 1.39 $ 1.44 $ 1.55 NonSignatory Airline Rates General Aviation Landing Fees $ 3.20 $ 2.90 $ 2.71 $ 2.43 $ 3.05 $ 2.53 $ 2.16 $ 1.90 N/A N/A Landing Fees $ 4.21 $ 3.81 $ 3.57 $ 2.43 $ 3.05 $ 2.53 $ 2.16 $ 1.90 $ 1.52 $ 1.86 Concourse C&D $ $ $ $ $ $ $ $ $ $ Concourse B $ $ $ $ $ $ $ $ $ $ Main Terminal $ $ $ $ $ $ $ $ $ $ International Arrivals Building $ 4.72 $ 5.25 $ 5.86 $ 5.65 $ 6.75 $ 6.57 $ 7.45 $ 5.68 $ 8.19 $ 7.14 Concourse C International Arrival Building $ 3.81 $ 4.31 $ 4.31 $ 7.33 $ 9.05 $ 6.64 $ 6.53 $ 6.91 $ 5.95 $ 5.44 Concourse A $ $ $ $ $ $ $ $ $ N/A Z-Gates $ $ $ N/A N/A N/A N/A N/A N/A N/A Passenger Conveyance $ 1.92 $ 1.74 $ 1.61 $ 1.54 $ 1.73 $ 1.86 $ 1.61 $ 1.63 $ 1.63 $ 2.02 Note* Rates and Charges are calculated pursuant to the formulas set forth in the Airport Use Agreement and Premises Lease. The agreement provides the calculation of the annual rates and charges, with rate adjustments at mid-year, or any time revenues fall 5% or more below projections. Note* Rates as presented are average rates as calculated at settlement. Source: Airports Authority's rates and charges reports. 86
95 RATIOS OF OUTSTANDING DEBT (continued) Outstanding Debt per Enplaned Passenger Outstanding debt by type: General Airport Revenue Bonds (GARB) $ 3,962,873,327 $ 3,483,377,453 $ 2,828,462,510 $ 2,528,738,687 Commercial Paper 260,000, ,000, ,000,000 - Bond Anticipation Commercial Paper Notes ,000,000 PFC Bank Participation Notes 432,000, ,000, ,000, ,700,000 Total Outstanding Debt $ 4,654,873,327 $ 4,083,377,453 $ 3,414,462,510 $ 2,866,438,687 Enplaned Passengers 21,681,123 20,737,147 22,415,046 19,385,904 Outstanding Debt per Enplaned Passenger $ $ $ $ Debt Service Per Enplaned Passenger Net Debt Service (1) $ 185,377,198 $ 163,354,637 $ 164,667,568 $ 140,079,210 Enplaned Passengers 21,681,123 20,737,147 22,415,046 19,385,904 Debt Service per Enplaned Passenger $ 8.55 $ 7.88 $ 7.35 $ 7.23 Pledged Revenue Coverage - Flexible Term PFC Notes (Bank Participation Notes) (2) Passenger Facility Revenues $ 82,858,846 $ 81,489,704 $ 88,315,311 $ 76,060,174 Passenger Facility Interest Earnings 632,066 1,902, , ,989 Net Available Revenues $ 83,490,912 $ 83,392,642 $ 89,058,769 $ 76,259,163 Outstanding Bank Participation Notes 432,000, ,000, ,000, ,700,000 Total Available 495,900, ,900, ,900, ,900,000 10% of Outstanding 43,200,000 40,000,000 40,000,000 18,770,000 Loan Fees & Interest Expense 16,999,845 15,245,780 4,834,032 3,571,826 Total Debt Coverage Requirements $ 60,199,845 $ 55,245,780 $ 44,834,032 $ 22,341,826 Debt Service Coverage Less Passenger Facility Expenditures $ 114,367,332 $ 181,693,023 $ 241,850,339 $ 33,883,482 (1) Debt Service paid from operating accounts. Net Debt Service does not include debt service paid from bond funds for capitalized interest and debt service paid from interest earnings. (2) The Airports Authority issued Flexible Term PFC Revenue Notes to finance PFC approved projects. The bank participation rates have various maturity dates and interest rates that vary from 2.95% to 3.72%. Source: Office of Finance 87
96 Exhibit S $ 2,327,168,578 $ 2,016,923,324 $ 1,695,065,930 $ 1,439,881,951 $ 1,668,553,357 $ 1,701,084, ,000, ,000, ,000, ,000, ,700, ,200, ,200, ,200, ,600, ,100,000 $ 2,664,868,578 $ 2,437,123,324 $ 2,071,265,930 $ 1,800,081,951 $ 1,831,153,357 $ 1,854,184,134 15,565,042 15,061,353 15,599,674 17,973,986 17,459,321 15,839,281 $ $ $ $ $ $ $ 141,828,530 $ 135,250,234 $ 122,585,407 $ 123,179,914 $ 115,181,177 $ 95,932,778 15,565,042 15,061,353 15,599,674 17,973,986 17,459,321 15,839,281 $ 9.11 $ 8.98 $ 7.86 $ 6.85 $ 6.60 $ 6.06 $ 58,438,038 $ 59,071,341 $ 47,233,127 $ 48,367,121 $ 42,609,759 $ 39,649,263 48, , , , , ,323 $ 58,486,113 $ 59,286,812 $ 47,611,601 $ 48,826,119 $ 42,762,240 $ 39,750, ,700, ,200, ,200, ,200, ,600, ,100, ,900, ,900, ,900, ,900, ,900, ,000,000 18,770,000 17,020,000 17,020,000 17,020,000 16,260,000 15,310,000 2,316,822 3,186,897 6,167,172 7,933,004 6,800,065 6,436,800 $ 21,086,822 $ 20,206,897 $ 23,187,172 $ 24,953,004 $ 23,060,065 $ 21,746, $ 67,871,550 $ 68,222,443 $ 41,949,627 $ 42,228,527 $ 19,227,303 $ 25,048,450 88
97 REVENUE BOND DEBT SERVICE COVERAGE (continued) NET REVENUES Airline Revenue $ 245,708,513 $ 230,537,986 $ 233,326,267 Non-Airline Revenue 217,338, ,896, ,409,975 Interest Income 32,510,098 27,735,256 14,337,950 Other Revenues & Prior Year Transfers 81,178,387 66,929,387 60,358,771 Total Revenues 576,735, ,099, ,432,963 LESS: Operating Expenses (260,303,941) (234,849,253) (234,702,564) Net Revenues $ 316,431,701 $ 290,250,031 $ 273,730,399 DEBT SERVICE 1988A General Airport Subordinated Revenue Bonds $ - $ - $ C General Airport Subordinated Revenue Bonds D General Airport Subordinated Revenue Bonds A General Airport Subordinated Revenue Bonds A Airport System Revenue Bonds A Airport System Revenue Bonds A Airport System Revenue & Refunding Bonds B Airport System Revenue & Refunding Bonds A Airport System Revenue Bonds A Airport System Revenue Bonds 971,072 1,257,695 2,142, B Airport System Revenue Bonds 8,556,063 14,484,458 15,248, C Airport System Revenue & Refunding Bonds A Airport System Revenue Bonds 468,826 1,287,357 1,322, B Airport System Revenue & Refunding Bonds 17,942,588 18,369,760 19,710, A Airport System Revenue & Refunding Bonds 5,891,335 5,855,002 5,946, A Airport System Revenue Bonds 14,291,817 13,623,715 13,976, B Airport System Revenue Bonds 651, , , A Airport System Revenue Bonds 8,556,496 7,794,227 6,320, B Airport System Revenue Bonds 477, , , C Airport System Revenue Variable Rate Refunding Bonds 19,857,135 19,442,226 19,758, D Airport System Revenue Refunding Bonds 5,267,806 4,884,026 2,596, A Airport System Revenue Refunding Bonds 7,490,702 5,886,411 10,185, B Airport System Revenue Refunding Bonds 4,000,040 4,012,211 4,050, C Taxable Airport System Revenue Refunding Bonds 3,266,384 3,275,036 3,295, D Airport System Revenue Variable Rate Bonds 4,754,407 3,366,517 3,230, A Airport System Revenue Refunding Bonds 654, , , B Airport System Revenue Bonds 5,104,256 1,482,108 4,819, C-1 Airport System Revenue Refunding Bonds 16,369,182 16,156,121 8,049, C-2 Airport System Revenue Refunding Bonds 4,924,855 4,992,470 14,346, D Airport System Revenue Refunding Bonds 11,187,696 11,219,448 11,183, A Airport System Revenue Bonds 16,966,776 12,701,790 9,863, B Airport System Revenue Bonds 850, , , C Taxable Airport System Revenue Bonds 289,964 1,677,884 1,647, D Airport System Revenue Bonds 864, , , A Airport System Revenue Bonds 5,810, B Airport System Revenue Bonds 7,854, C Airport System Revenue Refunding Bonds 1,732, A Airport System Revenue Bonds 5,557, B Airport System Revenue Bonds 3,194, Series A Bond Anticipation Commercial Paper Notes - 6,910, ,742 Series B Bond Anticipation Commercial Paper Notes Series One Airport System Revenue Commercial Paper Notes 75, ,384 Series Two Airport System Revenue Commercial Paper Notes 365,833 1,712,774 3,305,008 Net Debt Service $ 184,246,617 $ 163,354,637 $ 164,667,568 DEBT SERVICE COVERAGE Note: Net Revenues are calculated in accordance with the Airports Authority Airport Use Agreement and Premises Lease. Debt Service does not include debt paid from bond funds for capitalized interest or debt service paid from interest earnings. Source: Office of Finance 89
98 Exhibit S $ 225,134,652 $ 202,331,669 $ 195,780,109 $ 181,891,097 $ 184,187,568 $ 169,033,644 $ 159,350, ,783, ,840, ,030, ,871, ,143, ,290, ,346,707 8,356,729 8,727,243 9,642,956 15,472,164 16,161,118 13,202,961 16,386,425 33,211,382 36,138,404 53,132,972 65,104,145 44,655,603 46,904,252 35,745, ,486, ,037, ,586, ,338, ,147, ,431, ,828,843 (210,630,721) (196,433,452) (194,629,440) (187,047,571) (180,595,115) (171,979,528) (152,010,792) $ 234,855,769 $ 199,604,282 $ 198,956,968 $ 204,291,219 $ 210,552,316 $ 194,452,145 $ 179,818,051 $ - $ - $ - $ - $ - $ - $ 3,724, ,949, , ,787 15,069,038 19,108,263 17,769, ,729,503 22,856,951 22,655,731 21,120,185 19,071,482 1,993,757 4,350,565 4,903,913 4,794,599 4,903,808 4,850,857 4,794,336-2,565,300 3,402,230 3,345,168 3,383,814 3,362,031 3,356,384 23,257,594 35,119,965 35,289,120 34,485,341 34,776,289 33,727,975 30,811,993 2,952,191 2,945,565 2,655,447 2,213,032 2,580,111 1,384,999 1,235,188 12,842,186 14,370,024 14,741,589 14,241,097 14,198,177 12,630,866 6,760, , ,634 1,318,158 1,330,610 1,297,815 1,086,168 1,123, ,923 47,548 18,124,292 18,603,575 18,568,291 17,552,433 16,759,523 15,172,783 4,838,581 5,841,298 5,874,163 5,833,633 5,631,732 5,912,982 3,211,571-6,905,090 11,718,857 13,619,313 5,754, , , , , ,615,081 6,173,644 3,022, ,085,449 1,515, , ,934,028 19,158,357 5,037, ,994,667 5,739,300 1,807, ,433,874 2,841, ,603, , ,330,846 1,114, ,656,903 1,227, , ,535, ,353, ,161, ,885, ,579,243 4,044,030 3,994,287 7,005,927 1,527, ,934,188 2,595,462 3,160, , ,844, $ 140,079,210 $ 141,828,530 $ 135,250,234 $ 122,585,407 $ 123,179,914 $ 115,181,177 $ 95,932,
99 REVENUE BOND COVERAGE For Years (Dollars in Thousands) Exhibit S-9 DIRECT NET REVENUE TOTAL OPERATING AVAILABLE FOR DEBT SERVICE REQUIREMENTS YEAR REVENUES 1/ EXPENSES 2/ DEBT SERVICE Principal Interest Total Coverage CY 2007 $ 576,736 $ 260,304 $ 316,432 $ 110,322 $ 73,925 $ 184, CY , , ,250 68,137 95, , CY , , ,730 61, , , CY , , ,856 58,893 81, , CY , , ,604 51,875 89, , CY , , ,957 43,478 91, , CY , , ,291 35,202 87, , CY , , ,552 34,839 88, , CY , , ,453 83,238 31, , CY , , ,818 69,077 26,856 95, / Total Revenues including transfers. 2/ Operating expenses include Telecommunications, Washington Flyer Ground Transportation Subsidy, and Washington Flyer Magazine Subsidy. Note: Calculated based on the Airports Authority Agreed Upon Procedures, not in accordance with generally accepted accounting principles (GAAP). Source: Office of Finance 91
100 AIRPORT INFORMATION Ronald Reagan Washington National Airport As of December 31, 2007 Exhibit S-10 Location: Acres: 3 miles south from downtown Washington D.C. along the Potomac River in Arlington County, VA 860 +/- acres Airport Code: DCA Runways: 1/19 1,030,350 sq ft 15/33 780,600 sq ft 4/22 736,650 sq ft Terminal: Terminal A 55,567 sq ft Terminal B/C 365,743 sq ft Tenants 115,329 sq ft Public/Common 445,914 sq ft Mechanical 153,539 sq ft Total Terminal Sq. Ft. 1,136,092 sq ft Number of Passenger Gates: 44 Number of Loading Bridges: 44 Number of Concessionaires in Terminal: 102 Number of Rental Car Agencies in Garage A: 5 Apron: Commercial Airlines 2,972,637 sq ft Cargo Airlines N/A sq ft FBO 62,900 sq ft Exclusive Ramp Space 45,500 Common Use Ramp Space 253,700 Total Apron Sq. Ft. 3,334,737 Parking: Spaces Assigned: Garage A 872 Valet 230 Garage B & C Daily 3,877 Garage B & C Hourly 455 Economy Lot 2,956 Total Spaces 8,390 Cargo: Air Cargo Building 47,752 sq ft International: N/A Tower(s): TRACON 24 / FBO's Signature Flight Support in Hanger 7 Source: Office of Finance 92
101 AIRPORT INFORMATION Washington Dulles International Airport As of December 31, 2007 Location: 26 miles west from downtown Washington D.C., Located in Fairfax and Loudoun Counties, VA Acres: 11,830 +/- Acres Airport Code: IAD Runways: 12/30 1L/19R 1R/19L Terminal: Signatory Airlines 973,879 sq ft Tenants / Concessions 161,597 sq ft Public/Common 1,075,135 sq ft Mechanical 310,143 sq ft Total Terminal Sq. Ft. 2,520,754 sq ft Number of Passenger Gates: 130 Number of Loading Bridges: 37 Number of Concessionaires in Terminal: 112 Number of Rental Car Agencies on Airport: 8 Airfield Runways 5,025,000 sq ft Taxiways 12,127,386 sq ft Ramps/Aprons 12,595,834 sq ft Shoulders & Blast Pads 11,033,394 sq ft Total Airfield Sq. Ft. 40,781,614 Parking: Spaces Assigned Daily Garage 1 4,680 Daily Garage 2 3,645 Hourly Parking Lot 1,923 Economy 12,378 Valet 830 Overflow 2,499 Cell Phone Lot 100 Total Parking Spaces 26,055 spaces Roadways Lane mileage 219 miles Cargo: Cargo 1 & 2 54,000 sq ft Cargo 3 & 4 61,534 sq ft Cargo 5 277,370 sq ft Cargo 6 131,380 sq ft Total Cargo Sq. Ft. 524,284 International: Customs/Immigration F.I.S. Facility Tower(s): TRACON 24 / 7/ 365 FBO's Source: Office of Finance Landmark Aviation Signature Flight Support Exhibit S-11 93
102 Exhibit S-12 AIRPORTS AUTHORITY EMPLOYEE STRENGTH 1,250 1,200 1,150 1,100 1,050 1,246 1,216 1,193 1,211 1,212 1,151 1,163 1,182 1,171 1,102 1,000 CY 07 CY 06 CY 05 CY 04 CY 03 CY 02 CY 01 CY 00 CY 99 CY 98 94
103 MAJOR PRIVATE EMPLOYERS IN PRIMARY AIR TRADE AREA Exhibit S-13 Regional % of Total Employer City State Employees Employment Industry Lockheed Martin Corp. Bethesda MD 22, % Defense Northrop Grumman Arlington VA 20, % Defense Science Applications International Corp. Landover MD 15, % Technology Inova Health System Fairfax VA 15, % Health Care Marriott International Inc. Bethesda MD 14, % Hospitality MedStar Health Washington DC 13, % Health Care Verizon Communications Reston VA 12, % Communications Booz Allen Hamilton McLean VA 11, % Information Technology Computer Sciences Corporation Arlington VA 11, % Information Technology Constellation Energy Group Baltimore MD 9, % Energy General Dynamics Falls Church VA 7, % Defense IBM Gaithersburg MD 7, % Information Technology BAE Systems Rockville MD 6, % Defense Sunrise Senior Living, Inc. McLean VA 5, % Senior Living Provider Fannie Mae Washington DC 5, % Financial CACI International Inc. Arlington VA 5, % Information Technology Freddie Mac McLean VA 5, % Financial Sprint Nextel Reston VA 5, % Communications SRA International Fairfax VA 3, % Information Technology The Washington Post Co. Washington DC 3, % Publishing Total 201,400 Note: Ten years of data not presented as the rapidly changing company community makes older year information obsolete and noncomparative. Source: Greater Washington Initiative, 2007 Regional Report Source: Post 200, Washington Post Publisher, May 14,
104 EMPLOYMENT BY INDUSTRY Metropolitan Statistical Area - Last Ten Years Exhibit S-14 Industry Type Government Professional Business Services Trade, Transportation and Utilities Educational and Health Services Leisure and Hospitality Natural Resources, Mining and Construction Other Services Financial Activities Information Manufacturing Washington-Arlington-Alexandria, D.C.-Md-Va-W.Va Metropolitan Statistical Area Source: U.S. Department of Labor, Bureau of Labor Statistics Yearly Annual Average Numbers of Employees (in thousands) Employment in Thousands Employment by Industry Years Government Professional Business Services Trade, Transportation and Utilities Educational and Health Services Leisure and Hospitality Natural Resources, Mining and Construction Other Services Financial Activities Information Manufacturing 96
105 POPULATION TRENDS Exhibit S-15 Metropolitan Statistical Area - Last Ten Years (Expressed in Thousands) JURISDICTION District of Columbia Arlington County, VA City of Alexandria, VA Central Jurisdictions Fairfax County, VA Montgomery County, MD Prince George's County, MD City of Fairfax, VA City of Falls Church, VA Inner Suburbs 2, , , , , , , , , ,571.0 Prince William County, VA Loudoun County, VA Frederick County, MD Charles County, MD Stafford County, VA Spotsylvania County, VA Calvert County, MD Fauquier County, VA Manassas City, VA Warren County, VA Jefferson County, WVA Fredericksburg City, VA Clarke County, VA Manassas Park City, VA Outer Suburbs 1, , , , , , , , , ,119.6 DC-MD-VA-WVA Metropolitan Statistical Area 5, , , , , , , , , ,563.0 Prepared by the Office of Finance Source: U.S. Census Bureau, American Factfinder 97
106 AIRCRAFT OPERATIONS BY AIRPORT Takeoff and Landing Operations Exhibit S-16 Ronald Reagan Washington National Airport CALENDAR MAJOR/ REGIONAL/ GENERAL YEAR NATIONALS COMMUTERS AVIATION MILITARY TOTAL , ,024 5, , , ,087 3, , ,417 91,227 3, , , ,333 2, , , ,085 2, , ,259 73,078 2,255 1, , ,347 47,650 32,290 4, , ,285 59,695 44,592 5, , ,589 54,664 48,557 5, , ,926 56,274 49,290 5, ,093 Washington Dulles International Airport CALENDAR MAJOR/ REGIONAL/ GENERAL YEAR NATIONALS COMMUTERS AVIATION MILITARY TOTAL , ,150 64, , , ,372 67, , , ,492 73,629 1, , , ,669 74,689 1, , ,112 27,833 73,668 1, , ,063 26,957 81,732 1, , ,061 27,548 62,643 6, , ,467 52,847 59,417 7, , ,512 49,782 64,429 8, , ,157 25,754 65,842 7, ,184 Source: Office of Finance ` 98
107 LANDED WEIGHTS (Expressed in Thousands of Pounds) Ronald Reagan Washington National Airport CY 2007 CY 2006 CY 2005 CY 2004 CY 2003 AIRLINE Landed Landed Landed Landed Landed Weights Share Weights Share Weights Share Weights 3 Share 3 Weights 3 Share 3 US Airways 3,429, % 3,777, % 4,437, % 3,082, % 3,059, % Delta Airlines + Delta Shuttle 1,380, % 1,521, % 1,510, % 1,411, % 1,489, % American Airlines 1,330, % 1,288, % 1,277, % 1,156, % 1,362, % Northwest Airlines 872, % 875, % 846, % 842, % 916, % Republic Airlines (US Airways Express) 856, % 692, % 26, % Air Wisconsin (US Airways Express) 819, % 724, % 52, % United Airlines 682, % 685, % 671, % 846, % 615, % Continental Airlines 534, % 528, % 506, % 475, % 481, % American Eagle(Flagship) 396, % 425, % 404, % 361, % 363, % Midwest Express 302, % 303, % 305, % 355, % 272, % Comair 262, % 287, % 291, % 417, % 473, % AirTran 245, % 199, % 184, % 182, % 36, % PSA Airlines 196, % 208, % 578, % 302, % 232, % American Trans Air 164, % 180, % 204, % 214, % 158, % Alaska Airlines 155, % 148, % 142, % 94, % 46, % America West Airlines 149, % 215, % 224, % 285, % 172, % Frontier Airlines 141, % 137, % 137, % 128, % 47, % Air Canada 109, % 124, % 159, % 145, % 129, % Continental Express 108, % 123, % 116, % 189, % 113, % Spirit Airlines 102, % 143, % 182, % 125, % 8, % Chautauqua (US Airways Express) 91, % 119, % 213, % 292, % 156, % Pinnacle Airlines 80, % 80, % 106, % 37, % - - Air Canada Jazz 64, % 50, % Shuttle America (Delta Connection) 51, % 1, % Atlantic Southeast 46, % 43, % 50, % 89, % 87, % Piedmont Aviation 44, % 20, % 11, % 95, % 177, % Colgan Air 24, % 25, % 31, % 105, % 11, % Chautauqua (Delta Connection) 19, % 3, % Chautauqua (Continental Express) 15, % Mesaba Airlines 15, % 26, % 50, % Signature Flight Support (FBO) 12, % 5, % 46, % 41, % 30, % Trans States Airlines (US Airways Exp) 8, % Trans States Airlines , % 32, % 100, % 4, % Allegheny Commuter , % 152, % Potomac Air, Inc Trans World Airlines Other 1/ 1, % 13, % , , % Total 2/ 12,718, % 13,000, % 12,802, % 11,471, % 10,834, % 1/ Includes airlines no longer serving the Airport or carriers with insignificant activity. 2/ Percentage may not add to 100 percent due to individual rounding. 3/ Prior year amounts have been adjusted for corrections or additional information. Source: Office of Finance 99
108 Exhibit S-17 CY 2002 CY 2001 CY 2000 CY 1999 FY 1998 Landed Landed Landed Landed Landed Weights 3 Share 3 Weights 3 Share 3 Weights 3 Share 3 Weights 3 Share 3 Weights 3 Share 3 3,115, % 3,615, % 3,952, % 3,257, % 3,539, % 1,713, % 2,191, % 2,415, % 2,346, % 2,253, % 1,311, % 1,187, % 1,449, % 1,487, % 1,512, % 779, % 741, % 901, % 898, % 855, % , % 598, % 689, % 727, % 836, % 534, % 684, % 852, % 866, % 865, % 231, % 127, % 83, % 71, % 86, % 286, % , % 175, % 166, % 98, % , % 58, % 140, % 141, % 126, % 146, % 138, % 156, % , % , % 213, % 125, % 95, % 110, % 43, % 30, % 10, % , % 122, % 171, % 174, % 169, % 67, % 10, % 1, % 11, % 11, % , % 12, % , % 174, % 169, % , % , % 160, % 352, % 368, % 368, % , % 466, % 199, % 73, % 68, % , % 76, % 77, % 116, % 13, % 19, % 25, % 64, % , % 395, % 431, % 436, % 91, % 125, % - - 9, % 55, % 10,113, % 10,838, % 12,400, % 11,413, % 11,773, % 100
109 LANDED WEIGHTS (Expressed in Thousands of Pounds) Washington Dulles International Airport AIRLINE Landed Landed Landed Landed Landed Weights Share Weights Share Weights Share Weights Share Weights Share United Airlines 7,606, % 7,048, % 6,392, % 6,557, % 5,663, % Mesa Airlines 1,520, % 1,847, % 893, % 347, % - - JetBlue Airways 952, % 794, % 523, % 484, % 361, % Shuttle America 629, % 475, % 370, % 173, % - - Landmark Aviation (FBO) 603, % 701, % 551, % 297, % 352, % Trans States Airlines (United Express) 603, % 596, % 678, % 217, % - - American Airlines 544, % 557, % 598, % 587, % 777, % Southwest Airlines 518, % 130, % Signature Flight Support (FBO) 487, % 477, % , % 375, % Delta Airlines 481, % 497, % 530, % 727, % 759, % Lufthansa 443, % 469, % 409, % 317, % 310, % British Airways 438, % 458, % 28, % 529, % 515, % Federal Express 421, % 403, % 401, % 371, % 410, % Air France 398, % 413, % 384, % 321, % 296, % Chautauqua Airlines (United Express) 335, % 200, % GoJet Airlines 306, % 111, % Northwest Airlines 283, % 267, % 289, % 308, % 327, % AirTrans (Valujet) 255, % 267, % 178, % 184, % 211, % Virgin Atlantic 245, % 190, % 165, % 212, % 181, % Colgan Airways (United Express) 210, % 207, % South African Airways 203, % 169, % 64, % All Nippon 202, % 187, % 168, % 168, % 169, % US Airways 164, % 159, % 196, % 185, % 187, % KLM Royal Dutch Airlines 149, % 132, % Taca International 146, % 115, % 107, % 94, % 88, % Continental Express 145, % 178, % 197, % 190, % 135, % Austrian Airlines 137, % 143, % 28, % 145, % 143, % Korean Air 137, % 119, % 111, % 108, % 99, % Scandinavian 126, % 125, % 105, % 111, % 114, % Qatar Amiri Air 96, % Air Canada + Jazz 95, % 95, % 94, % 150, % 166, % Comair, Inc. 91, % 80, % 190, % 101, % 120, % Colgan Airways (US Airways Express) 90, % 85, % 31, % 38, % 33, % United Parcel Service 85, % 83, % 78, % 79, % 79, % Ethiopian Airlines 79, % 59, % 53, % 45, % 40, % Saudi Arabian Airlines 74, % 84, % 61, % 73, % 70, % Airborne Express 71, % 71, % MN Airlines, LLC 61, % 28, % % % % Iberia Airlines 54, % America West 50, % 116, % 146, % 175, % 126, % Virgin America 45, % Trans States Airlines (Amer. Conn) 39, % Continental Airlines, Inc. 36, % 26, % 37, % 44, % 60, % Aer Lingus 33, % Mesa Airlines, Inc. (US Airways Exp.) 33, % 16, % 22, % 23, % 184, % PSA Airlines 27, % 50, % 30, % 4, % - - American Eagle 24, % 66, % 69, % 69, % 69, % MAXjet Airways 24, % 41, % Independence Air + Atlantic Coast , % 3,802, % 3,403, % 2,035, % Air Wisconsin (United Express) , % 896, % 840, % 227, % Other /1 153, % 249, % 1,520, % 1,045, % 442, % TOTAL 2/ 19,975, % 18,669, % 20,413, % 19,161, % 15,140, % 1/ Includes airlines no longer serving the Airport or carriers with insignificant activity. 2/ Percentage may not add to 100 percent due to individual rounding. 3/ FLYi includes both Atlantic Coast and Independence Air. Source: Office of Finance 101
110 Exhibit S Landed Landed Landed Landed Landed Weights Share Weights Share Weights Share Weights Share Weights Share 6,127, % 7,019, % 7,384, % 7,280, % 5,604, % , % 17, % - 244, % 10, % , % , % 347, % ,017, % 858, % 805, % 806, % 827, % , % 246, % , % 864, % 838, % 954, % 1,011, % 311, % 375, % 339, % 224, % 224, % 564, % 403, % 426, % 396, % 403, % 485, % 465, % 482, % 517, % 548, % 268, % 252, % 298, % 248, % 220, % , % , % 524, % 474, % 451, % 386, % 214, % 235, % 244, % 334, % 521, % 189, % 217, % 222, % 187, % 149, % , % 19, % 24, % , % 197, % 203, % 197, % 162, % 249, % 508, % 1,446, % 2,054, % 639, % , % 70, % 52, % 56, % 107, % 118, % 103, % 100, % 102, % 133, % 146, % 120, % 99, % 81, % 95, % 96, % 80, % 104, % 122, % 120, % 114, % 68, % , % 217, % 189, % 120, % 116, % 119, % 76, % 112, % , % 109, % 58, % 19, % 24, % 76, % 66, % 58, % 5, % 55, % 41, % 42, % 44, % 34, % 18, % 77, % 89, % 85, % 96, % 98, % % , % - - 1, % 41, % 82, % , % 143, % , % 261, % , % 52, % 58, % 20, % 54, % 27, % , % 24, % ,217, % 2,373, % 2,251, % 2,088, % 1,743, % 57, % , % 1,001, % 1,018, % 835, % 984, % 16,579, % 17,382, % 17,573, % 17,366, % 14,352, % 102
111 ENPLANEMENTS Exhibit S-19 Ronald Reagan Washington National Airport Domestic NATIONAL COMMERCIAL PASSENGER ANNUAL TOTAL U.S. COMMERCIAL PASSENGER YEAR ENPLANEMENTS GROWTH ENPLANEMENTS 1/ ANNUAL GROWTH CY ,145, % 682,889,947 3/ 3.2% CY ,054, % 661,984, % CY ,736, % 660,677, % CY ,797, % 634,429, % CY ,970, % 587,537, % CY ,356, % 554,048, % CY ,480, % 560,381, % CY ,726, % 599,910, % CY ,388, % 573,211, % CY ,790, % 553,643, % Transborder/International NATIONAL COMMERCIAL PASSENGER ANNUAL TOTAL U.S. COMMERCIAL PASSENGER YEAR ENPLANEMENTS GROWTH ENPLANEMENTS 2/ ANNUAL GROWTH CY , % 78,310,782 4/ 4.0% CY , % 75,267, % CY , % 71,514, % CY , % 66,994, % CY , % 61,551, % CY , % 61,640, % CY , % 63,737, % CY , % 70,247, % CY , % 65,341, % CY , % 61,643, % 1/ Per Bureau of Transportation Statistics "Air Carriers: T-100 Domestic Market." This source replaces the FAA, which had been used as the source for this information in prior years. 2/ Per Bureau of Transportation Statistics "Air Carriers: T-100 International Market." This source replaces the FAA, which had been used as the source for this inforamtion in prior years. 3/ Based on January through November with estimate for December. 4/ Estimated based on actual information through August. Prepared by the Office of Finance Sources: Office of Finance, Bureau of Transportation Statistics 103
112 ENPLANEMENTS Washington Dulles International Airport Domestic Activity Exhibit S-20 DULLES DOMESTIC TOTAL U.S. COMMERCIAL COMMERCIAL PASSENGER ANNUAL PASSENGER YEAR ENPLANEMENTS GROWTH ENPLANEMENTS 1/ ANNUAL GROWTH CY ,313, % 682,889,947 3/ 3.2% CY ,797, % 661,984, % CY ,947, % 660,677, % CY ,014, % 634,429, % CY ,371, % 587,537, % CY ,497, % 554,048, % CY ,958, % 560,381, % CY ,888, % 599,910, % CY ,967, % 573,211, % CY ,188, % 553,643, % International Activity DULLES DOMESTIC TOTAL U.S. COMMERCIAL COMMERCIAL PASSENGER ANNUAL PASSENGER YEAR ENPLANEMENTS GROWTH ENPLANEMENTS 2/ ANNUAL GROWTH CY ,960, % 78,310,782 4/ 4.0% CY ,594, % 75,267, % CY ,448, % 71,514, % CY ,309, % 66,994, % CY ,994, % 61,551, % CY ,017, % 61,640, % CY ,961, % 63,737, % CY ,083, % 70,247, % CY ,841, % 65,341, % CY ,615, % 61,643, % 1/ Per Bureau of Transportation Statistics "Air Carriers: T-100 Domestic Market." This source replaces the FAA, which had been used as the source for this information in prior years. 2/ Per Bureau of Transportation Statistics "Air Carriers: T-100 International Market." This source replaces the FAA, which had been used as the source for this information in prior years. 3/ Based on January through November with estimate for December. 4/ Estimated based on actual information through August. Prepared by the Office of Finance Sources: MWAA Office of Finance, Bureau of Transportation Statistics 104
113 ENPLANEMENT MARKET SHARE Ronald Reagan Washington National Airport CY 2007 CY 2006 CY 2005 CY 2004 CY 2003 Passenger Market Passenger Market Passenger Market Passenger Market Passenger Market AIRLINE Enplanements Share Enplanements Share Enplanements Share Enplanements Share Enplanements Share DOMESTIC AIR CARRIERS US Airways+US Airways Shuttle 2,255, % 2,353, % 2,715, % 2,087, % 1,895, % American 1,214, % 1,132, % 1,119, % 921, % 955, % Delta+Delta Shuttle 957, % 1,073, % 1,131, % 1,095, % 1,050, % Northwest 675, % 666, % 643, % 622, % 587, % United 519, % 511, % 462, % 441, % 398, % Continental 373, % 378, % 357, % 309, % 306, % AirTran 213, % 172, % 155, % 138, % 26, % Midwest 204, % 207, % 187, % 166, % 149, % ATA 159, % 151, % 145, % 165, % 126, % Alaska 142, % 130, % 116, % 77, % 33, % Frontier 128, % 123, % 121, % 72, % 39, % America West 125, % 175, % 172, % 153, % 131, % Spirit 86, % 104, % 135, % 110, % 8, % Trans World Other Air Carriers 1/ % - - REGIONALS Republic (US Airways Express) 594, % 465, % 14, % Air Wisconsin (US Airways Express) 568, % 460, % 32, % American Eagle 258, % 280, % 264, % 215, % 198, % Comair (Delta Connection) 179, % 176, % 158, % 214, % 243, % PSA 139, % 152, % 339, % 191, % 111, % Continental Express 80, % 97, % 90, % 90, % 90, % Chautauqua (US Airways Express) 70, % 95, % 150, % 225, % 115, % Pinnacle 59, % 55, % 62, % 10, % - - Piedmont 28, % 11, % 4, % 47, % 100, % ASA (Delta Connection) 26, % 27, % 35, % 65, % 54, % Chautauqua (Continental Express) 14, % Colgan Airways (US Airways Exp.) 13, % 13, % Mesaba (Northwest Airlink) 9, % 14, % 25, % Trans States (American Connection) , % 25, % 42, % 3, % Liberty Express - - 6, % 58, % 265, % 113, % Allegheny , % 86, % Other Regionals 1/ 45, % 1, % 10, % 41, % 33, % AIR CARRIER -- CHARTERED Other Charters 1/ % GENERAL AVIATION Other General Aviation 1/ % % % MILITARY Other Military 1/ 3, % 2, % 1, % 5, % 3, % TOTAL 9,149, % 9,057, % 8,738, % 7,802, % 6,864, % TRANSBORDER/INTERNATIONAL AIR CARRIERS Air Canada 61, % 76, % 104, % 94, % 79, % US Airways 41, % 48, % 40, % 37, % 33, % REGIONALS Other Regionals 1/ 45, % 60, % 27, % 22, % 18, % GENERAL AVIATION Other General Aviation 1/ TOTAL 148, % 185, % 172, % 154, % 131, % GRAND TOTAL 9,298, % 9,242, % 8,911, % 7,957, % 6,996, % 1/ Includes airlines no longer serving National or airlines with insignificant activity. Note: Prior years' schedules have been adjusted to include charter, general aviation and military passengers. Source: Office of Finance 105
114 Exhibit S-21 CY 2002 CY 2001 CY 2000 CY 1999 CY 1998 Passenger Market Passenger Market Passenger Market Passenger Market Passenger Market Enplanements Share Enplanements Share Enplanements Share Enplanements Share Enplanements Share 1,797, % 2,049, % 2,569, % 2,435, % 2,813, % 921, % 771, % 1,013, % 995, % 1,046, % 1,139, % 1,247, % 1,458, % 1,381, % 1,347, % 522, % 480, % 580, % 574, % 528, % 392, % 372, % 411, % 462, % 528, % 326, % 409, % 544, % 571, % 562, % , % 109, % 105, % 95, % 88, % 121, % 105, % 99, % , % 3, % , % 24, % 10, % , % 122, % 55, % 35, % 42, % , % 10, % , % 252, % 268, % 241, % 19, % 75, % 71, % 43, % 61, % , % 66, % 70, % 70, % 74, % 46, % , % 10, % , % 34, % 95, % 102, % 92, % 58, % 10, % 1, % 6, % 8, % , % 70, % 164, % 184, % 209, % 5, % , % 227, % 126, % 86, % 45, % 66, % 2, % 5, % 9, % 34, % 29, % 72, % 53, % 49, % 61, % - - 3, % 2, % 1, % 1, % , % 81, % 81, % 79, % 4, % % ,361, % 6,527, % 7,807, % 7,469, % 7,870, % 83, % 78, % 108, % 111, % 104, % 11, % % , % 4, % 20, % % % , % 83, % 129, % 112, % 104, % 6,465, % 6,610, % 7,936, % 7,582, % 7,974, % 106
115 ENPLANEMENT MARKET SHARE Washington Dulles International Airport CY 2007 CY 2006 CY 2005 CY 2004 CY 2003 Passenger Market Passenger Market Passenger Market Passenger Market Passenger Market AIRLINE Enplanements Share Enplanements Share Enplanements Share Enplanements Share Enplanements Share DOMESTIC AIR CARRIERS United 3,551, % 3,430, % 3,131, % 3,064, % 2,459, % JetBlue 776, % 666, % 475, % 444, % 342, % American 444, % 450, % 471, % 410, % 438, % Southwest Airlines Co. 368, % 80, % Delta 368, % 384, % 392, % 474, % 531, % AirTran 204, % 199, % 133, % 129, % 166, % Northwest 199, % 196, % 220, % 204, % 174, % US Airways 109, % 101, % 118, % 97, % 118, % America West 39, % 86, % 98, % 120, % 85, % Virgin America 27, % Continental 20, % 15, % 26, % 27, % 39, % Independence Air , % 2,690, % 1,221, % - - Atlantic Coast , % 1,500, % Other Air Carriers 1/ 39, % 31, % 58, % 95, % 69, % REGIONALS Mesa (United Express) 1,279, % 1,602, % 730, % 282, % - - Trans States (United Express) 528, % 498, % 567, % 288, % 2, % Shuttle America (United Express) 375, % 266, % 239, % 110, % - - Chautauqua (United Express) 230, % 127, % 389, % 154, % - - Colgan Air (United Express) 156, % 142, % 22, % Continental Express 103, % 134, % 166, % 153, % 92, % Air Wisconsin (United Express) , % 681, % 641, % 179, % Other Regionals 1/ 486, % 340, % 329, % 272, % 163, % AIR CARRIER -- CHARTERED Other Charters 1/ 1, % % % 3, % 6, % GENERAL AVIATION Landmark Aviation 35, % 36, % 43, % 39, % 40, % Signature Flight Support 72, % 66, % 59, % 60, % 48, % MILITARY Other Military 1/ % % % % TOTAL 9,421, % 8,900, % 11,051, % 9,115, % 6,460, % TRANSBORDER/INTERNATIONAL AIR CARRIERS United 1,350, % 1,105, % 1,004, % 932, % 768, % Lufthansa 203, % 215, % 200, % 163, % 149, % Air France 192, % 201, % 190, % 156, % 139, % British Airways 173, % 182, % 189, % 189, % 187, % Taca International 118, % 98, % 90, % 81, % 72, % Virgin Atlantic 104, % 83, % 75, % 92, % 82, % Austrian 80, % 78, % 81, % 82, % 76, % KLM Royal Dutch 83, % 77, % 73, % 70, % 39, % All Nippon 65, % 70, % 68, % 68, % 62, % SAS 66, % 66, % 74, % 68, % 58, % South African Airways 87, % 58, % 13, % Korean Air 63, % 56, % 60, % 58, % 46, % Air Canada % 4, % 69, % 95, % 95, % Atlantic Coast , % 73, % Northwest , % Other Air Carriers 1/ 159, % 114, % 155, % 155, % 118, % REGIONALS Air Canada Jazz 66, % 63, % Air Wisconsin (United Express) - - 6, % 81, % 51, % - - Other Regionals 1/ 143, % 109, % 17, % AIR CARRIER -- CHARTERED Other Charters 1/ % % % GENERAL AVIATION Other General Aviation 1/ % % 1, % 1, % 1, % MILITARY Other Military 1/ % 1, % 1, % 2, % 2, % TOTAL 2,961, % 2,596, % 2,452, % 2,313, % 1,997, % GRAND TOTAL 12,382, % 11,497, % 13,503, % 11,428, % 8,458, % - 1/ Includes airlines no longer serving Dulles or airlines with insignificant activity. Note: Prior years' schedules have been adjusted to include passengers from charters, general aviation and military. Source: Office of Finance 107
116 Exhibit S-22 CY 2002 CY 2001 CY 2000 CY 1999 CY 1998 Passenger Market Passenger Market Passenger Market Passenger Market Passenger Market Enplanements Share Enplanements Share Enplanements Share Enplanements Share Enplanements Share 2,563, % 3,065, % 3,392, % 3,262, % 2,451, % 219, % 8, % , % 433, % 461, % 449, % 472, % , % 604, % 639, % 668, % 693, % 153, % 190, % 195, % 204, % 343, % 189, % 235, % 207, % 182, % 140, % 125, % 303, % 757, % 1,164, % 444, % 5, % % 15, % 42, % , % 89, % 66, % 47, % 48, % ,583, % 1,602, % 1,592, % 1,493, % 1,242, % 94, % 173, % 187, % 143, % 120, % , % , % 66, % 63, % 67, % 82, % 49, % , % 184, % 324, % 268, % 106, % 8, % 35, % 32, % 25, % 23, % 22, % 37, % 19, % 17, % 16, % 17, % % % % % % 6,571, % 7,011, % 7,931, % 8,007, % 6,228, % 801, % 739, % 850, % 866, % 737, % 153, % 174, % 166, % 122, % 116, % 127, % 119, % 124, % 107, % 91, % 181, % 155, % 192, % 186, % 183, % 71, % 57, % 42, % 41, % 42, % 91, % 105, % 115, % 96, % 76, % 74, % 58, % 47, % 48, % 53, % , % 59, % 77, % 66, % 55, % 60, % 31, % , % 37, % 50, % 27, % 22, % 110, % 126, % 114, % 84, % 65, % 6, % , % 72, % 81, % 84, % 76, % 151, % 222, % 219, % 109, % 94, % % 1, % 1, % % % 5, % 14, % 21, % 27, % 20, % 2,024, % 1,977, % 2,105, % 1,869, % 1,636, % 8,595, % 8,988, % 10,037, % 9,877, % 7,864, % 108
117 CARGO MARKET SHARE ENPLANED (Expressed in Pounds) Ronald Reagan Washington National Airport CY 2007 CY 2006 CY 2005 CY 2004 CY 2003 Cargo Market Cargo Market Cargo Market Cargo Market Cargo Market AIRLINE Weight Share Weight Share Weight Share Weight Share Weight Share DOMESTIC AIR CARRIERS US Airways + US Airways Shuttle 1,661, % 1,210, % 1,037, % 1,727, % 1,832, % ATA 215, % 371, % 589, % 225, % 87, % Continental 163, % 246, % 300, % 487, % 437, % Midwest 146, % 172, % 143, % 277, % 300, % Delta+Delta Shuttle 107, % 141, % 264, % 275, % 379, % Alaska 106, % 120, % 43, % % 22, % America West 86, % 287, % 284, % 381, % 499, % Northwest 69, % 24, % 24, % 41, % 239, % United 17, % 20, % 76, % 172, % 221, % AirTran 7, % 28, % 21, % Frontier 2, , % 36, % American 2, % 4, % 92, % 744, % 289, % Spirit - - 1, % 8, % 32, % 3, % Midway National Trans World REGIONALS Continental Express 35, % 60, % 43, % 30, % 18, % PSA 27, % 56, % 67, % 30, % 20, % Air Wisconsin (US Airways Express) 25, % 138, % 23, % Pinnacle Airlines 4, % 1, % Chautauqua Airlines 3, , % Republic (US Airways Express) 2, % 12, % % Piedmont 2, % 1, % 1, % 13, % 54, % Mesaba Airlines 154 Chautauqua (Delta Connection) % 2, % Chautauqua (US Airways Express) % % 1, % 16, % 28, % American Eagle , % % % 2, % Comair (Delta Connection) , % 32, % 56, % ASA (Delta Connection) , % 40, % 38, % Allegheny , % 31, % US Airways Express (Midway) , % Skyway Airlines % Mesa (America West Express) Potomac Air Liberty Express Business Express TOTAL 2,689, % 2,948, % 3,033, % 4,539, % 4,616, % TRANSBORDER/INTERNATIONAL AIR CARRIERS US Airways 52, % 27, % 12, % 2, % 6, % Air Canada % 1, % 3, % % % REGIONALS Air Wisconsin (US Airways Express) - - 3, % PSA % % % % US Airways Express (Midway) % TOTAL 53, % 32, % 16, % 3, % 7, % GRAND TOTAL 2,742, % 2,980, % 3,050, % 4,543, % 4,623, % 1/ Includes airlines no longer serving National or airlines with insignificant activity. Note: Prior years' comparative information has been corrected for omitted and/or erroneous information. Source: Office of Air Service Development 109
118 Exhibit S-23 CY 2002 CY 2001 CY 2000 CY 1999 CY 1998 Cargo Market Cargo Market Cargo Market Cargo Market Cargo Market Weight Share Weight Share Weight Share Weight Share Weight Share 1,607, % 8,306, % 13,348, % 13,900, % 17,687, % % 561, % 527, % , % 3,054, % 4,247, % 4,626, % 4,840, % 426, % 1,202, % 1,326, % 1,446, % 2,147, % 143, % 3,905, % 7,200, % 8,100, % 8,876, % 20, % , % 1,059, % 571, % 235, % 624, % 331, % 4,717, % 7,312, % 6,928, % 7,876, % 146, % 2,559, % 3,902, % 3,759, % 4,235, % , % 37, % 54, % , % 5,278, % 7,621, % 7,199, % 7,909, % - - 2, % 2, % , % 16, % 86, % 113, % 579, % , % 153, % ,352, % 2,861, % 2,359, % 2,500, % 22, % 4, % 1, % % , % 12, % 48, % 38, % 81, % , % , % 51, % 171, % 205, % 240, % , % - - 2, % 4, % 7, % % % % , % 1, % 1, % 3, % 4, % % 23, % 3, % , % 4, % 3, % 23, % 2, % , % , % 16, % % 3, % 4,380, % 33,522, % 49,448, % 48,950, % 57,635, % 55, % , % 1, % % % 89, % , % 1, % % % 89, % 4,437, % 33,524, % 49,449, % 48,951, % 57,724, % 110
119 CARGO MARKET SHARE ENPLANED (Expressed in Pounds) Washington Dulles International Airport CY 2007 CY 2006 CY 2005 CY 2004 CY 2003 Cargo Cargo Cargo Cargo Cargo AIRLINE Weight Share Weight Share Weight Share Weight Share Weight Share DOMESTIC AIR CARRIERS Federal Express 90,637, % 84,999, % 89,954, % 85,571, % 72,467, % United 47,996, % 44,757, % 42,347, % 55,671, % 62,396, % Airborne Express 13,330, % 11,161, % 10,135, % 10,007, % 8,749, % United Parcel Service 9,522, % 9,210, % 8,522, % 7,394, % 7,347, % Continental 2,296, % 2,484, % 2,893, % 3,181, % 2,811, % American 1,486, % 1,709, % 1,441, % 2,677, % 4,106, % Southwest Airlines 585, , % Delta 547, % 732, % 1,415, % 2,514, % 2,557, % America West 218, % 510, % 390, % 492, % 291, % JetBlue Airways 138, % US Airways 119, % 99, % 83, % 128, % 146, % Northwest 96, % 139, % 168, % 184, % 641, % Mountain Air Cargo 2, AirTran Airlines - - 6, % Emery Worldwide Trans World DHL Airways ,738, % 4,394, % 1,317, % Other 1/ , % 161, % 391, % 513, % ALL-CARGO CHARTERS Other 1/ , % - - REGIONALS Other 1/ 55, % 91, % 244, % 224, % 90, % MILITARY Other 1/ % 1, % - - TOTAL 167,033, % 156,229, % 159,498, % 172,930, % 163,437, % TRANSBORDER/INTERNATIONAL AIR CARRIERS United 96,960, % 106,822, % 64,727, % 50,470, % 39,940, % Lufthansa 21,636, % 20,128, % 17,550, % 14,632, % 12,251, % British Airways 12,824, % 11,246, % 11,563, % 10,578, % 10,758, % Virgin Atlantic 8,941, % 7,924, % 6,585, % 7,404, % 6,485, % Austrian 7,459, % 4,930, % 5,752, % 7,593, % 6,593, % SAS 7,262, % 6,616, % 7,375, % 6,035, % 4,338, % Air France 6,331, % 5,570, % 9,209, % 8,210, % 5,032, % KLM Royal Dutch 5,498, % 4,679, % 4,137, % 3,599, % 1,287, % Qatar Amiri Air 5,196, % All Nippon 12,112, % 9,251, % 6,663, % 6,707, % 7,236, % South African 1,156, % 3,342, % 612, % Iberia Airlines 721, % Saudi Arabian 680, % 631, % 648, % 875, % 886, % Taca International 644, % 859, % 669, % 873, % 913, % Aer Lingus 442, % Polet Cargo 345, % Ethiopian Airlines 316, % 109, % 121, % 116, % 112, % Korean Air 288, % 315, % 313, % 208, % 468, % Aeroflot 97, % 180, % 439, % 1,027, % 874, % Other 1/ 57, % 531, % 508, % 186, % 285, % Swiss Air Transport Sabena Spanair Swiss + Swiss Air ,889, % Northwest ,340, % bmi british midland ,502, % 6,395, % 1,949, % Alitalia - - 1,535, % 3,552, % 2,556, % - - Air Canada , % 30, % 123, % REGIONALS Other 1/ % % - - MILITARY Other 1/ 1,304, % 1,054, % 1,318, % 1,650, % 2,088, % TOTAL 190,278, % 185,729, % 144,277, % 129,154, % 108,858, % GRAND TOTAL 357,312, % 341,958, % 303,776, % 302,084, % 272,295, % 1/ Includes airlines no longer serving the Airport or carriers with insignificant activity. Note: Prior years' comparative information may have been adjusted for revisions and/or corrections to previously reported enplanement information. Source: Office of Air Service Development 111
120 Exhibit S-24 CY 2002 CY 2001 CY 2000 CY 1999 CY 1998 Cargo Cargo Cargo Cargo Cargo Weight Share Weight Share Weight Share Weight Share Weight Share 90,967, % 88,358, % 91,583, % 90,136, % 93,270, % 72,840, % 81,358, % 109,265, % 111,121, % 116,328, % 9,150, % 9,941, % 11,066, % 12,033, % 11,515, % 6,192, % 5,974, % 7,401, % 6,403, % 5,921, % 3,498, % 3,271, % 4,597, % 4,361, % 5,518, % 4,643, % 6,992, % 12,123, % 13,606, % 14,335, % 2,774, % 2,577, % 2,547, % 3,255, % 6,560, % 10, % - - 3, % 85, % 806, % 159, % 469, % 877, % 1,196, % 1,938, % 1,487, % 1,483, % 1,403, % 2,254, % 1,903, % ,319, % 16,957, % 17,866, % 10,139, % , % 473, % 661, % 1, % 8, % 76, % 76, % 993, % , % 1,562, % 1,398, % 1,388, % , % 355, % 1,022, % 131, % 91, % , % 44, % 31, % 93, % 209, % 383, % 183, % 287, % 1, % ,989, % 211,986, % 260,958, % 264,628, % 271,692, % 42,985, % 42,534, % 52,268, % 50,440, % 52,070, % 10,364, % 12,650, % 12,760, % 8,286, % 7,320, % 9,074, % 10,258, % 16,391, % 12,596, % 17,888, % 7,531, % 8,130, % 9,283, % 10,319, % 8,929, % 5,926, % 4,704, % 1,795, % ,874, % 2,397, % ,552, % 5,858, % 5,187, % 5,909, % 5,757, % ,318, % 8,235, % 9,533, % 8,981, % 8,166, % ,225, % 1,672, % 954, % 1,342, % 1,154, % 905, % 940, % 926, % 847, % 996, % 172, % 226, % 259, % 204, % 220, % 672, % 257, % 386, % 922, % 772, % 525, % 546, % 245, % 150, % 215, % 19, % 131, % 53, % 94, % 418, % ,477, % 4,549, % 568, % ,690, % 5,056, % 4,108, % 4,319, % 6,919, % 5,230, % 5,145, % 5,309, % 5,588, % 3,042, % 3,355, % 2,835, % 2,466, % 2,461, % 3,015, % 1,377, % , % 43, % 76, % 70, % 447, % % ,213, % 3,049, % 2,269, % 3,128, % 1,840, % 113,418, % 117,769, % 129,979, % 115,747, % 118,569, % 305,408, % 329,755, % 390,937, % 380,376, % 390,261, % 112
121 PASSENGER FACILITY CHARGES Exhibit S-25 Ronald Reagan Washington National Airport AIRLINE CY 2007 Share CY 2006 Share CY 2005 Share CY 2004 Share CY 2003 Share US Airways $ 13,570, % $ 12,293, % $ 12,611, % $ 10,503, % $ 9,952, % American Airlines 5,227, % 5,387, % 5,390, % 4,375, % 4,258, % Delta Air Lines 4,406, % 4,967, % 5,193, % 5,209, % 5,040, % Northwest Airlines 2,956, % 2,923, % 2,899, % 2,465, % 2,267, % United Airlines 2,573, % 2,710, % 2,677, % 2,616, % 2,028, % Continental Airlines 1,714, % 1,858, % 1,657, % 1,464, % 1,443, % Midwest Airlines 855, % 891, % 777, % 685, % 295, % America West Airlines 854, % 2,645, % 720, % 645, % 598, % AirTran Airlines 799, % 816, % 686, % 615, % 108, % Frontier Airlines 503, % 516, % 503, % 303, % 165, % Alaska Airlines 465, % 427, % 416, % 296, % 135, % ATA 451, % 555, % 566, % 427, % - - Spirit Airlines 367, % 454, % 584, % 481, % 42, % Air Canada 334, % 359, % 354, % 292, % 251, % American Trans Air , % 549, % Midwest Express Airlines , % Other 308, % 316, % 217, % 124, % 114, % TOTAL 1/ $ 35,389, % $ 37,124, % $ 35,259, % $ 30,804, % $ 27,625, % Washington Dulles International Airport AIRLINE CY 2006 Share CY 2006 Share CY 2005 Share CY 2004 Share CY 2003 Share United Airlines $ 27,004, % $ 25,928, % $ 24,225, % $ 24,953, % $ 16,620, % JetBlue Airways 3,092, % 2,773, % 2,094, % 1,949, % 1,578, % Delta Air Lines 1,844, % 1,923, % 2,261, % 2,473, % 2,391, % American Airlines 1,844, % 2,108, % 2,372, % 1,964, % 1,825, % Southwest Airlines 1,601, % 373, % US Airways 1,457, % 1,992, % 1,639, % 1,588, % 703, % Northwest Airlines 1,093, % 1,054, % 1,121, % 1,075, % 796, % Lufthansa Airlines 973, % 1,128, % 1,174, % 1,063, % 862, % AirTran Airlines 848, % 958, % 603, % 586, % 757, % British Airways 740, % 772, % 800, % 811, % 777, % Air France 640, % 681, % 587, % 404, % 404, % Continental Airlines 588, % 669, % 837, % 813, % 503, % Taca International 511, % 426, % 412, % 372, % 301, % South African Airways 468, % 346, % 54, % 5, % 6, % Virgin Atlantic Airways 345, % 334, % 253, % 321, % 230, % Austrian Airlines 341, % 421, % 375, % 384, % 352, % Air Canada 335, % 326, % 331, % 344, % 345, % Scandinavian Airlines 285, % 271, % 284, % 308, % 244, % All Nippon Airways 255, % 269, % 262, % 282, % 186, % Korean Airlines 246, % 211, % 223, % 224, % 180, % America West Airlines 63, % 362, % 402, % 522, % 421, % Alaska Airlines 21, % 57, % 167, % 167, % 219, % Independence Air , % 11,769, % 1,899, % - - Other 1,520, % 817, % 1,009, % 1,011, % 448, % TOTAL 1/ $ 46,122, % $ 44,300, % $ 53,264, % $ 43,529, % $ 30,159, % 1/ Percentage may not add to 100 percent due to individual rounding. Source: Office of Finance 113
122 PRIMARY ORIGINATION AND DESTINATION Exhibit S-26 PASSENGER MARKETS Ronald Reagan Washington National Airport Trip Length* Total O&D Passengers New York, NY SH 1,071,190 Atlanta, GA SH 790,910 Chicago, IL MH 767,720 Boston, MA SH 697,320 Dallas/Ft. Worth, TX MH 423,610 Detroit, MI SH 402,200 Fort Lauderdale, FL MH 383,580 Miami, FL MH 372,660 Orlando, FL MH 341,940 Denver, CO MH 307,500 Houston, TX MH 307,170 Minneapolis/St. Paul, MN MH 285,910 Tampa, FL MH 257,630 Kansas City, MO MH 232,330 Chicago Midway, IL MH 227,290 Seattle/Tacoma, WA LH 219,590 St. Louis, MO MH 209,070 Los Angeles, CA LH 198,000 Indianapolis, IN SH 172,970 West Palm Beach, FL MH 169,910 Phoenix, AZ LH 165,120 New Orleans, LA MH 155,620 Las Vegas, NV LH 154,530 Raleigh/Durham, NC SH 149,060 Milwaukee, WI MH 147,890 Jacksonville, FL MH 147,070 Fort Myers, FL MH 145,780 Omaha, NE MH 133,450 San Diego, CA LH 126,180 Hartford, MA SH 125,510 Note* SH MH LH Short Haul = 0 to 600 miles Medium Haul = 601 to 1,800 miles Long Haul = over 1,801 miles Total 9,288,710 Traffic Source: Year Ending 3Q2007 U.S. DOT O&D Survey Schedule Source: February 2008 OAG Schedule 114
123 PRIMARY ORIGINATION AND DESTINATION Exhibit S-27 PASSENGER MARKETS Washington Dulles International Airport Trip Length* Total O&D Passengers Los Angeles, CA LH 664,670 Orlando, FL MH 590,070 Boston, MA SH 556,590 San Francisco, CA LH 465,320 Atlanta, GA SH 451,100 Las Vegas, NV LH 411,430 Denver, CO MH 371,990 Chicago O'Hare, IL MH 322,990 San Diego, CA LH 311,890 Oakland, CA LH 308,610 Fort Lauderdale, FL MH 289,880 Tampa, FL MH 288,430 Long Beach, CA LH 270,880 Dallas/Ft. Worth, TX MH 248,760 Minneapolis/St. Paul, MN MH 234,660 New York, NY (JFK) SH 218,070 Chicago Midway, IL SH 211,370 Seattle/Tacoma, WA LH 189,740 San Juan, PR MH 136,690 Detroit, MI SH 132,790 St. Louis, MO MH 129,960 Miami, FL MH 118,490 Phoenix, AZ LH 117,890 Salt Lake City, UT LH 112,570 Houston, TX MH 98,630 New Orleans, LA MH 93,630 San Jose, CA LH 93,150 New York, NY (LGA) SH 92,800 West Palm Beach, FL MH 89,650 Portland, OR LH 88,540 Total 7,711,240 Note* SH MH LH Short Haul = 0 to 600 miles Medium Haul = 601 to 1,800 miles Long Haul = over 1,801 miles Traffic Source: Year Ending 3Q2007 U.S. DOT O&D Survey Schedule Source: February 2008 OAG Schedule 115
124 INSURANCE PROGRAM FOR OPERATIONS Exhibit S-28 POLICY RETENTION/ 10/01/05-10/01/06 CARRIER LIMITS UNDERLYING Airport Liability ACE USA $750,000,000 $200,000/$2,000,000 Lloyd's of London War Risk ACE USA $150,000,000 $200,000/$2,000,000 Vehicle Liability ACE USA $50,000,000 $1,000,000 (Excess Layer) Public Officials Liability ACE USA $10,000,000 $3,000,000 Law Enforcement Liability ACE USA $10,000,000 $3,000,000 Employment Practices Liability (VACO) Colony $10,000,000 $1,000,000 Property (All Risk) FM Global $750,000,000 $100,000 Tunnel Collapse $250,000 Flood $250,000,000 $500,000 Earthquake $250,000,000 $100,000 Boiler & Machinery $100,000 Mycom Turbo System $500,000 Terrorism (TRIA) FM Global $750,000,000 $100,000 Noncertified Terrorism FM Global $250,000,000 $100,000 Workers' Compensation Insurance Co. PA (AIG) VA Statutory $250,000/$1,000,000 (Employer's Liability & Jones Act) $1,000,000 (Acc./Dis.) $250,000/$1,000,000 Business Travel Coverage AIG $500,000/$1,000,000 - (Including Foreign) $5,000,000 - Fiduciary Liability Chubb $5,000,000 - Crime National Union Fire $10,000,000 $75,000 Special Coverage Chubb $10,000,000 - Long-Term Disability Hartford 60% of Base Salary N/A Pollution Indian Harbor (XL) $ 5,000,000 1,000,000 (3-yr Term 10/30/05-10/01/08=$94,244) Source: Office of Business Administration 116
125 INSURANCE PROGRAM FOR CONSTRUCTION Owner Controlled Wrap-up Insurance Program Exhibit S-29 COVERAGE POLICY DATE CARRIER LIMIT RETENTION Builder's Risk (includes Terrorism) 10/06-10/07 FM Global $750,000,000 $100,000 Earthquake $200,000,000 Flood $100,000 Debris Removal Blanket Contractor's General Liability 06/01-06/08 St. Paul Fire & Marine $1,000,000 Insurance Company Each Occurrence $2,000,000 General Aggregate (per project) $4,000,000 Products & Completed Operations Aggregate $4,000,000 Personal & Advertising Liability $2,000,000 Medical Expense $10,000 Premises Damage Limit $250,000 Automobile Liability (on-site) 06/01-06/08 St. Paul Fire & Marine $2,000,000 $1,000,000 Insurance Company Per occurrence Workers' Compensation & 06/07-06/08 St. Paul Guardian VA Statutory $1,000,000 Employers Liability Insurance Company Per occurrence Each Accident $2,000,000 Each Employee $2,000,000 Policy Limit $2,000,000 Umbrella Liability 06/01-06/08 National Union Fire $10,000 Insurance Company-AIG Self insured Each occurrence $ 50,000,000 retention General Aggregate $ 50,000,000 Products & Completed Operations Aggregate $ 50,000,000 Excess Liability 06/01-06/08 St. Paul Fire & Marine - Insurance Company Each occurrence $ 25,000,000 Aggregate per Umbrella Liability $ 25,000,000 Excess Liability 06/01-06/08 Starr Excess Liability - Insurance Int'l Ltd Each Occurrence $ 125,000,000 Aggregate per Umbrella Liability $ 125,000,000 Excess Liability 04/08/05-06/08 XL Europe, Ltd $ 50,000,000 - Wellington 2020 $ 25,000,000 Aspen Insurance (UK) Ltd. $ 25,000,000 Each Occurrence $ 100,000,000 Aggregate per Umbrella Liability $ 100,000,000 Contractor's Pollution Liability 10/05-10/06 Indian Harbor $5,000,000 $50,000 Insurance Company - XL Covg. A - Pollution Legal $100,000 Covg. B - Remediation $1,000,000 Covg. C - Legal Defense $100,000 Covg. D - Contingent Trans. $1,000,000 Includes Coverage for: bodily injury, property damage and clean-up costs related to on-site construction projects Source: Office of Business Administration 117
126 (THIS PAGE INTENTIONALLY LEFT BLANK)

127
2009 Comprehensive Annual Financial Report
 2009 Comprehensive Annual Financial Report Washington Dulles International Airport Ronald Reagan Washington National Airport Dulles Corridor METROPOLITAN WASHINGTON AIRPORTS AUTHORITY COMPREHENSIVE ANNUAL
COMPREHENSIVE ANNUAL FINANCIAL REPORT. For the Fiscal Year Ended December 31, 2011
 2011_CAFR_Cover_rev.pdf 1 3/26/12 3:36 PM 2011 COMPREHENSIVE ANNUAL FINANCIAL REPORT For the Fiscal Year Ended December 31, 2011 Intentionally Left Blank METROPOLITAN WASHINGTON AIRPORTS AUTHORITY COMPREHENSIVE
Metropolitan Washington Airports Authority (MWAA)
") RONALD REAGAN WASHINGTON NATIONAL DULLES TOLL ROAD DULLES METRORAIL WASHINGTON DULLES INTERNATIONAL Metropolitan Washington Airports Authority (MWAA) Andrew Rountree Chief Financial Officer & Vice President
RONALD REAGAN WASHINGTON NATIONAL DULLES TOLL ROAD DULLES METRORAIL WASHINGTON DULLES INTERNATIONAL Metropolitan Washington Airports Authority (MWAA) Andrew Rountree Chief Financial Officer & Vice President
Distinguished Budget Presentation
 GOVERNMENT FINANCE OFFICERS ASSOCIATION Distinguished Budget Presentation Award PRESENTED TO Metropolitan Washington Airports Authority Virginia For the Fiscal Year Beginning January 1, 2007 President
Jacksonville Aviation Authority Annual Report The Power Within.
 Jacksonville Aviation Authority Annual Report 2007 The Power Within. Board of Directors & Executive Team Cyrus Jollivette Chairman 1 John D. Clark Executive Director / CEO Jim McCollum Vice-Chairman 2
CONTACT: Investor Relations Corporate Communications
 NEWS RELEASE CONTACT: Investor Relations Corporate Communications 435.634.3200 435.634.3553 Investor.relations@skywest.com corporate.communications@skywest.com SkyWest, Inc. Announces Second Quarter 2016
Committee for Dulles. June 9, Jack Potter, MWAA President & CEO
 Committee for Dulles June 9, 2016 Jack Potter, MWAA President & CEO Dulles International is the Premier International Gateway to the Capital Region Dom Intl Total Mainline Airlines 10 29 37* Destinations
2016 COMPREHENSIVE ANNUAL FINANCIAL REPORT Metropolitan Washington Airports Authority INTENTIONALLY LEFT BLANK
 INTENTIONALLY LEFT BLANK METROPOLITAN WASHINGTON AIRPORTS AUTHORITY COMPREHENSIVE ANNUAL FINANCIAL REPORT FOR THE FISCAL YEARS ENDED DECEMBER 31, 2016 and DECEMBER 31, 2015 BOARD OF DIRECTORS as of December
ACI LEGAL COMMITTEE MEETING
 ACI LEGAL COMMITTEE MEETING MWAA S RAIL TO DULLES PROJECT: WHAT IS IT AND HOW DOES IT FIT WITH THE PRINCIPLES OF REVENUE DIVERSION PHIL SUNDERLAND MWAA GENERAL COUNSEL TWO GOALS FOR THE NEXT TEN MINUTES
AIR CANADA REPORTS 2010 THIRD QUARTER RESULTS; Operating Income improved $259 million or 381 per cent from previous year s quarter
 AIR CANADA REPORTS 2010 THIRD QUARTER RESULTS; Operating Income improved $259 million or 381 per cent from previous year s quarter MONTRÉAL, November 4, 2010 Air Canada today reported operating income
MIRAMAR, Fla., April 29, 2015 (GLOBE NEWSWIRE) -- Spirit Airlines, Inc. (Nasdaq:SAVE) today reported first quarter 2015 financial results.
 -- Spirit Airlines, Inc. (Nasdaq:SAVE) today reported first quarter 2015 financial results.") April 29, 2015 Spirit Airlines Announces First Quarter 2015 Results; Adjusted Net Income Increases 87.1 Percent to $70.7 Million and Pre-Tax Margin Increases 900 Basis Points to 22.7 Percent MIRAMAR, Fla.,
April 29, 2015 Spirit Airlines Announces First Quarter 2015 Results; Adjusted Net Income Increases 87.1 Percent to $70.7 Million and Pre-Tax Margin Increases 900 Basis Points to 22.7 Percent MIRAMAR, Fla.,
SKYWEST, INC. ANNOUNCES THIRD QUARTER 2012 RESULTS
 NEWS RELEASE For Further Information Contact: Michael J. Kraupp Chief Financial Officer and Treasurer Telephone: (435) 634-3212 Fax: (435) 634-3205 FOR IMMEDIATE RELEASE: November 7, 2012 SKYWEST, INC.
Report to the Finance Committee Comprehensive Annual Financial Report. Prepared by the Office of Finance April 2017
 Report to the Finance Committee 2016 Comprehensive Annual Financial Report Prepared by the Office of Finance April 2017 Audit Opinion date March 31, 2017 Unmodified or clean audit opinion on financial
SkyWest, Inc. Announces First Quarter 2018 Profit
 NEWS RELEASE CONTACT: Investor Relations Corporate Communications 435.634.3200 435.634.3553 Investor.relations@skywest.com corporate.communications@skywest.com SkyWest, Inc. Announces First Quarter 2018
Columbus Regional Airport Authority. Financial Statements. July 31, Respectfully Submitted. Randy Bush, CPA, CIA. Chief Financial Officer
 Columbus Regional Airport Authority Financial Statements July 31, 2018 Respectfully Submitted Randy Bush, CPA, CIA Chief Financial Officer Unaudited for internal purposes CRAA Operating Revenue & Expenses
Columbus Regional Airport Authority. Financial Statements. September 30, Respectfully Submitted. Randy Bush, CPA, CIA. Chief Financial Officer
 Columbus Regional Airport Authority Financial Statements September 30, 2018 Respectfully Submitted Randy Bush, CPA, CIA Chief Financial Officer Unaudited for internal purposes CRAA Operating Revenue &
CONTACT: Investor Relations Corporate Communications
 NEWS RELEASE CONTACT: Investor Relations Corporate Communications 435.634.3200 435.634.3553 Investor.relations@skywest.com corporate.communications@skywest.com SkyWest, Inc. Announces Fourth Quarter 2017
OPERATING AND FINANCIAL HIGHLIGHTS. Subsequent Events
 Copa Holdings Reports Net Income of $103.8 million and EPS of $2.45 for the Third Quarter of 2017 Excluding special items, adjusted net income came in at $100.8 million, or EPS of $2.38 per share Panama
Adjusted net income of $115 million versus an adjusted net loss of $7 million in the second quarter of 2012, an improvement of $122 million
 Air Canada Reports Record Second Quarter 2013 Results Highest Adjusted Net Income, Operating Income and EBITDAR Results for Second Quarter in Air Canada s History Adjusted net income of $115 million versus
CONTACT: Investor Relations Corporate Communications
 NEWS RELEASE CONTACT: Investor Relations Corporate Communications 435.634.3200 435.634.3553 Investor.relations@skywest.com corporate.communications@skywest.com SkyWest, Inc. Announces Second Quarter 2017
Columbus Regional Airport Authority. Financial Statements. April 30, Respectfully Submitted. Randy Bush, CPA, CIA. Chief Financial Officer
 Columbus Regional Airport Authority Financial Statements April 30, 2018 Respectfully Submitted Randy Bush, CPA, CIA Chief Financial Officer Unaudited for internal purposes CRAA Operating Revenue & Expenses
Columbus Regional Airport Authority. Financial Statements. August 31, Respectfully Submitted. Randy Bush, CPA, CIA. Chief Financial Officer
 Columbus Regional Airport Authority Financial Statements August 31, 2018 Respectfully Submitted Randy Bush, CPA, CIA Chief Financial Officer Unaudited for internal purposes CRAA Operating Revenue & Expenses
SKYWEST, INC. ANNOUNCES THIRD QUARTER 2014 RESULTS
 NEWS RELEASE For Further Information Contact: Investor Relations Telephone: (435) 634-3203 Fax: (435) 634-3205 FOR IMMEDIATE RELEASE: October 29, 2014 SKYWEST, INC. ANNOUNCES THIRD QUARTER 2014 RESULTS
Copa Holdings Reports Record Earnings of US$41.8 Million for 4Q06 and US$134.2 Million for Full Year 2006
 Copa Holdings Reports Record Earnings of US$41.8 Million for 4Q06 and US$134.2 Million for Full Year 2006 Panama City, Panama --- March 7, 2007. Copa Holdings, S.A. (NYSE: CPA), parent company of Copa
2017 COMPREHENSIVE ANNUAL FINANCIAL REPORT Metropolitan Washington Airports Authority INTENTIONALLY LEFT BLANK
 INTENTIONALLY LEFT BLANK METROPOLITAN WASHINGTON AIRPORTS AUTHORITY COMPREHENSIVE ANNUAL FINANCIAL REPORT FOR THE FISCAL YEARS ENDED DECEMBER 31, 2017 and DECEMBER 31, 2016 BOARD OF DIRECTORS as of December
COUNTY OF ORANGE, CALIFORNIA AIRPORT REVENUE BONDS, SERIES 2009 A & B ANNUAL REPORT FOR FISCAL YEAR ENDED JUNE 30, 2013
 COUNTY OF ORANGE, CALIFORNIA AIRPORT REVENUE BONDS, SERIES 2009 A & B ANNUAL REPORT FOR FISCAL YEAR ENDED JUNE 30, 2013 Dated: January 28, 2014 COUNTY OF ORANGE, CALIFORNIA AIRPORT REVENUE BONDS, SERIES
Columbus Regional Airport Authority. Financial Statements. March 31, Respectfully Submitted. Randy Bush, CPA, CIA. Chief Financial Officer
 Columbus Regional Airport Authority Financial Statements March 31, 2018 Respectfully Submitted Randy Bush, CPA, CIA Chief Financial Officer Unaudited for internal purposes CRAA Operating Revenue & Expenses
AIR CANADA REPORTS THIRD QUARTER RESULTS
 AIR CANADA REPORTS THIRD QUARTER RESULTS THIRD QUARTER OVERVIEW Operating income of $112 million compared to operating income of $351 million in the third quarter of 2007. Fuel expense increased 49 per
Proposed Dulles Toll Road Rate Adjustments
 Proposed Dulles Toll Road Rate Adjustments Dulles Corridor Advisory Committee Meeting October 5, 2012 Discussion Outline Regulatory Process for Changing Toll Rates Information Provided at Public Hearings
Spirit Airlines Reports First Quarter 2017 Results
 Spirit Airlines Reports First Quarter 2017 Results MIRAMAR, Fla., April 28, 2017 - Spirit Airlines, Inc. (NASDAQ: SAVE) today reported first quarter 2017 financial results. GAAP net income for the first
Operating Budget Data
 J00I00 Maryland Aviation Administration Maryland Department of Transportation Operating Budget Data ($ in Thousands) FY 15 FY 16 FY 17 FY 16-17 % Change Actual Working Allowance Change Prior Year Special
Business Plan INTRODUCTION AIRPORT ENTERPRISE FUND OVERVIEW. Master Plan Guiding Principles
 5 Business Plan INTRODUCTION Just as previous chapters have outlined plans for the airport s physical development, this chapter outlines a plan for the airport s financial development. More specifically,
Historical Statistics
 Historical Statistics FedEx Corporation Financial and Operating Statistics FY 2005 FY 2014 This report is a statistical supplement to FedEx s interim financial reports and is prepared quarterly. Additional
Spirit Airlines Reports Fourth Quarter and Full Year 2016 Results
 Spirit Airlines Reports Fourth Quarter and Full Year 2016 Results MIRAMAR, FL. (February 7, 2017) - Spirit Airlines, Inc. (NASDAQ: SAVE) today reported fourth quarter and full year 2016 financial results.
Technical Report Economic Impact Study
 Technical Report 2009 Economic Impact Study Prepared for: Metropolitan Washington Airports Authority 1 Aviation Circle Washington, DC 20001 Prepared by: The Louis Berger Group, Inc. 2445 M Street, NW Washington,
Copa Holdings Reports Net Income of $57.7 million and EPS of $1.36 for the Third Quarter of 2018
 Copa Holdings Reports Net Income of $57.7 million and EPS of $1.36 for the Third Quarter of 2018 November 14, 2018 PANAMA CITY, Nov. 14, 2018 /PRNewswire/ -- Copa Holdings, S.A. (NYSE: CPA), today announced
Report to the Dulles Corridor Advisory Committee
 Report to the Dulles Corridor Advisory Committee Information Report on Dulles Toll Road Toll Rate Adjustment Process and Tentative Schedule and Overview of Traffic and Revenue Study Update May 2018 Purpose
United Global Performance Commitment 2017
 United Global Performance Commitment 2017 A PERFORMANCE COMMITMENT FOR THE COMPLETE TRAVEL PROCESS OUR COMMITMENT The most comprehensive and competitive performance commitment industry-wide. 1 More On
Copa Holdings Reports Net Income of $136.5 million and EPS of $3.22 for the First Quarter of 2018
 Copa Holdings Reports Net Income of $136.5 million and EPS of $3.22 for the First Quarter of 2018 May 9, 2018 PANAMA CITY, May 9, 2018 /PRNewswire/ -- Copa Holdings, S.A. (NYSE: CPA), today announced financial
Chapter 9: Financial Plan Draft
 Chapter 9: Draft TABLE OF CONTENTS 9... 5 9.2.1 ABIA Accounting... 6 9.2.2 Legal Environment... 6 9.2.3 Governing Documents... 8 9.3.1 FAA AIP Grants... 13 9.3.2 Local ABIA Funds... 14 9.4.1 Defer or Delay
Greater Orlando Aviation Authority
 Greater Orlando Aviation Authority Orlando International Airport & Orlando Executive Airport Budgets Fiscal Year 2017-2018 Greater Orlando Aviation Authority Orlando, Florida Greater Orlando Aviation Authority
CHAPTER 1 EXECUTIVE SUMMARY
 CHAPTER 1 EXECUTIVE SUMMARY 1 1 EXECUTIVE SUMMARY INTRODUCTION William R. Fairchild International Airport (CLM) is located approximately three miles west of the city of Port Angeles, Washington. The airport
Rates & Charges Analysis
 Aeronautics Division Rates & Charges Analysis Executive Summary Executive Summary In This Report: Airlines Rates and Charges Other Building Rental Rates Landing Fees Parking Rates Tie-Downs Special Use
OPERATING AND FINANCIAL HIGHLIGHTS
 Copa Holdings Reports Financial Results for the Fourth Quarter of 2018 Excluding special items, adjusted net profit came in at $44.0 million, or Adjusted EPS of $1.04 Panama City, Panama --- February 13,
National Society of Professional Engineers. Charles S. Carnaggio, PE Project Director July 2, 2014
 National Society of Professional Engineers Charles S. Carnaggio, PE Project Director July 2, 2014 Phase 1 Opening Date: July 26, 2014 Dulles Corridor Metrorail Project At-a-Glance Seamless integration
SECURITIES AND EXCHANGE COMMISSION Washington, D.C Form 10-Q SKYWEST, INC.
 SECURITIES AND EXCHANGE COMMISSION Washington, D.C. 20549 Form 10-Q QUARTERLY REPORT UNDER SECTION 13 OR 15(d) OF THE SECURITIES EXCHANGE ACT OF 1934 For the quarterly period ended June 30, 2013 OR TRANSITION
Welcome Fairfax County Transportation Advisory Commission and FC-DOT Staff
 Welcome Fairfax County Transportation Advisory Commission and FC-DOT Staff July 29, 2014 Metropolitan Washington Airports Authority MWAA was created through a bi-state compact between the Commonwealth
Spirit Airlines Reports Highest Second Quarter Pre-Tax Margin in Company History
 July 24, 2013 Spirit Airlines Reports Highest Second Quarter Pre-Tax Margin in Company History MIRAMAR, Fla., July 24, 2013 (GLOBE NEWSWIRE) -- Spirit Airlines, Inc. (Nasdaq:SAVE) today reported second
PORT OF SEATTLE PRESENTATION TO THE WESTERN STATES INSTITUTIONAL INVESTORS CONFERENCE MAY 15, 2018
 PORT OF SEATTLE PRESENTATION TO THE WESTERN STATES INSTITUTIONAL INVESTORS CONFERENCE MAY 15, 2018 Elizabeth Morrison, Port of Seattle Director of Corporate Finance 0 OVERVIEW Regional Economy Port Financial
OPERATING AND FINANCIAL HIGHLIGHTS SUBSEQUENT EVENTS
 Copa Holdings Reports Net Income of US$6.2 Million and EPS of US$0.14 for the Third Quarter of 2015 Excluding special items, adjusted net income came in at $37.4 million, or EPS of $0.85 per share Panama
Session 6 Airport Finance 101 Funding Sources for Airports
 Session 6 Airport Finance 101 Funding Sources for Airports 31 st Annual AAAE Basics of Airport Law Workshop and 2015 Legal Update November 1-3, 2015 Desk Reference Chapters 2, 19, 22 Frank J. San Martin
Annual Airport Finance and Administration Conference Innovative Funding Strategies. March 4, 2013 Destin, Florida Bonnie Deger Ossege
 Annual Airport Finance and Administration Conference Innovative Funding Strategies March 4, 2013 Destin, Florida Bonnie Deger Ossege OVERVIEW Trends- Capital Improvement Programs Determine Your Airport
Copa Holdings Reports Fourth Quarter and Full Year 2007 Results
 Copa Holdings Reports Fourth Quarter and Full Year 2007 Results Panama City, Panama --- February 21, 2008. Copa Holdings, S.A. (NYSE: CPA), parent company of Copa Airlines and Aero Republica, today announced
Investor Update Issue Date: April 9, 2018
 Investor Update Issue Date: April 9, 2018 This investor update provides guidance and certain forward-looking statements about United Continental Holdings, Inc. (the Company or UAL ). The information in
AIR CANADA REPORTS FIRST QUARTER RESULTS
 AIR CANADA REPORTS FIRST QUARTER RESULTS As a result of the deconsolidation of Jazz effective May 24, 2007, Air Canada s consolidated results for the first quarter of 2008 are not directly comparable to
RAPID CITY REGIONAL AIRPORT
 RAPID CITY REGIONAL AIRPORT Budget: $16,232,274 Full time Employees: 24 Mission Statement It is the mission of the Rapid City Regional Airport Board to provide safe, efficient, environmentally sensitive,
Financial Proposal for Gwinnett County Airport Briscoe Field
 Financial Proposal for Gwinnett County Airport Briscoe Field Financial Proposal For the Lease, Operation and Improvement RP039-11 of GWINNETT COUNTY AIRPORT BRISCOE FIELD Presented To Gwinnett County Board
Cathay Pacific Airways Limited Abridged Financial Statements
 To provide shareholders with information on the results and financial position of the Group s significant listed associated company, Cathay Pacific Airways Limited, the following is a summary of its audited
OPERATING AND FINANCIAL HIGHLIGHTS. Subsequent Events
 Copa Holdings Reports Net Income of US$113.1 Million and EPS of US$2.57 for the First Quarter of 2015 Excluding special items, adjusted net income came in at US$106.0 million, or EPS of US$2.41 per share
THIRD QUARTER RESULTS 2017
 THIRD QUARTER RESULTS 2017 KEY RESULTS In the 3Q17 Interjet total revenues added $5,835.1 million pesos that represented an increase of 22.0% over the revenue generated in the 3Q16. In the 3Q17, operating
Melco International Development Limited (Incorporated in Hong Kong with limited liability) Website : (Stock Code : 200)
 Website : (Stock Code : 200)") Hong Kong Exchanges and Clearing Limited and The Stock Exchange of Hong Kong Limited take no responsibility for the contents of this announcement, make no representation as to its accuracy or completeness
Hong Kong Exchanges and Clearing Limited and The Stock Exchange of Hong Kong Limited take no responsibility for the contents of this announcement, make no representation as to its accuracy or completeness
Airline Business Development Update. June 22, 2017
 Airline Business Development Update June 22, 2017 Office of Airline Business Development s Primary Mission Expanding Air Service at Dulles International and Discouraging New Flights at Reagan National
AMERICAN AIRLINES GROUP REPORTS DECEMBER TRAFFIC RESULTS
 Corporate Communications 817-967-1577 mediarelations@aa.com Investor Relations 817-931-3423 investor.relations@aa.com FOR RELEASE: Monday, AMERICAN AIRLINES GROUP REPORTS DECEMBER TRAFFIC RESULTS FORT
OPERATING AND FINANCIAL HIGHLIGHTS
 Copa Holdings Reports Financial Results for the Fourth Quarter of 2015 Excluding special items, adjusted net income came in at $31.7 million, or EPS of $0.73 per share Panama City, Panama --- February
OFFICE OF THE AUDITOR
 OFFICE OF THE AUDITOR DEPARTMENT OF AVIATION (FORMERLY AMERICAN TRANS AIR, INC.) REVENUE AND CONTRACT COMPLIANCE AUDIT JUNE 2006 Dennis J. Gallagher Auditor Dennis J. Gallagher Auditor City and County
JANUARY 2018 BOARD INFORMATION PACKAGE
 JANUARY 2018 BOARD INFORMATION PACKAGE MEMORANDUM TO: Members of the Airport Authority FROM: Lew Bleiweis, Executive Director DATE: January 19, 2018 Financial Report (document) Informational Reports: A.
Chapter VI Implementation Planning
 Chapter VI Implementation Planning This chapter presents a general financial plan for the capital improvements recommended in the Master Plan. The purpose of the financial plan is to demonstrate that the
Cathay Pacific Airways Limited Abridged Financial Statements
 To provide shareholders with information on the results and financial position of the Group s significant listed associated company, Cathay Pacific Airways Limited, the following is a summary of its audited
Spirit Airlines Reports First Quarter 2018 Results
 Spirit Airlines Reports First Quarter 2018 Results MIRAMAR, Fla., April 26, 2018 - Spirit Airlines, Inc. (NYSE: SAVE) today reported first quarter 2018 financial results. For the first quarter 2018, Spirit
Copa Holdings Reports Net Income of US$113.9 Million for the Fourth Quarter of 2013
 Copa Holdings Reports Net Income of US$113.9 Million for the Fourth Quarter of 2013 Panama City, Panama --- February 12, 2014. Copa Holdings, S.A. (NYSE: CPA), today announced financial results for the
THIRD QUARTER AND NINE MONTHS OF 2014 KEY RESULTS
 THIRD QUARTER AND NINE MONTHS OF 2014 KEY RESULTS In 3Q14 INTERJET total revenues were $ 3,643.4 million, representing an increase of 9.9% on revenues generated in the 3Q13. Accumulated 9M14 INTERJET total
AIR CANADA REPORTS FULL YEAR AND FOURTH QUARTER 2010 RESULTS
 AIR CANADA REPORTS FULL YEAR AND FOURTH QUARTER 2010 RESULTS Record annual EBITDAR of $1.386 billion, 104 per cent improvement Operating income improvement of $677 million Employees to receive special
SECURITIES AND EXCHANGE COMMISSION Washington, D.C Form 10-Q SKYWEST, INC.
 prorate SECURITIES AND EXCHANGE COMMISSION Washington, D.C. 20549 Form 10-Q QUARTERLY REPORT UNDER SECTION 13 OR 15(d) OF THE SECURITIES EXCHANGE ACT OF 1934 For the quarterly period ended June 30, 2018
Copa Holdings Reports Net Income of $49.9 million and EPS of $1.18 for the Second Quarter of 2018
 Copa Holdings Reports Net Income of $49.9 million and EPS of $1.18 for the Second Quarter of 2018 Panama City, Panama --- Aug 8, 2018. Copa Holdings, S.A. (NYSE: CPA), today announced financial results
RECOMMENDED 2013 BUDGET
 RECOMMENDED 2013 BUDGET December 12, 2012 Budget Highlights Draft October 17, 2012 Aviation Operation & Maintenance (O&M) Expenses 1.5 percent overall O&M increase (including debt service) 2013 Salary
Q1 Fiscal 2018 Statistics
 Q1 Fiscal 2018 Statistics FedEx Corporation Financial and Operating Statistics First Quarter Fiscal 2018 September 19, 2017 This report is a statistical supplement to FedEx s interim financial reports
Thank you for participating in the financial results for fiscal 2014.
 Thank you for participating in the financial results for fiscal 2014. ANA HOLDINGS strongly believes that safety is the most important principle of our air transportation business. The expansion of slots
AIR CANADA REPORTS 2010 FIRST QUARTER RESULTS Operating loss narrows; revenue and traffic growth reflect strengthening economy
 AIR CANADA REPORTS 2010 FIRST QUARTER RESULTS Operating loss narrows; revenue and traffic growth reflect strengthening economy MONTRÉAL, May 6, 2010 Air Canada today reported a reduced operating loss of
STANSTED AIRPORT LIMITED REGULATORY ACCOUNTS PERFORMANCE REPORT FOR THE YEAR ENDED 31 MARCH Financial Review...1. Performance Report...
 PERFORMANCE REPORT CONTENTS Page Financial Review...1 Performance Report...3 Notes to the Performance Report...4 Stansted Regulatory Accounts PERFORMANCE REPORT Financial Review General overview Stansted
The Economic Impact of Tourism in Maryland. Tourism Satellite Account Calendar Year 2015
 The Economic Impact of Tourism in Maryland Tourism Satellite Account Calendar Year 2015 MD tourism economy reaches new peaks The Maryland visitor economy continued to grow in 2015; tourism industry sales
Balance sheets and additional ratios
 Balance sheets and additional ratios amounts in millions unless otherwise stated Consolidated balance sheets Dutch guilders USD* June 30, December 31, June 30, December 31, 1997 1996 1997 1996 Fixed assets
ECONOMIC DEVELOPMENT INCENTIVES AND PROGRAMS. Provide Airport Encroachment Protection. Standardize Ad Valorem Tax Exemptions
 ECONOMIC MASTER PLAN Florida s airport industry indicates the following programs are needed to maximize its impact on the State s economy: AIRPORT SECURITY Develop Model Security Plan for General Aviation
OPERATING AND FINANCIAL HIGHLIGHTS
 Copa Holdings Reports Net Income of US$18.6 Million and EPS of US$0.42 for the Second Quarter of 2010 Excluding special items, adjusted net income came in at $26.3 million, or $0.60 per share Panama City,
Historical Statistics
 Historical Statistics FedEx Corporation Financial and Operating Statistics FY 2006 FY 2015 This report is a statistical supplement to FedEx s interim financial reports and is prepared annually. Additional
January 1 through December 31, 2017
 2017 Budget Book Cover Final-12-12-2016.pdf 1 12/12/16 10:04 AM 2017 January 1 through December 31, 2017 REAGAN NA ATIONAL AIRPORT DULL LES CORRIDOR METRORAIL DULLES T OLL ROAD DULLES INTERNAT A IONAL
AMERICAN AIRLINES GROUP REPORTS RECORD DECEMBER TRAFFIC RESULTS
 Corporate Communications 817-967-1577 mediarelations@aa.com Investor Relations 817-931-3423 investor.relations@aa.com FOR RELEASE: Tuesday, AMERICAN AIRLINES GROUP REPORTS RECORD DECEMBER TRAFFIC RESULTS
The Global Competitiveness of the U.S. Aviation Industry: Addressing Competition Issues to Maintain U.S. leadership in the Aerospace Market
 121 North Henry Street Alexandria, VA 22314-2903 T: 703 739 9543 F: 703 739 9488 arsa@arsa.org www.arsa.org The Global Competitiveness of the U.S. Aviation Industry: Addressing Competition Issues to Maintain
OPERATING AND FINANCIAL HIGHLIGHTS. Subsequent Events
 Copa Holdings Reports Financial Results for the First Quarter of 2016 Excluding special items, adjusted net income came in at US$69.9 million, or EPS of US$1.66 per share Panama City, Panama --- May 5,
Financial Feasibility Analysis Terminal Programming Study Des Moines Airport Authority
 Financial Feasibility Analysis Terminal Programming Study Des Moines Airport Authority September 12, 2017 Contents 1. Funding Sources for Airport Projects 2. Financial Metrics 3. CIP Summary and Funding
AirportInfo. Airport Operating Expenses
 AirportInfo Airport Operating Expenses November 2014 Overview of U.S. Enplanements, Revenues and Expenses Percentage Change from Base Year 2001 80% Enplanements Revenues Expenses 70% 60% 50% 40% 30% 20%
The Airport. p a g e 2
 The Airport Boise Airport is joint civil-military airport three miles south of Boise, Idaho. The airport is operated by the city of Boise Department of Aviation and is overseen by an Airport Commission.
AIRPORT FUND. Description. Summary
 Description In March 1941 construction started for the airport at its present site. After Pearl Harbor, the airport, known as Pinellas Army Airfield, was used as a military flight-training base. After
Chapter 2 FINDINGS & CONCLUSIONS
 Chapter 2 FINDINGS & CONCLUSIONS 2.01 GENERAL Dutchess County acquired the airport facility in 1947 by deed from the War Assets Administration. Following the acquisition, several individuals who pursued
Investor Update September 2017 PARTNER OF CHOICE EMPLOYER OF CHOICE INVESTMENT OF CHOICE
 Investor Update September 2017 PARTNER OF CHOICE EMPLOYER OF CHOICE INVESTMENT OF CHOICE 1 Forward Looking Statements In addition to historical information, this presentation contains forward-looking statements
Spirit Airlines Reports Second Quarter 2018 Results
 Spirit Airlines Reports Second Quarter 2018 Results MIRAMAR, Fla., July 25, 2018 - Spirit Airlines, Inc. (NYSE: SAVE) today reported second quarter 2018 financial results. GAAP net income for the second
Copa Holdings Reports Earnings of US$30.3 Million and EPS of US$0.70 for 3Q08
 Copa Holdings Reports Earnings of US$30.3 Million and EPS of US$0.70 for 3Q08 Panama City, Panama --- November 13, 2008. Copa Holdings, S.A. (NYSE: CPA), parent company of Copa Airlines and Aero Republica,
Q4 Fiscal 2018 Statistics
 Q4 Fiscal 2018 Statistics FedEx Corporation Financial and Operating Statistics Fourth Quarter Fiscal 2018 June 19, 2018 This report is a statistical supplement to FedEx s interim financial reports and
Melco International Development Limited (Incorporated in Hong Kong with limited liability) Website : (Stock Code : 200)
 Website : (Stock Code : 200)") Hong Kong Exchanges and Clearing Limited and The Stock Exchange of Hong Kong Limited take no responsibility for the contents of this announcement, make no representation as to its accuracy or completeness
Hong Kong Exchanges and Clearing Limited and The Stock Exchange of Hong Kong Limited take no responsibility for the contents of this announcement, make no representation as to its accuracy or completeness
 Existing Conditions AIRPORT PROFILE Passenger Terminal Complex 57 air carrier gates 11,500 structured parking stalls Airfield Operations Area 9,000 North Runway 9L-27R 6,905 Crosswind Runway 13-31 5,276
EXHIBIT K TERMINAL PROJECT PROCEDURES PHASE I - DEVELOPMENT OF TERMINAL PROGRAM & ALTERNATIVES
 EXHIBIT K TERMINAL PROJECT PROCEDURES PHASE I - DEVELOPMENT OF TERMINAL PROGRAM & ALTERNATIVES Over the term of the Master Amendment to the Airline Use and Lease Agreement, the Kansas City Aviation Department