2017 COMPREHENSIVE ANNUAL FINANCIAL REPORT Metropolitan Washington Airports Authority INTENTIONALLY LEFT BLANK
|
|
|
- Eustace McDowell
- 5 years ago
- Views:
Transcription
1

2 INTENTIONALLY LEFT BLANK
3 METROPOLITAN WASHINGTON AIRPORTS AUTHORITY COMPREHENSIVE ANNUAL FINANCIAL REPORT FOR THE FISCAL YEARS ENDED DECEMBER 31, 2017 and DECEMBER 31, 2016 BOARD OF DIRECTORS as of December 31, 2017 Warner H. Session, Acting Chairman Earl Adams, Jr. Anthony H. Griffin The Honorable Katherine K. Hanley Barbara Lang The Honorable Robert W. Lazaro, Jr. Caren Merrick A. Bradley Mims Thorn Pozen The Honorable David G. Speck William E. Sudow The Honorable J. Walter Tejada Mark E. Uncapher Nina Mitchell Wells Joslyn N. Williams EXECUTIVE STAFF John E. Potter, President and Chief Executive Officer Margaret E. McKeough, Executive Vice President and Chief Operating Officer Jerome L. Davis, Executive Vice President and Chief Revenue Officer Andrew T. Rountree, CPA, Senior Vice President for Finance and Chief Financial Officer Monica R. Hargrove, Vice President and Secretary Lee Wyckoff, Vice President for Audit Prepared by the Office of Finance Geographically located in Virginia serving the Metropolitan Washington, D.C. area
4 INTENTIONALLY LEFT BLANK
5 METROPOLITAN WASHINGTON AIRPORTS AUTHORITY Comprehensive Annual Financial Report For the Fiscal Years Ended December 31, 2017 and December 31, 2016 Table of Contents INTRODUCTORY SECTION (unaudited) Transmittal Letter Certificate Of Achievement For Excellence In Financial Reporting Organizational Chart FINANCIAL SECTION Report Of Independent Auditor Management s Discussion And Analysis (unaudited) Basic Financial Statements Statement Of Net Position Statement Of Revenues, Expenses And Changes In Net Position Statement Of Cash Flows Notes To Financial Statements Summary of Significant Accounting Policies Airport Use Agreement and Premises Lease The Dulles Toll Road and Construction of The Dulles Metrorail Project Deposits and Investments Accounts Receivable Pension Plans and Deferred Compensation Plan Post-Employment Benefits Changes in Capital Assets Accounts Payable Lease Commitments i
6 11. Changes in Long-Term Non-Debt Liabilities Accounting and Financial Reporting for Derivatives Capital Debt Net Position Aviation Enterprise Fund Revenues Government Grants Passenger Facility Charges Risk Management Other Commitments and Contingencies Litigation Subsequent Events REQUIRED SUPPLEMENTAL INFORMATION (unaudited) Schedule 1 Schedule of Funding Progress for Post-Employment Benefits Schedule 2 Changes in Net Pension Liability (Asset) and Related Ratios Schedule 3 Schedule of Funding Progress for Defined Benefit Pension Plans Schedule 4 Schedule of Employer Contributions STATISTICAL SECTION (unaudited) Exhibit S-1 Components of Net Position Exhibit S-2 Revenues, Expenses and Changes in Net Position Exhibit S-3 Operating Expenses by Business Unit Exhibit S-4 Operating Revenues by Business Unit Exhibit S-5 Operating Revenues Reagan National Exhibit S-6 Operating Revenues Dulles International Exhibit S-7 Rates and Charges Exhibit S-8 Concession Revenues and Enplanements Reagan National Exhibit S-9 Concession Revenues and Enplanements Dulles International Exhibit S-10 Dulles Toll Road Transactions and Revenues Exhibit S-11 Dulles Toll Road Monthly Transactions and Revenues Exhibit S-12 Top 10 Payors ii
7 Exhibit S-13 Debt Service Coverage Aviation Enterprise Fund Exhibit S-14 Debt Service Coverage Dulles Corridor Enterprise Fund Exhibit S-15 Debt Service Requirements by Enterprise Fund Exhibit S-16 Ratios of Outstanding Debt Exhibit S-17 Airport Information Exhibit S-18 Dulles Toll Road Information Exhibit S-19 Employment by Industry Exhibit S-20 Major Private Employers Exhibit S-21 Population Trends Exhibit S-22 Airports Authority Employee Strength Exhibit S-23 Aircraft Operations by Airport Reagan National Exhibit S-24 Aircraft Operations by Airport Dulles International Exhibit S-25 Commercial Passenger Enplanements Exhibit S-26 Market Share by Landed Weight Reagan National Exhibit S-27 Market Share by Landed Weight Dulles International Exhibit S-28 Market Share by Passenger Enplanements Reagan National Exhibit S-29 Market Share by Passenger Enplanements Dulles International Exhibit S-30 Market Share by Passenger Enplanements Both Airports Exhibit S-31 Market Share by Enplaned Cargo Weight Reagan National Exhibit S-32 Market Share by Enplaned Cargo Weight Dulles International Exhibit S-33 Passenger Facility Charges by Airport Exhibit S-34 Top 30 Passenger Origination and Destination Markets in 2017 Reagan National Exhibit S-35 Top 30 Passenger Origination and Destination Markets in 2017 Dulles International Exhibit S-36 Top 10 Passenger Origination and Destination Markets Reagan National Exhibit S-37 Top 10 Passenger Origination and Destination Markets Dulles International Exhibit S-38 Airline Tenants Both Airports iii
8 Exhibit S-39 Non-Airline Tenants Reagan National Exhibit S-40 Non-Airline Tenants Dulles International iv
9
10 Management s discussion and analysis (MD&A) immediately follows the independent auditor s report and provides a narrative introduction, overview, and analysis of the basic financial statements. The MD&A complements this Transmittal Letter and should be read in conjunction with it. THE AIRPORTS AUTHORITY AND ITS PURPOSE The Airports Authority is a public body politic and corporate, created with the consent of the Congress of the United States by an Act of the District of Columbia and an Act of the Commonwealth for the purpose of operating, maintaining, and improving Ronald Reagan Washington National Airport (Reagan National) and Washington Dulles International Airport (Dulles International), (collectively, the Airports). The Airports had historically been managed by the Federal Aviation Administration (FAA) of the United States Department of Transportation (DOT). Pursuant to an Agreement and Deed of Lease, effective June 7, 1987, the Airports were transferred by the United States Government to the Airports Authority for an initial term of 50 years in accordance with the Metropolitan Washington Airports Act of 1986 (the Federal Act). On June 17, 2003, the Agreement and Deed of Lease was extended 30 years to June 6, Pursuant to the Master Transfer Agreement, dated December 29, 2006 and effective November 1, 2008, the Virginia Department of Transportation (VDOT) granted a permit for the operation and maintenance of the Dulles Toll Road to the Airports Authority for a term of 50 years. As part of the agreement with the Commonwealth, the Airports Authority is constructing the Dulles Metrorail Project with an eastern terminus near the West Falls Church Metrorail Station on Interstate 66 and a western terminus of Virginia Route 772 in Loudoun County and is making other improvements in the Dulles Corridor consistent with VDOT and regional plans. The Dulles Corridor is defined as the transportation corridor with an eastern terminus of the East Falls Church Metrorail Station at Interstate Route 66 and a western terminus of VA Route 772 in Loudoun County, Virginia. The Airports Authority is an independent interstate agency governed by a 17-member Board of Directors (the Board). The Board is appointed as follows: seven members by the Governor of Virginia subject to confirmation by the Virginia General Assembly, four members by the Mayor of the District of Columbia subject to confirmation by the Council of the District of Columbia, three members by the Governor of Maryland, and three members by the President of the United States with the advice and consent of the United States Senate. Members serve staggered, six-year terms without compensation and may be reappointed once. The Board establishes the Airports Authority s policy and appoints the President and Chief Executive Officer to oversee the operations of the Airports Authority. The Board annually elects a Chairman, Vice Chairman, and Secretary. As of December 31, 2017 two Federal appointments were vacant. Aviation Enterprise Fund The Airports Authority operates a two-airport system that provides domestic and international air service for the mid-atlantic region. All aviation-related activity is accounted for within the Aviation Enterprise Fund. The Air Trade Area for the Airports Authority is comprised of the District of Columbia, five Maryland counties, eleven Virginia counties, six independent Virginia cities, and one West Virginia county. The Aviation Enterprise Fund uses aircraft landing fees, fees from terminal and other rentals, and revenue from concessions to fund operating and maintenance expenses. The operations of the Airports Authority are not taxpayer-funded, with the exception of a discretionary grant of $50.0 million from the Commonwealth, $25.0 million of which is applicable to 2017, and $25.0 million of which will be applicable to

11 Air Trade Area Reagan National opened for service in 1941 and celebrated its 75 th Anniversary in Located on approximately 860 acres along the Potomac River in Arlington County, Virginia, it is the longest operating commercial airport serving the Air Trade Area. Approximately three miles from downtown Washington, D.C., Reagan National is the Airports Authority s principal domestic air service airport. Reagan National is located southwest of Washington, D.C., along the Potomac River, and is accessible via Metrorail. There were 24 mainline and regional airlines serving Reagan National as of December 31, 2017, providing 293 thousand takeoffs and landings during the year. There are no significant cargo operations at Reagan National. Dulles International opened for service in It is situated on approximately 11,830 acres in Fairfax and Loudoun Counties in Virginia. Dulles International is located 26 miles from downtown Washington, D.C., from which it is accessible via a 17-mile dedicated four-lane (two lanes in each direction) Dulles International Airport Access Highway and Interstate 66. Dulles International provides a full range of domestic and international air 3
12 service, including service to destinations in Europe, Asia, South America, and Africa. There were 60 domestic, international mainline and regional airlines serving Dulles International as of December 31, 2017, providing 265 thousand takeoffs and landings during the year. Dulles International also provides full service facilities for the airlines cargo operations. The cargo facilities are comprised of six buildings with over 505,000 square feet of warehouse space which is leased by airlines, cargo handling agents and other aviation support companies. Cargo operations at Dulles International are a vital part of the regional economic engine for the air trade industry. The Airports Authority s business relationship with the airlines operating at both Airports is governed by a formal negotiated Airport Use Agreement and Premises Lease (Use and Lease Agreement). In November 2014, the Airports Authority s Board approved the current Use and Lease Agreement which became effective January 1, The new Use and Lease Agreement became effective with nearly all the airlines providing service at Reagan National and Dulles International. For airlines operating at Reagan National, the term of agreement is 10 years, starting from the effective date of the agreement to December 31, For airlines operating at Dulles International, the term of agreement was originally three years, starting from the effective date of the agreement to December 31, In 2016, the First Universal Amendment to the Use and Lease Agreement (First Amendment) was agreed upon between the Airports Authority and the Signatory Airlines. It extended the Use and Lease Agreement to December 31, 2024, with respect to Dulles International. The Use and Lease Agreement, addresses the following core business issues: Financial responsibilities of the Airlines, including airline rates and charges methodology, Operational protocols including space and equipment use and maintenance obligations, Airports Capital Development Plans, and General Business Provisions (environmental, insurance, business rights). Key provisions of the Use and Lease Agreement are: A new Capital Construction Program (CCP) at both airports, A revised allocation for sharing Airport Net Remaining Revenue (NRR) with airlines at Reagan National (including 100 percent of NRR from 2014, 2015 and 2016 to be retained by the Airports Authority for use in 2015, 2016 and 2017), The Airports Authority can apply NRR from Reagan National at Dulles International, up to certain limitations, NRR generated at Dulles International will be shared between the Airports Authority and Dulles International airlines (generally 50 percent to airlines and 50 percent to the Airports Authority up to a plateau amount of $15.6 million in 2014, and $15.9 million in 2015, and thereafter 75 percent to airlines and 25 percent to the Airports Authority), Increased Debt Service Coverage payments from airlines for airline-supported cost centers at both airports (in years 2015 through 2017 airline funded debt service coverage will be 35 percent. In fiscal years 2018 through 2023, debt service coverage will be 30 percent, and in the final year of the agreement 2024, debt service coverage will be 25 percent). The centerpiece of the new Airline Use and Lease Agreement at Reagan National includes a $1 billion ten-year CCP that will provide an additional north terminal facility, repositioned security access to National Hall, Terminal A renovations and various airfield, roadways, utility, and other enabling projects. The CCP at Reagan National will be debt-funded by the Airports Authority, and the Airports Authority will seek available grants and authorization during the term of the Use and Lease Agreement to impose and use Reagan National Passenger Facility Charges (PFCs) to reduce debt for the Reagan National CCP. 4
13 Equally important, but smaller in scale, the Airline Use and Lease Agreement at Dulles International includes a $142 million three-year CCP that will provide for various airfield, utility systems and roadway projects. Improvements to increase the operational reliability of Concourse C/D systems are also included. The CCP at Dulles International will be primarily debt-funded, and the Airports Authority will seek grant funding where available. The First Universal Amendment to the Use and Lease Agreement added an additional $446 million of capital projects and extended the Dulles CCP through December 31, Per the Use and Lease Agreement, with regards to Dulles International, the Airports Authority may undertake a portion of the Dulles CCP, but will not be required to do so and may fund the projects it elects to undertake through the issuance of debt. The Reagan National CCP and the Dulles CCP together comprise the CCP. Reagan National generated $95.1 million in NRR in 2017, of which $37.1 will be credited to the airlines at Reagan National and $40.0 million will be credited to airline supported cost centers at Dulles International to mitigate airline rates and charges in Dulles International generated $146.6 million in NRR in 2016, of which $108.1 million will be credited to the airlines at Dulles International. The Airline Use and Lease Agreement continues a long history of positive financial performance of the Airports Authority by sharing NRR. Dulles Corridor Enterprise Fund Activities related to the Omer L. Hirst-Adelard L. Brault Expressway (also known as the Dulles Toll Road) and the Dulles Metrorail Project a large capital improvement project extending the existing Metrorail system to Dulles International and beyond into Loudoun County are accounted for within the Dulles Corridor Enterprise Fund. The Dulles Corridor Enterprise Fund is self-supporting, using tolls collected to support the Dulles Toll Road s operations and maintenance and, along with grants and contributions from federal, state, and local governments, to finance the Dulles Corridor s ongoing Capital Improvement Program, which includes the construction of the Dulles Metrorail Project. Constructed in 1984, the Dulles Toll Road is currently an eight-lane (four lanes in each direction) limited-access highway 13.4 miles in length. It was built in 1984 by VDOT and, until November 1, 2008, had been maintained and operated solely by VDOT. It begins just inside the Capital Beltway (Interstate 495) near Falls Church, Virginia at the Interstate 66 connector to Washington, D.C. The Dulles Toll Road then travels westward through Fairfax County past Dulles International and terminates at the entrance to the Dulles Greenway, a privately-owned toll road. The Dulles Toll Road has one main line plaza at the eastern end near the Capital Beltway and 19 ramp plazas. After assuming responsibility in 2008, the Airports Authority Board of Directors approved the following Toll Rate increases. On January 1, 2013, rates were increased from $1.50 to $1.75 at the main line plaza and from $0.70 to $1.00 at the ramp plazas. The Board approved a main line plaza toll rate increase to $2.50, which became effective on January 1, At this time, no further toll rate adjustments have been approved by the Board. The Dulles Toll Road has 59 toll collection lanes, including 29 E-ZPass-only collection lanes. All tollbooths are equipped with E-ZPass, an electronic toll collection system accepted in 15 contiguous states, including most states in the Virginia-to-Maine corridor. With the transfer of the Dulles Toll Road from VDOT, the Airports Authority committed to constructing the Dulles Metrorail Project. This 23.1 mile extension of the existing Metrorail system begins from a location near the Metrorail Orange Line West Falls Church station, continues west through Dulles International and into Loudoun County. The Dulles Metrorail Project, once completed, will be conveyed to and operated by the Washington 5
14 Metropolitan Area Transit Authority (WMATA) and will provide a one-seat ride from Dulles International to downtown Washington, D.C. The Dulles Metrorail Project is being constructed in two phases and will include the addition of 128 rail cars to the existing WMATA fleet. Phase 1 of the Dulles Metrorail Project extends 11.7 miles from a location near the Metrorail Orange Line West Falls Church station to Wiehle Avenue in Reston, Virginia. It includes five new stations and improvements to the existing WMATA service and an inspection yard at the West Falls Church station. Construction activities began in March 2009 and on July 26, 2014 the Silver Line opened for passenger service. Upon completion of construction of each phase of the Dulles Metrorail Project and acceptance by WMATA into the Metrorail system, the Airports Authority will transfer, without financial retribution, ownership of the completed phase of the project to WMATA. At that point, WMATA will become the owner and operator of the completed phase and will be solely responsible for its operation and maintenance. None of the operating and maintenance expenses of the completed phase will constitute operating or maintenance expenses of the Airports Authority. Such expenses will be payable entirely from WMATA s operating and other revenues (including revenues derived from the operation of the Dulles Metrorail Project). The debt associated with construction of each phase of the Dulles Metrorail Project will remain with the Airports Authority and will not be transferred to WMATA. The capitalized cost of the asset for Phase 1 ($3.27 billion) as of December 31, 2017 has been transferred to WMATA, governmental entities and others and is reflected as a transfer to other governments. Phase 2 will be transferred from the Airports Authority to WMATA and others after construction is completed, currently expected in The passenger service date will be determined by WMATA. The Metrorail cars associated with Phase 2 are complete and the Airports Authority transferred capitalized costs for the cars of $127 million to WMATA in Phase 2 of the Dulles Metrorail Project will extend the Metrorail system an additional 11.4 miles from Wiehle Avenue in Reston, Virginia to Dulles International and into Loudoun County, Virginia. Phase 2 of the Metrorail Project includes six new stations and a maintenance yard located on Dulles International property. The Design- Build contract for Phase-2 was awarded in May The construction contract for the Phase 2 maintenance yard at Dulles International was awarded in August As of December 31, 2017, the design work is completed and construction is well underway. The project is scheduled for completion in 2019, with service beginning in AIRPORTS AUTHORITY S ECONOMIC ENVIRONMENT In spite of continued volatility in the global and national economies, the Washington, D.C. economy has grown steadily for the past two decades. Following the 2009 Recession and 2013 Sequestration, the Washington area s economy has rebounded. Economic growth in the Washington area is forecasted to keep pace with the U.S National Average within the next several years. 6

15 U.S. GDP and Washington Area GRP (Annual % Change) 2017 COMPREHENSIVE ANNUAL FINANCIAL REPORT Air Trade Area Population Concentration of 6.1 Million Residents U.S. Census Bureau, 2017 Other MD 5% Other VA & WV 16% Fairfax County, VA 19% Frederick County, MD 4% Loudoun County, VA 6% Montgomery County, MD 17% Prince William County, VA 7% District of Columbia 11% Prince George's County, MD 15% 7
16 The population of the Airports Authority service region has grown to over 6.1 million, which was the fifth highest population growth in the nation for the period. The Washington, D.C. Metropolitan Area has many inherent advantages relevant to its competiveness in the global marketplace, most of which are rooted in Washington s status as the seat of the U.S. government. The region has an educated workforce, a positive entrepreneurial climate, international connectivity, excellent public transit, and Federal government access. Washington is very well established as a hub of government and tourism, and has strong technology infrastructure and entrepreneurial climate. 1 The region had the eighteenth highest economic growth in the nation in Average Annual Unemployment Rate U.S. Bureau of Labor Statistics 9.3% 9.6% 8.9% 8.1% 7.4% 6.2% 6.1% 6.2% 5.8% 5.5% 5.4% 5.0% 4.5% 5.3% 3.8% 4.9% 3.7% 4.4% United States Air Trade Area Over the years, the Air Trade Area has consistently had lower unemployment rates than the national average. As of December 2017, the region s average unemployment rate was 3.7 percent, significantly lower than the U.S. average of 4.4 percent. 3 Activity generated by the federal government provides a solid foundation and economic stimulus to the metropolitan area in both up and down cycles. While the impact of federal sequestration on the Air Trade Area was an estimated decline in the federal government s procurement spending, the area topped the list of federal spending in 2015 with $71.1 billion. 4 The Air Trade Area boasts strong participation in professional business services; trade, transportation, and utilities; education and health services; and leisure and hospitality. 5 The Air Trade Area is also home to numerous large and small private companies, including 17 Fortune 500 companies. 6 1 Source: Center for Regional Analysis, George Mason University 2 Source: Policom Corporation Economic Strength Ranking, Source: State of the U.S. Labor Market: Bureau of Labor Statistics 2017 Jobs Release 4 Source: SHRM, Metro Economic Outlook: Washington, DC, January Source: U.S. Department of Labor, Bureau of Labor Statistics 6 Source: Fortune 500,
17 Air Trade Area Employment by Industry 2017 Bureau of Labor Statistics Professional Business Services Government Educational and Health Services Trade, Transportation, and Utilities Leisure and Hospitality Other Services Mining, Logging, and Construction Financial Services Information Manufacturing Aviation and Toll Road Activity Number of Employees (in thousands) Activity at Reagan National reached record levels with total passengers of 23.9 million, representing a 1.3 percent increase over 2016 activity of 23.6 million, mainly due to aircraft upgauges by American Airlines and American Eagle in many domestic markets, along with aircraft upgauges to larger narrow body aircraft in beyond perimeter markets by Delta Air Lines and United Airlines. Total aircraft operations at the airport decreased slightly from 295 thousand operations in 2016 to 293 thousand operations in 2017 as a result of these upgauges and slightly decreased weekend service to non-leisure destinations during the fall and winter seasons. Dulles International served 22.7 million passengers in 2017, a 4.1 percent increase from 2016 when the airport served 21.8 million passengers. Total aircraft operations at Dulles International remained virtually flat in 2017 maintaining the same 265 thousand operations that were recorded in In 2017 domestic enplaned and deplaned passenger traffic at Dulles International increased by 4.9 percent as a result of domestic capacity adjustments by United Airlines and service increases by both Frontier Airlines and Southwest Airlines. Meanwhile international enplaned and deplaned passenger traffic was up by 2.7 percent as international passenger activity reached an all-time high of 7.7 million in 2017, marking the fourteenth consecutive year of international passenger growth at Dulles International. The airport is the region s international gateway and has continued to increase the number of destination offerings and attract new airlines. In 2017, new international markets included Delhi, India, operated by Air India along with Montreal, Canada service provided by Air Canada. In 2016, new international markets included Lisbon, Portugal, Barcelona, Spain, Nassau, Bahamas and Providenciales in the Turks and Caicos by United Airlines. LATAM and Royal Air Maroc added new destinations of Lima, Peru and Casablanca, Morocco, respectively. Air Canada returned to Dulles International with service to Toronto by its regional carrier Air Georgian. In 2015, new international markets included San Jose del Cabo by United Airlines and Accra by South African, as well as Dublin by Aer Lingus. 9
18 MWAA System-Wide Passengers Passengers (Millions) Reagan National (Total) Dulles (Domestic) Dulles (International) MWAA Passenger Trends 30.0 Total Passengers (Millions) Northwest/Delta Merger Economic downturn United/ Continental Merger Southwest/ AirTran Merger JetBlue/ American Slot Swap US Air/Delta Slot Swap and Divestiture at DCA JetBlue adds operations at DCA from divested slots Congressional DCA Actions: 4 Beyond Flights 4 Within Flights American/USAir Merger: Divestiture of 52 DCA slots to JetBlue, Southwest, and Virgin America New IAD: Aeromexico, Porter, Emirates, Etihad, Brussels Airlines, Air China Frontier begins IAD service to 18 destinations Q2 & Q3, but drops to 2 destinations in Q New IAD: Aer Lingus, Alaska Airlines New IAD: LATAM, Royal Air Maroc, Air Canada New IAD: Air India Air Canada (Montreal) IAD DCA Dulles International also provides full service facilities for the airlines cargo operations. The cargo facilities are comprised of six buildings with over 550,000 square feet of warehouse space which is leased by airlines, cargo handling agents and other aviation support companies. Cargo operations at Dulles International are a vital part of the regional economic engine for the air trade industry. 10
19 Total air cargo tonnage, freight and mail, at Dulles International was up 12.3 percent in 2017 over previous year. International cargo saw a substantial increase of 17.9 percent and domestic grew a solid 3.2 percent, while total mail and express tonnage experienced a 19.2 percent increase. The growth of air cargo tonnage, which began in September of 2016, continued to increase month over month through 2017 for all segments, inbound and outbound. The strong growth in International traffic was due to an increase in imports of 21.0 percent while exports grew 14.0 percent over last year. The Dulles Toll Road processed an average of 8.1 million toll transactions per month in 2017 and 8.1 million toll transactions per month in Dulles Toll Road transactions totaled 97.1 million in 2017 compared to 97.7 million in 2016, a 0.6 percent decrease in activity. Dulles Toll Road revenue has increased to $152.0 million in 2017, a 0.2 percent increase over Industry Outlook The downward trend industrywide in enplanement levels reversed during 2010, and enplanements continue to experience modest growth fueled by a robust business climate and tourist trade. According to Domestic U.S. DOT T-100 Onboard Passenger Data for the year ended November 30, 2017 U.S. domestic enplanements grew 4.4 percent, while international enplanements grew 6.7 percent. 7 The air cargo industry continues to move toward more efficient operations. Declining oil prices have led to a more favorable operational cost environment. Despite changing industry dynamics, long-term air cargo forecasts remain optimistic. Despite steady travel demand in 2017, airlines continued capacity discipline by constraining growth of flights and reducing overall seat capacity. In recent years, U.S. airports have also been challenged with declining federal government airport funding, inflation in operating costs, and the cost of needed capital improvements. The outlook for the US toll road industry remains positive, reflecting the expectation of continued strong traffic and revenue growth in the next 12 to 18 months. 8 Toll roads in the U.S. have been on a modest path of recovery from the economic downturn, but continued improvement in the economy will support continued gains in traffic. THE AIRPORTS AUTHORITY S OPERATING BUDGETS The Airports Authority s annual operating budgets are a financial planning tool outlining the estimated revenues and expenses for both Enterprise Funds at certain activity levels. The budgets are a management tool, and, accordingly, are not prepared in a manner consistent with Generally Accepted Accounting Principles (GAAP). The President and Chief Executive Officer submit the Airports Authority s annual operating budgets to the Board for approval. Budgetary controls and evaluations are affected by comparing actual interim and annual results with the budgets, noting the actual level of activities, and ensuring compliance with the provisions of the annual operating budgets approved by the Board. In keeping with the requirements of a proprietary fund, budgetary comparisons have not been included in the financial section of this report. 7 Source: US DOT T-100 Onboard Passenger Data 8 Source: Moody s Investors Service, 2017 Outlook 11
20 Aviation Enterprise Fund In 2017, the Airports Authority budgeted for the ability to operate the Airports in an efficient, safe and secure manner with quality customer service standards, while minimizing the impact to the airline cost structure in order to maximize the Airports competitive position. The Airports Authority s 2017 Budget reflected a 0.5 percent decrease in revenues and a 2.6 percent increase in expenses, as compared to the 2016 Budget. Operating revenues were slightly lower than budget estimates by 0.1 percent in 2017, compared to 1.8 percent over budget expectations in Operating expenses were 91.3 percent of budget authorization in 2017, while in 2016 expenses were 93.8 percent of budget authorization. Aviation Enterprise Fund Operating Budget As a Percentage Budget Actual¹ of Budget 2017 Revenues $ 713,646,495 $ 713,071, % 2017 Expenses 2 $ 353,033,093 $ 322,493, % 2016 Revenues $ 717,081,000 $ 730,274, % 2016 Expenses 2 $ 343,968,000 $ 322,590, % ¹ Actual results are stated on a budgetary basis for comparative purposes, which are not consistent with GAAP 2 Does not include depreciation expense or debt service Dulles Corridor Enterprise Fund The 2017 operating budget for the Dulles Corridor Enterprise Fund reflected the ninth full year of operating the Dulles Toll Road. The Dulles Corridor Enterprise Budget was prepared based on forecasted Toll Road revenues, operating and capital requirements, and requirements of the Toll Road Permit and Operation Agreement (December 2006) and Transportation Infrastructure Finance and Innovation Act (TIFIA) Loan Agreement (August 2014). The Airports Authority s 2017 Budget reflected a 1.5 percent decrease in revenues and a 2.8 percent decrease in expenses, as compared to the 2016 Budget. Operating revenues reached 98.3 percent of budget expectations in 2017, while in 2016; operating revenues were 96.7 percent of budget expectations. Operating expenses were 94.6 percent of budget authorization in 2017 and 93.6 percent in Dulles Corridor Enterprise Fund Operating Budget As a Percentage Budget Actual¹ of Budget 2017 Revenues $ 154,672,000 $ 152,022, % 2017 Expenses 2 $ 30,329,610 $ 28,688, % 2016 Revenues $ 156,972,000 $ 151,731, % 2016 Expenses 2 $ 31,193,000 $ 29,191, % ¹Actuals are stated on a budgetary basis for comparative purposes, which are not consistent with GAAP 2 Does not include depreciation expense or debt service 12
21 LONG-TERM FINANCIAL PLANNING Aviation Enterprise Fund The Aviation Enterprise Fund s long-term financial planning includes the completion of certain approved capital expenditures and the accumulation of sufficient resources required to service the debt issued to finance these expenditures and operate and maintain the Airports. Under terms of the Use and Lease Agreement, fees and charges paid by the Airlines are used along with other income from the Airports to service the debt issued to finance the CCP. It is anticipated that the major portion of future facilities development will be financed with the proceeds of bonds issued under the Master Indenture of Trust. In addition, the Airports Authority also expects to use PFC revenues, federal and state grants, and the Airports Authority s portion of NRR to finance capital development costs. While recent regulatory actions have contributed to short-term growth at Reagan National, because the airport is regulated through slot and perimeter regulations, much of the long-term future growth in aviation activity for the Air Trade Area is expected to occur at Dulles International. Dulles Corridor Enterprise Fund The Dulles Corridor Enterprise Fund s long-term planning includes the completion of the Dulles Metrorail Project and certain approved capital expenditures on the Dulles Toll Road and in the Dulles Corridor. The Airports Authority anticipates future funding for the capital expenditures in the Dulles Corridor will include tolls collected on the Dulles Toll Road, debt secured by toll road revenue, and continued receipt of grants and contributions from federal, state and local governments. In 2014, the Airports Authority and the DOT executed the TIFIA Loan Agreement which provides up to $1.278 billion of financing for Phase 2 of the Dulles Metrorail Project. The interest rate on the TIFIA Loan is 3.21 percent. At the end of 2017, a total of $792.5 million was drawn on the TIFIA Loan. The TIFIA Loan along with contributions from funding partners is expected to provide the funding for the remainder of the Dulles Metrorail Project. OTHER INFORMATION The Airports Authority s Website The Airports Authority has an Internet website offering a wide array of information to users, including financial information and operational statistics. Users can obtain direct access to the airlines serving the Airports, as well as flight arrival and departure information. The Airports Authority s CAFR, Budget, Master Indentures of Trust, Official Statements, Debt Service Review, airline rates and charges, and aviation statistics are posted on the website. The Airports Authority also posts monthly unaudited financial statements to include discussion of results and other information for the Airports Authority s bondholders and other interested parties. Financial information for the Airports Authority is available on the website at the following site: Recognition of Awards and Achievement The GFOA has awarded a Certificate of Achievement for Excellence in Financial Reporting to the Airports Authority for its CAFR for the year ended December 31, This was the twenty-seventh consecutive year the Airports Authority has received this prestigious award. In order to be awarded a Certificate of Achievement, a 13
22
23 2016 Certificate of Achievement for Excellence in Financial Reporting 2017 COMPREHENSIVE ANNUAL FINANCIAL REPORT 15
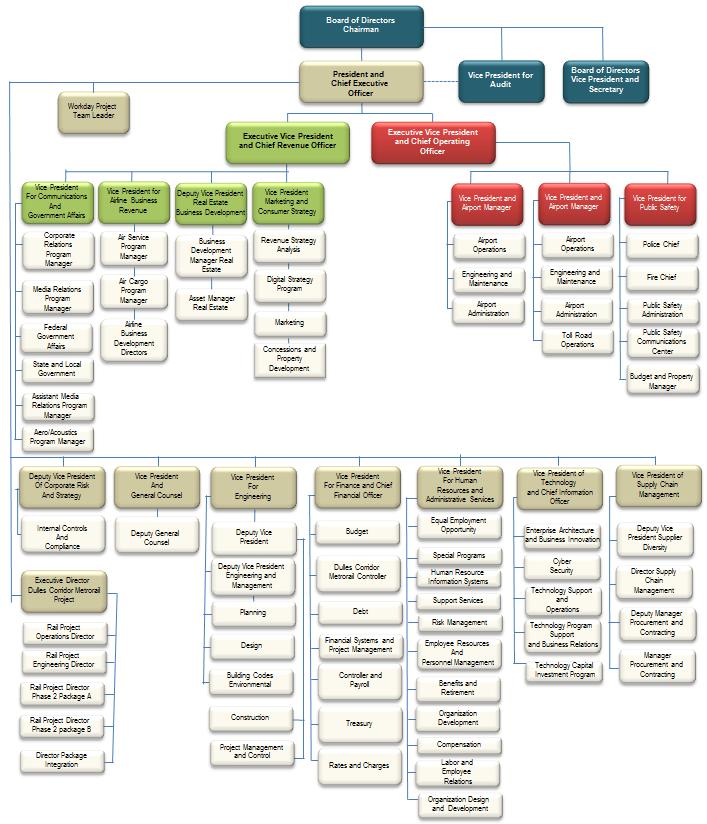
24 Organizational Chart 16
25 FINANCIAL SECTION Report of Independent Auditor 17
26 Report of Independent Auditor (Continued) 18
27 Management s Discussion and Analysis (unaudited) INTRODUCTION The purpose of the following discussion and analysis of the financial performance and activity of the (the Airports Authority) is to provide an introduction to and overview of the basic financial statements of the Airports Authority for the year ended December 31, 2017 with selected comparative information for the years ended December 31, 2016 and December 31, This discussion has been prepared by management, is unaudited, and should be read in conjunction with the financial statements and the notes that follow this section. Using the Financial Statements The Airports Authority s financial report includes three financial statements: the Statement of Net Position; the Statement of Revenues, Expenses and Changes in Net Position; and the Statement of Cash Flows. The financial statements are prepared in accordance with accounting principles generally accepted in the United States of America as promulgated by the Governmental Accounting Standards Board (GASB). The presentation of the financial statements includes two enterprise funds. The Aviation Enterprise Fund encompasses the activity of Ronald Reagan Washington National Airport (Reagan National) and Washington Dulles International Airport (Dulles International) (collectively, the Airports). The Dulles Corridor Enterprise Fund encompasses the Airports Authority s activity within the Dulles Corridor, which includes, but is not limited to, the Dulles Toll Road and the Dulles Corridor Metrorail Project (Dulles Metrorail Project). The Dulles Corridor is the transportation corridor with an eastern terminus of the East Falls Church Metrorail Station at Interstate Route 66 and a western terminus of VA Route 772 in Loudoun County, Virginia. The Statements of Net Position depict the Airports Authority s financial position as of a point in time, December 31, and include all assets, liabilities, and deferred outflows and inflows of the Airports Authority. The Statements of Net Position present financial information on all of the Airports Authority s assets, liabilities, and deferred outflows and inflows with the difference reported as net position. Net position is displayed in three components: net investment in capital assets, which includes capital assets funded from unrestricted and restricted sources, net of accumulated depreciation and outstanding debt attributable to acquisition of the capital assets; restricted, when constraints are imposed by third parties or enabling legislation on assets or deferred outflows of resources, net of any liabilities and deferred inflows of resources which will be liquidated with the restricted assets; or unrestricted, which includes all remaining assets, deferred outflows of resources, liabilities and deferred inflows of resources not included in the preceding two categories. Over time, increases or decreases in net position may serve as a useful indicator of whether the financial position of the Airports Authority is improving or deteriorating. The Statements of Revenues, Expenses and Changes in Net Position report total operating revenues, operating expenses, non-operating revenues and expenses, and other changes in net position for a fiscal period, the year ended December 31. Revenues and expenses are categorized as either operating or non-operating based upon management's policy as established in accordance with definitions set forth by GASB. Significant recurring sources of the Airports Authority s revenues, including Passenger Facility Charges (PFCs), investment income, and federal, state, and local grants are reported as non-operating revenues or capital contributions. The Airports Authority s interest expense is reported as a non-operating expense. 19
28 The Statements of Cash Flows present information showing how the Airports Authority s cash and cash equivalents position changed during the fiscal year. The Statements of Cash Flows classify cash receipts and cash payments resulting from operating activities, non-capital financing activities, capital and related financing activities, and investing activities. THE AIRPORTS AUTHORITY S ACTIVITY HIGHLIGHTS CHANGES IN NET POSITION TOTAL BUSINESS TYPE ACTIVITIES The Airports Authority s change in net position was $207.0 million and $323.4 million for the years ended December 31, 2017 and Total operating revenues for the Airports Authority decreased $12.2 million generated primarily as a result of the impact of a $25.0 million Commonwealth of Virginia grant received in 2017 which lowered the rates for the airlines. Operating expenses were up $11.9 million primarily related to the disposal of the Corporate Office Building (COB) of $10.6 million and a general increase as anticipated in the 2017 operating budget. The decrease in net contributions from (to) other governments of $78.3 million was driven by increased construction activity for Phase 2 of the Dulles Metrorail project and the contributions received from the project s funding partners to finance the project offset by a transfer to the Metropolitan Washington Area Transit Authority (WMATA) of $7.5 million for continuing costs Dulles Metrorail Project Phase 1 and $127.0 million for rail cars for the Dulles Metrorail Project Phase 2. The following represents a summary of the Statements of Revenues, Expenses and Changes in Net Position for the Airports Authority: Total Business Type Actvity Operating income Operating revenues $ 913,585,791 $ 925,791,041 $ 913,272,136 Operating expenses 682,301, ,361, ,098,509 Total operating income 231,283, ,429, ,173,627 Non-operating revenues Investment income 31,099,186 19,842,134 15,956,973 Federal, state and local grants 26,213, , ,437 Fair value gains on swaps 13,175,314 16,447,932 1,196,495 Other income - - 5,877,306 Net contributions from (to) other governments 52,520, ,861,460 3,424,708 Total non-operating revenues 123,008, ,855,237 27,253,919 Non-operating expenses Interest expense (294,305,010) (318,726,488) (312,014,926) Total non-operating expenses (294,305,010) (318,726,488) (312,014,926) Income/(Loss) before capital contributions 59,987, ,557,978 (46,587,380) Capital contributions 147,006, ,834, ,692,452 Change in net position $ 206,994,355 $ 323,392,211 $ 176,105,072 20
29 A detailed discussion of the results for each business type activity follows. Aviation Enterprise Fund 2017 COMPREHENSIVE ANNUAL FINANCIAL REPORT Air travel demand is directly related to key factors in regional, national and international economies, such as business activity, disposable income levels, employment, and currency rates, among others. The Great Recession of 2008 severely impacted airline finances, and was a significant factor in spurring the most recent merger activity. U.S. airlines calibrated capacity to the changing demand patterns that resulted from the economic downturn, and then were also able to control services and capacity as the U.S. economy recovered. In 2017, the national economy continued to demonstrate signs of sustained national economic recovery and growth, which portends a stronger economic climate for the airline industry. In December 2017, the U.S. Bureau of Economic Analysis reported that national real Gross Domestic Product growth for the third quarter of 2017 was 3.2 percent, representing continuing economic strengthening. The Washington market, which had underperformed the national economy in 2013 and 2014 largely because of federal cutbacks, was expected to exceed the national rate of growth. At the close of 2017, the expectation was that the Washington area s economy would continue to grow strongly and exceed the national levels of growth through Of the 15 largest job markets in the country, the Washington area experienced greater growth than most, with employment increasing by 1.3 percent from 2016 through Unemployment in the Washington area remains considerably lower than the national average. Airports enplanements and operations activity for the last three years follows: Enplanements and Operations Activity for 2015 to Total Enplanements (In Millions) 400 Total Operations (In Thousands) Reagan National Dulles International Reagan National Dulles International 21
30 Enplanements and Operations Activity for 2015 to 2017 Enplanements and Operations Reagan National Enplanements Domestic 11,763,471 11,600,333 11,298,258 Transborder 182, , ,719 Non-Commercial 19,954 13,348 13,817 Total Enplanements 11,966,354 11,780,610 11,509,794 Dulles International Enplanements Domestic 7,466,031 7,144,653 7,139,042 Transborder and International 3,857,629 3,719,341 3,574,810 Non-Commercial 83,447 73,683 75,030 Total Enplanements 11,407,107 10,937,677 10,788,882 Airports Authority System-wide Enplanements Domestic 19,229,502 18,744,986 18,437,300 Transborder and International 4,040,558 3,886,270 3,772,529 Non-Commercial 103,401 87,031 88,847 Total Enplanements 23,373,461 22,718,287 22,298,676 Total Operations Reagan National 293, , ,781 Dulles International 264, , ,070 Total Operations 557, , ,851 In 2017, combined Reagan National and Dulles International system enplanements grew by 2.9 percent, marking the eighth consecutive year of growth. Reagan National has undergone major changes in the last three years, due to Congressional actions and the American Airlines/US Airways merger. Enplanements at Reagan National for 2017 were a record high of 12.0 million, the eighth consecutive year of growth. This compares to 11.8 million for 2016 and 11.5 million for The growth in passenger traffic at Reagan National slowed notably in 2017 compared to 2016, when the full effect of the divestiture of 52 operating slots from American Airlines/US Airways to Southwest, JetBlue, and Virgin American was realized. The carriers receiving those slots operated larger aircraft to larger communities than American Airlines/US Airways had previously, adding nearly 2 million extra passengers. In 2017, the carriers continued to refine schedules to match demand by making adjustments to frequencies and destinations. American reduced frequency and capacity in a number of markets, such as Ft. Lauderdale, Philadelphia, Orlando and Dallas/Ft. Worth; while adding new service to Atlanta, Cleveland and Minneapolis/St. Paul, as well as, increasing capacity in other key markets such as Providence, Charlotte and Hartford. Delta reduced capacity to Atlanta and New York LaGuardia, stopped service to Memphis while launching service to Raleigh/Durham and increasing capacity to New York/JFK and Minneapolis/St. Paul. Based on data from the U.S. Department of Transportation, Reagan National now has the largest share of domestic local Washington origin-and-destination (O&D) passengers. Total enplanements at Dulles International stabilized at 11.4 million in 2017, due to growth in domestic and international enplanements. Dulles International served a record 3.9 million international enplaned passengers in 2017, which was the 14th consecutive year of international growth. United Airlines including its regional affiliates 22
31 had the largest commercial passenger market share of 59.4 percent both in 2017 and Domestic enplanement activity increased by 4.5 percent and was driven by increased capacity by United Airlines to 49 destinations and new service to Fort Lauderdale. As the Washington area economy is improving and the Metrorail Silver Line is on the way, Dulles International will continue to fill the expanding air travel needs for the region. International enplanements of 3.9 million in 2017 represented a 3.7 percent increase over 2016 and 7.9 percent increase over 2015 international enplanements. In 2017 new international markets included Delhi, India, operated by Air India and Montreal, Canada operated by Air Canada. In addition, Air China, Copa, and Icelandair, all increased service levels with added flights and larger aircrafts. United Airlines continued to contribute to passenger increases through additional service and larger aircrafts. According to Domestic U.S. DOT T-100 Onboard Passenger Data for the year ended November 30, 2017 U.S. domestic enplanements grew 4.4 percent, while international enplanements grew 6.7 percent. Reagan National enplanement growth of 1.4 percent was below the industry domestic growth rate of 4.4 percent. Dulles International s domestic enplanement growth rate of 4.5 percent was above the industry growth rate. International enplanement growth of 3.7 percent at Dulles International was below the industry growth rate of 6.7 percent that was calculated using International U.S. DOT T-100 Onboard Passenger Data for the year ended August 31, Airports 2017 Commercial Enplanements Growth Authority North America Difference Reagan National (Domestic) 1.4% 4.4% -3.0% Dulles International (Domestic) 4.5% 4.4% 0.1% Dulles International (International) 3.7% 6.7% -3.0% Source: U.S. DOT T-100 Onboard Passenger Data In 2017, the Airports Authority improved traveler experiences at both airports by opening 21 new shops, duty free stores and restaurants, including Chick-fil-A at Reagan National and the Washington Redskins Burgundy & Gold Club at Dulles International. Chick-fil-A received the Chicken Restaurant Brand of the Year honors for the fourth consecutive year in the 2017 Harris Poll EquiTrend Study and received the top score among fast food brands including one of the top 10 scores overall for customer experience in the The Washington Redskins Burgundy & Gold Club is a new full-service restaurant and bar offering travelers a chef-driven menu served in a festive atmosphere celebrating the team s 85-year history. The restaurant provides a sense of place, local flavor and a fun experience for passengers traveling through Dulles International. Dulles Corridor Enterprise Fund On November 1, 2008, the Virginia Department of Transportation (VDOT) transferred operating and maintenance responsibility of the Dulles Toll Road to the Airports Authority through a Permit and Operating Agreement for a period of 50 years. As of October 1, 2009, the employees of the Dulles Toll Road became employees of the Airports Authority, and the Airports Authority s public safety department began providing the primary police and fire service for the Dulles Toll Road. As part of the agreement with the Commonwealth, the Airports Authority is constructing the Dulles Metrorail Project from a location near the Metrorail Orange Line West Falls Church station to Route 772 in Loudoun County and will make other improvements in the Dulles Corridor consistent with VDOT and regional plans, using revenues from the Dulles Toll Road to pay the resulting debt service. 23
32 Phase 1 of the Dulles Metrorail Project extends 11.7 miles from a location near the Metrorail Orange Line West Falls Church station to Wiehle Avenue in Reston, Virginia. It includes five new stations and improvements to the existing Washington Metropolitan Area Transit Authority (WMATA) service and inspection yard at the West Falls Church station. Construction activities began in March 2009 and on July 26, 2014 the Silver Line opened for passenger service. Phase 2 of the Dulles Metrorail Project extends 11.4 miles from the Metrorail Wiehle Avenue Station in Reston through Dulles International to Route 772 in Loudoun County, Virginia. It includes 6 new stations and maintenance yard on Dulles International property. Construction is underway and the project is currently scheduled to be complete for passenger service in the first quarter of Toll rate increases implemented in 2010 through 2014 resulted in expected declines in Dulles Toll Road transactions. The Dulles Toll Road processed an average of 8.1 million, 8.1 million and 8.2 million toll transactions per month in 2017, 2016, and 2015, respectively. Revenues and transactions were lower compared to the forecast made by the independent consulting firm that produced the 2014 Dulles Toll Road Traffic and Revenue study. A new budgeted forecast is produced since Total revenues in 2017 were approximately 98.3 percent of budgeted forecasted revenues compared to 96.6 percent in 2016 and 98.2 percent in Electronic (E-ZPass) transactions and violations accounted for 88.2 percent of Dulles Toll Road revenue in 2017, an increase from 87.1 percent in 2016 and 86.1 percent in Actual vs. Forecasted Revenues (in Millions) $161.4** $157.0* $157.0** $154.7* $152.0 $151.7 $151.4 $154.2* $154.2** Actual Budget Forecast T&R Study Forecast * Budget ** T&R Study, April 2014 FINANCIAL HIGHLIGHTS - AVIATION ENTERPRISE FUND Pursuant to the Airports Authority s Airport Use Agreement and Premises Lease (Use and Lease Agreement), the Airports Authority receives airline-based revenues such as terminal rents, landing fees, international arrival fees, and passenger conveyance fees as well as non-airline, activity-based concession revenues, which include public parking, rental car activities, and food, beverage, and retail operations, among others. Signatory airlines, those that have signed the Use and Lease Agreement, are required to pay actual costs plus debt service coverage, while the majority of concessionaires pay the greater of a percentage of sales revenue or a minimum annual guarantee. 24
33 The Aviation Enterprise Fund recorded $761.6 million in operating revenues for 2017, a decrease of $12.5 million from Total operating revenues decreased as a result of the impact of a $25.0 million Commonwealth of Virginia grant received in 2017 which lowered the rates for the airlines. Operating revenues also reflect a $15.6 million increase in total concession revenue, led by increases in Ground Transportation. Aviation Enterprise Fund operating revenues increased $12.2 million between 2015 and Total operating revenues for each of the past three years follows: Aviation Enterprise Fund Operating revenues Concessions $ 332,007,816 $ 316,453,536 $ 286,049,575 Rents 283,755, ,980, ,082,521 Landing fees 93,764,918 93,422, ,741,304 Utility sales 13,260,122 13,019,300 12,920,034 Passenger fees 27,872,762 32,544,343 30,500,912 Other 10,902,393 10,639,749 10,546,031 Total operating revenues $ 761,563,128 $ 774,060,008 $ 761,840,377 Aviation Enterprise Fund Operating Revenues (in Millions) $800 $700 $600 $500 $400 $300 $200 $100 $ Concessions Rents Landing fees Utility sales Passenger fees Other Airline Revenues Airlines that operate at Reagan National and Dulles International pay for the actual costs to operate at the Airports including the Airports Authority s principal and interest payments on outstanding Aviation Enterprise Fund debt, as well as debt service coverage. When operating costs for the Aviation Enterprise Fund increase or decrease there is a corresponding increase or decrease in the rates charged to the airlines. In 2017, airline revenue, which consists of landing fees of $93.8 million, terminal rents from airlines of $239.2 million, and other airline fees of $27.0 million for a total of $360.0 million, decreased $31.9 million, or 8.1 percent from prior year. In 2016, airline revenue of $391.9 million decreased $20.0 million, or 4.9 percent compared to
34 In 2017, airline rent revenues totaled $239.2 million a decrease of $27.7 million, or 10.4 percent, from The key driver of decreased terminal rents in 2017 was the decrease in rent rates at Reagan National and Dulles International. In 2016, airline rent revenues totaled $276.6 million, which was an increase of $22.5 million, or 8.9 percent, from This increase was the result of an increase in the debt service requirement under the negotiation of the new Use and Lease Agreement for fiscal years 2015 through Landing fee revenues totaled $93.8 million in 2017, an increase of $0.3 million from Landing fee revenues decreased by $12.3 million from $105.7 million in 2015 to $93.4 million in Signatory landing fee rates paid per 1,000 pounds at Reagan National increased to $4.13 in 2017 from $3.95 in In 2017, signatory airline landing fee rates paid per 1,000 pounds at Dulles International decreased to $1.44 from $2.60 in Passenger fees, including passenger conveyance, international arrivals fees, totaled $27.9 million in 2017, a $4.7 million or 14.3 percent decrease from In 2016, passenger fees increased $2.0 million, or 6.6 percent, from Non-Airline Revenues The Airports Authority s concession revenues totaled $332.0 million in 2017, which was an increase of $15.6 million, or 4.9 percent, from Concession revenues accounted for 43.6 percent of total operating revenues in 2017 which were attributable to increases primarily in ground transportation, rental cars, fixed base operators, food and beverage, inflight caterers, and display advertising. Concession revenues in 2016 and 2015 were 41.0 and 37.5 percent of total operating revenues, respectively. The following table details concession revenues by major category for the years ended 2017, 2016 and 2015: Concession Revenues Parking $ 124,625,634 $ 127,699,503 $ 127,169,736 Rental cars 43,639,231 39,303,541 38,965,642 Food and beverage 32,871,379 30,377,267 26,276,371 Fixed base operator 24,388,896 20,229,037 17,515,830 Ground transportation 37,198,225 30,456,953 15,977,416 Inflight caterers 16,663,967 15,206,722 12,426,345 Display advertising 15,039,275 14,963,331 11,320,884 Newsstand and retail 14,341,520 14,490,773 13,632,732 Duty free 13,671,554 13,566,562 13,143,952 All other 9,568,135 10,159,847 9,620,667 Total $ 332,007,816 $ 316,453,536 $ 286,049,575 Parking revenues continued to rank as the Airports Authority s largest concession in 2017, providing $124.6 million in total revenues for the year, a decrease of $3.1 million, or 2.4 percent from $127.7 million in This decrease is reflective of the increase in shared rider services providers primarily at Reagan National. Parking revenues in 2016 were $0.5 million higher than 2015 due to increased passenger traffic. Rental car revenues of $43.6 million were higher by $4.3 million compared to In 2016 rental car revenues increased $0.3 million compared to The Airports Authority is implementing new food, beverage, and retail programs at both Airports. Recently implemented concepts included Burgundy and Gold Club at Dulles International. Food and beverage revenue 26
35 totaled $32.9 million in 2017, which represented an increase of $2.5 million from Food and beverage revenue totaled $30.4 million in 2016, which represented an increase of $4.1 million from Fixed base operator revenues of $24.4 million in 2017 increased by $4.2 million from prior year. Fixed base operator revenues of $20.2 million in 2016 increased by $2.7 million from prior year attributable to higher minimum annual guarantees. Inflight catering revenues increased by $1.5 million compared to 2016 due to a new contract that provides for a higher minimum annual guarantee. Ground transportation revenues increased $6.7 million in 2017, due to additional shared ride service providers at both airports. Revenues from utility sales to airport tenants were relatively flat year over year and were $13.3 million and $13.0 million in 2017 and 2016, respectively. Revenues from utility sales did not fluctuate from 2015 to In 2017, other non-concession revenues, which primarily represent revenues from employee and tenant parking permits, increased by $0.3 million to $10.9 million. Other revenues increased just slightly from 2015 to Non airline rents totaled $44.7 million in This was an increase from 2016 of $3.4 million and an increase of $5.0 million from 2015 revenues. The Airports Authority also receives revenues from the Transportation Security Administration (TSA) for reimbursement of expenses incurred by the Airports Authority s Public Safety personnel serving a support role to the TSA. Operating Expenses Operating expenses for the Aviation Enterprise Fund for the fiscal year ended December 31, 2017 totaled $636.7 million, an increase of $11.0 million or 1.8 percent from Operating expenses for 2016 decreased by $4.8 million or 0.8 percent from operating expenses in Materials, equipment, supplies, contract services and other expenses increased $22.7 million or 12.2 percent, to $209.0 million in The Airports Authority moved its corporate offices in 2017 to allow for the new construction at Reagan National. This resulted in the disposal of the Corporate Office Building and increased lease expenses plus other expenses associated with the move in The Airports Authority began the exploration of a new human resource and financial software system and recorded expenses associated with that process. These increases were partially offset by a reduction of snow removal costs and other related snow expenses due to an unusually mild winter in the area. Salaries and related benefits expenses increased $0.5 million, or 0.3 percent, from 2016 to $172.5 million in Regular full time pay for Airports Authority employees increased $4.5 million, or 4.0 percent, over The Airports Authority continued funding its Other Post-Employment Benefits (OPEB) program and recorded $0.3 million in expenses in 2017 and $1.1 million in expenses in The contribution percentages to the Airports Authority s pension plans increased to 6.85 percent in 2017 from 5.5 percent of eligible earnings in 2016 for the General Employee Plan and increased to percent in 2017 from 8.6 percent of eligible earnings in 2016 for the Police and Firefighters plan. The funded ratio as of the actuarial valuation date of December 31, 2017 was percent for the General Employee Plan and 98.9 percent for the Police and Firefighters plan. Depreciation and amortization expenses totaled $224.2 million in 2017, a decrease of $10.0 million or 4.3 percent from 2016 resulting from the disposal of assets required for the new construction at Reagan National. Depreciation and amortization expenses in 2016 were $234.2 million, which was $4.4 million lower from 2015 primarily due to additional capitalizations in 2016 in building and systems. In 2017, the corporate office building data center was transitioned to a primary data center in Ashburn, VA. High capacity intercampus networks between the data center and the Airports were implemented. The Airports 27
36 Authority also completed the design and buildout of a public Wi-Fi infrastructure. In 2016, at Reagan National, the Airports Authority completed the Digital Signage system in Terminal B/C, lobby and elevator upgrade in Terminal A, and screening checkpoint upgrade in Terminal A. At Dulles International, projects completed included the West Automated People Mover tunnels and stations, Taxilane B reconstruction and the widening of east station and the police range. In 2015, at Reagan National, the Airports Authority completed Runway 15-33, Runway 4-22 and the Master Site Refresh with Master Controller and Smart-X Technology. In 2015, at Dulles International, the East and West Basement Explosive Detection System in-line baggage screening and Taxiway Z reconstruction and airfield Runway 1R-19L and Road Safety Audits Pavements were completed. A cost allocation plan is used to identify and quantify all overhead and other indirect costs paid from the Aviation Enterprise Fund but appropriately allocable to the Dulles Toll Road or to the Dulles Metrorail Project within the Dulles Corridor Enterprise Fund. The following table shows the amount of the Aviation Enterprise Fund operating expenses that were allocated to the Dulles Corridor Enterprise Fund in 2017, 2016, and 2015, respectively. Year ended December 31, Dulles Toll Road $ 5,663,833 $ 5,532,341 $ 5,511,104 Dulles Metrorail Project 3,380,623 3,779,850 4,677,157 $ 9,044,456 $ 9,312,191 $ 10,188,261 The following presents total operating expenses for the years ended 2017, 2016 and 2015: Aviation Enterprise Fund Operating expenses Materials, equipment, supplies, contract services, and other $ 209,049,602 $ 186,332,647 $ 193,733,350 Impairment loss / design costs 295,303 2,045,592 - Salaries and related benefits 172,453, ,931, ,220,134 Utilities 25,175,478 25,683,982 25,568,096 Lease from U.S. Government 5,562,099 5,502,217 5,392,439 Depreciation and amortization 224,157, ,151, ,558,192 Total operating expenses $ 636,693,799 $ 625,647,298 $ 630,472,211 28
37 Aviation Enterprise Fund Operating Expenses (in Millions) $800 $600 $400 $200 $ Materials, Equipment, Supplies Impairment Loss / Design Costs Salaries Utilities Lease Depreciation & Amortization Changes in Net Position Operating income was $124.9 million in 2017, a decrease in income of $23.5 million compared to The change is a combination of decreased airline revenues as a result of the impact of a $25.0 million Commonwealth grant received in 2017 which lowered the rates for the airlines, increased concession revenues of $15.6 million and increased expenses of $11.0 million. Operating income was $148.4 million in 2016, which increased by $17.0 million from Non-operating revenues increased $28.6 million and non-operating expenses decreased by $0.9 million from The $25.0 million grant from the Commonwealth provided the significant increase in non-operating revenues. This grant offset the reduction in operating revenues caused by lower rates for the airlines. Interest income increased $6.8 million from 2016 driven by higher interest rates and an increase in available invested funds. Non-operating expenses, which included interest expense on the Aviation Enterprise Fund s $4.7 billion bond debt, totaled $227.8 million. Interest expense decreases were recognized primarily due to the refunding of some of the Aviation Enterprise Fund s bond debt. Contributions to the Dulles Corridor Enterprise totaled $48.9 million which reflected the Aviation Enterprise s share of Phase 2 of the Dulles Metrorail Project and was driven by increased construction on Phase 2 of the Dulles Metrorail Project. Capital contributions include PFCs, federal, state, and local grants, and other capital property acquired. PFC revenue for 2017 was $90.9 million, which was a slight increase of $1.1 million from PFC revenue for 2016 was $89.8 million, which was an increase of $1.3 million from Federal, state, and local grants in support of capital programs were $21.2 million in 2017, $21.5 million in 2016, and $47.6 million in In 2017, the Airports Authority received $19.2 million in Airport Improvement Programs (AIP) grants primarily to reimburse for runway construction and rehabilitation, taxiway reconstruction, and runway safety area improvements. In 2016, the Airports Authority received $14.8 million in Airport Improvement Program (AIP) grants to reimburse for the capital costs of constructing the fourth runway, reconstructing a portion of Taxiway Y, reconstructing Taxiway Z & Taxilane C Reconstruction, reconstructing and widening of Taxilane B East section all at Dulles International, and improving the safety areas for runways 15/33 and 4/22 at Reagan National. Please refer to Note 16 Government Grants for more information on grant activity. 29
38 The change in net position is an indicator of the overall fiscal condition of the Aviation Enterprise Fund. Net position increased in 2017 by $72.9 million. Net position increased in 2016 by $67.9 million. These increases reflect the continued strength and growth of the airports and the sound management of the Airports Authority debt and investment programs. The following represents a summary of the Statements of Revenues, Expenses and Changes in Net Position for the Aviation Enterprise Fund: Aviation Enterprise Fund Operating income Operating revenues $ 761,563,128 $ 774,060,008 $ 761,840,377 Operating expenses 636,693, ,647, ,472,211 Total operating income 124,869, ,412, ,368,166 Non-operating revenues Investment income 24,739,309 17,941,016 14,061,258 Federal, state and local grants 25,804, , ,437 Fair value gains on swaps 13,175,314 16,447,932 1,196,495 Total non-operating revenues 63,719,380 35,092,659 16,056,190 Non-operating expenses Interest expense (178,913,318) (189,201,753) (189,397,216) Contributions to other governments (48,879,320) (37,647,152) (26,104,546) Total non-operating expenses (227,792,638) (226,848,905) (215,501,762) Income/(loss) before capital contributions (39,203,929) (43,343,536) (68,077,406) Capital contributions 112,105, ,280, ,142,101 Change in net position $ 72,901,150 $ 67,936,512 $ 68,064,695 FINANCIAL HIGHLIGHTS - DULLES CORRIDOR ENTERPRISE FUND Operating Revenues For the year ended December 31, 2017, the Airports Authority recorded toll revenues of $152.0 million, which consisted of electronic toll collections (E-ZPass) of $130.1 million, cash collections of $17.9 million, and violations revenue of $4.0 million. Overall toll collection revenue increased $0.3 million from In 2017, E-ZPass revenue comprised 85.6 percent of toll revenues, up from 84.9 percent in 2016 and 84.2 percent in Operating revenues Electronic toll collection revenues Cash revenues Violation revenues Dulles Corridor Enterprise Fund $ 130,080,380 $ 128,853,731 $ 127,562,090 17,914,250 19,504,356 21,014,376 4,028,033 3,372,946 2,855,293 Total operating revenues $ 152,022,663 $ 151,731,033 $ 151,431,759 30
39 Operating Expenses For the years ended December 31, 2017 and 2016, the Dulles Corridor Enterprise Fund recorded $45.6 million and $44.7 million in total operating expenses, respectively. Materials, supplies, equipment, contract services, and other totaled $26.8 million in 2017, which is relatively the same as Electronic toll collection fees paid to the third party processor of E-ZPass transactions were $10.9 million up $0.9 million from 2016 but savings associated primarily with the unusually mild winter kept overall expenses down. In 2016, materials, supplies, equipment, contract services, and other totaled $26.8 million, which included $10.1 million in electronic toll collection fees paid to the third party processor of E-ZPass transactions. The majority of costs related to the Dulles Corridor Enterprise Fund are directly charged to the Fund. In certain instances, overhead costs for the Airports Authority are initially paid from the Aviation Enterprise Fund but are appropriately allocable to the Dulles Corridor Enterprise Fund as costs associated with operation of the Dulles Toll Road or as costs of the Dulles Metrorail Project. In 2017, $9.0 million was allocated from the Aviation Enterprise Fund to the Dulles Corridor Enterprise Fund, $5.7 million allocated to the Dulles Toll Road and $3.3 million allocated to the Dulles Metrorail Project. In 2016, $9.3 million was allocated from the Aviation Enterprise Fund to the Dulles Corridor Enterprise Fund, $5.5 million allocated to the Dulles Toll Road and $3.8 million allocated to the Dulles Metrorail Project. In 2015, $10.2 million was allocated from the Aviation Enterprise Fund to the Dulles Corridor Enterprise Fund, with $5.5 million allocated to the Dulles Toll Road and $4.7 million allocated to the Dulles Metrorail Project. (See Chart on Cost Allocation Plan) Depreciation and amortization expenses increased $1.1 million to $8.1 million in 2017 and increased $0.5 million from 2015 to $7.0 million in Recent increases in depreciation and amortization expenses were due to the sound wall replacement, E-ZPASS lanes and sign conversion, and Westbound ramps that were placed into service in Salaries and related benefits expense decreased $0.2 million. Dulles Corridor Enterprise Fund Operating expenses Materials, equipment, supplies, contract services, and other $ 26,841,386 $ 26,820,384 $ 26,944,764 Salaries and related benefits 10,505,127 10,663,943 10,820,154 Utilities 206, , ,593 Depreciation and amortization 8,055,255 6,986,951 6,511,787 Total operating expenses $ 45,608,081 $ 44,714,514 $ 44,626,298 31
40 Changes in Net Position The following represents a summary of the Statements of Revenues, Expenses and Changes in Net Position of the Dulles Corridor Enterprise Fund. Dulles Corridor Enterprise Fund Operating income Operating revenues $ 152,022,663 $ 151,731,033 $ 151,431,759 Operating expenses 45,608,081 44,714,514 44,626,298 Total operating income 106,414, ,016, ,805,461 Non-operating revenues (expenses) Investment income (loss) 6,359,877 1,901,118 1,895,715 Interest expense (115,391,692) (129,524,735) (122,617,710) Federal, state and local grants 408, Other income - - 5,877,306 Contributions from (to) other governments 101,399, ,508,612 29,529,254 Total non-operating revenues (expenses) (7,223,221) 40,884,995 (85,315,435) Income before capital contributions 99,191, ,901,514 21,490,026 Capital contributions 34,901, ,554,185 86,550,351 Change in net position (deficit) $ 134,093,205 $ 255,455,699 $ 108,040,377 The increase in net position for the Dulles Corridor Enterprise Fund totaled $134.1 million for the year ended December 31, The increase in net position for the Dulles Corridor Enterprise Fund totaled $255.5 million for the year ended December 31, 2016, and an increase in net position totaled $108.0 million for the year ended December 31, Total operating income for the Dulles Corridor Enterprise Fund was $106.4 million in 2017, $107.0 million in 2016 and $106.8 million in Overall, operating revenues and operating expenses from 2017, 2016 and 2015 remain relatively stable. Total non-operating revenues (expenses) decreased $48.1 million in 2017 to $7.2 million in operating expenses. Contributions from (to) other governments decreased $67.1 million. The decrease in net contributions from (to) other governments of $67.1 million was driven by increased construction activity for Phase 2 of the Dulles Metrorail project and the contributions received from the project s funding partners to finance the project, offset by a transfer to the Washington Metropolitan Area Transit Authority (WMATA) of $7.5 million for continuing costs Dulles Metrorail Project Phase 1 and $127.0 million for rail cars for the Dulles Metrorail Project Phase 2. Interest expense totaled $115.4 million, which was a $14.1 million decrease from 2016 due to increased construction spending and the associated capitalized interest. Investment income totaled $6.4 million in 2017, $1.9 million in 2016 and
41 Government grants and contributions in support of capital programs for the Dulles Corridor Enterprise Fund totaled $34.9 million for the fiscal year ended December 31, 2017 and $107.6 million for the fiscal year ended December 31, Federal grants in 2017 included $14.9 million related to the Dulles Metrorail Project, while the Commonwealth contributed $20.0 million. STATEMENTS OF NET POSITION TOTAL BUSINESS TYPE ACTIVITIES The Statements of Net Position present the financial position of the Airports Authority at the end of the fiscal year. The statements include all assets and liabilities of the Airports Authority. Net Position is the difference between total assets plus deferred outflows and total liabilities plus deferred inflows and is an indicator of the current fiscal health of the Airports Authority. A summarized comparison of the Airports Authority s assets, liabilities, deferred outflows and inflows, and net position on December 31, 2017, 2016, and 2015, follows: Total Business-Type Activities Assets Current assets $ 1,981,736,194 $ 1,650,120,403 $ 1,504,046,367 Non-current assets Restricted 860,238, ,610,636 1,120,957,539 Unrestricted 23,695,700 18,244,830 22,469,461 Capital assets, net 6,060,225,198 5,690,362,241 5,396,941,793 Total Assets 8,925,895,711 8,344,338,110 8,044,415,160 Deferred Outflows of Resources 91,778,093 93,204,615 95,217,736 Liabilities Current liabilities 565,007, ,938, ,860,326 Non-current liabilities 7,965,639,526 7,652,510,932 7,542,958,030 Total Liabilities 8,530,646,801 8,174,449,105 8,204,818,356 Deferred Inflows of Resources 23,018,575 6,079,547 1,192,678 Net Position (deficit) Net investment in capital assets 770,701, ,742, ,894,047 Restricted 264,078, ,523, ,505,773 Unrestricted (deficit) (570,771,160) (635,252,163) (803,777,958) Total Net Position (deficit) $ 464,008,428 $ 257,014,073 $ (66,378,138) Current assets for the Airports Authority totaled $2.0 billion on December 31, 2017, an increase of $331.1 million from Current assets in 2016 increased $146.1 million to $1.7 billion as of December 31, Current assets for the Aviation Enterprise Fund increased $252.1 million in 2017, primarily as a result of increased 33
42 investments of $250.7 million and increased cash of $7.2 million, restricted and unrestricted, there was a $2.1 million decrease in accounts receivable. Between 2015 and 2016, current assets for the Aviation Enterprise Fund increased $112.9 million, primarily as a result of $123.9 million increase in investments, restricted and unrestricted, offset by a decrease of $12.2 million in cash and cash equivalents. Current assets for the Dulles Corridor Enterprise Fund increased 16.3 percent or $79.5 million in 2017 due primarily to a $76.8 million increase in restricted investments. In 2016, the Dulles Corridor Enterprise Fund s current assets increased $33.1 million, or 7.3 percent from Non-current assets for the Airports Authority increased $249.9 million from 2016 to 2017 and increased $153.8 million from 2015 to The significant changes between 2016 and 2017 include a $463.1 million increase in construction in progress Dulles Metrorail Project for spending on Phase 2 of the project and a $75.0 million increase in construction in progress for the construction at Reagan National Airport. These were offset by a reduction in cash and cash equivalents and investments of $89.7 million. The Airports Authority s current liabilities increased $43.1 million from 2016, the result of a $24.5 million increase in the current portion of bonds and notes payable in the Aviation Enterprise Fund. Advance billings and payments received in advance increased $11.4 million and accounts payable and accrued expenses increased $10.5 million. In 2016, current liabilities decreased $139.9 million from 2015 to $521.9 million, as a result of the 2016 payoff of the Full Funding Grant Agreement note in the amount of $100 million in the Dulles Corridor Enterprise Fund. In 2017, non-current liabilities increased $313.1 million to $8.0 billion. This increase was largely due to the draws and accretion on the TIFIA Loan in 2017 totaling $340.2 million. Outstanding Commercial Paper increased $19.0 million and the interest rate swaps payable decreased $13.2 million. Bonds payable, net decreased $43.0 million in the Aviation Enterprise Funds and increased $30.8 million in the Dulles Corridor Enterprise fund. The Aviation Enterprise Fund refunded Series 2007A-B Airport Revenue bonds in The Dulles Corridor Enterprise funds recorded $36.8 million accretion on the capital appreciation bonds. Other liabilities include $215.0 million in unearned grant revenues from the Commonwealth. In 2016, non-current liabilities increased $109.6 million to $7.7 billion. This change was largely due to increase in the TIFIA Loan totaling $234.9 million, a net decrease of Commercial Paper of $29.0 million and an increase in other liabilities of $83.1 million., In addition, the Aviation Enterprise Fund bonds payable, net decreased $202.6 million. Total net position, which represents the residual interest in the Airports Authority assets and deferred outflows of resources after liabilities and deferred inflows of resources are deducted, increased $207.0 million from 2016 and increased $530.4 million from The Aviation Enterprise Fund and Dulles Corridor Enterprise Fund provided $72.9 million increase and $134.1 million increase, respectively, for In 2016, the Aviation Enterprise Fund and Dulles Corridor Enterprise Fund provided $67.9 million increase and $255.5 million increase, respectively. Net investment in capital assets increased $40.0 million from The increase in 2017 was attributable to the on-going construction at the airports and the Dulles Metrorail project. On December 31, 2017, total restricted net position of $264.1 million consisted of funds restricted for construction, debt service, leases, Dulles Metrorail Project latent defects, Dulles Toll Road repairs, and Public Safety. This was an overall increase from 2016 of $102.6 million. The Aviation Enterprise Fund s restricted net position increased $14.0 million, primarily due to an increase in assets restricted for construction and for debt service. The Dulles Corridor Enterprise Fund s restricted net position increased $88.6 million largely in assets restricted for construction. 34
43 Total unrestricted net position at the end of the reporting period for the Airports Authority was a deficit of $570.8 million, which represented an overall increase of $64.5 million from Unrestricted net position increased $69.3 million for the Aviation Enterprise Fund and decreased $4.8 million for the Dulles Corridor Enterprise Fund. These net unrestricted assets may be used to meet any of the Airports Authority s ongoing operational needs, including debt service for the Aviation Enterprise Fund and Dulles Corridor Enterprise Fund, subject to approval by the Airports Authority s Board of Directors. Unrestricted net position is reduced by the debt associated with the Dulles Metrorail Project Phase 1. The costs of this project were effectively transferred to WMATA in 2014 and are no longer reflected on the Airports Authority s financial statements. CAPITAL FINANCING AND DEBT MANAGEMENT Aviation Enterprise Fund The Airports Authority is financing its Aviation Enterprise Fund Capital Construction Program (CCP) through a combination of revenues, entitlements, and discretionary grants received from the Federal Aviation Administration (FAA), state grants, PFCs, and revenue bonds. Long-term debt is the principal source of funding for the CCP. The Airports Authority has $778.7 million of outstanding variable rate bonds, which are collateralized by Letters of Credit (LOC) and Direct Purchase Indexed Loans (Index Floaters). In September 2017, the Index Floater held by Wells Fargo for the Series 2010D Bonds was expiring and therefore extended through September 2022 at a lower interest rate of 72% LIBOR + 30 bps. In October 2017, the Index Floater held by PNC for the Series 2011B Bonds was expiring and therefore replaced with a LOC provided by U.S. Bank through April 2020 with an interest rate of 72% LIBOR + 30 bps. The Airports Authority s Aviation Enterprise Fund s long-term uninsured bonds are rated AA- by Fitch, Aa3 by Moody s, and AA- by Standard & Poor s Global Rating Services (S&P). In May 2017, Moody s upgraded the Airports Authority s credit to Aa3 from A1 and changed the outlook from Positive to Stable ; Fitch and S&P affirmed the ratings with Stable outlook. The Airports Authority, through its Master Indenture of Trust, has agreed to maintain debt service coverage of not less than Debt service coverage is calculated as defined in the Master Indenture of Trust. Historically, the Airports Authority has maintained a coverage ratio significantly higher than its requirement. For 2017, 2016 and 2015 the Airports Authority s debt service coverage was 1.77, 1.79, and 1.69, respectively. Dulles Corridor Enterprise Fund In 2009, a Master Indenture of Trust was created to secure Dulles Toll Road Revenue Bonds issued by the Dulles Corridor Enterprise Fund of the Airports Authority. Under this Indenture, all bonds are secured by a pledge of the Toll Road Revenues derived by the Airports Authority from the operation of the Dulles Toll Road. In August 2014, the Airports Authority and the USDOT executed the TIFIA Loan Agreement which provides up to $1.278 billion of financing for Phase 2 of the Dulles Metrorail Project. The Dulles Corridor Enterprise completed monthly draws on the TIFIA Loan with the USDOT totaling $319.2 million in 2017 and $222.5 million in 2016 and $250.8 million in In addition, in 2017, the Dulles Corridor Enterprise has incurred $20.9 million in accreted interest costs of which $18.5 million has been capitalized to the TIFIA Loan draws. The total accreted interest costs that have been capitalized to the TIFIA Loan draws through December 31, 2017 are $32.8 million. 35
44 The Airports Authority s Dulles Corridor Enterprise Fund has four liens (First Senior, Second Senior, Subordinate, and Junior) associated with the Dulles Toll Road Revenue Bonds. The Bonds under these Liens have assigned ratings by Moody s and S&P. Please refer to Note 13 Capital Debt for additional details on the Airports Authority long term debt activity and rating. FEDERAL, STATE, AND LOCAL GRANT ACTIVITY The Airports Authority receives grants from the United States government, the Commonwealth, and other local grantors for certain operating and capital construction programs. Aviation Enterprise Fund In 2017, the Aviation Enterprise Fund received $27.1 million in total federal, state, and local grants in support of operations. This included $0.9 million in funding for the Law Enforcement Officer Reimbursement Program, which offsets expenses incurred by the Airports Authority s Public Safety personnel serving a support role to the Transportation Security Administration (TSA). Other federal grants included $0.6 million from the TSA, which was used to offset the expense of training and caring for canines used in explosives detection and $0.1 million related to the collaborative effort between the Airports Authority and the Department of Justice and Department of Treasury. In 2016, the Commonwealth, appropriated $25.0 million for the Commonwealth s fiscal years 2017 and 2018 for the purpose of reducing the airline cost per enplanement at Dulles International and thereby improving the competitiveness of the airport. The Airports Authority received $25.0 million of Commonwealth funding in The Aviation Enterprise Fund also recognized $21.2 million in federal, state, and local grants in support of capital programs in The FAA s Airport Improvement Program provided $19.2 million for runway construction and rehabilitation, taxiway reconstruction, and runway safety area improvements. Dulles Corridor Enterprise Fund The Federal Transit Administration is the primary grantor to the Dulles Metrorail Project and has committed a total of $900.0 million in federal New Starts funding for the project. The $900.0 million Full Funding Grant Agreement (FFGA) was approved by the FTA on March 10, 2009 and is inclusive of all previously awarded grants for the Dulles Metrorail Project. During 2017, the Dulles Corridor Enterprise Fund recognized $1.2 million of the FFGA award. During 2017, the Dulles Corridor Enterprise Fund recognized $20.0 million of state grant in support of capital programs. In the 2014 Transportation Plan and 2014 Budget, the Commonwealth committed to provide $300.0 million in funds to the Phase 2 Project. These funds were provided over a three year period, $100.0 million per year beginning in 2014, $100.0 million in 2015 and $100.0 million in In 2013, the Commonwealth provided $150.0 million in funding towards Phase 1 of the Dulles Metrorail Project in order to allow the Airports Authority to minimize future toll rates charged to users of the Dulles Toll Road. The first $10.0 million was recognized in 2013 and an additional $30.0 million was recognized in each year for 2014, 2015 and 2016 and an additional $20.0 million was recognized in The Airport Authority receives project funding from the Northern Virginia Transportation Authority (NVTA) a total of $60.0 million, $33.0 million in 2015 and $27.0 million in These funds are used for the construction 36
45 of the Metrorail Innovation Station which is a part of Phase 2 of the Dulles Metrorail Project. During 2017, MWAA recognized $21.5 million of NVTA funds. Please refer to Note 16 Government Grants for more information on grant activity. CASH AND INVESTMENT MANAGEMENT TOTAL BUSINESS TYPE ACTIVITIES The Airports Authority s cash and cash equivalents decreased $47.5 million to $736.5 million as of December 31, This was driven by a decrease of $28.5 million in the Dulles Corridor Enterprise Fund and a decrease in available cash and cash equivalents, both restricted and unrestricted, of $19.0 million in the Aviation Enterprise Fund. Cash and cash equivalents with an original maturity of three months or less are considered highly liquid investments. Restricted and unrestricted investments increased by $295.3 million in 2017, which was attributable to a $211.9 million increase in the Aviation Enterprise Fund and an increase of $83.4 million in the Dulles Corridor Enterprise Fund investments. The following summary shows the major sources and use of cash: Total Business-Type Activities Cash received from operations $ 938,231,152 $ 925,620,760 $ 944,677,618 Cash expended from operations (449,088,961) (437,136,219) (431,697,068) Net cash provided by operations 489,142, ,484, ,980,550 Net cash provided (used) by: Noncapital financing activities 242,904, ,689,800 82,902,196 Capital and related financing activities (515,401,481) (583,897,066) (243,808,029) Investing activities (264,159,303) (265,616,389) (154,258,997) Net increase (decrease) in cash and cash equivalents (47,514,197) (185,339,114) 197,815,720 Cash and cash equivalents, beginning of year 783,965, ,304, ,488,699 Cash and cash equivalents, end of year $ 736,451,108 $ 783,965,305 $ 969,304,419 Cash temporarily idle during 2017 was invested in demand deposits, certificates of deposit, commercial paper, United States government and agency obligations, mutual funds, repurchase agreements collateralized by the United States government or agency obligations, and other permitted investments as listed in the Master Indenture for the Airports Authority s outstanding bonds. During 2017, the Airports Authority s Aviation Enterprise Fund operating account average portfolio balance was $867.7 million, and the average yield on investments was 1.21 percent. The capital funds are held by an agent for the Trustee but managed by the Airports Authority. For 2017, the capital funds had an average portfolio balance of $423.3 million and an average yield of 2.37 percent. During 2017, the Airports Authority s Dulles Corridor Enterprise Fund operating account average portfolio balance was $263.4 million and the average yield on investments was 0.35 percent. As is the case with the Aviation Enterprise Fund, capital funds for the Dulles Corridor Enterprise Fund are held by an agent for the Trustee, but managed by the Airports Authority. For 2017, the capital funds had an average portfolio balance of $668.6 million and an average yield of 0.88 percent. Certain Airports Authority funds that will be used for bond requirements and capital projects are invested in long-term instruments. An annual cash flow projection for capital projects is developed for all bond proceeds, 37
46 and investments are matched to maximize investment income while ensuring cash is available for capital project expenses. All investments must be made following the Investment Policy that was adopted by the Airports Authority s Board. CAPITAL CONSTRUCTION Aviation Enterprise Fund The Aviation Enterprise Fund capitalized $63.0 million in projects in 2017, principally for the Corporate Office Building Relocation, the public Wi-Fi infrastructure at both airports, and the Airfield Pavement Panel Replacement and new Police Training facility at Dulles International. Dulles Corridor Enterprise Fund The Dulles Corridor Enterprise Fund s Renewal and Replacement program provided funds to address major maintenance requirements including overlays, sound wall repairs, studies, erosion and drainage control, and other maintenance projects. The Renewal and Replacement program is funded from toll road revenues. In addition, the Dulles Corridor Capital Improvement Program funds improvements related to the Dulles Toll Road including, Main Plaza Revenue Collection Tunnel and additional work completed for Chathams Ford Noise Wall, Mclean Hamlet Noise Wall and Odricks Corner New Wall, and additional costs relating to the Dulles Metrorail Project. These projects, which are funded from bond proceeds, Federal Transit Administration grants, and contributions from Fairfax County, Loudoun County, the NVTA and the Commonwealth, include the Dulles Metrorail Project, as well as other studies and improvements. The total Capital Improvement Program budget for 2017 was $1.5 billion, of which $256.2 million was allocated for Phase 1 of the Dulles Metrorail Project; $1.2 billion was allocated for Phase 2 of the Dulles Metrorail Project, and $6.9 million for Dulles Toll Road. For more information on capital asset activity, please refer to Note 8 Changes in Capital Assets. CONTACTING THE AIRPORTS AUTHORITY S FINANCIAL MANAGEMENT The financial report is designed to provide the Airports Authority s Board, management, investors, creditors, and customers with a general view of the Airports Authority s finances and to demonstrate the Airports Authority s accountability for the funds it receives and expends. For additional information about this report, or for additional financial information, please contact Andrew Rountree, Senior Vice President for Finance and Chief Financial Officer, at the following address: 1 Aviation Circle, Washington, DC, or bondholders.information@mwaa.com. 38
47 INTENTIONALLY LEFT BLANK 39
48 Basic Financial Statements Statement of Net Position As of December 31, 2017 Total Aviation Dulles Corridor Business-Type Enterprise Activities ASSETS Current assets Cash and cash equivalents $ 8,072,076 $ 247,788,223 $ 255,860,299 Restricted cash and cash equivalents 184,513,638 92,843, ,357,478 Accounts receivable, net 29,337, ,579 30,058,910 Investments 873,390, ,390,158 Restricted investments 305,283, ,366, ,650,178 Inventory 6,817,689 62,097 6,879,786 Prepaid expenses and other current assets 6,248, ,595 6,539,385 Total current assets 1,413,663, ,072,692 1,981,736,194 Non-current assets Restricted: Cash and cash equivalents 24,008, ,225, ,233,331 Accounts receivable 19,585, ,076, ,662,011 Investments 248,241, ,101, ,343,277 Total restricted 291,835, ,403, ,238,619 Unrestricted: Net pension assets 8,867, ,142 9,366,734 Bond insurance costs 727,346 13,132,509 13,859,855 Other assets 469, ,111 Total unrestricted 10,064,049 13,631,651 23,695,700 Capital assets: Land and other non-depreciable assets 182,300, ,300,690 Construction in progress 256,316,979 25,702, ,019,039 Construction in progress - Dulles Metrorail Project - 1,609,685,489 1,609,685,489 Buildings, systems and equipment 7,347,035, ,353,257 7,470,388,692 Less: accumulated depreciation (3,456,997,918) (27,170,794) (3,484,168,712) Capital assets, net 4,328,655,186 1,731,570,012 6,060,225,198 Total non-current assets 4,630,554,789 2,313,604,728 6,944,159,517 Total assets $ 6,044,218,291 $ 2,881,677,420 $ 8,925,895,711 DEFERRED OUTFLOWS OF RESOURCES Deferred outflows - debt refundings $ 70,986,799 $ - $ 70,986,799 Deferred outflows - pension plans 19,653,333 1,137,961 20,791,294 Total deferred outflows of resources $ 90,640,132 $ 1,137,961 $ 91,778,093 The accompanying notes are an integral part of these financial statements. 40
49 Statement of Net Position As of December 31, 2017 Total Aviation Dulles Corridor Business-Type Enterprise Enterprise Activities LIABILITIES Current liabilities Accounts payable and accrued expenses $ 84,285,949 $ 101,644,823 $ 185,930,772 Advance billings and payments received in advance 30,575,134 81,122, ,698,113 Accrued lease obligations 371, ,137 Due to (due from) other funds 50,058,713 (50,058,713) - Accrued interest payable 47,611,936 23,208,659 70,820,595 Current portion of bonds and notes payable 192,100,000 4,086, ,186,658 Total current liabilities 405,002, ,004, ,007,275 Non-current liabilities Other liabilities 9,029, ,162, ,192,554 Commercial paper notes - 200,000, ,000,000 Interest rate swaps payable 135,294, ,294,251 Net pension liability 1,073,101 93,210 1,166,311 TIFIA payable - 831,656, ,656,852 Bonds payable, net 4,544,844,759 2,028,484,799 6,573,329,558 Total non-current liabilities 4,690,241,851 3,275,397,675 7,965,639,526 Total liabilities $ 5,095,244,720 $ 3,435,402,081 $ 8,530,646,801 DEFERRED INFLOWS OF RESOURCES Deferred inflows - debt refundings $ 127,061 $ - $ 127,061 Deferred inflows - pension plans 22,539, ,761 22,891,514 Total deferred inflows of resources $ 22,666,814 $ 351,761 $ 23,018,575 NET POSITION (DEFICIT) Net investment in capital assets $ 235,522,685 $ 535,178,513 $ 770,701,198 Restricted for Construction 67,922, ,827, ,749,896 Debt service 51,912,050 12,373,539 64,285,589 Leases 6,280,154-6,280,154 Dulles Rail latent defects - 15,047,632 15,047,632 Dulles Toll Road repairs - 8,475,218 8,475,218 Public Safety 239, ,901 Unrestricted (deficit) 655,069,337 (1,225,840,497) (570,771,160) Total net position (deficit) $ 1,016,946,889 $ (552,938,461) $ 464,008,428 The accompanying notes are an integral part of these financial statements. 41
50 Statement of Net Position As of December 31, 2016 ASSETS Current assets Total Aviation Dulles Corridor Business-Type Enterprise Enterprise Activities Cash and cash equivalents $ 35,110,978 $ 234,632,901 $ 269,743,879 Restricted cash and cash equivalents 150,279, ,274, ,554,845 Accounts receivable, net 31,477, ,798 32,059,976 Investments 747,024, ,024,471 Restricted investments 180,919, ,534, ,454,146 Inventory 9,732, ,994 9,939,652 Prepaid expenses and other current assets 7,027, ,468 7,343,434 Total current assets 1,161,572, ,547,495 1,650,120,403 Non-current assets Restricted: Cash and cash equivalents 50,238, ,427, ,666,581 Accounts receivable 12,463, ,832, ,295,202 Investments 287,112, ,536, ,648,853 Total restricted 349,814, ,796, ,610,636 Unrestricted: Bond insurance costs 2,136,016 14,493,216 16,629,232 Other assets 1,615,598-1,615,598 Total unrestricted 3,751,614 14,493,216 18,244,830 Capital assets: Land and other non-depreciable assets 182,738, ,738,053 Construction in progress 181,352,288 21,149, ,501,979 Construction in progress - Dulles Metrorail Project - 1,146,623,098 1,146,623,098 Buildings, systems and equipment 7,320,910, ,919,840 7,439,829,967 Less: accumulated depreciation (3,260,703,540) (20,627,316) (3,281,330,856) Capital assets, net 4,424,296,928 1,266,065,313 5,690,362,241 Total non-current assets 4,777,863,136 1,916,354,571 6,694,217,707 Total assets $ 5,939,436,044 $ 2,404,902,066 $ 8,344,338,110 DEFERRED OUTFLOWS OF RESOURCES Deferred outflows - debt refundings $ 74,717,792 $ - $ 74,717,792 Deferred outflows - pension plans 16,868,799 1,618,024 18,486,823 Total deferred outflows of resources $ 91,586,591 $ 1,618,024 $ 93,204,615 The accompanying notes are an integral part of these financial statements. 42
51 Statement of Net Position As of December 31, 2016 Total Aviation Dulles Corridor Business-Type Enterprise Enterprise Activities LIABILITIES Current liabilities Accounts payable and accrued expenses $ 60,363,806 $ 115,019,875 $ 175,383,681 Advance billings and payments received in advance 17,482,625 86,122, ,605,604 Accrued lease obligations 371, ,137 Due to (due from) other funds 35,387,021 (35,387,021) - Accrued interest payable 47,964,617 23,005,427 70,970,044 Current portion of bonds and notes payable 167,575,000 4,032, ,607,707 Total current liabilities 329,144, ,793, ,938,173 Non-current liabilities Other liabilities 9,196, ,133, ,330,288 Commercial paper notes - 181,000, ,000,000 Interest rate swaps payable 148,469, ,469,565 Net pension liability 6,266, ,806 6,672,707 TIFIA payable - 491,484, ,484,374 Bonds payable, net 4,587,819,773 1,997,734,225 6,585,553,998 Total non-current liabilities 4,751,753,143 2,900,757,789 7,652,510,932 Total liabilities $ 5,080,897,349 $ 3,093,551,756 $ 8,174,449,105 DEFERRED INFLOWS OF RESOURCES Deferred inflows - debt refundings $ 145,135 $ - $ 145,135 Deferred inflows - pension plans 5,934,412-5,934,412 Total deferred inflows of resources $ 6,079,547 $ - $ 6,079,547 NET POSITION (DEFICIT) Net investment in capital assets $ 245,920,855 $ 484,821,426 $ 730,742,281 Restricted for Construction 60,104,737 11,346,057 71,450,794 Debt service 45,536,603 14,454,656 59,991,259 Leases 6,544,607-6,544,607 Dulles Rail latent defects - 15,012,821 15,012,821 Dulles Toll Road repairs - 8,334,261 8,334,261 Public Safety 190, ,213 Unrestricted (deficit) 585,748,724 (1,221,000,887) (635,252,163) Total net position (deficit) $ 944,045,739 $ (687,031,666) $ 257,014,073 The accompanying notes are an integral part of these financial statements. 43
52 Statement of Revenues, Expenses and Changes in Net Position For the year ended December 31, 2017 OPERATING REVENUES Total Aviation Dulles Corridor Business-Type Enterprise Fund Enterprise Fund Activities Concessions $ 332,007,816 $ - $ 332,007,816 Tolls - 152,022, ,022,663 Rents 283,755, ,755,117 Landing fees 93,764,918-93,764,918 Utility sales 13,260,122-13,260,122 Passenger fees 27,872,762-27,872,762 Other 10,902,393-10,902,393 Total operating revenues 761,563, ,022, ,585,791 OPERATING EXPENSES Materials, equipment, supplies, contract services, and other 209,049,602 26,841, ,890,988 Impairment loss / design costs 295, ,303 Salaries and related benefits 172,453,925 10,505, ,959,052 Utilities 25,175, ,313 25,381,791 Lease from U.S. Government 5,562,099-5,562,099 Depreciation and amortization 224,157,392 8,055, ,212,647 Total operating expenses 636,693,799 45,608, ,301,880 OPERATING INCOME 124,869, ,414, ,283,911 NON-OPERATING REVENUES (EXPENSES) Investment income 24,739,309 6,359,877 31,099,186 Interest expense (178,913,318) (115,391,692) (294,305,010) Federal, state and local grants 25,804, ,744 26,213,501 Fair value gain on swaps 13,175,314-13,175,314 Net contributions from (to) other governments (48,879,320) 101,399,850 52,520,530 Total non-operating revenues (expenses) (164,073,258) (7,223,221) (171,296,479) GAIN (LOSS) BEFORE CAPITAL CONTRIBUTIONS (39,203,929) 99,191,361 59,987,432 CAPITAL CONTRIBUTIONS Passenger facility charges 90,946,857-90,946,857 Federal, state and local grants 21,158,222 34,901,844 56,060,066 Total capital contributions 112,105,079 34,901, ,006,923 NET POSITION (DEFICIT) Change in net position 72,901, ,093, ,994,355 Net position (deficit), beginning of year 944,045,739 (687,031,666) 257,014,073 Net position (deficit), end of year $ 1,016,946,889 $ (552,938,461) $ 464,008,428 The accompanying notes are an integral part of these financial statements. 44
53 Statement of Revenues, Expenses and Changes in Net Position For the year ended December 31, 2016 OPERATING REVENUES Total Aviation Dulles Corridor Business-Type Enterprise Enterprise Activities Concessions $ 316,453,536 $ - $ 316,453,536 Tolls - 151,731, ,731,033 Rents 307,980, ,980,996 Landing fees 93,422,084-93,422,084 Utility sales 13,019,300-13,019,300 Passenger fees 32,544,343-32,544,343 Other 10,639,749-10,639,749 Total operating revenues 774,060, ,731, ,791,041 OPERATING EXPENSES Materials, equipment, supplies, contract services, and other 186,332,647 26,820, ,153,031 Impairment loss / design costs 2,045,592-2,045,592 Salaries and related benefits 171,931,528 10,663, ,595,471 Utilities 25,683, ,236 25,927,218 Lease from U.S. Government 5,502,217-5,502,217 Depreciation and amortization 234,151,332 6,986, ,138,283 Total operating expenses 625,647,298 44,714, ,361,812 OPERATING INCOME 148,412, ,016, ,429,229 NON-OPERATING REVENUES (EXPENSES) Investment income 17,941,016 1,901,118 19,842,134 Interest expense (189,201,753) (129,524,735) (318,726,488) Federal, state and local grants 703, ,711 Fair value loss on swaps 16,447,932-16,447,932 Net contributions from (to) other governments (37,647,152) 168,508, ,861,460 Total non-operating revenues (expenses) (191,756,246) 40,884,995 (150,871,251) GAIN (LOSS) BEFORE CAPITAL CONTRIBUTIONS (43,343,536) 147,901, ,557,978 CAPITAL CONTRIBUTIONS Passenger facility charges 89,811,124-89,811,124 Federal, state and local grants 21,468, ,554, ,023,109 Total capital contributions 111,280, ,554, ,834,233 NET POSITION (DEFICIT) Change in net position 67,936, ,455, ,392,211 Net position (deficit), beginning of year (as restated) 876,109,227 (942,487,365) (66,378,138) Net position (deficit), end of year $ 944,045,739 $ (687,031,666) $ 257,014,073 The accompanying notes are an integral part of these financial statements. 45
54 Statement of Cash Flows For the year ended December 31, 2017 Total Aviation Dulles Corridor Business-Type Enterprise Enterprise Activities CASH FLOWS FROM OPERATING ACTIVITIES: Operating cash receipts from customers $ 778,960,956 $ 151,883,882 $ 930,844,838 Cash payments to suppliers for goods and services (231,471,399) (26,601,205) (258,072,604) Cash payments to employees for services (180,955,694) (2,661,565) (183,617,260) Cash receipts for interfund services 7,399,098-7,399,098 Cash payments for interfund services - (7,399,098) (7,399,098) NET CASH PROVIDED BY OPERATING ACTIVITIES 373,932, ,222, ,154,975 CASH FLOWS FROM NONCAPITAL FINANCING ACTIVITIES Cash provided by other governments - 250,493, ,493,200 Cash provided to other governments (33,758,552) - (33,758,552) Interest paid to vendors (refunded) (42,411) (1,342) (43,753) Federal, state and local grants in support of operations 25,804, ,744 26,213,501 NET CASH PROVIDED (USED) BY NONCAPITAL FINANCING ACTIVITIES (7,996,206) 250,900, ,904,396 CASH FLOWS FROM CAPITAL AND RELATED FINANCING ACTIVITIES: Proceeds from issuance of bonds/notes 522,135, ,239, ,374,715 Proceeds from issuance of commercial paper - 600,000, ,000,000 Payments for refunding of bond notes and commercial paper (451,705,000) - (451,705,000) Principal payments on bonds/notes and commercial paper (144,955,000) (585,032,707) (729,987,707) Payments for capital expenditures and construction in progress (122,662,580) (589,024,749) (711,687,329) Proceeds from sale of capital assets 258,337 24, ,286 Refunding of bond insurance costs 1,116,571-1,116,571 Interest paid on bonds and commercial paper (107,020,578) (90,744,110) (197,764,688) Federal, state and local grants in aid of construction 16,649,513 27,982,698 44,632,211 Passenger facility charge receipts 88,332,942-88,332,942 NET CASH USED BY CAPITAL AND RELATED FINANCING ACTIVITIES (197,850,795) (317,554,204) (515,404,999) CASH FLOWS FROM INVESTING ACTIVITIES: Proceeds from short-term investment maturities 1,609,023, ,259,920 1,987,283,253 Purchase of short-term investments (1,840,032,871) (448,270,558) (2,288,303,429) Proceeds from long-term investment maturities 80,828,695 58,865, ,694,573 Purchase of long-term investments (36,940,970) (65,901,996) (102,842,966) NET CASH USED IN INVESTING ACTIVITIES (187,121,813) (77,046,756) (264,168,569) NET DECREASE IN CASH AND CASH EQUIVALENTS (19,035,853) (28,478,344) (47,514,197) CASH AND CASH EQUIVALENTS, Beginning of year 235,629, ,335, ,965,305 CASH AND CASH EQUIVALENTS, End of year $ 216,594,029 $ 519,857,079 $ 736,451,108 The accompanying notes are an integral part of these financial statements. 46
55 Statement of Cash Flows For the year ended December 31, 2017 Total Aviation Dulles Corridor Business-Type Enterprise Enterprise Activities RECONCILIATION OF OPERATING INCOME TO NET CASH PROVIDED BY OPERATING ACTIVITIES: Operating income $ 124,869,329 $ 106,414,582 $ 231,283,911 Adjustments to reconcile operating income to net cash provided by operating activities: Depreciation and amortization 235,555,877 8,036, ,592,785 Gain (loss) on disposal of assets (11,398,485) 18,347 (11,380,138) Provision for losses on accounts receivable 352, ,697 Impairment loss on construction in progress 295, ,303 (Increase) decrease in assets: Accounts receivable 1,787,150 (138,781) 1,648,369 Inventory 2,914, ,897 3,059,866 Prepaid expenses and other current assets 779,176 24, ,049 Increase (decrease) in liabilities: Accounts payable and accrued expenses 6,541, ,084 6,767,345 Advance billings and payments received in advance 13,092,509-13,092,509 Due to (due from) other funds (449,076) 449,076 - Total pension liabilities (16,845,926) (331,675) (17,177,601) Long-term liabilities 16,438, ,703 16,815,880 NET CASH PROVIDED BY OPERATING ACTIVITIES $ 373,932,961 $ 115,222,014 $ 489,154,975 NONCASH INVESTING, CAPITAL AND FINANCING ACTIVITIES: Unrealized gain and (loss) on investments $ 841,375 $ (913,902) $ (72,527) Contributions to other entities $ (15,120,768) $ (134,526,371) $ (149,647,139) (Increase) decrease in assets in non operating accounts receivable $ - $ (8,009,694) $ (8,009,694) Increase (decrease) in capital assets in accounts payable and accrued expenses $ 17,380,967 $ (13,601,136) $ 3,779,831 Fair value gain on swaps $ 13,175,314 $ - $ 13,175,314 The accompanying notes are an integral part of these financial statements. 47
56 Statement of Cash Flows For the year ended December 31, 2016 Total Aviation Dulles Corridor Business-Type Enterprise Enterprise Activities CASH FLOWS FROM OPERATING ACTIVITIES: Operating cash receipts from customers $ 760,818,881 $ 151,609,077 $ 912,427,958 Cash payments to suppliers for goods and services (218,116,379) (24,276,234) (242,392,613) Cash payments to employees for services (178,713,826) (2,836,978) (181,550,804) Cash receipts for interfund services 13,192,802-13,192,802 Cash payments for interfund services - (13,192,802) (13,192,802) NET CASH PROVIDED BY OPERATING ACTIVITIES 377,181, ,303, ,484,541 CASH FLOWS FROM NONCAPITAL FINANCING ACTIVITIES Cash provided by other governments - 211,615, ,615,034 Cash provided to other governments (36,623,685) - (36,623,685) Interest paid (refunded) to vendors (3,845) (1,415) (5,260) Federal, state and local grants in support of operations 703, ,711 NET CASH PROVIDED (USED) BY NONCAPITAL FINANCING ACTIVITIES (35,923,819) 211,613, ,689,800 CASH FLOWS FROM CAPITAL AND RELATED FINANCING ACTIVITIES: Proceeds from issuance of bonds/notes 386,025, ,461, ,486,230 Proceeds from issuance of commercial paper - 440,000, ,000,000 Payments for refunding of bond notes and commercial paper (469,425,000) - (469,425,000) Principal payments on bonds/notes and commercial paper (152,002,677) (476,588,182) (628,590,859) Payments for capital expenditures and construction in progress (75,233,153) (577,478,664) (652,711,817) Proceeds from sale of capital assets 413,654 9, ,460 Refundings of bond insurance costs 2,473,840-2,473,840 Interest paid on bonds and commercial paper (154,836,127) (100,028,178) (254,864,305) Federal, state and local grants in aid of construction 27,170, ,762, ,933,179 Passenger facility charge receipts 89,378,206-89,378,206 NET CASH USED BY CAPITAL AND RELATED FINANCING ACTIVITIES (346,035,690) (237,861,376) (583,897,066) CASH FLOWS FROM INVESTING ACTIVITIES: Proceeds from short-term investment maturities 1,257,922, ,622,575 1,454,545,206 Purchase of short-term investments (1,365,798,479) (226,492,280) (1,592,290,759) Proceeds from long-term investment maturities 109,769, ,621, ,390,697 Purchase of long-term investments (121,364,649) (233,896,884) (355,261,533) NET CASH USED IN INVESTING ACTIVITIES (119,471,011) (146,145,378) (265,616,389) NET DECREASE IN CASH AND CASH EQUIVALENTS (124,249,042) (61,090,072) (185,339,114) CASH AND CASH EQUIVALENTS, Beginning of year 359,878, ,425, ,304,419 CASH AND CASH EQUIVALENTS, End of year $ 235,629,882 $ 548,335,423 $ 783,965,305 The accompanying notes are an integral part of these financial statements. 48
57 Statement of Cash Flows For the year ended December 31, 2016 Total Aviation Dulles Corridor Business-Type Enterprise Enterprise Activities RECONCILIATION OF OPERATING INCOME TO NET CASH PROVIDED BY OPERATING ACTIVITIES: Operating income $ 148,412,710 $ 107,016,519 $ 255,429,229 Adjustments to reconcile operating income to net cash provided by operating activities: Depreciation and amortization 233,624,607 6,979, ,603,771 Gain on disposal of assets 526,725 7, ,512 Provision for losses on accounts receivable 353, ,166 Impairment loss on construction in progress 2,045,592-2,045,592 (Increase) decrease in assets: Accounts receivable 919,039 (121,956) 797,083 Inventory (1,044,329) 41,137 (1,003,192) Prepaid expenses and other current assets (1,411,074) 6,708 (1,404,366) Increase (decrease) in liabilities: Accounts payable and accrued expenses (2,398,207) 140,574 (2,257,633) Advance billings and payments received in advance (14,513,335) - (14,513,335) Due to (due from) other funds 3,045,638 (3,045,638) - Total pension liabilities (286,950) (665,482) (952,432) Long-term liabilities 7,907, ,250 8,852,146 NET CASH PROVIDED BY OPERATING ACTIVITIES $ 377,181,478 $ 111,303,063 $ 488,484,541 NONCASH INVESTING, CAPITAL AND FINANCING ACTIVITIES: Unrealized gain (loss) on investments $ (2,292,783) $ (5,947,867) $ (8,240,650) Contributions to other entities $ (1,023,467) $ (34,961,203) $ (35,984,670) (Increase) decrease in assets in non operating accounts receivable $ - $ (14,833,606) $ (14,833,606) Increase (decrease) in capital assets in accounts payable and accrued expenses $ (2,311,678) $ (14,469,335) $ (16,781,013) Fair value gain on swaps $ 16,447,932 $ - $ 16,447,932 The accompanying notes are an integral part of these financial statements. 49
58 INTENTIONALLY LEFT BLANK 50
59 Notes to Financial Statements 1. SUMMARY OF SIGNIFICANT ACCOUNTING POLICIES A. Reporting Entity The (the Airports Authority) is an independent interstate agency created by the Commonwealth of Virginia (the Commonwealth) and the District of Columbia with the consent of the United States Congress. The Commonwealth and the District of Columbia enacted essentially identical legislation creating the Airports Authority for the purpose of operating Ronald Reagan Washington National Airport (Reagan National) and Washington Dulles International Airport (Dulles International) (collectively, the Airports). Pursuant to an Agreement and Deed of Lease, effective June 7, 1987, the Airports were transferred by the U.S. Government to the Airports Authority for an initial term of 50 years. On June 17, 2003, the Agreement and Deed of Lease was extended 30 years to June 6, On November 1, 2008, the Virginia Department of Transportation (VDOT) transferred responsibility for the operation and maintenance of the Dulles Toll Road to the Airports Authority for an initial term of 50 years. In connection with the transfer, the Airports Authority is constructing the Dulles Metrorail Project and is making other improvements in the Dulles Corridor consistent with VDOT and regional plans. The Airports Authority is governed by a Board of Directors (the Board) with members appointed by the Governors of the Commonwealth and the State of Maryland, the Mayor of the District of Columbia, and the President of the United States. Only the accounts of the Airports Authority are included in the reporting entity. There are no U.S. or state government agency finances that should be considered for inclusion in the Airports Authority s financial reporting entity. B. Measurement Focus, Basis of Accounting & Financial Statement Presentation The financial statements of the Airports Authority are presented using the economic resources measurement focus and the accrual basis of accounting in accordance with generally accepted accounting principles in the United States of America (GAAP), as prescribed by the Governmental Accounting Standards Board (GASB). Under the accrual basis of accounting, revenues are recorded when earned, and expenses are recorded when incurred. As defined by the GASB, the Airports Authority reports the operations of the Airports and the Dulles Toll Road, Dulles Metrorail Project, and related improvements as two separate Business-Type Activities. Business-Type Activities are those financed in whole or in part by fees charged to external parties for goods or services. The Airports operate as a single Business-Type Activity and are reported in the Airports Authority s Aviation Enterprise Fund. The Dulles Toll Road, the Dulles Metrorail Project, and related improvements in the Dulles Corridor operate as a single Business-Type Activity and are reported in the Dulles Corridor Enterprise Fund. The effects of interfund activity between these two enterprise funds have been eliminated in the total columns of the financial statements. Revenues from airlines, concessions, rental cars, parking and toll collections are reported as operating revenues. Financing and investing related transactions are reported as non-operating revenues. All expenses related to operating the Airports Authority are reported as operating expenses. Interest expense and financing costs are reported as non-operating expenses. 51
60 C. Use of Estimates in the Preparation of the Financial Statements The preparation of financial statements in conformity with GAAP in the United States of America requires management, where necessary, to make estimates and assumptions that affect the reported amounts of assets and liabilities and disclosure of contingent assets and liabilities at the date of the financial statements and the reported amounts of revenues and expenses during the reporting period. Significant estimates include the useful lives of capital assets, the fair value of derivative financial instruments, an allowance for doubtful accounts, other post-employment benefits obligations, and certain self-insured liabilities. Actual results could differ from those estimates. D. Budgeting Requirements The Airports Authority s annual budgeting process is a financial planning tool used to establish the estimated revenues and expenditures for the Aviation Enterprise Fund and Dulles Corridor Enterprise Fund. The Airports Authority is not required to demonstrate statutory compliance with its annual operating budgets. Accordingly, budgetary data is not included in the basic financial statements. E. Net Position Net position represents the residual interest of all other elements presented in the statement of net position for the Aviation Enterprise Fund and the Dulles Corridor Enterprise Fund. Net position is the difference between (a) assets and deferred outflows of resources and (b) liabilities and deferred inflows of resources. Net position is displayed in three components: Net investment in capital assets, which includes capital assets funded from unrestricted and restricted sources, net of accumulated depreciation and outstanding debt attributable to acquisition of the capital assets; Restricted when constraints are imposed by third parties or enabling legislation on assets or deferred outflows of resources, net of any liabilities and deferred inflows of resources which will be liquidated with the restricted assets; or Unrestricted, which include all remaining assets, deferred outflows of resources, liabilities and deferred inflows of resources not included in the preceding two categories. F. Revenue Recognition Revenues that result from providing services in connection with the principal ongoing operations of the Airports Authority s enterprises are reported as operating revenues. Revenues are reported net of estimated uncollectible amounts. The Airports Authority s operating revenues are presented in eight major categories as follows: Concessions Concession revenues are generated from public parking facilities and from commercial tenants who provide goods and services to the public or to other tenants of the Airports. Commercial tenant operations include car rentals, food and beverage sales, retail and newsstand sales, display advertising, ground transportation, in-flight catering, fixed-based operations, and other provided services. Revenues earned by the Airports Authority for commercial tenant operations are based on negotiated agreements and are usually based on the greater of a minimum annual guarantee or a percentage of the tenants gross receipts. Parking fees are collected directly by the Airports Authority. Concession revenues are recognized when minimum guarantees are earned or as services are provided or goods are sold to the public or other tenants of the airports. Tolls Toll revenues represent revenues collected from vehicles using the Dulles Toll Road and include automated vehicle identification or electronic toll collections, cash collections and violation revenues. Violation revenues are recorded at gross amounts, and the related collection and administrative fees are expensed. Toll revenues are recognized in the period in which the toll road usage occurred. 52
61 Rents Rental revenues are earned through leases of Airports Authority terminal and non-terminal property space. Leases with the airlines are based on full cost recovery plus debt service coverage, through rates and charges as described in Note 2 Airport Use Agreement and Premises Lease. Other leases are for terms of one or more years and include contractually established rental rates and provisions for annual rent adjustments. Rental revenues include common area maintenance charges as well as cost recovery for normal utility usage in most cases. Terminal and concourse rental rates at Dulles International include cost recovery and debt service coverage for the Automated People Mover system (the AeroTrain). Rental revenue is recognized over the life of the respective leases. Landing Fees Landing fees are generated principally from the airlines and are based on the landed weight of aircraft. The landing fee structure is determined annually based on full cost recovery of airside related charges pursuant to an agreement between the Airports Authority and the signatory airlines, as described in Note 2 Airport Use Agreement and Premises Lease. Utility Sales Utility revenues are generated from metered utility usage for terminal and non-terminal tenants whose utility usage is not already included in rental fees. Utility revenues are recognized based on the period of actual usage. Passenger Fees Passenger fee revenues are comprised of fees charged to airlines for use of U.S. Customs and Border Protection Federal Inspection facilities and for use of the mobile lounge passenger conveyance system at Dulles International. Passenger fee revenues also include security fees charged to the Transportation Security Administration. Passenger fee revenues are recognized when the facilities and systems are used or when the security services are provided. Customer Facility Charge On April 1, 1993, the Airports Authority began requiring the on-airport car rental companies at Reagan National to charge a Customer Facility Charge (CFC) to be used to pay, or to reimburse the Airports Authority, for costs, fees, and expenses associated with financing, maintaining, and operating the car rental companies Quick Turn-Around Facility, 55 percent of the cost of the south parking structure, 55 percent of the costs of busing service used to transport public parking patrons, and other costs, fees and expenses that may be paid from CFC proceeds. The CFC is $3.50 in 2017, increasing from $2.50 on February 1, 2017, per rental day and is collected by the car rental companies from each of their customers and subsequently remitted to the Airports Authority. In accordance with the concessions contracts between the Airports Authority and the car rental companies, the CFC cannot be used for the Airports Authority s indirect costs. CFC revenues are included in the Statements of Revenues, Expenses and Changes in Net Position as Concession revenues and associated assets are included in the Statements of Net Position as unrestricted assets. Other Revenues The other revenues category includes employee parking fees, medical service fees, and other miscellaneous revenues. Other revenues are recognized during the period the services are provided. G. Allocations of Overhead and Other Indirect Costs and Project Costs The majority of costs related to the Aviation Enterprise Fund and the Dulles Corridor Enterprise Fund are directly charged to the appropriate fund as a direct cost. Administrative functions, which represent overhead costs for the entire Airports Authority, as well as other indirect costs, such as Public Safety functions, are initially paid from the Aviation Enterprise Fund, but include costs which are appropriately allocable to the Dulles Corridor Enterprise Fund as costs associated with the operation of the Dulles Toll Road or as project management and administration costs for the Dulles Metrorail Project. A cost allocation plan is used to identify and quantify all overhead and other indirect costs appropriately allocable to the Dulles Toll Road or to the Dulles Metrorail Project within the Dulles Corridor Enterprise Fund. 53
62 All allocated overhead and other indirect costs are expensed by the Dulles Corridor Enterprise Fund and recognized as a reduction of expenses by the Aviation Enterprise Fund. Costs allocated for 2017 and 2016 are recognized within Operating Expenses on the Statements of Revenues, Expenses and Changes in Net Position as follows: Year ended December 31, Materials, equipment, supplies, contract services, and other $ 1,330,101 $ 1,233,108 Salaries and related benefits 7,678,263 7,665,065 Utilities 30,046 62,214 Depreciation and amortization 6, ,804 Total $ 9,044,456 $ 9,312,191 The Dulles Metrorail Project is being constructed in two phases (refer to Note 3 The Dulles Toll Road and Construction of the Dulles Metrorail Project). Project overhead costs are allocated between the two phases of the project based on a cost allocation plan and are recorded as expenses. H. Cash and Cash Equivalents For purposes of reporting cash flows, cash and cash equivalents include cash on hand, demand deposits, certificates of deposit, commercial paper, United States government and agency obligations, money market funds, and repurchase agreements collateralized by United States government or agency obligations with an original maturity of three months or less, including restricted assets. I. Investments The Airports Authority s investment policy is determined by the Board. Permitted investments are set within the policy. Written investment objectives and procedures are developed by the staff in consultation with the Investment Committee. The Investment Committee meets quarterly to review the portfolio performance, confirm compliance to the policy, and formulate an investment plan for the next quarter. In accordance with the provisions of GAAP, investments with an original maturity greater than one year are recorded at their fair value and all investment income, including changes in the fair value of investments, are reported as investment income in the financial statements. Investments with an original maturity of less than one year are carried at amortized cost. Fair value measurements are categorized within the fair value hierarchy and are based on the valuation inputs used to measure the fair value of the asset. The inputs are categorized into levels with highest priority given to unadjusted quoted prices in active markets (level 1) and the lowest priority to unobservable inputs (level 3). Investments consist of securities with an original maturity greater than three months and include United States government and agency obligations, guaranteed investment contracts and repurchase agreements collateralized by United States government or agency obligations, certificates of deposit and commercial paper. 54
63 J. Accounts Receivable Accounts receivable are reported net of estimated uncollectible amounts when earned. The Airports Authority s payment terms range from zero to 30 days (60 days for government agencies), depending on the type of service provided. An allowance for doubtful accounts for the Aviation Enterprise Fund is based on management estimates of uncollectible revenue billings. As a customer s balance is deemed uncollectible, the receivable is offset against this allowance. Subsequent receipt of a receivable previously written off is applied to this allowance. An allowance for doubtful accounts for the Dulles Corridor Enterprise Fund is based on management estimates of uncollectible revenue billings. Since the receivables in the Dulles Corridor Enterprise Fund are primarily from governmental entities, the allowance for doubtful accounts is not needed. K. Inventory and Prepaid Items Inventory consists of supplies, maintenance parts, and bulk materials such as sand and salt, all of which are for use at the Airports and Dulles Toll Road. Inventories of materials and supplies are determined both by physical counts and through perpetual inventory systems. Inventories are valued at cost using the weighted average valuation method. The Airports Authority records all inventory adjustments identified by physical counts directly to expense. Obsolete inventory is either returned to the vendor for credit (if possible) or disposed of according to Airports Authority policy. Certain payments to vendors reflect costs applicable to future accounting periods and are recorded as prepaid items in the financial statements. L. Restricted Assets Assets restricted to specific purposes by legally enforceable requirements are segregated on the Statements of Net Position. Requirements include: externally imposed requirements by creditors (such as through debt covenants), grantors or contributors; laws or regulations of other governments; and constitutional provisions or enabling legislation. The Airports Authority s restricted assets are expendable. The Airports Authority s policy is to spend restricted assets before unrestricted assets are spent when both are available for the same purpose. Restricted assets necessary to meet current liability obligations are classified as current assets. Restricted assets that are restricted for disbursement in the acquisition or construction of non-current assets or that are segregated for the liquidation of long-term debts are classified as non-current assets. Assets restricted for construction include the funds available for the design and construction of capital improvements for the Airports and the Dulles Toll Road as well as for construction of the Dulles Metrorail Project. Assets restricted for construction include cash, investments and receivables obtained from debt proceeds, grants and passenger facility charges. Assets restricted for debt service include the cash balances required to pay the semi-annual interest payments as well as the principal for the annual October bond payments. The restricted assets for debt service reserve include cash and investments totaling the maximum amount of required principal payments for the bonds scheduled to come due in one year. The debt service reserve accounts are revalued each year in October. Any amounts in excess of the debt service requirements are transferred to the applicable construction fund or taken into the operating fund of the Airports Authority if the construction funds have been expended. If the debt service reserve is insufficient, the Airports Authority transfers funds into the accounts. Assets restricted for leases represents funds which have been restricted based on operating lease agreements. Assets restricted for Dulles Metrorail Project latent defects and for Dulles Toll Road 55
64 repairs represent cash and investments which are held in accordance with contractual agreements for the construction of the Dulles Metrorail Project as well as the operation of the Dulles Toll Road (refer to Note 3 The Dulles Toll Road and Construction of the Dulles Metrorail Project). Assets restricted for the benefit of the Airports Authority s Public Safety department represent cash funds obtained through cooperative seizure activities with federal and state justice agencies (refer to Note 16 Government Grants). M. Pensions For purposes of measuring the net pension liability or (asset), deferred outflows of resources and deferred inflows of resources related to pensions, and pension expense, information about the fiduciary net position of the Civil Service Retirement Systems (CSRS), the Federal Employees Retirement System (FERS) and the Airports Authority General and Public Safety Employee Retirement Plans (the Authority Plans) and the additions to and deductions from the CSRS s, FERS s and Authority Plans net fiduciary position have been determined on the same basis as they were reported by the United States Office of Personnel Management and the actuaries. For this purpose, benefit payments (including refunds of employee contributions) are recognized when due and payable in accordance with the benefit terms. Investments are reported at fair value. N. Capital Assets Capital assets used in operations Capital assets are stated at historical cost or, if acquired upon termination or expiration of tenant leases, acquisition value at the date of transfer. Costs for capital assets under construction include direct, indirect project management costs and financing costs incurred. Provision for depreciation has been calculated using the straight-line method over the estimated useful lives of the assets. The cost of internally developed software and other assets, if amortized, uses the straight-line method. The Airports Authority does identify certain intangible assets, such as permanent easements, as having indefinite lives. The estimated useful lives and corresponding capitalization thresholds are as follows: Category Useful Life Threshold Equipment 3-15 years $10,000 Motor vehicles 3-15 years $10,000 Intangible assets 3-15 years $10,000 Buildings 5-50 years $25,000 Systems and structures 5-50 years $25,000 Maintenance, repairs, and minor improvements and replacements are expensed as incurred. Permanently impaired capital assets that will continue to be used by the Airports Authority are written down to their measured impaired value; assets the Airports Authority has determined will no longer be used are written off completely. Pollution remediation obligations that do not qualify for capitalization are accrued as liabilities and expensed when a range of expected outlays is reasonably estimable or upon receipt of goods and services. 56
65 Capital assets under construction to be transferred to other governmental agencies Costs for capital assets under construction, which upon completion will be transferred to other governmental agencies, are stated at historical cost and include direct costs, indirect costs, and financing costs. Indirect costs capitalized as project costs only include construction administration expenses directly attributable to these specific capital asset programs. The Airports Authority is responsible for acquiring the rights-of-way and property interest, including easements, necessary for the construction of the Dulles Metrorail Project and other projects within the Dulles Corridor. However, the Airports Authority and VDOT are coordinating the acquisition of the property and determining where property interests will be acquired by VDOT in the name of the Commonwealth either through eminent domain or through some other procedure. At the discretion of VDOT, all property in VDOT s control needed for these projects will be made available to the Airports Authority in the form of a land use permit. At the completion of the projects, VDOT shall transfer certain properties acquired for construction and operation of the projects by deed, easement, or permit to the Airports Authority. Although VDOT may hold the legal title to these acquired property interests, the costs incurred to acquire these property interests are included in construction in progress, as the Airports Authority has control of these property interests during the construction period. Pollution remediation liabilities associated with the capital assets under construction to be transferred to other governmental agencies are capitalized as incurred, as these liabilities are incurred to prepare the capital asset for transfer to another governmental agency and the associated property was acquired with known or suspected pollution that was expected to be remediated. Once construction is completed and the asset is accepted by the other government agency, the Airports Authority will account for the transfer in accordance with the relevant accounting requirements. O. Capitalization of Interest Interest incurred during the period that relates to the construction or production of capital assets or to the construction of assets that are discrete projects and intended for donation to other entities is capitalized. For interest on tax-exempt debt, the amount of interest to be capitalized is calculated by offsetting interest expense incurred with interest earned on invested debt proceeds, from the date of the borrowing until completion of the project. This net capitalized interest is allocated to completed projects based on the completion date of each project funded with proceeds from that particular debt issue. For interest on taxable debt, the amount of interest capitalized is calculated by applying the interest rate of the debt to the average amount of the accumulated expenditures during the period. P. Deferred Outflows/Inflows of Resources In addition to assets, the Statement of Net Position contains a separate section for deferred outflows of resources which represent a consumption of net position that applies to a future period(s) and will be recognized as an outflow of resources in a future period(s). The Airports Authority recognizes deferred outflows for debt refundings and pension plans. In addition to liabilities, the Statement of Net Position contains a separate section for deferred inflows of resources which represent an acquisition of net position that applies to a future period(s) and will be recognized as an inflow of resources in a future period(s). The Airports Authority recognizes deferred inflows for debt refundings and pension plans. 57
66 Q. Long-Term Debt Debt issuance costs represent expenses incurred in the process of issuing bonds, commercial paper notes and interest rate swaps and are expensed as incurred. Insurance related to debt issuance is amortized over the life of the related debt. Original issue discounts or premiums are amortized using the effective-interest method over the life of the related debt. Interest on capital appreciation debt is accreted using the straight-line method. For debt refunded, the difference between the reacquisition price and the net carrying amount of the refunded debt is deferred and amortized as a component of interest expense using the straight-line method over the remaining life of the refunded debt or the life of the new debt, whichever is shorter. R. Federal, State & Local Grants The Airports Authority receives federal, state, and local grants in support of specific operational programs, its Capital Construction Program (CCP) and the Dulles Metrorail Project. Grants are recognized as related expenditures are made and all eligibility requirements are met. Grants recognized for services provided directly to a government entity are reported as operating revenues in the Statements of Revenues, Expenses and Changes in Net Position. Grants obtained through operational activities that are not related to services provided to any governmental entity are reported as non-operating revenues. Grants for capital asset acquisition, facility development, and/or rehabilitation and long-term planning are reported as capital contributions. Capital contributions are reported in the Statements of Revenues, Expenses and Changes in Net Position after non-operating revenues and expenses. S. Passenger Facility Charges In 1990, Congress approved the Aviation Safety and Capacity Expansion Act, which authorized domestic airports to impose a Passenger Facility Charge (PFC) on enplaning passengers. PFCs may be used for airport projects that meet at least one of the following criteria: preserve or enhance safety, security, or capacity of the national air transportation system; reduce noise or mitigate noise impact resulting from an airport; or furnish opportunities for enhanced competition between or among carriers. The Airports Authority has imposed PFCs since November 1993 at Reagan National and since January 1994 at Dulles International. PFCs are collected by the airlines and remitted on a monthly basis to the Airports Authority. The Airports Authority accounts for PFCs on an accrual basis, based on the month the charges were collected by the airlines. Due to their restricted use, PFCs are categorized as capital contributions. T. Lease Obligations The Airports were transferred by the federal government to the Airports Authority under the terms of a lease (the Federal Lease) which transferred a leasehold interest in all of the Airports then-existing real property, including access highways and related facilities, and transferred title to all equipment, materials, furnishings, and other personal property appurtenant to or located on the Airports property (other than particular property required for federal air traffic control responsibilities). Upon expiration of the Federal Lease, the Airports, including improvements, will be returned to the Federal government. Since the transfer, the Airports Authority has acquired title to land and aviation easements adjacent to Dulles International for airport expansion. All land acquired after the transfer is not subject to the Federal Lease except that, pursuant to amendments to the Federal Lease, any after-acquired land in the Airports Authority s possession at the expiration of the Federal Lease will revert to the federal government. 58
67 The Airports Authority accounts for the Federal Lease as an operating lease. The Federal Lease provides for an annual base rental payable to the United States Treasury and is subject to annual adjustment for inflation and interest. The Airports Authority invests the monthly lease payments in an interest-bearing account or investments allowed by the Airports Authority Investment Policy and makes semi-annual payments, including interest, to the Federal government. In accordance with generally accepted accounting principles for an operating lease, the property originally transferred under the Federal Lease does not appear on the Statements of Net Position. The Dulles Toll Road is operated under the Permit and Operating Agreement (the Permit) from VDOT. Under the terms of the Permit, the Airports Authority has the exclusive right to establish, charge, and collect tolls and other user fees for the use of the Dulles Toll Road until the expiration of the term, or earlier termination, of the Permit. Under the terms of the Permit, the revenues from the Dulles Toll Road are to pay for the operation and maintenance of the Dulles Toll Road, to pay the debt service associated with construction of the Dulles Metrorail Project and other Dulles Corridor improvements, and to fund reserves associated with maintaining and preserving the Dulles Toll Road. Any residual amounts are to be paid to VDOT within 180 days of the end of the fiscal year. Upon the expiration of the term, or earlier termination, of the Permit, all facilities of the Dulles Toll Road, including any improvements, will be returned to VDOT in its original or an enhanced condition. Other than the residual amounts which may be owed by the Airports Authority to VDOT, the Permit does not require any significant consideration in exchange for the Airports Authority s access to operate and maintain the Dulles Toll Road. The Airports Authority has entered into leases for office space used exclusively by Dulles Metrorail Project personnel with lease terms consistent with the construction period for the Dulles Metrorail Project. The expenditures under these operating leases are capitalized as construction in progress costs of the Dulles Metrorail Project. The Airports Authority has entered into a lease for office space used for the locating of office personnel originally situated in the Corporate Office Building on Reagan National. The expenditure under this operating lease is expensed as incurred. U. Post-employment Benefits The Airports Authority recognizes pension expense and deferred outflows of resources and deferred inflows of resources related to pensions that result in changes in the components of the net pension liability. Net pension liability is measured as a portion of the actuarial present value of projected benefits payments that is attributed to past period of employee service net of the pensions plan s fiduciary net position. See Note 6 Pension Plans and Deferred Compensation Plan. The Airports Authority provides other post-employment benefits (OPEB) of healthcare and life insurance. OPEB plan contributions are actuarially determined and the Airports Authority recognizes expense for the year in relation to the annual required contribution to the annual OPEB costs. The Airports Authority records an adjustment to the net OPEB obligation for any differences between the OPEB expense in relation to the annual required contribution and contributions made in relation to the annual required contribution. The contribution requirements are based upon projected pay-as-you-go financing requirements and funding for future benefits. The Airports Authority pays 80 percent of the health premium costs, 45 percent of the dental premium costs, and 100 percent of the basic life insurance costs for eligible employees, with the retirees paying the remaining 59
68 premium costs and 100 percent of the cost of supplemental life insurance. See Note 7 Post-Employment Benefits. V. Compensated Absences Airports Authority employees are granted paid vacation at rates of 13 to 30 days per year, depending on their length of employment. General employees may accumulate up to a maximum of 30 days. Firefighters who work a 56-hour week may accumulate up to a maximum of 6 weeks. Executive employees exceeding a specified pay scale are entitled to accumulate up to 60 days. The accumulated vacation is accrued when incurred, as employees will be paid for accumulated vacation either during their future service to the Airports Authority or upon their termination of service. The calculation of the liability is based on compensation rates plus related employer-paid benefits in effect as of the end of the current fiscal year. The portion of this liability expected to be paid within the next year is reflected in accrued expenses while the amount expected to be paid out after one year is included in other non-current liabilities. Airports Authority employees earn 13 days of sick leave per year. Unused sick leave for employees enrolled in the Airports Authority s retirement plan is counted at retirement as additional time worked for calculation of the pension benefit. There is no liability for unpaid accumulated sick leave, as the Airports Authority does not pay any amounts when employees separate from service. W. Advance Billings and Payments Received in Advance Advance billings consist of certain charges for rents, landing fees, and passenger fees to be earned at both airports and certain non-airline rental income at Dulles International. The applicable advance billing charges for rents, landing fees, and passenger fees charged to airlines are determined by the calculation of settlement (refer to Note 2 - Airport Use and Lease Agreement and Premises Lease). Advance billings as a result of settlement are recognized on a straight-line basis over a term of one year. The applicable non-airline rental income represents lease rentals, received in advance, for certain ground leases entered into with developers. The applicable nonairline rental income is recognized as revenue on a straight-line basis over the terms of the related leases when the term is less than one year. The applicable revenue for leases with developers with terms in excess of one year is recognized using the effective-interest method over the terms of the related agreements. Payments received in advance represent remittances received from tenants in payment of future period rent obligations, in payment of future periods for annual parking permits or which exceed that tenant s total outstanding obligations to the Airports Authority. X. Self-Insurance The Airports Authority provides employee group medical and dental insurance through a combination of selfinsured and insured arrangements. Under the self-insured plans, the Airports Authority assumes the financial risk for the payment of employee medical and pharmacy claim expenses incurred by participants. Under the fully insured plans, the Airports Authority pays a fixed premium for employee health care, prescription drugs, and dental insurance, and the insurance company assumes the risk for all claims expenses. Risk management insurance is also provided through a combination of self-insured and insured arrangements (refer to Note 18 Risk Management). The cost of claims reported and an estimate of claims incurred but not reported is charged to operating expenses. Liabilities for unpaid claims are accrued based on management s estimate using actual costs, historical experience, current trends, and quarterly actuarial reviews. Liabilities for unpaid claims expected to be paid out within the next year are included on the Statements of Net Position in 60
69 accounts payable and accrued expenses, while liabilities for unpaid claims which are expected to be paid out in years subsequent to the next year are included in other long-term liabilities. The appropriateness of the selfinsurance accrued liabilities is continually reviewed and updated by management. Y. Taxes The Airports Authority is exempt from the payment of federal and state income, property, and certain other taxes. Z. Recently Issued Accounting Pronouncements GASB Statement No. 74, Financial Reporting for Postemployment Benefit Plans Other Than Pension Plans (GASB 74) improves the usefulness of information about postemployment benefits other than pensions (other postemployment benefits or OPEB) included in the general purpose external financial reports of state and local governmental OPEB plans for making decisions and assessing accountability. This Statement replaces Statements No. 43, Financial Reporting for Post-employment Benefit Plans Other Than Pension Plans (GASB 43), as amended, and No. 57, OPEB Measurements by Agent Employers and Agent Multiple-Employer Plans. The requirements for defined contribution OPEB plans replace the requirements for those OPEB plans in Statement No. 25, Financial Reporting for Defined Benefit Pension Plans and Note Disclosures for Defined Contribution Plans, as amended, GASB 43, and Statement No. 50, Pension Disclosures. The requirements of GASB 74 are effective for periods beginning June 15, 2016 and thereafter. The Airports Authority has incorporated required changes in their OPEB reporting. GASB Statement No. 75, Accounting and Financial Reporting for Postemployment Benefits Other Than Pensions (GASB 75), improves the accounting and financial reporting by state and local governments for postemployment benefits. The requirements of GASB 75 are effective for periods beginning June 15, 2017 and thereafter. The Airports Authority will review the Statement and incorporate any required changes necessary. GASB Statement No. 80, Blending Requirements of Certain Component Units an amendment of GASB Statement No. 14 improves financial report by clarifying the financial statement presentation requirements for certain component units. The requirements of GASB 80 are effective for periods beginning after June 15, 2016 and thereafter. The Airports Authority does not have any component units so the provisions of this statement do not apply. GASB Statement No. 81 Irrevocable Split-Interest Agreements establishes accounting and financial reporting standards for irrevocable split-interest agreements created through trusts or other legally enforceable agreements with characteristics that are equivalent to irrevocable split-interest agreements in which a donor irrevocably transfers resources to an intermediary. The requirements of this Statement are effective for periods beginning after December 15, 2016 and thereafter. The Airports Authority does not have any irrevocable splitinterest agreements so the provisions of this statement do not apply. GASB Statement No. 82 Pension Issues an amendment of GASB Standards No. 67, No. 68 and No. 73 establishes accounting and financial reporting requirements for pensions provided to the employees of state or local governmental employers. The requirements of this Statement are effective for reporting periods beginning after June 15, 2016 and thereafter. The Airports Authority has incorporated required changes in their pension reporting. 61
70 GASB Statement No. 83, Certain Asset Retirement Obligations establishes standards of accounting and financial reporting for certain asset retirement obligations, a legally enforceable liability associated with the retirement of a tangible capital asset. The requirements of this Statement are effective for reporting periods beginning after June 15, 2018 and thereafter. The Airports Authority will review the Statement and incorporate any required changes to their financial reporting. GASB Statement No. 84, Fiduciary Activities establishes standards of accounting and financial reporting for fiduciary activities. The requirements of this Statement are effective for reporting periods beginning after December 15, 2018 and thereafter. The Airports Authority will review the Statement and incorporate any required changes in their financial reporting. GASB Statement No. 85, Omnibus 2017 establishes accounting and financial reporting requirements for blended component units, goodwill, fair value measurements and application, and postemployment benefits. The requirements of this Statement are effective for reporting periods beginning after June 15, The Airports Authority will review the Statement and incorporate any required changes in their financial reporting. GASB Statement No. 86, Certain Debt Extinguishment Issues improves consistency in accounting and financial reporting for in-substance defeasance of debt by providing guidance for transactions and other monetary assets acquired with only existing resources are placed in an irrevocable trust for the sole purpose of refunding debt. It also improves accounting and financial reporting for prepaid insurance on debt that is extinguished and notes to financial statements for debt that is defeased in substance. The requirements of this Statement are effective for reporting periods beginning after June 15, The Airports Authority will review the Statement and incorporate any required changes in their financial reporting. GASB Statement No. 87, Leases improves the accounting and financial reporting for leases by governments. The Statement requires recognition of certain lease assets and liabilities for leases that previously were classified as operating leases and recognized as inflows of resources or outflows of resources based on the payment provisions of the contract. It establishes a single model for lease accounting. The requirements of this Statement are effective for reporting periods beginning after December 15, The Airports Authority will review the Statement and incorporate any required changes in their financial reporting. AA. Prior Year Changes Certain tables within the notes in previously published documents included amounts rounded to the thousands. These amounts have been updated to reflect rounding to the dollars to be consistent with the current presentation. 2. AIRPORT USE AGREEMENT AND PREMISES LEASE The Airport Use Agreement and Premises Lease Agreement (Use and Lease Agreement) provides for the use and occupancy of facilities at the Airports and establishes the rates and charges, including landing fees and terminal rents, to be paid by the major airlines (Signatory Airlines) serving the Airports. Airline payments of rents, fees and other charges pay for the costs assigned to the airline-supported cost centers. The Airports Authority s other revenues, principally concession revenue, pay for the costs assigned to other cost centers at the Airports, such as roadways, parking areas and non-airline revenue generating portions of the terminal. In February 1990, the Airports Authority entered into a long-term Airport Use and Lease Agreement with the Signatory Airlines serving the Airports. That Use and Lease Agreement was for a term of 25 years to expire on 62
71 September 30, 2014, but was extended through December 31, 2014, terminating as of the end of the 2014 fiscal year. In November 2014, the Airports Authority s Board approved a new Use and Lease Agreement which became effective January 1, The new Use and Lease Agreement became effective with nearly all of the airlines providing service at Reagan National and Dulles International. For airlines operating at Reagan National, the term of agreement is 10 years, starting from the effective date of the agreement to December 31, For airlines operating at Dulles International, the term of agreement was originally three years, starting from the effective date of the agreement to December 31, In 2016, the First Universal Amendment to the Use and Lease Agreement (First Amendment) was agreed upon between the Airports Authority and the Signatory Airlines, which extended the Use and Lease Agreement for Dulles International through December 31, Both the former and the new Use and Lease Agreements are hybrid agreements, which include elements of both compensatory and residual rate-making methodologies. The Use and Lease Agreements are compensatory to the extent the costs are allocated to specified cost centers, and the users of those cost centers are responsible for paying the costs. Signatory Airlines agree to pay fees that allow the Airports Authority to recover the total cost requirement of the airline-supported cost centers, which include airfield, terminal, equipment (e.g., loading bridges, baggage conveyors and devices), passenger conveyance, and the International Arrivals Building at Dulles International. The Airports Authority is responsible for all non-airline cost centers, such as general aviation, ground transportation, and Dulles International cargo. The residual element of the Use and Lease Agreement provides that, in accordance with a formula, the Airports Authority will share its revenue, after certain expenses, referred to as Net Remaining Revenue (NRR), with the Signatory Airlines. To calculate the Airports Authority s and the Signatory Airlines respective shares of NRR, the total amount of NRR is first segregated by Airport. NRR at each Airport is then reduced by depreciation, debt service coverage on Senior Bonds and Subordinated Bonds and coverage in the tenant equipment cost centers allocable to each Airport, with the Signatory Airlines receiving 100 percent of an amount equal to the debt service coverage on any Senior Bonds and Subordinated Bonds and coverage in the tenant equipment cost centers and the Airports Authority receiving 100 percent of an amount equal to depreciation. Rates and charges are established annually and are based on projected activity and costs. The Use and Lease Agreement provides for a mid-year adjustment to rates and charges. In addition, at any time during the year if revenues fall five percent or more below projections, rates and charges may be adjusted to provide for full cost recovery plus debt service coverage. The Use and Lease Agreement has rate making features that are designed to ensure the Airports Authority s debt service and related coverage obligations under the Indenture are met. The Use and Lease Agreement authorizes the Airports Authority to make immediate rate adjustments in the event projected revenues are not adequate to meet the rate covenant under the Indenture. These adjustments are referred to as Extraordinary Coverage Protection Payments under the Use and Lease Agreement. The Indenture requires there be 125 percent coverage on the debt service on the Bonds. Under the Use and Lease Agreement, the Airports Authority sets its airline rates and charges at each Airport to recover its costs in the airline-supported cost centers. These costs include 100 percent of the debt service assigned to these cost centers, plus debt service coverage at varying amounts, depending on the Airport and the year, to satisfy, with respect to this debt service, the 125 percent coverage covenant included in the Indenture. Under the previous Use and Lease Agreement in effect through December 31, 2014, airline-funded debt service coverage at both Reagan National and Dulles International was 25 percent of debt service. In the first three years of the new Use and Lease Agreement, from , airline-funded debt service coverage at both Reagan National and Dulles International will be 35 percent of debt service. In the fourth through ninth years of the new Use and Lease Agreement, from , airline-funded debt service coverage will be 30 percent of debt 63
72 service only at Reagan National. This requirement was extended to Dulles International under the First Amendment. In 2024, the final year of the new Use and Lease Agreement, airline-funded debt service coverage will be 25 percent of debt service at Reagan National. This requirement was also extended to Dulles International under the First Amendment. In the event the 125 percent debt service coverage is not met at an Airport, an adjustment in the airlines rates and charges will occur at that Airport to produce compliance with the coverage covenant. In the event the Airports Authority is unable to adjust airline rates sufficiently at the Airport that failed to generate the required 125 percent debt service coverage, under the Use and Lease Agreement, the Airports Authority shall adjust the rates at the other Airport as necessary to fulfill the Airports Authority s obligation to meet the debt service coverage covenant required by the Indenture. The Use and Lease Agreement provides for a Capital Construction Program (CCP) at each of the Airports. The approved CCP at Reagan National includes a $1 billion capital construction program including the following projects: (i) a project for the design and construction of a new commuter concourse; (ii) a project consisting of enabling projects associated with the commuter concourse project; (iii) a Terminal B/C Secure National Hall project; (iv) a project consisting of a set of enabling projects associated with the Secure National Hall project; (v) a project consisting of preliminary planning and design work on a facility to expand or replace current Terminal A; and (vi) a project for the design and construction of a new structured parking garage (collectively, the Reagan National CCP ). In addition, the Reagan National CCP will include various airfield, roadway, utility and other projects. The CCP at Dulles International includes a $142.0 million three-year CCP that is expected to include major maintenance to the existing infrastructure of buildings, airfields, roadways, utilities and other projects (the Dulles CCP ). The First Amendment to the Use and Lease Agreement added $446 million of additional capital projects and extended the Dulles CCP through December 31, Per the Use and Lease Agreement, with regards to Dulles International, the Airports Authority may undertake a portion of the Dulles CCP, but will not be required to do so and may fund the projects it elects to undertake through the issuance of debt. The Reagan National CCP and the Dulles CCP together comprise the CCP. An airline that files for bankruptcy has the right to reject its Use and Lease Agreement with the Airports Authority. In the event the Airports Authority does not recover all of its costs pursuant to the Use and Lease Agreement with a bankrupt carrier, the Airports Authority may adjust the rates and charges for all Signatory Airlines in a subsequent rate period to recover the rates and charges due from the bankrupt carrier. As a result, if a Signatory Airline were to reject its lease of space at either Airport, the unrecovered rental costs could be allocated among the remaining airline tenants. If an airline is not a Signatory Airline, it is required to pay rates and charges set by the Airports Authority in accordance with regulations adopted by the Board and United States Department of Transportation requirements. The Use and Lease Agreement excludes Dulles Toll Road revenues to ensure no revenues from the operation of the Airports will be used to support the operation of the Dulles Toll Road or finance Dulles Toll Road improvements or the Dulles Metrorail Project. 64
73 NRR at Reagan National will be shared as shown in the table below: Year in Which NRR is Generated 2014, 2015, through NRR Sharing 100% Airports Authority/ 0% Airlines 55% Airports Authority/ 45% Airlines 55% Airports Authority/ 45% Airlines 45% Airports Authority/ 55% Airlines Maximum Amount of Airports Authority Share Usable at Dulles International in Year Following Year of Generation $40 million $35 million $30 million $25 million NRR allocation between the Airports Authority and the Airlines, as well as any limitation on the use of the Airports Authority s share at Dulles International, to be described in a new airport use and lease agreement, which would be effective in 2025, or, if none, in accordance with the allocation for NRR generated in 2023, as described above. NRR at Dulles International will be shared in the same manner as it had been shared under the previously existing agreement. At Dulles International, NRR will be divided equally between the Airports Authority and the Signatory Airlines up to a plateau of $15.6 million (in 2014 dollars) escalated by the U.S. Implicit Price Deflator Index from the base date of January 1, 2014 to the current year. The remainder will then be split with 25 percent allocated to the Airports Authority and 75 percent allocated to the Signatory Airlines. The Signatory Airlines share of NRR, referred to as Transfers, is used to lower airline rates and charges in the year following the year the NRR is earned. The Airports Authority uses its share of NRR to finance its Capital, Operating and Maintenance Investment Program or for any other lawful purpose. Under the new formula, the Airports Authority will retain an increased level of NRR from Reagan National and have the ability to use revenues generated at Reagan National to pay outstanding debt service costs at Dulles International, up to a maximum of $40 million per year in years 2014, 2015 and Such revenue sharing between Reagan National and Dulles International is allowed under the Use and Lease Agreement. Under the Use and Lease Agreement, the Airports Authority may increase its allocable share of NRR, with regard to Reagan National, in the event any new legislation is enacted which expands the Perimeter Rule by allowing additional flights in excess of the 1,250 mile perimeter. For each new pair of beyond-perimeter flights, the Airports Authority would be entitled to $1.5 million from NRR, before any sharing of NRR occurs with the airlines. For the years ended December 31, 2017 and 2016, the Signatory Airlines Transfer amounts were $145.2 million and $110.4 million, and the Airports Authority s share of NRR was $96.5 million and $135.5 million, respectively. The Use and Lease Agreement also provides for an annual settlement whereby rates and charges are recalculated using audited financial data to determine any airline over- or under-payment for airline-supported cost centers For the years ended December 31, 2017 and 2016, the settlement resulted in net charges to the Signatory Airlines of $8.9 million and net charges to the Signatory Airlines of $8.3 million, respectively. Each year s net charge adjusts the amount of revenue recognized during that year, with either a corresponding receivable due from the Signatory Airlines (refer to Note 5 Accounts Receivable) or advance billings. 65
74 3. THE DULLES TOLL ROAD AND CONSTRUCTION OF THE DULLES METRORAIL PROJECT Dulles Toll Road On November 1, 2008, the Virginia Department of Transportation (VDOT) transferred operational and financial control of the Dulles Toll Road (Omer L. Hirst Adelard L. Brault Expressway) (DTR) to the Airports Authority for a term of 50 years, upon the terms and conditions set forth by the Master Transfer Agreement dated December 29, 2006, and the Permit and Operating Agreement dated December 29, 2006, each entered into by and between VDOT and the Airports Authority. Concurrent with this transfer of rights and responsibility, VDOT contributed to the Airports Authority approximately $272.1 million of capital property, including $254.8 million of construction in progress for the Dulles Metrorail Project. The Airports Authority accounted for the transfer in accordance with GAAP. The Airports Authority took control and responsibility for all the assets associated with the transfer of the DTR and accordingly recorded the capital assets on its Statement of Net Position. In exchange for the rights to the revenues from operation of the Dulles Toll Road and certain other revenues described in the VDOT Agreements, the Airports Authority agreed to (i) operate and maintain the Dulles Toll Road, (ii) cause the design and construction of the extension of the WMATA Metrorail system from a location near the Metrorail Orange Line West Falls Church station on I-66 through Tysons Corner to Dulles International and beyond Route 772 to Loudoun County (the Dulles Metrorail Project) and (iii) make other improvements in the Dulles Corridor consistent with VDOT and regional plans. The Dulles Corridor is defined as the transportation corridor with an eastern terminus of the East Falls Church Metrorail station at I-66 and a western terminus of Route 772 in Loudoun County, Virginia. The Airports Authority is solely responsible for setting toll rates and collecting tolls on the Dulles Toll Road, following its process for issuing regulations and in consultation with the Dulles Corridor Advisory Committee. The Dulles Corridor Advisory Committee is an eight-member committee, composed of two representatives for each of the Airports Authority, Fairfax County, Loudoun County, and the Commonwealth, to provide the Airports Authority with advice on issues related to the management, improvement, and expansion of the Dulles Corridor, as well as changes to the toll rates on the Dulles Toll Road. The Airports Authority may not use any net revenues pledged for payment of the Airport System Revenue Bonds or Notes to support the operation of the Dulles Toll Road or to pay debt service on Dulles Toll Road Revenue Bonds. Likewise, the Airports Authority may not use any revenues pledged for payment of the Dulles Toll Road Revenue Bonds or Notes to support the operation of the Airports or to pay debt service on Airport System Revenue Bonds or Notes. The deficit in Unrestricted Net Assets is expected to be reversed over time through the accumulation of additional reserves resulting from future Dulles Toll Road revenue growth. Future Dulles Toll Road revenue will be used to service the debt following the transfer to WMATA for the construction of the Metrorail extension. Debt service through 2018 is also augmented by a contribution of $150.0 million from the Commonwealth. The Airports Authority augmented its debt service by $20.0 million for the year ended December 31, 2017 and by $30.0 million for the year ended December 31, Dulles Metrorail Project The Airports Authority is funding and constructing the 23.1-mile Dulles Metrorail Project in two phases. Phase 1 of the Dulles Metrorail Project extends 11.7 miles from a location near the Metrorail Orange Line West Falls Church station to Wiehle Avenue in Reston, Virginia. It includes five new stations and improvements to the existing WMATA Service and Inspection Yard at the West Falls Church station. Phase 2 of the Dulles Metrorail Project will extend the Metrorail system an additional 11.4 miles from Wiehle Avenue through Dulles 66
75 International property and west into Loudoun County, Virginia. Phase 2 of the Dulles Metrorail Project is expected to include six new stations and a maintenance yard located on Dulles International property. The Dulles Metrorail Project is being funded with a combination of toll road revenue bonds secured by a pledge of Dulles Toll Road revenues, federal grants, and contributions from local jurisdictions. In addition, approximately 4.1 percent of the costs are expected to be paid from Passenger Facility Charges of the Airports. The current Use and Lease Agreement, as more fully described in Note 2 Airport Use Agreement and Premises Lease, limits to $10.0 million the amount of airport capital costs that can be incurred for construction of the Dulles Metrorail Project at Dulles International, unless otherwise agreed upon. As of December 31, 2017, the Airports Authority has approximately $2.0 billion of Dulles Toll Road revenue bonds payable (refer to Note 13 Capital Debt). Upon completion of construction of each phase of the Dulles Metrorail Project and acceptance by WMATA into the Metrorail system, the Airports Authority will transfer, without financial retribution, ownership of the completed phase of the project to WMATA. At that point, WMATA will become the owner and operator of the completed phase and will be solely responsible for its operation and maintenance. None of the operating and maintenance expenses of the completed phase will constitute operating or maintenance expenses of the Airports Authority. Such expenses will be payable entirely from WMATA s operating and other revenues (including revenues derived from the operation of the Dulles Metrorail Project). The debt associated with construction of each phase of the Dulles Metrorail Project will remain with the Airports Authority and will not be transferred to WMATA. The Airports Authority reports the Construction in progress amounts related to both phases of the Dulles Metrorail Project in its Statement of Net Position. These are disclosed in Note 8 Changes in Capital Assets. Assets transferred to WMATA for Phase 1 and Phase 2 are removed from the Airports Authority s Statement of Net Position and reported in the financial reports of WMATA. Phase 1 of the Dulles Metrorail Project consisting of the 11.7 mile extension and related assets were accepted by WMATA and began operating on July 26, At that time, the assets were transferred to WMATA in their entirety and WMATA obtained ownership and title to these assets. These assets included the rail track, rail stations, buildings, power substations, rail cars, land, easements, right-of-ways etc. WMATA is responsible for all ongoing operating and maintenance costs pertaining to these transferred assets. The transfer of these assets resulted in a reduction of $3.272 billion ($3.142 billion in 2014, $0.087 billion in 2015, $0.035 billion in 2016 and $0.008 billion in 2017) in construction in progress as shown on the Authority s Statement of Net Position and a $3.272 billion non-operating expense (contribution to other governments) on the Authority s Statement of Revenues, Expenses and Changes in Net Position. It is expected the final project closeout for Phase 1 of the Dulles Metrorail Project will occur over the next few years and as part of the project close out, the Authority will transfer these additional costs on an on-going basis. In addition to these costs, costs for Metrorail cars will be included in these subsequent transfers. Phase 2 of the Dulles Metrorail Project consisting of the 11.4 miles extension and related assets is still under construction. The Metrorail cars for Phase 2 are substantially complete and were transferred to WMATA in WMATA obtains all ownership and title to these assets. The transfer of these Metrorail cars resulted in a reduction of $127.0 million in Construction in progress shown on the Authority s Statement of Net Position and a $127.0 million non-operating expense (contribution to governments) on the Authority s Statement of Revenues, Expenses and Changes in Net position. 67
76 4. DEPOSITS AND INVESTMENTS The Airports Authority s investment policy, as approved by the Board, requires deposits in excess of the federally insured amount be held at institutions with a Kroll Bond Rating Agency rating of B or above. In the event a financial institution s rating falls below this level, the deposits are to be reduced to the federally insured amount. The Airports Authority s practice is to sweep all demand deposits at the close of each business day into overnight money market fund investments. As of December 31, 2017 and 2016, the Airports Authority had various certificates of deposit in the amount of $17.8 million and $16.0 million, respectively, of which $12.5 million and $10.5 million, respectively, were not covered by insurance and were not collateralized with securities held by the pledging financial institutions. These certificates of deposit were held at institutions with a Kroll Bond Rating Agency rating of B or above. These certificates of deposit were part of the Airports Authority s Linked Deposit Program, whereby a portion of the reserve funds were deposited with banks that have a Community Reinvestment Act rating of outstanding or the Local Deposit Program established for regional banks with a Community Reinvestment Act rating of satisfactory. Participants in the Local Deposit Program must collateralize any deposit over the Federal Deposit Insurance Corporation (FDIC) limit. The Airports Authority maintains multiple imprest cash funds in certain departments. These amounts are not covered by insurance and are not collateralized. These funds totaled $175.4 thousand and $176.2 thousand as of December 31, 2017 and 2016, respectively. As of December 31, 2017 and 2016, cash and cash equivalents and investments were classified on the Statements of Net Position as follows: Aviation Enterprise As of December 31, 2017 As of December 31, 2016 Dulles Corridor Enterprise Total Business- Type Activities Aviation Enterprise Dulles Corridor Enterprise Total Business- Type Activities Cash and cash equivalents Current, unrestricted $ 8,072,076 $ 247,788,223 $ 255,860,299 $ 35,110,978 $ 234,632,901 $ 269,743,879 Current, restricted 184,513,638 92,843, ,357, ,279, ,274, ,554,845 Non-current, restricted 24,008, ,225, ,233,331 50,238, ,427, ,666,581 Total cash and cash equivalents 216,594, ,857, ,451, ,629, ,335, ,965,305 Investments Current, unrestricted 873,390, ,390, ,024, ,024,471 Current, restricted 305,283, ,366, ,650, ,919, ,534, ,454,146 Non-current, restricted 248,241, ,101, ,343, ,112, ,536, ,648,853 Total investments 1,426,915, ,468,101 1,921,383,613 1,215,056, ,070,733 1,626,127,470 Total cash, cash equivalents, and investments $ 1,643,509,541 $ 1,014,325,180 $ 2,657,834,721 $ 1,450,686,619 $ 959,406,156 $ 2,410,092,775 Cash and cash equivalents and securities as of December 31, 2017 and 2016 were comprised of the following: Aviation Enterprise As of December 31, 2017 As of December 31, 2016 Dulles Corridor Enterprise Total Business- Type Activities Aviation Enterprise Dulles Corridor Enterprise Total Business- Type Activities Cash deposits $ 109,709,253 $ 3,924,636 $ 113,633,889 $ 21,097,638 $ 19,240,636 $ 40,338,274 Money market 127,796, ,623, ,420, ,573, ,250, ,824,206 Securities 1,406,003, ,776,953 1,898,780,434 1,196,015, ,914,953 1,605,930,295 Total cash, cash equivalents, and investments $ 1,643,509,541 $ 1,014,325,180 $ 2,657,834,721 $ 1,450,686,619 $ 959,406,156 $ 2,410,092,775 68
77 Fair Value Measurements In accordance with the provisions of GAAP, investments with an original maturity greater than one year are recorded at their fair value and all investment income, including changes in the fair value of investments, are reported as investment income in the financial statements. Investments with an original maturity greater than one year include debt securities, nonparticipatory guaranteed investment contracts and repurchase agreements. Investments with an original maturity of less than one year are carried at amortized cost. Fair value measurements are categorized within the fair value hierarchy established by generally accepted accounting principles. The hierarchy is based on the valuation inputs used to measure the fair value of the asset. The inputs are categorized into levels with highest priority given to unadjusted quoted prices in active markets (level 1) and the lowest priority to unobservable inputs (level 3): Level 1 Level 2 Level 3 Unadjusted quoted prices for identical instruments in active markets. Quoted prices for similar instruments in active markets; quoted prices for identical or similar assets in markets that are not active; inputs other than quoted prices that are observable. Valuations derived from valuation techniques in which significant inputs are unobservable. In instances where inputs used to measure fair value fall into two different levels in the fair value hierarchy, fair value measurements in their entirety are categorized based on the lowest priority level input that is significant to the valuation. The change in carrying value of total securities during 2017 was $292.9 million. At December 31, 2017 and 2016, the carrying value and the Fair Value Measures Used of the securities was determined through the portfolio tracking system and verified with the Trustee statements. The portfolio tracking system uses an independent company for pricing with a goal of producing fixed income evaluations representing a market based measurement that represents their good faith opinion as to what the holder would receive in an orderly transaction (for an institutional round lot position typically $1 million or greater) under current market conditions. They use a global team of 200 evaluators to create the evaluation each day. Given that, on average, less than 1% of the outstanding U.S. dollar debt trades on any given day, they generally draw parallels from current market activity to generate evaluations for the majority of issues that have not traded. 69
78 Investment Type Carrying Value as of December 31, 2017 Aviation Enterprise Dulles Corridor Enterprise Total Business- Type Activities Quoted Prices in Active Markets for Indentical Assets (Level 1) Fair Value Measures Using Significant Other Observable Inputs (Level 2) Significant Unobservable Inputs (Level 3) Amortized Cost Debt Securities Treasury $ 499,051,397 $ 469,098,602 $ 968,149,999 $ - $ 449,103,073 $ - $ 519,046,926 Fannie Mae 14,988,311-14,988, ,988,311 Freddie Mac 24,976,959-24,976, ,976,959 Farmer Mac 89,727,679-89,727,679-24,943,000-64,784,679 Farm Credit 24,985,111-24,985, ,985,111 Home Loan 560,353,098 23,678, ,031,449-35,913, ,117,919 Commercial Paper 69,854,121-69,854, ,854,121 Nonparticipatory Contracts MBIA GIC 1 33,645,518-33,645, ,645,518 Dexia (FSA) GIC 1 30,215,597-30,215, ,215,597 Repurchase Agreements: BOA Repo 1 6,580,610-6,580, ,580,610 Morgan Stanley Repo 1 51,625,080-51,625, ,625,080 Total securities $ 1,406,003,481 $ 492,776,953 $ 1,898,780,434 $ - $ 509,959,603 $ - $ 1,388,820,831 1 Collateralized by Federal Agency Notes Investment Type Carrying Value as of December 31, 2016 Aviation Enterprise Dulles Corridor Enterprise Total Business- Type Activities Quoted Prices in Active Markets for Indentical Assets (Level 1) Fair Value Measures Using Significant Other Observable Inputs (Level 2) Significant Unobservable Inputs (Level 3) Amortized Cost Debt Securities Treasury $ 271,752,048 $ 294,271,752 $ 566,023,800 $ - $ 416,886,314 $ - $ 149,137,486 Fannie Mae 64,884,802 14,485,185 79,369, ,369,987 Freddie Mac 113,710,520 26,639, ,349,764-22,076, ,273,659 Farmer Mac 238,237,139 19,938, ,175,167-24,934, ,241,167 Farm Credit 62,998,844-62,998,844-24,956,500-38,042,344 Home Loan 209,451,794 54,580, ,032,538-49,984, ,047,635 Commercial Paper 69,927,870-69,927, ,927,870 Nonparticipatory Contracts MBIA GIC 1 33,645,518-33,645, ,645,518 Dexia (FSA) GIC 1 61,698,037-61,698, ,698,037 Repurchase Agreements: BOA Repo 1 16,333,690-16,333, ,333,690 City First Bank Repo 1,750,000-1,750, ,750,000 Morgan Stanley Repo 1 51,625,080-51,625, ,625,080 Total securities $ 1,196,015,342 $ 409,914,953 $ 1,605,930,295 $ - $ 538,837,822 $ - $ 1,067,092,473 1 Collateralized by Federal Agency Notes 70
79 The tables below present the Airports Authority s investments in accordance with GAAP: As of December 31, 2017 Cost Carrying Value Securites with original maturity 1 year and over $ 640,587,687 $ 632,026,408 Securites with original maturity less than 1 year 1,264,751,697 1,266,754,026 $ 1,905,339,384 $ 1,898,780,434 As of December 31, 2016 Cost Carrying Value Securites with original maturity 1 year and over $ 708,830,822 $ 702,140,177 Securites with original maturity less than 1 year 903,585, ,790,118 $ 1,612,416,720 $ 1,605,930,295 Credit Risk Credit Risk is the risk that the Airports Authority will lose money due to the default of the issuer or investment counterparty of the security. The primary objectives of the Airports Authority s investment policy are the safety of capital, the liquidity of the portfolio and the yield of investments. Bond proceeds may be invested in securities as permitted in the bond indentures; otherwise, assets of the Airports Authority may be invested in United States Treasury securities; short-term obligations of the United States Government agencies; short-term obligations of the Commonwealth, the State of Maryland, and the District of Columbia; certificates of deposit with banks that have a Kroll Rating Agency rating of B or better, or that are fully insured or collateralized; prime CP rated A1 and P1 by Standard & Poor s Rating Services (S&P) and Moody s Investors Service Inc. (Moody s), respectively; prime bankers acceptance notes; repurchase agreements whose underlying collateral consists of the foregoing; money market or mutual funds or other such securities or obligations that may be approved by the Finance Committee by modification of the Airports Authority s policy. 71
80 The table below summarizes the investments by type and credit rating as of December 31, 2017: Credit Rating Investment Type Moody's S&P Fitch Treasury Aaa AA+ AAA Fannie Mae Aaa AA+ AAA Freddie Mac Aaa Not Rated AAA Farmer Mac Not Rated Not Rated Not Rated Farm Credit Aaa AA+ AAA Home Loan Aaa AA+ Not Rated MBIA GIC 1 Ba3 Not Rated Not Rated Dexia (FSA) GIC 1 Aa3 AA AA- Commercial Paper P1 A1 F1 Debt Service Reserve Repurchase Agreements: BOA Repo 1 Baa2 A- A- Morgan Stanley Repo 1 A3 BBB+ A 1 Underlying rating of the counterparties Custodial Credit Risk Custodial credit risk is the risk that, in the event of a failure of the counterparty, the Airports Authority would not be able to recover the value of its deposits, investments or collateral securities that were in the possession of an outside party. Deposits are exposed to custodial credit risk if they are uninsured and uncollateralized. Investment securities are exposed to custodial credit risk if they are uninsured or not registered in the name of the Airports Authority and are held by either the counterparty or the counterparty s trust department or agent but not in the Airports Authority s name. The Airports Authority s Investment Policy requires securities be insured or registered investments or securities held by the Airports Authority or its agent in the Airports Authority s name. As of December 31, 2017 and 2016, all the Airports Authority s securities are held by the Airports Authority or its agent in the Airports Authority s name and are fully insured or registered investments. Repurchase agreements and guaranteed investment contracts are required to be collateralized at percent and require the collateral to be Authorized Investments as described in the Investment Policy and the Master Bond Indenture. The fair value of the collateral for the guaranteed investment contracts was $70.1 million on December 31, The fair value of the collateral for the Debt Service Reserve repurchase agreements was $61.4 million as of December 31, All the collateral for these contracts was held by the Airports Authority s agent in the Airports Authority s name. 72
81 Interest Rate Risk The Airports Authority s investment policy as approved by the Board is designed to maximize investment earnings, while protecting the security of the principal and providing adequate liquidity. The overriding policy for investment decisions is to have funds available as needed for construction and general operating expenses. The Airports Authority s Investment Committee meets quarterly and determines the investment horizon for each fund based on current construction or operating needs and the prevailing market conditions. Each investment transaction shall seek to ensure capital losses are avoided, whether they are from securities defaults or erosion of market value. The Airports Authority mitigates interest rate risk by managing the weighted average maturity of each portfolio type to best meet liquidity needs. As of December 31, 2017 and 2016, the Airports Authority had the following investments with the respected weighted average maturity in years: As of December 31, Investment Type Treasury Fannie Mae Freddie Mac Farmer Mac Farm Credit Home Loan Commercial Paper MBIA GIC Dexia (FSA) GIC Debt Service Reserve Repurchase Agreements: BOA Repo City First Bank Repo Morgan Stanley Repo Concentration of Credit Risk The Airports Authority, as previously described, is limited to investments allowed by the bond indentures and the authorized investment policy. However, the policy does not limit the aggregation of investments in any one type of security. There are providers of securities in which the Airports Authority has invested individually more than 5.0 percent of the total portfolio. 73
82 As of December 31, 2017 and 2016, investments accounted for the following percentages of the total portfolio: As of December 31, Investment Type Treasury 51.0% 35.3% Fannie Mae 0.8% 5.0% Freddie Mac 1.3% 8.7% Farmer Mac 4.7% 16.1% Farm Credit 1.3% 3.9% Home Loan 30.8% 16.4% MBIA GIC 1.8% 2.1% Dexia (FSA) GIC 1.6% 3.8% Commercial Paper 3.7% 4.4% Debt Service Reserve Repurchase Agreements: BOA Repo 0.3% 1.0% City First Bank Repo 0.0% 0.1% Morgan Stanley Repo 2.7% 3.2% 100.0% 100.0% 5. ACCOUNTS RECEIVABLE As of December 31, 2017 and 2016, Accounts receivable consisted of the following: As of December 31, Trade accounts receivable $ 23,792,219 $ 31,290,403 Less: allowance for doubtful accounts (1,974,943) (1,637,907) Trade accounts receivable, net 21,817,276 29,652,496 Settlement due from airline tenants 7,269,669 2,582,711 Grants receivable in support of operations 522, ,216 Other receivables 448,979 (314,447) Total current accounts receivable $ 30,058,910 $ 32,059,976 Grants receivable in support of capital programs $ 129,734,472 $ 167,069,709 Passenger facility charge receivables 10,808,470 8,671,216 Other 119, ,277 Total restricted accounts receivable $ 140,662,011 $ 176,295,202 During 2017, there were no bankruptcy filings reported. The total uncollectible amount written off during 2017 was $15,660 out of which $5,500 related to DCA, $10,113 to IAD and $47 related to telecommunications Accounts Receivable judged to be uncollectible and written off in 2016 totaled $109 thousand. 74
83 The Airports Authority judges existing reserves sufficient to cover any potentially uncollectible receivables owed as of December 31, 2017 and December 31, PENSION PLANS AND DEFERRED COMPENSATION PLAN The Airports Authority participates in two United States government pension plans: the Civil Service Retirement System (CSRS) and the Federal Employees Retirement System (FERS). Each is considered a cost-sharing, multiple-employer public employee retirement system. The CSRS was established by the Civil Service Retirement Act and the FERS was established by the Federal Employees Retirement System Act of Employees hired before December 31, 1983 are members of the CSRS unless they elected to transfer to the FERS either before December 31, 1987 or during the special enrollment period from July 1, 1998 through December 31, Effective April 1, 1987, a Thrift Savings Plan was added whereby CSRS and FERS members can contribute a percentage of their salaries on a tax-deferred basis up to the Internal Revenue Service elective deferral limit ($18,000 in 2017 and 2016). In addition to the above described Plans, the Airports Authority maintains single-employer defined benefit pension plans that cover its regular employees and its police and fire (public safety) employees hired on or after June 7, The Airports Authority also offers employees a deferred compensation plan and a money purchase pension plan. Under the CSRS, employees contribute 7.0 percent of their base pay (7.5 percent for public safety employees) and the Airports Authority matches the employees contributions. Retirement benefits are based on length of service and the average of the employee s three highest years of base pay. Employees are eligible to retire at age 55 with 30 years of service; age 60 with 20 years of service; or age 62 with 5 years of service. Public safety employees can retire at age 50 with 20 years of service or any age with 25 years of service. Retirement annuities range from 7.5 percent to a maximum 80.0 percent of the average of the employee s three highest years of base pay depending on an employee s length of service. As of December 31, 2017, there were 10 regular employees enrolled in the CSRS. Under the FERS, employees derive benefits from three different sources: a Basic Benefit Plan (BBP), Social Security, and a Thrift Savings Plan. Employee contributions to the BBP range from 0.8 percent of base pay for regular employees to 1.3 percent for public safety employees. The Airports Authority s contribution ranges from 10.7 percent of base pay for regular employees to 23.3 percent of base pay for public safety employees. Employees are eligible to retire when they have 10 years of service and have reached a minimum retirement age based on date of birth and ranging from 55 to 57 years of age. Retirement annuities range from 1.0 percent (less than 20 years of service) to 1.1 percent (20 or more years of service) of the average of the employee s three highest years of base pay for each year of service. Public safety employees can retire at age 50 with 20 years of service or at any age with 25 years of service. These employees receive retirement benefits equal to 1.7 percent of the average of the employee s three highest years of base pay for every year of service up to 20 years plus 1.0 percent of the same average three-year high for every year of service over 20 years. As of December 31, 2017, there were 20 regular employees and 2 public safety employees enrolled in the FERS. The Airports Authority s base pay for employees covered by the CSRS and the FERS for the year ended December 31, 2017 was $3.1 million. Employee contributions to the federal pension plans for 2017 and 2016 were $83 thousand and $95 thousand, respectively. Employer contributions to the federal pension plans for 2017 and 2016 were $340 thousand and $446 thousand, respectively. These contributions represent 100 percent of required contributions for each of the respective years. The Airports Authority s total base pay for all employees, including employees covered by CSRS and FERS, was $122.4 million and $116.4 million in 2017 and 2016, 75
84 respectively. The pension expense, deferred inflows and outflows for these pension plans are not recognized by the Airports Authority. See Schedule 4 Schedule of Employer Contributions. Plan documents and audited plan financials for the CSRS and FERS plans may be obtained by written request to: U.S. Office of Personnel Management, Retirement Operations Center, P.O. Box 45, Boyers, PA, Airports Authority Pension Plans Effective January 1, 1989, the Airports Authority established a retirement benefits program for employees hired on or after June 7, Employee coverage and service credit was retroactive to June 7, The program includes the Airports Authority s General Employee Retirement Plan (the Regular Plan, covering regular employees) and the Police Officers and Firefighters Retirement Plan (the Police and Firefighter Plan, covering public safety employees) with the exception of employees working less than 20 hours per week and other temporary employees. Collectively, these plans are referred to as the Plans. Both are considered to be singleemployer defined benefit plans. Any amendment to the Plans must be approved by the Airports Authority s Retirement Committee. The Plans provide retirement and death benefits to plan members and beneficiaries. As of December 31, 2017, the number of employees participating in the Plans was: Current Participants Regular Public Safety Total Vested Non-vested Retirees/disabled employees currently receiving benefits Terminated vested participants Total 1, ,412 Regular employees who retire at or after age 60 with five years of credited service are entitled to an annual retirement benefit, payable monthly for life, in an amount equal to 1.2 percent of final-average eligible compensation up to covered compensation and 1.6 percent of final-average base pay above covered compensation for each year of credited service (maximum of 30 years). Eligible compensation includes base pay and shift differential for wage grade employees. Regular employees with at least five years of service can receive benefits starting at age 55 with a 5.0 percent reduction in benefits for each year the participant is younger than age 60. Employees do not contribute to the Regular Plan. Public safety employees who retire at age 55 with five years of service or at any age with 25 years of service are entitled to an annual retirement benefit of 2.0 percent of final-average base pay for service up to 25 years and 1.0 percent of the final-average base pay for service between 25 and 30 years. Public safety employees with at least 25 years of service can receive benefits starting before age 50; however, the benefit is reduced by 5 percent for each year by which benefits begin prior to age 50. Public safety employees are required to contribute 1.5 percent of base pay per year of participation to the Police and Firefighter Plan. This contributed amount is accumulated with a 5.0 percent interest rate and is returned when a benefit is forfeited. The Airports Authority contributes the remaining amounts necessary to fund the Plans using the entry age normal actuarial method in addition to an amount necessary to amortize any unfunded liability. For the Plans, the final-average base pay is the average of the employee s highest consecutive 78 bi-weekly pay periods in the most recent 120 months, while covered compensation is the 35-year average of the Social Security Wage Bases ending with the year in which the participant attains Social Security normal retirement age. A participant s years of benefit service include the number of hours of accrued unused sick leave at a participant s termination provided the maximum amount of benefit service that may be credited to a participant 76
85 is 30 years. A pre-retirement surviving spouse benefit is payable in the event of death, equal to 50.0 percent of the benefit which would have been payable had the employee retired, provided the employee had at least five years of service. Retiree benefits are adjusted annually by the lesser of one-half of the Consumer Price Index or 4.0 percent. Contributions Required and Made The Airports Authority s funding policy is to provide for periodic employer contributions at actuarially determined rates that, expressed as percentages of annual covered payroll, are designed to accumulate sufficient assets to pay benefits when due. Employer contributions are determined in accordance with the plan provisions and are approved by the Airports Authority s Retirement Committee. Level percentages of payroll employer contribution rates are determined using the entry age actuarial cost method. Unfunded actuarial accrued liabilities are being amortized over a period of 20 years on a closed basis. The Airports Authority contributed 6.85 percent of the applicable base payroll to the Regular Plan and percent of the applicable base payroll to the Police and Firefighters Plan in The Airports Authority s base payroll for employees covered by the Regular Plan was $92.9 million and $90.9 million for 2017 and 2016, respectively. The base payroll for employees covered by the Police and Firefighters Plan was $26.4 million and $27.7 million for 2017 and 2016, respectively. The Airports Authority contributed $6.4 million and $4.6 million to the Regular Plan and $2.7 million and $2.2 million to the Police and Firefighters Plan in 2017 and 2016, respectively. Net Pension Liability The components of the net pension liability (NPL) of the Plans as of December 31, 2017 and 2016 were as follows: General Employees Retirement Plan Plan Fiduciary Actuarial Total Pension Plan Fiduciary Net Pension Net Position Valuation Liability (TPL) Net Position Liability (Asset) as a Percentage Date (a) (b) (a-b) of the TPL 12/31/2017 $ 172,160,605 $ 180,953,017 $ (8,792,412) % 12/31/ ,598, ,360, , % Police Officers & Firefighters Retirement Plan Plan Fiduciary Actuarial Total Pension Plan Fiduciary Net Pension Net Position Valuation Liability (TPL) Net Position Liability (Asset) as a Percentage Date (a) (b) (a-b) of the TPL 12/31/2017 $ 109,636,800 $ 108,470,489 $ 1,166, % 12/31/ ,225,777 93,790,974 6,434, % 77
86 The total pension liability (TPL) was determined by an actuarial valuation as of December 31, 2017, using the following actuarial assumptions, applied to all periods included in the measurement: Valuation Date December 31, 2017 Actuarial Cost Method Entry-age actuarial cost method Amortization Method 20-year level dollar, closed Assets Valuation Method 5-year smoothed market Actuarial Assumptions: (a) Investment rate of return 7.50%, net of expenses (b) Projected salary increases Variable rate 3.0% to 6.0% (a) and (b) include inflation at 2.750% (c) Cost of living adjustments 1.375% (d) Mortality Rates For General Employees Plan: RP-2014 Mortality Tables, with generational improvement based upon 75% of projection scale MP-2015 For Police Officers and Firefighters Plan: RP-2014 Blue Collar Mortality Tables, with generational improvement based upon 75% of projection scale MP-2015 Trends in assets in excess of TPL and annual covered payroll are both affected by inflation. Expressing the TPL in excess of assets as a percentage of annual covered payroll approximately adjusts for the effects of inflation and aids analysis of progress made in accumulating sufficient assets to pay benefits when due. Generally, the lower this percentage, the stronger the retirement plans. The comparability of trend information is affected by changes in actuarial assumptions, benefit provisions, actuarial funding methods, accounting policies, the size or composition of the population covered by the Plans, and other changes. Those changes usually affect trends in contribution requirements and in ratios that use the TPL as a factor. The Fiduciary Net Position is determined on the same basis of accounting as for benefits, payments, and valuation of investments. All assets of the Airports Authority pension plans are held in trust at the Bank of New York Mellon. A copy of the Plans audited financial statements, Plan documents, and required supplementary information for the Plans may be obtained by written request to:, Attention: Benefits Department, 1 Aviation Circle, Washington, DC
87 Changes in the Net Pension Liability Total Pension Plan Fiduciary Net Pension Liability Net Position Liability/(Asset) General Employees Retirement Plan (a) (b) (a) - (b) Balances as of December 31, 2016 $ 155,598,670 $ 155,360,766 $ 237,904 Changes for the year: Service cost 5,548,643-5,548,643 Interest 11,883,159-11,883,159 Differences between expected and actual experience 4,571,544-4,571,544 Changes of assumptions 68,595-68,595 Contribution - employer - 6,365,276 (6,365,276) Contribution - member Net investment income - 24,963,769 (24,963,769) Benefit payments (5,510,006) (5,510,006) - Plan administrative expenses - (226,788) 226,788 Net changes 16,561,935 25,592,251 (9,030,316) Balances as of December 31, 2017 $ 172,160,605 $ 180,953,017 $ (8,792,412) Total Pension Plan Fiduciary Net Pension Liability Net Position Liability/(Asset) General Employees Retirement Plan (a) (b) (a) - (b) Balances as of December 31, 2015 $ 148,423,232 $ 143,868,107 $ 4,555,125 Changes for the year: Service cost 5,294,135-5,294,135 Interest 11,357,903-11,357,903 Differences between expected and actual experience 1,128,023-1,128,023 Changes of assumptions (5,963,403) - (5,963,403) Contribution - employer - 4,553,940 (4,553,940) Contribution - member Net investment income - 11,755,443 (11,755,443) Benefit payments (4,641,220) (4,641,220) - Plan administrative expenses - (175,504) 175,504 Net changes 7,175,438 11,492,659 (4,317,221) Balances as of December 31, 2016 $ 155,598,670 $ 155,360,766 $ 237,904 79
88 Total Pension Plan Fiduciary Net Pension Liability Net Position Liability/(Asset) Police Officers and Firefighters Retirement Plan (a) (b) (a) - (b) Balances as of December 31, 2016 $ 100,225,777 $ 93,790,974 $ 6,434,803 Changes for the year: Service cost 3,261,511-3,261,511 Interest 7,633,684-7,633,684 Differences between expected and actual experience 1,988,277-1,988,277 Changes of assumptions Contribution - employer - 2,680,653 (2,680,653) Contribution - member - 395,786 (395,786) Net investment income - 15,201,677 (15,201,677) Benefit payments (3,472,449) (3,472,449) - Plan administrative expenses - (126,152) 126,152 Net changes 9,411,023 14,679,515 (5,268,492) Balances as of December 31, 2017 $ 109,636,800 $ 108,470,489 $ 1,166,311 Total Pension Plan Fiduciary Net Pension Liability Net Position Liability/(Asset) Police Officers and Firefighters Retirement Plan (a) (b) (a) - (b) Balances as of December 31, 2015 $ 88,974,180 $ 86,733,070 $ 2,241,110 Changes for the year: Service cost 2,342,298-2,342,298 Interest 6,742,144-6,742,144 Differences between expected and actual experience 2,606,881-2,606,881 Changes of assumptions 2,455,053-2,455,053 Contribution - employer - 2,174,817 (2,174,817) Contribution - member - 381,736 (381,736) Net investment income - 7,478,417 (7,478,417) Benefit payments (2,894,779) (2,894,779) - Plan administrative expenses - (82,287) 82,287 Net changes 11,251,597 7,057,904 4,193,693 Balances as of December 31, 2016 $ 100,225,777 $ 93,790,974 $ 6,434,803 The long-term expected rate of return on the pension plans is 7.5 percent. The long-term expected rate of return was determined using best-estimate ranges of expected future real rates of return (expected returns, net of pension plan investment expense and inflation), developed for each major asset class. These ranges are combined to produce the long-term expected rate of return by weighting the expected future real rates of return by the target asset allocation percentage and by adding expected inflation. 80
89 Best estimates of arithmetic real rates of return for each major asset class included in the pension plan s target asset allocation as of December 31, 2017 is summarized in the following table: For year ended December 31, 2017 Allocation Asset Class Target Long-Term Expected Real Rate of Return* Domestic Equity 40% 7.5% International Equity 20% 8.5% Domestic Bonds 20% 2.5% Convertible Bonds 10% 4.5% Real Estate 10% 4.5% Total 100% * The long-term expected rates of return listed are expected arithmetic average returns over the foreseeable future based on reasonable return expectations but cannot be guaranteed. These returns exclude inflation. The long-term annual inflation assumption used is currently 2.5%. The annual money-weighted rates of return, net of investment expenses, for the year ended December 31, 2017, were 16.38% for the Retirement Plan for General Employees and 16.58% for the Retirement Plan for Police Officers and Firefighters. Discount Rate The discount rate used to measure the NPL was 7.5 percent. The projection of cash flows used to determine the discount rate assumed contributions from plan participants will be made at the current contribution rate and contributions from the Airports Authority will be made at required rates, actuarially determined. Based on these assumptions, the pension plans fiduciary net position was projected to be available to make all projected future benefit payments to current participants. Therefore, long-term expected rate of return on pension plan investments was applied to all periods of projected benefit payments to determine the total pension liability. Changes in the discount rate affect the measurement of the NPL. Lower discount rates produce a higher NPL and higher discount rates produce a lower NPL. Because the discount rate does not affect the measurement of assets, the percentage change in the net pension liability can be very significant for a relatively small change in the discount rate. The table below shows the sensitivity of the net pension liability (asset) to the discount rate. For the year ended December 31, % Decrease Discount Rate 1% Increase 6.50% 7.50% 8.50% Net pension liability (asset) General Employees Retirement Plan $ 12,647,548 $ (8,792,412) $ (26,855,488) Police Officers & Firefighters Retirement Plan 15,895,233 1,166,311 (11,032,943) 81
90 The net pension asset (NPA), NPL and related deferred outflows and inflows were allocated between the Aviation Enterprise and the Dulles Corridor Enterprise based on the allocated wages and benefits per the cost allocation model. In 2017, the General Employees Retirement Plan reported the NPA and the Police Officers and Firefighters Retirement Plan had the NPL, which were separately allocated to the Aviation Enterprise and the Dulles Corridor Enterprise. Pension Deferred Outflows of Resources and Deferred Inflows of Resources For the year ended December 31, 2017, the Airports Authority recognized pension expenses of $5.6 million and $3.8 million respectively for the Regular Plan and Police and Firefighter Plan. At December 31, 2017, the Airports Authority reported deferred outflows of resources and deferred inflows of resources related to pensions from the following sources and will be recognized in future pension expenses as follows: For the year ended December 31, 2017 General Employees Retirement Plan Deferred Outflows of Resources Deferred Inflows of Resources Differences between expected and actual experience $ 4,844,777 $ - Changes in assumptions 3,266,419 4,474,605 Differences between projected and actual earnings on pension plan investments 3,453,818 11,215,864 Total $ 11,565,014 $ 15,690,469 Amount reported as deferred outflows and deferred inflows of resources related to pensions will be recognized in future pension expenses as follows: Deferred Outflows/(Inflows) of Year ended December 31, Resources 2018 $ (423,915) 2019 (423,913) 2020 (2,150,825) 2021 (1,955,821) ,038 Thereafter 535,981 For the year ended December 31, 2017 Police Officers & Firefighters Retirement Plan Deferred Outflows of Resources Deferred Inflows of Resources Differences between expected and actual experience $ 5,149,819 $ - Changes in assumptions 1,919,239 58,427 Differences between projected and actual earnings on pension plan investments 2,157,222 7,142,618 Total $ 9,226,280 $ 7,201,045 82
91 Amount reported as deferred outflows and deferred inflows of resources related to pensions will be recognized in future pension expenses as follows: Deferred Outflows/(Inflows) of Year ended December 31, Resources 2018 $ 229, , (848,806) 2021 (651,026) ,293 Thereafter 2,079,166 The Fiduciary Net Position is determined on the same basis of accounting as for benefits, payments, and valuation of investments. Deferred Compensation Plan The Airports Authority offers its employees a deferred compensation plan created in accordance with Internal Revenue Code Section 457. The plan, effective as of July 2, 1989, is available to all career and non-career term employees and permits the deferral of a portion of regular compensation until future years. Participation in the plan is optional. Until December 31, 2013, the Airports Authority matched 100 percent of participant contributions for career employees up to the first 2 percent of regular compensation and matched an additional 50 percent of participant contributions between 2 percent and 4 percent of regular compensation. As of January 1, 2014, the Airports Authority s matching contributions are made to the Governmental Profit Sharing Plan. The deferred compensation is not available to employees until termination, retirement, death, or unforeseeable emergency. The assets of the plan are held in custodial and annuity accounts for the exclusive benefit of plan participants, and accordingly, the related assets of the plan are not reflected on the Airports Authority s Statement of Net Position. The trust agent for the plan is the Lincoln Financial Group. Investments are managed for participants by the Lincoln Financial Group through one of several investment options or a combination thereof. The choice of the investment option(s) is made by each participant. Amounts contributed by participants to the deferred compensation plan, along with the Airports Authority s matching contribution, totaled $11.6 million and $9.4 million in the years ended December 31, 2017 and 2016, respectively. Governmental Profit Sharing Plan The Airports Authority established a new supplemental defined contribution retirement plan under Section 401(a) of the Internal Revenue Code (the Supplemental Savings Plan ) effective May 15, The Airports Authority s matching contributions, the contributions it makes to match, fully or partially, the contributions career employees elect to make under the Retirement Savings Plan, are made under the new Supplemental Savings Plan as of January 1, For eligible employees, the Airports Authority matches 100 percent of participant contributions up to the first 2 percent of regular compensation and matches an additional 50 percent of participant contributions between 2 percent and 4 percent of regular compensation. The Airports Authority contributed $3.1 million and $2.9 million in the years ended December 31, 2017 and 2016, respectively. 83
92 7. POST-EMPLOYMENT BENEFITS The Airports Authority provides post-employment group healthcare, dental, and life insurance benefits for its retired employees. The Airports Authority Retired Employees Healthcare Plan (the Healthcare Plan) is a singleemployer defined benefit healthcare, dental, and life insurance plan and is administered by the Airports Authority. The Healthcare Plan provides medical, dental, and life insurance benefits to eligible retirees and their dependents (the Participants). Participants hired prior to January 1, 2016 are eligible for the Healthcare Plan if they have attained 5 years of eligible service. All other Participants are eligible for the Healthcare Plan if they have attained 10 years of eligible service. As of December 31, 2017, 657 Participants were receiving health insurance benefits, and 632 Participants were receiving life insurance benefits under the Healthcare Plan. As of December 31, 2016, 616 Participants were receiving health insurance benefits, and 595 Participants were receiving life insurance benefits under the Healthcare Plan. The management of the Airports Authority can establish and amend benefit provisions of the Healthcare Plan. The Airports Authority created and began funding an Employee Welfare Benefits Trust (the Trust) in February 2005 in order to provide a funding mechanism for its other post-employment benefit obligations. There are no separate stand-alone financial reports for the Healthcare Plan. A copy of the plan documents may be obtained by written request to:, Attention: Benefits Department, 1 Aviation Circle, Washington, DC Contributions Required and Made The contribution requirements of the Healthcare Plan s Participants and the Airports Authority for health and dental insurance are established and may be amended by the management of the Airports Authority. The contribution requirements are based upon projected pay-as-you-go financing requirements and funding for future benefits. The Airports Authority pays 80 percent of the health premium costs and 45 percent of the dental premiums costs, with the retirees paying the remaining premium costs. For the years ended December 31, 2017 and 2016, the Airports Authority s share of health and dental insurance premium costs totaled $6.5 million and $4.4 million, respectively. Plan participants contributed $1.9 million and $1.8 million of the total premiums for the years ended December 31, 2017 and 2016, respectively. The monthly contribution requirements for participants in the Healthcare Plan depend on several factors including provider choices, participant age, and type of benefit coverage. 84
93 Monthly Contributions for Retirees Under 65 for 2017 Retiree Plus Retiree Plus Provider Choices Retiree Only Spouse Child(ren) Family United - Choice $ 147 $ 307 $ 278 $ 437 United - Choice Plus Kaiser Permanente HMO MetLife Dental Monthly Contributions for Retirees Over 65 for 2017 One > Age 65 Two Party Family Provider Choices Retiree Only One < Age 65 Medicare Medicare United Healthcare Choice $ 130 $ 290 $ 272 $ 350 United Healthcare Choice Plus Kaiser HMO MetLife Dental Monthly Contributions for Retirees Under 65 for 2016 Retiree Plus Retiree Plus Provider Choices Retiree Only Spouse Child(ren) Family United - Choice $ 147 $ 307 $ 278 $ 437 United - Choice Plus Kaiser Permanente HMO MetLife Dental Monthly Contributions for Retirees Over 65 for 2016 One > Age 65 Two Party Family Provider Choices Retiree Only One < Age 65 Medicare Medicare United Healthcare Choice $ 130 $ 290 $ 272 $ 350 United Healthcare Choice Plus Kaiser HMO MetLife Dental The Airports Authority offers two life insurance options to its Participants. Under Option 1, the Airports Authority pays 100 percent of the Participant s basic and supplemental life insurance cost. Basic life insurance cost is reduced to 25 percent of the Participant s life insurance in force at the time of retirement. Supplemental life insurance is a multiple of the basic life insurance (1 to 5 times) the Participant had selected prior to retirement. Supplemental life insurance is reduced at a rate of 2 percent each month so that at the end of 50 months, no supplemental life insurance coverage remains in force. Option 2 is available to Participants who retire from the Airports Authority on or after May 1, Under Option 2, the Airports Authority pays 100 percent of the Participant s basic life insurance cost. Basic life insurance cost is 85
94 reduced to 25 percent of the Participant s life insurance in force at the time of retirement. Participants pay 100 percent of the cost of supplemental life insurance. The amount of supplemental life insurance in force remains equal to the amount the Participant had at the time of retirement but is reduced by 50 percent at age 70 and another 50 percent at age 75. As of December 31, 2017, 106 out of 632 retired employees had supplemental coverage, and the cost of life insurance totaled $531 thousand. As of December 31, 2016, 110 out of 595 retired employees had supplemental coverage, and the cost of life insurance for retired employees totaled $495 thousand. Actuarial Methods and Assumptions Projections of benefits for financial reporting purposes are based on the substantive plan (the Plan as understood by the employer and the Plan members) and include the types of benefits provided at the time of each valuation as well as the historical pattern of sharing the benefit costs between the employer and plan members to that point. The actual methods and assumptions used include techniques that are designed to reduce the effects of short-term volatility in actuarial accrued liabilities (AAL), consistent with the long-term perspectives of the calculations. The actuarial value of future assets will be determined using fair market values. Actuarial valuations of an ongoing plan involve estimates of the value of reported amounts and assumptions about the probability of occurrence of events far into the future, including but not limited to future employment, mortality, and healthcare cost trends. Actuarially determined amounts are subject to continual revision as actual results are compared with past expectations and new estimates are made about the future. The schedule of funding progress presents multi-year trend information about whether the actuarial value of the plan assets is increasing or decreasing over time relative to the AAL for benefits. Significant actuarial assumptions used in determining the AAL are as follows: Valuation Date December 31, 2017 Actuarial Cost Method Entry-age, normal Amortization Method 30-year level dollar, closed Assets Valuation Method 5-year smooth market Actuarial Assumptions: (a) Investment rate of return 7.50%, net of expenses (b) Projected salary increases Variable rate 3.0% to 6.0% (a) and (b) include inflation at 2.75% (c) Cost of living adjustments 1.375% (d) Mortality Rates For General Employees Plan: RP-2014 Mortality Tables, with generational improvement based upon 75% of projection scale MP-2015 For Police Officers and Firefighters Plan: RP-2014 Blue Collar Mortality Tables, with generational improvement based upon 75% of projection scale MP-2015 (e) Healthcare Cost Trend Rate 5.9% initially to ultimate rate of 3.9% 86
95 Other Post-employment Benefit (OPEB) Costs and Obligations The annual non-pension post-employment benefit cost is actuarially determined as is the calculation of the annual required contribution (ARC). The ARC represents the actuarially determined level of funding that, if paid on an ongoing basis, is projected to cover annual benefit costs and the 30-year open amortization of the difference between the AAL and amounts previously recognized. The following reflects the components of the 2016 annual OPEB costs, amounts paid, and changes to the net accrued OPEB obligation based on the January 1, 2017 actuarial valuation: Year ended December 31, Medical/Dental Annual required contribution $ 4,680,000 $ 5,240,000 $- $ 5,090,000 Interest on net OPEB obligation (asset) 120, , ,000 Adjustment to annual required contribution (120,000) (140,000) (140,000) Annual OPEB cost 4,680,000 5,240,000 5,090,000 Contributions made 6,741,693 5,332,232 5,380,841 Change in net OPEB obligation (asset) (2,061,693) (92,232) (290,841) Net OPEB obligation beginning of year 1,487,371 1,579,603 1,870,444 Net OPEB obligation (asset) end of year $ (574,322) $ 1,487,371 $ 1,579,603 Year ended December 31, Life Insurance Annual required contribution $ 567,000 $ 769,900 $ 754,600 Interest on net OPEB obligation (asset) 4,600 4,600 4,600 Adjustment to annual required contribution (4,800) (4,800) (4,800) Annual OPEB cost 566, , ,400 Contributions made 515, , ,400 Change in net OPEB obligation (asset) 51, Net OPEB obligation beginning of year 61,195 61,195 61,195 Net OPEB obligation (asset) end of year $ 112,430 $ 61,195 $ 61,195 The net OPEB obligation liabilities are reported as non-current liabilities as of December 31, 2017 and 2016 in the Statements of Net Position. 87
96 The Airport Authority s annual OPEB cost, the percentage of annual OPEB cost contributed to the plan, and the net OPEB obligation for the year ended December 31, 2017 and the two preceding years, were as follows: Three-Year Trend Information - Medical Insurance Year Percentage of Ended Annual OPEB Annual OPEB Net OPEB December 31, Cost Cost Contributed Obligation (Asset) 2015 $ 5,090, % $ 1,579, ,240, % 1,487, ,680, % (574,322) Three-Year Trend Information - Life Insurance Year Percentage of Ended Annual OPEB Annual OPEB Net OPEB December 31, Cost Cost Contributed Obligation (Asset) 2015 $ 754, % $ 61, , % 61, , % 112,430 Funding Status and Funding Progress The Airports Authority began funding the Plan in 2005, and in addition to funding insurance costs for Participants, contributed $257 thousand for the year ended December 31, 2017 to the Trust for medical and dental insurance. The Airports Authority also contributed $26 thousand to the Trust for life insurance. Schedule of Funding Progress - Medical Insurance Actuarial UAAL as a Actuarial Actuarial Accrued Unfunded Annual Percentage Valuation Value Liability (AAL) AAL Funded Covered of Covered Date of Assets - Entry Age (UAAL) Ratio Payroll Payroll 1/1/2017 $100,172,093 $112,929,339 $12,757, % $116,927, % Schedule of Funding Progress - Life Insurance Actuarial UAAL as a Actuarial Actuarial Accrued Unfunded Annual Percentage Valuation Value Liability (AAL) AAL Funded Covered of Covered Date of Assets - Entry Age (UAAL) Ratio Payroll Payroll 1/1/2017 $9,765,157 $12,233,600 $2,468, % $116,927, % 88
97 8. CHANGES IN CAPITAL ASSETS Capital asset activity for the years ended December 31, 2017 and 2016 was as follows: Balance as of Transfers and Transfers and Balance as of January 1, 2017 Additions Retirements December 31, 2017 Capital assets not being depreciated: Land and other non-depreciable assets $ 182,738,053 $ - $ (437,363) $ 182,300,690 Construction in progress - Aviation Enterprise 181,352, ,394,285 (75,429,594) 256,316,979 Construction in progress - Dulles Corridor Enterprise 1,167,772, ,913,486 (142,298,726) 1,635,387,549 Total capital assets not being depreciated 1,531,863, ,307,771 (218,165,683) 2,074,005,218 Other capital assets: Buildings 2,568,701,743 12,920,297 (35,201,157) 2,546,420,883 Systems and structures 4,659,237,473 46,282,688 (291,240) 4,705,228,921 Equipment 133,930,174 8,821,606 (1,183,644) 141,568,136 Motor vehicles 77,960,577 2,200,696 (2,990,521) 77,170,752 Total other capital assets 7,439,829,967 70,225,287 (39,666,562) 7,470,388,692 Less accumulated depreciation: Buildings 1,165,713,556 62,947,743 (23,579,696) 1,205,081,603 Systems and structures 1,951,249, ,153,040 (2,459) 2,109,400,104 Equipment 114,001,955 4,476,883 (1,182,518) 117,296,320 Motor vehicles 50,365,822 4,982,176 (2,957,313) 52,390,685 Total accumulated depreciation 3,281,330, ,559,842 (27,721,986) 3,484,168,712 Totals $ 5,690,362,241 $ 599,973,216 $ (230,110,259) $ 6,060,225,198 Balance as of Transfers and Transfers and Balance as of January 1, 2016 Additions Retirements December 31, 2016 Capital assets not being depreciated: Land and other non-depreciable assets $ 182,737,681 $ 372 $ - $ 182,738,053 Construction in progress - Aviation Enterprise 162,943,105 79,796,185 (61,387,002) 181,352,288 Construction in progress - Dulles Corridor Enterprise 731,632, ,075,457 (57,934,828) 1,167,772,789 Total capital assets not being depreciated 1,077,312, ,872,014 (119,321,830) 1,531,863,130 Other capital assets: Buildings 2,550,742,779 18,096,874 (137,910) 2,568,701,743 Systems and structures 4,606,588,519 52,663,648 (14,694) 4,659,237,473 Equipment 131,711,993 3,113,004 (894,823) 133,930,174 Motor vehicles 77,352,167 4,633,700 (4,025,290) 77,960,577 Total other capital assets 7,366,395,458 78,507,226 (5,072,717) 7,439,829,967 Less accumulated depreciation: Buildings 1,101,992,848 63,734,814 (14,106) 1,165,713,556 Systems and structures 1,785,272, ,985,000 (7,714) 1,951,249,523 Equipment 109,967,158 4,829,140 (794,343) 114,001,955 Motor vehicles 49,534,368 4,797,149 (3,965,695) 50,365,822 Total accumulated depreciation 3,046,766, ,346,103 (4,781,858) 3,281,330,856 Totals $ 5,396,941,793 $ 413,033,137 $ (119,612,689) $ 5,690,362,241 89
98 Depreciation expense was incurred by the Business-Type Activities of the Airports Authority during the fiscal years as follows: Aviation Enterprise Fund $ 223,865,294 $ 233,845,074 Dulles Corridor Enterprise Fund 6,694,548 5,501,029 Total Depreciation Expense 230,559, ,346,103 Amortization of Bond Insurance Costs 1,652,805 1,792,180 Total Depreciation and Amortization $ 232,212,647 $ 241,138,283 The Airports Authority completed multiple capital asset construction and development projects during the years ended December 31, 2017 and Within the Aviation Enterprise Fund, at Reagan National, projects completed in 2017 included the Corporate Office Building Relocation and the Public Wi-Fi Cellular service. Within the Aviation Enterprise Fund, at Reagan National, projects completed in 2016 included Digital Signage system in Terminal B/C, lobby and elevator upgrade in Terminal A, and security screening checkpoint expansion in Terminal A. At Dulles International, projects completed in 2017 included the Airfield Pavement Panel Replacement and new police training facility. At Dulles International, projects completed in 2016 included West Automated People Mover tunnels and stations, Taxilane B reconstruction and widening east station and a police range. As of December 31, 2017, ongoing projects at Reagan National included continued Secure National Hall and New North Concourse preconstruction and Taxiway and Taxilane Resurfacing Program. Ongoing projects for Dulles International include the JP Morgan Chase Office Building Renovation and the Airfield Pavement Panel replacements. As of December 31, 2017, the Aviation Enterprise Fund s commitments with contractors for capital asset construction and development projects were $ million. Within the Dulles Corridor Enterprise Fund, projects completed in 2017 included Main Plaza Revenue Collection Tunnel and additional work completed for Chathams Ford Noise Wall, Mclean Hamlet Noise Wall and Odricks Corner New Wall. Within the Dulles Corridor Enterprise Fund, projects completed in 2016 included Chathams Ford Noise Wall, Mclean Hamlet Noise Wall and Odricks Corner New Wall. In addition, the Airports Authority is funding and constructing the 23.1-mile Dulles Metrorail Project in two phases. The Airports Authority completed construction of Phase 1 of the Dulles Metrorail Project which extended 11.7 miles from a location near the Metrorail Orange Line West Falls Church Station to Wiehle Avenue in Reston, Virginia. It included five new stations and improvements to the existing WMATA Service and Inspection Yard at the West Falls Church Station. In 2017, additional costs of $7.5 million dollars were incurred and transferred to WMATA as additional costs to Phase 1. Phase 2 of the Dulles Metrorail Project will extend the Metrorail system an additional 11.4 miles from Wiehle Avenue through Dulles International and west into Loudoun County, Virginia. Phase 2 of the Dulles Metrorail Project is expected to include six new stations and a maintenance yard located on Dulles International property. As of December 31, 2017, ongoing projects included Phase 2 of the Dulles Metrorail Project and the toll road revenue collection system. As of December 31, 2017, the Dulles Corridor Enterprise Fund s commitments with contractors for capital asset construction and development projects were $644.8 million. Services for the above commitment amounts had not been provided as of December 31, 2017, and accordingly, no liability has been recorded in the accompanying financial statements. Construction projects are financed by revenue bonds secured by aviation and toll road revenues, commercial paper, passenger facility charges, and grants and contributions from Federal, state and local governments. 90
99 Interest included as part of the capitalized value of the assets constructed during the years ended December 31, 2017 and 2016 were as follows: As of December 31, Interest costs incurred $ 333,584,824 $ 336,342,684 Less: interest costs capitalized 39,279,814 17,616,196 Interest costs expensed $ 294,305,010 $ 318,726, Investment income earned $ 31,333,895 $ 19,873,978 Less: interest income capitalized 234,709 31,844 Investment income recognized $ 31,099,186 $ 19,842, ACCOUNTS PAYABLE A detail of accounts payable and accrued expenses as of December 31, 2017 and 2016 was as follows: As of December 31, Trade accounts payable and accruals $169,038,069 $159,944,463 Accrued compensation and benefits 12,474,766 11,919,281 Current portion of claims 2,580,517 2,557,995 Security deposits 1,837, ,942 Total accounts payable and accrued expenses $ 185,930,772 $ 175,383, LEASE COMMITMENTS Property Held for Lease The Airports Authority has entered into various operating leases with tenants for the use of space at the Airports Authority s facilities, including buildings, terminals, and airfield areas. Leases with minimum annual guarantee provisions provide for minimum lease amounts as well as contingent fees based on the tenants volume of business at the Airports. These leases have various lease terms, may include provisions for annual increases in the minimum annual guarantee amounts, and may be reviewed periodically to ensure compliance with payments of the contingent fees and other terms of the leases. Most concession leases at the Airports have minimum annual guarantee provisions. The Use and Lease Agreement (refer to Note 2 Airport Use Agreement and Premises Lease) provides for terminal and other facility and space rentals by the airlines at the Airports. Airlines that have signed the Use and Lease Agreement are responsible for full cost recovery plus debt service coverage for these facilities until the termination date of the Use and Lease Agreement. 91
100 The Airports Authority has also entered into various fixed rate lease agreements with tenants for facilities and space at the Airports. These leases have various lease terms and usually include provisions for annual rent increases. Minimum future rentals scheduled to be received on operating leases that have initial or remaining noncancelable terms in excess of one year, as calculated in 2017 dollars, are: Year ending December 31, 2017 Minimum Annual Guaranteed Leases Airline Terminal Leases Fixed Rate Leases Total 2018 $137,541, ,003 $27,403, ,194, ,079, ,769 18,705, ,051, ,235, ,882 18,717, ,213, ,060, ,420 16,355, ,707, ,624, ,975 8,344,708 58,271, and thereafter 103,697,603-72,849, ,547,272 Total minimum future rentals $ 601,239,542 $ 1,371,049 $ 162,375,340 $ 764,985,931 The above amounts do not include contingent rentals and fees in excess of minimums, which amounted to $42.6 million and $50.0 million for the years ended December 31, 2017 and 2016 respectively. Total income from leases, including minimum annual guarantees and contingent rentals and fees, totaled $482.4 million and $490.6 million for the years ended December 31, 2017 and 2016 respectively. Property Leased from Others The Airports Authority has an 80 year lease (the Federal Lease), with negotiable extensions, with the United States Government for the Airports. This lease is due to expire on June 6, The lease requires an annual inflation-adjusted base amount and interest earned on funds reserved monthly in a lease payment reserve account to be paid on a semi-annual basis. The Airports Authority invests the monthly lease payments per the Airports Authority s Investment Policy. The Airports Authority has entered into non-cancellable office space leases in Herndon, and Crystal City, Virginia. The Herndon location s total rentable space of 58,763 square feet includes additional rentable space of 6,378 square feet entered into during The Crystal City location s total rentable space is 74,248 square feet. The Crystal City lease commenced on March 23, 2017 and includes parking and rent which is abated for the initial 12 months. Beginning April 2017, the lease expense is amortized on a monthly basis. Minimum future rentals scheduled to be paid on the operating leases in effect on December 31, 2017, as calculated in 2017 dollars, are as follows: Year ending December 31, Federal Lease Office Space Lease Total 2018 $ 5,570,744 $ 4,047,429 $ 9,618, ,570,744 3,486,226 9,056, ,570,744 3,133,277 8,704, ,570,744 3,207,282 8,778, ,570,744 3,283,138 8,853, and thereafter 242,659,756 18,549, ,209,702 Total minimum future rentals $ 270,513,476 $ 35,707,298 $ 306,220,774 92
101 Total rental expense paid to the United States Government for the years ended December 31, 2017 and 2016 was $5.6 million and $5.5 million, respectively. The 2017 and 2016 capitalized expenditures related to the office space lease totaled $1.8 million and $1.6 million, respectively. 11. CHANGES IN LONG-TERM NON-DEBT LIABILITIES Activity for non-current liabilities, other than for capital debt, for the years ended December 31, 2017 and 2016 was as follows: Beginning Balance Additions Reductions Ending Balance Due Within One Year Due After One Year Compensated absences $ 9,621,100 $ 10,727,026 $ 9,933,735 $ 10,414,391 $ 8,579,344 $ 1,835,047 Claims¹ 6,371,480 2,490,822 2,904,485 5,957,817 2,580,517 3,377,300 Arbitrage 1,779, , , ,225 Net OPEB obligation² 1,548,566-1,436, , ,430 Deferred rent revenue 787,080 2,165,472-2,952,552-2,952,552 Deferred grant revenue 230,000,000-15,000, ,000, ,000,000 $ 250,107,390 $ 15,383,320 $ 30,138,295 $ 235,352,415 $ 11,159,861 $ 224,192,554 1 See Note 18 Risk Management 2 See Note 7 Post-Employment Benefits Activity during year ended December 31, 2017 As of December 31, 2017 Activity during year ended December 31, 2016 As of December 31, 2016 Beginning Balance Additions Reductions Ending Balance Due Within One Year Due After One Year Compensated absences $ 9,293,017 $ 10,226,477 $ 9,898,394 $ 9,621,100 $ 8,219,107 $ 1,401,993 Claims¹ 4,731,103 4,282,571 2,642,194 6,371,480 2,557,995 3,813,485 Arbitrage 192,604 1,586,560-1,779,164-1,779,164 Net OPEB obligation² 1,637,483-88,917 1,548,566-1,548,566 Deferred rent revenue 787, , ,080 Deferred grant revenue 150,000, ,000,000 20,000, ,000, ,000,000 $ 166,641,287 $ 116,095,608 $ 32,629,505 $ 250,107,390 $ 10,777,102 $ 239,330,288 1 See Note 18 Risk Management 2 See Note 7 Post-Employment Benefits 12. ACCOUNTING AND FINANCIAL REPORTING FOR DERIVATIVES In 2001, the Airports Authority began a risk management program to assist in managing the interest cost on outstanding and future debt. The Airports Authority has entered into a number of interest rate swap agreements (collectively, the Swap Agreements) to hedge against potential future increases in interest rates. All of the Airports Authority s Swap Agreements were entered into in connection with the planned issuance of Aviation Enterprise Fund variable rate debt and represent floating-to-fixed rate agreements. The Swap Agreements were written on a forward-starting basis to either hedge future new money Bonds or to synthetically advance refund Bonds that could not be advance refunded on a conventional basis because of their tax status. Based on the Swap Agreements, the Airports Authority owes interest calculated at a notional amount multiplied by a fixed rate to the counterparties. In return, the counterparties owe the Airports Authority interest, based on the notional amount multiplied by a variable rate equal to 72 percent of the 1-month London Inter Bank Offered Rate (LIBOR). The variable rate received from the counterparties is intended to closely correlate to the interest rate the Airports Authority pays on the underlying variable rate debt. Only the net difference in interest payments is actually exchanged with the counterparties, while the Airports Authority continues to pay interest to 93
102 the bondholders at the variable rate provided by the bonds associated with the Swap. During the term of the Swap Agreement, the Airports Authority pays or receives the difference between the fixed rate on the Swaps and 72 percent of the 1-month LIBOR. The chart below provides summary information with respect to the Airports Authority s Swap Agreements: Outstanding Termination Trade Effective Original Notional Amount Hedged Value 2 Fixed Date Date Counterparty Ratings 1 Notional Amount as of 12/31/2017 Series as of 12/31/2017 Rate 07/31/01 08/29/02 Bank of America, N.A. Aa3/A+/A+ $ 80,590,000 $ 23,780, A-2 $ (1,597,130) 4.445% 06/15/06 10/01/09 J.P. Morgan Chase Bank Aa3/A+/AA- 190,000, ,171, A-3 (43,406,178) 4.099% 06/15/06 10/01/09 Bank of America, N.A. Aa3/A+/A+ 110,000,000 93,888, D/2010C-2 (24,608,278) 4.099% 06/15/06 10/01/10 Wells Fargo Bank, N.A. Aa2/A+/AA- 170,000, ,841, D (41,730,343) 4.112% 05/13/05 10/01/11 Wells Fargo Bank, N.A. Aa2/A+/AA- 125,000, ,631, A-1 (23,952,322) 3.862% Total $ 675,590,000 $ 537,313,050 $ (135,294,251) 1 Long-term ratings of Moody's, S&P, and Fitch, respectively, as of December 31, A negative value represents a payment by the Airports Authority to the counterparty if the swap is terminated in the current market; a positive value represents a receipt by the Airports Authority if the swap is terminated in the current market. Accounting and Financial Reporting for Derivative Instruments All of the Aviation Enterprise Fund s forward-starting swap transactions and those swap transactions associated with issued debt were determined to be ineffective in 2008 and are recognized at fair value on the Statements of Revenue, Expenses and Changes in Net Position. GAAP requires that if a derivative instrument is found to be ineffective in the first reporting period, evaluation of effectiveness in subsequent reporting periods should not be performed. Therefore, since all of the Airports Authority s derivatives were found to be ineffective at the end of December 31, 2008, hedge accounting ceased permanently, and the changes in the value of the instruments are reported in the Statements of Revenue, Expenses and Changes in Net Position as a fair value gain or (loss). Derivative Fair Value Summary For the years ended December 31, 2017 and 2016, all of the Airports Authority s interest rate swaps were recognized on the Statements of Net Position as liabilities at fair value. The fair value of the Swaps on December 31, 2017 and 2016 was a loss of $135.3 million and $148.5 million, respectively. This represents the maximum loss that would be recognized if all counterparties failed to perform as contracted. The change in fair value of Swaps for 2017 was a gain of $13.2 million. The change in fair value of Swaps for 2016 was a gain of $16.4 million. Changes in the fair value of the Airports Authority s Swaps are recorded as fair value gains or losses on the Statements of Revenue, Expenses and Changes in Net Position. In addition, net interest payments to the counterparties are recorded in the financial statements. 94
103 The fair value of the Airports Authority s Swaps as of December 31, 2017, and 2016 was as follows: Effective Date Outstanding Notional Fair Value as of 12/31/2017 Fair Value as of 12/31/2016 Change in Fair Value Counterparty Maturity 2002 Bank of America, N.A. $ 23,780, $ (1,597,130) $ (2,666,861) 1,069, J.P. Morgan Chase Bank 162,171, (43,406,178) (47,302,765) 3,896, Bank of America, N.A. 93,888, (24,608,278) (26,765,516) 2,157, Wells Fargo Bank, N.A. 148,841, (41,730,343) (45,232,475) 3,502, Wells Fargo Bank, N.A. 108,631, (23,952,322) (26,501,948) 2,549,626 Total $ 537,313,050 $ (135,294,251) $ (148,469,565) $ 13,175,314 Fair Value Measurements The Airports Authority categorizes their fair value measurements within the fair value hierarchy established by generally accepted accounting principles. The Airports Authority s Swaps are classified as Level 3, valuations derived from valuation techniques in which significant inputs are unobservable. The Swaps are valued by the counterparties. Risks Credit Risk The Airports Authority is exposed to the creditworthiness of the swap counterparties. To manage this risk, the Airports Authority will only enter into Swap Agreements with counterparties having a rating of at least A. The Airports Authority s Swap Agreements do not require the Airports Authority to post collateral for any reason. The counterparties to the Swaps are required to post collateral if their credit ratings fall below Aa3/AAbut only if the fair values of the Swaps are positive, or in the Airports Authority s favor. As of December 31, 2017, all outstanding swap fair values were negative, or in the counterparty s favor, so no collateral has been posted. The Airports Authority does not enter into any master netting agreements. Interest Rate Risk The Airports Authority is exposed to interest rate risk on its Swaps. On its pay-fixed, receivevariable interest rate swaps, as LIBOR decreases, the Airports Authority s net payment on the swap increases. Basis Risk The Airports Authority may be exposed to basis risk when the payments received from the counterparties are not sufficient to completely offset the debt service payments on the underlying variable rate bonds. As of December 31, 2017, the weighted average interest rate on the Airports Authority s hedged variablerate debt was 1.19 percent and 72 percent of LIBOR was 1.13 percent. Termination Risk The Airports Authority or its counterparties may terminate a swap if the other party fails to perform under the terms of the contract. In the event that the swap is terminated prior to maturity, the Airports Authority may owe a make-whole termination payment to a counterparty or receive a termination payment from a counterparty that could be substantial. Tax Risk The Airports Authority is exposed to the risk that future tax law changes or trading relationships lead to an increase in the ratio of tax-exempt to taxable yields. 95
104 13. CAPITAL DEBT The Airports Authority utilizes a variety of debt instruments, including short-term and long-term borrowings, fixed and variable rate products, and taxable and tax-exempt debt, to finance construction of capital projects for both Enterprise Funds. The Internal Revenue Service (IRS) has set up rules for the investment of bond proceeds of tax-exempt debt limiting the interest income that can be earned. All of the Airports Authority s tax-exempt debt follows the IRS rules for calculation and rebate of arbitrage. The Airports Authority had a $0.9 million arbitrage liability as of December 31, 2017 and a $1.8 million arbitrage liability as of December 31, AVIATION ENTERPRISE FUND DEBT A Master Indenture of Trust was created in 1990 to secure Airport System Revenue Bonds issued by the Aviation Enterprise Fund of the Airports Authority. This Master Indenture was amended effective September 1, 2001, to, in part, change the definition of Annual Debt Service to accommodate the issuance of secured commercial paper, to permit the Airports Authority to release certain revenues from the definition of revenues, and to expand the list of permitted investments to include new, safe investment vehicles designed to increase the return on the Airports Authority s investments. Under this amended Master Indenture, all bonds are collateralized by a pledge of Net Revenues of the Airports Authority which is senior to the subordinated pledge given by the Airports Authority in connection with the issuance of its bonds prior to On May 2, 2001, the Airports Authority s Board adopted Resolution No allowing the issuance of Commercial Paper (CP) Notes for the Aviation Enterprise Fund in a not-to-exceed amount of $500.0 million. The principal purpose of the CP Notes is to pay or provide for certain capital improvements at the Airports or to refund other forms of indebtedness. Recent Transactions On June 6, 2017, the Airports Authority Aviation Enterprise Fund issued $522.1 million of Series 2017A Airport System Revenue Refunding Bonds. As a result of debt service savings of $63.1 million, Series 2017A Bonds refunded $451.7 million of outstanding Series 2007A-B Bonds for debt service savings and paid for the cost of issuance of the bonds. In addition, $220.0 million of New Money Bonds were issued to fund $200.0 million of capital projects at the Airports and the associated capitalized interest and cost of issuance. The Series 2017A Alternative Minimum Tax (AMT) Airport System Revenue Refunding Bonds par amount of $334.5 million refunded $87.8 million of Series 2007A Bonds maturing in and for a net present value savings of $7.8 million and $363.9 million of Series 2007B Bonds maturing in for net present value savings of $55.3 million. The refunding produced total gross savings of $116.6 million or $63.1 million on a present value basis. Annual debt service savings in the near term are approximately $20 million from 2019 through Bonds Payable The Aviation Enterprise Fund s long-term bonds issued and outstanding as of December 31, 2017 and 2016 were as follows: 96
105 Issue Interest Maturing on Outstanding at December 31, Date Rates 1-Oct Amount Series 2003D-1 Revenue Bonds 10/01/03 Term Variable (1.295%) $ 53,825,000 $ 55,900,000 Series 2007A Revenue Refunding Bonds 07/03/07-87,795,000 Series 2007B Revenue Bonds 09/27/07-363,910,000 Series 2008A Revenue Bonds 06/24/08 Serial 5.000%-5.750% ,770, ,600,000 Series 2009B Revenue Bonds 04/01/09 Serial 3.750%-5.250% $141,700,000 Term 5.000% ,450,000 Term 5.000% ,455, ,605, ,825,000 Series 2009C Revenue Bonds 07/02/09 Serial 4.250%-5.250% $135,980,000 Term 5.125% ,405,000 Term 5.125% ,125,000 Term 5.625% ,000, ,510, ,155,000 Series 2009D-1-2 Revenue Bonds 07/02/09 Term Variable (4.099%) ,785, ,725,000 Series 2010A Revenue Bonds 07/28/10 Serial 3.500%-5.000% $167,435,000 Term 4.625% ,100,000 Term 5.000% ,305,000 Term 5.000% ,505, ,345, ,190,000 Series 2010B Revenue Refunding Bonds 07/28/10 Serial 4.000%-5.000% ,130, ,085,000 Series 2010C-1-2 Revenue Refunding Bonds 09/22/10 Term Variable C-1 (1.780%) $53,875,000 Term Variable C-2 (4.099%) ,665, ,540, ,370,000 Series 2010D Revenue Bonds 09/22/10 Term Variable (4.112%) ,840, ,310,000 Series 2010F-1 Revenue Refunding Bonds 11/17/10 Serial 4.375%-5.000% ,820,000 61,820,000 Series 2011A Revenue & Refunding Bonds 09/21/11 Variable A-1 (3.862%) $108,630,000 Variable A-2 (4.445%) ,780,000 Variable A-3 (4.099%) ,610, ,020, ,500,000 Series 2011B Revenue & Refunding Bonds 09/21/11 Variable (1.250%) ,715, ,470,000 Series 2011C Revenue Refunding Bonds 09/29/11 Serial 5.000% ,320, ,730,000 Series 2011D Revenue Refunding Bonds 09/29/11 Serial 3.000%-5.000% ,020,000 8,440,000 Series 2012A Revenue Refunding Bonds 07/03/12 Serial 3.000%-5.000% ,780, ,960,000 Series 2012B Revenue Refunding Bonds 07/03/12 Serial 5.000% ,315,000 10,745,000 97
106 Issue Interest Maturing on Outstanding at December 31, Date Rates 1-Oct Amount Series 2013A Revenue & Refunding Bonds 07/11/13 Serial 4.000%-5.00% $164,245,000 Term 5.000% ,870,000 Term 5.000% ,090, ,205, ,205,000 Series 2013B Revenue Refunding Bonds 07/11/13 Serial 2.557%-3.979% ,145,000 24,850,000 Series 2013C Revenue Refunding Bonds 07/11/13 Serial 3.000%-5.000% ,005,000 11,005,000 Series 2014A Revenue & Refunding Bonds 07/03/14 Serial 2.000%-5.00% $429,540,000 Term 4.000% ,605,000 Term 5.000% ,290, ,435, ,090,000 Series 2015A Revenue Refunding Bonds 01/29/15 Serial Term 5.000% 2033 $96,745,000 Term 5.000% ,035, ,780, ,780,000 Series 2015B Revenue & Refunding Bonds 07/15/15 Serial 2.750%-5.00% $175,555,000 Term 5.000% ,900,000 Term 5.000% ,955,000 Term 5.000% ,640, ,050, ,460,000 Series 2015C Revenue Refunding Bonds 07/15/15 Serial 3.125%-5.00% ,625,000 33,165,000 Series 2015D Revenue Refunding Bonds 07/15/15 Serial 2.700%-4.485% $17,905,000 Term 4.963% ,585,000 30,490,000 30,490,000 Series 2016A Revenue Refunding Bonds 07/07/16 Serial 4.000%-5.000% ,655, ,655,000 Series 2016B Revenue Refunding Bonds 07/07/16 Serial 5.000% ,370,000 23,370,000 Series 2017A Revenue Refunding Bonds 07/07/17 Serial 5.000% $423,705,000 Term 5.000% ,415,000 Term 5.000% ,855, ,975,000 - $ 4,472,075,000 $ 4,546,600,000 Plus (Less) unamortized discount/premium, net 264,869, ,794,773 Total Aviation Enterprise Debt $ 4,736,944,759 $ 4,755,394, , 4 5 6, 7, 8 9 Interest rates on Series 2003D-1 Bonds are calculated monthly using 72% of the 1-month LIBOR Index Rate plus a spread of.315% rounded to five decimal points. As of 12/31/17, the rate was 1.295%. Interest rates on Series 2009D-1 are reset weekly, and interest rates on Series 2009D-2 are reset daily by the Remarketing Agent. The Bonds are hedged with a Swap Agreement at a fixed rate of 4.099%. Refer to Note 12 for information on the Airports Authority's swaps. Interest rates on Series 2010C-1 are reset weekly, and rates on Series 2010C-2 are reset weekly by the Remarketing Agent. As of 12/31/17, the rate on Series 2010C-1 was 1.780%. The 2010C-2 Bonds are hedged with a Swap Agreement at a rate of 4.099%. Refer to Note 12 for information on the Airports Authority's swaps. Interest rates on Series 2010D are calculated weekly using 72% of the 1-month LIBOR Index Rate plus a spread of.30%. The Bonds are hedged with a Swap Agreement at a fixed rate of 4.112%. Refer to Note 12 for information on the Airports Authority's swaps. Interest rates on Series 2011A Bonds are reset weekly. As of 12/31/17, the rate was 1.760%. The 2011A-1 Bonds are hedged with a Swap Agreement at a fixed rate of 3.862%. The 2011A-2 Bonds are hedged with a Swap Agreement at a fixed rate of 4.445%. The 2011A-3 Bonds are hedged with a Swap Agreement at a rate of 4.099%. Refer to Note 12 for information on the Airports Authority's swaps. Interest rates on Series 2011B Bonds are calculated monthly using 72% of the 1-month LIBOR Index Rate plus a spread of.30% rounded to nearest 1/16. As of 12/31/17, the rate was 1.250%. Source: Airports Authority Records 98
107 Changes to the Aviation Enterprise Fund s Bonds Payable balances were as follows: Balance as of December 31, 2015 $ 4,950,780,423 Bonds Issued Series 2016A Revenue Refunding Bonds $ 362,655,000 Series 2015B Revenue Refunding Bonds 23,370, ,025,000 Bonds Refunded Series 2006A $ (153,555,000) Series 2006B (284,320,000) Series 2006C (31,550,000) (469,425,000) Principal Payments (150,260,000) Change in Unamortized Discount/Premium 38,274,350 Balance as of December 31, 2016 $ 4,755,394,773 Bonds Issued Series 2017A Revenue Refunding Bonds 522,135, ,135,000 Bonds Refunded Series 2007A $ (87,795,000) Series 2007B (363,910,000) (451,705,000) Principal Payments (144,955,000) Change in Unamortized Discount/Premium 56,074,986 Balance as of December 31, 2017 $ 4,736,944,759 Balance as of December 31, Short Term $ 192,100,000 Balance as of December 31, Long Term 4,544,844,759 $ 4,736,944,759 99
108 Maturities and Sinking Fund Requirements Principal payments on the Aviation Enterprise Fund s long-term bonds are due annually on October 1. The following table summarizes the maturities and sinking fund requirements for the Aviation Enterprise Fund Senior Debt, not including any unamortized discount or premium: Year Ending December 31, Principal Interest Total Debt Service 2018 $ 192,100,000 $ 212,963,376 $ 405,063, ,755, ,082, ,837, ,650, ,712, ,362, ,175, ,792, ,967, ,735, ,892, ,627, ,032,535, ,325,172 1,774,860, ,207,055, ,434,802 1,681,489, ,865, ,208,945 1,106,073, ,855,000 50,406, ,261,307 Thereafter 84,350,000 10,785,500 95,135,500 $ 4,472,075,000 $ 2,447,604,272 $ 6,919,679,272 Insurance The Airports Authority reviews each bond sale to determine if there is value in providing investors municipal bond insurance. As of December 31, 2017 and 2016, the Airports Authority s Aviation Enterprise Fund had insured $105.5 million and $563.9 million of long-term bonds, respectively. This represented 2.2 percent of total bonds as of December 31, 2017 and 11.9 percent of total bonds as of December 31, Aviation Enterprise Fund bonds were insured by Berkshire Hathaway (BHAC) in 2017 and additionally by American Municipal Bond Assurance Corporation (Ambac) in Insurer Ambac BHAC Amount Insured Percent of Total Amount Insured Percent of Total at December 31, 2017 Bonds Payable at December 31, 2016 Bonds Payable $ - 0.0% $ 451,705, % 105,465, % 112,200, % $ 105,465, % $ 563,905, % Commercial Paper Notes The Airports Authority s Aviation Enterprise Fund has an authorized commercial paper program in an aggregate principal amount not to exceed $500.0 million outstanding at any time. The Airports Authority currently has in place one credit facility allowing the Airports Authority to support the issuance of up to $200.0 million of Commercial Paper (CP) Notes (CP Notes) at any given time. The CP Notes are structured as short-term demand obligations under the Amended and Restated Eleventh Supplemental Indenture and the Twenty-second Supplemental Indenture. The Notes are collateralized by certain pledged funds, including Net Revenues on parity with the bonds. They are further collateralized by irrevocable direct pay Letter of Credit (LOC) facility. The Airports Authority s obligation to repay amounts drawn under the LOC is collateralized by a promissory note issued to the provider. 100
109 The CP Notes were issued in two series. Series One CP Notes were authorized for issuance of up to $250.0 million in 2004 and suspended in March The LOC securing the Series One CP Notes expired and thus the program is noted as suspended. Series Two CP Notes were authorized for issuance of up to $200.0 million in March 2014 and collateralized by an irrevocable direct pay LOC issued by Industrial and Commercial Bank of China (ICBC) expiring in February 2022 in the amount of $200.0 million in principal and $13.3 million in interest. As of December 31, 2017 and 2016, the Airports Authority had no outstanding Series Two CP Notes. Liquidity Facilities The Airports Authority has $778.7 million of outstanding variable rate bonds, which are further collateralized by LOC and Direct Purchase Indexed Loans (Index Floaters). The following table lists the liquidity facilities supporting the variable rate bonds as of December 31, 2017: Bank Provider Credit Facility Associated Program/Series Interest Rate Expiration Date Series Original Amount Outstanding as of December 31, 2017 Interest Draw Allowed Maximum Draw Allowed ICBC LOC CP: Series Two 17 bps 2/25/2022 $ 200,000,000 $ - $ 9,000,000 $ 209,000,000 Royal Bank of Canada LOC 2011 A VRDO 27 bps 9/28/2018 $ 233,635,000 $ 180,020,000 $ 2,840,864 $ 182,860,864 SMBC LOC 2010 C VRDO 34 bps 9/21/2020 $ 170,000,000 $ 145,540,000 $ 2,296,741 $ 147,836,741 TD Bank LOC 2009 D VRDO 35 bps 2/28/2021 $ 136,825,000 $ 116,785,000 $ 1,842,963 $ 118,627,963 U.S. Bank Index Floater 2011 B 72% LIBOR + 30 bps 4/1/2020 $ 207,640,000 $ 133,715,000 $ - $ 133,715,000 Wells Fargo Index Floater 2003 D1 72% LIBOR bps 10/1/2018 $ 150,000,000 $ 53,825,000 $ - $ 53,825,000 Wells Fargo Index Floater 2010 D 72% LIBOR + 30 bps 9/22/2022 $ 170,000,000 $ 148,840,000 $ - $ 148,840,000 Credit Ratings The Aviation Enterprise Fund s underlying credit ratings as of December 31, 2017 and 2016 are depicted in the table below: Mode Fixed Variable, CP Variable, 2009D VRDO * Variable, 2010C VRDO * Variable, 2011A VRDO * Lien Position Senior Senior Senior Senior Senior Rating as of December 31, 2017 Moody's / S&P / Fitch Aa3 / AA- / AA- P-1 / A-1 / F1 Aa1/VMIG1 AAA/A-1+ AA+/F1+ Aa2/VMIG1 AA+/A-1 AA-/F1 Aa1/VMIG1 AAA/A-1+ AAA/F1+ Rating as of December 31, 2016 Moody's / S&P / Fitch A1 / AA- / AA- P-1 / A-1 / F1 Aa1/VMIG1 AAA/A-1+ AA+/F1+ Aa2/VMIG1 AA+/A-1 AA-/F1 Aa1/VMIG1 AAA/A-1+ AAA/F1+ * Joint Default Analysis with Moody's, Joint Criteria Rating with S&P, Dual Party Pay Criteria with Fitch DULLES CORRIDOR ENTERPRISE FUND DEBT In August of 2009, a Master Indenture of Trust was created to secure Dulles Toll Road Revenue Bonds issued by the Dulles Corridor Enterprise Fund of the Airports Authority. Under this Master Indenture, all bonds are secured by a pledge of the Toll Road Revenues derived by the Airports Authority from the operation of the Dulles Toll Road. The pledge of the Toll Road Revenues securing the Series 2009A Bonds (First Senior Lien), however, is senior to the pledge to Toll Road Revenues securing the Series 2009B-C-D Bonds and Series 2010A-B Bonds 101
110 (Second Senior Lien). Following the Second Senior Lien pledge are the bonds that were issued on a Subordinate Lien, the Series 2010D Bonds. On June 8, 2011, the Airports Authority Board adopted Resolution No allowing the issuance of CP Notes for the Dulles Corridor Enterprise Fund in a not-to-exceed amount of $300.0 million. The principal purpose of the CP Notes is to provide funds to finance the costs of the Dulles Metrorail Project and certain Capital Improvement Program (CIP) projects and refund other forms of indebtedness. On May 9, 2014, the Airports Authority s application for a secured loan under the Transportation Infrastructure Finance and Innovation Act of 1978 (TIFIA) to finance a portion of the costs of Phase 2 of the Metrorail Project was approved by the United States Department of Transportation (USDOT) in principal amount of $1.278 billion. Subsequently, on July 16, 2014, the Airports Authority Board adopted Resolution No authorizing execution of the TIFIA Loan Agreement and issuance of Dulles Toll Road Junior Lien Revenue Bonds, TIFIA Series Bonds Payable The Dulles Corridor Enterprise Fund s bonds payable as of December 31, 2017 and 2016 were as follows: Issue Interest Maturing on Outstanding at December 31 Date Rates October 1 Amount Series 2009A Revenue Bonds 08/12/09 CIBs Term 5.125% 2032 $ 22,140,000 CIBs Term 5.000% ,735,000 CIBs Term 5.250% ,125,000 $ 198,000,000 $ 198,000,000 Series 2009B Revenue Bonds 08/12/ %-7.910% CABs 293,960, ,772,834 Series 2009C Revenue Bonds 08/12/ % Convertible CABs 249,775, ,775,000 Series 2009D Revenue Bonds 08/12/ % Build America Bonds 400,000, ,000,000 Series 2010A Revenue Bonds 05/27/ % CABs Term 89,932,315 84,257,489 Series 2010B Revenue Bonds 05/27/ % Convertible CABs Term 224,019, ,139,350 Series 2010D Revenue Bonds 05/27/ % Build America Bonds 150,000, ,000,000 Series 2014A Revenue Refunding Bonds 5/22/ % ,760, ,760,000 $ 2,027,447,118 $ 1,994,704,673 Plus (Less) unamortized discount/premium, net 5,124,339 7,062,259 Total Dulles Corridor Enterprise Bonds Payable $ 2,032,571,457 $ 2,001,766,
111 Changes to the Dulles Corridor Enterprise Fund s Bonds Payable balances during 2017 and 2016 were as follows: Balance as of December 31, 2015 $ 1,965,558,469 Principal Payments (7,588,182) Plus: Change in Accretion of Capital Appreciation Bonds 45,652,839 Change in unamortized (discount) or premium, net (1,856,194) Balance as of December 31, ,001,766,932 Principal Payments (4,032,707) Plus: Change in Accretion of Capital Appreciation Bonds 36,775,152 Change in unamortized (discount) or premium, net (1,937,920) Balance as of December 31, 2017 $ 2,032,571,457 Balance as of December 31, ST $ 4,086,658 Balance as of December 31, LT 2,028,484,799 $ 2,032,571,457 Maturities and Sinking Fund Requirements Principal payments on the Dulles Corridor Enterprise Fund s long-term bonds are due annually on October 1. The following table summarizes the maturities and sinking fund requirements for the Dulles Corridor Enterprise Fund Senior Debt, not including any unamortized discount or premium: Year Ending December 31, Principal Interest Total Debt Service 2018 $ 4,086,658 $ 91,847,704 $ 95,934, ,259, ,974, ,234, ,505, ,674, ,179, ,466, ,122, ,589, ,422, ,607, ,029, ,436, ,615, ,051, ,558, ,393, ,952, ,617, ,752,983 1,041,370, ,498, ,616,016 1,262,114,024 Thereafter 1,030,519, ,530,599 1,426,049,974 $ 1,688,370,263 $ 4,020,134,879 $ 5,708,505,
112 Insurance As of December 31, 2017 and 2016, the Airports Authority s Dulles Corridor Enterprise Fund had insured $307.2 million and $311.2 million of long-term bonds, respectively with Assured Guaranty. This represented 15.2 percent of total bonds as of December 31, 2017 and 15.5 percent of total bonds as of December 31, Commercial Paper Notes The CP Notes are structured as short-term demand obligations under the Seventh Supplemental Indenture. They are collateralized by certain pledged funds, including Net Revenues on parity with the bonds. They are further collateralized by an irrevocable direct pay LOC facility. The Airports Authority s obligation to repay amounts drawn under such LOCs is collateralized by a promissory note issued by the Airports Authority. The CP Notes are collateralized by an irrevocable direct pay LOC of $300.0 million (and an additional $20.0 million for interest draw) issued by J.P. Morgan Chase Bank, National Association. In June 2016, CP Notes, Series One, Reimbursement Agreement with J.P. Morgan Chase Bank, National Association was extended two years through August The outstanding balance was $200.0 million as of December 31, Changes to the Dulles Corridor Enterprise Fund s Commercial Paper Notes balances during 2017 and 2016 were as follows: CP Notes Balance as of December 31, 2015 $ 210,000,000 Commercial Paper Notes Refunded (469,000,000) Commercial Paper Notes Issued 440,000,000 Balance as of December 31, ,000,000 Commercial Paper Notes Refunded (581,000,000) Commercial Paper Notes Issued 600,000,000 Balance as of December 31, 2017 $ 200,000,000 Notes Payable The Dulles Corridor Enterprise TIFIA Loan with the USDOT consists of monthly draws. Interest and principal will begin to be paid after substantial completion of Phase 2 of the Metrorail Project. Interest is accreted monthly and capitalized semi-annually on April 1 and October 1. The capitalized interest amount as of December 31, 2017 is $32.8 million. 104
113 Changes to the Dulles Corridor Enterprise Fund s TIFIA Notes Payable during 2017 and 2016 were as follows: TIFIA Notes Outstanding Draw Balance as of December 31, 2015 $ 250,839,657 Total Draws in ,461,230 Total Draws as of December 31, ,300,887 Total Draws in ,239,715 Draw Balance as of December 31, 2017 $ 792,540,602 Accreted Interest in 2015 $ 5,759,192 Accreted Interest in ,424,295 Accreted Interest in ,932,763 Total Accreted Interest as of December 31, 2017 $ 39,116,250 Total TIFIA Balance as of December 31, 2017 $ 831,656,852 Changes to the Dulles Corridor Enterprise Fund s FFGA Notes Payable balances during 2016 and 2017 were as follows: Notes Payable Balance as of December 31, 2015 $ 100,000,000 Principal Payments in 2016 (100,000,000) Balance as of December 31, Principal Payments in Balance as of December 31, 2017 $ - Credit Ratings The Dulles Corridor Enterprise Fund s underlying credit ratings as of December 31, 2017 and 2016 are depicted in the table below: ` Mode Lien Position Fixed First Senior Fixed Second Senior Fixed Second Senior 1 Fixed Subordinate Fixed Junior Variable, CP Second Senior Rating as of Decemeber 31, 2017 Moody's / S&P / Fitch A2 / A- / NR Baa1 / BBB+ / NR A2 / AA / NR Baa2 / BBB+ / NR Baa2 / A- / NR P-1 / A-1+ / NR Rating as of Decemeber 31, 2016 Moody's / S&P / Fitch A2 / A- / NR Baa1 / BBB+ / NR Aa2 / AAA / NR Baa2 / BBB+ / NR Baa2 / A- / NR P-1 / A-1+ / NR 1 Enhanced Rating 105
114 14. NET POSITION Net position consisted of the following, as of December 31, 2017: As of December 31, 2017 Restricted for Net Investment in Capital Assets Construction Debt Service Debt Service Reserve Leases Current assets Cash and cash equivalents $ - $ - $ - $ - $ - Accounts receivable, net Investments Restricted investments - 408,862, ,787, Inventory Prepaid expenses and other current assets Non-current assets Restricted Cash and cash equivalents * - 413,075,106 42,318,311 1,659,121 6,741,115 Accounts receivable - 140,318, ,807 Investments ,377,682 - Unrestricted: Net pension assets Bond insurance costs, net Other assets Capital assets 6,060,225, Total Assets 6,060,225, ,255, ,106, ,036,803 7,084,922 Deferred outflows of resources Deferred outflows - debt refundings 70,986, Deferred outflows - pension plans Total deferred outflows of resources 70,986, Current liabilities Accounts payable and accrued expenses 133,096, ,688 Advance billings and payments received in advance - 66,122,979 15,000, Accrued lease obligations Accrued interest payable ,820, Current portion of bonds and notes payable 192,100, Non-current liabilities Other liabilities 968, ,000,000 15,000, ,080 Commercial paper notes 200,000, Interest rate swaps payable Pension liability TIFIA payable 662,712,738 66,442, ,501,762 - Bonds payable, net 4,171,505, ,940, ,535,041 - Total Liabilities 5,360,383, ,505, ,820, ,036, ,768 Deferred inflows of resources Deferred inflows - debt refundings 127, Deferred inflows - pension plans Total deferred inflows of resources 127, Net position (deficit) $ 770,701,198 $ 169,749,896 $ 64,285,589 $ - $ 6,280,154 * Includes the portion of restricted cash and cash equivalents classified as current on the Statement of Net Position 106
115 Restricted for Dulles Toll Dulles Rail Road Latent Defects Repairs As of December 31, 2017 Public Safety Unrestricted Total Business- Type Activities $ - $ - $ - $ 255,860,299 $ 255,860, ,058,910 30,058, ,390, ,390, ,650, ,879,786 6,879, ,539,385 6,539,385 15,047,632 1,509, , ,590, ,662,011-6,965, ,343, ,366,734 9,366, ,859,855 13,859, , , ,060,225,198 15,047,632 8,475, ,901 1,196,424,238 8,925,895, ,986, ,791,294 20,791, ,791,294 91,778, ,816, ,930, ,575, ,698, , , ,820, ,086, ,186, ,436, ,192, ,000, ,294, ,294, ,166,311 1,166, ,656, ,533,348,855 6,573,329, ,765,095,178 8,530,646, , ,891,514 22,891, ,891,514 23,018,575 $ 15,047,632 $ 8,475,218 $ 239,901 $ (570,771,160) $ 464,008,
116 Net position consisted of the following, as of December 31, 2016: As of December 31, 2017 Restricted for Net Investment in Capital Assets Construction Debt Service Debt Service Reserve Leases Current assets Cash and cash equivalents $ - $ - $ - $ - $ - Accounts receivable, net Investments Restricted investments - 408,862, ,787, Inventory Prepaid expenses and other current assets Non-current assets Restricted Cash and cash equivalents * - 413,075,106 42,318,311 1,659,121 6,741,115 Accounts receivable - 140,318, ,807 Investments ,377,682 - Unrestricted: Net pension assets Bond insurance costs, net Other assets Capital assets 6,060,225, Total Assets 6,060,225, ,255, ,106, ,036,803 7,084,922 Deferred outflows of resources Deferred outflows - debt refundings 70,986, Deferred outflows - pension plans Total deferred outflows of resources 70,986, Current liabilities Accounts payable and accrued expenses 133,096, ,688 Advance billings and payments received in advance - 66,122,979 15,000, Accrued lease obligations Accrued interest payable ,820, Current portion of bonds and notes payable 192,100, Non-current liabilities Other liabilities 968, ,000,000 15,000, ,080 Commercial paper notes 200,000, Interest rate swaps payable Pension liability TIFIA payable 662,712,738 66,442, ,501,762 - Bonds payable, net 4,171,505, ,940, ,535,041 - Total Liabilities 5,360,383, ,505, ,820, ,036, ,768 Deferred inflows of resources Deferred inflows - debt refundings 127, Deferred inflows - pension plans Total deferred inflows of resources 127, Net position (deficit) $ 770,701,198 $ 169,749,896 $ 64,285,589 $ - $ 6,280,154 * Includes the portion of restricted cash and cash equivalents classified as current on the Statement of Net Position 108
117 As of December 31, 2016 Restricted for Dulles Rail Latent Defects Dulles Toll Road Repairs Public Safety Unrestricted Total Business- Type Activities $ - $ - $ - $ 269,743,879 $ 269,743, ,059,976 32,059, ,024, ,024, ,454, ,939,652 9,939, ,343,434 7,343,434 15,012,821 1,414, , ,221, ,295,202-6,920, ,648, ,629,232 16,629, ,615,598 1,615, ,690,362,241 15,012,821 8,334, ,231 1,084,356,242 8,344,338, ,717, ,486,823 18,486, ,486,823 93,204, ,018 46,985, ,383, ,482, ,605, , , ,970, ,032, ,607, ,740, ,330, ,000, ,469, ,469,565 6,672,707 6,672, ,484, ,501,405,958 6,585,553, ,018 1,732,160,816 8,174,449, , ,934,412 5,934, ,934,412 6,079,547 $ 15,012,821 $ 8,334,261 $ 190,213 $ (635,252,163) $ 257,014,
118 The Aviation Enterprise Fund s debt service reserve accounts were over-funded by $5.7 million as of December 31, 2017 and $7.5 million as of December 31, The Dulles Corridor Enterprise Fund s debt service reserve accounts were under-funded by $0.6 million as of December 31, 2017 and under-funded $3.4 million as of December 31, Over-funded amounts can only be withdrawn from the Aviation Enterprise Fund s debt service reserve accounts once a year, based on balances as of October 1. Dulles Corridor Enterprise Fund s debt service reserve accounts are balanced twice a year, based on balances as of April 1 and October AVIATION ENTERPRISE FUND REVENUES Uncollectible Revenues Aviation Enterprise Fund revenues, net of estimated uncollectible revenues, for the years ended December 31, 2017 and December 31, 2016, were as follows: Year ended December 31, Gross Revenues Concessions $ 332,092,589 $ 316,530,157 Rents 283,903, ,138,272 Landing fees 93,819,456 93,479,793 Utility sales 13,265,312 13,024,832 Passenger fees 27,872,762 32,544,343 Other 10,961,722 10,695,777 Total gross revenues 761,915, ,413,174 Less: Estimated uncollectible revenues (352,697) (353,166) Total net operating revenues $ 761,563,128 $ 774,060,008 Concentrations of Revenues Several airlines, and their affiliates, represent concentrations of revenues for the Airports Authority. At Reagan National, American, Delta, Southwest, United Airlines and JetBlue comprised approximately 94.1 percent of Signatory Airline Revenues during At Dulles International, American Airlines, United Airlines, Delta, British and Lufthansa comprised approximately 68.7 percent of Signatory Airline Revenues during Combined, these ten airlines represented approximately 76.5 percent of total Signatory Airline Revenues during 2017 for the Airports Authority. 110
119 16. GOVERNMENT GRANTS The Airports Authority receives, predominately on a cost-reimbursement basis, grants from the United States government, the Commonwealth, and other local grantors for certain operating and capital construction programs. Government grants and counties contributions recorded by the Airports Authority during the years ended December 31, 2017 and 2016 totaled $270.2 million and $296.4 million, respectively. In fiscal years 2017 and 2016 the Airports Authority recognized federal, state and local grants for operating and capital programs as follows. Operating Programs The Law Enforcement Officer Reimbursement Program, which is recorded as Operating Revenue, offsets expenses incurred by the Airports Authority s Public Safety personnel serving a support role to the Transportation Security Administration (TSA). Explosives detection funds are used to offset the expense of training and caring for canines used in explosives detection. The Department of Justice and the U.S. Treasury Equitable Sharing Agreements are collaborative efforts between these agencies and the Airports Authority s police department wherein both entities share in the proceeds from the sale of confiscated items. The Airports Authority s proceeds may only be used for certain types of expenditures as defined by these agencies. In 2016, the Commonwealth, pursuant to the Appropriation Act awarded the Airports Authority $25 million of Commonwealth funding in the Commonwealth s Fiscal Year 2017 and $25 million of Commonwealth funding in the Commonwealth s Fiscal Year 2018 for the purpose of reducing the airline cost per enplanement at Dulles International and thereby improving the competitiveness of the airport. The Airports Authority received $25 million of Commonwealth funding in fiscal year In 2017, U.S Department of Homeland Security, Federal Emergency Management Agency, Protection and National Preparedness awarded the Airports Authority $595 thousand. The purpose of this grant is to enhance the capacity of the Airports Authority, as well as the surrounding city and county jurisdictions in the National Capital Region to be better prepared to respond and recover from a Complex Coordinated Terrorist Attacks (CCTA). 111
120 Grants in Support of Operations Award Recognized Year Ended Dec. 31, Operating Revenue TSA Security Fees TSA - Law enforcement officer reimbursement program $ 851,460 $ 948,547 Grant recognized as operating revenues 851, ,547 Non-Operating Revenue Federal Grants TSA - National explosive detection canine team program 606, ,000 Department of Justice - Equitable sharing agreement 1, 2 42,734 97,711 Department of Treasury - Equitable sharing agreement 1, 2 76,989 - Federal Emergency Management Agency - CCTA Program 25,685 - Urban Areas Security Initiative - NCR IMT Program 17,559 - Federal Emergency Management Agency Snow Assistance and Severe Storm Program 306,558 - Total Federal Grants 1,075, ,711 State Grant Commonwealth of Virginia Funding to IAD 25,000,000 - Virginia Department Emergency Management - Snow Assistance 102,186 - Virginia Department Emergency Management - NCR-IMT Program 35,790 - Total State Fund 25,137,976 - Grants recognized as non-operating revenues 26,213, ,711 Total Federal, State, and Local grants in support of operations $ 27,064,961 $ 1,652,258 1 Funds received under this agreement can be expended for items which may be capitalized or expensed in accordance with the Airports Authority's capitalization thresholds. 2 While the agreement remains in effect as of December 31, 2017, the amount of future awards is dependent on the occurrence of future events. Capital Programs The Airports Authority Dulles Corridor Enterprise Fund receives grants in support of Phase 1 of the Dulles Metrorail Project. The Federal Transit Administration (FTA) is the primary grantor, with total federal New Starts funding commitments for the project totaling $900 million. The state and local funding sources for Phase 1 of the Dulles Metrorail Project include transportation bonds issued by the Commonwealth and a Fairfax County transportation improvement district property tax. In addition, the Virginia Transportation Act of 2000 dedicated 112
121 $75 million to the project from Surface Transportation Program funds. In 2009, USDOT allocated $77.3 million in American Recovery and Reinvestment Act (ARRA) funding to the project. These funds replaced Section 5309 funds that were scheduled to be received in the final year (2016) of the FFGA. As of February 2012, the Airports Authority had fulfilled its ARRA local match requirement of $199.2 million, and the close-out of the ARRA grant was completed on April 16, For 2017, a total of $14.3 million of the New Starts funding of Phase 1 of the Dulles Metrorail Project was invoiced and received. For 2016, a total of $140.1 million of New Starts Funding of Phase 1 of the Dulles Metrorail Project was invoiced and received. The Airports Authority s Aviation Enterprise Fund receives federal and state grants in support of its construction program. The federal programs, primarily through the FAA s Airport Improvement Program (AIP), including annual entitlement grants, provide funding for airport development, airport planning, and noise compatibility programs from the Airports and Airways Trust Funds in the form of entitlement and discretionary grants for eligible projects. The Commonwealth also provides discretionary funds for capital programs. Phase 2 of the Dulles Metrorail Project extends 11.4 miles from the Metrorail Wiehle Avenue Station in Reston through Dulles International to Route 772 in Loudoun County, Virginia. It includes six new stations and maintenance yard on Dulles International property. Construction is currently underway and the project is currently scheduled to be complete for passenger service in the first quarter of The Airport Authority receives project funding from the Northern Virginia Transportation Authority (NVTA) a total of $60.0 million, $33.0 million in 2015 and $27.0 million in These funds are used for the construction of the Metrorail Innovation Station which is a part of Phase 2 of the Dulles Metrorail Project. During 2017, a total of $21.5 million of NVTA funds was invoiced and $11.6 million was received during the same period in The remaining $9.9 million was received in January
122 Award Recognized Award Year Ended Dec. 31, Remaining Grants in Support of Capital Programs Dec. 31, 2017 Federal Grants Federal Aviation Administration AIP - 4th Runway $ - $ 7,129,613 $ - AIP - Taxiway Z & Taxilane C Reconstruction - 45,599 - AIP - Improve runway 15/33 and 4/22 safety 765,900 1,516,149 1,109,099 AIP - Rehabilitation of Taxiway K and P 5,077, ,113 AIP - Rehabilitation of Runway 4/22 9,807,246-4,416,804 AIP -Taxiway J 9,middle section Reconstruction 645,805-4,406,491 AIP - Reconstruction of South Taxiway Y - 240,304 - AIP - Improve Runway 1/19 safety area (Phase 2) - 1,507,500 - AIP - Rehabilitate Runway 1/19 and Associated - 386,655 - AIP - Taxilane C and Taxiway Z Reconstruction 2,862,260 2,302, ,484 AIP - Taxilane B Reconstruction and Widening, - 1,632,400 - Total Federal Aviation Administration Grants 19,158,223 14,760,539 10,781,991 Federal Transit Administration FFGA - Dulles Metrorail Project (Phase 1) 1,198,988 63,911,008 33,529,526 Internal Revenue Service Build America Bonds interest subsidy 13,702,855 13,643,177 - Total Federal Grants 34,060,066 92,314,724 44,311,517 Commonwealth of Virginia Grant Department of Aviation - AeroTrain 2,000,000 2,000,000 - Virginia Department of Transportation - Dulles Toll Road Subsidy 20,000,000 30,000,000 30,000,000 Virginia Department of Transportation - Dulles Metrorail Project (Phase 2) ,122,979 22,000,000 32,000, ,122,979 Local Grant Northern Virginia Transportation Authority (NVTA) - Phase 2 21,543,990 32,162,187 6,293,823 Fairfax County Water Authority - 1,002,285 - Fairfax County - Betterments - 5,555,000 - Arlington County - Arlington County Police Firing Range Agreement - 4,708,386-21,543,990 43,427,858 6,293,823 Total Federal, State, and Local grants in support of capital programs 77,604, ,742, ,728,319 Local Counties Contributions for Dulles Metrorail Project Fairfax County Contributions (Phase 2) 108,278,342 82,900, ,088,308 Loudoun County Contributions (Phase 2) 57,224,570 44,071, ,771, ,502, ,972, ,860,185 Total Federal, State, and Local grants including counties contributions in support of capital programs. $ 243,106,968 $ 294,714,672 $ 756,588,
123 17. PASSENGER FACILITY CHARGES As of December 31, 2017, the FAA has approved ten PFC applications for a total authority of $3.5 billion for the Airports Authority s Aviation Enterprise Fund. Each PFC application is approved by individual airport. However, PFC fees may be imposed at one airport and used for approved projects at either airport. PFC revenue for 2016 and 2017 was as follows: Reagan National Dulles International Total PFC Revenue 2016 $ 47,673,620 $ 42,137,504 $ 89,811,124 PFC Revenue 2017 $ 47,470,884 $ 43,475,973 $ 90,946,857 Total Applications $ 1,025,481,914 $ 2,442,302,508 $ 3,467,784,422 PFC Revenue Received Through December 31, 2017 $ 760,695,050 $ 826,822,485 $ 1,587,517,535 Estimated Final Collection Date February 1, 2023 December 31, 2038 PFC collections totaling $45.0 million and $43.5 million in 2017 and 2016, respectively, were applied to debt service payments. In accordance with the regulations, based on the approval date from the FAA and continuing through the PFC collection period, the FAA reduces the Airports Authority s share of entitlement grants by 75.0 percent. 18. RISK MANAGEMENT The Airports Authority is exposed to a variety of risks or losses related to operations (i.e., injuries to employees or to members of the public or damage to Airports Authority or public property). This exposure is managed through a combination of self-insured and insured arrangements. Major insurance coverages include airport liability, workers compensation, property, equipment breakdown, environmental impairment, public officials, employment practices, law enforcement, crime, fiduciary, business travel, cyber risk, terrorism and executive risk. The Airports Authority is self-insured for the first $750 thousand of each workers compensation loss and from $0 to $1.0 million (depending on type) of all other risk management/insurance losses. Claim payments did not exceed insurance coverage for each of the past three years. Accruals are maintained to recognize the self-insured risk of loss and encompass all offices within the Airports Authority. The accruals are determined based on insurance claim practices and actuarial estimates for prior and current year claims. The appropriateness of the accruals is continually reviewed and updated by management on a quarterly basis. 115
124 The overall accrual for potential losses as of December 31, 2017 and December 31, 2016 was $6.0 million and $6.4 million, respectively. Changes in the claim liability accounts in fiscal years 2017, 2016 and 2015 were as follows: Claims and Beginning Changes in Fiscal Year Balance Estimates Claim Payments Ending Balance 2015 $5,086,662 $2,436,317 $2,791,876 $4,731, $4,731,103 $4,282,571 $2,642,194 $6,371, $6,371,480 $2,490,822 $2,904,485 $5,957, OTHER COMMITMENTS AND CONTINGENCIES Grants Amounts received or receivable from grant agencies, principally the U.S. government, the Commonwealth and Fairfax County, are subject to audit and adjustment by the grantor agencies. Any disallowed claims, including for amounts already collected, may constitute a liability of the applicable funds. The amount, if any, of expenditures that may be disallowed by the grantor cannot be determined at this time, although the Airports Authority expects such amounts, if any, to be immaterial. Pollution Remediation The Airports Authority continually monitors its properties to identify polluted sites for which the Airports Authority would be named a responsible party. Identified pollution remediation obligations as of December 31, 2017 and 2016 were $1.1 million and $0.2 million, respectively. Routine pollution prevention, control, and monitoring costs are expensed as incurred. Pollution prevention, control, and monitoring expenses for the years ended December 31, 2017 and 2016 were $6.5 million and $5.1 million, respectively. Rights-of-Way Purchases The Airports Authority acquires property interests for the Dulles Metrorail Project through negotiated settlement or through the VDOT s Commissioner of Highways power of eminent domain. The Airports Authority is responsible for all costs associated with such proceedings and for the payment of all compensation and damages for the properties acquired. As of December 31, 2017 and 2016, the Airports Authority had acquired multiple property interests through the power of eminent domain for a total of $1.2 million and $0.5 million respectively, for which the final compensation and damages were not settled. No estimate of the final compensation and damages for these acquired properties was recorded as of December 31, Northern Virginia Criminal Justice Training Academy The Airports Authority is a member of the Northern Virginia Criminal Justice Training Academy (the Academy), which provides criminal justice training to fourteen participating police and sheriff agencies from Northern Virginia. Academy members cannot withdraw from the Academy while any bonds of the Academy are issued and outstanding. As of June 30, 2016, the most recent period for which audited financials were available, the Academy had $8.7 million in revenue bonds outstanding. Payments by the Airports Authority to the Academy for training services totaled $264 thousand and $315 thousand during the years ended December 31, 2017 and 2016, respectively. 116
125 20. LITIGATION The Airports Authority is involved in various claims and lawsuits arising in the ordinary course of business that are covered by insurance or that the Airports Authority does not believe to be material. Although the outcome of these claims and lawsuits is not presently determinable, in the opinion of the Airports Authority s general counsel, the likely outcome in these matters which are not covered by insurance, including the lawsuit described below will not have a material adverse effect on the financial condition of the Airports Authority. Moreover, to the knowledge of the Airports Authority, there is, except as described below, no litigation pending or threatened against the Airports Authority that contests the creation, existence, powers or jurisdiction of the Airports Authority, or the validity or effect of the Federal Act, the Federal Lease, the Virginia Act or the District Act. On July 5, 2016, six users of the Dulles Toll Road, individually and on behalf of all others similarly situated, filed a class action complaint against the Airports Authority, the United States Department of Transportation and the Secretary of Transportation in the federal district court for the District of Columbia. In the lawsuit as originally filed, among other claims, the plaintiffs claimed that the payment of tolls on the Dulles Toll Road may not be used to subsidize the construction of the Dulles Metrorail Project and questioned the constitutionality of the Airports Authority and certain of its activities as operator of the Dulles Toll Road that are related to the Dulles Metrorail Project and to the Airports Authority s Dulles Corridor Enterprise. The lawsuit was transferred to the federal district court for the Eastern District of Virginia in November Soon thereafter, the plaintiffs amended their complaint to add certain allegations and claims regarding the operation of the Aviation Enterprise by the Airports Authority and requesting, among other things, that the Secretary of Transportation retake possession of the Airports from the Airports Authority. Many of the claims raised in the amended complaint are substantially similar to claims made in previous litigation challenging the tolls the Airports Authority has set for the Dulles Toll Road and/or the constitutionality of the Airports Authority, all of which have been concluded in favor of the Airports Authority. On May 30, 2017, the federal district court in Virginia granted the motions to dismiss filed by Airports Authority and the federal defendants, rejected all claims asserted by plaintiffs in the amended complaint, and dismissed the amended complaint with prejudice. Plaintiffs thereafter filed an appeal of the district court s ruling in the U.S. Court of Appeals for the Fourth Circuit. Briefing in this appeal is underway, and it is expected that all briefing will be completed by the end of April A decision from the court of appeals is anticipated in the third or fourth quarter of While the Airports Authority intends to continue to vigorously defend against the claims raised in this litigation, it cannot predict what action the court of appeals might take, or whether a decision by that court which is adverse to the Airports Authority will directly affect the Aviation Enterprise. 21. SUBSEQUENT EVENTS The Dulles Corridor Enterprise completed loan draws on the TIFIA Loan with the USDOT totaling $78.1 million and FTA draw of $3.7 million in the 1 st quarter of The Aviation Enterprise Fund received $25.0 million in grants in January 2018 from the Commonwealth pursuant to the Appropriation Act for the purpose of reducing the airline cost per enplanement at Dulles International. On December 22, 2017, the President of the United States signed the Tax Cuts and Jobs Act. One of the provisions within the Act was the reduction in the corporate tax rate from 35 percent to 21 percent, beginning 117
126 January 1, This reduction directly increased the total interest rate cost associated with the Aviation Enterprise s Indexed Floater credit facilities (2003D1, 2010D and 2011B), through the Margin Rate Factor provision in the associated agreements. The Airports Authority negotiated a reduced interest rate cost with the providers of the Indexed Floater credit facilities, and the Chairman of the Board executed the amendments to the Continuing Covenant Agreements and Supplemental Indentures on February 26, INTENTIONALLY LEFT BLANK 118
127 REQUIRED SUPPLEMENTAL INFORMATION (unaudited) 2017 COMPREHENSIVE ANNUAL FINANCIAL REPORT SCHEDULE 1 SCHEDULE OF FUNDING PROGRESS FOR POST-EMPLOYMENT BENEFITS The following presents the funding progress from January 1, 2008 through December 31, Schedule of Funding Progress - Medical Insurance Actuarial UAAL as a Actuarial Actuarial Accrued Annual Percentage Valuation Value Liability (AAL) Unfunded Funded Covered of Covered Date of Assets - Entry Age UAAL Ratio Payroll Payroll 1/1/2008 $ 19,450,000 $ 85,170,000 $ 65,720, % $ 68,620, % 1/1/ ,190, ,980,000 78,790, % 73,960, % 1/1/ ,420, ,870,000 85,450, % 78,170, % 1/1/ ,960, ,230,000 91,270, % 92,170, % 1/1/ ,710, ,470,000 74,760, % 95,490, % 1/1/ ,130, ,530,000 81,400, % 105,430, % 1/1/ ,730, ,580,000 90,850, % 109,970, % 1/1/ ,180, ,200,000 21,020, % 107,560, % 1/1/ ,120, ,060,000 13,940, % 110,670, % 1/1/ ,172, ,929,339 12,757, % 116,927, % Schedule of Funding Progress - Life Insurance Actuarial UAAL as a Actuarial Actuarial Accrued Annual Percentage Valuation Value Liability (AAL) Unfunded Funded Covered of Covered Date of Assets - Entry Age UAAL Ratio Payroll Payroll 1/1/2008 $ 1,711,700 $ 6,822,000 $ 5,110, % $ 68,616, % 1/1/2009 2,217,400 7,578,300 5,360, % 73,961, % 1/1/2010 2,765,800 8,161,500 5,395, % 78,171, % 1/1/2011 3,608,900 9,777,600 6,168, % 92,169, % 1/1/2012 4,324,200 11,035,700 6,711, % 95,487, % 1/1/2013 5,140,000 9,975,700 4,835, % 105,429, % 1/1/2014 6,539,000 10,689,800 4,150, % 109,974, % 1/1/2015 7,691,800 11,670,700 3,978, % 107,563, % 1/1/2016 8,688,000 11,212,900 2,524, % 110,670, % 1/1/2017 9,765,157 12,233,600 2,468, % 116,927, % 119
128 SCHEDULE 2 CHANGES IN NET PENSION LIABILITY (ASSET) AND RELATED RATIOS General Employees Retirement Plan Fiscal year ending December 31, Total Pension Liability Changes for the year: Service cost $ 5,548,643 $ 5,294,135 $ 4,917,894 $ 4,596,269 $ 4,285,977 Interest 11,883,159 11,357,903 10,121,292 9,413,518 8,636,527 Differences between expected and actual experience 4,571,544 1,128, (1,122,634) 377,551 Changes of assumptions 68,595 (5,963,403) 5,375, Benefit payments (including refunds) (5,510,006) (4,641,220) (3,978,260) (3,572,654) (2,939,701) Net changes in Total Pension Liability 16,561,935 7,175,438 16,437,391 9,314,499 10,360,354 Total Pension Liability - Beginning 155,598, ,423, ,985, ,671, ,310,988 Total Pension Liability - Ending (a) $ 172,160,605 $ 155,598,670 $ 148,423,232 $ 131,985,841 $ 122,671,342 Plan Fiduciary Net Position Changes for the year: Contribution - employer $ 6,365,276 $ 4,553,940 $ 1,431,907 $ 4,812,943 $ 5,903,067 Contribution - member Net investment income 24,963,769 11,755,443 2,102,247 6,366,579 20,759,598 Benefit payments (including refunds) (5,510,006) (4,641,220) (3,978,260) (3,572,655) (2,939,701) Plan administrative expenses (226,788) (175,504) (186,879) (225,762) (59,919) Net changes in Plan Fiduciary Net Position 25,592,251 11,492,659 (630,985) 7,381,105 23,663,045 Plan Fiduciary Net Position - Beginning 155,360, ,868, ,499, ,117, ,454,942 Plan Fiduciary Net Position - Ending (b) $ 180,953,017 $ 155,360,766 $ 143,868,107 $ 144,499,092 $ 137,117,987 Net Pension Liability/(Asset) - Ending (a) - (b) $ (8,792,412) $ 237,904 $ 4,555,125 $ (12,513,251) $ (14,446,645) Plan Fiduciary Net Position as Percentage of the TPL % 99.85% 96.93% % % Covered-Employee Payroll $ 99,305,842 $ 90,852,722 $ 85,760,198 $ 82,620,662 $ 79,926,284 Net Pension Liability/(Asset) as a Percentage of Covered-Employee Payroll -8.85% 0.26% 5.31% % % Schedule is intended to show information for 10 years. Additional years will be displayed as they become available. 120
129 SCHEDULE 2- CHANGES IN NET PENSION LIABILITY (ASSET) AND RELATED RATIOS (continued) Police Officers and Firefighters Retirement Plan Fiscal year ending December 31, Total Pension Liability Changes for the year: Service cost $ 3,261,511 $ 2,342,298 $ 2,318,795 $ 2,187,801 $ 2,252,676 Interest 7,633,684 6,742,144 6,153,445 5,646,934 5,066,533 Differences between expected and actual experience 1,988,277 2,606,881 1,998, ,950 1,716,317 Changes of assumptions - 2,455,053 (86,408) - - Benefit payments (including refunds) (3,472,449) (2,894,779) (2,233,670) (1,492,134) (981,032) Net changes in Total Pension Liability 9,411,023 11,251,597 8,150,391 6,986,551 8,054,494 Total Pension Liability - Beginning 100,225,777 88,974,180 80,823,789 73,837,238 65,782,744 Total Pension Liability - Ending (a) $ 109,636,800 $ 100,225,777 $ 88,974,180 $ 80,823,789 $ 73,837,238 Plan Fiduciary Net Position Changes for the year: Contribution - employer $ 2,680,653 $ 2,174,817 $ 592,481 $ 2,408,703 $ 3,224,322 Contribution - member 395, , , , ,463 Net investment income 15,201,677 7,478,417 1,082,654 3,979,334 12,634,140 Benefit payments (including refunds) (3,472,449) (2,894,779) (2,233,670) (1,492,134) (981,032) Plan administrative expenses (126,152) (82,287) (98,471) (89,888) (42,023) Net changes in Plan Fiduciary Net Position 14,679,515 7,057,904 (277,587) 5,174,117 15,192,870 Plan Fiduciary Net Position - Beginning 93,790,974 86,733,070 87,010,657 81,836,540 66,643,670 Plan Fiduciary Net Position - Ending (b) $ 108,470,489 $ 93,790,974 $ 86,733,070 $ 87,010,657 $ 81,836,540 Net Pension Liability/(Asset) - Ending (a) - (b) $ 1,166,311 $ 6,434,803 $ 2,241,110 $ (6,186,868) $ (7,999,302) Plan Fiduciary Net Position as Percentage of the TPL 98.94% 93.58% 97.48% % % Covered-Employee Payroll $ 26,937,796 $ 27,708,013 $ 25,360,689 $ 25,617,129 $ 24,978,683 Net Pension Liability/(Asset) as a Percentage of Covered-Employee Payroll 4.33% 23.22% 8.84% % % Schedule is intended to show information for 10 years. Additional years will be displayed as they become available. 121
130 SCHEDULE 3 SCHEDULE OF FUNDING PROGRESS FOR DEFINED BENEFIT PENSION PLANS Schedule of Funding Progress - General Employees Retirement Plan Actuarially Actual Fiscal Year Determined Contribution Contribution as Ended Contribution Contribution in Deficiency a % of Covered December 31 (ADC) Relation to ADC (Excess) Covered Payroll Payroll 2013 $ 5,903,067 $ 5,903,067 $ - $ 79,926, % ,812,943 4,812,943-82,620, % ,431,907 1,431,907-85,760, % ,553,940 4,553,940-90,852, % ,365,276 6,365,276-99,305, % Schedule of Funding Progress - Police Officers & Firefighters Retirement Plan Actuarially Actual Fiscal Year Determined Contribution Contribution as Ended Contribution Contribution in Deficiency a % of Covered December 31 (ADC) Relation to ADC (Excess) Covered Payroll Payroll 2013 $ 3,224,322 $ 3,224,322 $ - $ 24,978, % ,408,703 2,408,703-25,617, % , ,481-25,360, % ,174,817 2,174,817-27,708, % ,680,653 2,680,653-26,937, % Schedule is intended to show information for 10 years. Additional years will be displayed as they become available. Notes to Schedule of Employer Contributions The total pension liability was determined by an actuarial valuation as of December 31, two years prior to the end of the fiscal year in which contributions are reported. The Airports Authority s funding policy is to provide for periodic employer contributions at actuarially determined rates that, expressed as percentages of annual covered-employee payroll, are designed to accumulate sufficient assets to pay benefits when due. Employer contributions are determined in accordance with the Plan provisions and are approved by the Airports Authority s Retirement Committee. 122
131 Methods and assumptions used to determine contribution rates: Valuation Date December 31, 2017 Actuarial Cost Method Entry-age actuarial cost method Amortization Method 20-year level dollar, closed Assets Valuation Method 5-year smoothed market Actuarial Assumptions: (a) Investment rate of return 7.50%, net of expenses (b) Projected salary increases Variable rate 3.0% to 6.0% (a) and (b) include inflation at 2.75% (c) Cost of living adjustments 1.375% (d) Mortality Rates For General Employees Plan: RP-2014 Mortality Tables, with generational improvement based upon 75% of projection scale MP-2015 For Police Officers and Firefighters Plan: RP-2014 Blue Collar Mortality Tables, with generational improvement based upon 75% of projection scale MP-2015 All assets of the Airports Authority pension plans are held in trust at the Bank of New York Mellon. A copy of the Plans audited financial statements, Plan documents, and required supplementary information for the Plans may be obtained by written request to:, Attention: Benefits Department, 1 Aviation Circle, Washington, DC
132 SCHEDULE 4 SCHEDULE OF EMPLOYER CONTRIBUTIONS For the Year Ended December 31, Civil Service Retirement System Federal Employees Retirement System Total 2008 $ 289,953 $ 815,338 $ 1,105, , , , , , , , , , , , , , , , , , , , , , , , , , , ,127 Plan documents and audited plan financials for the CSRS and FERS plans may be obtained by written request to: U.S. Office of Personnel Management, Retirement Operations Center, P.O. Box 45, Boyers, PA,
133 STATISTICAL SECTION This part of the Airports Authority s comprehensive annual financial report presents detailed information as a context for understanding what the information in the financial statements and note disclosures says about the Airports Authority s overall financial health. Financial Trends: (S-1 through S-3): These schedules contain trend information to help the reader understand how the Airports Authority s financial performance and well-being have changed over time. Revenue Capacity: (S-4 through S-12): These schedules contain information to help the reader assess the factors affecting the Airports Authority s ability to generate airline and non-airline revenues. Debt Capacity: (S-13 through S-16): These schedules present information to help the reader assess the affordability of the Airports Authority s current levels of outstanding debt and the Airports Authority s ability to issue additional debt in the future. Demographic and Economic Information: (S-17 through S-22): These schedules offer demographic and economic indicators to help the reader understand the environment within which the Airports Authority s financial activities take place and to help make comparisons over time and with other airports. Operating Information: (S-23 through S-40): These schedules contain information about the Airports Authority s operations and resources to help the reader understand how the Airports Authority s financial information relates to the services the Airports Authority provides and the activities it performs. Table of Contents Page Exhibit S-1 Components of Net Position Exhibit S-2 Revenues, Expenses and Changes in Net Position Exhibit S-3 Operating Expenses by Business Unit Exhibit S-4 Operating Revenues by Business Unit Exhibit S-5 Operating Revenues Reagan National Exhibit S-6 Operating Revenues Dulles International Exhibit S-7 Rates and Charges Exhibit S-8 Concession Revenues and Enplanements Reagan National Exhibit S-9 Concession Revenues and Enplanements Dulles International Exhibit S-10 Dulles Toll Road Transactions and Revenues Exhibit S-11 Dulles Toll Road Monthly Transactions and Revenues
134 Exhibit S-12 Top 10 Payors Exhibit S-13 Debt Service Coverage Aviation Enterprise Fund Exhibit S-14 Debt Service Coverage Dulles Corridor Enterprise Fund Exhibit S-15 Debt Service Requirements by Enterprise Fund Exhibit S-16 Ratios of Outstanding Debt Exhibit S-17 Airport Information Exhibit S-18 Dulles Toll Road Information Exhibit S-19 Employment by Industry Exhibit S-20 Major Private Employers Exhibit S-21 Population Trends Exhibit S-22 Airports Authority Employee Strength Exhibit S-23 Aircraft Operations by Airport Reagan National Exhibit S-24 Aircraft Operations by Airport Dulles International Exhibit S-25 Commercial Passenger Enplanements Exhibit S-26 Market Share by Landed Weight Reagan National Exhibit S-27 Market Share by Landed Weight Dulles International Exhibit S-28 Market Share by Passenger Enplanements Reagan National Exhibit S-29 Market Share by Passenger Enplanements Dulles International Exhibit S-30 Market Share by Passenger Enplanements Both Airports Exhibit S-31 Market Share by Enplaned Cargo Weight Reagan National Exhibit S-32 Market Share by Enplaned Cargo Weight Dulles International Exhibit S-33 Passenger Facility Charges by Airport Exhibit S-34 Top 30 Passenger Origination and Destination Markets in 2017 Reagan National Exhibit S-35 Top 30 Passenger Origination and Destination Markets in 2017 Dulles International Exhibit S-36 Top 10 Passenger Origination and Destination Markets Reagan National Exhibit S-37 Top 10 Passenger Origination and Destination Markets Dulles International
135 Exhibit S-38 Airline Tenants Both Airports Exhibit S-39 Non-Airline Tenants Reagan National Exhibit S-40 Non-Airline Tenants Dulles International
136 Exhibit S-1 COMPONENTS OF NET POSITION (Expressed in Thousands) NET POSITION AT YEAR END COMPOSED OF: Net investment in capital assets $ 770,701.2 $ 730,742.3 $ 429,894.0 $ (1,206,194.3) $ 1,925,134.4 $ 1,930,730.2 $ 1,681,513.6 $ 1,420,180.3 $ 1,099,998.9 $ 638,153.5 Restricted 1 264, , , , , , , , , ,133.7 Unrestricted 1 (570,771.2) (635,252.2) (803,778.0) 432, , , , , , ,889.7 Cumulative prior period adjustment 1,7, , (50,718.9) - - (62,380.4) TOTAL NET POSITION $ 464,008.4 $ 257,014.1 $ (66,378.2) $ (242,483.2) $ 2,623,030.5 $ 2,292,183.2 $ 1,986,492.8 $ 1,822,588.8 $ 1,536,809.7 $ 1,059,796.5 A summary of the restatements affecting years 2008 and prior is as follows: Years prior to 2009 (cumulative) Years prior to 2008 (cumulative) Total net position, as previously stated 2 $ 1,117,891.8 $ 1,002,968.8 Decrease in net investment in capital assets (31,876.6) Restricted - - Increase in unrestricted 4,5,6 4, ,644.1 Decrease due to cumulative prior period adjustment 7 (62,380.4) (45,407.6) Cumulative decrease in net position, due to restatements (58,095.3) (74,640.1) Net position, as restated $ 1,059,796.5 $ 928, Components of net position have been restated for 2008 and 2007 based on adjustments recorded during the Airports Authority's 2011 and 2010 fiscal years. Based on existing Airports Authority records, restatements pertaining to investment income could not be specifically identified as pertaining to restricted or unrestricted investments or as to specific years in which the investment income was originally recognized and therefore those restatement amounts are shown in the aggregate. 2 Total net position as stated in the Airport Authority's 2011 Comprehensive Annual Financial Report for the immediately preceeding year. 3 Capitalized interest expense for projects placed in service in prior years was reduced, resulting in reductions to accumulated depreciation. 4 Investment income was increased for interest income on a note receivable. This interest income had previously been capitalized as construction in progress. 5 Amortization of a bond premium was revised, resulting in a reduction of interest expense. 6 Interest expense was increased for the interest costs incurred on the unspent bond proceeds of tax-exempt debt. These interest costs had previously been capitalized. 7 Investment income was reduced as a result of correcting mark-to-market accruals for long-term investment valuations. 8 Cumulative adjustment for 2011 relates to change in accounting principle with the implementation of GASB Statement No. 65. Please see Note 2 for more information. 9 Cumulative adjustment for 2014 relates to change in accounting principles with the implementation of GASB Statement No. 68. Source: Airports Authority Records 128
137 Exhibit S-2 REVENUES, EXPENSES AND CHANGES IN NET POSITION (Expressed in Thousands) OPERATING REVENUES Concessions $ 332,007.8 $ 316,453.5 $ 286,049.6 $ 253,486.1 $ 236,254.0 $ 227,719.9 $ 227,600.0 $ 230,973.6 $ 217,461.2 $ 223,710.7 Tolls 152, , , , , , , , , ,416.5 Rents 283, , , , , , , , , ,331.3 Design fees ,363.2 Landing fees 93, , , , , , , , , ,289.6 Utility sales 13, , , , , , , , , ,348.6 Passenger fees 27, , , , , , , , , ,354.1 Other 10, , , , , , , , , ,547.4 TOTAL OPERATING REVENUES 913, , , , , , , , , ,361.4 OPERATING EXPENSES Materials, equipment, supplies, contract services and other 1 235, , , , , , , , , ,288.7 Impairment loss/design costs , , , ,027.4 Salaries and related benefits 182, , , , , , , , , ,720.6 Utilities 25, , , , , , , , , ,402.3 Lease from U.S. Government 5, , , , , , , , , ,958.3 Depreciation and amortization 1 232, , , , , , , , , ,852.8 TOTAL OPERATING EXPENSES 1 682, , , , , , , , , ,250.1 OPERATING INCOME (LOSS) 1 231, , , , , , , , ,396.8 (26,888.7) NON-OPERATING REVENUES (EXPENSES) Passenger facility charges, financing costs (944.8) (2,330.5) Investment income 1 31, , , , , , , , , ,850.1 Interest expense 1 (294,305.0) (318,726.5) (312,014.9) (266,110.4) (238,369.6) (229,471.5) (240,011.8) (240,220.4) (154,780.8) (142,622.1) Swap payments/hedge termination Federal compensation net of transfers Federal, state and local grants 26, , , , , Fair value gain (loss) on swaps 13, , ,196.5 (54,156.5) 81, ,422.5 (96,249.9) (34,978.4) 103,731.4 (158,374.6) Other Income - - 5, Contributions to other governments 52, , ,424.7 (3,045,602.6) 0.0 (313.8) (1,297.9) (10,086.1) (650.2) - TOTAL NON-OPERATING REVENUES (EXPENSES) 1 (171,296.5) (150,871.2) (284,761.0) (3,348,134.9) (145,531.5) (207,594.2) (300,961.4) (255,632.9) (37,612.2) (280,528.4) GAIN (LOSS) BEFORE CAPITAL CONTRIBUTIONS 1 59, ,558.0 (46,587.4) (3,155,407.2) 33,854.0 (118,193.3) (156,300.1) (172,442.0) 48,784.6 (307,417.1) CAPITAL CONTRIBUTIONS Passenger facility charges 90, , , , , , , , , ,455.2 Federal, state and local grants 56, , , , , , , , , ,941.5 Other capital property acquired , , , , ,488.2 TOTAL CAPITAL CONTRIBUTIONS 147, , , , , , , , , ,884.9 Cumulative change in net position due to restatements 1, , (50,718.9) CHANGE IN NET POSITION 1 $ 206,994.3 $ 323,392.2 $ 176,105.1 $ (2,865,513.7) $ 330,847.3 $ 305,690.4 $ 163,904.0 $ 285,779.1 $ 477,013.2 $ 131, Amounts for years prior to 2008 have not been revised due to restatements recorded during the Airports Authority's 2011 and 2010 fiscal years. The amount of these restatements to any one specific year prior to 2008 is not determinable based on existing Airports Authority records. A summary of the impact of these adjustments is as follows: Years prior to 2008 (cumulative) Increases in operating expenses due to restatements Increase in materials, equipment, supplies, contract services and other $ 5,603.2 Increase in depreciation and amortization 24,485.5 Change in operating expenses due to restatements 30,088.7 Change in operating income (loss) (30,088.7) Decreases in non-operating revenues (expenses) due to restatements Decrease in investment income (29,513.3) Decrease in interest expense (2,003.2) Change in non-operating revenues (expenses) due to restatements (31,516.5) Change in gain (loss) before capital contributions (61,605.2) Cumulative change in net position due to restatements $ (61,605.2) 2 Cumulative adjustment for 2011 relates to change in accounting principle with the implementation of GASB Statement No Cumulative adjustment for 2014 relates to change in accounting principle with the implementation of GASB Statement No. 68. Source: Airports Authority Records 129
138 Exhibit S-3 OPERATING EXPENSES BY BUSINESS UNIT (Expressed in Thousands) , REAGAN NATIONAL Materials, equipment, supplies, contract services, and other $ 65,090.0 $ 59,895.3 $ 61,986.4 $ 61,248.8 $ 64,364.3 $ 58,069.0 $ 56,509.9 $ 55,813.2 $ 47,846.1 $ 49,691.4 Salaries and related benefits 79, , , , , , , , , ,112.1 Utilities 8, , , , , , , , , ,687.4 Travel Insurance 4, , , , , , , , , ,116.5 Loss (proceeds) from disposal of capital assets (0.1) (46.8) (116.7) (115.4) (132.0) Non-capitalized facility projects , , , , Lease from U.S. Government 2, , , , , , , , , ,478.9 Depreciation and amortization 8, , , , , , , , , ,546.1 Total Reagan National Expenses 170, , , , , , , , , ,660.3 DULLES INTERNATIONAL Materials, equipment, supplies, contract services, and other 102, , , , , , , , , ,837.2 Salaries and related benefits 93, , , , , , , , , ,236.6 Utilities 15, , , , , , , , , ,475.0 Travel Insurance 2, , , , , , , , , ,116.5 Loss (proceeds) from disposal of capital assets (18.9) (67.8) (111.2) (117.2) 84.3 Non-capitalized facility projects , , ,205.6 (26.0) Lease from U.S. Government 2, , , , , , , , , ,479.3 Depreciation and amortization 9, , , , , , , , , ,409.8 Total Dulles International Expenses 227, , , , , , , , , ,726.5 DULLES TOLL ROAD Materials, equipment, supplies, contract services, and other 20, , , , , , , , , ,424.5 Salaries and related benefits 7, , , , , , , , , Utilities Travel Insurance , Loss (proceeds) from disposal of capital assets (15.3) (2.7) (6.2) (0.7) - Non-capitalized facility projects 1, , Depreciation and amortization , Total Dulles Toll Road Expenses 31, , , , , , , , , ,673.9 DULLES METRORAIL PROJECT Materials, equipment, supplies, contract services, and other 3, , , , , , , , , Salaries and related benefits 2, , , , , , , , , Utilities Travel Insurance (9.0) Loss (proceeds) from disposal of capital assets 0.4 (0.1) (0.1) (1.4) (2.9) (4.2) - Non-capitalized facility projects (4.4) Depreciation and amortization 7, , , , , , , , Total Dulles Metrorail Project Expenses 13, , , , , , , , , WASHINGTON FLYER EXPENSES WASHINGTON FLYER MAGAZINE EXPENSES TELECOMMUNICATIONS EXPENSES 3, , , , , , , , , ,606.8 FAA AIR TRAFFIC CONTROL TOWER EXPENSES AVIATION DRIVE EXPENSES 3 1, , , , , , , , , ,406.1 CONSTRUCTION PROGRAMS 4 Materials, equipment, supplies, contract services, and other 23, , , , , , , , , ,281.0 Loss (proceeds) from disposal of capital assets - 2, , , ,776.6 Non-capitalized facility projects 6, , , , , , , , , ,960.3 Depreciation and amortization 205, , , , , , , , , ,242.7 Total Construction Programs Expenses 234, , , , , , , , , ,614.2 TOTAL EXPENSES $ 682,301.9 $ 670,361.8 $ 675,098.5 $ 664,586.8 $ 670,697.6 $ 707,150.5 $ 613,974.2 $ 608,721.9 $ 536,950.2 $ 588, The Airports Authority converted the Washington Flyer Magazine Program to a management contract in Separate reporting has been discontinued. 2 FAA Air Traffic Control Tower was completed in Aviation Drive is inclusive of all expense classifications. 4 Construction programs consists of the Aviation Enterprise Capital Construction Program and the Dulles Corridor Capital Improvement Program. 5 Expenses for 2012 have been adjusted as a result of the change in accounting principle with the implementation of GASB Statement No Certain amounts for 2010 through 2014 have been reclassified to be consistent with current year reporting. Source: Airports Authority Records 130
139 Exhibit S-4 OPERATING REVENUES BY BUSINESS UNIT (Expressed in Thousands) REAGAN NATIONAL Airline: Rents $ 105,043.9 $ 104,827.3 $ 100,824.8 $ 75,410.7 $ 87,000.4 $ 82,203.8 $ 85,704.4 $ 81,175.2 $ 73,828.0 $ 66,302.8 Landing fees 57, , , , , , , , , ,290.3 Total Airline Revenues 162, , , , , , , , , ,593.1 Non-Airline: Concessions: Parking 57, , , , , , , , , ,980.2 Rental cars 25, , , , , , , , , ,736.1 Terminal concessions: Food and beverage 17, , , , , , , , , ,117.4 News stands 4, , , , , , , , , ,731.8 Retail 1, , , , , , , , , ,531.5 Display advertising 8, , , , , , , , , ,105.4 Ground transportation 1 23, , , , , , , , , ,183.1 Services Inflight catering 1, , , , , Fixed base operator 2, , , , , , , Duty free All other 1, , , , , Total Concessions 143, , , , , , , , , ,369.3 Rents 7, , , , , , , , , ,349.9 Security Utility sales 2, , , , , , , , , ,240.1 Other 3, , , , , , , , , ,651.3 Total Non-Airline Revenue 157, , , , , , , , , ,488.9 Total Reagan National Revenues 320, , , , , , , , , ,082.0 DULLES INTERNATIONAL Airline: Rents 138, , , , , , , , , ,354.7 Landing fees 36, , , , , , , , , ,999.3 International Arrival Building fees 20, , , , , , , , , ,372.0 Passenger Fees 6, , , , , , , , , ,703.5 Design Fees ,361.2 Total Airline Revenues 201, , , , , , , , , ,790.7 Non-Airline: Concessions: Parking 67, , , , , , , , , ,125.6 Rental cars 18, , , , , , , , , ,213.1 Terminal concessions: Food and beverage 15, , , , , , , , , ,742.7 News stands 5, , , , , , , , , ,081.0 Retail 3, , , , , , , , , ,576.8 Display advertising 6, , , , , , , , , ,119.8 Ground transportation 14, , , , , , , , , ,185.6 Services 3, , , , , , , , , ,515.2 Inflight catering 14, , , , , , , , , ,120.9 Fixed base operator 22, , , , , , , , , ,430.0 Duty free 13, , , , , , , , , ,757.5 All other 4, , , , , , , , , Total Concessions 188, , , , , , , , , ,341.5 Rents 28, , , , , , , , , ,402.3 Security Utility sales 5, , , , , , , , , ,565.6 Other 7, , , , , , , , , ,039.1 Total Non-Airline Revenues 230, , , , , , , , , ,748.9 Total Dulles International Revenues 432, , , , , , , , , ,539.6 DULLES TOLL ROAD Tolls 152, , , , , , , , , ,416.5 Other Total Dulles Toll Road 152, , , , , , , , , ,416.5 TELECOMMUNICATIONS 4, , , , , , , , , ,179.9 FAA AIR TRAFFIC CONTROL TOWER 3, , , , , , , , , , AVIATION DRIVE , , ,444.5 TOTAL REVENUES $ 913,585.8 $ 925,791.0 $ 913,272.1 $ 870,829.2 $ 850,083.1 $ 796,551.4 $ 758,635.4 $ 691,912.9 $ 623,347.0 $ 561, Aviation Drive revenues include rents and utilities. Source: Airports Authority Records 131
140 Exhibit S-5 OPERATING REVENUES REAGAN NATIONAL 2017 Terminal Concessions, 19.0% Other Non-Airline, 4.4% Airline Rents, 32.8% Rental Car, 8.0% Parking, 17.9% Landing Fees, 17.9% Source: Airports Authority Records 132
141 Exhibit S-6 OPERATING REVENUES DULLES INTERNATIONAL 2017 COMPREHENSIVE ANNUAL FINANCIAL REPORT 2017 Other Non-Airline, 9.8% Terminal Concessions, 23.8% Airline Rents, 32.0% Rental Car, 4.2% Landing Fees, 8.5% Parking, 15.6% Int'l Arrivals Fees, 4.7% Passenger Fees, 1.6% Source: Airports Authority Records 133
142 Exhibit S-7 RATES AND CHARGES Reagan National Rates Signatory Airline Rates Signatory Airline Cost Per Enplanement (CPE) $ $ $ $ $ $ $ $ $ $ Signatory Airline CPE (including prior year Settlement) $ $ $ $ $ $ $ $ $ $ Landing Fee $ 4.14 $ 3.90 $ 4.03 $ 3.72 $ 4.19 $ 3.55 $ 3.42 $ 3.16 $ 2.81 $ 2.55 Terminal A - Average Rate $ $ $ $ $ $ $ $ $ $ Terminal B & C - Average Rate $ $ $ $ $ $ $ $ $ $ Type 6 - Covered/Unenclosed $ 5.54 $ 5.37 $ 5.29 $ 5.30 $ 5.13 $ 5.57 $ 5.55 $ 5.42 $ 5.35 $ 6.00 Type 7 - Uncovered/Unenclosed $ 1.39 $ 1.34 $ 1.32 $ 1.32 $ 1.28 $ 1.39 $ 1.39 $ 1.35 $ 1.34 $ 1.50 Non-Signatory Airline Rates General Aviation Landing Fees $ 4.20 $ 3.94 $ 3.91 $ 4.01 $ 4.30 $ 3.86 $ 3.59 $ 3.52 $ 2.93 $ 2.89 Landing Fee $ 5.25 $ 4.93 $ 4.89 $ 5.01 $ 5.37 $ 4.83 $ 4.48 $ 4.40 $ 3.66 $ 3.61 Terminal A $ $ $ $ $ $ $ $ $ $ Terminal B & C $ $ $ $ $ $ $ $ $ $ Rental Car Customer Facility Charge Customer Facility Charge (Per Rental Day) $ 2.50 $ 2.50 $ 2.50 $ 2.50 $ 2.50 $ 2.50 $ 2.50 $ 2.50 $ 2.50 $ 2.50 Dulles International Rates Signatory Airline Rates Signatory Airline CPE $ $ $ $ $ $ $ $ $ $ Signatory Airline CPE (including prior year Settlement) $ $ $ $ $ $ $ $ $ $ Landing Fee $ 1.34 $ 2.35 $ 3.41 $ 4.59 $ 4.23 $ 3.72 $ 3.50 $ 3.44 $ 3.14 $ 2.60 Concourse C & D $ $ $ $ $ $ $ $ $ $ Concourse B $ $ $ $ $ $ $ $ $ $ Main Terminal $ $ $ $ $ $ $ $ $ $ Concourse A $ $ $ $ $ $ $ $ $ $ Z-Gates $ $ $ $ $ $ $ $ $ $ Type 6 - Covered/Unenclosed $ 5.54 $ 5.37 $ 5.57 $ 5.42 $ 5.47 $ 5.35 $ 5.42 $ 5.42 $ 5.35 $ 6.00 Type 7 - Uncovered/Unenclosed $ 1.39 $ 1.34 $ 1.39 $ 1.35 $ 1.37 $ 1.34 $ 1.36 $ 1.35 $ 1.34 $ 1.50 Airside Operations Building N/A N/A N/A $ $ $ $ $ $ $ International Arrivals Building $ 5.42 $ 7.11 $ 7.68 $ 8.64 $ 8.76 $ 8.31 $ 6.59 $ 6.55 $ 4.10 $ 3.53 Apron Operations Building N/A N/A N/A N/A N/A N/A N/A N/A N/A N/A Concourse C International Arrival Building $ $ $ $ 9.46 $ 9.60 $ 9.16 $ 6.52 $ 4.72 $ 2.98 $ 1.78 Passenger Conveyance $ 1.73 $ 1.82 $ 1.65 $ 1.85 $ 1.83 $ 2.08 $ 2.40 $ 2.20 $ 2.02 $ 2.02 Non-Signatory Airline Rates General Aviation Landing Fee $ 5.96 $ 5.81 $ 6.14 $ 4.96 $ 4.75 $ 4.15 $ 4.23 $ 4.09 $ 4.32 $ 3.54 Landing Fee $ 7.76 $ 7.57 $ 8.07 $ 6.53 $ 6.26 $ 5.46 $ 5.56 $ 5.38 $ 5.68 $ 4.66 Concourse C & D $ $ $ $ $ $ $ $ $ $ Concourse B $ $ $ $ $ $ $ $ $ $ Main Terminal $ $ $ $ $ $ $ $ $ $ International Arrivals Building $ 7.81 $ 8.37 $ 8.43 $ 9.15 $ 9.27 $ 9.41 $ 7.61 $ 7.18 $ 5.28 $ 4.74 Concourse C International Arrival Building $ $ $ 9.77 $ 9.55 $ 9.03 $ 9.89 $ 8.40 $ 7.71 $ 4.80 $ 3.43 Concourse A $ $ $ $ $ $ $ $ $ $ Z-Gates $ $ $ $ $ $ $ $ $ $ Passenger Conveyance $ 2.69 $ 2.51 $ - $ - $ - $ - $ - $ - $ - $ - Passenger Facility Charges Reagan National $ 4.50 $ 4.50 $ 4.50 $ 4.50 $ 4.50 $ 4.50 $ 4.50 $ 4.50 $ 4.50 $ 4.50 Dulles International $ 4.50 $ 4.50 $ 4.50 $ 4.50 $ 4.50 $ 4.50 $ 4.50 $ 4.50 $ 4.50 $ 4.50 Dulles Toll Road Toll Rates Two-Axle Vehicles Main Plaza $ 2.50 $ 2.50 $ 2.50 $ 2.50 $ 1.75 $ 1.50 $ 1.25 $ 1.00 $ 0.75 $ 0.75 Ramp Plaza $ 1.00 $ 1.00 $ 1.00 $ 1.00 $ 1.00 $ 0.75 $ 0.75 $ 0.75 $ 0.50 $ 0.50 As discussed in Note 2 - Airport Use Agreement and Premises Lease (Use and Lease Agreement), airline rates and charges are calculated pursuant to the formulas set forth in the Use and Lease Agreement. The Use and Lease Agreement provides for the calculation of annual rates and charges, with rate adjustments at midyear, or any time revenues fall 5% or more below projections. The rates presented in the above tables are average rates, as calculated at the time of settlement. Source: Airports Authority Records 134
143 Exhibit S-8 CONCESSION REVENUES AND ENPLANEMENTS REAGAN NATIONAL Reagan National Concession Revenues & Enplanements (in Millions) Concession Revenues $150 $130 $110 $90 $70 $50 $30 $10 -$ Number of Enplaned Passengers Parking Rental Cars Terminal and Other Enplanements Annual enplanements include domestic and transborder passengers for both commercial and non-commercial (including military, general aviation, and charter) flights. Enplanements are a measurement of an airport's usage and are influenced by many factors including availability of air service, price of airfare, location of the airport, and macroeconomic factors. Enplanements at Reagan National set a new record in Concession revenues make up the vast majority of the Airports Authority's non-airline revenues. The Airports Authority retains all risk related to the fluctuation of parking revenue, its largest concession revenue source. Parking revenue is highly dependent on passenger traffic and varies year to year. However, the majority of the Airports Authority's rental car and terminal concession contracts contain a fixed component as well as a variable component. In most cases, the Airports Authority is guaranteed a minimum payment by a tenant and then shares excess revenue with the tenant if sales exceed a predetermined amount. As passenger enplanements have increased over the past several years, so too have concession revenue. Parking revenue, for example, has increased 37.5 percent from Food and beverage revenue has increased percent and advertising revenue has increased percent during the same period. The food and beverage tenants in the terminal have undergone major redevelopment in recent years. Source: Airports Authority Records 135
144 Exhibit S-9 CONCESSION REVENUES AND ENPLANEMENTS DULLES INTERNATIONAL Dulles International Concession Revenues & Enplanements (in Millions) Concession Revenues $180 $160 $140 $120 $100 $80 $60 $40 $20 $ Number of Enplaned Passengers Parking Rental Cars Terminal and Other Enplanements Annual enplanements include domestic and transborder passengers for both commercial and non-commercial (including military, general aviation, and charter) flights. Enplanements are a measurement of an airport's usage and are influenced by many factors including availability of air service, price of airfare, location of the airport, and macroeconomic variables. Enplanements at Dulles International increased slightly again in Concession revenues, which are directly correlated with passenger enplanements, make up the vast majority of the Airports Authority's non-airline revenues. The Airports Authority retains all risk related to the fluctuation of parking revenue, its largest concession revenue source. Parking revenue is highly dependent on passenger traffic and varies year to year. Parking revenue has increased percent The majority of the Airports Authority's rental car and terminal concession contracts contain a fixed component as well as a variable component. In most cases, the Airports Authority is guaranteed a minimum payment by a tenant and then shares excess revenue with the tenant if sales exceed a predetermined amount. This has helped the Airports Authority maintain strong concession revenue despite lower enplanement figures in recent years. Total concession revenue per enplaned passenger increased from $11.50 in 2008 to $16.50 in 2017, a 43.4 percent increase. Since 2008, rental car revenue increased 19.2 percent, food and beverage increased 71.9 percent, inflight catering increased percent, display advertising increased percent, and newsstand and retail increased a combined 33.6 percent. Source: Airports Authority Records 136
145 Exhibit S-10 DULLES TOLL ROAD TRANSACTIONS AND REVENUES 2017 COMPREHENSIVE ANNUAL FINANCIAL REPORT Dulles Toll Road Annual Transactions & Revenues Millions $180 $160 $140 $120 $100 $80 $60 $40 $20 $ Transactions Revenues (in $) Annual transactions include the number of revenue transactions (i.e., each recorded toll payment, whether mainline or ramp), non-revenue transactions (i.e., police, emergency vehicles, military vehicles, etc.), and violations (i.e., each transaction where the full toll amount was not collected at the time of the transaction, whether due to avoidance, electronic misreading, or otherwise, and where the amount was subsequently collected) processed in the calendar year ending December 31. Transactions measure roadway usage and are impacted by toll rate increases. The first toll rate increase in the roadway's history became effective in May 2005 while the Dulles Toll Road was under the operation of Virginia Department of Transportation (VDOT). A second toll rate increase became effective in January 2010, a third in January 2011, a fourth in January 2012, a fifth in January 2013 and a sixth in January The Dulles Toll Road was transferred to the Airports Authority on November 1, The chart above includes VDOT data for years and Airports Authority data for years Source: Airports Authority Records, VDOT 137
146 Exhibit S-11 DULLES TOLL ROAD MONTHLY TRANSACTIONS AND REVENUES DULLES TOLL ROAD TRANSACTIONS - MONTHLY January 7,720,943 6,801,818 7,421,306 7,533,849 7,919,077 8,022,521 7,824,547 8,299,024 8,466,696 9,207,781 February 7,397,887 7,597,218 6,949,373 6,897,287 7,409,382 7,889,749 7,764,687 6,657,821 8,416,445 8,709,460 March 8,402,723 8,546,164 8,067,467 7,813,556 7,979,292 8,687,041 9,018,150 9,349,797 9,310,414 9,351,455 April 7,991,692 8,376,903 8,531,503 8,366,358 8,596,720 8,181,616 8,483,334 9,199,462 9,337,263 9,585,976 May 8,614,230 8,486,112 8,630,483 8,677,032 8,773,942 8,717,049 8,835,657 9,115,093 9,360,939 9,578,599 June 8,608,525 8,761,470 8,763,974 8,475,065 8,388,250 8,726,637 8,949,690 9,389,948 9,630,452 9,385,082 July 7,930,833 8,156,218 8,622,889 8,425,436 8,437,968 8,418,491 8,375,850 9,011,255 9,508,324 9,478,858 August 8,427,385 8,502,760 8,348,215 8,074,295 8,550,839 8,700,231 8,681,495 9,016,174 9,298,209 9,158,359 September 8,063,784 8,153,590 8,316,546 8,175,388 8,293,200 8,113,485 8,476,912 8,748,923 9,173,068 9,185,049 October 8,564,148 8,584,122 8,660,062 8,670,164 8,713,861 8,428,482 8,724,624 9,140,399 9,573,659 9,731,826 November 7,888,215 7,889,319 7,806,575 7,504,223 7,944,233 8,161,592 8,169,587 8,420,491 8,710,278 8,482,508 December 7,479,547 7,862,834 8,122,250 7,894,372 7,669,453 7,844,178 8,230,422 8,337,797 8,546,869 8,943,949 Total 97,089,912 97,718,528 98,240,643 96,507,025 98,676,217 99,891, ,534, ,686, ,332, ,798,902 DULLES TOLL ROAD REVENUES - MONTHLY January $ 12,029,155 $ 10,543,515 $ 11,389,551 $ 11,628,573 $ 10,053,324 $ 8,178,917 $ 7,252,137 $ 6,943,140 $ 4,985,174 $ 5,447,177 February 11,530,241 11,704,668 10,642,237 10,649,396 9,443,886 8,054,220 7,207,088 5,527,103 4,966,879 5,155,941 March 12,738,684 13,167,526 12,344,215 12,024,127 10,204,385 8,819,788 8,357,690 7,926,739 5,480,864 5,529,627 April 12,741,647 12,896,331 13,092,256 12,881,743 10,830,020 8,398,229 7,899,087 7,758,412 5,525,242 5,672,881 May 13,351,053 13,116,779 13,324,202 13,288,581 11,411,164 8,900,082 8,222,220 7,682,533 5,557,699 5,668,517 June 13,420,335 13,454,426 13,442,996 13,173,845 10,787,616 8,884,182 8,395,804 7,881,709 5,731,147 5,553,988 July 12,500,196 12,716,315 13,284,638 12,991,259 10,820,010 8,579,991 7,897,235 7,576,203 5,708,503 5,527,081 August 13,249,423 13,221,979 12,991,819 12,548,064 11,114,413 8,824,605 8,107,776 7,615,869 5,517,772 5,304,363 September 12,713,052 12,794,683 12,918,314 12,777,532 10,778,250 8,255,318 7,918,571 7,374,258 5,483,727 5,439,259 October 13,481,517 13,558,343 13,374,739 13,127,022 11,503,339 8,549,445 8,145,202 7,673,235 5,697,597 5,765,472 November 12,456,183 12,336,830 12,114,303 11,523,551 10,339,310 8,235,967 7,665,907 7,191,951 5,183,999 5,034,561 December 11,811,177 12,219,638 12,512,489 12,039,048 9,774,124 7,915,344 7,590,822 6,887,014 5,054,951 5,381,936 Total $ 152,022,663 $ 151,731,033 $ 151,431,759 $ 148,652,741 $ 127,059,841 $ 101,596,088 $ 94,659,539 $ 88,038,167 $ 64,893,554 $ 65,480,803 Notes: 1) Toll rates were adjusted in May 2005, January 2010, January 2011, January 2012, January 2013, and January ) Transactions include cash and electronic transactions, violations, and non-revenue transactions (i.e., police, emergency vehicles, military vehicles, etc.). Sources: VDOT for 2007-October 2008 data; Airports Authority Records for November
147 Exhibit S-12 TOP 10 PAYORS PAYOR United Airlines $ 133,947,096 $ 128,975,358 $ 163,582,680 $ 161,331,091 $ 200,836,207 $ 195,607,915 $ 132,761,970 $ 117,389,911 $ 97,782,264 $ 91,135,655 American Airlines 76,146,046 74,721,175 65,649,533 20,480,216 28,574,259 26,924,185 25,628,008 22,380,542 20,472,606 19,362,364 Delta Airlines 31,405,402 30,456,819 33,489,855 31,051,104 35,998,400 37,438,965 31,832,207 24,763,314 17,974,561 15,845,321 Southwest 19,415,900 20,897,539 20,455,778 12,506,395 12,571,064 * * * * * JetBlue Airways 15,908,662 15,687,679 17,104,209 11,283,876 11,108,347 11,318,923 10,399,704 * * * IAD DC Holdings, LLC 15,664,239 15,259,065 11,440,879 * * 9,890,712 10,093,319 * * 8,319,844 Dulles Duty Free, LLC 14,307,223 14,287,142 14,909,516 * * * * * * * Signature Flight Support 17,474,253 12,765,027 12,932,607 13,595,464 12,233,542 9,961,070 9,654,269 8,282,227 9,202,521 8,904,302 Rasier, LLC 17,728,518 12,162,144 * * * * * * * * In-Ter-Space Services, Inc. 16,598,211 11,049,855 * * * * * * * * US Airways * * 12,031,385 39,492,497 56,417,666 42,523,675 43,538,638 39,941,628 38,060,252 36,106,513 Hertz Rent-A-Car * * 11,493,331 10,086,569 10,441,012 11,262,291 11,749,340 12,397,487 11,751,506 10,910,269 Lufthansa German Airline * * * 9,841,438 * * * * * * JC Decaux/AK Media * * * 9,430,087 10,262,622 10,804,427 11,969,794 11,751,277 8,245,804 8,364,731 British Airways * * * * 10,259,009 9,973,602 * * * * Continental Airlines * * * * * * 9,984,056 8,267,352 8,161,420 * Vanguard Car Rental USA * * * * * * * 9,737,445 8,518,193 * Avis Rent-A-Car * * * * * * * 8,658,845 8,293,921 8,056,239 Northwest Airlines * * * * * * * * * 8,218,269 TOTAL 2 $ 358,595,550 $ 336,261,803 $ 363,089,773 $ 319,098,737 $ 388,702,128 $ 365,705,765 $ 297,611,305 $ 263,570,028 $ 228,463,048 $ 215,223,507 * Payor did not comprise top ten for the given year, and as such, revenue is not presented for comparative purposes. 1 Payors are determined based on invoiced tenant. Amounts exclude payments made by payors on behalf of other tenants per agreements between tenants. 2 Passenger facility charges and grants are excluded from amounts. Source: Airports Authority Records 139
148 Exhibit S-13 DEBT SERVICE COVERAGE AVIATION ENTERPRISE FUND NET REVENUE: Operating Revenue $ 761,563,128 $ 774,060,008 $ 761,840,377 $ 722,176,805 $ 723,023,251 Revenue Adjustments 1 (15,202,568) (18,998,524) (25,302,779) (32,095,870) (26,773,503) Prior Year Transfers 2 150,429, ,117, ,644,629 78,096,697 61,907,217 Adjusted Revenue 896,790, ,178, ,182, ,177, ,156,965 Operating Expenses 636,693, ,647, ,472, ,983, ,771,681 Operating Expenses Adjustments 3 (309,795,617) (301,882,075) (309,049,646) (296,707,434) (307,615,823) Direct Operating Expenses 326,898, ,765, ,422, ,276, ,155,858 Net Revenue Available for Debt Service 569,892, ,413, ,759, ,901, ,001,107 DEBT SERVICE 1998A Airport System Revenue Bonds B Airport System Revenue & Refunding Bonds A Airport System Revenue & Refunding Bonds A Airport System Revenue Bonds B Airport System Revenue Bonds A Airport System Revenue Bonds B Airport System Revenue Bonds C Airport System Revenue Variable Rate Refunding Bonds D Airport System Revenue Refunding Bonds A Airport System Revenue Refunding Bonds ,187, B Airport System Revenue Refunding Bonds 2,636,700 2,319, ,277, C Taxable Airport System Revenue Refunding Bonds ,956, D Airport System Revenue Variable Rate Bonds - - 2,329,969 1,735,804 1,844, A Airport System Revenue Refunding Bonds , , B Airport System Revenue Bonds ,002,346 12,008, C-1 Airport System Revenue Refunding Bonds ,895 1,564, C-2 Airport System Revenue Refunding Bonds ,832,309 4,818, D Airport System Revenue Refunding Bonds ,643,472 26,075, A Airport System Revenue Bonds ,645,260 19,838,515 20,963, B Airport System Revenue Bonds - - 1,467,322 2,516,115 2,513, C Taxable Airport System Revenue Bonds ,753 1,703,571 1,703, D Airport System Revenue Bonds , , , A Airport System Revenue Bonds - 4,163,865 7,346,516 11,201,123 11,114, B Airport System Revenue Bonds - 7,433,464 12,760,704 16,567,503 17,898, C Airport System Revenue Refunding Bonds - 1,687,918 2,893,066 2,778,070 2,947, A Airport System Revenue Bonds 8,813,330 15,092,539 15,096,013 15,085,864 15,060, B Airport System Revenue Bonds 17,045,577 30,262,154 29,367,074 30,196,961 31,674, A Airport System Revenue Bonds 19,701,855 21,030,075 17,694,731 19,765,600 20,404, A Airport System Revenue Bonds B Airport System Revenue Bonds 16,879,438 15,178,598 14,928,697 14,294,086 12,979, C Airport System Revenue Bonds D Airport System Revenue Bonds A Airport System Revenue Bonds 19,517,127 19,642,731 24,873,804 20,453,504 17,350, B Airport System Revenue Refunding Bonds 23,273,795 23,281,173 23,289,781 23,301,847 23,294, C Airport System Revenue Variable Rate Refunding Bonds 7,021,921 6,712,280 6,656,416 6,208,429 2,946, D Airport System Revenue Variable Rate Bonds 10,228,410 10,226,351 9,957,615 9,223,171 10,443, F-1 Airport System Revenue Refunding Bonds 3,062,843 3,071,721 3,064,830 3,062,716 2,513, A Airport System Revenue and Refunding Bonds 17,679,965 17,561,705 17,292,635 17,396,150 16,247, B Airport System Revenue and Refunding Bonds 15,211,048 14,075,471 12,719,610 12,208,206 11,943, C Airport System Revenue Refunding Bonds 15,421,908 15,441,560 15,468,007 14,909,398 15,339, D Airport System Revenue Refunding Bonds 777, , , , , A Airport System Revenue Refunding Bonds 22,123,765 17,497,635 13,775,073 10,565,206 9,107, B Airport System Revenue Refunding Bonds 3,926,221 3,937,013 3,976,897 4,065,535 1,733, A Airport System Revenue Refunding Bonds 4,636,247 7,041,412 6,141,396 6,760,835 2,672, B Airport System Revenue Refunding Bonds 4,469,410 3,645,642 1,318, , , C Airport System Revenue Refunding Bonds 528, , , , , A Airport System Revenue Refunding Bonds 41,583,307 39,578,905 36,226,596 14,205, A Airport System Revenue Refunding Bonds 8,140,299 8,170,115 6,688, B Airport System Revenue and Refunding Bonds 16,384,738 15,600,408 6,862, C Airport System Revenue Refunding Bonds 4,072,778 4,067,218 1,704, D Airport System Revenue Refunding Bonds 1,317,667 1,318, , A Airport System Revenue Refunding Bonds 14,482,108 7,152, B Airport System Revenue Refunding Bonds 1,167, , A Airport System Revenue Refunding Bonds 19,340,466 Series One Airport System Revenue Commercial Paper Notes ,513 99,345 Series Two Airport System Revenue Commercial Paper Notes , Variable rate fees 2,658,068 3,568, Net Debt Service $ 322,101,425 $ 320,623,606 $ 307,711,751 $ 309,882,667 $ 309,828,342 DEBT SERVICE COVERAGE Revenue adjustments are calculated in accordance with the Master Indenture of Trust to adjust for such items as non-aviation or non-o&m related entities and funds, restricted revenue, investment earnings and pension expenses with the implementation of GASB Transfers are the Signatory Airlines' share of Net Remaining Revenue as defined and calculated in accordance with the Use and Lease Agreement and transferred by the Airports Authority from the General Purpose Fund to the Airline Transfer Account. 3 Operating expense adjustments are calculated in accordance with the Master Indenture of Trust to adjust for such items as non-aviation or non-o&m related entities and funds, Federal lease, depreciation and amortization, non-cash items and pension valuation 4 Operating Expenses for 2012 have been adjusted as a result of the change in accounting principle with the implementation of GASB Statement No Operating Expenses for 2014 have been adjusted as a result of the change in accounting principle with the implementation of GASB Statement No Debt Service Coverage includes Financing Fees Sources: Master Indenture of Trust for Airport System Revenue Bonds, Use and Lease Agreement, and Airports Authority Records 140
149 $ 694,947,564 $ 663,975,831 $ 603,874,716 $ 558,453,459 $ 550,944,843 (28,946,572) (22,231,153) (28,660,133) (28,048,911) (47,420,422) 61,560,812 61,613,810 65,848,672 72,352,566 77,989, ,561, ,358, ,063, ,757, ,513, ,038, ,768, ,920, ,888, ,549,712 (365,677,287) (274,239,044) (281,071,560) (245,208,025) (296,038,710) 307,361, ,529, ,848, ,679, ,511, ,200, ,829, ,214, ,077, ,002, ,282 1,131,638 12,232,774 18,080,308 18,762, ,498,470 5,533,497 5,934,291 1,977,993 13,958,418 17,088,664 15,642,420 15,183, , , , ,309 7,032,131 10,176,763 8,959,111 8,276,261 7,647, , , , , ,736-12,988,294 15,543,684 16,894,925 19,909,292 4,036,507 6,539,153 5,735,734 5,653,245 5,138,941 11,868,132 10,759,464 9,127,960 9,204,996 9,432,168 3,650,225 4,090,647 4,093,404 4,080,345 4,044,855 3,348,217 3,351,651 3,355,828 3,346,857 3,304,686 1,399,066 1,047,095 1,329,203 3,033,369 4,610, , , , , ,543 11,895,492 11,074,530 10,932,881 8,513,411 2,687,609 1,564,952 1,564,943 2,670,647 2,304,178 13,086,451 4,815,468 4,814,541 5,042,973 4,524,687 4,951,434 26,084,526 26,087,988 26,108,986 24,379,800 14,950,296 18,197,721 19,311,222 17,455,181 18,369,390 18,734,984 2,514,469 2,517,176 1,276, , ,406 1,703,566 1,703,567 1,703,547 1,700,941 1,085, , ,489 1,427,855 1,773,881 1,758,877 11,366,225 9,012,953 5,311,454 8,392,188 5,604,803 15,874,849 14,347,548 10,644,288 9,946,372 5,746,532 2,440,111 2,259,501 2,244,344 1,903,483 1,485,981 15,108,005 15,102,592 15,072,933 13,723,351 13,816,874 28,308,735 26,508,630 19,948,918 20,751,616 14,659,468 21,072,490 12,508,425 9,151,564 2,495,585 6,964, ,568 1,777,662 3,874,659-13,007,178 11,812,024 5,874,908 3,497, ,333-8,278, ,200,444-15,766,681 13,840,460 5,703, ,327,344 22,718,966 7,594, ,686,266 3,646,635 1,077, ,593,189 10,159,919 1,765, ,845,154 3,166, , ,551,233 2,628, ,751,722 3,417, ,374,273 3,851, , , ,860, , , , , ,104 1,401, , ,862 46,916 58, , $ 312,026,358 $ 290,663,196 $ 237,068,086 $ 229,060,181 $ 204,496, Notes: The Aviation Enterprise Fund has three programs: Operating and Maintenance (O&M); Capital, Operating and Maintenance Investment Program (COMIP); and Capital Construction Program (CCP). All outstanding debt are on a Senior Lein basis and Lein requirement is This Exhibit shows debt service coverage calculations for the Aviation Enterprise Fund as defined in the Master Indenture of Trust for Airport System Revenue Bonds. The Master Indenture of Trust includes a rate covenant provision specifying that the Airports Authority will fix and adjust fees and other charges for use of the Airports Authority, including services rendered by the Airports Authority pursuant to the Airline Use Agreement and Premises Lease calculated to be at least sufficient to produce net revenues to provide for the larger of the following: (i) amounts needed for making required deposits to various accounts in the fiscal year; or (ii) an amount not less than 125 percent of the annual debt service with respect to Airport Revenue Bonds. Debt service coverage calculations for all years shown in this Exhibit exceed the minimum requirement as defined in the Master Indenture of Trust; more recent coverage levels reflect the completion of major projects in Dulles International s CCP. It is important to note that net revenue, revenue, and expenses are presented in this Exhibit in accordance with definitions found in the Master Indenture of Trust. Additionally, debt service does not include debt paid from bond funds for capitalized interest or debt service paid from interest earnings. 141
150 Exhibit S-14 DEBT SERVICE COVERAGE DULLES CORRIDOR ENTERPRISE FUND NET REVENUE Total Dulles Corridor Enterprise Fund Revenue $ 152,022,663 $ 151,731,033 $ 157,309,065 $ 148,652,741 $ 127,059,841 $ 101,603,839 $ 94,659,538 $ 88,038,168 $ 64,893,554 Less: Non Operating & Maintenance Program Revenue - - (5,891,537) - - (7,750) Total Dulles Toll Road Gross Revenue 152,022, ,731, ,417, ,652, ,059, ,596,089 94,659,538 88,038,168 64,893,554 Add: Total Investment Income 6,359,877 1,901,118 1,895,715 3,142,751 (1,854,080) 1,182,797 10,932,190 7,419,127 1,137,968 Less: Non Operating & Maintenance Program Investment Income (5,309,244) (1,640,774) (2,141,025) (2,852,609) 1,993,621 (985,573) (10,731,882) (7,287,582) (1,121,482) Revenue 153,073, ,991, ,172, ,942, ,199, ,793,313 94,859,846 88,169,713 64,910,040 Total Dulles Corridor Enterprise Fund Operating Expenses 45,608,081 44,714,514 44,626,297 48,441,763 39,925,946 34,111,704 35,205,986 34,801,734 30,094,846 Less: Non Operating & Maintenance Program Operating Expenses (16,710,659) (15,036,058) (15,712,624) (21,689,595) (12,950,640) (9,463,606) (9,877,753) (8,476,815) (4,129,722) Total Dulles Toll Road Operating Expenses 28,897,422 29,678,456 28,913,673 26,752,168 26,975,306 24,648,098 25,328,233 26,324,919 25,965,124 Less: Operating & Maintenance Program Depreciation and Amortization and GASB 68 (173,922) (590,117) (684,793) (417,498) (473,942) (273,686) (319,822) (178,113) (141,864) Operating Expenses 28,723,500 29,088,339 28,228,880 26,334,670 26,501,364 24,374,412 25,008,411 26,146,806 25,823,260 Total Dulles Corridor Enterprise Fund Interest Expense 115,391, ,524, ,617,710 63,532,479 21,467,437 19,322,104 18,060,020 31,072,729 11,414,822 Less: Non Operating & Maintenance Program Interest Expense (115,391,619) (129,524,730) (122,616,508) (63,531,144) (19,923,877) (14,338,842) (18,050,020) (31,072,113) (11,414,822) Interest Expense ,202 1,335 1,543,560 4,983,262 10, Net Revenue Available for Debt Service $ 124,349,723 $ 122,903,033 $ 122,942,136 $ 122,606,878 $ 99,154,458 $ 72,435,639 $ 69,841,435 $ 62,022,291 $ 39,086,780 DEBT SERVICE LIEN 2009A Dulles Toll Road Revenue Bonds (Current Interest Bonds) First Senior 10,142,988 10,142,988 10,142,988 10,142,988 10,142,988 10,142,988 10,142,988 10,372,412 3,686, B Dulles Toll Road Revenue Bonds (Capital Appreciation Bonds) Second Senior 6,211,394 9,502,644 11,222,500 6,765,000 9,227,500 7,445,000 1,601, C Dulles Toll Road Revenue Bonds (Convertible Capital Appreciation Bonds) Second Senior 16,235,375 4,058, D Dulles Toll Road Revenue Bonds (Current Interest Bonds, Build America Bonds) Second Senior 29,848,000 29,848,000 29,848,000 29,847,129 29,848,000 29,848,000 29,848,000 30,523,133 10,849, D Dulles Toll Road Revenue Bonds (35% Subsidy) Second Senior (9,737,922) (9,732,710) (9,684,184) (9,694,630) (9,992,364) (10,446,800) (10,446,800) (10,683,097) (3,797,329) Commercial Paper Series One Second Senior 1,783, , , , ,115 90,536 4, D Dulles Toll Road Revenue Bonds (Current Interest Bonds) Subordinate 12,000,000 12,000,000 12,000,000 12,000,000 12,000,000 12,000,000 12,000,000 7,133, D Dulles Toll Road Revenue Bonds (35% Subsidy) Subordinate (3,913,350) (3,914,400) (3,893,836) (3,897,600) (4,017,300) (4,200,000) (4,200,000) (2,496,667) A Dulles Toll Road Revenue Refunding Bonds (Current Interest Bonds) Second Senior 21,088,000 21,088,000 21,088,000 12,828, Net Debt Service $ 83,657,696 $ 73,436,654 $ 70,857,828 $ 58,181,803 $ 47,479,939 $ 44,879,724 $ 38,950,246 $ 34,849,114 $ 10,739,077 LIEN DEBT SERVICE COVERAGE BY LIEN REQUIREMENT First Senior Lien Second Senior Lien Subordinate Lien N/A Notes: The Dulles Corridor Enterprise Fund has three programs: Operating and Maintenance, Renewal & Replacement, and the Capital Improvement Program. Debt service coverage for the Dulles Corridor Enterprise Fund is calculated according to the Master Indenture of Trust for Dulles Toll Road Revenue Bonds. As such, the calculation excludes non Operating & Maintenance Program activity. The Airports Authority has covenanted in the Master Indenture that it will establish, charge, and collect Tolls for the privilege of traveling on the Dulles Toll Road at rates sufficient to meet the Operation and Maintenance Expenses and produce Net Revenues that are at least at the debt service levels set forth in the table above. If either (i) the annual budget adopted by the Airports Authority for any Fiscal Year is inadequate to meet the rate covenant for that year; or (ii) the audited financial statements regarding the Dulles Toll Road show that the Airports Authority did not satisfy the rate covenant for any Fiscal Year, then the Airports Authority is required to engage a Toll Road Consultant to conduct a study and take the actions recommended by the Toll Road Consultant. Debt service coverage calculations for all years shown in this Exhibit exceed the minimum requirement as defined in the Master Indenture; coverage levels will reflect the issuance of additional bonds as work on the Dulles Metrorail Project continues. The Dulles Corridor Enterprise did not incur any long term debt prior to It is important to note that net revenue, revenue and expenses are presented in this Exhibit in accordance with definitions found in the Master Indenture. Additionally, debt service excludes accreted interest associated with the Capital Appreciation Bonds. 1 Operating Expenses for 2012 have been adjusted as a result of the change in accounting principle with the implementation of GASB Statement No Operating Expenses for 2014 have been adjusted as a result of the change in accounting principle with the implementation of GASB Statement No. 68. Sources: Master Indenture of Trust for Dulles Toll Road Revenue Bonds and Airports Authority Records 142
151 Exhibit S-15 DEBT SERVICE REQUIREMENTS BY ENTERPRISE FUND 2017 COMPREHENSIVE ANNUAL FINANCIAL REPORT Aviation Enterprise Fund ($ in thousands) DIRECT NET REVENUES TOTAL OPERATING AVAILABLE FOR YEAR REVENUES 1 EXPENSES 2 DEBT SERVICE Principal Interest Total Coverage 2017 $ 896,790 $ 326,898 $ 569,892 $ 155,285 $ 166,816 $ 322, , , , , , , , , , , , , , , , , , , , , , , , , , , , , , , , , , , , , , , ,214 87, , , , , ,077 87, , , , , ,003 83, , , ¹ Total revenues include prior year transfers, see Exhibit S-13. ² Operating expense adjustments are calculated in accordance with the Master Indenture of Trust to adjust for such items as non-aviation or non-o&m related entities and funds, Federal lease, depreciation and amortization, and non-cash items. Dulles Corridor Enterprise Fund ($ in thousands) DIRECT OPERATING YEAR TOTAL REVENUES 3 EXPENSES 4 NET REVENUES AVAILABLE FOR DEBT SERVICE Lien Principal Interest Capital Appreciation Total Coverage First Senior $ - $ 10,143 $ - $ 10, $ 153,073 $ 28,723 $ 124,350 Second Senior 4,045 59,217 2,166 65, Subordinate - 8,087-8, First Senior $ - $ 10,143 $ - $ 10, $ 151,991 $ 29,088 $ 122,903 Second Senior 7,588 45,705 1,914 55, Subordinate - 8,086-8, First Senior $ - $ 10,143 $ - $ 10, $ 151,172 $ 28,230 $ 122,942 Second Senior 8,687 41,387 2,535 52, Subordinate - 8,106-8, First Senior $ - $ 10,143 $ - $ 10, $ 148,943 $ 26,336 $ 122,607 Second Senior 4,202 33,172 2,563 39, Subordinate - 8,102-8, First Senior $ - $ 10,143 $ - $ 10, $ 127,199 $ 28,045 $ 99,154 Second Senior 9,042 20, , Subordinate - 7,983-7, $ 101,793 $ 29,358 $ 72,436 First Senior $ - $ 10,143 $ - $ 10, Second Senior 5,745 19,492 1,700 26, Subordinate - 7,800-7, $ 94,860 $ 25,018 $ 69,841 First Senior $ - $ 10,143 $ - $ 10, Second Senior Subordinate - 7,800-7, ,170 26,147 62,022 First Senior - $ 10,372 $ - $ 10, Second Senior - 19,840-19, Subordinate - 4,637-4, ,910 25,823 39,087 First Senior - $ 3,687 $ - $ 3, Second Senior - 7,052-7, Subordinate N/A 3 Includes revenues and investment income from the Operating & Maintenance program; See Exhibit S Includes operating expenses, less depreciation and amortization, and interest expense from the Operating & Maintenance program; see Exhibit S-14. The Dulles Corridor Enterprise did not have any long term debt prior to Source: Airports Authority Records 143
152 Exhibit S-16 RATIOS OF OUTSTANDING DEBT Long-Term Debt - Aviation Enterprise Fund ($ in Thousands) Outstanding Debt by Type First Senior Lien Revenue Bonds $ 4,472,075 $ 4,546,600 $ 4,780,260 $ 4,870,030 $ 4,950,835 $ 5,036,470 $ 5,217,005 $ 5,132,360 $ 4,870,540 $ 4,109,755 Unamortized Premiums and (Discounts) 264, , , ,997 92,387 95,234 13,352 14,776 20,469 18,211 Commercial Paper Notes ,000 21,000 21,000 38,500 58, , ,500 PFC, Bank Participation Notes ,000 Total Long-Term/Short-Term Debt, Net $ 4,736,945 $ 4,755,395 $ 4,950,780 $ 5,031,027 $ 5,064,222 $ 5,152,704 $ 5,268,857 $ 5,205,636 $ 5,106,009 $ 4,777,466 Total Enplaned Passengers 23,373 22,718 22,299 21,229 21,145 21,050 20,964 20,857 20,386 20,927 Debt Per Enplanement Long-Term Debt - Dulles Corridor Enterprise Fund ($ in Thousands) Outstanding Debt by Type First Senior Lien Revenue Bonds $ 198,000 $ 198,000 $ 198,000 $ 198,000 $ 198,000 $ 198,000 $ 198,000 $ 198,000 $ 198,000 $ - Second Senior Lien Revenue Bonds 1,679,447 1,646,705 1,608,640 1,570,333 1,107,277 1,073,337 1,038, , ,339 - Subordinate Lien 150, , , , , , , ,000 - Bond Anticipation Notes ,000 Commercial Paper Notes 200, , , , , , Transportation Infrastructure Finance and Innovation Act of 1978 Loan 831, , , Full Funding Grant Agreement Note , , , , Unamortized Premium (Discount) 5,124 7,062 8,918 10,696 (4,922) (5,002) (5,079) (5,151) (5,224) - Total Long-Term/Short-Term Debt, Net $ 3,064,228 $ 2,674,251 $ 2,532,157 $ 2,249,801 $ 2,100,355 $ 1,765,885 $ 1,381,581 $ 1,341,717 $ 967,115 $ 150,000 Total Road Transactions 97,090 97,719 98,241 96,507 98,676 99, , , , ,798 Debt Per Transaction
153 INTENTIONALLY LEFT BLANK 145
154 Exhibit S-17 AIRPORT INFORMATION Ronald Reagan Washington National Airport Location: Acres: Airport Code: Three miles south from downtown Washington, D.C. along the Potomac River in Arlington County, VA 860 +/- acres DCA Runways: 1/19 7,169 feet 15/33 5,204 feet 4/22 5,000 feet Aircraft Capability: Group IV - Boeing Terminal: Terminal A 246,880 square feet Terminal B/C 994,030 square feet Total Terminal Space 1,240,910 square feet Number of Passenger Gates 44 Number of Hardstand Positions 12 Total Aircraft Positions 56 Parking: Garage Parking 6,408 spaces Electric Car Charging Stations 8 spaces Surface Parking 2,653 spaces Cell Phone Waiting Area Parking 33 spaces Total Public Parking 9,094 spaces Tenant Employee Parking 3,206 spaces Total Parking 12,300 spaces Cargo: Number of Cargo Buildings 1 Cargo Space 47,882 square feet International: Tower: Fixed Base Operators: No facilities TRACON - Vint Hill, VA - Operating 24 Hours/Day 7 Days/Week Signature Flight Support Intermodal Access: George Washington Parkway, VA State Route 233 Washington DC Metrorail System - Blue and Yellow Lines Virginia Railway Express Data as of December 31, 2017 Source: Airports Authority Records 146
155 Exhibit S-17 AIRPORT INFORMATION (continued) Washington Dulles International Airport Location: Acres: Airport Code: Twenty-six miles west from downtown Washington, D.C., located in Fairfax and Loudoun Counties, VA 11,830 +/- acres IAD Runways: 1C/19C 11,500 feet 1R/19L 11,500 feet 12/30 10,500 feet 1L/19R 9,400 feet Aircraft Capability: Group VI - Airbus A-380 Terminal: Main Terminal 1,319,845 square feet Concourse A 189,852 square feet Concourse B 942,600 square feet Concourse C/D 900,064 square feet Concourse C International Arrivals Building 57,000 square feet Z Gates 18,916 square feet International Arrivals Building 268,000 square feet Total Terminal Space 3,696,277 square feet Number of Passenger Gates 124 Maximum Aircraft Positions 163 Parking: Garage Parking 8,325 spaces Electric Car Charging Stations 8 spaces Surface Parking 15,151 spaces Cell Phone Waiting Area Parking 197 spaces Total Public Parking 23,673 spaces Tenant Employee Parking 6,847 spaces Total Parking 30,520 spaces Cargo: Number of Cargo Buildings 6 Cargo Space 554,734 square feet International: Tower: Fixed Base Operators: Customs/Immigration Federal Inspection Facility TRACON - Vint Hill, VA - Operating 24 Hours/Day 7 Days/Week Jet Aviation (Formerly IAD DC Holdings) Signature Flight Support Intermodal Access: Dulles Access Highway, VA State Routes 267 and 28 Washington Flyer Bus Service from Wiehle-Reston East Metrorail Station Metro Bus 5A - D.C. - Dulles Line Data as of December 31, 2017 Source: Airports Authority Records 147
 and the western terminus is the Dulles Greenway. 13.")
156 Exhibit S-18 DULLES TOLL ROAD INFORMATION Dulles Toll Road Location: Roadway Length: Eight-lane limited access highway that is situated on Virginia State Route 267. The Dulles Toll Road's eastern terminus is inside the Capital Beltway (Interstate 495) and the western terminus is the Dulles Greenway miles Year of Construction: 1984 Toll Collection Plazas: Mainline: 1 Exit Ramp: 19 Toll Collection Methods: Cash and Electronic Toll Collection (E-ZPass) Number of Toll Collection Lanes: 59 E-ZPass Only Collection Lanes: 29 Intersecting Roadways: Chain Bridge Road (SR 123) Wiehle Ave. (SR 828) Capital Beltway (I-495) Reston Parkway (SR 602) Spring Hill Road (SR 684) Fairfax County Parkway (SR 7100) Leesburg Pike (SR 7) Monroe Street Trap Road Centreville Road (SR 657) Hunter Mill Road (SR 674) Sully Road (SR 28) Parallel Roadways: Interstate 66 Leesburg Pike (SR 7) US Route 29 State Route 236 US Route 50 Data as of January 9, 2018 Source: Airports Authority Records 148
157 Exhibit S-19 EMPLOYMENT BY INDUSTRY Annual Average 12 Numbers of Employees (in thousands) Industry Professional Business Services Government Educational and Health Services Trade, Transportation, and Utilities Leisure and Hospitality Other Services Mining, Logging, and Construction Financial Services Information Manufacturing DC-VA-MD-WV - Metropolitan Statistical Area 3, , , , , , , , , ,003.1 Air Trade Area Employment by Sector Mining, Logging, and Construction 5% Financial Services 5% Information 2% Manufacturing 2% Professional Business Services 23% Other Services 6% Leisure and Hospitality 10% Trade, Transportation, and Utilities 12% Educational and Health Services 14% Government 21% Source: U.S Department of Labor, Bureau of Labor Statistics (Preliminary December 2017 data) 149
158 Exhibit S-20 MAJOR PRIVATE EMPLOYERS Fortune 500 Companies (By Revenue) Headquartered in the Air Trade Area Employer Fortune 500 Rank Fannie Mae $ 107,162 DC Financial Services Freddie Mac ,665 VA Financial Services Lockheed Martin Corp ,658 MD Aerospace & Defense General Dynamics Corp ,353 VA Aerospace & Defense Capital One Financial Corp ,519 VA Financial Services Northrop Grumman ,508 VA Aerospace & Defense Danaher Corp ,912 DC Technology Marriott International Inc ,072 MD Hospitality & Travel AES Corp ,287 VA Energy Hilton Worldwide Holdings Inc ,663 VA Hospitality & Travel Computer Sciences Corp ,106 VA Information Technology Leidos Holdings Inc. 381 * 7,043 VA Information Technology Discovery Communications Inc ,497 MD Mass Media & Entertainment CalAtlantic 415 * 6,477 VA Homebuilders NVR ,835 VA Homebuilders Host Hotels & Resorts Inc ,488 MD Hospitality & Travel Booz Allen Hamilton ,406 VA Professional Services $ 2017 Revenue (in $ Millions) State Industry 413,651 Seventeen Washington-area companies were on the Fortune 500 list of the country's largest companies by revenue in * Did not make the list in Major Private-Sector Employers of Metro-Area Employees Employer Number of Metro-Area Employees Industry MedStar Health 17,419 Health Care Marriott International Inc. 16,773 Hospitality & Travel Inova Health System 16,000 Health Care Booz Allen Hamilton Inc. 15,210 Professional Services Giant Food LLC 10,751 Food & Drug Stores Deloitte LLP 9,530 Professional Services CSRA Inc. 9,053 Technology Leidos Holdings Inc. 9,013 Technology Verizon Communications Inc. 8,300 Telecommunications Hilton Worldwide Holdings Inc. 8,243 Hospitality & Travel General Dynamics Corp. 7,500 Aerospace & Defense Kaiser Permanente of the Mid-Atlantic States 7,450 Health Care Children's National Health System 6,860 Health Care Accenture Federal Services 6,500 Federal Contracting Capital One Financial Corp. 6,200 Financial Services Adventist HealthCare 5,421 Health Care The Long & Foster Cos. Inc. 5,416 Real Estate Northrop Grumman Corp. 4,700 Aerospace & Defense Securitas Security Services USA Inc. 4,318 Security Engility Corp. 4,000 Federal Contracting Source: Washington Business Journal 2017 Book of Lists 150
159 Exhibit S-21 POPULATION TRENDS Annual Estimates of the Resident Population (in Thousands) JURISDICTION District of Columbia Arlington County, VA City of Alexandria, VA Central Jurisdictions 1, , , , Fairfax County, VA 1, , , , , , , , , ,004.4 Montgomery County, MD 1, , , , , Prince George's County, MD City of Fairfax, VA City of Falls Church, VA Inner Suburbs 3, , , , , , , , , ,911.1 Prince William County, VA Loudoun County, VA Frederick County, MD Charles County, MD Stafford County, VA Spotsylvania County, VA Calvert County, MD Fauquier County, VA Jefferson County, WV Warren County, VA Manassas City, VA Fredericksburg City, VA Clarke County, VA Manassas Park City, VA Outer Suburbs 1, , , , , , , , , ,565.2 DC-MD-VA-WV Metropolitan Statistical Area 6, , , , , , , , , ,394.9 Personal Income (Millions) $ 405,390 $ 391,938 $ 376,413 $ 362,511 $ 358,420 $ 347,744 $ 326,709 $ 312,522 $ 314,078 $ 306,840 Per Capital Income $ 66,733 $ 64,882 $ 62,975 $ 61,507 $ 61,743 $ 60,836 $ 58,223 $ 57,249 $ 58,577 $ 56,876 The DC-MD-VA-WVA Metropolitan Statistical Area is the Air Trade Area for the Airports Authority. Ronald Reagan Washington National Airport is located in Arlington County, VA and Washington Dulles International Airport is located in Fairfax and Loudoun Counties, VA. The Dulles Toll Road is located in Fairfax County, VA. The U.S. Census Bureau produces the estimates of each county's population, starting with the revised population estimate for the prior year. The Census Bureau then adds or subtracts the demographic components of population change (e.g., births, deaths, net migration) calculated for that period. Resident population estimates are revised annually; therefore, results above may not agree to estimates presented in prior years. The U.S. Bureau of Economic Analysis uses wages from the Bureau of Labor Statistics Quarterly Census of Employment and Wages for all four quarters to estimate annual metropolitan area personal income. Source: U.S. Census Bureau, Population Division, Release Date: January 2017; U.S. Bureau of Economic Analysis, Release Date: November
160 Exhibit S-22 AIRPORTS AUTHORITY EMPLOYEE STRENGTH Airports Authority Employee Strength Active Employees as of December 31 1,600 1,400 1,200 1, Public Safety Dulles International Airport Reagan National Airport Consolidated Functions Dulles Toll Road Dulles Rail Project Employee Strength represents the number of active employees as of the last pay period of the fiscal year. It does not include members of the Student Employment Program, which offers full-time, part-time, and seasonal employment opportunities to full and part-time students, casual employees, part time temporary employees, full time temporary employees, and the Chantilly and Pulley Partnership Programs with Fairfax County and Alexandria City Public Schools that gives opportunities to students with disabilities. The Office of Public Safety has primary responsibility for assuring public safety and security at the Airports and the Dulles Toll Road. It includes the Police Department, the Fire Department, and the Public Safety Administration Department. Consolidated Functions includes the Board Office, Executive Office, Office of Communications, Office of Finance, Office of Engineering, Office of Airline Business Development, General Counsel, Office of Audit, Office of Supply Chain Management, Office of Real Estate, Office of Marketing and Consumer Strategy, Office of Customer and Concessions Development, Office of Human Resources, and Office of Information & Telecommunications Systems. Consolidated Functions support both Airports, the Dulles Toll Road, the Dulles Metrorail Project, and Public Safety. From November 1, 2008 to September 30, 2009, the operations of the Dulles Toll Road were contracted to Virginia Department of Transportation (VDOT). On October 1, 2009, VDOT employees of the Dulles Toll Road became Airports Authority employees. Source: Airports Authority Records 152
161 Exhibit S-23 AIRCRAFT OPERATIONS BY AIRPORT REAGAN NATIONAL 2017 COMPREHENSIVE ANNUAL FINANCIAL REPORT Year Major / Nationals Regional General Aviation Military Total , ,471 3,916 3, , , ,358 3,363 3, , , ,197 3,112 3, , , ,343 3,740 2, , , ,603 5,057 2, , , ,448 6,441 1, , , ,084 5, , , ,972 4,788 1, , , ,165 5,261 1, , , ,541 4,914 1, , , ,024 5, ,433 This exhibit depicts the Airport s total operations, defined as take-offs and landings, across the top of the chart, with each year s respective component operations by carrier type shown in bar graph format Annual Aircraft Operations - Reagan National (in Thousands) Major / Nationals Regional General Aviation & Military Several factors affect the activity levels at Reagan National, including its proximity to downtown Washington, the FAA's High Density Rule, which imposes limits on the number of flights, and the Perimeter Rule, which generally limits non-stop flights to a radius of 1,250 statute miles. In addition, the Airports Authority's noise abatement program includes limitations on certain aircraft operations after 9:59pm and before 7:00am. In 2017, there were 293,097 operations, compared to an average of 283,836 from 2008 through The increase was driven by a 2012 slot transaction between Delta and US Airways, which created new service by US Airways and JetBlue. In addition, four new slots were authorized by the passage of a FAA Reauthorization Bill in 2012, which added new service and a new airline, Virgin America, at Reagan National. 153
162 Exhibit S-24 AIRCRAFT OPERATIONS BY AIRPORT DULLES INTERNATIONAL Year Major / Nationals Regional General Aviation Military Total , ,556 40, , , ,203 36, , , ,263 37, , , ,400 38, , , ,789 41, , , ,647 42, , , ,431 46, , , ,042 47, , , ,046 48, , , ,608 54, ,292 This exhibit depicts the Airport s total operations, defined as take-offs and landings, across the top of the chart, with each year s respective component operations by carrier type shown in bar graph format Annual Aircraft Operations - Dulles International (in Thousands) Major / Nationals Regional General Aviation & Military Since 2009, flight operations have declined 22.3 percent due to a decrease in domestic traffic as a result of airline industry consolidations, replacement of frequent turbo prop and regional jet flights with less frequent mainline service, and the shifting of beyond perimeter passenger demand to Reagan National as slots were opened up. In 2017, total aircraft operations declined by 0.07 percent from 2016 levels to 264,
163 INTENTIONALLY LEFT BLANK 155
164 Exhibit S-25 COMMERCIAL PASSENGER ENPLANEMENTS Year Reagan National: Domestic Passenger Enplanements Annual Growth Dulles International: Domestic Passenger Enplanements Annual Growth Industry: Domestic Passenger Enplanements Annual Growth ,763, % 7,466, % 422,290, % ,600, % 7,144, % 405,096, % ,298, % 7,139, % 392,353, % ,257, % 7,112, % 480,588, % ,993, % 7,396, % 467,885, % ,606, % 7,855, % 462,600, % ,236, % 8,261, % 460,091, % ,891, % 8,564, % 453,172, % ,634, % 8,429, % 449,388, % ,836, % 8,742, % 485,280, % Year Reagan National: International/ Transborder Passenger Enplanements Annual Growth Dulles International: International/ Transborder Passenger Enplanements Annual Growth Industry: International/ Transborder Passenger Enplanements Annual Growth , % 3,857, % 69,072, % , % 3,719, % 64,701, % , % 3,574, % 63,013, % , % 3,566, % 83,372, % , % 3,463, % 81,009, % , % 3,317, % 77,198, % , % 3,256, % 75,692, % , % 3,177, % 74,645, % , % 3,117, % 69,399, % , % 3,115, % 71,926, % Prior years' comparative information may be adjusted for additional information or to conform with current year presentation. Excludes general aviation and military enplanements. 1 Data is based on Domestic U.S. DOT T-100 Onboard Passenger Data for the following airlines: Alaska (AS), American (AA), Hawaiian (HA), JetBlue (B6), Southwest (WN), and United (UA) to emulate past A4A data that only included these airlines. All data is for the year ended November 30, Data is based on Domestic U.S. DOT T-100 Onboard Passenger Data for the following airlines: Alaska (AS), American (AA), Hawaiian (HA), JetBlue (B6), Southwest (WN), and United (UA) to emulate past A4A data that only included these airlines. All data is for the year ended August 31, Source: Airports Authority Records, Airlines for America (A4A) Monthly Traffic Report, U.S. DOT T-100 Onboard Passenger Data 156
165 Exhibit S-25 COMMERCIAL PASSENGER ENPLANEMENTS (continued) 2017 COMPREHENSIVE ANNUAL FINANCIAL REPORT Enplanements Domestic Enplanements (In Millions) Reagan National Dulles International Enplanements International / Transborder Enplanements (In Millions) Reagan National Dulles International Domestic commercial enplanements at Reagan National increased 1.4 percent in 2017 to an all-time high of nearly 11.8 million. The increase marked the eighth straight year of enplanement growth at Reagan National. The growth in passenger traffic at Reagan National passenger slowed notably in 2017 compared to 2016, when the full effect of the divestiture of 52 operating slots from US Airways/American to Southwest, JetBlue, and Virgin American was realized. International traffic accounted for approximately 1.5 percent of Reagan National's total enplanements in Total enplanements at Dulles International stabilized at 11.4 million in Domestic commercial enplanements at Dulles International increased by 4.4 percent in 2017, primarily due to increased capacity by United Airlines along with incremental growth by Frontier and Southwest. International enplanements at Dulles International of 3.9 million in 2017 represented a 3.7 percent increase over 2016 which was the 14th consecutive year of international growth. Source: Airports Authority Records 157
166 Exhibit S-26 MARKET SHARE BY LANDED WEIGHT REAGAN NATIONAL (Expressed in Thousands of Pounds) Airlines 1 Landed Weights Market Share Landed Weights Market Share Landed Weights Market Share Landed Weights Market Share American 3,463, % 3,788, % 1,427, % 1,337, % Southwest 1,748, % 1,975, % 1,945, % 799, % Republic (American Eagle) 1,466, % 1,039, % 226, % 63, % Delta 1,370, % 1,377, % 1,337, % 1,347, % PSA 1,244, % 990, % 408, % 325, % JetBlue 1,004, % 1,120, % 1,123, % 831, % United 653, % 635, % 700, % 799, % Trans States (American Connection) 411, % 11, % 3, % % Air Wisconsin (US Airways Express) 345, % 941, % 1,090, % 1,014, % Republic Airline (Delta) 296, % % % % Alaska 208, % 208, % 208, % 207, % Virgin America 193, % 186, % 185, % 81, % ExpressJet (United Express) 161, % 150, % 132, % 115, % Frontier 149, % 151, % 152, % 150, % SkyWest (United Express) 140, % 77, % 121, % 61, % GoJet (Delta Connection) 133, % 66, % 20, % % Endeavor (Delta Connection) 114, % 107, % 167, % 186, % Sky Regional (Air Canada) 106, % 107, % 108, % 107, % Republic (United Express) 87, % 109, % 41, % 49, % Signature 79, % 60, % 58, % 58, % Air Canada Jazz 73, % 64, % 67, % 64, % Mesa (United Express) 72, % 63, % 19, % % MN Airlines 44, % 86, % 90, % 88, % Envoy Air (American Eagle) 43, % 1, % 36, % 129, % Shuttle America (Delta Connection) 25, % 344, % 332, % 331, % Piedmont 9, % 23, % 29, % 56, % MN Airlines (Sun Country) 3, % % % % Shuttle America (United Express) 2, % 63, % 77, % 91, % ExpressJet (Delta Connection) 1, % 8, % 4, % 7, % SkyWest (Delta Connection) % % % % Compass (Delta Connection) % 2, % 7, % % Air Canada % % % % Mesa Airlines, Inc. (American Eagle) % % % % Elite Airways % % % % US Airways % % 2,560, % 2,528, % Eastern % % % % AirTran % % % 248, % American Eagle % % % 103, % Chautauqua (Continental Express) % % % 10, % Republic (Frontier) % % % 8, % Chautauqua (Delta Connection) % % % 6, % Other Charters % % % % Miami Air International % % % % Northwest % % % % Midwest % % % % Delta Shuttle % % % % Pinnacle (Delta Connection) % % % % Continental % % % % Chautauqua (US Airways Express) % % % % Republic (US Airways Express) % 264, % 1,215, % 1,714, % Other % % % % GRAND TOTAL 13,658, % 14,030, % 13,902, % 12,926, % 1 2 Prior years' comparative information has been modified as necessary based on revisions from carriers. Includes airlines no longer serving Reagan National or carriers with insignificant activity. Source: Airports Authority Records 158
167 Landed Weights Market Share Landed Weights Market Share Landed Weights Market Share Landed Weights 2010 Market Share Landed Weights Market Share Landed Weights Market Share 1,413, % 1,241, % 1,338, % 1,328, % 1,322, % 1,316, % 181, % 46, % % % % % 4, % % % % % % 1,398, % 1,567, % 1,639, % 1,594, % 888, % 874, % 511, % 390, % 287, % 298, % 243, % 222, % 733, % 532, % 301, % 48, % % % 938, % 647, % 593, % 688, % 727, % 702, % % % % % % % 959, % 823, % 646, % 651, % 804, % 951, % % % % % % % 209, % 174, % 156, % 154, % 156, % 157, % 49, % 19, % % % % % 77, % 93, % % % % % 193, % 356, % 412, % 211, % 154, % 153, % 6, % 7, % % % % % % % % % % % 95, % % % % % % 61, % % % % % % 45, % % % % % % 46, % 47, % 34, % 20, % 13, % 10, % 66, % 88, % 83, % 80, % 79, % 68, % % % % % % % 61, % 46, % 37, % % % % % % % % % % 262, % 313, % 315, % 317, % 354, % 49, % 67, % 47, % 19, % 19, % 7, % 19, % % % % % % % 78, % 26, % 49, % 14, % % % 50, % 18, % % % % % % % % % % % 1, % 6, % 174, % 23, % % % 42, % 100, % 99, % 100, % 94, % 112, % % % % % % % % % % % % % 2,726, % 2,664, % 2,698, % 2,867, % 2,956, % 3,349, % % % % % % % 436, % 458, % 471, % 445, % 324, % 305, % 289, % 386, % 325, % 426, % 464, % 420, % 52, % 38, % 20, % 35, % 43, % 39, % 59, % % % % % % % % % % % % % % % % % % % % % % % % % % % 48, % 802, % 884, % % % % % 47, % 275, % % % % % 38, % 537, % 99, % 172, % 151, % 32, % 11, % 8, % 83, % 397, % 357, % 357, % 386, % 479, % 68, % 209, % 174, % 161, % 101, % 88, % 1,772, % 1,550, % 1,261, % 1,209, % 985, % 886, % % 338, % 996, % 957, % 1,058, % 770, % 13,147, % 12,811, % 12,648, % 12,095, % 12,068, % 12,685, % 159
168 Exhibit S-27 MARKET SHARE BY LANDED WEIGHT DULLES INTERNATIONAL (Expressed in Thousands of Pounds) Airlines 1 Landed Weights Market Share Landed Weights Market Share Landed Weights Market Share Landed Weights Market Share United 6,313, % 6,061, % 5,850, % 6,027, % Mesa (United Express) 1,889, % 1,832, % 1,558, % 577, % Lufthansa 479, % 482, % 458, % 434, % British Airways 451, % 464, % 472, % 480, % Commutair 442, % 449, % 324, % 313, % Delta 421, % 382, % 377, % 336, % Signature 376, % 625, % 573, % 569, % American 352, % 357, % 314, % 402, % Federal Express 346, % 364, % 385, % 384, % Air France 323, % 308, % 301, % 329, % Southwest 306, % 284, % 310, % 308, % Emirates 297, % 309, % 201, % 202, % Landmark Aviation 222, % 353, % 400, % 368, % Trans States (United Express) 219, % 421, % 668, % 304, % Virgin America 217, % 230, % 232, % 220, % Qatar Airways 206, % 201, % 203, % 201, % All Nippon 203, % 202, % 202, % 202, % Korean Air 198, % 201, % 193, % 191, % Saudi Arabian 197, % 201, % 201, % 202, % JetBlue 196, % 198, % 200, % 219, % PSA 188, % 206, % 126, % 51, % Ethiopian Airlines 185, % 171, % 164, % 163, % KLM Royal Dutch 161, % 149, % 147, % 150, % South African 159, % 171, % 155, % 149, % Etihad 155, % 155, % 167, % 201, % Air China 154, % 108, % 109, % 61, % Frontier 140, % 86, % 300, % 168, % SAS 139, % 139, % 135, % 136, % Turkish Airlines 138, % 159, % 139, % 138, % Virgin Atlantic 134, % 140, % 152, % 138, % Icelandair 116, % 91, % 73, % 46, % TACA International 115, % 113, % 120, % 148, % COPA 113, % 107, % 102, % 96, % Air Wisconsin (United Express) 103, % United Parcel Service 102, % 96, % 89, % 90, % Austrian 98, % 101, % 132, % 131, % Brussels 73, % 67, % 58, % 98, % Endeavor (Delta Connection) 71, % 73, % 43, % 50, % Aer Lingus 69, % 56, % 47, % % Porter 66, % 61, % 58, % 54, % Royal Air Maroc 62, % 15, % % % Alaska 56, % 55, % 43, % % SkyWest (Delta Connection) 52, % 24, % 12, % 8, % Air Georgian 51, % 33, % % % Avianca 50, % 50, % 50, % 49, % LAN Peru SA 50, % 38, % % % Air India 40, % Aeromexico 39, % 37, % 42, % 45, % GoJet Airlines (Delta Connection) 38, % 12, % % 22, % Aeroflot 34, % 37, % 42, % 53, % Omni Air International 33, % 34, % 34, % 22, % Republic Airlines (American Eagle) 28, % % 2, % % Republic (United Express) 27, % % 20, % 284, % ExpressJet (United Express) 12, % 1, % 127, % 1,116, % ExpressJet (Delta Connection) 12, % 30, % 43, % 44, % Compass Airlines (Delta Connection) 8, % 22, % 5, % 6, % Silver Airways % 91, % 101, % 26, % Shuttle America (Delta Connection) % 29, % 58, % % Other 2 42, % 33, % 167, % 675, % GRAND TOTAL 16,793, % 16,741, % 16,510, % 16,712, % 1 2 Prior years' comparative information has been modified as necessary based on revisions from carriers. Includes airlines no longer serving Dulles International or carriers with insignificant activity. 160 Source: Airports Authority Records
169 Landed Weights Market Share Landed Weights Market Share Landed Weights 2011 Market Share Landed Weights Market Share Landed Weights Market Share Landed Weights Market Share 6,526, % 6,839, % 7,337, % 7,651, % 7,544, % 7,435, % 532, % 569, % 552, % 682, % 900, % 1,126, % 430, % 426, % 413, % 398, % 336, % 384, % 444, % 462, % 466, % 421, % 467, % 492, % 271, % 124, % % 76, % 49, % 26, % 289, % 333, % 416, % 394, % 386, % 441, % 487, % 515, % 536, % 541, % 525, % 462, % 455, % 448, % 496, % 551, % 501, % 535, % 386, % 374, % 358, % 364, % 358, % 411, % 347, % 370, % 375, % 371, % 375, % 387, % 330, % 343, % 353, % 412, % 455, % 475, % 283, % 84, % % % % % 400, % 458, % 492, % 470, % 403, % 501, % 323, % 302, % 459, % 593, % 652, % 628, % 242, % 308, % 284, % 284, % 286, % 257, % 201, % 201, % 201, % 201, % 201, % 202, % 202, % 202, % 202, % 196, % 186, % 202, % 172, % 194, % 185, % 168, % 167, % 118, % 171, % 139, % 99, % 78, % 67, % 68, % 273, % 370, % 599, % 693, % 786, % 927, % 50, % 44, % 36, % 33, % 48, % 38, % 158, % 151, % 157, % 93, % 74, % 76, % 163, % 164, % 146, % 149, % 146, % 147, % 159, % 154, % 163, % 172, % 182, % 197, % 153, % % % % % % % % % % % % % % % % % % 132, % 137, % 135, % 129, % 124, % 128, % 141, % 140, % 98, % 12, % % % 139, % 175, % 174, % 161, % 193, % 252, % 48, % 40, % 28, % % % % 127, % 116, % 116, % 102, % 100, % 118, % 94, % 51, % 48, % 42, % 43, % 41, % 87, % 84, % 86, % 83, % 68, % 86, % 106, % 107, % 108, % 107, % 107, % 142, % 52, % % % % % % 48, % % % % % % % 102, % 126, % 110, % 57, % 81, % 57, % 49, % % % % % % % % % % % % % % % % % 8, % % % 1, % 1, % % % % % % % % 49, % 49, % 35, % 35, % 36, % 19, % % % % % % % 43, % 28, % % % % % 18, % 2, % % % % % 38, % 19, % 16, % 16, % 15, % 15, % % % % % % % % % % % % % 233, % % % % % % 1,207, % 1,230, % 627, % 310, % 74, % % 38, % 30, % % % % % 73, % 86, % 78, % 87, % % % % % % % % % % % % % % 2, % 1,053, % 1,776, % 2,605, % 2,737, % 2,885, % 3,086, % 17,259, % 17,822, % 18,625, % 18,945, % 18,812, % 19,522, % 161
170 Exhibit S-28 MARKET SHARE BY PASSENGER ENPLANEMENTS REAGAN NATIONAL Airlines 1 Passenger Enplanements Market Share Passenger Enplanements Market Share Passenger Enplanements Market Share Passenger Enplanements Domestic American 3,104, % 3,265, % 1,434, % 1,326, % Southwest 1,742, % 1,720, % 1,526, % 602, % Delta 1,315, % 1,291, % 1,227, % 1,218, % JetBlue 915, % 953, % 936, % 698, % United 545, % 536, % 565, % 621, % Alaska 211, % 217, % 216, % 211, % Republic Airline (Delta) 187, % % % % Frontier 172, % 175, % 165, % 159, % Virgin America 139, % 120, % 126, % 59, % MN Airlines 32, % 57, % 56, % 53, % Elite Airways % % % % US Airways % % 1,963, % 1,842, % AirTran % % % 210, % Continental % % % % Northwest % % % % Midwest % % % % Delta Shuttle % % % % ATA % % % % America West % % % % Other % % % % Regionals Republic (American Eagle) 1,138, % 824, % 173, % 50, % PSA 968, % 756, % 330, % 267, % Trans States (American Connection) 354, % 11, % 4, % % Air Wisconsin (US Airways Express) 279, % 741, % 898, % 783, % SkyWest (United Express) 135, % 68, % 107, % 53, % ExpressJet (United Express) 127, % 126, % 106, % 97, % GoJet (Delta Connection) 98, % 42, % 14, % % Endeavor (Delta Connection) 91, % 87, % 135, % 144, % Republic (United Express) 69, % 94, % 38, % 38, % Mesa (United Express) 64, % 56, % 17, % % Envoy Air (American Eagle) 31, % 1, % 28, % 102, % Shuttle America (Delta Connection) 25, % 181, % 171, % 171, % Piedmont 6, % 15, % 21, % 39, % Shuttle America (United Express) 1, % 48, % 60, % 69, % ExpressJet (Delta Connection) 1, % 7, % 3, % 7, % SkyWest (Delta Connection) % % % % Republic (US Airways Express) % 194, % 959, % 1,328, % Compass (Delta Connection) % 2, % 6, % % Mesaba Aviation (American Eagle) % % % % American Eagle % % % 82, % Chautauqua (Continental Express) % % % 7, % Republic (Frontier) % % % 5, % Chautauqua (Delta Connection) % % % 3, % Pinnacle (Delta Connection) % % % % Chautauqua (US Airways Express) % % % % Comair (Delta Connection) % % % % ASA (Delta Connection) % % % % Continental Express % % % % Colgan Air (Continental Connection) % % %. 0.00% Colgan Air (United Express) % % % % SkyWest (Continental Connection) % % % % Colgan Air (US Airways Express) % % % % Mesaba Aviation (Delta Connection) % % % % Republic (Midwest Connect) % % % % Mesaba Aviation (Northwest Airlink) % % % % Pinnacle (Northwest Airlink) % % % % Freedom (Delta Connection) % % % % Charters % % % % General Aviation 14, % 9, % 10, % 9, % Military 5, % 3, % 3, % 3, % TOTAL DOMESTIC 11,783, % 11,613, % 11,312, % 10,270, % Transborder / International American Airlines 7, % JetBlue 2, % 9, % 23, % 13, % Air Canada % % % % Regionals Sky Regional (Air Canada) 84, % 81, % 82, % 77, % Air Canada Jazz 58, % 47, % 47, % 41, % Trans States (American Connection) 23, % Air Wisconsin (US Airways Express) 3, % 25, % 26, % 46, % Republic (American Eagle) 1, % % % % PSA Airlines, Inc % US Airways % , % 15, % Republic (US Airways Express) % 2, % 4, % 6, % Envoy % % 1, % % TOTALTRANSBORDER/INTERNATIONAL 182, % 166, % 197, % 201, % GRAND TOTAL 11,966, % 11,780, % 11,509, % 10,471, % 1 Prior years' comparative information has been modified as necessary based on revisions from carriers. 2 Includes airlines no longer serving Reagan National or carriers with insignificant activity. Source: Airports Authority Records Market Share 162
171 2013 Passenger Enplanements Market Share Passenger Enplanements Market Share Passenger Enplanements Market Share Passenger Enplanements Market Share Passenger Enplanements Market Share Passenger Enplanements Market Share 1,222, % 1,139, % 1,194, % 1,188, % 1,143, % 1,158, % 163, % 42,037 `` % % % % 1,161, % 1,269, % 1,251, % 1,253, % 728, % 726, % 611, % 447, % 240, % 37, % % % 676, % 486, % 468, % 532, % 522, % 518, % 205, % 171, % 155, % 149, % 144, % 146, % % % % % % % 190, % 323, % 357, % 204, % 158, % 156, % 38, % 11, % % % % % 40, % 34, % 26, % % % % % 2,000, % 1,902, % 1,850, % 1,927, % 1,929, % 2,132, % 338, % 383, % 389, % 381, % 263, % 249, % 61, % 299, % 269, % 291, % 303, % 325, % % % % 28, % 581, % 669, % % % % % 32, % 174, % % % % % 13, % 206, % % 98, % 146, % 240, % 117, % 106, % 3, % % % % % % 404, % 291, % 203, % 215, % 168, % 147, % % % % % % % 670, % 538, % 450, % 446, % 567, % 670, % 4, % 5, % % % % % 59, % 77, % % % % % % % % % % % 65, % % % % % % 30, % % % % % % % % % % % % % % % % % % 127, % 146, % 148, % 164, % 168, % 23, % 50, % 32, % 10, % 12, % 4, % 12, % 58, % 18, % 37, % 10, % % % 31, % 13, % % % % % % % % % % % 1,337, % 1,131, % 915, % 907, % 733, % 630, % % 4, % 128, % 20, % % % % 215, % 288, % 226, % 292, % 331, % 268, % 43, % 30, % 14, % 29, % 32, % 34, % 49, % % % % % % % 24, % 46, % 2, % 6, % 9, % 77, % 116, % 98, % 21, % 7, % 7, % 54, % 166, % 125, % 123, % 77, % 64, % % 66, % 147, % 206, % 250, % 190, % % 15, % 138, % 31, % 2, % 4, % % 11, % 62, % 55, % 61, % 58, % % 8, % 32, % 44, % 44, % 19, % % 3, % % % % % % 2, % 8, % % % % % % 15, % 15, % 13, % 13, % % % 77, % 41, % % % % % % 10, % 147, % 20, % % % % 4, % 29, % 4, % % % % % 47, % 58, % % % % % % 24, % % % % % % % 7, % 6, % 5, % 3, % 1, % 1, % 3, % 5, % 5, % 3, % 2, % 2, % 10,005, % 9,619, % 9,247, % 8,897, % 8,638, % 8,840, % % % % % % % 25, % 58, % 58, % 63, % 54, % 65, % 44, % % % % % % 38, % 45, % 46, % 45, % 42, % 38, % 66, % 46, % % % % % % % % % % % 16, % 15, % 11, % 35, % 35, % 38, % 12, % 14, % 8, % % % % % % % % % % 204, % 181, % 126, % 144, % 133, % 141, % 10,209, % 9,800, % 9,373, % 9,042, % 8,771, % 8,982, % 163
172 Exhibit S-29 MARKET SHARE BY PASSENGER ENPLANEMENTS DULLES INTERNATIONAL Passenger Enplanement Market Share Passenger Enplanement Market Share Passenger Enplanement Market Share Passenger Enplanements Domestic United 3,438, % 3,142, % 2,890, % 2,866, % Delta 349, % 312, % 314, % 277, % American 317, % 327, % 294, % 353, % Southwest 283, % 258, % 265, % 269, % Virgin America 184, % 190, % 187, % 187, % JetBlue 153, % 160, % 155, % 182, % Frontier 143, % 89, % 306, % 159, % Alaska 53, % 50, % 38, % % Other % 29, % 71, % 10, % Regionals Mesa (United Express) 1,525, % 1,448, % 1,249, % 449, % Commutair 383, % 409, % 285, % 266, % Trans States (United Express) 180, % 372, % 600, % 285, % PSA 150, % 169, % 113, % 45, % Air Wisconsin (United Express) 89, % % % % Endeavor (Delta Connection) 60, % 60, % 39, % 43, % SkyWest (Delta Connection) 45, % 22, % 11, % 7, % GoJet (Delta Connection) 30, % 9, % % 16, % Rebublic (American Eagle) 22, % % 1, % % Republic (United Express) 14, % 7, % 19, % 244, % ExpressJet (United Express) 11, % % 112, % 916, % Other 2 24, % 75, % 171, % 521, % Charters 2, % 4, % 6, % 6, % General Aviation 81, % 71, % 73, % 76, % Military % % % % TOTAL DOMESTIC 7,547, % 7,216, % 7,212, % 7,188, % Transborder/International United 1,325, % 1,304, % 1,323, % 1,372, % Lufthansa 222, % 212, % 208, % 199, % British Airways 183, % 192, % 198, % 193, % Air France 164, % 152, % 153, % 158, % Emirates 125, % 129, % 101, % 97, % TACA International 114, % 106, % 106, % 124, % COPA 106, % 94, % 77, % 71, % Ethiopian Airlines 98, % 80, % 85, % 88, % Qatar Amiri Air 93, % 104, % 99, % 95, % KLM Royal Dutch 92, % 85, % 84, % 82, % Turkish Airlines 88, % 95, % 90, % 90, % Icelandair 85, % 68, % 55, % 39, % Korean Air 80, % 79, % 77, % 78, % South African 75, % 74, % 65, % 67, % All Nippon 72, % 70, % 68, % 64, % Etihad 70, % 71, % 70, % 76, % Virgin Atlantic 66, % 65, % 65, % 66, % SAS 66, % 66, % 64, % 69, % Air China 61, % 44, % 42, % 22, % Saudi Arabian 60, % 65, % 69, % 72, % Austrian 54, % 59, % 75, % 75, % Aer Lingus 50, % 37, % 27, % % Avianca 41, % 36, % 36, % 38, % Brussels 35, % 28, % 25, % 34, % Aeromexico 30, % 27, % 30, % 33, % LAN Peru SA 29, % 21, % % % Royal Air Maroc 26, % 7, % Aeroflot 19, % 20, % 19, % 21, % Air India 17, % % % % Other 2 4, % 4, % 8, % 2, % Regionals Airlines 1 Mesa (United Express) 152, % 194, % 142, % 39, % Porter 55, % 52, % 41, % 38, % Air Georgian 43, % 27, % % % Trans States (United Express) 28, % 28, % 46, % % Other 2 7, % % 5, % 147, % Charters 6, % 6, % 6, % 5, % General Aviation 1, % 1, % 1, % 1, % Military % % % % TOTAL TRANSBORDER/INTERNATIONAL 3,859, % 3,721, % 3,576, % 3,568, % GRAND TOTAL 11,407, % 10,937, % 10,788, % 10,757, % Market Share 1 2 Prior years' comparative information has been modified as necessary based on revisions from carriers. Includes airlines no longer serving Dulles International or carriers with insignificant activity. Source: Airports Authority Records 164
173 Passenger Enplanements Market Share Passenger Enplanements Market Share Passenger Enplanements Market Share Passenger Enplanements Market Share Passenger Enplanements Market Share Passenger Enplanements Market Share 3,132, % 3,112, % 3,264, % 3,430, % 3,286, % 3,312, % 231, % 271, % 324, % 317, % 296, % 333, % 356, % 388, % 427, % 464, % 409, % 435, % 289, % 308, % 321, % 374, % 371, % 396, % 191, % 241, % 235, % 231, % 237, % 194, % 225, % 321, % 495, % 576, % 625, % 730, % % % % % % % % % % % % % % 130, % 196, % 158, % 212, % 415, % 445, % 471, % 440, % 549, % 719, % 906, % 211, % 100, % % 46, % 30, % 15, % 295, % 283, % 349, % 445, % 566, % 545, % 44, % 40, % 33, % 31, % 42, % 32, % % % % % % % 41, % % % % % % 7, % % % 1, % 1, % % 9, % 1, % % % % % % % % % % % 206, % 4, % % % % % 940, % 1,000, % 523, % 277, % 62, % % 756, % 1,169, % 1,632, % 1,651, % 1,556, % 1,413, % 9, % 10, % 12, % 10, % 10, % 9, % 73, % 73, % 70, % 72, % 66, % 84, % % % % % % % 7,470, % 7,928, % 8,332, % 8,637, % 8,496, % 8,827, % 1,401, % 1,372, % 1,439, % 1,451, % 1,443, % 1,401, % 203, % 186, % 174, % 176, % 158, % 173, % 186, % 192, % 190, % 173, % 182, % 189, % 172, % 173, % 173, % 161, % 181, % 176, % 88, % 23, % % % % % 103, % 99, % 103, % 98, % 95, % 101, % 90, % 99, % 101, % 103, % 88, % 85, % 82, % 74, % 47, % 5, % % % 66, % 41, % 35, % 31, % 31, % 30, % 85, % 89, % 77, % 74, % 79, % 78, % 81, % 74, % 80, % 56, % 42, % 44, % 77, % 83, % 83, % 78, % 72, % 57, % 74, % 71, % 78, % 80, % 73, % 82, % 53, % % % % % % 62, % 65, % 62, % 66, % 60, % 62, % 35, % 30, % 20, % % % % 68, % 68, % 65, % 71, % 66, % 71, % 61, % 48, % 35, % 28, % 23, % 20, % 69, % 75, % 75, % 76, % 84, % 95, % 64, % 65, % 60, % 60, % 63, % 80, % % % % % % % % % % % % % 37, % 35, % 24, % 24, % 23, % 12, % 19, % % % % % % 30, % 18, % % % % % % % % % % % % % % % % % 19, % 10, % 8, % 8, % 7, % 8, % 2, % 110, % 63, % 32, % 76, % 84, % % % % % % % 33, % 24, % % % % % % % 63, % 81, % % % % % % % % % 187, % 175, % 178, % 222, % 250, % 253, % 5, % 7, % 9, % 10, % 11, % 4, % 1, % 2, % 1, % % % % % % % % % 1, % 3,465, % 3,320, % 3,258, % 3,178, % 3,117, % 3,117, % 10,936, % 11,248, % 11,590, % 11,815, % 11,614, % 11,944, % 165
174 Exhibit S-30 MARKET SHARE BY PASSENGER ENPLANEMENTS BOTH AIRPORTS Domestic Airlines 1 Passenger Enplanement Market Share Passenger Enplanement Market Share Passenger Enplanement Market Share Passenger Enplanement Market Share Passenger Enplanement United 3,984, % 3,679, % 3,456, % 3,487, % 3,809, % American 3,422, % 3,592, % 1,729, % 1,680, % 1,579, % Southwest 2,026, % 1,979, % 1,791, % 872, % 453, % Delta 1,665, % 1,604, % 1,541, % 1,495, % 1,392, % JetBlue 1,069, % 1,113, % 1,092, % 881, % 837, % Virgin America 323, % 310, % 314, % 246, % 229, % Alaska 265, % 267, % 255, % 211, % 205, % Republic Airline (Delta) 187, % Frontier 315, % 265, % 471, % 318, % 190, % MN Airlines 32, % 57, % 56, % 53, % 40, % US Airways % % 1,998, % 1,842, % 2,001, % Other % % 36, % 220, % 400, % Regionals Mesa (United Express) 1,590, % 1,504, % 1,267, % 489, % 445, % PSA 1,119, % 926, % 444, % 313, % 449, % Republic (American Eagle) 1,161, % 825, % 175, % 50, % 3, % Trans States (American Connection) 354, % Air Wisconsin (US Airways Express) 279, % 741, % 898, % 783, % 671, % Air Wisconsin (United Express) 89, % Commutair 383, % 409, % 285, % 266, % 211, % GoJet (Delta Connection) 129, % Trans States (United Express) 180, % 372, % 600, % 285, % 295, % Shuttle America (Delta Connection) 25, % 209, % 228, % 171, % 127, % Republic (US Airways Express) 0.00% 194, % 961, % 1,330, % 1,339, % Endeavor (Delta Connection) 152, % 147, % 174, % 188, % 106, % ExpressJet (United Express) 138, % 126, % 219, % 1,013, % 999, % Republic (United Express) 83, % 102, % 58, % 283, % 237, % SkyWest (United Express) 136, % 68, % 108, % 127, % 102, % Shuttle America (United Express) 7, % 50, % 65, % 158, % 228, % Mesa (US Airways Express) % % 63, % 127, % 123, % Other 2 104, % 189, % 134, % 503, % 899, % 0 00% Chartered 2, % 4, % 6, % 6, % 9, % General Aviation 96, % 81, % 83, % 85, % 80, % Military 5, % 3, % 3, % 3, % 3, % TOTAL DOMESTIC 19,331, % 18,830, % 18,524, % 17,500, % 17,475, % Transborder / International United 1,325, % 1,304, % 1,323, % 1,372, % 1,401, % Lufthansa 222, % 212, % 208, % 199, % 203, % British Airways 183, % 192, % 198, % 193, % 186, % Air France 164, % 152, % 153, % 158, % 172, % Emirates 125, % 129, % 101, % 97, % 88, % TACA International 114, % 106, % 106, % 124, % 103, % Qatar Amiri Air 93, % 104, % 99, % 95, % 90, % Turkish Airlines 88, % 95, % 90, % 90, % 82, % COPA 106, % 94, % 77, % 71, % 66, % KLM Royal Dutch 92, % 85, % 84, % 82, % 85, % Ethiopian Airlines 98, % 80, % 85, % 88, % 81, % Korean Air 80, % 79, % 77, % 78, % 77, % South African 75, % 74, % 65, % 67, % 74, % Etihad 70, % 71, % 70, % 76, % 53, % All Nippon 72, % 70, % 68, % 64, % 62, % Icelandair 85, % 68, % 55, % 39, % 35, % SAS 66, % 66, % 64, % 69, % 68, % Saudi Arabian 60, % 65, % 69, % 72, % 61, % Virgin Atlantic 66, % 65, % 65, % 66, % 69, % Air China 61, % 44, % 42, % 22, % % Austrian 54, % 59, % 75, % 75, % 64, % Aer Lingus 50, % 37, % 27, % % % Other 2 215, % 156, % 144, % 159, % 150, % Market Share Regionals Mesa (United Express) 152, % 194, % 142, % % % Sky Regional (Air Canada) 84, % 81, % 82, % 77, % 44, % Air Canada Jazz 66, % 47, % 47, % 41, % 38, % Porter 55, % 52, % 41, % 38, % 33, % Other 2 102, % 84, % 96, % 199, % 266, % Chartered 6, % 6, % 6, % 5, % 5, % General Aviation 1, % 1, % 1, % 1, % 1, % Military % % % % % TOTAL TRANSBORDER INTERNATIONAL 4,042, % 3,888, % 3,774, % 3,728, % 3,669, % GRAND TOTAL 23,373, % 22,718, % 22,298, % 21,228, % 21,145, % 1 2 Prior years' comparative information has been modified as necessary based on revisions from carriers. Includes airlines with insignificant activity. Source: Airports Authority Records 166
175 Passenger Enplanement Market Share Passenger Enplanement Market Share Passenger Enplanement Market Share Passenger Enplanement Market Share Passenger Enplanement Market Share 3,598, % 3,732, % 3,962, % 3,809, % 3,831, % 1,527, % 1,622, % 1,653, % 1,553, % 1,594, % 350, % 321, % 374, % 371, % 396, % 1,540, % 1,575, % 1,570, % 1,024, % 1,059, % 768, % 735, % 613, % 625, % 730, % 252, % 235, % 231, % 237, % 194, % 171, % 155, % 149, % 144, % 146, % 323, % 357, % 204, % 158, % 156, % 34, % 26, % 14, % 15, % 20, % 1,902, % 1,864, % 1,950, % 1,964, % 2,229, % 912, % 988, % 1,063, % 1,473, % 2,030, % 471, % 440, % 549, % 719, % 906, % 331, % 237, % 246, % 211, % 179, % % % % % % 547, % 464, % 453, % 567, % 670, % 100, % % 46, % 30, % 15, % 283, % 349, % 445, % 566, % 545, % 146, % 148, % 164, % 168, % 25, % 1,132, % 916, % 907, % 739, % 631, % % % % % % 1,078, % 523, % 277, % 62, % % 4, % % % % % 87, % 67, % 33, % % % 178, % 211, % 318, % 372, % 369, % 98, % 84, % 86, % 86, % 50, % 1,608, % 2,424, % 2,129, % 2,150, % 1,784, % 10, % 12, % 10, % 10, % 10, % 80, % 75, % 75, % 68, % 86, % 6, % 5, % 3, % 3, % 3, % 17,548, % 17,579, % 17,534, % 17,135, % 17,668, % 1,372, % 1,439, % 1,451, % 1,443, % 1,401, % 186, % 174, % 176, % 158, % 173, % 192, % 190, % 173, % 182, % 189, % 173, % 173, % 161, % 181, % 176, % 23, % % % % % 99, % 103, % 98, % 95, % 101, % 99, % 101, % 103, % 88, % 85, % 74, % 47, % 5, % % % 41, % 35, % 31, % 31, % 30, % 89, % 77, % 74, % 79, % 78, % 74, % 80, % 56, % 42, % 44, % 83, % 83, % 78, % 72, % 57, % 71, % 78, % 80, % 73, % 82, % % % % % % 65, % 62, % 66, % 60, % 62, % 30, % 20, % % % % 68, % 65, % 71, % 66, % 71, % 48, % 35, % 28, % 23, % 20, % 75, % 75, % 76, % 84, % 95, % % % % % % 65, % 60, % 60, % 63, % 80, % 49, % 60, % 54, % 27, % 33, % 200, % 169, % 191, % 170, % 175, % % % % % % % % % % % 45, % 57, % 86, % 86, % 87, % 24, % % % % % 237, % 177, % 184, % 208, % 203, % 7, % 9, % 10, % 11, % 4, % 2, % 1, % % % % % % % % 1, % 3,501, % 3,384, % 3,322, % 3,251, % 3,258, % 21,049, % 20,963, % 20,857, % 20,386, % 20,927, % 167
176 Exhibit S-31 MARKET SHARE BY ENPLANED CARGO WEIGHT REAGAN NATIONAL (Expressed in Pounds) Airlines 1 Cargo Market Cargo Market Cargo Weight Share Weight Share Weight Market Share Cargo Weight Market Share Domestic American 2,441, % 1,112, % 1,224, % 741, % Southwest 372, % 344, % 209, % 57, % Delta 299, % 369, % 445, % 340, % United 92, % 128, % 150, % 93, % Alaska 91, % 46, % 33, % 36, % MN Airlines 79, % 64, % 36, % 2, % US Airways % % 1,561, % 1,313, % Frontier % % % % Continental % % % % Federal Express % % % % Republic (Midwest) % % % % Northwest % % % % Midwest % % % % Air Canada % % % % Regional PSA 450, % 282, % 196, % 196, % Trans States Airlines (American Connection) 101, % % % % Air Wisconsin (US Airways Express) 79, % 228, % 209, % 196, % American Eagle 19, % % % 1, % Piedmont 1, % 1, % 2, % 7, % Envoy Air (American Eagle) 1, % % 2, % 1, % SkyWest (Continental Connection) % % % % Chautauqua (Continental Express) % % % % Continental Express % % % % Republic (Midwest Connect) % % % % Mesaba Aviation (Northwest Airlink) % % % % Pinnacle (Northwest Airlink) % % % % Other % % % % TOTAL DOMESTIC 4,030, % 2,578, % 4,072, % 2,989, % Air Carrier - Chartered % % 6, % % Regional % % 1, % 1, % TOTAL TRANSBORDER/INTERNATIONAL % % 8, % 1, % GRAND TOTAL 4,030, % 2,579, % 4,081, % 2,990, % Prior years' comparative information has been modified as necessary based on revisions from carriers. Includes airlines no longer serving Reagan National or carriers with insignificant activity. Source: Airports Authority Records 168
177 Cargo Weight Market Share Cargo Weight Market Share Cargo Weight Market Share Cargo Weight Market Share Cargo Weight Market Share Cargo Weight Market Share 613, % 987, % 1,115, % 347, % 438, % 357, % % % % % % % 360, % 429, % 344, % 286, % 156, % 95, % 78, % 3, % 10, % 18, % 16, % 17, % 79, % 47, % 50, % 113, % 97, % 106, % % % % % % % 399, % 714, % 543, % 618, % 554, % 642, % 502, % 690, % 428, % 863, % 499, % 19, % 8, % 133, % 95, % 157, % 110, % 156, % % 809, % 779, % 910, % 549, % 313, % % % % 28, % % % % % % 21, % 85, % 83, % % % % % 11, % 102, % % % % % % % 272, % 96, % 135, % 82, % 56, % 23, % % % % % % % 159, % 112, % 124, % 73, % 63, % 43, % 6, % 7, % % % % % 3, % 1, % % % % % % % % % % % % % % % % % % % % 1, % 1, % 7, % % % % 5, % 8, % 20, % % % % 2, % 39, % 9, % % % % % % % % % % % 1, % 4, % % % % % % % 2,483, % 4,034, % 3,630, % 3,532, % 2,692, % 2,005, % % % % % % 39, % 2, % % % % % % 2, % % % % % 39, % 2,486, % 4,034, % 3,630, % 3,532, % 2,692, % 2,045, % 169
178 Exhibit S-32 MARKET SHARE BY ENPLANED CARGO WEIGHT DULLES INTERNATIONAL (Expressed in Pounds) Airlines 1 Cargo Weight Market Share Cargo Weight Market Share Cargo Weight Market Share Cargo Weight Market Share Cargo Weight Market Share Domestic Federal Express 68,954, % 68,205, % 70,422, % 72,447, % 73,530, % United 21,320, % 19,714, % 22,698, % 16,255, % 16,431, % United Parcel Service 15,214, % 15,163, % 15,077, % 14,099, % 11,766, % Delta 968, % 877, % 849, % 387, % 498, % American 593, % 414, % 402, % 428, % 637, % Southwest 346, % 283, % 270, % 250, % 402, % Aeroflot Soviet Airlines 56, % Mountain Air Cargo 33, % Alaska Airlines 15, % 14, % 6, % % % British Airways % JetBlue % % 1, % 2, % 13, % ABX Air % % % % 53, % Other % % % % % Regionals 0.00% PSA 2, % 353, % 74, % 29, % 36, % Air Wisconsin (US Airways Express) % % % % 2, % Other % % % % % Air Carrier -- Chartered 0.00% Kalitta Air 122, % 218, % % % 100, % Atlas Air 57, % 246, % % 156, % 113, % Mountain Air Cargo 32, % 2, % 3, % 14, % 194, % Antonov 0 12, % % % 189, % Volga-Dnepr % % 20, % % % Miami Air International % % % % % Other % % % % % Military 13, % % % % % TOTAL DOMESTIC 107,732, % 105,506, % 109,826, % 104,073, % 103,970, % Transborder/International United 44,897, % 38,195, % 42,725, % 46,312, % 39,792, % Lufthansa 12,156, % 12,353, % 10,395, % 9,170, % 9,340, % Qatar Airways 12,156, % 9,847, % 10,110, % 12,337, % 11,323, % All Nippon 11,798, % 11,090, % 10,506, % 10,681, % 9,298, % British Airways 7,670, % 7,131, % 7,100, % 11,437, % 11,043, % Korean Air 6,990, % 4,752, % 4,776, % 2,875, % 2,361, % Virgin Atlantic 6,034, % 6,281, % 5,916, % 5,724, % 6,344, % Air France 5,680, % 3,538, % 2,687, % 2,974, % 3,168, % Etihad 5,038, % 4,345, % 6,056, % 6,942, % 5,177, % SAS 4,734, % 4,301, % 3,505, % 3,480, % 3,087, % Emirates 4,072, % 6,408, % 6,888, % 10,480, % 8,872, % Saudi Arabian 4,055, % 3,708, % 5,260, % 5,565, % 4,529, % South African 3,748, % 3,361, % 3,506, % 4,877, % 5,693, % Turkish Airlines 3,253, % 3,246, % 3,637, % 4,545, % 3,526, % Air China 2,498, % 1,272, % 2,171, % 1,745, % % KLM Royal Dutch 2,267, % 3,428, % 3,339, % 5,211, % 3,789, % Ethiopian Airlines 1,818, % 1,477, % 1,568, % 1,437, % 842, % Austrian 1,791, % 1,894, % 2,473, % 2,849, % 2,460, % Federal Express 1,007, % 418, % % % % United Parcel Service 866, % 839, % 643, % 354, % 17, % Brussels 805, % 738, % 1,639, % 1,808, % 836, % LAN Peru SA 789, % 392, % % % % Royal Air Maroc 527, % COPA 215, % 129, % 229, % 329, % 330, % TACA International 163, % 118, % 220, % 118, % 169, % Air India 149, % Icelandair 31, % 33, % 50, % 39, % 24, % Aer Lingus 15, % 24, % 592, % % % Avianca 9, % 22, % 38, % 83, % 26, % Aeroflot % 3, % 20, % 46, % 46, % Other % % % % % All Cargo Charters Kalitta Air 251, % 101, % 510, % 176, % % Ryan Airlines/Gold Transportation 11, % Atlas Air % 164, % 300, % 16, % 308, % Air Transport International % % % % 15, % Antonov % % % % 283, % Evergreen International % % % % 258, % Volga-Dnepr % % % 78, % 421, % Other % % % % % 0.00% Military 881, % 644, % 1,068, % 526, % 1,027, % TOTAL TRANSBORDER/INTERNATIONAL 146,385, % 130,266, % 137,943, % 152,227, % 134,420, % GRAND TOTAL 254,118, % 235,773, % 247,769, % 256,300, % 238,391, % 1 Prior years' comparative information has been modified as necessary based on revisions from carriers. 2 Includes airlines no longer serving Dulles International or carriers with insignificant activity. Source: Airports Authority Records 170
179 Cargo Weight Market Cargo Weight Market Cargo Weight Market Cargo Weight Market Cargo Weight Market Share Share Share Share Share 73,713, % 74,823, % 76,889, % 83,793, % 82,766, % 27,840, % 34,373, % 45,511, % 38,771, % 40,833, % 14,242, % 12,291, % 10,519, % 8,304, % 8,582, % 482, % 556, % 539, % 399, % 420, % 686, % 793, % 1,091, % 1,289, % 2,264, % 417, % 423, % 316, % 271, % 560, % % % % % 0.00% 0.00% 21, % 209, % 386, % 455, % 678, % % % % 119, % 11,811, % 367, % 1,886, % 2,909, % 2,197, % 1,224, % 43, % 27, % 47, % 29, % 20, % 3, % 6, % 10, % % % 2, % 1, % 2, % 9, % 1,189, % % % % % % % 106, % % % % % % 121, % 8, % % % % % % % 182, % % % % % % % % % % 61, % % % % 31, % % 4, % % % % 118,065, % 125,505, % 138,345, % 135,651, % 150,383, % 54,935, % 82,974, % 99,578, % 85,576, % 94,114, % 10,004, % 8,568, % 10,568, % 16,741, % 19,296, % 11,776, % 12,548, % 13,088, % 12,546, % 12,987, % 9,405, % 9,915, % 8,964, % 7,120, % 10,093, % 11,882, % 12,424, % 13,277, % 14,530, % 14,539, % 2,013, % 1,037, % 681, % 631, % 348, % 6,523, % 7,601, % 8,028, % 6,908, % 9,891, % 4,945, % 10,212, % 11,019, % 6,913, % 8,659, % % % % % % 3,612, % 5,458, % 7,756, % 5,502, % 6,208, % 1,580, % % % % % 3,170, % 906, % 1,423, % 619, % 697, % 6,395, % 6,367, % 6,655, % 4,687, % 3,797, % 2,945, % 1,095, % 6, % % % % % % % % 3,794, % 4,721, % 3,388, % 4,164, % 5,766, % 970, % 964, % 763, % 571, % 722, % 2,728, % 4,210, % 5,083, % 5,371, % 7,344, % % % 45, % % % % % % % % % % % % % % % % % % 46, % 67, % 44, % 46, % 10, % 235, % 391, % 387, % 452, % 624, % 12, % 12, % % % % 914, % 3,242, % 2,253, % 705, % 1,129, % 8, % % 3, % 15, % % 80, % 26, % % 7, % 77, % 5, % 156, % 641, % 1,388, % 243, % 126, % % % % % 563, % % % % 156, % % 14, % 59, % 62, % % % % % % 760, % 225, % % 220, % % 91, % % % % % 20, % % % % 50, % 969, % 802, % 1,031, % 950, % 1,569, % 140,227, % 174,464, % 194,220, % 174,983, % 199,381, % 258,292, % 299,970, % 332,565, % 310,635, % 349,765, % 171
180 Exhibit S-33 PASSENGER FACILITY CHARGES BY AIRPORT Reagan National Airlines American Airlines 4 $ 23,835,526 $ 23,720,880 $ 12,620,573 $ 6,607,691 $ 5,294,318 $ 5,226,296 $ 5,215,581 $ 5,558,325 $ 5,435,374 $ 5,253,701 US Airways ,971,171 16,699,046 18,492,628 16,878,970 14,199,404 14,582,062 13,934,880 14,476,818 Southwest Airlines 6,623,054 6,732,944 6,128,934 3,212,031 1,942, , Delta Airlines 6,557,470 6,265,275 6,068,136 5,906,588 5,478,172 6,344,119 7,567,947 7,079,513 5,081,996 4,636,630 JetBlue Airways 3,730,716 4,040,767 4,036,800 3,029,943 2,567,433 1,931,568 1,062, , United Airlines 3,789,541 3,997,233 3,900,631 3,735,844 3,819,294 3,699,333 2,527,462 2,557,228 2,467,198 2,506,485 Alaska Airlines 980, , , , , , , , , ,198 Frontier Airlines 728, , , ,404 1,040,644 1,404,603 1,579, , , ,194 Air Canada 492, , , , , , , , , ,106 Virgin America 483, , ,828 51, MN Airlines 137, , , , , , , AirTran Airlines ,338 1,650,696 1,638,033 1,632,888 1,156,620 1,075,203 Spirit Airlines (803) 428, , , , ,386 Continental Airlines ,462 1,270,792 1,622,627 1,775,593 1,750,203 Midwest Airlines , , ,789 Northwest Airlines ,807 2,055,181 2,775,098 ATA America West Airlines Other Airlines 2 198, , , , , , , , ,126 92,348 Adjustments 3 (87,173) (118,077) 222, , , , ,376 (87,424) 191,848 (238,756) TOTAL $ 47,470,884 $ 47,673,620 $ 46,885,509 $ 41,969,433 $ 40,497,586 $ 39,623,895 $ 36,993,974 $ 36,154,641 $ 34,912,610 $ 35,037,786 Dulles International Airlines United Airlines $ 26,112,104 $ 25,657,007 $ 24,298,549 $ 24,402,180 $ 24,604,350 $ 24,700,284 $ 21,972,484 $ 24,381,322 $ 24,188,764 $ 24,105,856 Delta Airlines 2,476,885 2,308,384 2,180,717 2,040,765 2,153,258 2,439,923 2,304,143 2,450,430 1,977,246 1,907,178 American Airlines 4 2,176,073 2,180,496 1,600,336 1,559,167 1,481,683 1,593,514 1,642,789 1,720,637 1,686,082 1,695,527 Southwest Airlines 1,106,199 1,010,730 1,042,577 1,035,401 1,104,271 1,199,309 1,239,318 1,482,116 1,491,052 1,591,622 Lufthansa German Airline 1,081, ,892 1,199,891 1,229,411 1,236,194 1,201,882 1,124,200 1,139,039 1,256,257 1,299,418 Virgin America 568, , , , , ,648 1,041, ,353 1,059, ,813 British Airways 647, , , , , , , , , ,545 JetBlue Airways 554, , , , ,827 1,305,838 2,089,605 2,525,215 2,579,607 3,055,512 Emirates Airlines 551, , , , , ,192 20,907 17,064 27,909 14,074 Air France 514, , , , , , , , , ,256 Qatar Amiri Air 375, , , , , , , , , ,286 Frontier Airlines 629, ,707 1,392, , Turkish Airlines 426, , , , , , ,776 40,923 10,346 3,130 C.O.P.A. Airlines 497, , , , , , , , , ,023 South African Airways 299, , , , , , , , , ,495 Ethiopian Airlines 427, , , , , , , , , ,196 Scandinavian Airlines 285, , , , , , , , , ,378 Korean Air Lines 306, , , , , , , , , ,761 Air Canada 348, , , , , , , , , ,935 Icelandair 374, , , , , ,839 90, All Nippon Airways 319, , , , , , , , , ,599 Porter Airlines 246, , , ,581 82, , Virgin Atlantic Airways 208, , , , , , , , , ,053 Alaska Airlines 367, , ,224 9,906 13,568 11,998 11,284 30,905 31,546 34,970 Air China 262, , ,577 79, Austrian Airlines 122, , , , , , , , , ,781 KLM Royal Dutch Airlines 176, , , , , , , , , ,780 Taca International Airlines 168, , , , , , , , , ,958 Saudi Arabian Airlines 76,750 86, , , ,313 84,628 67,387 54,985 49,097 31,657 Royal Air Maroc 130,010 Air Inida 44,396 Aer Lingus 246,398 US Airways - 603, ,164 1,078,679 1,104,201 1,093,620 1,300,499 1,309,668 1,288,635 Continental Airlines ,291 3,098,744 1,260, , ,936 AirTran Airlines , , , , ,506 Northwest Airlines , , ,702 America West Airlines Independence Air Other Airlines 2 1,345,879 1,510,851 1,370,965 1,239, , , , , , ,324 Adjustments , ,923 (324,232) (1,757,404) 1,985,253 (249,711) 337, ,666 (214,475) TOTAL $ 43,475,973 $ 42,137,504 $ 41,666,829 $ 40,309,344 $ 38,559,328 $ 43,639,683 $ 41,632,952 $ 43,933,709 $ 43,608,154 $ 43,417,431 Passenger facility charges (PFCs) are collected by the airlines and remitted on a monthly basis to the Airports Authority. The Airports Authority accounts for PFCs on an accrual basis, based on the month the charges were collected by the airlines. These schedules reflect the amounts of PFCs submitted by carriers to the Airports Authority based on the airlines' year of collection. 1 Previous years comparative information has been modified as necessary based on revisions from carriers. Carrier information is based on each year presented. 2 Other Airlines includes PFCs applicable for carriers that do not operate at Reagan National or Dulles International. 3 Adjustments include estimates of receivables due from carriers for PFCs not yet remitted as of year-end, less estimates carried forward from the prior year. 4 US Airways merger with American Airlines completed in October Source: Airports Authority Records
181 Exhibit S-34 TOP 30 PASSENGER ORIGINATION AND DESTINATION MARKETS IN 2017 REAGAN NATIONAL Domestic Trip Total Destination Airport State Length* O&D Boston Logan MA SH 1,183,531 Chicago O'Hare IL MH 959,558 Atlanta GA SH 933,206 Orlando FL MH 748,209 Fort Lauderdale FL MH 564,816 Miami FL MH 491,625 Los Angeles CA LH 488,587 Tampa FL MH 487,825 Dallas/Fort Worth TX MH 435,003 New York La Guardia NY SH 418,588 Denver CO MH 414,800 Chicago Midway IL SH 394,126 Minneapolis/ St. Paul MN MH 382,062 Dallas Love Field TX MH 357,270 San Francisco CA LH 332,516 New Orleans LA MH 328,972 Detroit MI SH 314,685 St. Louis MO MH 287,888 Indianapolis IN SH 281,260 Nashville TN SH 268,823 Phoenix AZ LH 259,902 Seattle/Tacoma WA LH 249,990 Jacksonville FL MH 247,116 Kansas City MO MH 242,538 Hartford CT SH 231,374 Providence RI SH 230,865 Charleston SC SH 230,424 Houston Intercontinental TX MH 225,993 Raleigh/Durham NC SH 211,664 Columbus OH SH 210,714 *Note SH Short Haul = 0 to 600 miles MH Medium Haul = 601-1,800 miles LH Long Haul = over 1,800 miles Domestic Source: U.S. DOT DB1B, Year Ending 3Q 2017, via Diio online portal. International Source: MIDT via Sabre Global Demand Data (GDD), Year Ending 3Q
182 Exhibit S-35 TOP 30 PASSENGER ORIGINATION AND DESTINATION MARKETS IN 2017 DULLES INTERNATIONAL Domestic International Trip Total Total Destination Airport State Length* O&D Destination Airport Country O&D Los Angeles CA LH 814,551 London Heathrow United Kingdom 472,618 San Francisco CA LH 752,577 Paris De Gaulle France 161,485 Denver CO MH 511,521 Cancun Mexico 140,595 Orlando FL MH 405,235 San Salvador El Salvador 118,202 Atlanta GA SH 398,149 Beijing China 117,416 Dallas/Fort Worth TX MH 273,807 Amsterdam Netherlands 102,372 Seattle/Tacoma WA LH 272,590 Seoul South Korea 94,778 Boston Logan MA SH 263,454 Mexico City Mexico 94,524 Las Vegas NV LH 235,060 Frankfurt Germany 84,246 San Diego CA LH 219,603 Lima Peru 79,961 Tampa FL MH 197,771 Toronto Pearson Canada 74,070 Chicago O'Hare IL SH 193,742 Dublin Ireland 73,559 Austin TX MH 160,472 Delhi India 72,699 Houston Intercontinental TX MH 141,018 Rome Italy 70,840 Detroit MI SH 120,431 Addis Ababa Ethiopia 67,201 Miami FL MH 115,636 Guatemala City Guatemala 64,794 Ft. Lauderdale FL MH 112,037 Dubai United Arab Emirates 64,232 Phoenix AZ LH 110,854 Tokyo Japan 62,975 New York J F Kennedy NY SH 108,764 Toronto Bishop Canada 60,693 Minneapolis St. Paul MN MH 104,846 Hyderabad India 57,505 Charlotte NC SH 99,779 Ho Chi Minh City Vietnam 52,846 Honolulu HI LH 94,032 Munich Germany 51,835 San Antonio TX MH 83,610 Manila Philippines 51,002 New Orleans LA MH 83,368 Mumbai India 48,568 Indianapolis IN SH 81,896 Lagos Nigeria 47,801 Portland OR LH 81,509 Bangkok Thailand 46,717 Salt Lake City UT LH 76,437 Geneva Switzerland 46,483 St. Louis MO MH 75,295 Brussels Belgium 44,840 San Juan PR LH 69,715 Tel Aviv Yafo Ben Gurion Israel 43,639 Nashville TN SH 69,090 Riyadh Saudi Arabia 43,343 *Note SH Short Haul = 0 to 600 miles MH Medium Haul = 601-1,800 miles LH Long Haul = over 1,800 miles Domestic Source: U.S. DOT DB1B, Year Ending 3Q 2017, via Diio online portal. International Source: MIDT via Sabre Global Demand Data (GDD), Year Ending 3Q
183 Exhibit S-36 TOP 10 PASSENGER ORIGINATION AND DESTINATION MARKETS REAGAN NATIONAL The following tables depict the top ten passenger origin and destination (O&D) markets for Reagan National for the past ten years. O&D data is used to determine air traffic patterns, air carrier market shares, and passenger flows. Primarily serving as a short-haul airport, Reagan National offers nonstop service to destinations no further than a 1,250 mile perimeter from Washington, D.C. as part of the federally-instituted Perimeter Rule. The federal government has granted exceptions to this rule, allowing daily flights to the following cities beyond the perimeter: Austin; Denver; Las Vegas; Los Angeles; Phoenix; Portland, Ore.; Salt Lake City; San Diego; San Francisco; and Seattle Destination Airport Passengers Destination Airport Passengers Destination Airport Passengers Destination Airport Passengers Boston, MA 1,183,531 Boston, MA 1,184,229 Boston, MA 1,117,410 Boston, MA 1,130,313 Chicago, O'Hare 959,558 Atlanta, GA 885,741 Atlanta, GA 811,460 Chicago, O'Hare 806,970 Atlanta, GA 933,206 Chicago, O'Hare 826,250 Chicago, O'Hare 787,175 Atlanta, GA 732,631 Orlando, FL 748,209 Orlando, FL 771,552 Orlando, FL 676,587 Orlando, FL 628,918 Fort Lauderdale, FL 564,816 Fort Lauderdale, FL 531,709 Tampa, FL 528,561 Tampa, FL 437,091 Miami, FL 491,625 Tampa, FL 512,559 Fort Lauderdale, FL 467,864 New York, LaGuardia 429,451 Los Angeles, CA 488,587 Miami, FL 490,522 Denver, CO 465,287 Fort Lauderdale, FL 426,535 Tampa, FL 487,825 Los Angeles, CA 475,373 New York, LaGuardia 451,477 Miami, FL 414,004 Dallas/Ft. Worth, TX 435,003 New York, LaGuardia 441,559 Miami, FL 444,096 Denver, CO 404,842 New York, LaGuardia 418,588 Dallas/Ft. Worth, TX 425,316 Los Angeles, CA 440,020 Dallas/Fort Worth, TX 379, Destination Airport Passengers Destination Airport Passengers Destination Airport Passengers Destination Airport Passengers Boston,MA 1,051,126 Boston, MA 1,093,141 Boston, MA 1,062,242 Chicago, O'Hare 822,763 Chicago, O'Hare 949,322 Chicago, O'Hare 898,683 Chicago, O'Hare 823,013 Atlanta, GA 767,081 Orlando, FL 728,413 Atlanta, GA 733,234 Atlanta, GA 720,482 Boston, MA 646,227 Atlanta, GA 687,700 Orlando, FL 631,807 Orlando, FL 629,355 New York, LaGuardia 524,133 Fort Lauderdale, FL 451,421 Fort Lauderdale, FL 606,297 Ft. Lauderdale, FL 525,329 Orlando, FL 502,996 New York, LaGuardia 438,792 New York, LaGuardia 421,656 Dallas/Ft. Worth, TX 449,662 Dallas/Ft. Worth, TX 486,589 Miami, FL 423,460 Miami, FL 416,144 Miami, FL 443,104 Ft. Lauderdale, FL 465,358 Dallas/Fort Worth, TX 397,727 Dallas/Fort Worth, TX 393,561 New York, LaGuardia 439,741 Miami, FL 343,872 Tampa, FL 373,635 Denver, CO 377,543 Minneapolis/St. Paul, MN 347,184 Minneapolis/St. Paul, MN 319,561 Denver, CO 360,098 Minneapolis/St. Paul, MN 341,466 Denver, CO 320,124 Denver, CO 315, Destination Airport Passengers Destination Airport Passengers Chicago, O'Hare 781,980 Chicago, O'Hare 795,642 Atlanta, GA 777,598 Atlanta, GA 776,303 Boston, MA 605,344 New York, LaGuardia 760,458 New York, LaGuardia 592,826 Boston, MA 690,429 Dallas/Ft. Worth, TX 460,984 Dallas/Ft. Worth, TX 452,014 Ft. Lauderdale, FL 410,870 Detroit, MI 391,503 Orlando, FL 368,557 Ft. Lauderdale, FL 391,001 Miami, FL 334,183 Miami, FL 351,765 Denver, CO 318,801 Denver, CO 338,055 Minneapolis/St. Paul, MN 316,259 Orlando, FL 326, Data reported for current year reflects year-ending estimates as of the 3rd Quarter in the calendar year. Prior year results have been adjusted to reflect actual annual traffic. Sources: U.S. DOT, DB1B database, via Diio online portal. 175
184 Exhibit S-37 TOP 10 PASSENGER ORIGINATION AND DESTINATION MARKETS DULLES INTERNATIONAL The following tables depict the top ten passenger originand destination (O&D) markets for Dulles International for the past ten years. O&D data is used to determine air traffic patterns, air carrier market shares, and passenger flows. Dulles International is a major East Coast gateway for domestic and international travelers as well as cargo activities Destination Airport Passengers Destination Airport Passengers Destination Airport Passengers Destination Airport Passengers Los Angeles, CA 814,551 Los Angeles, CA 815,488 San Francisco, CA 803,235 Los Angeles, CA 822,948 San Francisco, CA 752,577 San Francisco, CA 774,931 San Francisco, CA 787,614 San Francisco, CA 812,980 Denver, CO 511,521 London, Heathrow 445,207 London, Heathrow 448,828 London, Heathrow 455,181 London, Heathrow 472,618 Denver, CO 442,756 Denver, CO 392,909 Denver, CO 374,384 Orlando, FL 352,138 Orlando, FL 352,138 Orlando, FL 344,595 Boston, MA 267,014 Atlanta, GA 398,149 Atlanta, GA 341,711 Atlanta, GA 318,188 Atlanta, GA 266,181 Dallas/Ft. Worth, TX 273,807 Seattle, WA 250,301 Las Vegas, NV 282,630 Orlando, FL 259,000 Seattle, WA 272,590 Boston, MA 248,884 Boston, MA 246,783 Chicago O'Hare, IL 236,643 Boston, MA 263,454 Las Vegas, NV 241,729 Chicago O'Hare, IL 245,335 Dallas/Fort Worth, TX 196,885 Las Vegas, NV 235,060 San Diego, CA 230,623 San Diego, CA 241,795 Paris, De Gaulle 194, Destination Airport Passengers Destination Airport Passengers Destination Airport Passengers Destination Airport Passengers Los Angeles, CA 835,895 San Francisco, CA 808,779 Los Angeles, CA 847,686 Los Angeles, CA 848,814 San Francisco, CA 809,625 Los Angeles, CA 783,603 San Francisco, CA 815,813 San Francisco, CA 806,058 London, Heathrow 481,089 London, Heathrow 522,592 London, Heathrow 483,574 Boston, MA 506,669 Denver, CO 350,647 Denver, CO 320,527 Orlando, FL 380,384 Orlando, FL 449,486 Boston, MA 291,033 Orlando, FL 294,831 Boston, MA 357,564 London, Heathrow 396,859 Atlanta, GA 243,826 Boston, MA 286,600 Denver, CO 343,145 Denver, CO 338,793 Chicago, O'Hare 236,008 Atlanta, GA 280,040 Atlanta, GA 302,228 Atlanta, GA 311,385 Dallas/Fort Worth, TX 217,767 Paris, De Gaulle 268,740 Paris, De Gaulle 232,914 Las Vegas, NV 260,038 Orlando, FL 212,326 Chicago, O'Hare 221,285 Las Vegas, NV 232,451 Dallas/Ft. Worth, TX 225,741 Paris, De Gaulle 211,338 Chicago, Midway 199,097 San Diego, CA 221,778 San Diego, CA 225, Destination Airport Passengers Destination Airport Passengers Los Angeles, CA 873,918 Los Angeles, CA 848,158 San Francisco, CA 733,077 San Francisco, CA 654,212 Orlando, FL 477,197 Orlando, FL 583,915 Boston, MA 465,043 Boston, MA 489,643 London, Heathrow 419,241 London, Heathrow 422,970 Atlanta, GA 338,386 Atlanta, GA 369,003 Denver, CO 306,213 Denver, CO 353,317 Las Vegas, NV 256,342 Las Vegas, NV 312,148 San Diego, CA 229,424 San Diego, CA 281,208 Dallas/Ft. Worth, TX 218,505 Tampa, FL 260,788 Domestic traffic data Domestic Source: U.S. DOT, DB1B database, via Diio online portal. International Source: MIDT via Sabre Global Demand Data (GDD), 12 months ending December of , preliminary data. No international data currently available before January 2005 * International passenger 176
185 Exhibit S-38 AIRLINE TENANTS BOTH AIRPORTS As of December 31, 2017 Reagan National Dulles International Signatory Airlines Signatory Airlines Non-Signatory Airlines Air Canada Aer Lingus Aeroflot Air Wisconsin Airlines Air Canada Aeromexico Alaska Airlines Air China Omni Air International American Airlines Air France Southern Airways International Delta Airlines Air Georgian Air India Endeavor Air Air Wisconsin MN Airlines, LLC (Sun County) Envoy Air Alaska Airlines Volga-Dnepr ExpressJet Airlines All Nippon Airways Frontier Airlines American Airlines GoJet Airlines Austrian Airlines Jazz Aviation LP Avianca Airlines MN Airlines, LLC British Airways Jet Blue Airways Corp Brussels Airlines Mesa Airlines CommutAir Piedmont Airlines Compass Airlines PSA Airlines COPA Airlines Republic Airlines Delta Airlines Shuttle America Emirates Airlines Sky Regional Airlines Endeavor Air, Inc. SkyWest Airlines Ethiopian Airlines Southwest Airlines Etihad Airways Trans States Airlines ExpressJet Airlines United Airlines Federal Express Virgin America, Inc. Frontier Airlines GoJet Airlines Icelandair Jet Blue Airways Corp KLM Royal Dutch Airlines Korean Air LATAM Lufthansa German Airlines Mesa Airlines Mountain Air Cargo Porter Airlines Pinnacle PSA Qatar Airways Republic Airlines Royal Air Maroc Saudi Arabian Airlines Scandinavian Airlines Shuttle America Silver Airways Sky West South African Airways Southwest Airlines TACA International Airlines Trans States Airlines, Inc. Turkish Airlines United Airlines United Parcel Service Virgin America, Inc. Virgin Atlantic Airways Ltd. Signatory airlines are those that have signed the Airports Authority Use Agreement and Premises Lease. Signatory status is available to all airlines providing scheduled service and offers benefits such as lower fees, sharing of Airports Authority revenue, and the right to lease space. Additional detail is provided in Note 2 - Airport Use Agreement and Premises Lease. Source: Airports Authority Records 177
186 Exhibit S-39 NON-AIRLINE TENANTS REAGAN NATIONAL As of December 31, 2017 Reagan National Retail Food and Beverage Ground Transportation America! &Pizza Challenger Transportation, Inc. Brighton American Tap Room Hotel Shuttles Brooks Brothers Ben's Chili Bowl Limousine Operators Capital Image Big Bowl Lyft, Inc. Fine Leather Works Boar's Head Delicatessen Rasier LLC (Uber) Fort America, Inc. Bracket Room/Green Beans Coffee Technical and Professional Services InMotion Entertainment Cava Mezza The Airport Shuttle, Inc. I Relax and Massage Cibo Bistro & Wine Bar Washington Shuttle, Inc. (Super Shuttle) itravel2 Cibo Express Gourmet Johnston & Murphy Cosi Commercial Aviation Services Lacoste CTY ABM Janitorial Services-Northeast, Inc. Landau Custom Burger Aircraft Service International Group, Inc. National Treasures DCA Bistro Airline Tech Reps (STS Line Maintenance) Pen & Prose Boutique District Bar Airport Terminal Services Smithsonian Institution Dunkin Donuts Airway Cleaners, LLC Spanx El Centro D.F. Air Serv Corporation Sunglass Hut International Five Guys Allied Aviation Fueling of National Airport Tumi Georgetown Gourmet Market American Sales & Management Uniquely DC Good Stuff Eatery Avdyne AeroServices, LLC Vineyard Vines Grille District DAL Global Services, LLC XpresSpa Kapnos Taverna Elite Line Services, LLC Lebanese Taverna First Transit, Inc. Legal Sea Foods G2 Secure Staff, LLC Lickety Split Huntleigh USA Corporation Newsstands Magic Pan Inland Technologies CNBC News Matsutaki Sushi Oxford Airport Technical Services Forbes May Vending Company PrimeFlight Aviation Services, Inc. Hudson News Page Readyjet, Inc. NBC4 Pinkberry Swissport USA, Inc. Washingtonian Qdoba Mexican Grill Ultimate Aircraft Deicing Corp. Reservoir Worldwide Flight Services, Inc. Sam and Harry's Say Si Bon Gourmet Duty Free Sip Munch & More Other Airport Tenants Dulles Duty Free LLC Starbucks Aeronautical Radio, Inc. Tagliare Air General Taylor Gourmet American Airlines Federal Credit Union Foreign Currency U Street Pub BMG Consulting Services ICE Currency Services Washington Pour Bar Concessions International/MBC Concessions Wow Bau Hot Asian Buns DC Provisions, LLC Drug Enforcement Administration Advertising Eastern Industrial Maintenance, Inc. Fixed Based Operators In-Ter-Space Services, Inc. Federal Aviation Administration Signature Flight Support Federal Bureau of Investigation Services General Services Administration Parking Managed by: AC Holdings, Inc.(CNN) Gulf Coast Real Estate Consultants Five Star U Street Metropolitan Alclear, LLC Marketplace Development Washington Airport Parking C&P Shoeshine MorphoTrust USA Capital One Bank Nextel Communications of the Mid-Atlantic Parking Shuttle Managed by: Kiko's Shoeshine Pleasant News at DCA, LLC Five Star U Street Metropolitan Pacific Telemanagement Services Riva Networks, Inc. Washington Airport Parking Smarte Carte Inc. Transportation Security Administration VIP Shoeshine University of District of Columbia US Coast Guard Air Station Inflight Kitchens Rental Cars Sky Chefs, Inc. Advantage Rent A Car Avis Rent -A-Car Systems Budget Rent-A-Car DTG Operations Enterprise Leasing Hertz Rent-A-Car Vanguard Car Rental Source: Airports Authority Records 178
187 Exhibit S-40 NON-AIRLINE TENANTS DULLES INTERNATIONAL As of December 31, 2017 Dulles International Retail Food & Beverage Commercial Aviation Services America! &Pizza Air General Bluwire DC. LLC American Tap Room Air Serv Corporation Burberry Au Bon Pain Aircraft Services Int'l Coach Auntie Anne's Pretzels AvDyne Aero Services, LLC Erwin Pearl Bar Symon Cargo Airport Services Estee Lauder Be Right Burger Delta Airline Global Services Flag World Bistro Atelier G2 Secure Staff Flagland International Bracket Room Global Aviation Services, LLC GenX Wireless Capitol Grounds Ground Services International, Inc. InMotion Entertainment Carrabba's Huntleigh Corporation I Relax-n-Massage Chef Geoff's Swissport Fueling, Inc. itravel 2 Chipotle Mexican Grill Swissport USA, Inc. iwireless Shop, LLC Cosi Tug Technologies Corporation Kiehl's DC-3 Hot Dog Joint Worldwide Flight Services, Inc. Landau DC Craft & Brews L'Occitane District Chop House Other Airport Tenants Michael Kors Dulles Gourmet Market ACT Cargo (USA), Inc. Montblanc Dunkin Donuts Adesa See's Candies Firkin and the Fox AECOM Technology Corporation Souvenir Library Five Guys Airline Tariff Publishing Company Swarovski Luv'nBerry Airschott, Inc. Thomas Pink Max & Erma's AMB/AFCO Cargo IAD, LLC Tumi Moe's Grill & Bar Aviation Facilities Company Uniquely DC Potbelly Sandwich Works Drug Enforcement Administration Vera Bradley Smashburger Dulles East- MWAA Vineyard Vines Starbucks Eastern Industrial Maintenance, Inc. Virginia Cacao Factory Subway Federal Aviation Administration Zoom Systems-Best Buy The Kitchen by Wolfgang Puck Federal Republic of Germany Vino Volo General Services Administration Newsstands Wendy's Globe Air Cargo, Inc. Capitol City Ink Heavyweight Air Cargo Forbes Advertising Host International, Inc. Hudson News In-Ter-Space Services, Inc. IAD Fuels, LLC NBC4 Inland Technologies International Stellar News Rental Cars IOM (International Org. for Migration) Washington Informer Advantage Rent-A-Car Jet Airways of the U.S. Washingtonian Avis Rent-A-Car Systems John S. Connor, Inc. Budget Rent-A-Car Landow Aviation Limited Partnership DTG Operations Livingston International Tech. Services Corp. Duty Free Enterprise Leasing Lufthansa Cargo AG Dulles Duty Free, LLC Hertz Rent-A-Car Marketplace Development Vanguard Car Rental USA MorphoTrust USA, Inc. Services Network Management Corporation AC Holdings, Inc. (CNN) In-flight Kitchens Nextel Communications of the Mid-Atlantic Alclear, LLC Flying Food Group, LLC Nicoya Trucking Be Relax Gate Gourmet International Platinum Air Cargo USA, LLC Capital One Bank Sky Chefs, Inc. Pollo Real Marriott Hotel at Dulles Quality Pipe Cleaning Co., Inc. Marriott Hotel at Dulles Fixed Based Operators Qwest Pena Shoeshine IAD DC Holdings, LLC Sealtec, LLC Professional Leather Care Signature Flight Support Swissport North America, Inc. Smarte Carte, Inc. The Smithsonian Institution Sunoco Gas Station Ground Transportation Transportation Security Administration Capital Executive Limousine Triad International Maintenance Corp. Foreign Currency Challenger Transportation U.S. Postal Service ICE Currency Services Checker Airport Taxi, Inc. V-Dulles West, LLC Supreme Airport Shuttle Verizon South, Inc. Parking Managed by: Dulles Airport Taxi Five Star U Street Metropolitan Hotel Shuttles Washington Airport Parking Limousine Operators Lyft Inc. Parking Shuttle Managed by: Raiser, LLC (Uber) Five Star U Street Metropolitan Regency Cab Washington Airport Parking Technical and Professional Services, Inc. The Airport Shuttle Washington Shuttle, Inc. (Super Shuttle) Source: Airports Authority Records 179

188
2016 COMPREHENSIVE ANNUAL FINANCIAL REPORT Metropolitan Washington Airports Authority INTENTIONALLY LEFT BLANK
 INTENTIONALLY LEFT BLANK METROPOLITAN WASHINGTON AIRPORTS AUTHORITY COMPREHENSIVE ANNUAL FINANCIAL REPORT FOR THE FISCAL YEARS ENDED DECEMBER 31, 2016 and DECEMBER 31, 2015 BOARD OF DIRECTORS as of December
Report to the Finance Committee Comprehensive Annual Financial Report. Prepared by the Office of Finance April 2017
 Report to the Finance Committee 2016 Comprehensive Annual Financial Report Prepared by the Office of Finance April 2017 Audit Opinion date March 31, 2017 Unmodified or clean audit opinion on financial
Metropolitan Washington Airports Authority (MWAA)
") RONALD REAGAN WASHINGTON NATIONAL DULLES TOLL ROAD DULLES METRORAIL WASHINGTON DULLES INTERNATIONAL Metropolitan Washington Airports Authority (MWAA) Andrew Rountree Chief Financial Officer & Vice President
RONALD REAGAN WASHINGTON NATIONAL DULLES TOLL ROAD DULLES METRORAIL WASHINGTON DULLES INTERNATIONAL Metropolitan Washington Airports Authority (MWAA) Andrew Rountree Chief Financial Officer & Vice President
COMPREHENSIVE ANNUAL FINANCIAL REPORT. For the Fiscal Year Ended December 31, 2011
 2011_CAFR_Cover_rev.pdf 1 3/26/12 3:36 PM 2011 COMPREHENSIVE ANNUAL FINANCIAL REPORT For the Fiscal Year Ended December 31, 2011 Intentionally Left Blank METROPOLITAN WASHINGTON AIRPORTS AUTHORITY COMPREHENSIVE
Welcome Fairfax County Transportation Advisory Commission and FC-DOT Staff
 Welcome Fairfax County Transportation Advisory Commission and FC-DOT Staff July 29, 2014 Metropolitan Washington Airports Authority MWAA was created through a bi-state compact between the Commonwealth
Airline Business Development Update. June 22, 2017
 Airline Business Development Update June 22, 2017 Office of Airline Business Development s Primary Mission Expanding Air Service at Dulles International and Discouraging New Flights at Reagan National
Committee for Dulles. June 9, Jack Potter, MWAA President & CEO
 Committee for Dulles June 9, 2016 Jack Potter, MWAA President & CEO Dulles International is the Premier International Gateway to the Capital Region Dom Intl Total Mainline Airlines 10 29 37* Destinations
Jacksonville Aviation Authority Annual Report The Power Within.
 Jacksonville Aviation Authority Annual Report 2007 The Power Within. Board of Directors & Executive Team Cyrus Jollivette Chairman 1 John D. Clark Executive Director / CEO Jim McCollum Vice-Chairman 2
Report to the Dulles Corridor Advisory Committee
 Report to the Dulles Corridor Advisory Committee Information Report on Dulles Toll Road Toll Rate Adjustment Process and Tentative Schedule and Overview of Traffic and Revenue Study Update May 2018 Purpose
Air Service Development Information Report and Proposed 2015 Annual Air Service Plan
 Strategic Development Committee Air Service Development Information Report and Proposed 2015 Annual Air Service Plan December 2014 a 1 2014 Air Service Overview Airlines offered little growth in seat capacity,
CONTACT: Investor Relations Corporate Communications
 NEWS RELEASE CONTACT: Investor Relations Corporate Communications 435.634.3200 435.634.3553 Investor.relations@skywest.com corporate.communications@skywest.com SkyWest, Inc. Announces Fourth Quarter 2017
MIRAMAR, Fla., April 29, 2015 (GLOBE NEWSWIRE) -- Spirit Airlines, Inc. (Nasdaq:SAVE) today reported first quarter 2015 financial results.
 -- Spirit Airlines, Inc. (Nasdaq:SAVE) today reported first quarter 2015 financial results.") April 29, 2015 Spirit Airlines Announces First Quarter 2015 Results; Adjusted Net Income Increases 87.1 Percent to $70.7 Million and Pre-Tax Margin Increases 900 Basis Points to 22.7 Percent MIRAMAR, Fla.,
April 29, 2015 Spirit Airlines Announces First Quarter 2015 Results; Adjusted Net Income Increases 87.1 Percent to $70.7 Million and Pre-Tax Margin Increases 900 Basis Points to 22.7 Percent MIRAMAR, Fla.,
CONTACT: Investor Relations Corporate Communications
 NEWS RELEASE CONTACT: Investor Relations Corporate Communications 435.634.3200 435.634.3553 Investor.relations@skywest.com corporate.communications@skywest.com SkyWest, Inc. Announces Second Quarter 2017
Copa Holdings Reports Record Earnings of US$41.8 Million for 4Q06 and US$134.2 Million for Full Year 2006
 Copa Holdings Reports Record Earnings of US$41.8 Million for 4Q06 and US$134.2 Million for Full Year 2006 Panama City, Panama --- March 7, 2007. Copa Holdings, S.A. (NYSE: CPA), parent company of Copa
AIR CANADA REPORTS 2010 THIRD QUARTER RESULTS; Operating Income improved $259 million or 381 per cent from previous year s quarter
 AIR CANADA REPORTS 2010 THIRD QUARTER RESULTS; Operating Income improved $259 million or 381 per cent from previous year s quarter MONTRÉAL, November 4, 2010 Air Canada today reported operating income
Spirit Airlines Reports First Quarter 2017 Results
 Spirit Airlines Reports First Quarter 2017 Results MIRAMAR, Fla., April 28, 2017 - Spirit Airlines, Inc. (NASDAQ: SAVE) today reported first quarter 2017 financial results. GAAP net income for the first
CONTACT: Investor Relations Corporate Communications
 NEWS RELEASE CONTACT: Investor Relations Corporate Communications 435.634.3200 435.634.3553 Investor.relations@skywest.com corporate.communications@skywest.com SkyWest, Inc. Announces Second Quarter 2016
Spirit Airlines Reports Fourth Quarter and Full Year 2016 Results
 Spirit Airlines Reports Fourth Quarter and Full Year 2016 Results MIRAMAR, FL. (February 7, 2017) - Spirit Airlines, Inc. (NASDAQ: SAVE) today reported fourth quarter and full year 2016 financial results.
Copa Holdings Reports Fourth Quarter and Full Year 2007 Results
 Copa Holdings Reports Fourth Quarter and Full Year 2007 Results Panama City, Panama --- February 21, 2008. Copa Holdings, S.A. (NYSE: CPA), parent company of Copa Airlines and Aero Republica, today announced
Dulles Toll Road Rate Setting Process
 Dulles Toll Road Rate Setting Process Public Hearings Slides FOR HNTB June 22, 2018 Dulles Toll Road Operations The Dulles Toll Road is a critical transportation link to the region s infrastructure. On
OPERATING AND FINANCIAL HIGHLIGHTS. Subsequent Events
 Copa Holdings Reports Net Income of $103.8 million and EPS of $2.45 for the Third Quarter of 2017 Excluding special items, adjusted net income came in at $100.8 million, or EPS of $2.38 per share Panama
PORT OF SEATTLE PRESENTATION TO THE WESTERN STATES INSTITUTIONAL INVESTORS CONFERENCE MAY 15, 2018
 PORT OF SEATTLE PRESENTATION TO THE WESTERN STATES INSTITUTIONAL INVESTORS CONFERENCE MAY 15, 2018 Elizabeth Morrison, Port of Seattle Director of Corporate Finance 0 OVERVIEW Regional Economy Port Financial
Technical Report Economic Impact Study
 Technical Report 2009 Economic Impact Study Prepared for: Metropolitan Washington Airports Authority 1 Aviation Circle Washington, DC 20001 Prepared by: The Louis Berger Group, Inc. 2445 M Street, NW Washington,
air traffic statistics
 June 23 air traffic statistics Prepared by the Office of Finance Department of Internal Controls, Compliance and Financial Strategy Metropolitan Washington Airports Authority Air Traffic Statistics Table
December Air Traffic Statistics. Prepared by the Office of Marketing & Consumer Strategy
 December 217 Air Traffic Statistics Prepared by the Office of Marketing & Consumer Strategy 1 This report includes only data submitted by airlines as of the date of publication: February 2, 217. Reports
Adjusted net income of $115 million versus an adjusted net loss of $7 million in the second quarter of 2012, an improvement of $122 million
 Air Canada Reports Record Second Quarter 2013 Results Highest Adjusted Net Income, Operating Income and EBITDAR Results for Second Quarter in Air Canada s History Adjusted net income of $115 million versus
air traffic statistics
 October 213 air traffic statistics Prepared by the Office of Finance Department of Internal Controls, Compliance and Financial Strategy Metropolitan Washington Airports Authority Air Traffic Statistics
Thank you for participating in the financial results for fiscal 2014.
 Thank you for participating in the financial results for fiscal 2014. ANA HOLDINGS strongly believes that safety is the most important principle of our air transportation business. The expansion of slots
OPERATING AND FINANCIAL HIGHLIGHTS SUBSEQUENT EVENTS
 Copa Holdings Reports Net Income of US$6.2 Million and EPS of US$0.14 for the Third Quarter of 2015 Excluding special items, adjusted net income came in at $37.4 million, or EPS of $0.85 per share Panama
COUNTY OF ORANGE, CALIFORNIA AIRPORT REVENUE BONDS, SERIES 2009 A & B ANNUAL REPORT FOR FISCAL YEAR ENDED JUNE 30, 2013
 COUNTY OF ORANGE, CALIFORNIA AIRPORT REVENUE BONDS, SERIES 2009 A & B ANNUAL REPORT FOR FISCAL YEAR ENDED JUNE 30, 2013 Dated: January 28, 2014 COUNTY OF ORANGE, CALIFORNIA AIRPORT REVENUE BONDS, SERIES
Proposed Dulles Toll Road Rate Adjustments
 Proposed Dulles Toll Road Rate Adjustments Dulles Corridor Advisory Committee Meeting October 5, 2012 Discussion Outline Regulatory Process for Changing Toll Rates Information Provided at Public Hearings
SkyWest, Inc. Announces First Quarter 2018 Profit
 NEWS RELEASE CONTACT: Investor Relations Corporate Communications 435.634.3200 435.634.3553 Investor.relations@skywest.com corporate.communications@skywest.com SkyWest, Inc. Announces First Quarter 2018
Historical Statistics
 Historical Statistics FedEx Corporation Financial and Operating Statistics FY 2005 FY 2014 This report is a statistical supplement to FedEx s interim financial reports and is prepared quarterly. Additional
SKYWEST, INC. ANNOUNCES THIRD QUARTER 2014 RESULTS
 NEWS RELEASE For Further Information Contact: Investor Relations Telephone: (435) 634-3203 Fax: (435) 634-3205 FOR IMMEDIATE RELEASE: October 29, 2014 SKYWEST, INC. ANNOUNCES THIRD QUARTER 2014 RESULTS
Citi Industrials Conference
 Citi Industrials Conference June 13, 2017 Andrew Levy Executive Vice President and Chief Financial Officer Safe Harbor Statement Certain statements included in this presentation are forward-looking and
AIR CANADA REPORTS THIRD QUARTER RESULTS
 AIR CANADA REPORTS THIRD QUARTER RESULTS THIRD QUARTER OVERVIEW Operating income of $112 million compared to operating income of $351 million in the third quarter of 2007. Fuel expense increased 49 per
OPERATING AND FINANCIAL HIGHLIGHTS
 Copa Holdings Reports Net Income of US$32.0 Million and EPS of US$0.72 for the Second Quarter of 2012 Excluding special items, adjusted net income came in at $58.6 million, or EPS of $1.32 per share Panama
SUMMARY MINUTES STRATEGIC DEVELOPMENT COMMITTEE MEETING OF OCTOBER 19, 2016
 SUMMARY MINUTES STRATEGIC DEVELOPMENT COMMITTEE MEETING OF OCTOBER 19, 2016 Ms. Wells chaired the October 19 Strategic Development Committee Meeting, calling it to order at 9:35 a.m. A quorum was present
Investor Update Issue Date: April 9, 2018
 Investor Update Issue Date: April 9, 2018 This investor update provides guidance and certain forward-looking statements about United Continental Holdings, Inc. (the Company or UAL ). The information in
OPERATING AND FINANCIAL HIGHLIGHTS SUBSEQUENT EVENTS
 Copa Holdings Reports Financial Results for the Third Quarter of 2016 Excluding special items, adjusted net income came in at $55.3 million, or adjusted EPS of $1.30 per share Panama City, Panama --- November
Dulles Corridor Improvements. Drive to Ride
 Dulles Corridor Improvements Dulles Corridor Improvements Status Update v Condition assessment of Toll Road facilities is complete v Dulles Airport Access Highway/I-495 Interchange Safety Improvements
air traffic statistics
 September 213 air traffic statistics Prepared by the Office of Finance Department of Internal Controls, Compliance and Financial Strategy Commercial Total Int'l Dom Passengers % Change Air Traffic Summary
Historical Statistics
 Historical Statistics FedEx Corporation Financial and Operating Statistics FY 2006 FY 2015 This report is a statistical supplement to FedEx s interim financial reports and is prepared annually. Additional
ACI LEGAL COMMITTEE MEETING
 ACI LEGAL COMMITTEE MEETING MWAA S RAIL TO DULLES PROJECT: WHAT IS IT AND HOW DOES IT FIT WITH THE PRINCIPLES OF REVENUE DIVERSION PHIL SUNDERLAND MWAA GENERAL COUNSEL TWO GOALS FOR THE NEXT TEN MINUTES
Columbus Regional Airport Authority. Financial Statements. August 31, Respectfully Submitted. Randy Bush, CPA, CIA. Chief Financial Officer
 Columbus Regional Airport Authority Financial Statements August 31, 2018 Respectfully Submitted Randy Bush, CPA, CIA Chief Financial Officer Unaudited for internal purposes CRAA Operating Revenue & Expenses
OPERATING AND FINANCIAL HIGHLIGHTS
 Copa Holdings Reports Net Income of US$18.6 Million and EPS of US$0.42 for the Second Quarter of 2010 Excluding special items, adjusted net income came in at $26.3 million, or $0.60 per share Panama City,
Investor Update September 2017 PARTNER OF CHOICE EMPLOYER OF CHOICE INVESTMENT OF CHOICE
 Investor Update September 2017 PARTNER OF CHOICE EMPLOYER OF CHOICE INVESTMENT OF CHOICE 1 Forward Looking Statements In addition to historical information, this presentation contains forward-looking statements
Land area 1.73 million km 2 Queensland population (as at 31 December 2017) Brisbane population* (preliminary estimate as at 30 June 2017)
 Brisbane population* (preliminary estimate as at 30 June 2017)") Queensland - 11 Queensland OVERVIEW Queensland is nearly five times the size of Japan, seven times the size of Great Britain, and two and a half times the size of Texas. Queensland is Australia s second
Queensland - 11 Queensland OVERVIEW Queensland is nearly five times the size of Japan, seven times the size of Great Britain, and two and a half times the size of Texas. Queensland is Australia s second
Investor Relations Update January 25, 2018
 General Overview Investor Relations Update Accounting Changes On January 1, 2018, the company adopted two new Accounting Standard Updates: (ASUs): ASU 2014-9: Revenue from Contracts with Customers (the
2009 Comprehensive Annual Financial Report
 2009 Comprehensive Annual Financial Report Washington Dulles International Airport Ronald Reagan Washington National Airport Dulles Corridor METROPOLITAN WASHINGTON AIRPORTS AUTHORITY COMPREHENSIVE ANNUAL
June Air Traffic Statistics. Prepared by the Office of Corporate Risk and Strategy
 June 214 Air Traffic Statistics Prepared by the Office of Corporate Risk and Strategy Air Traffic Statistics Table of Contents Summary Air Traffic Summary... 1 SH&E Air Traffic Schedule Activity... 3 Passenger
Spirit Airlines Reports Highest Second Quarter Pre-Tax Margin in Company History
 July 24, 2013 Spirit Airlines Reports Highest Second Quarter Pre-Tax Margin in Company History MIRAMAR, Fla., July 24, 2013 (GLOBE NEWSWIRE) -- Spirit Airlines, Inc. (Nasdaq:SAVE) today reported second
OPERATING AND FINANCIAL HIGHLIGHTS. Subsequent Events
 Copa Holdings Reports Financial Results for the First Quarter of 2016 Excluding special items, adjusted net income came in at US$69.9 million, or EPS of US$1.66 per share Panama City, Panama --- May 5,
Columbus Regional Airport Authority. Financial Statements. September 30, Respectfully Submitted. Randy Bush, CPA, CIA. Chief Financial Officer
 Columbus Regional Airport Authority Financial Statements September 30, 2018 Respectfully Submitted Randy Bush, CPA, CIA Chief Financial Officer Unaudited for internal purposes CRAA Operating Revenue &
RECOMMENDATION TO THE DULLES CORRIDOR AND FINANCE COMMITTEES
 RECOMMENDATION TO THE DULLES CORRIDOR AND FINANCE COMMITTEES Proposed Amendment to the Regulation that Establishes Toll Rates for Use of the Dulles Toll Road November 2018 Purpose To brief the Dulles Corridor
OPERATING AND FINANCIAL HIGHLIGHTS
 Copa Holdings Reports Financial Results for the Fourth Quarter of 2015 Excluding special items, adjusted net income came in at $31.7 million, or EPS of $0.73 per share Panama City, Panama --- February
Columbus Regional Airport Authority. Financial Statements. March 31, Respectfully Submitted. Randy Bush, CPA, CIA. Chief Financial Officer
 Columbus Regional Airport Authority Financial Statements March 31, 2018 Respectfully Submitted Randy Bush, CPA, CIA Chief Financial Officer Unaudited for internal purposes CRAA Operating Revenue & Expenses
AMERICAN AIRLINES GROUP REPORTS DECEMBER TRAFFIC RESULTS
 Corporate Communications 817-967-1577 mediarelations@aa.com Investor Relations 817-931-3423 investor.relations@aa.com FOR RELEASE: Monday, AMERICAN AIRLINES GROUP REPORTS DECEMBER TRAFFIC RESULTS FORT
1Q 2017 Earnings Call. April 18, 2017
 1Q 2017 Earnings Call April 18, 2017 Safe Harbor Statement Certain statements included in this presentation are forward-looking and thus reflect our current expectations and beliefs with respect to certain
Columbus Regional Airport Authority. Financial Statements. April 30, Respectfully Submitted. Randy Bush, CPA, CIA. Chief Financial Officer
 Columbus Regional Airport Authority Financial Statements April 30, 2018 Respectfully Submitted Randy Bush, CPA, CIA Chief Financial Officer Unaudited for internal purposes CRAA Operating Revenue & Expenses
Distinguished Budget Presentation
 GOVERNMENT FINANCE OFFICERS ASSOCIATION Distinguished Budget Presentation Award PRESENTED TO Metropolitan Washington Airports Authority Virginia For the Fiscal Year Beginning January 1, 2007 President
air traffic statistics
 December 213 air traffic statistics Prepared by the Office of Finance Department of Internal Controls, Compliance and Financial Strategy Commercial Total Dom Int'l Passengers % Change Air Traffic Summary
Gerry Laderman SVP Finance, Procurement and Treasurer
 Gerry Laderman SVP Finance, Procurement and Treasurer Safe Harbor Statement Certain statements included in this release are forward-looking and thus reflect our current expectations and beliefs with respect
AIR CANADA REPORTS 2010 FIRST QUARTER RESULTS Operating loss narrows; revenue and traffic growth reflect strengthening economy
 AIR CANADA REPORTS 2010 FIRST QUARTER RESULTS Operating loss narrows; revenue and traffic growth reflect strengthening economy MONTRÉAL, May 6, 2010 Air Canada today reported a reduced operating loss of
Spirit Airlines Reports Third Quarter 2015 Pre-Tax Margin of 26.9 Percent
 October 27, 2015 Spirit Airlines Reports Third Quarter 2015 Pre-Tax Margin of 26.9 Percent MIRAMAR, Fla., Oct. 27, 2015 (GLOBE NEWSWIRE) -- Spirit Airlines, Inc. (NASDAQ:SAVE) today reported third quarter
March 4, Investor Conference
 March 4, 2014 Investor Conference Disclaimer This Investor Presentation is provided for your general information and convenience only, is current only as of its date and does not constitute an offer to
Heathrow (SP) Limited
 Limited") 28 April 2014 Heathrow (SP) Limited Results for three months ended 31 March 2014 Strong operational and financial performance at the outset of the new regulatory period Highest ever passenger satisfaction
28 April 2014 Heathrow (SP) Limited Results for three months ended 31 March 2014 Strong operational and financial performance at the outset of the new regulatory period Highest ever passenger satisfaction
August Air Traffic Statistics. Prepared by the Office of Corporate Risk and Strategy
 August 215 Air Traffic Statistics Prepared by the Office of Corporate Risk and Strategy Metropolitan Washington Airports Authority Air Traffic Statistics Table of Contents Summary Air Traffic Summary...
Spirit Airlines Reports Second Quarter 2018 Results
 Spirit Airlines Reports Second Quarter 2018 Results MIRAMAR, Fla., July 25, 2018 - Spirit Airlines, Inc. (NYSE: SAVE) today reported second quarter 2018 financial results. GAAP net income for the second
May Air Traffic Statistics. Prepared by the Office of Corporate Risk and Strategy
 May 214 Air Traffic Statistics Prepared by the Office of Corporate Risk and Strategy Commercial Total Int'l Dom Air Traffic Summary May 214 Passenger Activity (in Millions) Current Month Year-to-Date Last
Columbus Regional Airport Authority. Financial Statements. July 31, Respectfully Submitted. Randy Bush, CPA, CIA. Chief Financial Officer
 Columbus Regional Airport Authority Financial Statements July 31, 2018 Respectfully Submitted Randy Bush, CPA, CIA Chief Financial Officer Unaudited for internal purposes CRAA Operating Revenue & Expenses
Investor Relations Update October 25, 2018
 General Overview Investor Relations Update Revenue The company expects its fourth quarter total revenue per available seat mile (TRASM) to be up approximately 1.5 to 3.5 percent year-over-year. Fuel Based
OPERATING AND FINANCIAL HIGHLIGHTS. Subsequent Events
 Copa Holdings Reports Net Income of US$113.1 Million and EPS of US$2.57 for the First Quarter of 2015 Excluding special items, adjusted net income came in at US$106.0 million, or EPS of US$2.41 per share
September Air Traffic Statistics. Prepared by the Office of Corporate Risk and Strategy
 September 214 Air Traffic Statistics Prepared by the Office of Corporate Risk and Strategy Air Traffic Summary September 214 Commercial Total Dom Int'l Passengers % Change Passenger Activity (in Millions)
OPERATING AND FINANCIAL HIGHLIGHTS
 Copa Holdings Reports Financial Results for the Fourth Quarter of 2018 Excluding special items, adjusted net profit came in at $44.0 million, or Adjusted EPS of $1.04 Panama City, Panama --- February 13,
American Airlines Group Reports Second-Quarter Profit
 NEWS RELEASE American Airlines Group Reports Second-Quarter Profit 7/28/2017 FORT WORTH, Texas American Airlines Group Inc. (NASDAQ:AAL) today reported its second-quarter 2017 results, including these
Land area 1.73 million km 2 Queensland population (as at December 2016) Brisbane population* (preliminary estimate as at 30 June 2016)
 Brisbane population* (preliminary estimate as at 30 June 2016)") Queensland - 11 Queensland OVERVIEW Queensland is nearly five times the size of Japan, seven times the size of Great Britain, and two and a half times the size of Texas. Queensland is Australia s second
Queensland - 11 Queensland OVERVIEW Queensland is nearly five times the size of Japan, seven times the size of Great Britain, and two and a half times the size of Texas. Queensland is Australia s second
Spirit Airlines Reports First Quarter 2018 Results
 Spirit Airlines Reports First Quarter 2018 Results MIRAMAR, Fla., April 26, 2018 - Spirit Airlines, Inc. (NYSE: SAVE) today reported first quarter 2018 financial results. For the first quarter 2018, Spirit
air traffic statistics
 July 23 air traffic statistics Prepared by the Office of Finance Department of Internal Controls, Compliance and Financial Strategy Air Traffic Summary July 23 Below is a summary of the July 23 Air Traffic
SKYWEST, INC. ANNOUNCES THIRD QUARTER 2012 RESULTS
 NEWS RELEASE For Further Information Contact: Michael J. Kraupp Chief Financial Officer and Treasurer Telephone: (435) 634-3212 Fax: (435) 634-3205 FOR IMMEDIATE RELEASE: November 7, 2012 SKYWEST, INC.
AMERICAN AIRLINES GROUP REPORTS RECORD FEBRUARY TRAFFIC AND CAPACITY
 Corporate Communications 817-967-1577 mediarelations@aa.com Investor Relations 817-931-3423 investor.relations@aa.com FOR RELEASE: Tuesday, AMERICAN AIRLINES GROUP REPORTS RECORD FEBRUARY TRAFFIC AND CAPACITY
Copa Holdings Reports Net Income of US$113.9 Million for the Fourth Quarter of 2013
 Copa Holdings Reports Net Income of US$113.9 Million for the Fourth Quarter of 2013 Panama City, Panama --- February 12, 2014. Copa Holdings, S.A. (NYSE: CPA), today announced financial results for the
January Air Traffic Statistics. Prepared by the Office of Marketing & Consumer Strategy
 January 218 Air Traffic Statistics Prepared by the Office of Marketing & Consumer Strategy This report includes only data submitted by airlines as of the date of publication: March 21, 218. Reports are
EXHIBIT E to Signatory Airline Agreement for Palm Beach International Airport RATE AND FEE SCHEDULE
 EXHIBIT E to Signatory Airline Agreement for Palm Beach International Airport RATE AND FEE SCHEDULE SECTION I - DEFINITIONS The following words, terms and phrases used in this Exhibit E shall have the
AMERICAN AIRLINES GROUP REPORTS RECORD DECEMBER TRAFFIC RESULTS
 Corporate Communications 817-967-1577 mediarelations@aa.com Investor Relations 817-931-3423 investor.relations@aa.com FOR RELEASE: Tuesday, AMERICAN AIRLINES GROUP REPORTS RECORD DECEMBER TRAFFIC RESULTS
American Airlines Group Reports December Traffic
 NEWS RELEASE American Airlines Group Reports December Traffic 1/11/2017 FORT WORTH, Texas, Jan. 11, 2017 American Airlines Group (NASDAQ:AAL) today reported December and full year 2016 traffic results.
Heathrow (SP) Limited
 Limited") Draft v2.0 10 Feb Heathrow (SP) Limited Results for year ended 31 December 2013 24 February 2014 Strong operational and financial performance in 2013 Passenger satisfaction at record high and over 72 million
Draft v2.0 10 Feb Heathrow (SP) Limited Results for year ended 31 December 2013 24 February 2014 Strong operational and financial performance in 2013 Passenger satisfaction at record high and over 72 million
Financial Proposal for Gwinnett County Airport Briscoe Field
 Financial Proposal for Gwinnett County Airport Briscoe Field Financial Proposal For the Lease, Operation and Improvement RP039-11 of GWINNETT COUNTY AIRPORT BRISCOE FIELD Presented To Gwinnett County Board
2Q 2017 Earnings Call. July 19, 2017
 2Q 2017 Earnings Call July 19, 2017 Safe Harbor Statement Certain statements included in this presentation are forward-looking and thus reflect our current expectations and beliefs with respect to certain
October Air Traffic Statistics. Prepared by the Office of Corporate Risk and Strategy
 October 214 Air Traffic Statistics Prepared by the Office of Corporate Risk and Strategy Metropolitan Washington Airports Authority Air Traffic Statistics Table of Contents Summary Air Traffic Summary...
Dulles Corridor Metrorail Project Update Dulles Area Transportation Association August 25, 2009
 Dulles Corridor Metrorail Project Update Dulles Area Transportation Association August 25, 2009 Patty Nicoson President Dulles Corridor Rail Association Proposed Toll Rate Increase on Dulles Toll Road
February Air Traffic Statistics. Prepared by the Office of Corporate Risk and Strategy
 February 215 Air Traffic Statistics Prepared by the Office of Corporate Risk and Strategy Commercial Total Dom Int'l Passengers % Change Air Traffic Summary February 215 Passenger Activity (in Millions)
Greater Orlando Aviation Authority
 Greater Orlando Aviation Authority Orlando International Airport & Orlando Executive Airport Budgets Fiscal Year 2017-2018 Greater Orlando Aviation Authority Orlando, Florida Greater Orlando Aviation Authority
INVESTOR PRESENTATION. Imperial Capital Global Opportunities Conference September 2015
 INVESTOR PRESENTATION Imperial Capital Global Opportunities Conference September 2015 Forward-looking Statements This presentation contains forward-looking statements within the meaning of the Private
Copa Holdings Reports Net Income of US$51.9 Million for the Fourth Quarter of 2008 and US$152.2 Million for Full Year 2008
 Copa Holdings Reports Net Income of US$51.9 Million for the Fourth Quarter of 2008 and US$152.2 Million for Full Year 2008 Panama City, Panama --- February 19, 2009. Copa Holdings, S.A. (NYSE: CPA), parent
Silver Line Operating Plan
 Customer Service and Operations Committee Information Item IV-A December 6, 2012 Silver Line Operating Plan Washington Metropolitan Area Transit Authority Board Action/Information Summary Action Information
Oct-17 Nov-17. Sep-17. Travel is expected to grow over the coming 6 months; at a slightly faster rate
 Analysis provided by TRAVEL TRENDS INDEX SEPTEMBER 2018 CTI reading of.8 in September 2018 indicates that travel to or within the U.S. grew 1.6% in September 2018 compared to September 2017. LTI predicts
ANA Reports Record Profits for FY2012
 ANA HOLDINGS NEWS ANA Reports Record Profits for FY2012 TOKYO April 30, 2013 - ANA Holdings today reports consolidated financial for the fiscal year ended March, 2013. Financial and Operational Highlights
November Air Traffic Statistics. Prepared by the Office of Corporate Risk and Strategy
 November 214 Air Traffic Statistics Prepared by the Office of Corporate Risk and Strategy Air Traffic Statistics Table of Contents Summary Air Traffic Summary... 1 SH&E Air Traffic Schedule Activity...
METROPOLITAN WASHINGTON AIRPORTS AUTHORITY. January 1 through December 31, With
 METROPOLITAN WASHINGTON AIRPORTS AUTHORITY 2016 January 1 through December 31, 2016 Your With Reagan National Airport Dulles International Airport Dulles Corridor Metrorail Dulles Toll Road Geographically