December 1 st, MAD. Mohammed ABDELJALIL million MAD(*) collaborators(*) 35.9 million tons(*)
|
|
|
- Elvin Welch
- 6 years ago
- Views:
Transcription

1 ANNUAL REPORT 2012
2 2012
3

4 04 ANNUAL REPORT 2012 MARSA MAROC IN BRIEF Corporate Name Date of establishment Legal status Registered capital Headquarters President of the Executive Board Sector of activity Turnover Staff Global traffic Operated ports Société d Exploitation des Ports - Marsa Maroc December 1 st, 2006 Limited Company with Board of Directors and Supervisory Board MAD 175, Bd. Zerktouni Casablanca - Morocco Mohammed ABDELJALIL Terminals and ports operating within the framework of concessions million MAD(*) collaborators(*) 35.9 million tons(*) Nador, Al Hoceima, Tangier, Mohammedia, Casablanca, Jorf Lasfar, Safi, Agadir, Laayoune, Dakhla Provided services Ship related services (piloting, towing, mooring, victualing, etc); Goods related services (handling on board and on dockside, storing, checking, weighting, containers staffing and unstaffing etc); Related services (handling, goods stacking, loading and unloading of trucks, etc); Real-time Information (e-service Marsa Conteneur ). (*) To the end of 2012

5 05 CORPORATE PROFILE Marsa Maroc is a multi-speciality and the national leader in ports operation with a significant presence in all the kingdom s commercial ports. Since its creation by the end of 2006, Marsa Maroc started a development process with the ultimate objective to fully participate in improving the logistic performance of Morocco. Driven by the constant concern for service quality and thanks to its qualified human resources and performant equipments, Marsa Maroc strives to offer services along with the best international standards in all the national ports where it operates. Moreover, Marsa Maroc has the ambition to strengthen its presence in the international market in order to become a reference port operator at the regional scale. The obtaining of the Container Terminal 4 concession in the port of Tanger Med II and the Container Terminal 3 in the port of Casablanca confirm its ambition.

6 TABLE OF CONTENTS
7 PRESIDENT S WORD PRESENTATION OF MARSA MAROC Management bodies Organization Chart HIGHLIGHTS Development Quality Citizenship 2012 ACTIVITY Traffic achievements Financial results FINANCIAL STATEMENTS Balance sheet (Assets) Balance sheet (Liabilities) Profit and loss account Funds statement Statement of cash flows CONTACTS

8 08 PRESIDENT S WORD ANNUAL REPORT 2012
9 09 With its structuring projects, 2012 has been a development-driven year. Mohammed ABDELJALIL Chairman of the Executive Board With its structuring projects, 2012 has been a development-driven year. First, the vertical storage space at the Ro-Ro terminal of Casablanca s port inaugurated in April 2012 by His Majesty King Mohammed VI May God Assists Him. This major infrastructure that meets international norms and standards is truly the flagship of this type of terminals at the regional level. Offering a large capacity of vehicles hosting as well as processing a wide range of services with high added value, it intends to support the strong dynamic of vehicles import and export business. The other key event of this year that strengthens our Cap 15 project, by pursuing up our development projects, was undoubtedly the obtaining of the Container Terminal 3 concession at the port of Casablanca. With this new terminal, Marsa Maroc will process about TEUs in the port of Casablanca reinforcing thus our leadership in this strategic activity. Other important achievements are also part of our strategic vision, in particular the acquisition of high capacity cranes that can handle Post- Panamax vessels reaching up to 17 rows of containers. Furthermore, the subcontracting contract for passengers, cars and cruises activity at the Port of Tangier is a recognition by the market of our expertise and know-how. Moreover, we remain committed to our values and strongly believe in our role as a corporate citizen. This year, we renewed our commitment in areas such as education and environment. We are particularly proud of the distinction that we have been awarded by Mohammed VI Foundation for the Protection of the Environment in the field of environmental protection and «clean beaches». Regarding the achievements, we maintained our leadership by draining 48% of the national port traffic. As far as our financial performance is concerned, our turnover stood at million MAD registering an increase of 2% compared to the previous year. These achievements reinforce our determination to pursue our business plan in order to strengthen the position of Marsa Maroc as the national port sector leader as a basis for its future international expansion. This significant investment confirms our ambition to meet our customers needs and provide them quality services. Also as part of our improvement, the certification during the year 2012 of the freight forwarding activity at the Port of Casablanca and renewal of the certification for bulk and general cargo activity at the port of Tanger Med I crown our efforts to establish a quality management system.


10 10 ANNUAL REPORT 2012 PRESENTATION OF MARSA MAROC Management bodies Supervisory Board : Mr Abdelaziz RABBAH Mr Younes TAZI Mr Abdelhak KHOUADRA Mr. Mohamed Jamal BENJELLOUN Mr Abdelhak BENDAHMANE Mr Jamal RAMDANE Minister of Equipment and Transport, Chairman of the Supervisory Board Vice-president of the Supervisory Board Representative of the Ministry of Economy and Finance Member of the Supervisory Board Secretary oh the Supervisory Board Shareholder of «La Société d Exploitation des Ports» Executive Board: Mohammed ABDELJALIL Chairman of the Executive Board El Mahjoub BAYRI Director and Tanger Med II Project Manager Mustapha SAHABI Financial Manager Rachid HADI Operations Manager at the Port of Casablanca Youssef BENNANI Development Manager


11 11 Organization Chart Chairman of the Executive Board Development Direction Port Operations Managers* Tanger Med Project Direction Technical Direction Financial Direction Human Resources Direction Information Systems Direction Purchase and General Affairs Direction Legal Matters Direction Internal Audit and Organization Direction (*) A total of eight: Nador, Tangier, Mohammedia, Casablanca, Jorf Lasfar, Safi, Agadir, Laâyoune.


12 HIGHLIGHTS 2012 Development Quality Citizenship
13

14 14 ANNUAL REPORT 2012 DEVELOPMENT Royal inauguration of the vertical storage space for vehicles at Casablanca s port His Majesty King Mohammed VI inaugurated on April 26 th, 2012, a new vertical storage space for vehicles at Casablanca s port. This storage space aims at meeting cars importers and exporters needs in terms of saving time, hosting capacity and the quality of service. The project required a budget of 168 million MAD. Occupying 5 levels, the storage space covers an area of m², i.e. a useful storage area of m². It has a nominal storage capacity of cars and will allow the handling of cars annually. It will be able to increase the storage capacity at Casablanca s port from to units. Meeting the international norms and standards, the building comprises zones of delivery and cars hosting as well as a zone dedicated to value-added services. Operational from May 2012, the valueadded services zone offers related services such as preparation, paint retouching or washing cars in compliance with the specific needs of each client. Through this structuring project, Marsa Maroc aims at going along the strong dynamism that the cars import and export activity witnesses these last years.


15 15 Marsa Maroc awarded a provisional concession to operate Container Terminal 3 - CT3- of Casablanca s port On Tuesday, December 11 th, 2012, Marsa Maroc was awarded a provisional concession to operate Container Terminal 3 CT3- at Casablanca s port. With this success, Marsa Maroc strengthens its leadership in the national port market by increasing its capacity in handling domestic container traffic to about TEUs at Casablanca s port. This new container terminal which offers a 530 linear meters of quay with a depth of 12.5 to 14 meters and 30 hectares of land will be equipped of 4 gantry cranes and 13 RTG. Its commercial startup date is scheduled for August Under the terms of the concession agreement, which will bind it to the National Ports Agency (ANP) for a period of 30 years, Marsa Maroc will be committed to provide, for the good functioning of CT3, all superstructures, equipment and necessary human resources with an investment of about 850 million MAD. The signing of a subcontracting agreement between Marsa Maroc and the SAPT Marsa Maroc and the Planning Company for the Restructuring of Tangier s Port Zone SAPTsigned on October 1 st 2012, a subcontracting agreement for the operation of ferry and cruise ships terminal at Tangier s port. Under the terms of the subcontracting agreement, Marsa Maroc will make use, for a period of one year renewable by tacit consent and capped at three years, of its expertise and know-how for the management of passengers, vehicles and cruises activities.

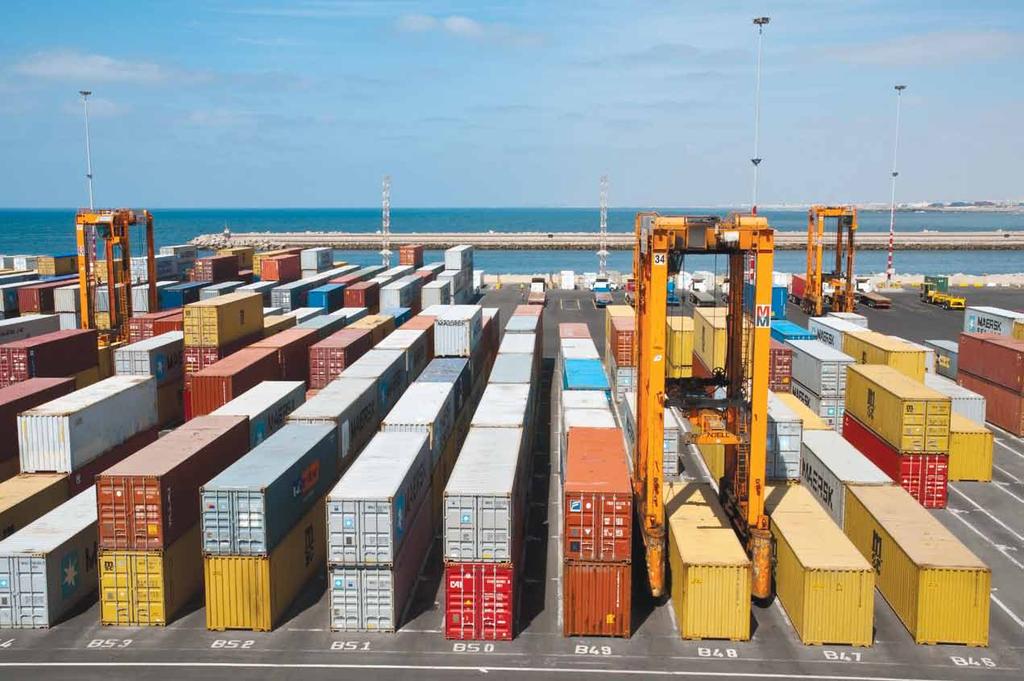
16 16 ANNUAL REPORT 2012 Advances in the multi-users Container Terminal project CT4 of the port of Tanger Med II The signing with TMSA in June 2009, of the concession agreement of CT4 of the port of Tanger Med II embodies Marsa Maroc s major strategic development in containers business and this in conformity with the business plan CAP 15 developed in This project, that strengthens Marsa Maroc s leadership in the port sector, will gradually be put into operation and partly commissioned starting from February To support this important project, Marsa Maroc has already carried out a series of measures aiming at supporting the project in its preliminary stage and related to various projects such as: Project financing ; Assistance and consultancy in project management ; Market studies, traffic and costs. Two gantry cranes for the operation of post-panamax shipsat Casablanca s port Marsa Maroc has strengthened its equipment fleet with the purchase of two new container gantry cranes for Casablanca s port. These gantry cranes, which will reinforce the equipments of the Eastern Terminal, allow, since August 2012, treat post-panamax vessels reaching 17 rows and handle twin-lift containers (i.e. the handling of two full 20 feet containers at a same time) with a total load of 65 tons. In addition, this new method allows 35 handling movments ship movements per hour. This investment of over 148 million MAD goes with the evolution of the marine industry, especially in terms of the size of container ships and reflects the commitment of Marsa Maroc to offer its clients quality services through the improvement of containers loading and unloading rates and the reduction of ships lengths of stays.

17 17 The participation of Marsa Maroc in national and international exhibitions During the last quarter of 2012, Marsa Maroc took part in three important events gathering international professionals of transport and logistics. It participated in Morocco to the second edition of the International Exhibition of Transport, Mobility and Logistics, LOGISTRA, which took place from September 5 th to September 9 th, 2012, at the Office of Shows and Exhibitions in Casablanca. Marsa Maroc also participated to the International Exhibition of Solutions for Transport and Logistics in Dakar and the Atlantic Exhibition of Logistics and Transport (SALT) in Tenerife that took place respectively from November 15 th to November 17 th and from November 21 st to November 23 rd, Inaugurated by Mr Abdelaziz Rabbah, Minister of Equipment and Transport, the Dakar and Tenerife exhibitions have honored Morocco as an emerging logistic platform through the promotion of a moroccan global offer of logistics. During these three events, Marsa Maroc s stand was a forum of exchange and communication with local and foreign visitors who were informed about the flagship development projects of the company.

18 18 ANNUAL REPORT 2012 QUALITY Certification of Freight Forwarding activity at Casablanca s Port Marsa Maroc was granted in July 2012, the ISO version certification for: sales and operations of unloading, loading of trailers and containers and storage of goods». This certification project which aims at answering the requirements of customers and improve their satisfaction through the implementation of process, took place for a period of one year. It crowns the efforts made by the operations management at the port of Casablanca for the establishment of a quality management system for the Freight Forwarding activity. The renewal of certification of the bulk and general cargo terminal at the Port of Tanger Med I Following the first follow-up audit managed by TUV Rheinland, the ISO version certification that was granted to Marsa Maroc in June 2011, for: Management of terminals and port quays at the Port of Tanger Med I, was renewed. The renewal of this certification is a recognition of Marsa Maroc s commitment to anchoring a quality management system for the handling of bulk and general cargo traffics at the port of Tanger Med I.


19 19 CITIZENSHIP Marsa Maroc awarded the Commitment Prize and Blue Flag for clean beaches operation Her Royal Highness Princess Lalla Hasna chaired in Skhirat on Saturday May 26 th, 2012, the Princess Lalla Hasna Trophy Ceremony for «clean beaches 2011». During this ceremony, Marsa Maroc received two distinctions. Firstable, it was awarded the commitment prize for raising the awareness of holiday makers about the preservation of the environment. Secondly, it was awarded and for three consecutive years, the Blue Flag for clean beaches operation. Construction of a childcare center Related to its commitment towards for better schooling project, Marsa Maroc has built and equipped a childcare center in Oursstek village located in Oukaimeden region. Inaugurated on March 4 th, 2012, the childcare center hosted 20 children during the first year and provided reading and writing courses to women from Oursstek village. Eco-school Program : For a better environment Within the framework of the Eco-school and clean beaches programs initiated by Mohammed VI Foundation for the Protection of Environment and in commemoration of the World Environment Day, Marsa Maroc, faithful to its vocation of a corporate citizen, organized in coordination with Bayti Hayati Association, an action to raise students awareness on the protection and preservation of beaches. This consciousness raising operation undertaken in four schools in Casablanca-Anfa and Bouznika, took place from June 5 th to June the 8 th 2012.
20 ACTIVITY 2012 TRAFFIC ACHIEVEMENTS FINANCIAL RESULTS
21
22 22 ANNUAL REPORT 2012 TRAFFIC ACHIEVEMENTS Marsa Maroc s market share in the national container traffic In 2012, Marsa Maroc has attracted almost 48% of the national port traffic, in near-stagnation in comparison with the last year. Marsa Maroc upholds its leading position in the containerized segment with a market share of 62%. 7% 50% 31% MM Casablanca MM Agadir Somaport Tanger Med I 12% Traffic handled by Marsa Maroc GLOBAL TRAFFIC: Marsa Maroc handled in 2012 a total traffic of 35.9 million tons, registering in comparison with last year, a slight rise of 2%.
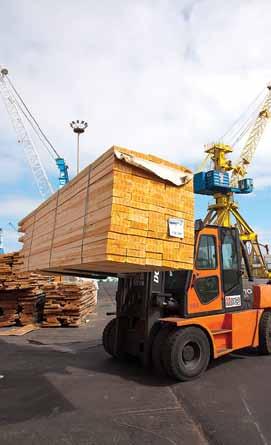
23 23 ACTIVITY SEGMENT TRAFFIC Dry bulks and liquid bulks handled by Marsa Maroc maintained their growth trend with a respective increase of 4% and 2%. As for the conventional and roll on roll off segments, they registered a significant decrease in terms of volume. The liquid bulks segment recorded a volume of over 15.7 million tons, registering a slight increase of 2% due to the increase of hydrocarbons imports, and more specifically crude oil in the port of Mohammedia and this, further to the starting up of La Samir s new facilities Hydrocarbons Vegetal oils
24 24 ANNUAL REPORT 2012 TRAFFIC ACHIEVEMENTS The solid bulk segment has reached more than 11.4 million tons thereby registering an increase of 4% in comparison with last year. This increase is due, on one hand, to the increase in cereals traffic and growth of sugar traffic, a result of poor agricultural year which affected both segments and, on the other hand, to the handling of new traffics including iron ore in the port of Agadir and clinker for export in the port of Jorf Lasfar
25 25 The container traffic segment remained nearly the same registering a volume of over TEU (Twenty Feet Equivalent Unit). A decrease in traffic of about 2% was registered in the port of Agadir due especially to the decline of citrus fruits and early vegetables traffics caused by bad weather. This decrease has been made up by a slight revival of the container traffic in the port of Casablanca due to the growth of the global market as well as the performance of our main costumers during EVOLUTION OF THE CONTAINER TRAFFIC BY PORT IN TEU Casablanca Agadir The conventional traffic segment underwent a 11% fall setting at 2,5 million tons. At the origin of this decline, the decrease of steel traffic in the port of Casablanca caused essentially by the decline of the steel companies activity and the tough competitiveness in this business unit. EVOLUTION OF MAIN CONVENTIONAL TRAFFICS IN TONS
26 26 ANNUAL REPORT 2012 TRAFFIC ACHIEVEMENTS The new vehicles and engines segment underwent a decrease of 11% in comparison with the previous year with a volume of units handled at the port of Casablanca. This decrease is mainly due to the transfer of Renault s export traffic from the port of Casablanca to Tanger Med port. EVOLUTION OF VEHICLES TRAFFIC IN CASABLANCA S PORT The passengers traffic segment amounted to 2.01 million passengers including cruisers registering a decline of 10%. The most significant decrease of 35% affected Nador s port and it was caused mainly by the weak maritime offer due to the difficulties facing the Moroccan flag and the competitiveness of Melilia s port. EVOLUTION OF PASSENGERS TRAFFIC BY PORT
27 27 TRAFFIC BY PORT : In 2012, all ports operated by Marsa Maroc had their activity grow or stagnate compared to last year with the exception of Tangier and Laayoune ports. The port of Jorf Lasfar registered the most significant increase in traffic with a growth of about 9%. TRAFFIC EVOLUTION BY PORT IN TONS NADOR TANGER MOHAMMEDIA CASABLANCA JORF-LASFAR SAFI AGADIR LAAYOUNE DAKHLA
28 28 ANNUAL REPORT 2012 FINANCIAL RESULTS Turnover evolution Marsa Maroc s turnover for 2012 reached million versus million MAD in 2011, an increase of 2% and an additional turnover of 39 million MAD. Compared to the initial forecasts, the turnover of 2012 was up by 3%. Port handling services representing 91% of Marsa Maroc s turnover generated revenues of million MAD, an increase of 2% compared to The main services are handling (1.125 million MAD ), storage (395 million MAD ) and various services (286 million MAD ). The services provided to ships and which mainly include towing, steering and mooring achieved in 2012 a turnover of 156 million MAD, a slight decrease of 1% compared to Other operating activities totaled a turnover of 30 million MAD, a decrease of 10% compared to TURNOVER EVOLUTION IN MILLIONS OF MAD (*) (*) Forecasts
29 29 BREAKDOWN OF 2012 TURNOVER BREAKDOWN OF 2012 TURNOVER BY PORT HANDLING SERVICES SERVICES TO VESSELS OTHER SERVICES
30 30 ANNUAL REPORT 2012 FINANCIAL RESULTS Evolution of operating expenses The operating expenses in 2012 amounted to 1,592 million MAD against million MAD reported in 2011, which means a 2% increase. Changes in operating expenses were recorded as follows: Purchases (-5%), external expenses (-3%) and taxes and duties (4%) and personnel expenses (9%). The 2012 operating expenses underwent a decrease of 2% compared to the forecasts (*) (*) Forecasts
31 31 Evolution of income The 2012 operating income amounted to 446 million MAD versus 426 million MAD in 2011, an increase of 5%. Thus increasing by 28%, compared to the forecasts. The net income of 2012 reached 192 million MAD versus 206 million MAD achieved in 2011, a decrease of 7%. EVOLUTION OF OPERATING INCOME AND NET INCOME IN MILLIONS OF MAD Operating income 0 (*) Forecasts (*) Net income 2012 Capital budget performance Compared to the 2012 budget allowance amounting to 458 million MAD, the commitments at the end of 2012 reached 272 million MAD, i.e. a commitment rate of 59%. The commitments reached 40% for equipments, 27% for infrastructures and 89% for studies and financial participations , ,
32 FINANCIAL STATEMENTS 2012 BALANCE SHEET (ASSETS) BALANCE SHEET (LIABILITIES) PROFIT AND LOSS ACCOUNT MANAGEMENT ACCOUNTS FUNDS STATEMENT
33
34 34 ANNUAL REPORT 2012 F I X E D A SS E TS C U RR E N T A SS E TS C A S H ASSETS BALANCE SHEET (ASSETS) GROSS Financial year from 01/01/2012 to 31/12/2012 FINANCIAL YEAR DEPRECIATIONS AND PROVISIONS NET 31/12/2012 PREVIOUS FINANCIAL YEAR NET 31/12/2011 DEFERRED EXPENSES RECORDED AS ASSET (A) INTANGIBLE FIXED ASSETS (B) , , , ,63 * Other intangible fixed assets , , , ,63 TANGIBLE FIXED ASSETS (C) , , , ,96 * Lands , , , ,70 * Buildings , , , ,78 * Technical fittings, material and equipment , , , ,73 * Transportation equipment , , , ,86 * Furniture, office equipment and various facilities , , , ,87 * Other tangible fixed assets , , , ,53 * Tangible fixed assets in process , , ,49 CAPITAL ASSETS (D) , , , ,41 * Fixed advances , , , ,26 * Other financial claims , , , ,15 * Equity Securities , , , ,00 ASSET TRANSLATION ADJUSTEMENT (E) TOTAL I (A+B+C+D+E) , , , ,00 STOCKS (F) , , , ,90 * Supplies , , , ,40 * Work in process inventory , , ,50 FLOATING ASSET RECEIVABLES (G) , , , ,57 * Advances to suppliers, advances and payments on account , , ,00 * Trade account receivable and related accounts , , , ,68 * Staff , , ,58 * Government , , ,43 * Other receivables , , , ,97 * Accruals , , ,91 SECURITIES AND INVESTMENT SECURITIES (H) , , ,34 TOTAL II (F+G+H+I) , , , ,81 CASH RESOURCES - ASSET , , , ,12 * Uncashed cheques and instruments , , , ,38 * Banks TG and CP , , ,62 * Cash, imprests and sums at disposal , , ,12 TOTAL III , , , ,12 GRAND TOTAL I + II + III , , , ,93
35 35 P R O P E R T Y A S S E T S L I Q U I D A S S E T S C A S H LIABILITIES BALANCE SHEET (LIABILITIES) Financial year from 01/01/2012 to 31/12/2012 FINANCIAL YEAR 31/12/2012 PREVIOUS FINANCIAL YEAR 31/12/2011 SHAREHOLDERS EQUITY , ,92 * Personal funds or registered capital , ,00 * Reserve , ,00 * Other reserves , ,64 * Balance carried forward , ,62 * Income of the financial year , ,66 SHAREHOLDERS EQUITY TOTAL (A) , ,92 EQUIVALENT SHAREHOLDERS EQUITY (B) , ,55 * Amortization expense , ,55 FINANCING DEBTS (C) , ,13 * Other financing debts , ,13 PERMANENT PROVISIONS FOR RISK EXPOSURE AND EXPENSES (D) , ,58 * Provisions for risk exposures , ,36 * Provisions for expenses , ,22 RATE ADJUSTMENT (E) , ,05 * Financial debts decrease , ,05 TOTAL I (A+B+C+D+E) , ,23 DEBTS OF THE FLOATING LIABILITIES (F) , ,34 * Trade accounts payable and related accounts , ,00 * Advances and payments on account from customers , ,11 * Staff , ,47 * Social institutions , ,57 * Government , ,32 * Current accounts 287,08 232,64 * Other creditors , ,50 * Liability adjustement accounts , ,73 TRANSLATION ADJUSTEMENTS LIABILITIES (H) , ,57 TOTAL II (F + G + H) , ,91 CASH RESOURCES - LIABILITY , ,79 * Banks (credit balances) , ,79 TOTAL III , ,79 GENERAL TOTAL I + II + III , ,93
36 36 ANNUAL REPORT 2012 O P E R A T I N G F I N A N C I N G PROFITAND LOSS ACCOUNT PROFIT AND LOSS ACCOUNT (excluding tax) OPERATIONS FINANCIAL YEAR OPERATIONS Financial year from 01/01/2012 to 31/12/2012 PREVIOUS FINANCIAL YEAR TOTALS OF THE FINANCIAL YEAR 31/12/2012 C = A + B TOTALS OF THE PREVIOUS FINANCIAL YEAR 31/12/2011 D A B I. OPERATING INCOME , , , ,49 * Sales of assets and services produced , , , ,44 * Operating recovery: transfers and expenses , , ,05 TOTAL I , , , ,49 II. OPERATING COSTS , , , ,33 * Consumed purchases of materials and supplies , , , ,22 * Other external expenses , , , ,48 * Duties and taxes , , ,14 * Payroll , , ,00 * Operating expenses ,80 0, , ,49 TOTAL II , , , ,33 III. OPERATING RESULTS (I - II) , , , ,16 IV. FINANCIAL INCOME , , ,94 * Income of investments and other long-term investments ,00 * Exchange gains , , ,28 * Interest income and other financial income , , ,70 * Financial reversals : transfers of expenses ,96 TOTAL IV , , ,94 V. FINANCIAL EXPENSES , , ,29 * Interest expenses , , ,48 * Exchange loss , , ,54 * Other financial expenses , , ,85 * Financial expenses , , ,42 TOTAL V , , ,29 VI. FINANCIAL INCOME (IV - V) , , ,65 VII. CURRENT INCOME (III - VI) , , , ,81 VIII. NON CURRENT INCOME , , , ,72 * Disposals income , , ,90 * Other non current income , , , ,79 * Non current reversals : transfers of expenses , , ,03 TOTAL VIII , , , ,72
37 37 N O N C U R R E N T PROFITAND LOSS ACCOUNT PROFIT AND LOSS ACCOUNT (excluding tax) OPERATIONS OPERATIONS FINANCIAL YEAR Financial year from 01/01/2012 to 31/12/2012 PREVIOUS FINANCIAL YEAR TOTALS OF THE FINANCIAL YEAR 31/12/2012 C = A + B TOTALS OF THE PREVIOUS FINANCIAL YEAR 31/12/2011 D A B TOTAL VIII , , , ,72 IX. NON CURRENT EXPENSES , , , ,30 * Net worth of transferred fixed assets depreciation , , ,58 * Other non current expenses , , , ,75 * Non current depreciation and estimated expenses , , ,97 TOTAL IX , , , ,30 X. NON CURRENT INCOME (VIIIX) , , , ,58 XI. INCOME BEFORE TAXES (VII+X) , , , ,23 XII. INCOME TAXES , , ,57 XIII. NET INCOME (XI - XII) , , , ,66 XIV. INCOME TOTAL (I + IV + VIII) , , , ,15 XV. EXPENSE TOTAL (II + V + IX + XII) , , , ,49 XVI NET INCOME (Income total - Expense total) , , , ,66
38 38 ANNUAL REPORT 2012 MANAGEMENT ACCOUNTS REANALISIS FORM STATEMENT OF INCOME MANAGEMENT Period of 01/01/2012 to 31/12/2012 FINANCIAL YEAR 2012 PRIVIOUS YEAR 2011 I + I + PRODUCTION OF THE FINANCIAL YEAR : (1+2+3) , ,44 1 Purchases of produced goods and services , ,44 2 Inventory changes 3 Fixed assets produced by the company for itself II - CONSUMPTION OF THE FINANCIAL YEAR: (4+5) , ,70 4 Consumed purchases of materials and supplies , ,22 5 Other external expenses , ,48 III = VALUE ADDED (I -II ) , , Operating grants 7 - Duties and taxes , , Payroll , ,00 IV = EARININGS BEFORE INTEREST, TAXES, DEPRECIATION AND AMORTIZATION , , Other operating income 10 - Other operating expenses 11 + Operating reversals : transfers of expenses , , Operating expenses , ,49 V = OPERATING RESULTS (+ ou -) , ,16 VI + FINANCIAL INCOME , ,65 VII = CURRENT INCOME (+ OU -) , ,81 VIII + NON CURRENT INCOME , , Income taxes , ,57 IX = NET INCOME OF THE FINANCIAL YEAR (+ ou -) , ,66 II. SELFFINANCING CAPACITY - SELF-FINANCING 1 Net income of the financial year , , Operating expenses (1) , , Financial expenses (1) , , Non current expenses (1) , , Operating reversals (2) , , Financial reversals (2) , Non current reversals (2) (3) , , Disposals income , , Net worth of transferred fixed assets depreciation , ,58 I SELFFINANCING CAPACITY , ,21 10 Distribution of earnings , ,00 II SELF FINANCING , ,21 (1) Excluding the expenses relating to the treasury floating assets and liabilities (2) Excluding the reversals relating to the treasury floating assets and liabilities (3) Including reversals on investments grants
39 39 ASSETS CASH FLOW STATEMENT (Integrated funds investment in current assets) FINANCIAL YEAR 31/12//2012 (a) Financial year from 01/01/2012 to 31/12/2012 FINANCIAL YEAR 31/12/2011 (b) APPROPRIA- TIONS (c) VARIATIONS (a - b) RESOURCES (d) Permanent financing (1) , , ,86 Minus fixed asset (2) , , ,56 = WORKING CAPITAL (A) FUNCTIONAL (1-2) , , ,42 Floating assets (3) , , ,89 Minus floating assets (4) , , ,17 = FINANCING REQUIREMENT (B) GLOBAL (3-4) , , ,72 NET CASH (ASSET - LIABILITY = A - B , , ,30 ASSETS APPROPRIATIONS (a) FINANCIAL YEAR RESOURCES (b) PREVIOUS FINANCIAL YEAR APPROPRIATIONS (a) RESOURCES (b) I. PERMANENT RESOURCES OF THE FINANCIAL YEAR (FLOW) , ,90 SELF FINANCING (A) , ,21 Funds from operations , ,21 Disribution of earnings , ,00 DISPOSALS AND DECREASE OF CAPITAL ASSETS (B) , ,69 Disposals of intangible assets Disposals of tangible assets , ,90 Disposals of capital assets Non performing assets recovery , ,68 Intangible assets withdrawal , ,11 INCREASE IN CAPITALS AND EQUIVALENTS (C) Increase in capital, contributions Capital grants OTHER RESOURCES INCREASE IN FINANCING DEBTS (D) ,00 (net of redemption premiums) TOTAL 1 : PERMANENT RESOURCES , ,90 II. PERMANENT APPROPRIATIONS OF THE FINANCIAL YEAR (FLOW) , ,03 ACQUISITION AND INCREASE OF FIXED ASSETS (E) , ,49 Acquisitions of intangible assets , ,00 Acquisition of tangible assets , ,93 Acquisitions of capital assets ,00 Increase of non performing debt , ,56 REDEMPTION OF CAPITAL (F) REDEMPTION OF FINANCING DEBTS (G) , ,54 APPROPRIATIONS AS DEFERRED CHARGES (H) TOTAL II - PERMANENT APPROPRIATIONS (E + F + G + H) , ,03 III. VARIATION IN THE GLOBAL FINANCING REQUIREMENT (G.F.R) , ,95 IV. VARIATION IN CASH FLOW , ,92 GRAND TOTAL , , , ,90

40 CONTACTS 2012
41
 Fax : 0536 60 85 31 bouassam@marsamaroc.co.ma Al Hoceima : B.")
 - Fax : 0522 31 58 95 r_hadi@marsamaroc.")
42 22 ANNUAL REPORT 2012 CONTACTS HEAD QUARTER DEVELOPEMENT DIRECTION PORTS 175, Bd. Zerktouni Casablanca Maroc Tel. : Fax : Tel : Fax : y_bennani@marsamaroc.co.ma Nador : B.P. BB Béni-Ensar NADOR Tel : (6LG) Fax : bouassam@marsamaroc.co.ma Al Hoceima : B.P. BB Béni-Ensar NADOR Tel. : Fax : bouassam@marsamaroc.co.ma Tanger : Port de commerce B.P 305 Tanger Tel : à 45 Fax : m_sennouni@marsamaroc.co.ma Mohammedia : Port de Commerce - B.P 98 Mohammedia Tel : Fax : l_oujja@marsamaroc.co.ma Casablanca : Port des Almohades - Casablanca Tel : (15LG) - Fax : r_hadi@marsamaroc.co.ma

43 43 PORTS Jorf Lasfar : km 22 Route d El Jadida B.P. 407 Plateau Rl Jadida Tel : / /13 Fax : h_oubaha@marsamaroc.co.ma Safi : B.P 8 fond de Mer Safi Tel. : / Fax : r_abinouh@marsamaroc.co.ma Agadir : B.P. 36 Port d Agadir Tel. : Fax : k_mansour@marsamaroc.co.ma Laayoune : B.P. 48 Elmersa Tel. : Fax : a_bellat@marsamaroc.co.ma Dakhla : Nouveau Port de Dakhla B.P 335 Dakhla Tel. : / Fax : n_boumezzough@marsamaroc.co.ma
44
45
46 Head quarter 175, Bd Zerktouni Casablanca - Maroc Tel.: Fax :
Investor Presentation
 Investor Presentation Communication financière Publication semestrielle Octobre 2016 Company at a glance : the leading port operator in Morocco 36,1 millions of tons Traffic (2017) Mad 2 554 mn USD 278
Investor Presentation
 Investor Presentation Communication financière Publication semestrielle Octobre 2016 Company at a glance : the leading port operator in Morocco 36,3 millions of tons Traffic (2016) Mad 2 567 mn USD 254
A n n u al Report Annual Report 2008
 Annual Report Annual Report 2008 Company name : Société d exploitation des ports - Marsa Maroc Date of establishment : December 1 st, 2006 Legal status : Public Limited Company with Executive and Supervisory
Corporate profile : Marsa Maroc in brief ANNUAL REPORT ANNUaL REPORT Marsa Maroc is a multi-speciality port operator and the national
 4 Marsa Maroc in brief Corporate profile : Corporate name Date of establishment December 1 st, 2006 Société d exploitation des ports Marsa Maroc Marsa Maroc is a multi-speciality port operator and the
Marsa Maroc in brief. Corporate name : Société d Exploitation des Ports Marsa Maroc. Date of creation : December 1 st, 2006
 Marsa Maroc in brief Corporate name : Société d Exploitation des Ports Marsa Maroc Date of creation : December 1 st, 2006 Legal status : Public Limited Company with an Executive Board and a Supervisory
SERVICE QUALITY IMPROVEMENT AT THE CONTAINER TERMINAL OF THE PORT OF CASABLANCA. 12 th ASEAN PORT & SHIPPING &12 June, Jakarta, Indonesia
 SERVICE QUALITY IMPROVEMENT AT THE CONTAINER TERMINAL OF THE PORT OF CASABLANCA 12 th ASEAN PORT & SHIPPING 2014 11&12 June, Jakarta, Indonesia CONTENT Marsa Maroc - Background Main issues causing the
FOURTH QUARTER RESULTS 2017
 FOURTH QUARTER RESULTS 2017 KEY RESULTS In the 4Q17 Interjet total revenues added $5,824.8 million pesos that represented an increase of 10.8% over the revenue generated in the 4Q16. In the 4Q17, operating
FIRST QUARTER RESULTS 2017
 FIRST QUARTER RESULTS 2017 KEY RESULTS In the 1Q17 Interjet total revenues added $4,421.5 million pesos that represented an increase of 14.8% over the income generated in the 1Q16. In the 1Q17, operating
INTESA SANPAOLO VITA RESULTS AT 31 MARCH 2017 APPROVED:
 INTESA SANPAOLO VITA RESULTS AT 31 MARCH 2017 APPROVED: Assets under management at 145,908.2 million euros (143,735.3 million euros at December 2016 +1.5%) Financial liabilities (unit and index linked)
THIRD QUARTER RESULTS 2018
 THIRD QUARTER RESULTS 2018 KEY RESULTS In the 3Q18 Interjet total revenues added $ 6,244.8 million pesos that represented an increase of 7.0% over the revenue generated in the 3Q17. In the 3Q18, operating
THIRD QUARTER AND NINE MONTHS OF 2014 KEY RESULTS
 THIRD QUARTER AND NINE MONTHS OF 2014 KEY RESULTS In 3Q14 INTERJET total revenues were $ 3,643.4 million, representing an increase of 9.9% on revenues generated in the 3Q13. Accumulated 9M14 INTERJET total
OPERATING AND FINANCIAL HIGHLIGHTS SUBSEQUENT EVENTS
 Copa Holdings Reports Net Income of US$6.2 Million and EPS of US$0.14 for the Third Quarter of 2015 Excluding special items, adjusted net income came in at $37.4 million, or EPS of $0.85 per share Panama
OPERATING AND FINANCIAL HIGHLIGHTS. Subsequent Events
 Copa Holdings Reports Net Income of US$113.1 Million and EPS of US$2.57 for the First Quarter of 2015 Excluding special items, adjusted net income came in at US$106.0 million, or EPS of US$2.41 per share
PRESS RELEASE AEROPORTO GUGLIELMO MARCONI DI BOLOGNA S.p.A.: The Board of Directors approves the group results for the first nine months of 2017:
 PRESS RELEASE AEROPORTO GUGLIELMO MARCONI DI BOLOGNA S.p.A.: The Board of Directors approves the group results for the first nine months of 2017: Traffic growth continues with 6.3 million passengers (+6.7%
NORWEGIAN AIR SHUTTLE ASA QUARTERLY REPORT SECOND QUARTER 2006 [This document is a translation from the original Norwegian version]
![NORWEGIAN AIR SHUTTLE ASA QUARTERLY REPORT SECOND QUARTER 2006 [This document is a translation from the original Norwegian version]](/thumbs/74/71229964.jpg "NORWEGIAN AIR SHUTTLE ASA QUARTERLY REPORT SECOND QUARTER 2006 [This document is a translation from the original Norwegian version]") NORWEGIAN AIR SHUTTLE ASA QUARTERLY REPORT SECOND QUARTER 2006 SECOND QUARTER IN BRIEF had earnings before tax of MNOK 24.8 (20.6) in the second quarter. The operating revenue increased by 44 % this quarter,
NORWEGIAN AIR SHUTTLE ASA QUARTERLY REPORT SECOND QUARTER 2006 SECOND QUARTER IN BRIEF had earnings before tax of MNOK 24.8 (20.6) in the second quarter. The operating revenue increased by 44 % this quarter,
Volaris Reports Strong First Quarter 2015: 32% Adjusted EBITDAR Margin, 9% Operating Margin
 Volaris Reports Strong First Quarter 2015: 32% Adjusted EBITDAR Margin, 9% Operating Margin Mexico City, Mexico, April 22, 2015 Volaris* (NYSE: VLRS and BMV: VOLAR), the ultra-low-cost airline serving
NORWEGIAN AIR SHUTTLE ASA QUARTERLY REPORT FIRST QUARTER 2004 [This document is a translation from the original Norwegian version]
![NORWEGIAN AIR SHUTTLE ASA QUARTERLY REPORT FIRST QUARTER 2004 [This document is a translation from the original Norwegian version]](/thumbs/87/95085804.jpg "NORWEGIAN AIR SHUTTLE ASA QUARTERLY REPORT FIRST QUARTER 2004 [This document is a translation from the original Norwegian version]") NORWEGIAN AIR SHUTTLE ASA QUARTERLY REPORT 2004 IN BRIEF At the start of 2003, Norwegian has become a pure low-fare airline. The Fokker F-50 operations have been terminated, and during the quarter the
NORWEGIAN AIR SHUTTLE ASA QUARTERLY REPORT 2004 IN BRIEF At the start of 2003, Norwegian has become a pure low-fare airline. The Fokker F-50 operations have been terminated, and during the quarter the
First Half 2017 results Result improvement driven by solid traffic and unit revenue performance
 28 th July 2017 2017 results Result improvement driven by solid traffic and unit revenue performance FIRST HALF 2017 Robust traffic resulting in an improved load factor, up 1.4 pts compared to last year
GROUP ULJANIK PLOVIDBA CONSOLIDATED AUDITED FINANCIAL STATEMENTS FOR THE PERIOD JANUARY - DECEMBER 2014
 GROUP ULJANIK PLOVIDBA CONSOLIDATED AUDITED FINANCIAL STATEMENTS FOR THE PERIOD JANUARY - DECEMBER 2014 Pula, April 2015 CONTENT: Consolidated audited Financial Statements of GROUP ULJANIK PLOVIDBA with
Second Quarter to 30th September
 22 nd November 2007 FINANCIAL YEAR 2007-08 EXCELLENT SECOND QUARTER Operating income up 27.6% to 725 million euros Adjusted 1 operating margin of 12%, up 2 points Net income up 97% to 736 million euros
OPERATING AND FINANCIAL HIGHLIGHTS. Subsequent Events
 Copa Holdings Reports Net Income of $103.8 million and EPS of $2.45 for the Third Quarter of 2017 Excluding special items, adjusted net income came in at $100.8 million, or EPS of $2.38 per share Panama
Thank you for participating in the financial results for fiscal 2014.
 Thank you for participating in the financial results for fiscal 2014. ANA HOLDINGS strongly believes that safety is the most important principle of our air transportation business. The expansion of slots
THIRD QUARTER RESULTS 2017
 THIRD QUARTER RESULTS 2017 KEY RESULTS In the 3Q17 Interjet total revenues added $5,835.1 million pesos that represented an increase of 22.0% over the revenue generated in the 3Q16. In the 3Q17, operating
Consolidated Statement of Financial Position as at December 31, 2017
 86 Key Figures Consolidated Statement of Financial Position as at December 31, 2017 Assets in million December 31, 2017 December 31, 2016 Non-current assets Goodwill 19.3 19.3 Investments in airport operating
1.3% millionn euros. Net debt of 5.4 improvement. euros to. Financial Year. the Air. operating. equipped. ness and. also focus on.
 25 th July 2014 Financial Year 2014: First Half results SECOND QUARTER Revenues of 6.45 billion euros, upp 1.7% like-for-like; passenger unit revenue up 1.3% at constant currency thanks to strict capacity
OPERATING AND FINANCIAL HIGHLIGHTS
 Copa Holdings Reports Net Income of US$32.0 Million and EPS of US$0.72 for the Second Quarter of 2012 Excluding special items, adjusted net income came in at $58.6 million, or EPS of $1.32 per share Panama
Balance sheets and additional ratios
 Balance sheets and additional ratios amounts in millions unless otherwise stated Consolidated balance sheets Dutch guilders USD* June 30, December 31, June 30, December 31, 1997 1996 1997 1996 Fixed assets
Summary of Results for the First Quarter of FY2015/3
 Summary of for the First Quarter of FY2015/3 August 8, 2014 Tokyu Corporation (9005) http://www.tokyu.co.jp/ Contents Ⅰ.Executive Summary 2 Ⅱ.Conditions in Each Business 4 Ⅲ.Details of Financial for the
FIRST QUARTER RESULTS 2016
 FIRST QUARTER RESULTS 2016 KEY RESULTS In 1Q16 Interjet total revenues added $3,850.8 million pesos that represented an increase of 21.9% over the income generated in the 1Q15. In 1Q16 total passengers
Finnair Q Result
 Finnair Q1 2015 Result 7 May 2015 CEO Pekka Vauramo, Interim CFO Mika Stirkkinen 1 Turbulent market environment The weakness of the Finnish economy continued to be reflected in the demand in the first
OPERATING AND FINANCIAL HIGHLIGHTS. Subsequent Events
 Copa Holdings Reports Financial Results for the First Quarter of 2016 Excluding special items, adjusted net income came in at US$69.9 million, or EPS of US$1.66 per share Panama City, Panama --- May 5,
LOCATED AT THE GATEWAY OF THE TROPICAL PROVINCE, RIDING ON THE GROWTH MOMENTUM OF THE COUNTRY, WE ARE ON THE RIGHT TRACK OF TAKING OFF.
 LOCATED AT THE GATEWAY OF THE TROPICAL PROVINCE, RIDING ON THE GROWTH MOMENTUM OF THE COUNTRY, WE ARE ON THE RIGHT TRACK OF TAKING OFF. MANAGEMENT DISCUSSION INDUSTRY REVIEW Civil Aviation Industry in
OPERATING AND FINANCIAL HIGHLIGHTS
 Copa Holdings Reports Financial Results for the Fourth Quarter of 2015 Excluding special items, adjusted net income came in at $31.7 million, or EPS of $0.73 per share Panama City, Panama --- February
AEROFLOT ANNOUNCES FY 2017 IFRS FINANCIAL RESULTS
 AEROFLOT ANNOUNCES FY 2017 IFRS FINANCIAL RESULTS Moscow, 1 March 2018 Aeroflot Group ( the Group, Moscow Exchange ticker: AFLT) today publishes its audited financial statements in accordance with International
Copa Holdings Reports Record Earnings of US$41.8 Million for 4Q06 and US$134.2 Million for Full Year 2006
 Copa Holdings Reports Record Earnings of US$41.8 Million for 4Q06 and US$134.2 Million for Full Year 2006 Panama City, Panama --- March 7, 2007. Copa Holdings, S.A. (NYSE: CPA), parent company of Copa
Flughafen Wien Group Continues on Success Path in the First Quarter of 2016
 Flughafen Wien Group Continues on Success Path in the First Quarter of 2016 Upward revaluation of stake in Malta Airport and good business development lead to strong increase in the net profit for the
Spirit Airlines Reports First Quarter 2017 Results
 Spirit Airlines Reports First Quarter 2017 Results MIRAMAR, Fla., April 28, 2017 - Spirit Airlines, Inc. (NASDAQ: SAVE) today reported first quarter 2017 financial results. GAAP net income for the first
OPERATING AND FINANCIAL HIGHLIGHTS
 Copa Holdings Reports Financial Results for the Fourth Quarter of 2018 Excluding special items, adjusted net profit came in at $44.0 million, or Adjusted EPS of $1.04 Panama City, Panama --- February 13,
Summary of Results for the First Three Quarters FY2015/3
 Summary of Results for the First Three Quarters FY2015/3 February 10, 2015 Tokyu Corporation (9005) http://www.tokyu.co.jp/ Contents Ⅰ.Executive Summary 2 Ⅱ.Conditions in Each Business 5 Ⅲ.Details of Financial
Preliminary Figures FY 2016
 February 14, 2017 Preliminary Figures FY 2016 Capital Markets Day 2017 Tom Blades (CEO) Disclaimer This presentation has been produced for support of oral information purposes only and contains forwardlooking
STANSTED AIRPORT LIMITED REGULATORY ACCOUNTS PERFORMANCE REPORT FOR THE YEAR ENDED 31 MARCH Financial Review...1. Performance Report...
 PERFORMANCE REPORT CONTENTS Page Financial Review...1 Performance Report...3 Notes to the Performance Report...4 Stansted Regulatory Accounts PERFORMANCE REPORT Financial Review General overview Stansted
Q1 Fiscal 2018 Statistics
 Q1 Fiscal 2018 Statistics FedEx Corporation Financial and Operating Statistics First Quarter Fiscal 2018 September 19, 2017 This report is a statistical supplement to FedEx s interim financial reports
Copa Holdings Reports Net Income of $49.9 million and EPS of $1.18 for the Second Quarter of 2018
 Copa Holdings Reports Net Income of $49.9 million and EPS of $1.18 for the Second Quarter of 2018 Panama City, Panama --- Aug 8, 2018. Copa Holdings, S.A. (NYSE: CPA), today announced financial results
OPERATING AND FINANCIAL HIGHLIGHTS SUBSEQUENT EVENTS
 Copa Holdings Reports Financial Results for the Third Quarter of 2016 Excluding special items, adjusted net income came in at $55.3 million, or adjusted EPS of $1.30 per share Panama City, Panama --- November
PRESS RELEASE AEROPORTO GUGLIELMO MARCONI DI BOLOGNA S.p.A.: The Board of Directors approves the 2018 First Half Report.
 PRESS RELEASE AEROPORTO GUGLIELMO MARCONI DI BOLOGNA S.p.A.: The Board of Directors approves the 2018 First Half Report. Passenger traffic reached 4 million passengers (+5.3% versus H1 2017), thanks to
Interim Release Q3/9M 2017
 Overview by the Executive Board November 2, 207 In the first nine months of 207, the airports of the Fraport Group recorded strong passenger development. At approximately 48.9 million, passenger numbers
PRESS RELEASE AEROPORTO GUGLIELMO MARCONI DI BOLOGNA S.p.A.: the Board of Directors approves the Group Q Results.
 PRESS RELEASE AEROPORTO GUGLIELMO MARCONI DI BOLOGNA S.p.A.: the Board of Directors approves the Group Q1 2017 Results. Passenger traffic reached approx. 1.6 million passengers (+4.6% versus 2016), thanks
Copa Holdings Reports Net Income of US$51.9 Million for the Fourth Quarter of 2008 and US$152.2 Million for Full Year 2008
 Copa Holdings Reports Net Income of US$51.9 Million for the Fourth Quarter of 2008 and US$152.2 Million for Full Year 2008 Panama City, Panama --- February 19, 2009. Copa Holdings, S.A. (NYSE: CPA), parent
FINANCIAL YEAR Key data
 March 8 th, 2012 FINANCIAL YEAR 2011 2011: A TOUGH YEAR Economic environment and geopolitical crises weigh on activity Insufficient level of unit revenues to absorb higher fuel bill Revenues up 4.5% to
Q4 Fiscal 2017 Statistics
 Q4 Fiscal 2017 Statistics FedEx Corporation Financial and Operating Statistics Fourth Quarter Fiscal 2017 July 17, 2017 This report is a statistical supplement to FedEx s interim financial reports and
Q3 Fiscal 2018 Statistics
 Q3 Fiscal 2018 Statistics FedEx Corporation Financial and Operating Statistics Third Quarter Fiscal 2018 March 20, 2018 This report is a statistical supplement to FedEx s interim financial reports and
Q3 Fiscal 2017 Statistics
 Q3 Fiscal 2017 Statistics FedEx Corporation Financial and Operating Statistics Third Quarter Fiscal 2017 February 28, 2017 This report is a statistical supplement to FedEx s interim financial reports and
Land area 1.73 million km 2 Queensland population (as at 31 December 2017) Brisbane population* (preliminary estimate as at 30 June 2017)
 Brisbane population* (preliminary estimate as at 30 June 2017)") Queensland - 11 Queensland OVERVIEW Queensland is nearly five times the size of Japan, seven times the size of Great Britain, and two and a half times the size of Texas. Queensland is Australia s second
Queensland - 11 Queensland OVERVIEW Queensland is nearly five times the size of Japan, seven times the size of Great Britain, and two and a half times the size of Texas. Queensland is Australia s second
Annual General Meeting. 13 June 2017
 Annual General Meeting 13 June 2017 Agenda 1. Approval of the Annual Report of the financial year 2016 of AS Tallink Grupp 2. Proposal on distribution of profits 3. Extension of authorities of the members
Bilfinger Berger: Preliminary Report on the 2004 Financial Year
 Bilfinger Berger AG Carl-Reiss-Platz 1-5 68165 Mannheim Germany www.bilfingerberger.com Contact: Sascha Bamberger Phone: +49 6 21/4 59-24 55 Fax: +49 6 21/4 59-25 00 E-mail: sbam@bilfinger.de Date: February
ASUR 2Q11 PASSENGER TRAFFIC UP 2.89% YOY
 In Mexico ASUR Lic. Adolfo Castro (52) 5552-84-04-08 acastro@asur.com.mx In the U.S. Breakstone Group Susan Borinelli (646) 330-5907 sborinelli@breakstone-group.com ASUR 2Q11 PASSENGER TRAFFIC UP 2.89%
Copa Holdings Reports Fourth Quarter and Full Year 2007 Results
 Copa Holdings Reports Fourth Quarter and Full Year 2007 Results Panama City, Panama --- February 21, 2008. Copa Holdings, S.A. (NYSE: CPA), parent company of Copa Airlines and Aero Republica, today announced
MIRAMAR, Fla., April 29, 2015 (GLOBE NEWSWIRE) -- Spirit Airlines, Inc. (Nasdaq:SAVE) today reported first quarter 2015 financial results.
 -- Spirit Airlines, Inc. (Nasdaq:SAVE) today reported first quarter 2015 financial results.") April 29, 2015 Spirit Airlines Announces First Quarter 2015 Results; Adjusted Net Income Increases 87.1 Percent to $70.7 Million and Pre-Tax Margin Increases 900 Basis Points to 22.7 Percent MIRAMAR, Fla.,
April 29, 2015 Spirit Airlines Announces First Quarter 2015 Results; Adjusted Net Income Increases 87.1 Percent to $70.7 Million and Pre-Tax Margin Increases 900 Basis Points to 22.7 Percent MIRAMAR, Fla.,
million euros to 5.3 billion euros
 0 th February 014 FULL YEAR 0 RESULTS 0 RESULTS ON TRACK DESPITE CHALLENGING CONTEXT C T Revenues up.3% at constant currency to 5.5 billion euros EBITDA 1 improvement of 461 million euros to 1,855 million
VR Group s result for 2018 was excellent rail traffic volumes increased
 Press release 1 (5) VR Group s result for 2018 was excellent rail traffic volumes increased Financial details for 2018 presented in this press release are unaudited FAS figures. The figures in brackets
Melco International Development Limited (Incorporated in Hong Kong with limited liability) Website : (Stock Code : 200)
 Website : (Stock Code : 200)") Hong Kong Exchanges and Clearing Limited and The Stock Exchange of Hong Kong Limited take no responsibility for the contents of this announcement, make no representation as to its accuracy or completeness
Hong Kong Exchanges and Clearing Limited and The Stock Exchange of Hong Kong Limited take no responsibility for the contents of this announcement, make no representation as to its accuracy or completeness
Globus Maritime Limited Trading Update and Financial Highlights for the Three Months and Nine Months Ended September 30, 2007.
 Globus Maritime Limited Trading Update and Financial Highlights for the Three Months and Nine Months Ended September 30, 2007. Athens, Greece, November 15, 2007. Globus Maritime Limited (AIM: GLBS), a
Spirit Airlines Reports Fourth Quarter and Full Year 2016 Results
 Spirit Airlines Reports Fourth Quarter and Full Year 2016 Results MIRAMAR, FL. (February 7, 2017) - Spirit Airlines, Inc. (NASDAQ: SAVE) today reported fourth quarter and full year 2016 financial results.
Golden Ocean Group Limited Q results March 1, 2007
 Golden Ocean Group Limited Q4 2006 results March 1, 2007 PROFIT & LOSS 2005 2006 (in thousands of $) 2006 2005 Oct-Dec Oct-Dec Jan - Dec Jan - Dec Operating Revenues 37 292 91 253 Time charter revenues
Historical Statistics
 Historical Statistics FedEx Corporation Financial and Operating Statistics FY 2005 FY 2014 This report is a statistical supplement to FedEx s interim financial reports and is prepared quarterly. Additional
Cathay Pacific Airways Limited Abridged Financial Statements
 To provide shareholders with information on the results and financial position of the Group s significant listed associated company, Cathay Pacific Airways Limited, the following is a summary of its audited
OPERATING AND FINANCIAL HIGHLIGHTS
 Copa Holdings Reports Net Income of US$18.6 Million and EPS of US$0.42 for the Second Quarter of 2010 Excluding special items, adjusted net income came in at $26.3 million, or $0.60 per share Panama City,
Record results driven by traffic growth and its positive dynamic, which has supported all key economic margins.
 PRESS RELEASE AEROPORTO GUGLIELMO MARCONI DI BOLOGNA: The Board of Directors approves draft and consolidated financial statements as at December, 31 2016. Record results driven by traffic growth and its
Fact Sheet for Q4 and Full Year 2016 February 2, 2017
 Fact Sheet for Q4 and Full Year 2016 February 2, 2017 Contents Daimler Group Stock Market Information 3 Earnings and Financial Situation 4-13 Information for Divisions Mercedes-Benz Cars 14-17 Daimler
Copa Holdings Reports Earnings of US$30.3 Million and EPS of US$0.70 for 3Q08
 Copa Holdings Reports Earnings of US$30.3 Million and EPS of US$0.70 for 3Q08 Panama City, Panama --- November 13, 2008. Copa Holdings, S.A. (NYSE: CPA), parent company of Copa Airlines and Aero Republica,
Finnair Q Result
 Finnair Q2 2015 Result 14 August 2015 CEO Pekka Vauramo, Interim CFO Mika Stirkkinen 1 Market environment shows signs of improvement There were signs of a recovery in the demand for consumer and business
El Al Israel Airlines announced today its financial results for the year 2016 and the fourth quarter of the year:
 El Al Israel Airlines announced today its financial results for the year 2016 and the fourth quarter of the year: The Company's revenues in 2016 amounted to approx. USD 2,038 million, compared to approx.
Historical Statistics
 Historical Statistics FedEx Corporation Financial and Operating Statistics FY 2006 FY 2015 This report is a statistical supplement to FedEx s interim financial reports and is prepared annually. Additional
Investor Presentation
 TUI Group Investor Presentation WestLB Deutschland Conference 2010 17 November 2010 TUI AG Investor Relations Seite 1 Future-related related statements This presentation contains a number of statements
20 February 2019 FULL YEAR 2018 RESULTS Resilient results despite the impact of strikes and fuel bill increase
 20 February 2019 FULL YEAR 2018 RESULTS Resilient results despite the impact of strikes and fuel bill increase FULL YEAR 2018 More than 100 million passengers carried, the leading European group for long-haul
RYANAIR ANNOUNCES RECORD Q1 PROFIT INCREASE
 RYANAIR ANNOUNCES RECORD Q1 PROFIT INCREASE Ryanair, Europe s largest low fares airline today (Tuesday, 6 Aug 2002) announced its biggest increase in Q1 profits (end 30 Jun 02). Passenger traffic during
Third Quarter Results
 1 Third Quarter 2010-11 Results Highlights of the Third Quarter Passenger business affected by significant disruptions Dynamic cargo activity Strong improvement in results Decline in ex-fuel unit costs
Fact Sheet for Q3 and January-September 2017 October 20, 2017
 Fact Sheet for Q3 and January-September 2017 October 20, 2017 Contents Daimler Group Stock Market Information 3 Earnings and Financial Situation 4-12 Information for Divisions Mercedes-Benz Cars 13-16
Spirit Airlines Reports First Quarter 2018 Results
 Spirit Airlines Reports First Quarter 2018 Results MIRAMAR, Fla., April 26, 2018 - Spirit Airlines, Inc. (NYSE: SAVE) today reported first quarter 2018 financial results. For the first quarter 2018, Spirit
RESULTS RELEASE 20 August GENTING HONG KONG GROUP ANNOUNCES FIRST HALF RESULTS FOR 2015 Highlights
 RESULTS RELEASE 20 August 2015 FOR IMMEDIATE RELEASE INTERNATIONAL GENTING HONG KONG GROUP ANNOUNCES FIRST HALF RESULTS FOR 2015 Highlights The commentary below is prepared based on a comparison of the
SHIP MANAGEMENT SURVEY. January June 2018
 CENTRAL BANK OF CYPRUS EUROSYSTEM SHIP MANAGEMENT SURVEY January June 2018 INTRODUCTION The Ship Management Survey (SMS) is conducted by the Statistics Department of the Central Bank of Cyprus and concentrates
Falkland Oil and Gas Limited ( FOGL or the Company ) Preliminary Results for the year ended 31 December 2007
 Preliminary Results for the year ended 31 December 2007") Wednesday 12 March 2008 Falkland Oil and Gas Limited ( FOGL or the Company ) Preliminary Results for the year ended 31 December 2007 FOGL, the oil and gas exploration company focused on its extensive licence
Wednesday 12 March 2008 Falkland Oil and Gas Limited ( FOGL or the Company ) Preliminary Results for the year ended 31 December 2007 FOGL, the oil and gas exploration company focused on its extensive licence
Interim Results for the Six Months ended 28 February 2017
 Interim Results for the Six Months ended 28 February 2017 The Group is pleased to announce its interim results for the six months ended 28 February 2017. Formation Group is focused solely on property development
Melco International Development Limited (Incorporated in Hong Kong with limited liability) Website : (Stock Code : 200)
 Website : (Stock Code : 200)") Hong Kong Exchanges and Clearing Limited and The Stock Exchange of Hong Kong Limited take no responsibility for the contents of this announcement, make no representation as to its accuracy or completeness
Hong Kong Exchanges and Clearing Limited and The Stock Exchange of Hong Kong Limited take no responsibility for the contents of this announcement, make no representation as to its accuracy or completeness
CONTACT: Investor Relations Corporate Communications
 NEWS RELEASE CONTACT: Investor Relations Corporate Communications 435.634.3200 435.634.3553 Investor.relations@skywest.com corporate.communications@skywest.com SkyWest, Inc. Announces Second Quarter 2016
SKYWEST, INC. ANNOUNCES THIRD QUARTER 2014 RESULTS
 NEWS RELEASE For Further Information Contact: Investor Relations Telephone: (435) 634-3203 Fax: (435) 634-3205 FOR IMMEDIATE RELEASE: October 29, 2014 SKYWEST, INC. ANNOUNCES THIRD QUARTER 2014 RESULTS
Flughafen Wien Group Maintains Upward Trend: Passenger Growth and Strong Earnings Improvement in the First Nine Months of 2016
 Flughafen Wien Group Maintains Upward Trend: Passenger Growth and Strong Earnings Improvement in the First Nine Months of 2016 REVENUE increase to 545.4 million (+10.2%), EBITDA rise to 306.5 million (+13.1%
CONTACT: Investor Relations Corporate Communications
 NEWS RELEASE CONTACT: Investor Relations Corporate Communications 435.634.3200 435.634.3553 Investor.relations@skywest.com corporate.communications@skywest.com SkyWest, Inc. Announces Second Quarter 2017
ANA HOLDINGS Financial Results for the Three Months Ended June 30, 2018
 ANA HOLDINGS NEWS ANA HOLDINGS Financial Results for the Three Months Ended June 30, 2018 TOKYO, July 31, 2018 ANA HOLDINGS INC. (hereinafter ANA HD ) today reports its financial results for the three
Norwegian Air Shuttle ASA
 Norwegian Air Shuttle ASA Q1 2018 Presentation 26 April 2018 Highlights Q1 2018 Successfully completed private placement of NOK 1.3 billion Added two 737-800s and six 787-9s to operations Launched interline
AIR CANADA REPORTS 2010 THIRD QUARTER RESULTS; Operating Income improved $259 million or 381 per cent from previous year s quarter
 AIR CANADA REPORTS 2010 THIRD QUARTER RESULTS; Operating Income improved $259 million or 381 per cent from previous year s quarter MONTRÉAL, November 4, 2010 Air Canada today reported operating income
Half-yearly Report 2013
 Half-yearly Report 2013 Financial result unchanged PORT OF ROTTERDAM THROUGHPUT DECREASED SLIGHTLY Throughput in the port of Rotterdam in the first half of the year decreased by 0.9% compared to the first
Investment Highlights
 Third Quarter 2014 Investment Highlights 1 Mexican airport portfolio positioned to take full advantage of global growth. 2 Diversified business model contributing to earnings resilience. 3 Well-defined
Presentation on Results for the 2nd Quarter FY Idemitsu Kosan Co.,Ltd. November 14, 2018
 Presentation on Results for the 2nd Quarter FY 2018 Idemitsu Kosan Co.,Ltd. November 14, 2018 Table of Contents 1. FY 2018 2nd Quarter Financials (1) Overview (2) Segment Information 2. Reference Materials
Copa Holdings Reports Net Income of $136.5 million and EPS of $3.22 for the First Quarter of 2018
 Copa Holdings Reports Net Income of $136.5 million and EPS of $3.22 for the First Quarter of 2018 May 9, 2018 PANAMA CITY, May 9, 2018 /PRNewswire/ -- Copa Holdings, S.A. (NYSE: CPA), today announced financial
Q4 Fiscal 2018 Statistics
 Q4 Fiscal 2018 Statistics FedEx Corporation Financial and Operating Statistics Fourth Quarter Fiscal 2018 June 19, 2018 This report is a statistical supplement to FedEx s interim financial reports and
Results 2 nd Quarter 2004
 Grupo Posadas, s, S.A. de C.V. & Subsidiaries July 28 th, 2004 Results 2 nd Quarter 2004 Cosolidated revenues increased 11% EBITDA increased 15% Recovery on REVPAR 3 new openings in the 2Q04, which sum
Full Year 2009 Results
 Full Year 2009 Results 1 Antonio Vázquez Chairman & Chief Executive Officer 2 Highlights 2009 Strong decrease in revenues: weak demand and yield deterioration. High competition and drop of business traffic.
2010 half year financial results Growth in results despite the downturn in traffic
 Paris, 31 August half year financial results Growth in results despite the downturn in traffic Results in progression despite the decrease in traffic of 2.1%: Revenue up by 2.5% 1 to 1,318.4 million EBITDA
1 st Quarter Results FY
 1 st Quarter Results FY 2004-05 05 Q1 Highlights p Context 8Improving economic context 8Strong economic growth in Americas and Asia 8Modest economic recovery in Europe 8Soaring fuel prices 8IPE Brent up