A n n u al Report Annual Report 2008
|
|
|
- Doreen Goodwin
- 6 years ago
- Views:
Transcription

1 Annual Report Annual Report 2008

2 Company name : Société d exploitation des ports - Marsa Maroc Date of establishment : December 1 st, 2006 Legal status : Public Limited Company with Executive and Supervisory Boards Share Capital : MAD Registered Offi ce : 175 Bd Zerktouni Casablanca Morocco President of the Executive Board : Mr Mohammed ABDELJALIL Business area : Terminals and ports operating within the framework of concessions Turnover : Million MAD Staff : Global traffi c : 41.3 Million tons Operated ports : Nador, Tangier, Mohammedia, Casablanca, Jorf Lasfar, Safi, Agadir, Laâyoune and Dakhla
3 President s word Presentation of Marsa Maroc Management Method Activity and Services Main terminals Table of contents Table of contents Highlights Ports Business Marsa Maroc s Activity A n n u a l R e p o r t Strategy & Development Strategic Plan CAP 15 Development Projects Structuring Projects Results Consolidated Traffic, Financial and Budgetary Accounts Variation by Location Financial Statements Appendices 53 Contacts 57

4 President s word President s word 6


5 In 2008, Marsa Maroc had set among its priorities to improve the quality of service at the port of Casablanca. Recorded in continuation of the «port of Casablanca roadmap» agreed between the government and the CGEM on December 14 th, 2007, an ambitious action plan has been implemented by the company. Thanks to the mobilization of its human resources, the investments made to enhance the port equipments and the reorganization of its operating processes, Marsa Maroc was able to meet the expectations of the port community which witnessed a marked improvement in operational performance of the container s terminals at the port of Casablanca. In terms of financial achievements, the 2008 turnover stood exceptionally at 3 billion Dirhams of which 340 million were transferred according to the subcontract in transition period so being a reprocessed turnover of about 2.6 billion Dirhams. This cyclical performance is due to the record level of trade combined with delayed start of competing terminals and maintaining in Tangier City of the TIR traffic whose transfer to Tanger Med will be delayed for one year over our forecasts. Also, we should expect a reduction of the turnover during the next two financial years with a gradual return to its normative level. Meanwhile, this year saw the launch of our business plan «CAP15» designed around fifteen strategic priority projects. The implementation of these projects, organized around the axis of growth, maintenance and modernization of existing activities, is based on strengthening the fundamentals of the company. Thus, Marsa Maroc has committed itself in a plan of revision of its human resources management policy in order to develop a culture of performance. Plans for strengthening the management control and risk management have been started as well. After a year full of achievements in 2008 and launch of structuring projects, we enter the year 2009 with the will to carry out our development projects and to persevere in the direction of continuous improvement of our quality of service. Have a good reading. Mr. Mohammed ABDELJALIL President of the Executive Board 5
6
7 Presentation of Marsa Maroc Presentation of Marsa Maroc Management Method Activity and Services Main terminals

8 Marsa Maroc Presentation of Marsa Maroc Ports Business Reform Marsa Maroc was established in December 2006 further to the dissolution of the former Office d Exploitation des Ports in the framework of the ports business reform. Thus, the law on ports reform which came into force in December 2006 has deeply changed the functioning of the national ports sector with three main objectives: Clarification of roles and split of functions of authority and business operations; Introduction of competition between port operators; Unification of handling operations therefore ending breach of responsibility in the handling chain. In this new configuration, and in competition with other operators, Marsa Maroc takes in charge operating terminals and wharfs within the framework of concession contracts with the Agence Nationale des Ports which is entrusted with missions of authority, regulation and development of ports capacities. 8


9 Management Method Marsa Maroc was set up in December 2006, as a limited company with Executive and Supervisory Boards. The Supervisory Board, chaired by Mr Karim GHELLAB, Minister of Equipment and Transport, carries out continuous monitoring of the Company s management by the Executive Board and approves the major strategic orientations of the company. The Supervisory Board chaired by Mr Karim GHELLAB Executive Board, chaired by Mr Mohammed ABELJALIL, is the company s management body. It is vested with abilities to make commercial, technical, financial and social decisions. Mohammed ABDELJALIL President of the Executive Board El Mahjoub BAYRI Technical Director and Interim Development Director Mustapha SAHABI Finance Director Rachid HADI Operations Director in the Port of Casablanca Youssef BENNANI Human Resources and General Affairs Director 9
10 Marsa Maroc Presentation of Marsa Maroc Integrated Port Logistics Mission Marsa Maroc is assigned to the mission of creating value for its customers at each step of the port s logistics chain. Services Marsa Maroc offers to its customers, importers, exporters, shipowners, shipping agents, and freight-forwarders, a range of diversified services: Port operations: Main services: on board and dockside handling, warehousing, checking, weighing, loading and unloading containers and trailers. Other Services: stevedoring, loading and unloading trucks and other port logistical support services.. Maritime services: Piloting, towing, mooring as well as supplying water and electricity. e-services: The e-service «Marsa Conteneur» enables the customers an access to real-time information about the different stages of their containers transit. 10
11 A multi-location Implementation Marsa Maroc is present in the 10 major ports of the Kingdom. This diversity has vested it with the nature of a multi-services port operator taking in charge various kinds of traffic. Mohammedia Liquid bulks : hydrocarbons Tangier City Passengers Al Hoceima Passengers Casablanca Containers, Ro-Ro, conventional shipments and dry bulks Nador Ores, billets and Passengers Jorf Lasfar Dry bulks and hydrocarbons Safi Ores ROYAUME DU MAROC Agadir Containers, citrus and early fruits Laayoune Sand, containers, hydrocarbons and ores Dakhla Refrigerated containers and fish products 11

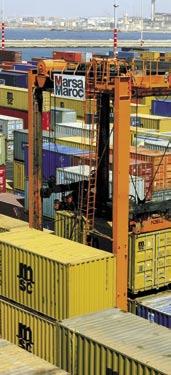
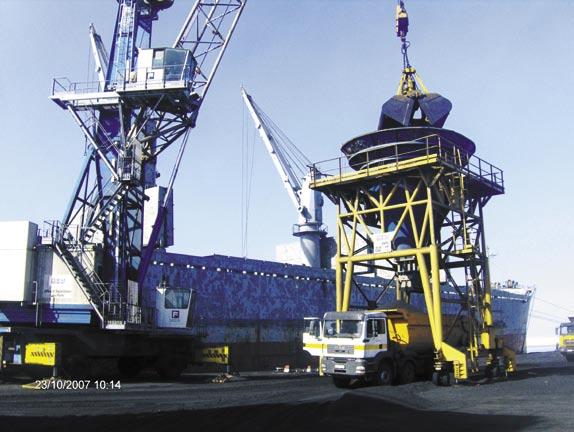
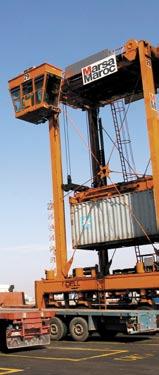
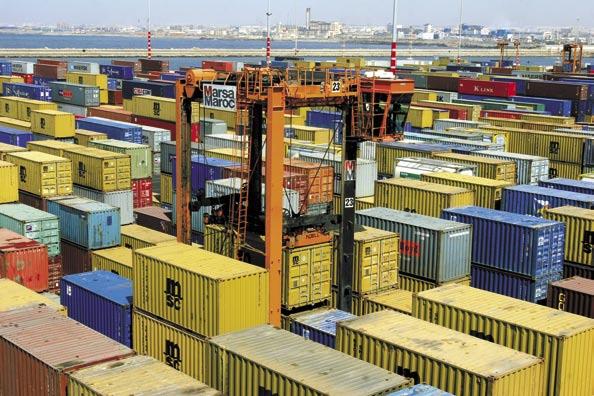
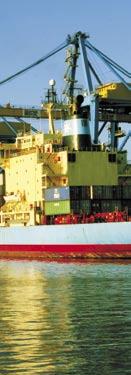
12 Marsa Maroc Presentation of Marsa Maroc Main terminals To meet the specific needs of each kind of traffic, Marsa Maroc provides its customers with specialized equipments and human resources. Containers terminal of the port of Casablanca Containers activity 620 m quay with a depth of 12 m. Equipped with 6 gantry cranes for containers and high capacity equipments, including straddle carriers with 3 levels of storage. Equipped with a universally renowned automated system of management, used in world largest terminals. Accomodates a capacity of TEU each year. Commercial quay of the port of Jorf Lasfar Dry bulks activity 682 ml quay with a depth of 12.5 m. 5 berthing posts. Equipped with large capacity cranes: 38 and 40 tons. Main cargo handled: Petroleum coke, fertilizers and scrap metal. Oil handling terminal of the port of Mohammedia Liquid bulks activity 580 ml quay with a depth of 17 m, 2 berthing posts. A hosting capacity of 150,000 TPL vessels. Equipped with fire detection and sprinklers safety device based on the latest technology. More than 9 million tons of oil handled yearly. 12

13 Ro-Ro terminal of the port of Casablanca Ro-Ro activity 3 ramps with a capacity of 100 tons. A storage capacity of 5800 units. Nearly 100,000 vehicles per year. Maritime stations of Tangier and Nador ports Passengers activity Tangier 5 car ferry berthing posts. 4 telescopic bridges for passengers. 2 maritime stations with a surface of 1,400 m 2 and 1,800 m 2 respectively. More than 1,300,000 passengers per year. Nador 680 ml quay, 4 berthing posts. 1 reception hall of 3500 m 2. 3 bridges for passengers. More than 400,000 passengers per year. 13
14
15 2008 Highlights H i g h l i g h t s Ports business Marsa Maroc s activity
.")

16 2008 Highlights 2008 Highlights Ports business Launching of construction work of a new container s terminal at the port of Casablanca. In November 2008, His Majesty King Mohammed VI launched the construction of the Containers Terminal 3 (TC3). With a capacity of 600,000 TEU, the new terminal has a quay length of 600 m with a depth between 12m and 14 m. Start of new activities at the port of Tanger Med. In March 2008, containers import/export traffic activity started at Containers Terminal 1, operated by APM Terminals Tangiers; In November 2008, the TIR activity was launched at the RO-RO terminal of Tanger Med. Implementation of Containers Terminal 2 at the port of Tanger Med Conceded to the Consortium formed by the operator Eurogate-Contship and the shipping companies MSC and CMA-CGM, the Containers Terminal 2 started operating in July


17 Marsa Maroc s Activities Projects and achievements Implementation of Marsa Maroc s strategic plan «CAP 15» by the launching of the first strategic projects: obtaining new concessions ; integrating Freight Forwarding (Port to Door) ; improving the quality of service and industrial performance ; developping partnerships with industrials. Launching of the project of a vertical storage space construction in the port of Casablanca. This car park will provide a capacity of vehicles as well as value-added services. 17

18 2008 Highlights 2008 Highlights Improving performances Marsa Maroc achieved all the actions included in the roadmap for «containers waiting time reduction at the port of Casablanca». Thus, the period April-December 2008 registered a good performance in terms of operational indicators, such as: reducing the average vessels waiting time by 65% ; improving vessels daily productivity by 11% ; reducing trucks loading time by 36% ; increasing the number of daily delivered containers by 11%. Investments New equipments has been purchased to improve service quality and to support traffic growth. The main purchased equipments are : 24 straddle carriers for the ports of Casablanca and Agadir (178 MMAD) ; A tugboat for the port of Laâyoune (55 MMAD) ; Two mineral ore conveyors for the port of Laâyoune (3.8 MMAD). 18
; 5 loaders for the ports of Nador (2), Jorf Lasfar (1), Laâyoune (2) for an amount of (10 MMAD); 8")

; 15 forklifts including 10 for the port of Casablanca, 3 for Nador, 1 for Jorf Lasfar, 1 for")

19 27 forklifts including 2 for the port of Dakhla, the others for the port of Casablanca (31.5 MMAD); 5 loaders for the ports of Nador (2), Jorf Lasfar (1), Laâyoune (2) for an amount of (10 MMAD); 8 industrial tractors for the port of Casablanca (10.5 MMAD). 5 rail mounted cranes, 2 for the port of Casablanca, 2 for the port of Nador, 1 for the port of Jorf Lasfar (186 MMAD); 41 industrial tractors including 38 for the port of Casablanca and 3 for the port of Jorf Lasfar (65 MMAD); 15 forklifts including 10 for the port of Casablanca, 3 for Nador, 1 for Jorf Lasfar, 1 for Laâyoune (58.6 MMAD); 1 towboat for the port of Mohammedia (3.2 MMAD). The renovation and implementation of two oil delivery systems and the pipeline 24 connecting SAMIR to the port of Mohammedia, have reduced by half the average stay at berth of ships importing refined products (Oil Handling Terminal). 19


20 2008 Highlights 2008 Highlights e-services Launching of Marsa Maroc s website: This communication tool is particularly dedicated to customers and partners of Marsa Maroc; Launching of Marsa Conteneur e-service for customers of the port of Casablanca to get informed about their containers transit status (loading, unloading, receipt, exit). Citizenship In recognition of the civic action of the Company as part of Clean Beaches 2008 operation, the Mohammed VI Foundation for Environmental Protection has awarded the Commitment Trophy to Marsa Maroc. 20
21 Strategy & Development S t r a t e g y & D e v e l o p m e n t Strategic Plan CAP 15 Development projects Structuring projects
22 Strategy & Development Strategic plan CAP 15 Given the major changes experienced by the port business sector including the reform and liberalization of the sector as well as the start of activity of the port of Tanger Med, the strategy adopted by Marsa Maroc aims to maintain its market positions in order to preserve the financial equilibrium of the Company, while focusing on the priorities of growth. So, the strategic plan of Marsa Maroc «CAP 15» revolves around themes of growth and improvement of the present situation as well as a transverse axis of consolidating fundamentals of the company. Growth axis 1 Development of the container s strategic business Obtaining new concessions in Tangier and Casablanca areas. Diversification in surface logistics by the development of dry ports/logistics platforms. Improving the quality of service and operational performance. Growth axis 2 Partnerships with bulks and hydrocarbons industrials near the complex of Jorf Lasfar/Safi This requires Marsa Maroc to establish partnerships with major industrial companies in bulks and hydrocarbons for joint operations and / or development of port infrastructures dedicated to these kinds of traffic. 22


23 Improvement axis Maintaining and upgrading the other activities Car Carriers: improving the quality of service and the proposal of value-added services in the rapidly growing segment of vehicles traffic; Conversion of Tangier City port: defining Marsa Maroc s position within the framework of Tangier City port restructuration, including passengers and cruises activities; Conventional : commercial partnerships and improvement of the quality of service. The management of these strategic streams requires the consolidation by Marsa Maroc of its fundamentals by implementing an appropriate human resources management, recasting and improving procedures, setting up an effective management control, etc. 23
.")
24 Strategy & Development Development projects Development of the container strategic business: Obtaining new concessions Marsa Maroc aims to operate new container terminals by obtaining concessions in national ports like Casablanca and Tanger Med or other regional ports (West of Africa). Modernization of car carriers activity: Construction of a multi-storey car park To support the growth of the automotive business, Marsa Maroc plans to build a vertical storage space at the vehicles terminal of the port of Casablanca. Designed in accordance with the best international standards, the terminal will require an investment of 130 million MAD and a completion period of almost 18 months. This building will have a three-storey car park, areas dedicated to value added services as well as delivery and reception areas. With a ground surface of 18,000 m 2, the building will have a storage area of 90,000 m 2 with a capacity of 5,000 to 6,000 cars. Its start up is scheduled for the end of Development of bulks activities: Capacities Expansion in the port of Jorf Lasfar Implementation of a new multipurpose terminal To meet the needs of an hinterland with an increasing number of industrial units, Marsa Maroc will operate the new multipurpose terminal by the end of This terminal will offer to the local industries large facilities such as a 320 meters long quay with a depth of 12.5m and an area of 9.5 ha. Implementation of a new oil handling terminal Marsa Maroc will implement, by the end of 2009, an oil handling terminal, «berth 8». With a depth of 15.6 m, this platform will be able to receive ships of large capacity. The quay s facilities meet the needs of the port s hinterland for hydrocarbons as well as serving other regions through cabotage. 24
25 Structuring projects Human resources: towards a culture of performance Since its establishment, Marsa Maroc has committed itself to develop and deploy a new human resources policy according to its strategic plans. Thanks to its scope, the structural redesign of our human resources policy will upgrade the human resources management. It will become more dynamic, fair and appreciative of the participation, initiative and performance individually as well as collectively. It aims to help employees to prepare their career plans, enhance their motivation and have them joining the dynamic of the company. The study, which was started late November 2007, focused on the main levers of modern human resources management, such as the Management by Objectives, Workforce Planning, Wage and Staff Policies. Management control: for a better guidance In 2008, Marsa Maroc initiated a project for the development of management control with the following objectives: Guiding activities and measuring company s performance based on relevant dashboards. Readjustment and improvement of the current budgeting method to make it evolve from a control spending device to a budget guiding system. Structuring the «management control» within the company and encompassing both its human and organizational aspects. Risk Management: towards quality insurance In order to provide the structure with an operational tool to manage and prepare the quality insurance certification, a project is currently under way, in order to rebuild the procedural repository. Achieving this project is fundamental to the Company s strategy. It covers both operational and functional procedures. In this context, a study of operational risks related to the container s activity at the port of Casablanca was performed. This study provided a map of the process and then enabled to identify, analyze and prioritize the risks linked to the container traffic process. According to their level of mitigation and potential severity, the risks are prioritized in order to identify a list of major hazards with adequate action plans. This pilot project will be reapplied to the other activities of the Company across all operational locations. 25


26
27 2008 Results 2008 Results Consolidated Results of Traffi c, Financial and Budgetary. Variation by Location Financial Statements KEY FIGURES Employees Billion Dirhams of turnover Million Dirhams of Net Income Thousand TEU handled Million Tons of cargo handled
28 Traffic Achievements Traffic Achievements Overall traffic Million of tons 50-1,2% 40 +0,5% ,5% 10 0 Total Import Total Export Global trafic In 2008 Marsa Maroc has carried out across its 10 ports a global traffi c of 41.3 million tons compared to million tons in Its market share in the national ports traffi c reaches 62%. tons of cargo 41Million handled Container TEU ,6% 2008 was characterized by the following major ,3% +13,9% trends: Continued growth of containerized traffi c with an increase of 13% compared to At the port of Agadir, this traffi c increased by 43% which is explained by the switch of citrus and early fruits traffi c from the TIR and conventional methods to the container method and the reinforcement of 0 Total Import Total Export Global trafic the container carriers shipping lines TEU ,4% +12,6% With TEU*, Marsa Maroc s facilities at the port of Casablanca contributed with 86% to the global container traffi c handled by Marsa Maroc. The port of Tangier s traffi c fell by 50% because ,5% +43% of the transfer of the container s traffi c from Tangier City port to Tangier Med port. 0 Casablanca Tangier Agadir Total * TEU: Twenty-foot Equivalent Unit
29 Véhicules New vehicles neufs traffic Units % Sustained growth of vehicles traffi c approaching the level of 100,000 units with 99,896 vehicles handled in 2008 and an increase of 21%. The export-bound vehicles fl ow effectively started in 2008 with 6,124 units against 352 units in TIR Traffic Units ,8% Slight increase of the TIR traffi c (0.8%) thanks to the import of goods, equipments and industrial products ,8% -0,4% Total inflow total outflow Global traffic Main bulks traffic Million tons ,1% The traffi c of hydrocarbons slightly decreased by 2.1%, this trend is mostly due to the decline of imports of crude oil (-12%) and fuel versus an increased traffi c of refi ned products and liquefi ed gas ,2% +0,7% About 11% decrease of grain traffi c because of the decline of grains import through the port of 1 0 Grains Coal & Pet Coke Hydrocarbons Casablanca
30 Traffic Achievements Traffic Achievements Marsa Maroc s traffic by port (in tons) Mohammedia Casablanca Jorf Lasfar Tangier Nador Safi Agadir Laâyoune Dakhla 30
31 Réalisations Financial Results financières Turnover in MMAD KMAD P2009 P2010 Turnover excluding subcontracts Subcontracts turnover Marsa Maroc achieved a turnover of nearly 3 billion MAD of which 340 million MAD correspond to operations on ships board processed and transferred to the private operator under a subcontract covering the transition period for the reform implementation in the port of Casablanca agreed with the Agence Nationale des Ports. Excluding these outsourced items, the turnover achieved by the own means of the company is 2.6 billion MAD in increase of 18% compared to 2.2 billion MAD in Despite the effects of the global fi nancial crisis and its impact on the national economy causing a decline in port s activity, the projected turnover for 2009 is approximately 2.4 billion DH of which 200 million MAD correspond to «on board» operations. With the start up of new private operators at the port of Casablanca, after the end of the transition period in September 2009 and the transfer of the roll on-roll off activity and the majority of the passengers activity from the port of Tangier City towards the port of Tanger Med expected during 2010, the turnover will be brought back to a normative level of about 1.8 billion DH. Operating charges KMAD P2009 P2010 Subcontracts charges Charges excluding subcontracts Operating charges are 2 billion MAD which 340 million MAD due to the subcontracting of operations on ships board at the port of Casablanca. Excluding these subcontracts expenses, operating charges are 1.7 billion MAD versus 1.3 billion MAD in They will be reduced to a level of 1.6 billion MAD in

32 Financial Results Financial Results OPERATING INCOME KMAD P2009 P2010 Operating income Operating income In 2008, Marsa Maroc achieved exceptional financial performances with an operating income of 978 million MAD and a net income of 656 million MAD. With the start up of competitors and the transfer of activity from the port of Tangier City to the port of Tanger Med scheduled for April 2010, operating income in 2010 will stand at roughly 300 million MAD. Turnover Contribution by port (KMAD) Ports Casablanca Jorf-lasfar Safi Agadir Laayoune Dakhla Nador Tangier Mohammedia Casablanca 65% Jorf Lasfar 4% Safi 3% Agadir 6% Laayoune 1,6% Dakhla 0,4% Nador 4% Tangier 10% Mohammedia 6% Turnover Contribution by business activity (MMAD) Handling services : Ship servicing : 164 Other products : 55 92,65% 5,50% 1,85% 32


33 Balance Sheet Capital Current liabilities Fixed Assets Current Assets Treasury Capital Current liabilities Fixed Assets Current Assets Treasury In thousands of MAD 33
34 Capital budget Capital budget The capital budget, approved by the Supervisory Board of Marsa Maroc on January 29 th, 2008 meeting covered a total of 2,276 million MAD divided as follows: Facilities : MMAD including 647 MMAD for 2008 Infrastructures : 758 MMAD including 492 MMAD for 2008 Studies : 70 MMAD including 38 MMAD for 2008 Other : 82 MMAD including 82 MMAD for 2008 Commitments for 2008 The main projects undertaken for equipments are : Supply and maintenance of straddle carriers at the ports of Casablanca and Agadir: 112 MMAD; Supply and maintenance of 2 rail mounted cranes and their accessories at the port of Jorf Lasfar: 70 MMAD; Supply and maintenance of straddle tractors and trailers at the ports of Casablanca and Agadir: 59 MMAD; Supply and maintenance of containers forklift at the port of Casablanca: 42 MMAD; Supply and maintenance of forklifts for empty containers: 16 MMAD; Supply of high capacity forklifts to the ports of Casablanca and Agadir: 13 MMAD. 34

35 Results Réalisations by port par port Nador: exceptional infrastructure for the Oriental gateway Overall traffi c : 2,693,950 tons Staff : 128 Main traffi c : ore, billets and passengers. Turnover : 118,341,000 MAD Operating income : 32,606,000 MAD Global Traffic Soon to be connected to the national railway network, the commercial mole operated by Marsa Maroc at the port of Nador handled more than 2.7 million tons of goods for the regional industries in The traffi c growth of about 11.5% is mainly due to higher exports of ores and billets. Evolution of the main products traffic Passengers Thousand tons Billets Coal Coke oil Barytine Total Infl ow: Outfl ow: Vehicles : ,6% +3,5% -3%

36 Results by port Results by port Tangier: a non stop service for a high frequency traffic Overall traffi c: 4,272,462 tons Staff: 162 Main traffi cs: Passengers, Ro-Ro Turnover: 287,439,000 MAD Operating income: 154,780,000 MAD Global Traffic In 2008, the traffi c handled by Marsa Maroc at the port of Tangier has experienced a slight decline of 0.9%. The year 2008 was characterized by the start of the TIR and container traffi cs at the port of Tanger Med. Evolution of the Main products traffic Passengers Thousand tons Grains Container TIR Total Infl ow: Outfl ow: Vehicles: % -1% +5%

37 Mohammedia: leader for hydrocarbons Overall traffi c : 9, 449,144 tons Staff: 128 Main Activity: Liquid bulks Turnover : 169, 499,000 MAD Operating income : 73, 740,000 MAD Global Traffic In 2008, the traffi c handled by Marsa Maroc at the port of Mohammedia reached nearly 9.5 million tons, which is a decrease of 1.2% compared to This decline is mostly due to a decrease of fuel exportations and an increased traffi c of refi ned products and liquefi ed gas, including diesel and LPG 350. Evolution of the main products traffic Thousand tons Crude oil Liquid gases Refined products Total 37

38 Results by port Results by port Casablanca: an organization that measures up to the country s fi rst port Overall traffi c: 14,592,266 tons Staff: 1069 Major traffi c: containers, dry bulks, Ro-Ro Turnover: 1,970,758,000 MAD Operating income: 722,408,000 MAD Global Traffic The traffi c handled by Marsa Maroc at the port of Casablanca stood at nearly 14.6 million tons, a slight decrease of 2.3% compared to However, 2008 was characterized by the sustained growth of several activities, namely that of containers, TIR and new vehicles. Global traffic evolution Evolution of the main products traffic Thousand tons Thousand tons Import Export Total Grains at dockside Steel Products Wood and by-products Sugar Container s traffic evolution Roll-on/Roll-off traffic evolution TEU Units

39 Jorf Lasfar: a prospective challenger Overall traffi c: 3,541,127 tons Staff : 64 Main traffi cs: Dry bulks and liquid bulks Turnover: 105,257,000 MAD Operating income: 53,521,000 MAD Global Traffic Marsa Maroc facilities at the port of Jorf Lasfar handled nearly 3.6 million tons of oil, scrap metal, petroleum coke and other dry bulks. In 2008, and in order to attract new customers at the port of Jorf Lasfar, Marsa Maroc initiated new services, such as stevedoring. Evolution of the main products traffic Thousand tons Grains Coke oil Fertilizers Diesel Total

40 Results by port Results by port Safi: large capacities for the ore region Overall traffi c: 2,359,231 tons Staff : 106 Principal Activity: Dry bulks Turnover: 92,274,000 MAD Operating income: 14,574,000 MAD Global Traffic At the port of Safi, Marsa Maroc s facilities handled nearly 2.4 million tons of cargo, registering a decrease of 7% was characterized by a decrease of ore exports from the port of Safi because of the little content of zinc, copper and lead deposits Evolution of the main products traffic Thousand tons Sulphur Barytine Gypsum Total

41 Agadir: the commercial port of the south Overall traffic: 2,822,713 tons Staff : 171 Main trades: Containers Turnover: 171,529,000 MAD Operating income: MAD 43,843,000 Global Traffic At the port of Agadir, Marsa Maroc handled more than 2.8 million tons of cargo, registering an increase of 8.8% compared to The major products that contributed to this performance are: citrus and early fruits, fi sh (frozen and canned), and wood was characterized by the start of the Ro-Ro traffi c in the port of Agadir. Evolution of the main products traffic Thousand tons Citrus & early fruits Canned fish Frozen Fish Total

42 Results by port Results by port Laayoune: growing capacities for an expanding region Overall traffi c: 1,475,383 tons Staff : 64 Main trades: dry bulks Turnover: 48,324,000 MAD Operating income: 10,684,000 MAD Global Traffic At the port of Laâyoune, Marsa Maroc s facilities handled nearly 1.5 million tons of goods. The traffi cs that contributed to this performance are mainly sand, hydrocarbons and clinker. Evolution of the main products traffic Thousand tons Sand Oil Pelagic fish Fish Meal Total

43 Dakhla: a modern port Overall traffi c: 112,482 tons Staff : 21 Main trades: fi shery products, liquid bulks Turnover: 10,682,000 MAD Trafic Global 2008 knew a decline in traffi c for Marsa Maroc at the port of Dakhla. Thus the handled traffi c declined by 14% to reach a total of 112,482 tons. Evolution of the main products traffic Thousand tons Frozen Fish Hydrocarbons Total


44
45 2008 Résultts Financial Statements Assets Liabilities Profi t and Loss Account Business Operations Financing Statement
 52 358 368,47 13 778 685,03 38 579 683,44 37 085 476,57 Other intangible assets 52 358 368,47 13 778 685,03 38 579 683,44 37 085 476,57")

46 FINANCIAL STATEMENTS ASSETS FINANCIAL YEAR 01/01/2008 TO 31/12/2008 F I X E D A S S E T S C U R R E N T A S S E T S CASH NONCASH ASSETS (A) ASSETS GROSS AMOUNT DEPRECIATION & PROVISIONS NET 2008 AMOUNT PREVIOUS YEAR NET 2007 INTANGIBLE FIXED ASSETS (B) , , , ,57 Other intangible assets , , , ,57 TANGIBLE FIXED ASSETS (C) , , , ,05 Lands , , , ,46 Construction , , , ,56 Plant, machinery and equipment , , , ,91 Transportation Equipment , , , ,11 Furniture & offi ce equipment , , , ,95 Other tangible assets , , , ,05 Current tangible assets , , ,01 FINANCIAL FIXED ASSETS (D) , , , ,02 Long term Loans , , , ,87 Other receivable accounts , , , ,15 Equities stake , , ,00 ASSETS ADJUSTMENTS (E) , , ,06 Increase of fi nancing debt , , ,06 TOTAL I (A+B+C+D+E) , , , ,70 INVENTORIES (F) , , , ,23 Materials and supplies , , , ,30 Work in progress , , ,93 ACCOUNTS RECEIVABLE (G) , , , ,29 Supplier receivable, advances and deposits , , ,00 Customer and related accounts , , , ,95 Staff , , ,98 State , , ,01 Shareholder accounts Other receivables , , , ,56 Accrued assets , , ,79 EQUITIES AND SECURITIES (H) , , ,91 TOTAL II (F+G+H+I) , , , ,43 CASH - ASSETS , , , ,00 Check and drafts to be cashed , , , ,12 Bank and giro accounts ,65 0, , ,14 Cash, credits and advance deposits ,77 0, , ,74 TOTAL III , , , ,00 TOTAL I + II + III , , , ,13 (HT): non-cash.
 Carried forward")
47 LIABILITIES FINANCIAL YEAR 01/01/2008 TO 31/12/2008 LIABILITIES YEAR 2008 PREVIOUS YEAR 2007 EQUITY , ,07 Share capital or personal (1) , ,00 Less: shareholders, unpaid-up capital Discount, merger, contribution premium P E R M A N E N T F I N A N C I N G Revaluation Regulatory reserve , ,00 Other reserves (2) Carried forward , ,89 Net profi t pending assignment (2) Net profi t for the year (2) , ,18 TOTAL EQUITY (A) , ,07 RELATED EQUITY (B) , ,90 Regulated Provisions , ,90 DEBT FINANCING (C) , ,18 Mandatory Borrowings , ,00 Other fi nancial debts , ,18 LONG TERM PROVISIONS FOR LIABILITIES AND CHARGES (D) , ,88 Contingency and loss provisions , ,70 Provisions for charges , ,18 TOTAL I (A+B+C+D) , ,03 DETTES DU PASSIF CIRCULANT (F) , ,05 C U R R E N T L I A B I L I T I E S ( 3 ) CASH Payable Trade accounts payable , ,40 Customers accounts, advances and deposits , ,32 Staff , ,30 Social security , ,28 State , ,63 Shareholders accounts 48,60 0,00 Other creditors , ,04 Accrued liabilities , ,08 TOTAL II (F + G + H) , ,05 CASH - LIABILITIES , ,05 Banks (credit balance) , ,05 TOTAL III , ,05 (1) Staff receivable equity - (2) Increase (+) Decrease (-) - (3) (HT): Non-cash. TOTAL I + II + III , ,13

 of materials and supplies 515 028 339,68 376 280,92 515 404 620,60 477 815 662,53 * Other external")
48 FINANCIAL STATEMENTS PROFIT AND LOSS STATEMENT FINANCIAL YEAR 01/01/2008 to 31/12/2008 PROFIT AND LOSS ACCOUNTS OPERATIONS TOTAL TOTAL FINANCIAL YEAR 2008 PREVIOUS YEARS A B C = A + B D I. OPERATING REVENUES , , , ,41 * Sales of produced goods and services turnovers , , , ,85 * Operating Adjustments: transfer of charges , , ,56 O P E R A T I N G TOTAL I , , , ,41 II. OPERATING EXPENSES , , , ,42 * Purchase (2) of materials and supplies , , , ,53 * Other external expenses , , , ,22 * Taxes and duties , , , ,17 * Staff expenses , , , ,00 * Other operating expenses * Operating Depreciation ,49 483, , ,50 TOTAL II , , , ,42 III. OPERATING PROFIT (I - II) , , , ,99 IV. FINANCIAL INCOME ,15 0, , ,79 * Income from securities and other fi xed assets , ,00 * Foreign exchange gain , , ,07 F I N A N C I N G * Interest and other fi nancial income , , ,72 * Financial adjustements: transfer of charges , ,94 TOTAL IV ,15 0, , ,79 V. FINANCIAL EXPENSES , , , ,81 * Interest charges , , , ,12 * Foreign exchange loss , , ,79 * Other fi nancial charges , ,86 * Financial provision ,90 TOTAL V , , , ,81 VI. FINANCIAL RESULTS (IV - V) , , , ,02 VII. CURRENT RESULTS (III - VI) , , , ,97 VIII. NON-CURRENT REVENUES , , , ,12 * Income from disposal of fi xed assets , , ,01 N O N C U R R E N T * Other non-current assets , , , ,11 * Non-current adjustments: transfer of charges , ,41 TOTAL VIII , , , ,12 IX. NON-CURRENT EXPENSES , , , ,99 * Net depreciation value of disposed fi xed assets , , ,42 * Other non-current expenses , , , ,47 * Non-current allowances for depreciation and provisions , , ,10 TOTAL IX , , , ,99 X. Non-operating PROFIT (VIIIX) , , , ,87 XI. PROFIT BEFORE INCOME TAX (VII+X) , , , ,10 XII. INCOME TAX (*) ,07 0, , ,92 XIII. NET PROFIT (XI - XII) , , , ,18 XIV. TOTAL REVENUES (I + IV + VIII) , , , ,32 XV. TOTAL EXPENSES (II + V + IX + XII) , , , ,14 XVI - NET PROFIT (total revenues - total charges) , , , ,18
 2 980 238 223,67 2 556 192 669,85 1 Sales of goods and services 2 980 238 223,67 2 556 192 669,85 2")
49 BUSINESS OPERATING STATEMENT PERIOD OF 01/01/2008 to 31/12/2008 I. RESULTS FORMATION TABLE 2008 FINANCIAL YEAR 2007 PREVIOUS YEAR I + TOTAL ANNUAL PRODUCTION: (1+2+3) , ,85 1 Sales of goods and services , ,85 2 Variation of stocks 3 Fixed assets produced for use by the company II - TOTAL ANNUAL EXPENSES: (4+5) , ,75 4 Purchases of materials and supplies , ,53 5 Other external expenses , ,22 III = VALUE ADDED (I -II ) , , Operating subsidies 7 - Tax & fees , , Staff expenses , ,00 IV = GROSS OPERATING PROFIT , , Other operating income 10 - Other operating expenses 11 + Operating write-back : transfer of charges , , Operating provision , ,50 V = OPERATING PROFIT (+ or -) , ,99 VI + - FINANCIAL RESULTS , ,02 VII = CURRENT PROFIT (+ or -) , ,97 VIII + - NON-CURRENT PROFIT , , Income tax , ,92 IX = NET PROFIT FOR THE YEAR (+ or -) , ,18 II. CASHFLOW 1 Net profi t , , Operating provisions (1) , , Finance provisions (1) , Non-current provisions (1) , , Operating write-back (2) , , Finance write-back (2) , Non-current write-back (2) (3) , Income from disposals of fi xed assets , , Depreciation net value of disposed fi xed assets , ,42 I CASHFLOW , ,81 10 Dividends distributed ,00 0,00 II NET CASHFLOW , ,81 (1) Except provisions for current assets and liabilities to cash (2) Except write-backs on assets and liabilities (3) Including write-backs on investment subsidies NOTA : The CAF calculation can also be made from the E.B.E
 RESOURCES (d) Permanent Financing 2 649 715 481,79 2 119 250 623,03 530 464 858,76 Minus fi xed asset 1 491 843 285,37 1 307 970 290,70 183 872 994,67 = WORKING CAPITAL (A) CURRENT")
50 FINANCIAL STATEMENTS FINANCING STATEMENT FOR THE YEAR INVESTMENT FUNDS INTEGRATED THE CURRENT ASSETS YEAR END 31/12/2008 CATEGORY FINANCIAL YEAR 2008 (a) EPREVIOUS YEAR 2007 (b) EXPENSES ( c) VARIATION (a - b) RESOURCES (d) Permanent Financing , , ,76 Minus fi xed asset , , ,67 = WORKING CAPITAL (A) CURRENT (1-2) , , ,09 Current Assets , , ,26 Minus Current Liabilities , , ,89 = CAPITAL REQUIREMENTS (B) GLOBAL (4-5) , , ,37 NET CASH ACCOUNT (ASSETS LIABILITIES) = A - B , , ,72 CATEGORY FINANCIAL YEAR 2008 PREVIOUS YEAR 2007 EXPENSES (a) RESOURCES (b) EXPENSES (a) RESOURCES (b) I. INVESTMENT CAPITAL FOR THE YEAR (FLOW) , ,48 CASHFLOW (A) , ,81 - Investment Cash fl ow , ,81 - Dividends distributed ,00 DISPOSALS AND WITHDRAWALS OF FIXED ASSETS (B) , ,67 - Disposal of intangible fi xed assets - Disposal of tangible fi xed assets , ,01 - Disposal of fi nancial fi xed assets - Recovery from long term debts , ,66 - Withdrawal of tangible fi xed assets INCREASE IN EQUITY AND RELATED INVESTMENTS (C ) ,00 - Stock issue ,00 - Investment subsidy OTHER FINANCING CAPITAL INCREASE OF FINANCING DEBT (D) (net of redemption premiums) TOTAL 1: INVESTMENT CAPITAL , ,48 II. INVESTMENT ACTIVITIES FOR THE YEAR (FLOW) , ,76 ACQUISITION AND INVESTMENT INCREASE (E ) , ,61 Acquisitions of intangible assets , ,13 Acquisition of tangible fi xed assets , ,87 Acquisition of fi nancial assets Increase in long term receivables , ,61 REPAYMENT OF SHAREHOLDERS EQUITY (F) REPAYMENT OF FINANCING DEBT (G) , ,15 NONCASH INVESTMENT (H) TOTAL II - INVESTMENT ACTIVITIES (E + F + G + H) , ,76 III. CHANGE IN GLOBAL BUDGET FINANCING , ,12 IV. NET CHANGE OF THE CASH ACCOUNT , ,60 TOTAL , , , ,48
51


52
53 Appendices Appendices

54 Appendices Million of tons Appendices Overall traffic ,5% 30-1,2% ,5% 0 Total Imports Total Exports Overall Traffic Structure of the Handled Traffic 2008 vs 2007 Total Trend by packaging mode Traffic breakdown by packaging mode by the end of Dec 2008 Million of tons % -2% +9% +6% +4% Dry bulks Liquid Bulks Containers RO-RO Conventional shipments % 12% 30% 11% 30% Containers ( ) Dry Bulks ( ) RO-RO ( ) Liquid Bulks ( ) Conventional shipments (in Tons) ( ) 54
55 Traffic by location Traffic breakdown by port Traffic Breakdown by port at December-end 2008 Million of tons ,5% Nador -2,3% +10% Tangier Mohamedia Casablanca Jorf Lasfar -15,2% Safi Agadir Laayoune Dakhla Agadir 7% Safi 6% Jorf Lasfar 9% Casablanca 35% Laayoune 4% Dakhla 0,3% Nador 6% Tangier 10% Mohammedia 23% Main traffic CONTAINER Evolution of container traffic Evolution of container traffic by port TEU ,6% TEU ,6% ,4% ,3% +13,9% ,5% +43% 0 Total Import Total Export Global traffic 0 Casablanca Tangier Agadir Total
56 Main traffic Main traffic RO-RO TIR Traffic Units ,8% New vehicles Traffic Units % ,8% -0,4% Total Inflow Total Outflow Global Traffic PASSENGERS BULKS Evolution of passengers by port Major bulks cargo trend Passengers ,68% -2% Millions of tons ,1% ,4% +19,4% +19,07% ,2% +0,7% 0 Nador Tangier Casablanca Agadir Total Grains 2007 Coal & Pet Coke 2008 Hydrocarbons 56
57 Contacts Contacts 17

58 Marsa Maroc contacts Contacts Head Office: 175, Bd Zerktouni Casablanca - Morocco Tel: Fax: Sales & Marketing Direction: Tel: Fax: h_mzerma@marsamaroc.co.ma Ports: 58 Nador : Al Hoceima : Tangier : Mohammedia : Casablanca : Jorf Lasfar : Safi : Agadir : Laayoune : Dakhla : P.O Box 88 Béni-Ensar - Nador Tel: (6 LG) - Fax: h_oubaha@marsamaroc.co.ma P.O Box 88 Béni-Ensar - Nador Tel: Fax: h_oubaha@marsamaroc.co.ma Port de Tanger - P.O Box Tangier Tel: à 45 - Fax: m_sennouni@marsamaroc.co.ma Port de Commerce - P.O Box 98 - Mohammedia Tel: Fax: s_asbaai@marsamaroc.co.ma Port des Al Mohades - Casablanca Tel: (15 LG) - Fax: r_hadi@marsamaroc.co.ma Km 22 Route d El Jadida - P.O Box Plateau El Jadida Tel: / /13 - Fax: r_abinouh@marsamaroc.co.ma P.O Box 8 - Fond de Mer - Safi Tel: / Fax: l_oujja@marsamaroc.co.ma P.O Box 36 - Agadir Port Tel: Fax: k_mansour@marsamaroc.co.ma P.O Box 48 - Elmersa Tel: Fax: bouassam@marsamaroc.co.ma Nouveau Port de Dakhla - P.O Box Dakhla Tel: / Fax: bouassam@marsamaroc.co.ma
59
60 175, Bd Zerktouni Casablanca - Morocco Tel: Fax:
Investor Presentation
 Investor Presentation Communication financière Publication semestrielle Octobre 2016 Company at a glance : the leading port operator in Morocco 36,1 millions of tons Traffic (2017) Mad 2 554 mn USD 278
Investor Presentation
 Investor Presentation Communication financière Publication semestrielle Octobre 2016 Company at a glance : the leading port operator in Morocco 36,3 millions of tons Traffic (2016) Mad 2 567 mn USD 254
December 1 st, MAD. Mohammed ABDELJALIL million MAD(*) collaborators(*) 35.9 million tons(*)
 collaborators(*) 35.9 million tons(*)") ANNUAL REPORT 2012 2012 04 ANNUAL REPORT 2012 MARSA MAROC IN BRIEF Corporate Name Date of establishment Legal status Registered capital Headquarters President of the Executive Board Sector of activity
ANNUAL REPORT 2012 2012 04 ANNUAL REPORT 2012 MARSA MAROC IN BRIEF Corporate Name Date of establishment Legal status Registered capital Headquarters President of the Executive Board Sector of activity
SERVICE QUALITY IMPROVEMENT AT THE CONTAINER TERMINAL OF THE PORT OF CASABLANCA. 12 th ASEAN PORT & SHIPPING &12 June, Jakarta, Indonesia
 SERVICE QUALITY IMPROVEMENT AT THE CONTAINER TERMINAL OF THE PORT OF CASABLANCA 12 th ASEAN PORT & SHIPPING 2014 11&12 June, Jakarta, Indonesia CONTENT Marsa Maroc - Background Main issues causing the
Marsa Maroc in brief. Corporate name : Société d Exploitation des Ports Marsa Maroc. Date of creation : December 1 st, 2006
 Marsa Maroc in brief Corporate name : Société d Exploitation des Ports Marsa Maroc Date of creation : December 1 st, 2006 Legal status : Public Limited Company with an Executive Board and a Supervisory
FIRST QUARTER RESULTS 2017
 FIRST QUARTER RESULTS 2017 KEY RESULTS In the 1Q17 Interjet total revenues added $4,421.5 million pesos that represented an increase of 14.8% over the income generated in the 1Q16. In the 1Q17, operating
El Al Israel Airlines announced today its financial results for the second quarter and the first half of 2017.
 August 16, 2017 El Al Israel Airlines announced today its financial results for the second quarter and the first half of 2017. The Company's revenues in the second quarter of 2017 amounted to approx. USD
FOURTH QUARTER RESULTS 2017
 FOURTH QUARTER RESULTS 2017 KEY RESULTS In the 4Q17 Interjet total revenues added $5,824.8 million pesos that represented an increase of 10.8% over the revenue generated in the 4Q16. In the 4Q17, operating
Thank you for participating in the financial results for fiscal 2014.
 Thank you for participating in the financial results for fiscal 2014. ANA HOLDINGS strongly believes that safety is the most important principle of our air transportation business. The expansion of slots
Half-yearly Report 2013
 Half-yearly Report 2013 Financial result unchanged PORT OF ROTTERDAM THROUGHPUT DECREASED SLIGHTLY Throughput in the port of Rotterdam in the first half of the year decreased by 0.9% compared to the first
Corporate profile : Marsa Maroc in brief ANNUAL REPORT ANNUaL REPORT Marsa Maroc is a multi-speciality port operator and the national
 4 Marsa Maroc in brief Corporate profile : Corporate name Date of establishment December 1 st, 2006 Société d exploitation des ports Marsa Maroc Marsa Maroc is a multi-speciality port operator and the
PRESS RELEASE AEROPORTO GUGLIELMO MARCONI DI BOLOGNA S.p.A.: The Board of Directors approves the group results for the first nine months of 2017:
 PRESS RELEASE AEROPORTO GUGLIELMO MARCONI DI BOLOGNA S.p.A.: The Board of Directors approves the group results for the first nine months of 2017: Traffic growth continues with 6.3 million passengers (+6.7%
El Al Israel Airlines announced today its financial results for the year 2016 and the fourth quarter of the year:
 El Al Israel Airlines announced today its financial results for the year 2016 and the fourth quarter of the year: The Company's revenues in 2016 amounted to approx. USD 2,038 million, compared to approx.
THIRD QUARTER AND NINE MONTHS OF 2014 KEY RESULTS
 THIRD QUARTER AND NINE MONTHS OF 2014 KEY RESULTS In 3Q14 INTERJET total revenues were $ 3,643.4 million, representing an increase of 9.9% on revenues generated in the 3Q13. Accumulated 9M14 INTERJET total
Q1 Fiscal 2018 Statistics
 Q1 Fiscal 2018 Statistics FedEx Corporation Financial and Operating Statistics First Quarter Fiscal 2018 September 19, 2017 This report is a statistical supplement to FedEx s interim financial reports
Third Quarter Results
 1 Third Quarter 2010-11 Results Highlights of the Third Quarter Passenger business affected by significant disruptions Dynamic cargo activity Strong improvement in results Decline in ex-fuel unit costs
THIRD QUARTER RESULTS 2018
 THIRD QUARTER RESULTS 2018 KEY RESULTS In the 3Q18 Interjet total revenues added $ 6,244.8 million pesos that represented an increase of 7.0% over the revenue generated in the 3Q17. In the 3Q18, operating
Historical Statistics
 Historical Statistics FedEx Corporation Financial and Operating Statistics FY 2006 FY 2015 This report is a statistical supplement to FedEx s interim financial reports and is prepared annually. Additional
Q4 Fiscal 2017 Statistics
 Q4 Fiscal 2017 Statistics FedEx Corporation Financial and Operating Statistics Fourth Quarter Fiscal 2017 July 17, 2017 This report is a statistical supplement to FedEx s interim financial reports and
Q3 Fiscal 2018 Statistics
 Q3 Fiscal 2018 Statistics FedEx Corporation Financial and Operating Statistics Third Quarter Fiscal 2018 March 20, 2018 This report is a statistical supplement to FedEx s interim financial reports and
PPIAF Assistance in Swaziland
 PPIAF Assistance in Swaziland July 2012 In 2002 PPIAF support was provided to the government of Swaziland to assess the regulatory, legal, and institutional framework necessary to concession Swaziland
Historical Statistics
 Historical Statistics FedEx Corporation Financial and Operating Statistics FY 2005 FY 2014 This report is a statistical supplement to FedEx s interim financial reports and is prepared quarterly. Additional
THIRD QUARTER RESULTS 2017
 THIRD QUARTER RESULTS 2017 KEY RESULTS In the 3Q17 Interjet total revenues added $5,835.1 million pesos that represented an increase of 22.0% over the revenue generated in the 3Q16. In the 3Q17, operating
INTESA SANPAOLO VITA RESULTS AT 31 MARCH 2017 APPROVED:
 INTESA SANPAOLO VITA RESULTS AT 31 MARCH 2017 APPROVED: Assets under management at 145,908.2 million euros (143,735.3 million euros at December 2016 +1.5%) Financial liabilities (unit and index linked)
Sales increased and income will be on a recovery track in the second half of the fiscal year.
 Sales increased and income will be on a recovery track in the second half of the fiscal year. Contents I. Results for the First Half of Fiscal Year Ending March 2019 Profit decreased mainly due to temporary
Q3 Fiscal 2017 Statistics
 Q3 Fiscal 2017 Statistics FedEx Corporation Financial and Operating Statistics Third Quarter Fiscal 2017 February 28, 2017 This report is a statistical supplement to FedEx s interim financial reports and
LOCATED AT THE GATEWAY OF THE TROPICAL PROVINCE, RIDING ON THE GROWTH MOMENTUM OF THE COUNTRY, WE ARE ON THE RIGHT TRACK OF TAKING OFF.
 LOCATED AT THE GATEWAY OF THE TROPICAL PROVINCE, RIDING ON THE GROWTH MOMENTUM OF THE COUNTRY, WE ARE ON THE RIGHT TRACK OF TAKING OFF. MANAGEMENT DISCUSSION INDUSTRY REVIEW Civil Aviation Industry in
STANSTED AIRPORT LIMITED REGULATORY ACCOUNTS PERFORMANCE REPORT FOR THE YEAR ENDED 31 MARCH Financial Review...1. Performance Report...
 PERFORMANCE REPORT CONTENTS Page Financial Review...1 Performance Report...3 Notes to the Performance Report...4 Stansted Regulatory Accounts PERFORMANCE REPORT Financial Review General overview Stansted
FIRST QUARTER RESULTS 2016
 FIRST QUARTER RESULTS 2016 KEY RESULTS In 1Q16 Interjet total revenues added $3,850.8 million pesos that represented an increase of 21.9% over the income generated in the 1Q15. In 1Q16 total passengers
Gerry Laderman SVP Finance, Procurement and Treasurer
 Gerry Laderman SVP Finance, Procurement and Treasurer Safe Harbor Statement Certain statements included in this release are forward-looking and thus reflect our current expectations and beliefs with respect
ANA HOLDINGS Financial Results for the Three Months Ended June 30, 2018
 ANA HOLDINGS NEWS ANA HOLDINGS Financial Results for the Three Months Ended June 30, 2018 TOKYO, July 31, 2018 ANA HOLDINGS INC. (hereinafter ANA HD ) today reports its financial results for the three
Presentation on Results for the 2nd Quarter FY Idemitsu Kosan Co.,Ltd. November 14, 2018
 Presentation on Results for the 2nd Quarter FY 2018 Idemitsu Kosan Co.,Ltd. November 14, 2018 Table of Contents 1. FY 2018 2nd Quarter Financials (1) Overview (2) Segment Information 2. Reference Materials
GROUP ULJANIK PLOVIDBA CONSOLIDATED AUDITED FINANCIAL STATEMENTS FOR THE PERIOD JANUARY - DECEMBER 2014
 GROUP ULJANIK PLOVIDBA CONSOLIDATED AUDITED FINANCIAL STATEMENTS FOR THE PERIOD JANUARY - DECEMBER 2014 Pula, April 2015 CONTENT: Consolidated audited Financial Statements of GROUP ULJANIK PLOVIDBA with
CONTACT: Investor Relations Corporate Communications
 NEWS RELEASE CONTACT: Investor Relations Corporate Communications 435.634.3200 435.634.3553 Investor.relations@skywest.com corporate.communications@skywest.com SkyWest, Inc. Announces Second Quarter 2016
Annual General Meeting. 13 June 2017
 Annual General Meeting 13 June 2017 Agenda 1. Approval of the Annual Report of the financial year 2016 of AS Tallink Grupp 2. Proposal on distribution of profits 3. Extension of authorities of the members
For personal use only HILLS HOLDINGS HALF YEAR RESULTS FY2013
 HILLS HOLDINGS HALF YEAR RESULTS FY2013 TODAY KEY HIGHLIGHTS OUR FY13 FIRST HALF RESULTS GROUP PERFORMANACE FIRST HALF NPAT 1 $8.2M IN LINE WITH NOVEMBER AGM GUIDANCE. STRONG MANAGEMENT OF WORKING CAPITAL
CONTACT: Investor Relations Corporate Communications
 NEWS RELEASE CONTACT: Investor Relations Corporate Communications 435.634.3200 435.634.3553 Investor.relations@skywest.com corporate.communications@skywest.com SkyWest, Inc. Announces Second Quarter 2017
A new era for the Port of Thessaloniki, Greece & South-East Europe
 A new era for the Port of Thessaloniki, Greece & South-East Europe The Port of Thessaloniki The Gateway Port to the Balkans and South Eastern Europe Strategically located close to the major Trans-European
CONTACT: Investor Relations Corporate Communications
 NEWS RELEASE CONTACT: Investor Relations Corporate Communications 435.634.3200 435.634.3553 Investor.relations@skywest.com corporate.communications@skywest.com SkyWest, Inc. Announces Fourth Quarter 2017
Globus Maritime Limited Trading Update and Financial Highlights for the Three Months and Nine Months Ended September 30, 2007.
 Globus Maritime Limited Trading Update and Financial Highlights for the Three Months and Nine Months Ended September 30, 2007. Athens, Greece, November 15, 2007. Globus Maritime Limited (AIM: GLBS), a
Bilfinger Berger: Preliminary Report on the 2004 Financial Year
 Bilfinger Berger AG Carl-Reiss-Platz 1-5 68165 Mannheim Germany www.bilfingerberger.com Contact: Sascha Bamberger Phone: +49 6 21/4 59-24 55 Fax: +49 6 21/4 59-25 00 E-mail: sbam@bilfinger.de Date: February
Air China Limited Interim Results. August Under IFRS
 Air China Limited 21 Interim Results Under IFRS August 21 1 Agenda 21 Interim Results Overview Business Overview Financial Overview Outlook 2 2 2 21 Interim Results 3 21 Interim Results Overview 4 4 4
Interim Report 3m Bilfinger Berger SE, Mannheim May 10, 2012 Joachim Müller, CFO
 Interim Report 3m 2012 Bilfinger Berger SE, Mannheim May 10, 2012 Joachim Müller, CFO Bilfinger Berger SE Interim report 3m 2012 May 10, 2012 Page 1 3m 2012: Highlights Growth in output volume and orders
FY RESULTS ROADSHOW PRESENTATION
 1 FY RESULTS 2014 ROADSHOW PRESENTATION FY 2014 HIGHLIGHTS FOCUS ON EXECUTION 2 Strong financial performance Revenues: 61 bn, +5% vs. 2013 EBIT* before one off: 4.1 bn, +15% vs. 2013 EPS: 2.99, +61% vs.
Copa Holdings Reports Record Earnings of US$41.8 Million for 4Q06 and US$134.2 Million for Full Year 2006
 Copa Holdings Reports Record Earnings of US$41.8 Million for 4Q06 and US$134.2 Million for Full Year 2006 Panama City, Panama --- March 7, 2007. Copa Holdings, S.A. (NYSE: CPA), parent company of Copa
RESULTS RELEASE 20 August GENTING HONG KONG GROUP ANNOUNCES FIRST HALF RESULTS FOR 2015 Highlights
 RESULTS RELEASE 20 August 2015 FOR IMMEDIATE RELEASE INTERNATIONAL GENTING HONG KONG GROUP ANNOUNCES FIRST HALF RESULTS FOR 2015 Highlights The commentary below is prepared based on a comparison of the
OPERATING AND FINANCIAL HIGHLIGHTS SUBSEQUENT EVENTS
 Copa Holdings Reports Net Income of US$6.2 Million and EPS of US$0.14 for the Third Quarter of 2015 Excluding special items, adjusted net income came in at $37.4 million, or EPS of $0.85 per share Panama
01 Amadeus at a glance
 01 Amadeus at a glance 7 Amadeus Annual Report 2011 1.1 Company s origins and development Most people associate the birth of electronic commerce distribution with the arrival of the internet. In fact,
Presentation on Results for the 3rd Quarter FY Idemitsu Kosan Co.,Ltd. February 14, 2019
 Presentation on Results for the 3rd Quarter FY 2018 Idemitsu Kosan Co.,Ltd. February 14, 2019 Table of Contents 1. FY 2018 3rd Quarter Results (1) Overview (2) Segment Information 2. Forecast for FY 2018
Q4 Fiscal 2018 Statistics
 Q4 Fiscal 2018 Statistics FedEx Corporation Financial and Operating Statistics Fourth Quarter Fiscal 2018 June 19, 2018 This report is a statistical supplement to FedEx s interim financial reports and
Second Quarter to 30th September
 22 nd November 2007 FINANCIAL YEAR 2007-08 EXCELLENT SECOND QUARTER Operating income up 27.6% to 725 million euros Adjusted 1 operating margin of 12%, up 2 points Net income up 97% to 736 million euros
AIR CANADA REPORTS 2010 THIRD QUARTER RESULTS; Operating Income improved $259 million or 381 per cent from previous year s quarter
 AIR CANADA REPORTS 2010 THIRD QUARTER RESULTS; Operating Income improved $259 million or 381 per cent from previous year s quarter MONTRÉAL, November 4, 2010 Air Canada today reported operating income
Presentation on Results for the 2nd Quarter FY Idemitsu Kosan Co.,Ltd. November 1, 2016
 Presentation on Results for the 2nd Quarter FY 2016 Idemitsu Kosan Co.,Ltd. November 1, 2016 Table of Contents 1. 2nd Quarter FY 2016 Financials (1) Overview (2) Segment Information 2. Reference Materials
Helloworld Travel Limited results announcement Half year ended 31 December 2017
 Helloworld Travel Limited results announcement Half year ended 31 December 2017 HIGHLIGHTS FOR THE HALF YEAR ENDED 31 DECEMBER 2017 Total Transaction Value (TTV) growth of 2.7% to $2.968 billion. Earnings
AIRBUS. H Roadshow Presentation. July 2018
 AIRBUS H1 2018 Roadshow Presentation July 2018 H1 18 HIGHLIGHTS 2 Robust commercial aircraft environment Backlog of ~7,200 a/c underpins ramp-up plans H1 financials reflect mainly A350 performance and
million euros to 5.3 billion euros
 0 th February 014 FULL YEAR 0 RESULTS 0 RESULTS ON TRACK DESPITE CHALLENGING CONTEXT C T Revenues up.3% at constant currency to 5.5 billion euros EBITDA 1 improvement of 461 million euros to 1,855 million
Finnair Q Result
 Finnair Q1 2015 Result 7 May 2015 CEO Pekka Vauramo, Interim CFO Mika Stirkkinen 1 Turbulent market environment The weakness of the Finnish economy continued to be reflected in the demand in the first
1.3% millionn euros. Net debt of 5.4 improvement. euros to. Financial Year. the Air. operating. equipped. ness and. also focus on.
 25 th July 2014 Financial Year 2014: First Half results SECOND QUARTER Revenues of 6.45 billion euros, upp 1.7% like-for-like; passenger unit revenue up 1.3% at constant currency thanks to strict capacity
Annual Results. Year ended 28 April June 2018
 1 Annual Results Year ended 28 April 2018 28 June 2018 Cautionary statement 2 This document is solely for use in connection with a briefing on the group headed by Stagecoach Group plc ( the Group ). This
Summary of Results for the First Three Quarters FY2015/3
 Summary of Results for the First Three Quarters FY2015/3 February 10, 2015 Tokyu Corporation (9005) http://www.tokyu.co.jp/ Contents Ⅰ.Executive Summary 2 Ⅱ.Conditions in Each Business 5 Ⅲ.Details of Financial
Interim Release Q3/9M 2017
 Overview by the Executive Board November 2, 207 In the first nine months of 207, the airports of the Fraport Group recorded strong passenger development. At approximately 48.9 million, passenger numbers
Air China Limited Announces 2009 Annual Results
 Air China Limited Announces 2009 Annual Results Record Operating Profit in Complex Market Environment Strengthened Position to Capture Growth Opportunities Hong Kong April 22, 2010 Air China Limited (
2. Industry and Business
 72 Statistical Yearbook of Abu Dhabi 2016 2. Industry and Business Business Enviroment Manufacturing Oil and Gas Petrochemicals Electricity and Water Construction Transport Information and Communication
Q1 Fiscal 2019 Statistics
 Q1 Fiscal 2019 Statistics FedEx Corporation Financial and Operating Statistics First Quarter Fiscal 2019 September 17, 2018 This report is a statistical supplement to FedEx s interim financial reports
Aéroports de Paris Sound 2010 results
 Aéroports de Paris Sound 2010 results Paris, 24 February 2011 Annual results up despite a virtually stable traffic (+0.4%) over the year: Revenue up by 4.0% to 2,739 million EBITDA up by 5.0% to 927 million,
Walvis Bay and its role as a logistics hub for the SADC region. Christian Faure Executive: Marketing and Strategic Business Development
 Walvis Bay and its role as a logistics hub for the SADC region Christian Faure Executive: Marketing and Strategic Business Development CONTENTS 1. Namport and market environment 2. Walvis Bay town dynamics
Consolidated Statement of Financial Position as at December 31, 2017
 86 Key Figures Consolidated Statement of Financial Position as at December 31, 2017 Assets in million December 31, 2017 December 31, 2016 Non-current assets Goodwill 19.3 19.3 Investments in airport operating
Alexandria Port, Egypt
 Alexandria Port, Egypt Source: This information has been extracted from the WFP Logistics Capacity Assessment for Egypt. This LCA is a work in progress and not all sections are complete. This material
AEROFLOT ANNOUNCES FY 2017 IFRS FINANCIAL RESULTS
 AEROFLOT ANNOUNCES FY 2017 IFRS FINANCIAL RESULTS Moscow, 1 March 2018 Aeroflot Group ( the Group, Moscow Exchange ticker: AFLT) today publishes its audited financial statements in accordance with International
Land area 1.73 million km 2 Queensland population (as at 31 December 2017) Brisbane population* (preliminary estimate as at 30 June 2017)
 Brisbane population* (preliminary estimate as at 30 June 2017)") Queensland - 11 Queensland OVERVIEW Queensland is nearly five times the size of Japan, seven times the size of Great Britain, and two and a half times the size of Texas. Queensland is Australia s second
Queensland - 11 Queensland OVERVIEW Queensland is nearly five times the size of Japan, seven times the size of Great Britain, and two and a half times the size of Texas. Queensland is Australia s second
Interim Report 6m 2014
 August 11, 2014 Interim Report 6m 2014 Investors and Analysts Conference Call on August 11, 2014 Joachim Müller, CFO Latest ad-hoc release (August 4, 2014) Reduction of forecast, primarily due to a further
TRAFFIC GROWS BY 35%, PROFITS INCREASE BY 44% TO 104.5M
 TRAFFIC GROWS BY 35%, PROFITS INCREASE BY 44% TO 104.5M Ryanair, Europe s largest low fares airline today (25 June 2001) announced a strong set of results for the year end March, 2001. Traffic for the
Guidance on criteria for assessing the financial resources of new applicants and holders of operating licences
 Consumer Protection Group Risk Analysis Department Guidance on criteria for assessing the financial resources of new applicants and holders of operating licences Version 10 (20 April 2010) 1 Introduction
Air China Limited Annual Results. March Under IFRS
 Air China Limited 21 Annual Results Under IFRS March 211 Agenda Part 1 Highlights Part 2 Business Overview Part 3 Financial Overview Part 4 Outlook 2 Part 1 Highlights Steady Economic Growth; Asia Pacific
2010 half year financial results Growth in results despite the downturn in traffic
 Paris, 31 August half year financial results Growth in results despite the downturn in traffic Results in progression despite the decrease in traffic of 2.1%: Revenue up by 2.5% 1 to 1,318.4 million EBITDA
Passenger services 7,438 10,550 Cargo services 4,405 4,225 Catering and other services Turnover 1 12,275 15,511
 Cathay Pacific Airways Limited - 2003 Interim Results Consolidated Profit and Loss Account - Unaudited Six months ended 30th June 2003 2002 Note Passenger services 7,438 10,550 Cargo services 4,405 4,225
First Half 2017 results Result improvement driven by solid traffic and unit revenue performance
 28 th July 2017 2017 results Result improvement driven by solid traffic and unit revenue performance FIRST HALF 2017 Robust traffic resulting in an improved load factor, up 1.4 pts compared to last year
SHIP MANAGEMENT SURVEY. July December 2017
 SHIP MANAGEMENT SURVEY July December 2017 INTRODUCTION The Ship Management Survey is conducted by the Statistics Department of the Central Bank of Cyprus and concentrates primarily on transactions between
GRINDROD LIMITED AUDITED RESULTS AND DIVIDEND ANNOUNCEMENT for the year ended 31 December 2016
 www.grindrod.com GRINDROD LIMITED AUDITED RESULTS AND DIVIDEND ANNOUNCEMENT for the year ended 31 December 2016 Wifi access guest@sun Presentation and Announcement download www.grindrod.com > Investor
JAPAN AIRLINES Co., Ltd. Financial Results 1 st Quarter Mar/2017(FY2016) July 29, 2016
 July 29, 2016") JAPAN AIRLINES Co., Ltd. Financial Results Mar/2017(FY2016) July 29, 2016 Today s Topics P.1 P.2 P.13 From the first quarter of this fiscal year, figures for Revenue Passengers Carried, ASK, RPK and Load
JAPAN AIRLINES Co., Ltd. Financial Results Mar/2017(FY2016) July 29, 2016 Today s Topics P.1 P.2 P.13 From the first quarter of this fiscal year, figures for Revenue Passengers Carried, ASK, RPK and Load
PRESS RELEASE AEROPORTO GUGLIELMO MARCONI DI BOLOGNA S.p.A.: the Board of Directors approves the Group Q Results.
 PRESS RELEASE AEROPORTO GUGLIELMO MARCONI DI BOLOGNA S.p.A.: the Board of Directors approves the Group Q1 2017 Results. Passenger traffic reached approx. 1.6 million passengers (+4.6% versus 2016), thanks
Media Release. Qantas Group Full Year 2017 Financial Result 1. Sydney, 25 August 2017
 Media Release Qantas Group Full Year 2017 Financial Result 1 Sydney, 25 August 2017 Underlying Profit Before Tax: $1,401 million (second highest in Qantas history) Statutory Profit Before Tax: $1,181 million
SkyWest, Inc. Announces First Quarter 2018 Profit
 NEWS RELEASE CONTACT: Investor Relations Corporate Communications 435.634.3200 435.634.3553 Investor.relations@skywest.com corporate.communications@skywest.com SkyWest, Inc. Announces First Quarter 2018
RESULTS AS AT 30 th JUNE 2018 Positive unit revenue securing stable operating result excluding strikes
 1 st August 2018 RESULTS AS AT 30 th JUNE 2018 Positive unit revenue securing stable operating result excluding strikes SECOND QUARTER 2018 Air France-KLM leveraged the solid ongoing demand to generate
Fabienne MARGAIL HEAD OF HINTERLAND DEPARTMENT MARSEILLE FOS PORT AUTHORITY. HINTERPORT 18 may 201& - Marseille
 Fabienne MARGAIL HEAD OF HINTERLAND DEPARTMENT MARSEILLE FOS PORT AUTHORITY 2 1 st port in France 1 st port in the Mediterranean A large multi-purpose port liquid bulk, solid bulk, general cargo, passengers,
Copa Holdings Reports Net Income of US$113.9 Million for the Fourth Quarter of 2013
 Copa Holdings Reports Net Income of US$113.9 Million for the Fourth Quarter of 2013 Panama City, Panama --- February 12, 2014. Copa Holdings, S.A. (NYSE: CPA), today announced financial results for the
Copa Holdings Reports Net Income of $49.9 million and EPS of $1.18 for the Second Quarter of 2018
 Copa Holdings Reports Net Income of $49.9 million and EPS of $1.18 for the Second Quarter of 2018 Panama City, Panama --- Aug 8, 2018. Copa Holdings, S.A. (NYSE: CPA), today announced financial results
Ramsay Health Care Limited Results Briefing Half Year ended 31 December 2018
 Ramsay Health Care Limited Results Briefing Half Year ended 31 December 2018 Craig McNally, Group Managing Director & Bruce Soden, Group Finance Director 28 February 2019 ramsayhealth.com Agenda Group
ANA Reports Record Profits for FY2012
 ANA HOLDINGS NEWS ANA Reports Record Profits for FY2012 TOKYO April 30, 2013 - ANA Holdings today reports consolidated financial for the fiscal year ended March, 2013. Financial and Operational Highlights
Polish Ports in 2017 February 2018
 Polish Ports in 2017 February 2018 Summary and future outlook Summary: Polish port sector with another record-breaking result of cargo handling. Annual cargo turnover amounted 87.3 million tones, what
Record results driven by traffic growth and its positive dynamic, which has supported all key economic margins.
 PRESS RELEASE AEROPORTO GUGLIELMO MARCONI DI BOLOGNA: The Board of Directors approves draft and consolidated financial statements as at December, 31 2016. Record results driven by traffic growth and its
Summary o f Results for the First Half of FY2018
 Summary o f Results for the First Half of FY2018 November 9, 2018 (9005) https://www.tokyu.co.jp/ Contents Ⅰ.Executive Summary 2 Ⅱ.Conditions in Each Business 6 Ⅲ.Details of Financial Results for the 13
RYANAIR ANNOUNCES RECORD Q1 PROFIT INCREASE
 RYANAIR ANNOUNCES RECORD Q1 PROFIT INCREASE Ryanair, Europe s largest low fares airline today (Tuesday, 6 Aug 2002) announced its biggest increase in Q1 profits (end 30 Jun 02). Passenger traffic during
Investor Presentation
 TUI Group Investor Presentation WestLB Deutschland Conference 2010 17 November 2010 TUI AG Investor Relations Seite 1 Future-related related statements This presentation contains a number of statements
Panama Canal Stakeholder Working Group Meeting
 Panama Canal Stakeholder Working Group Meeting POHA, Bayport Container Terminal, Houston, Texas August 27, 2012 TOTAL ECONOMIC IMPACT 9,749 Texas jobs are in some way related to the Port Of the 9,749
Copa Holdings Reports Net Income of $136.5 million and EPS of $3.22 for the First Quarter of 2018
 Copa Holdings Reports Net Income of $136.5 million and EPS of $3.22 for the First Quarter of 2018 May 9, 2018 PANAMA CITY, May 9, 2018 /PRNewswire/ -- Copa Holdings, S.A. (NYSE: CPA), today announced financial
Schiphol Group. Annual Report
 Schiphol Group Annual Report 2013 Business model Business model Schiphol Group distinguishes four core activities: Aviation, Consumer Products and Services, Real Estate, and Alliances and Participations.
First Half 2013 Results. 16 mai 2013
 First Half 2013 Results 16 mai 2013 26 July 2013 Results Increasing effects of Transform 2015 Highlights of the First Half A difficult global economic environment Transform 2015 plan roll-out on track
Management Discussions and Analysis for the three-month period ended 31 March 2014 and Executive Summary
 Executive Summary Overview of the global economy during the first quarter of 2015 (Q1/2015) are as following; the US economy has been in recovery mode while rapidly dollar appreciation weighs on net exports
OPERATING AND FINANCIAL HIGHLIGHTS. Subsequent Events
 Copa Holdings Reports Financial Results for the First Quarter of 2016 Excluding special items, adjusted net income came in at US$69.9 million, or EPS of US$1.66 per share Panama City, Panama --- May 5,