2015 UNDESIGNATED TRAIL MANAGEMENT AND MESSAGING STUDY FINAL REPORT
|
|
|
- Reynard Watson
- 5 years ago
- Views:
Transcription

1 2015 UNDESIGNATED TRAIL MANAGEMENT AND MESSAGING STUDY FINAL REPORT Prepared by Principle Investigators: Ben Lawhon, MS Education Director Leave No Trace Center for Outdoor Ethics Boulder, Colorado Derrick Taff, PhD Assistant Professor Department of Recreation, Park and Tourism Management Pennsylvania State University Forrest Schwartz, MS PhD Candidate Department of Recreation, Park and Tourism Management Pennsylvania State University 1
2 Acknowledgements The authors would like to thank the staff and volunteers at the City of Boulder Colorado Open Space and Mountain Parks, including but not limited to Deonne VanderWoude, Megan Bowes, and the RESTO Crew, for their support and guidance during this study. The authors would also like to thank Faith Overall, and the Leave No Trace Center for Outdoor Ethics for their assistance with the data collection efforts associated with this research. Suggested Citation: Lawhon, B., Taff, B. D., & Schwartz, F. (2016). Undesignated Trail Management and Messaging Study Report. The City of Boulder, Department of Open Space and Mountain Parks. Boulder, Colorado. i
3 Table of Contents Acknowledgements... i Table of Contents... ii List of Tables... iv List of Figures... vi Executive Summary... vii Introduction... 1 Background... 1 Study Justification... 1 Study Objectives... 2 Study Goals... 2 Literature Review... 2 Methods... 7 Site and Sample... 7 Educational Treatment... 7 Observational Measures... 8 Survey Instrument... 8 Results Discussion Discussion of Hypotheses Results Discussion of Key Findings and Implications for Management Implications for Future Research Study Limitations References Appendices Appendix A. Observation Datasheet Appendix B. Designated Trail (DT) Surveyor Datasheet Appendix C. Undesignated Trail (UT) Surveyor Datasheet Appendix D. Undesignated Trail Study Codebook Appendix E. Sampling Site Diagram Appendix F. Study Site Names and Locations Appendix G. Definitions Appendix H. Original Sample Schedule - June Appendix I. Revised Sample Schedule (Based on unforeseen events such as weather, illness and treatment issues) Appendix J. Educational Signage Appendix K. Sample Barrier Treatment Appendix L. Visitor Survey Appendix M. Site Selection Randomization Procedures ii
4 Appendix N. Methodological Protocol Appendix O. Summary of Key Findings Appendix P. Study Site Map Appendix Q. Preliminary Site-Level Analysis Appendix R. Powerpoint slides from May 26, 2015 research presentation iii
5 List of Tables Observation Data Table 1. Observed activity Table 2. Observed group size Table 3. Number of dogs observed per observation Table 4. Dog present dichotomous (Yes/No) Table 5. Study location by Number of dogs observed Table 6. Study location by observed presence of dog(s) dichotomous (Yes/No) Table 7a. Observed direction of travel Table 7b. Observed direction of travel Control days removed Table 7c. Observed direction of travel (Exiting DT removed) Table 8. Presence of a dog by trail use (DT or UT) Table 9. Observed direction of travel on UT Table 10. Trail use decision upon arrival at UT/DT junction Table 11. Location by Treatment Table 12. Shift Type by Treatment Table 13. Shift Period by Treatment Table 14a. Treatment type by treatment interaction Table 14b. Treatment type by treatment interaction (collapsed into 2 categories) Table 14c. Treatment type (collapsed) by treatment interaction Table 14d. Treatment type (collapsed) by treatment interaction (collapsed) Table 15a. Trail use decision by Treatment interaction (Including Control Days) Table 15b. Trail use decision by Treatment interaction (Excluding Control Days) Table 15c. Trail use by Treatment interaction (collapsed) (Excluding Control Days) Table 16a. Treatment type by decision upon arrival at DT/UT Intersection (Take UT or stay on DT) Table 16b. Treatment effectiveness: Chi-square analysis with post hoc and effect size statistics Table 16c. Treatment type (excluding control) by decision upon arrival at DT/UT Intersection (Take UT or stay on DT) Table 16d. Treatment type (collapsed) by decision upon arrival at DT/UT Intersection (Take UT or stay on DT) Table 16c. Treatment type (collapsed excluding Control) by decision upon arrival at DT/UT Intersection (Take UT or stay on DT) Table 17. Behavioral intent vs observed behavior Survey Response Rate Table 18. Overall survey response rate Table 19. Survey response by trail use iv
6 Table 20a. Survey response by treatment type Table 20b. Survey response by treatment type collapsed Tx categories Survey Response Analysis Table 21. What is your primary activity today? Table 22. How many dogs did YOU bring today (please do not include dogs another person in your group brought)? Table 23. How many times have you visited this section of trail in the past 12 months?. 28 Table 24. Are you aware that some trails in City of Boulder OSMP are undesignated or not official trails? Table 25. To what extent do you believe that human recreation behaviors have the potential to cause NEGATIVE IMPACT, a) Ecologically, and b) Socially in City of Boulder OSMP? (Select only one answer per item) Table 26. Please indicate how INAPPROPRIATE or APPROPRIATE you think each of the following activities is for a visitor to do in City of Boulder OSMP. (Select only one answer per item) Table 27. Please indicate how EFFECTIVE the following activities would be at reducing NEGATIVE IMPACTS in City of Boulder OSMP Table 28. Please indicate how DIFFICULT you think each of the following activities would be for you to do in City of Boulder OSMP. (Select only one answer per item) Table 29a. Current trail use behavior Table 29b. Future trail use behavioral intent Table 30. Did you travel off a designated trail during your visit today? Table 31. Indicate whether or not any of the following reasons for traveling off the designated trail(s) applied to your visit today. (Select only one answer per item) Table 32. Please indicate how IMPORTANT these reasons would be for you to travel only on designated trails in the FUTURE. (Select only one answer per item) Table 33. Did you notice the following on this trail today? (Check all that apply) Table 34. Please RANK the following in order (1 st, 2 nd, and 3 rd ), indicating which would be most effective in keeping you off an undesignated trail. (1 st = Most Effective; 3 rd = Least Effective) Table 35. How many people, including yourself, were part of your group today? Table 36a. Do you live in the United States? Table 36b. If yes, do you live within Boulder City limits? Table 37. Please indicate how strongly you AGREE or DISAGREE with the following statements Table 38. How IMPORTANT were each of the following reasons for your visit to City of Boulder OSMP today? (Select only one answer per item) Table 39. Open Ended Comments: Is there anything else you would like us to know? If so, please provide additional feedback below: v
7 Survey Response by Use History Table 40. Relationship between visitation history and awareness of undesignated trails Table 41. Please indicate how INAPPROPRIATE or APPROPRIATE you think each of the following activities is for a visitor to do in City of Boulder OSMP Table 42. Please indicate how DIFFICULT you think each of the following activities would be for you to do in City of Boulder OSMP Table 43. Please indicate how LIKELY you are to do the activity in the future by circling the number of your response for each statement Table 44. Please indicate how IMPORTANT these reasons would be for you to travel only on designated trails in the FUTURE Table 45. Please indicate how strongly you AGREE or DISAGREE with the following statements Table 46. Relationship between visitation motivations and visitation history Paired Survey and Observation: Survey Response by Trail Use (DT or UT) Table 47. Self-reported frequency of trail behavior by observed trail-use Table 48. Self-reported reasons for trail behavior by observed trail-use Table 49. Analysis of UT and DT survey responses Reasons for staying on designated trails Survey Response by Place of Residence Table 50. Analysis of resident and non-resident survey responses Statistically significant results Regression analysis based on Theory of Planned Behavior Table 51. Multiple Correlation/Regression analysis of the relationships of perceived appropriateness, effectiveness, and difficulty to future behavioral intent Table 52. Linear Regression analysis of the relationships of perceived appropriateness, effectiveness, and difficulty to actual observed trail use (DT vs UT) List of Figures Figure A. Use Impact Curve, adapted from Hammitt & Cole, Figure 1. Multiple correlation regression path model - behavioral intent Figure 2. Logistic regression path model - observed trail use behavior Figure 3. Photograph of stone structure at Sanitarium site vi
8 Executive Summary The use and creation of undesignated trails, also known as social trails is a specific area of concern on the City of Boulder Open Space and Mountain Park (OSMP) system. Undesignated trail use can lead to erosion, vegetation damage, unsafe trail conditions, and impacts on local wildlife. Across OSMP lands there are approximately 147 miles of designated trails (DT) and over 150 miles of undesignated trails (UT). Researchers with the Leave No Trace Center for Outdoor Ethics and Penn State University collaborated with OSMP staff and volunteers to collect data at twenty randomly selected designated/undesignated trail junctions across the OSMP trails system. Through a rigorous experimental design, this study examined the effectiveness of indirect and direct management approaches for reducing the use of undesignated trails on OSMP lands. The study specifically focused on the following two hypotheses: H1 All management treatments would reduce use of undesignated trails from control levels. H2 A combination of treatments would be more effective than any single treatment in reducing use of undesignated trails from control levels. The study took place between June 1 and June 30, During this period researchers deployed four different educational and/or management treatments as well as a control, to twenty randomly selected designated and undesignated trail intersections to determine which treatment was most effective at curbing use of undesignated trails. Data was collected through both direct unobtrusive visitor observation and visitor surveys. Some data collection days consisted of observations only, while others included paired observation and survey data collection methods. During survey days trained administrators intercepted visitors on the undesignated and designated trail under review. Two key findings from the survey results include: 42% of survey respondents were unaware that UTs existed on the OSMP system; Frequent visitors reported being the least likely to stay on designated trails. During observation days trained observers conducted a census of trail users on both designated and undesignated trails, capturing the specifics of their behavior as it pertained to treatment and control conditions (i.e. interaction with treatment, decision made at trail intersection). Surveys were collected during each paired sampling period, which facilitated a more robust understanding of the efficacy of the educational messages and site management strategies by examining reported behavior and attitudes alongside actual observed behavior. vii
9 Observation data suggest the combined physical barrier and educational treatment (Treatment 5) was the most effective at mitigating undesignated trail use. This method was approximately 97% effective at directing visitors to proceed onto the DT rather than traveling on the UT. This treatment was followed in effectiveness by a physical barrier (94%), and a posted sign with an educational message (94%) different from the one used for Treatment 5. Further analysis revealed that only the combined barrier and education message treatment (Treatment 5) produced a statistically significant reduction in undesignated trail use compared to control conditions. Thus, in regards to H1, the authors fail to reject the null hypothesis on the grounds that statistically significant reductions were not produced by all treatments over and above control conditions. Further, the authors reject the null alternative of H2 based on results of post hoc tests indicating a statistically significant relationship was observed between Treatment 5 and reduced undesignated trail use, over and above control conditions. These findings indicate that the combined educational message ( Stay on designated trails: Even when wet and muddy, to protect trailside plants and minimize erosion. This is Not a Designated Trail ) with a physical barrier (i.e., Treatment 5) was the most effective method for mitigating use of undesignated trails utilized in this study. However, it was also found that Treatments 3 (educational signage) and 4 (physical barrier) resulted in observed reductions in UT use (though not statistically significant). While these results indicate that among the treatments utilized in the study only Treatment 5 produced a statistically significant reduction in undesignated trail use compared to control conditions, from an applied management perspective the other treatments may merit consideration. On OSMP lands, it may not be physically, aesthetically, or economically practical to treat every undesignated trail intersection in the system with a combination barrier and educational sign (i.e., Treatment 5). Therefore, the other treatment options used in the study should not be eliminated as management options in the face of a statistically significant test result, as statistical significance is but one indicator and it may not always be the most practical approach (Vaske, 2008). This study highlighted the varying level of effectiveness associated with the treatments applied in this study, with statistical comparisons of these conditions. The results presented here suggest a range of UT management options exist, each with different levels of effectiveness, which provide managers a set of alternative approaches for mitigating the use of UTs on the OSMP system. OSMP staff can utilize the data provided by this research, combined with known practical constraints (i.e. human or financial resources, site characteristics, aesthetics, etc.) to make informed decisions about the most appropriate approach to mitigating the use of undesignated trails on OSMP lands. See appendix O for a detailed summary of key findings. viii
10 Introduction The City of Boulder Open Space and Mountain Parks (OSMP) manages approximately 45,000 acres of land in and around the City of Boulder, which offers protection of critical habitat for plant and animals and opportunities for passive recreation such as hiking, horseback riding and cycling. As the population across the frontrange of Colorado has steadily increased, annual visitation to OSMP lands is now approximately 5.3 million 1 (Vaske, Shelby & Donnelly, 2009). Research has shown that increasing visitation often leads to increased impacts to soils, vegetation, wildlife and other visitors (Hammitt & Cole, 1998). In 2008, OSMP began the Restoration Legacy Program to address the restoration needs of the system. An important part of the program was closure and restoration of undesignated trails on OSMP lands. In order to effectively reduce use of undesignated trails, it is essential that OSMP managers have a solid understanding of which types of closure treatments are most effective at ensuring visitor compliance with OSMP trail closures (both voluntary and regulatory closures). Furthermore, an understanding of visitor motivations for using undesignated trails is paramount for implementing specific management actions (or combinations of actions) to reduce use of such trails. Thus, understanding the relationships between closure treatments and visitor behavior supports the development of sustainable trail management strategies for OSMP lands. Background The use and creation of undesignated trails, also known as social trails is a specific area of concern on the OSMP system. Across OSMP lands there are 147 miles of designated trails and over 150 miles of undesignated trails. Researchers with Leave No Trace Center for Outdoor Ethics and Penn State University collaborated with OSMP staff and volunteers to collect data at twenty randomly selected designated/undesignated trail junctions across the OSMP trails system. Through a multi-method experimental design, which included unobtrusive observation and visitor survey data collection, this study examined the effectiveness of indirect and direct management activities for reducing the use of undesignated trails on OSMP lands. Study Justification This was the first known study of its kind on municipal open space lands. As such, this study provides a unique addition to the scientific and professional literature on parks and 1 Results from the 2004/2005 visitation study were multiplied by the average annual Boulder County population increase to estimate the current number of visits to OSMP. 1
11 protected areas, adding information on alternative management practices for reducing visitor impacts in parks and protected areas. Recent trend data (see Outdoor Industry Foundation, 2012) indicate that a continued increase in recreational use of public lands, including open space, is likely to occur over the coming years. Therefore, studies of this kind may be useful for both educational programs such as Leave No Trace and land managers across the country as they work to reduce recreation-related impacts. Study Objectives There were three primary study objectives: 1. To explore current use of UTs and DTs on OSMP lands through observation and visitor surveys (see Appendix L); 2. To deploy a series of five educational and/or management treatments/control to twenty randomly selected UTs using a stratified sampling strategy (e.g., attempting distributed stratification by a.m./p.m., weekday/weekend, treatment, location, paired sampling/observation only sampling) over a one-month period, to determine which treatment was most effective at mitigating use of undesignated trails (see Appendices H-K); 3. To pair observed OSMP trail users response to treatments/control with survey data from those same observed individuals or parties for comparative analysis of observed behavior and reported behavior. Study Goals The overarching goal of this study was to apply a range of management treatments in conjunction with associated controls, and use unobtrusive visitor observation and survey methods to assess the effectiveness of the experimental management treatments in achieving closure objectives. More specifically, this study expored the following hypotheses: H1 All management treatments would reduce use of undesignated trails from control levels. H2 A combination of treatments would be more effective than any single treatment in reducing use of undesignated trails from control levels. Literature Review Recent trend data indicate that a continued increase in recreational use of public lands nationwide, including open space, is likely to occur over the coming years (Cordell, 2012; Outdoor Industry Foundation, 2012). Research has shown that increasing visitation often 2
12 leads to increased impacts to soils, vegetation, wildlife and other visitors (Hammitt & Cole, 1987). Of critical concern to this study is the notion that increased visitation likely correlates to an increase in the use of undesignated trails, which leads to myriad impacts (Park, Manning, & Marion, 2008). Land managers primarily address visitor use issues through one of two approaches: indirectly through visitor education such as Leave No Trace or directly through enforcement or sanctions (Manning, 2003; Marion & Reid, 2007). The most commonly applied principle in wilderness and backcountry management is that indirect actions be applied first, with more direct management actions being applied as a last resort (Marion, 2016). Indirect management strategies have traditionally been the preferred approach to mitigating recreation-related resource impacts (Hammitt, Cole, & Monz, 2015). These strategies tend to be less financially constraining, are perceived by visitors as unobtrusive, and are more in line with the experiential values associated with outdoor recreation (Marion, Leung, Eagleston, & Burroughs, 2016; Park et al., 2008; Reigner & Lawson, 2009). However, a routinely applied indirect management strategy may not always be the most effective approach (Cole, 1995), particularly in areas that receive moderate to high traffic (Marion et al., 2016). While previous research provides evidence to the efficacy of information/education as a means for addressing recreation-related impacts in a wilderness or backcountry context (Manning, 2003), less is known about the effectiveness of direct or indirect measures designed specifically for mitigating the use of undesignated trails in a frontcountry setting. Much of the research on the efficacy of visitor education and information has taken place in a wilderness or backcountry setting and has explored issues related to minimum-impact knowledge, behaviors, attitudes and beliefs (Marion & Reid, 2007). These studies have found education and information to be an effective means of increasing minimum-impact knowledge (Cole, Hammond, & McCool, 1997); altering visitor behavior (Bradford & McIntyre, 2007; Johnson & Swearingen, 1992; Reigner & Lawson, 2009); and have provided guidance for message design, delivery, and content (Cole et al., 1997; Winter, 2006; Winter, Cialdini, Bator, & Rhoads, 1998). While generally found to be efficacious, the extent to which education and information are effective in achieving management objectives varies depending on a number of factors, such as: target resource impacts, recreation settings and contexts, characteristics and circumstances of the message, and visitor experiences and behaviors to which they are applied (Reigner & Lawson, 2009). In the case of undesignated trail use, education and information have been found to be effective tools in minimizing, but not eliminating this behavior. Injunctive prescriptive messages (i.e., positively worded messages informing 3
13 visitors of behaviors that align with management objectives) with an appeal to ecological concerns are typically most effective when enforceable laws or regulations do not exist (Bradford & McIntyre, 2007; Johnson & Swearingen, 1992; Winter, Sagarin, Rhoads, Barrett, & Cialdini, 2000). With the exception of Habitat Conservation areas, off-trail travel is generally not an illegal activity on OSMP lands, therefore education and information which utilizes a prescriptive and ecologically-grounded plea might be most effective in this setting. An aspect of recreational trail behavior that has received little attention is the degree of intentionality regarding the use of undesignated trails. In other words, the impacts of offtrail travel have been well-documented (Guo, Smith, Leung, Seekamp, & Moore, 2015; Wimpey & Marion, 2011), but an understanding of the reasons for which recreationists base their decisions to venture off trail is lacking. Do recreationists travel off designated trails knowingly with intent, or do they end up off trail accidentally due to inadequate signage or some other reason? It behooves managers to invest in efforts to understand the motives behind visitor off-trail behavior to increase the effectiveness of management strategies. Understanding the reasons underlying problem recreation behaviors can inform managers of the most appropriate and effective approach for directing visitors to practice minimum impact behaviors. Problem recreation behaviors are often classified into 5 basic types (see Table A): illegal, careless, unskilled, uninformed, and unavoidable actions; with each category able to be influenced by messaging/education to varying levels (Manning, 2003). Illegal and unavoidable actions are considered to be little influenced by messaging/education, whereas unskilled and uninformed actions are considered to be highly responsive to messaging/education. By understanding where off-trail behaviors lie on this continuum of problem behaviors, managers can craft strategies to address the underlying causes. 4
 When problematic recreation behavior does occur, such as off-trail travel in particular, research")
14 Table A. Application of information/education to wilderness management problems (adapted from Manning, 2003) When problematic recreation behavior does occur, such as off-trail travel in particular, research suggests that resource impacts occur rapidly at the onset, and increase more slowly, if at all, thereafter (see Figure A). In other words, the relationship between use and impact is asymptotic rather than linear (Hammitt & Cole, 1987). The challenge this creates for managers is that moderate to low levels of use can create high levels of impact in a relatively short amount of time. A small minority of visitors who engage in problem behaviors can create high levels of impact that are lasting. In a system that experiences such high visitation as does OSMP, if only a small percentage of visitors engage in problem behaviors, significant and lasting impacts could result. Figure A. Use Impact Curve, adapted from Hammitt & Cole,
15 A fairly substantial body of recreational trails literature exists, which includes significant contributions from both recreational ecologists and social scientists alike. The recreation ecology literature has focused largely on the ecological impacts of human recreation behaviors, noting the effects of various recreation-related factors such as: hiking (Lynn & Brown, 2003), campsites and campfires (Marion et al., 2016), informal trail use (Wimpey & Marion, 2011), tree cutting for campfire use (Cole, 2016), rock climbing (Monz, 2009), and mountain biking (Marion et al., 2016). The common finding in this line of inquiry is that with human recreation comes inherent resource impacts. The extent of impacts is attributable to numerous factors, some site and context related, some related to the activity and equipment being used, and others specific to human behaviors. While recreation ecologists have worked to measure and model the causes and extent of impacts, social scientists have worked to fill in the gaps by exploring the cognitive factors underpinning outdoor recreation behaviors. The research in this area has focused largely on the use of persuasive messaging techniques (Cialdini, 2003; Winter et al., 2000) to direct visitors onto designated trails and off of undesignated, or informal, trail networks (Bradford & McIntyre, 2007; Kidd et al., 2015; Park et al., 2008). Results of social sciencebased recreational trails research suggests that educational and informational messages are generally effective at minimizing off-trail use compared to control conditions. Lacking in these studies has been either the collection of behavioral observation data (Lawhon, Newman, Taff, & Vaske, 2013; Vagias, Powell, Moore, & Wright, 2014), survey data to add depth to observational data (Bradford & McIntyre, 2007), or a method for pairing survey and observation data when both forms are collected (Park et al., 2008). In sum, the extant literature on indirect visitor management approaches has contributed significantly to our understanding of the efficacy of these efforts. Specifically, visitor education and information campaigns have proven to be successful means for achieving management objectives. However, the predominance of these studies have been conducted in wilderness or backcountry settings, thus less is known of the efficacy in high-use frontcountry settings. Moreover, little research has measured the effectiveness of a range of management approaches --- from indirect to direct --- in changing visitor behavior. Finally, when researchers have been able to collect observational and survey data they have often lacked the ability to pair the data sources - a commonly mentioned suggestion for future research focused on visitor behavior in parks and protected areas. While limited research of this kind has been done in national parks and wilderness settings, most of which has been hypothetical and attitudinal rather than behavioral and experimental (see Park et al and Johnson & Swearingen, 1992), there have been no such studies of this kind on open space lands to date. As such, this multi-method, experimental design study is a unique addition to the scientific and professional literature 6
16 on parks and protected areas, and adds to the minimal body of literature on alternative management practices for reducing visitor impacts in parks and protected areas. Studies such as this, in an open space context, may be particularly useful for both informing educational efforts and management actions that can be implemented by managers as they work to reduce recreation-related impacts. Methods The design of this study involved collecting data through both direct unobtrusive visitor observation and visitor surveys. Some data collection days consisted of observation only, while others paired observation with survey administration. The paired data collection facilitated a more robust understanding of the efficacy of the various educational messages and site management strategies. This section provides a basic overview of the methods utilized in this study. For a more detailed discussion of the applied research design and methods please see Appendix N Methodological Protocol. Site and Sample Sampling design was stratified over a one-month period in June Twenty-five days of sampling were allotted for data collection, beginning June 1 and concluding on June 30. Stratification was based upon the following considerations: a) 5 treatments; b) 20 sampling locations, or sites; c) a.m. or p.m. data collection; d) weekday (i.e., Monday, Tuesday, Wednesday, and Thursday) or weekend (i.e., Friday, Saturday, and Sunday) data collection; e) paired surveying with visitor behavior observation, or observation of visitor behavior without the survey instrument; f) availability and quantity of OSMP staff/volunteers and research staff; g) the limited sampling period spanning over one-month. Educational Treatment The development of the treatments containing behavioral messaging (i.e., Treatments 2, 3, and 5) was informed by an elicitation study with ~30 visitors on OSMP properties in October Participants rated nine messages, each crafted based upon persuasive communications literature (Cialdini et al., 2006; Hockett & Hall, 2007; Widner & Roggenbuck, 2000; Winter & Winter, 2006). Ultimately respondents evaluated: 1) the persuasiveness of the message, and: 2) the likelihood that the message would influence the visitor to stay on designated OSMP trails. Two statements were rated as being the most influential: 1) Stay on designated trails: Even when wet and muddy, to protects trailside plants and minimize erosion. This is Not a Designated Trail (Treatment 2), and 2) To Protect OSMP Lands: Please Stay on Designated Trails. This is Not a Designated Trail (Treatment 3). 7
17 Researchers deployed the series of five educational and/or management treatments/control to twenty randomly selected designated and undesignated trail intersections using a stratified sampling strategy (AM/PM, weekday/weekend, 5 treatments, 20 locations, paired sampling/observation only sampling) to determine which treatment is most effective at curbing use of undesignated trails. Treatments included: 1. Treatment One Control no educational or barrier treatments in place. 2. Treatment Two Educational treatment #1: Stay muddy hiker * This sign read Stay on designated trails: Even when wet and muddy, to protect trailside plants and minimize eroison. This is Not a Designated Trail. 3. Treatment Three Educational treatment #2: Protect hiker * This sign read To Protect OSMP Lands: Please Stay on Designated Trails. This is Not a Designated Trail. 4. Treatment Four Physical barrier* Physical barrier made of logs that aesthetically fit with the OSMP environment. 5. Treatment Five Physical barrier with Educational treatment #1* Physical barrier made of logs that aesthetically fit with the OSMP environment with the sign that read Stay on designated trails: Even when wet and muddy, to protect trailside plants and minimize erosion. This is Not a Designated Trail. affixed to the center. *Note: To maintain consistency and accurately determine visitor intentionality, Treatments 2, 3, 4, and 5 were set-back approximately 5 10 feet from the point of entry onto an undesignated trail, barring any physical barriers that inhibit this placement at a given site. Observational Measures Unobtrusive visitor observation was used to collect behavioral data at the 20 selected research sites. Trained observers conducted a census of trail users on both designated and undesignated trails, capturing the specifics of their behavior as it pertains to study treatments/control (i.e. interaction with treatment, decision made at trail intersection). No personally identifiable markers were captured by observers. Additional observation pairing information such as the color of lead person s bottoms and shoes was noted to ensure that observation ID numbers are appropriately paired with survey ID numbers. Survey Instrument The survey instrument was developed through a collaborative, iterative review process between the research team and OSMP staff. The instrument was framed within the context of the of the Theory of Planned Behavior (Ajzen, 1991) and developed to incorporate 8
18 established natural resource-based human dimensions questions, including items stemming from the Recreation Experience Preference scales (Driver, Tinsley, & Manfredo, 1991), established Leave No Trace-focused questions that have been used in numerous peer-reviewed studies (Lawhon et al., 2013; Taff et al., 2014; Vagias & Powell, 2010; Vagias, Powell, Moore, & Wright, 2014) questions regarding trail behaviors and perceptions of intervention treatments (Park, Manning, & Marion, 2008), and questions about visitor use preference, history, and basic demographic information. In the early development of the survey instrument, it was pretested with ~30 Penn State undergraduate students; and was subsequently field tested with visitors on OSMP properties in May Pretesting allowed respondents to inform researchers of potentially confusing wording and layout issues. Two trained surveyors worked together during each paired sampling period with one surveyor on the designated trail and the other on the undesignated trail. 9
19 Results Observation Data This section includes descriptive results related to the observation data. Table 1: Walkers/hikers comprised the majority of observed visitor activities (76%), followed by runners (18%) and bikers (6%) respectively. Table 1. Observed activity Activity N Percent Hiking/Walking Running Biking Climbing 2.1 Equestrian 3.1 Other 10.4 Total Missing System 2 Total 6 Total 2232 Table 2: The majority of visitors were traveling alone (58%), while 31% visited in pairs. Overall mean group size was Table 2. Observed group size Group Size N Percent Total Mean 1.65 Missing Total
20 Table 3: Approximately 25% of visitors were observed traveling with one or more dogs. Table 3. Number of dogs observed per observation Number of Dogs N Percent Table 4: This is a simplified version of Table 3. Approximately 25% of visitors were observed traveling with one or more dogs. Table 4. Dog present dichotomous (Yes/No) Presence of dog(s) N Percent No Dog One or more dogs Total Table 5: Dry Creek had the highest percentage of visitors traveling with one or more dogs. Roughly 95% of visitors here were observed with dogs. Cragmoor had the second highest (52%) followed by BVR (42%). Table 5. Study location by Number of dogs observed Number of Dogs Location Total Sanitarium Count % within Location 64.3% 27.7% 8.0% 0.0% 0.0% 0.0% 100.0% % within Dogs 8.6% 14.4% 17.8% 0.0% 0.0% 0.0% 10.1% Chautauqua Count % within Location 72.9% 23.3% 3.8% 0.0% 0.0% 0.0% 100.0% % within Dogs 5.8% 7.2% 5.0% 0.0% 0.0% 0.0% 6.0% Anemone Count % within Location 77.1% 20.5% 2.4% 0.0% 0.0% 0.0% 100.0% % within Dogs 3.8% 4.0% 2.0% 0.0% 0.0% 0.0% 3.7% Hogback Count % within Location 96.4% 3.6% 0.0% 0.0% 0.0% 0.0% 100.0% % within Dogs 1.6% 0.2% 0.0% 0.0% 0.0% 0.0% 1.3% Lost Gulch Count % within Location 91.8% 4.9% 3.3% 0.0% 0.0% 0.0% 100.0% % within Dogs 3.3% 0.7% 2.0% 0.0% 0.0% 0.0% 2.7% BVR Count % within Location 58.1% 30.2% 9.3% 1.6% 0.0% 0.8% 100.0% % within Dogs 4.5% 9.1% 11.9% 16.7% 0.0% 100.0% 5.8% Settler's Count % within Location 82.9% 14.4% 2.1% 0.5% 0.0% 0.0% 100.0% 11
21 Number of Dogs Location Total % within Dogs 9.2% 6.3% 4.0% 8.3% 0.0% 0.0% 8.4% Sanitas Count % within Location 85.9% 11.2% 2.3% 0.6% 0.0% 0.0% 100.0% % within Dogs 17.8% 9.1% 7.9% 16.7% 0.0% 0.0% 15.7% Red Rocks Count % within Location 77.0% 16.1% 5.7% 1.1% 0.0% 0.0% 100.0% % within Dogs 4.0% 3.3% 5.0% 8.3% 0.0% 0.0% 3.9% Cragmoor Count % within Location 48.7% 38.5% 12.8% 0.0% 0.0% 0.0% 100.0% % within Dogs 1.1% 3.5% 5.0% 0.0% 0.0% 0.0% 1.8% Amphitheater Count % within Location 91.1% 8.1% 0.8% 0.0% 0.0% 0.0% 100.0% % within Dogs 6.7% 2.3% 1.0% 0.0% 0.0% 0.0% 5.5% NCAR Count % within Location 78.1% 19.0% 2.9% 0.0% 0.0% 0.0% 100.0% % within Dogs 4.9% 4.7% 3.0% 0.0% 0.0% 0.0% 4.7% Coal Seam Count % within Location 85.3% 11.2% 2.8% 0.7% 0.0% 0.0% 100.0% % within Dogs 7.3% 3.7% 4.0% 8.3% 0.0% 0.0% 6.4% Flagstaff Count % within Location 87.5% 12.5% 0.0% 0.0% 0.0% 0.0% 100.0% % within Dogs 2.1% 1.2% 0.0% 0.0% 0.0% 0.0% 1.8% Dakota Ridge Count % within Location 81.9% 15.2% 2.1% 0.4% 0.4% 0.0% 100.0% % within Dogs 11.6% 8.4% 5.0% 8.3% 50.0% 0.0% 10.7% Gunbarrel Count % within Location 100.0% 0.0% 0.0% 0.0% 0.0% 0.0% 100.0% % within Dogs 1.4% 0.0% 0.0% 0.0% 0.0% 0.0% 1.1% Dry Creek Count % within Location 5.1% 65.4% 26.9% 2.6% 0.0% 0.0% 100.0% % within Dogs 0.2% 11.9% 20.8% 16.7% 0.0% 0.0% 3.5% Four Pines Count % within Location 63.0% 25.9% 11.1% 0.0% 0.0% 0.0% 100.0% % within Dogs 1.0% 1.6% 3.0% 0.0% 0.0% 0.0% 1.2% Red Rocks (S) Count % within Location 74.1% 25.9% 0.0% 0.0% 0.0% 0.0% 100.0% % within Dogs 1.2% 1.6% 0.0% 0.0% 0.0% 0.0% 1.2% Shanahan Count % within Location 64.0% 30.0% 3.0% 2.0% 1.0% 0.0% 100.0% % within Dogs 3.8% 7.0% 3.0% 16.7% 50.0% 0.0% 4.5% Total Count % within Location 75.4% 19.3% 4.5% 0.5% 0.1% 0.0% 100.0% % within Dogs 100.0% 100.0% 100.0% 100.0% 100.0% 100.0% 100.0% 12
22 Table 6: This is the same analysis as Table 5 above, with presence of dog collapsed to a Yes or No. Dry Creek had the highest percentage of visitors traveling with one or more dogs. Roughly 95% of visitors here were observed with dogs. Cragmoor had the second highest (52%) followed by BVR (42%). Table 6. Study location by observed presence of dog(s) dichotomous (Yes/No) Presence of dog(s) Location No Dog One or more dogs Total Sanitarium Count % within Location 63.2% 36.8% 100.0% % within Dogs_Dichot 8.6% 15.1% 10.2% Chautauqua Count % within Location 72.4% 27.6% 100.0% % within Dogs_Dichot 5.8% 6.7% 6.0% Anemone Count % within Location 77.1% 22.9% 100.0% % within Dogs_Dichot 3.8% 3.4% 3.7% Hogback Count % within Location 96.4% 3.6% 100.0% % within Dogs_Dichot 1.6% 0.2% 1.3% Lost Gulch Count % within Location 88.9% 11.1% 100.0% % within Dogs_Dichot 3.3% 1.3% 2.8% BVR Count % within Location 58.1% 41.9% 100.0% % within Dogs_Dichot 4.5% 9.7% 5.8% Settler's Count % within Location 82.4% 17.6% 100.0% % within Dogs_Dichot 9.2% 5.9% 8.4% Sanitas Count % within Location 85.9% 14.1% 100.0% % within Dogs_Dichot 17.8% 8.8% 15.6% Red Rocks Count % within Location 77.0% 23.0% 100.0% % within Dogs_Dichot 4.0% 3.6% 3.9% Cragmoor Count % within Location 48.7% 51.3% 100.0% % within Dogs_Dichot 1.1% 3.6% 1.7% Amphitheater Count % within Location 91.1% 8.9% 100.0% % within Dogs_Dichot 6.7% 2.0% 5.5% NCAR Count % within Location 78.1% 21.9% 100.0% % within Dogs_Dichot 4.9% 4.1% 4.7% Coal Seam Count % within Location 85.3% 14.7% 100.0% % within Dogs_Dichot 7.3% 3.8% 6.4% Flagstaff Count % within Location 85.4% 14.6% 100.0% % within Dogs_Dichot 2.1% 1.1% 1.8% 13
23 Presence of dog(s) Location No Dog One or more dogs Total Dakota Ridge Count % within Location 81.9% 18.1% 100.0% % within Dogs_Dichot 11.6% 7.7% 10.6% Gunbarrel Count % within Location 100.0% 0.0% 100.0% % within Dogs_Dichot 1.4% 0.0% 1.1% Dry Creek Count % within Location 5.1% 94.9% 100.0% % within Dogs_Dichot 0.2% 13.3% 3.5% Four Pines Count % within Location 63.0% 37.0% 100.0% % within Dogs_Dichot 1.0% 1.8% 1.2% Red Rocks (S) Count % within Location 74.1% 25.9% 100.0% % within Dogs_Dichot 1.2% 1.3% 1.2% Shanahan Count % within Location 64.0% 36.0% 100.0% % within Dogs_Dichot 3.8% 6.5% 4.5% Total Count % within Location 75.1% 24.9% 100.0% % within Dogs_Dichot 100.0% 100.0% 100.0% Table 7a: Direction of travel was operationalized as: DT visitors approaching on the designated trail from the nearest trailhead (trailhead of interest); Exiting DT visitors approaching from the opposite direction of the nearest trailhead (assumed to be exiting OSMP property); and UT visitors observed on an undesignated trail. DT users comprised the majority of the sample (59%), while 31% were exiting on a DT and approximately 10% were traveling on undesignated trails. Table 7a. Observed direction of travel Direction of travel N Percent DT UT Exiting DT Total Missing Total
24 Table 7b: On days when a treatment was in place (removing control days from the analysis), 51% of visitors were observed traveling on designated trails, while 39% were exiting the area and approximately 10% were traveling on undesignated trails. Table 7b. Observed direction of travel Control days removed Direction of travel N Percent DT UT Exiting DT Total Table 7c: Visitors who approached the study site from the opposite direction of the nearest trailhead (operationalized as exiting OSMP property) were assumed to have previously passed by the trail intersection of interest when entering the area. It is likely these visitors had passed the study site upon entry to the area and had already seen/interacted with the treatment, introducing bias to the trail use decision. When excluding these visitors from the analysis, 85% of visitors were observed using designated trails and 15% using undesignated trials. Table 7c. Observed direction of travel (Exiting DT removed) Direction of travel N Percent DT UT Total Table 8: UT users were significantly more likely to be traveling with a dog (35%) than were DT users (25%). Table 8. Presence of a dog by trail use (DT or UT) Dog or no dog Visitor was traveling on DT or UT No Dog One or more dogs Total DT Count % within Visitor was traveling on DT or UT 75.0% 25.0% 100.0% % within Dog or no dog 87.1% 80.3% 85.3% UT Count % within Visitor was traveling on DT or UT 64.6% 35.4% 100.0% % within Dog or no dog 12.9% 19.7% 14.7% Total Count % within Visitor was traveling on DT or UT 73.5% 26.5% 100.0% % within Dog or no dog 100.0% 100.0% 100.0% Pearson Chi-Square a
25 Table 9: UT visitors in the Treatment category (43%) approached the study site on a designated trail but continued on to the undesignated trail upon arrival at the UT/DT intersection. Those in the No Treatment category (57%) approached the study site from the opposite direction of the treatment. Table 9. Observed direction of travel on UT Direction of travel on UT N Percent No Treatment Treatment Total Table 10: A total of 1407 visitors were observed who would have had an opportunity to interact with the treatment in place. This number is obtained when removing the visitors who were observed traveling in the exiting direction on a DT, and those UT users who were coming from the direction opposite the treatment. Table 10. Trail use decision upon arrival at UT/DT junction Decision at UT/DT N Percent DT UT 98 7 Total Table 11: Treatments were randomized across 20 sites. Sanitas, Dakota Ridge and Sanitarium were the top three most frequently visited sites, with 348, 237 and 228 observations respectively. Table 11. Location by Treatment Location Control Ed 1 Ed 2 Barrier Barrier/Ed Total Sanitarium Count % within Treatment 6.2% 8.1% 12.7% 18.0% 10.4% 10.2% Chautauqua Count % within Treatment 4.0% 7.1% 7.8% 7.8% 4.2% 6.0% Anemone Count % within Treatment 3.2% 2.7% 6.1% 4.8% 2.5% 3.7% Hogback Count % within Treatment 1.0% 1.0% 1.3% 2.1% 1.4% 1.3% Lost Gulch Count % within Treatment 0.5% 2.7% 4.6% 8.1% 0.3% 2.8% BVR Count % within Treatment 7.3% 3.3% 3.5% 7.8% 7.3% 5.8% Settler's Count Treatment
26 Treatment Location Control Ed 1 Ed 2 Barrier Barrier/Ed Total % within Treatment 10.7% 6.7% 10.4% 6.0% 7.0% 8.4% Sanitas Count % within Treatment 31.4% 11.0% 11.6% 3.6% 10.1% 15.6% Red Rocks Count % within Treatment 3.0% 4.4% 5.8% 2.4% 3.9% 3.9% Cragmoor Count % within Treatment 1.8% 0.4% 1.8% 3.0% 2.5% 1.7% Amphitheater Count % within Treatment 4.5% 4.2% 4.1% 6.9% 9.5% 5.5% NCAR Count % within Treatment 3.5% 2.7% 5.1% 3.6% 10.4% 4.7% Coal Seam Count % within Treatment 5.7% 6.3% 7.3% 11.1% 2.2% 6.4% Flagstaff Count % within Treatment 1.9% 4.0% 0.3% 2.1% 0.0% 1.8% Dakota Ridge Count % within Treatment 12.1% 20.8% 9.1% 0.0% 4.8% 10.6% Gunbarrel Count % within Treatment 0.6% 2.1% 1.5% 0.9% 0.0% 1.1% Dry Creek Count % within Treatment 0.5% 5.6% 3.3% 6.0% 3.6% 3.5% Four Pines Count % within Treatment 0.3% 0.2% 1.3% 3.0% 2.5% 1.2% Red Rocks (S) Count % within Treatment 0.5% 1.7% 0.0% 2.7% 1.7% 1.2% Shanahan Count % within Treatment 1.3% 5.0% 2.5% 0.0% 15.7% 4.5% Total Count % within Treatment 100.0% 100.0% 100.0% 100.0% 100.0% 100.0% 17
27 Table 12: Shift type - observation only or paired (observation and survey) was stratified across treatment type. There was an even split in total observations by shift type, and all treatment types were adequately represented in the observations. Table 12. Shift Type by Treatment Treatment Shift Type Control Ed 1 Ed 2 Barrier Barrier/Ed Total Observation Count % within Treatment 72.2% 38.8% 44.6% 37.2% 44.3% 49.9% Paired Count % within Treatment 27.8% 61.2% 55.4% 62.8% 55.7% 50.1% Total Count % within Treatment 100.0% 100.0% 100.0% 100.0% 100.0% 100.0% Table 13: Observation shifts consisted of four different time periods, which were stratified by treatment and day. The majority of observations were made during the Late AM shift (731). All treatment types were adequately represented across shift periods. Table 13. Shift Period by Treatment Treatment Period Control Ed 1 Ed 2 Barrier Barrier/Ed Total Early AM Count % within Treatment 22.8% 16.3% 28.1% 40.2% 30.5% 26.1% Late AM Count % within Treatment 54.2% 18.5% 18.0% 20.1% 44.0% 32.8% Early PM Count % within Treatment 8.5% 26.7% 20.3% 29.1% 16.8% 19.2% Late PM Count % within Treatment 14.5% 38.5% 33.7% 10.5% 8.7% 22.0% Total Count % within Treatment 100.0% 100.0% 100.0% 100.0% 100.0% 100.0% 18
28 Table 14a: Treatment interaction was operationalized as Pass and Read the visitor took an obvious look at the treatment but did not stop moving, and a Stop and Read the visitor physically stopped moving to read/observe the treatment. Ed 1 received the highest percentage of Pass and Reads (34%), followed by Barrier/Ed 1 (24%) and Ed 2 (20%) respectively. A Barrier received the highest percentage of Stop and Reads (27%), followed by Ed 1 (26%) and Barrier/Ed 1 (24%) respectively. Table 14a. Treatment type by treatment interaction Treatment interaction Treatment Type None Pass and Read Stop and Read Total Control Count % within Treatment in place 98.0% 0.9% 1.1% 100.0% % within Treatment interaction 27.6% 4.2% 4.3% 24.9% Education 1 Count % within Treatment in place 85.5% 7.3% 7.3% 100.0% % within Treatment interaction 22.9% 33.8% 26.1% 23.7% Education 2 Count % within Treatment in place 88.1% 5.4% 6.5% 100.0% % within Treatment interaction 18.6% 19.7% 18.5% 18.6% Barrier Count % within Treatment in place 84.0% 5.5% 10.5% 100.0% % within Treatment interaction 16.2% 18.3% 27.2% 17.0% Barrier/Ed Count % within Treatment in place 82.3% 7.7% 10.0% 100.0% % within Treatment interaction 14.7% 23.9% 23.9% 15.7% Total Count % within Treatment in place 88.3% 5.1% 6.6% 100.0% % within Treatment interaction 100.0% 100.0% 100.0% 100.0% *Total N=1407 (10 Missing Cases) 19
29 Table 14b: Treatment interaction is collapsed in to a dichotomous variable (interaction or no interaction). Of those who interacted with a treatment, Ed 1 received the greatest percentage of interaction (29%), followed by Barrier/Ed (24%). Of the treatments in place, visitors interacted with Barrier/Ed roughly 18% of the time, followed by Barrier (16%) and Ed 1 (15%). Table 14b. Treatment type by treatment interaction (collapsed into 2 categories) Treatment interaction Treatment in place No Interaction Interaction Total Control Count % within Treatment in place 98.0% 2.0% 100.0% % within Treatment interaction 27.6% 4.3% 24.9% Education 1 Count % within Treatment in place 85.5% 14.5% 100.0% % within Treatment interaction 22.9% 29.4% 23.7% Education 2 Count % within Treatment in place 88.1% 11.9% 100.0% % within Treatment interaction 18.6% 19.0% 18.6% Barrier Count % within Treatment in place 84.0% 16.0% 100.0% % within Treatment interaction 16.2% 23.3% 17.0% Barrier/Ed Count % within Treatment in place 82.3% 17.7% 100.0% % within Treatment interaction 14.7% 23.9% 15.7% Total Count * % within Treatment in place 88.3% 11.7% 100.0% % within Treatment interaction 100.0% 100.0% 100.0% *Total N=1407 (10 Missing Cases) 20
30 Table 14c: Here, Ed 1 and Ed 2 have been collapsed as well as Barrier and Barrier/Ed. Of the treatments in place the Barrier category was the most likely to receive a Pass and Read (7%) and Stop and Read (10%). Table 14c. Treatment type (collapsed) by treatment interaction Treatment interaction Treatment in place None Pass and Read Stop and Read Total Control Count % within Treatment 98.0% 0.9% 1.1% 100.0% % within Treatment interaction 27.6% 4.2% 4.3% 24.9% Education Count % within Treatment 86.6% 6.4% 6.9% 100.0% % within Treatment interaction 41.5% 53.5% 44.6% 42.3% Barrier Count % within Treatment 83.2% 6.6% 10.3% 100.0% % within Treatment interaction 30.9% 42.3% 51.1% 32.8% Total Count * % within Treatment 88.3% 5.1% 6.6% 100.0% % within Treatment interaction 100.0% 100.0% 100.0% 100.0% *Total N=1407 (10 Missing Cases) Table 14d: In this case, both treatment interaction and treatment in place have been collapsed. The Barrier category received visitor interactions roughly 17% of the time, while the Education category received interaction 13% of the time. Table 14d. Treatment type (collapsed) by treatment interaction (collapsed) Treatment Interaction Treatment in place No Interaction Interaction Total Control Count % within Treatment 98.0% 2.0% 100.0% % within Treatment interaction 27.6% 4.3% 24.9% Education Count % within Treatment 86.6% 13.4% 100.0% % within Treatment interaction 41.5% 48.5% 42.3% Barrier Count % within Treatment 83.2% 16.8% 100.0% % within Treatment interaction 30.9% 47.2% 32.8% Total Count * % within Treatment 88.3% 11.7% 100.0% % within Treatment interaction 100.0% 100.0% 100.0% *Total N=1407 (10 Missing Cases) 21
31 Table 15a: Among visitors who traveled past the study site, those who made a decision to use the UT were much more likely to interact with the treatment. Nearly 24% of UT users stopped and read the treatment. Table 15a. Trail use decision by Treatment interaction (Including Control Days) Treatment interaction Trail use: Decision upon arrival at UT/DT Intersection None Pass and Read Stop and Read Total DT Count % within Decision upon arrival 89.8% 4.8% 5.3% 100.0% % within Treatment interaction 94.6% 88.7% 75.0% 93.0% UT Count % within Decision upon arrival 68.4% 8.2% 23.5% 100.0% % within Treatment interaction 5.4% 11.3% 25.0% 7.0% Total Count % within Decision upon arrival 88.3% 5.1% 6.6% 100.0% % within Treatment interaction 100.0% 100.0% 100.0% 100.0% *Total N=1407 (10 Missing Cases) Table 15b: Here, control days have been removed from the previous analysis. When removing observations when no treatment was in place the percentage of UT users who stopped and read the treatment is closer to 32%. Table 15b. Trail use decision by Treatment interaction (Excluding Control Days) Treatment interaction Trail use: Decision upon arrival at UT/DT Intersection None Pass and Read Stop and Read Total DT Count % within Decision upon arrival 87.2% 6.1% 6.7% 100.0% % within Treatment interaction 95.7% 88.2% 75.0% 93.5% UT Count % within Decision upon arrival 55.9% 11.8% 32.4% 100.0% % within Treatment interaction 4.3% 11.8% 25.0% 6.5% Total Count % within Decision upon arrival 85.1% 6.5% 8.4% 100.0% % within Treatment interaction 100.0% 100.0% 100.0% 100.0% *Total N=1049 (9 Missing Cases) 22
32 Table 15c: Continuing with the previous analysis here, treatment interaction has been collapsed into a dichotomous variable. In this case, 44% of visitors who made a decision to use the UT had an interaction with the treatment. Table 15c. Trail use by Treatment interaction (collapsed) (Excluding Control Days) Treatment interaction Trail use: Decision upon arrival at UT/DT Intersection No Interaction Interaction Total DT Count % within Decision upon arrival 87.2% 12.8% 100.0% % within Treatment interaction 95.7% 80.8% 93.5% UT Count % within Decision upon arrival 55.9% 44.1% 100.0% % within Treatment interaction 4.3% 19.2% 6.5% Total Count % within Decision upon arrival 85.1% 14.9% 100.0% % within Treatment interaction 100.0% 100.0% 100.0% Table 16a: When looking at trail use decision by the type of treatment in place it is apparent that the Barrier/Ed treatment is 97% effective at directing visitors to the DT, followed by Barrier (94%), and Ed 2 (94%). This suggests the Barrier/Ed treatment to be the most effective method for mitigating use of UTs. Table 16a. Treatment type by decision upon arrival at DT/UT Intersection (Take UT or stay on DT) Treatment in place DT UT Total Control Count Decision % within Treatment 91.4% 8.6% 100.0% % within Decision 24.4% 30.6% 24.8% Ed 1 Count % within Treatment 90.8% 9.2% 100.0% % within Decision 23.4% 31.6% 24.0% Ed 2 Count % within Treatment 93.9% 6.1% 100.0% % within Decision 18.7% 16.3% 18.6% Barrier Count % within Treatment 94.2% 5.8% 100.0% % within Decision 17.3% 14.3% 17.1% Barrier/Ed Count % within Treatment 96.8% 3.2% 100.0% % within Decision 16.3% 7.1% 15.6% Total Count Chi-square = 9.642* (p=.047) % within Treatment 93.0% 7.0% 100.0% % within Decision 100.0% 100.0% 100.0%
33 Table 16b: Chi-square analyses were used to examine whether statistically significant differences existed between Treatment and Control conditions. Only Treatment 5 (Barrier/Ed) was found to produce statistically significant differences in UT use, when compared to control conditions. Table 16b. Treatment effectiveness: Chi-square analysis with post hoc and effect size statistics X 2 p-value Effect size 2 Trail-use decision at Treatment in place DT UT Total treatment 1 Control (91.4) (8.6) (100.0) Ed (90.8) (9.2) (100.0) Ed (93.9) (6.1) (100.0) Barrier (94.2) (5.8) (100.0) Barrier/Ed *.107 (96.8) (3.2) (100.0) Total (93.0) (7.0) (100.0) *sig. at.05 level 1 Cell entries are are observed counts. Values in parenthesis are percentages 2 phi () coefficients presented as an estimate of effect size 24
34 Table 16c: Here, control days have been removed from the previous analysis in Table 16a to focus on treatments alone. Table 16c. Treatment type (excluding control) by decision upon arrival at DT/UT Intersection (Take UT or stay on DT) Decision Treatment in place DT UT Total Ed 1 Count % within Treatment 90.8% 9.2% 100.0% % within Decision 30.9% 45.6% 31.9% Ed 2 Count % within Treatment 93.9% 6.1% 100.0% % within Decision 24.7% 23.5% 24.7% Barrier Count % within Treatment 94.2% 5.8% 100.0% % within Decision 22.8% 20.6% 22.7% Barrier/Ed Count % within Treatment 96.8% 3.2% 100.0% % within Decision 21.5% 10.3% 20.8% Total Count % within Treatment 93.6% 6.4% 100.0% % within Decision 100.0% 100.0% 100.0% Chi-square = 8.336* (p=.034) Table 16d: Continuing with the previous line of analysis here, treatments have been collapsed to Ed and Barrier categories. The Barrier category of treatments was found to be 95% effective while the Ed category of treatments was 92% effective. Table 16d. Treatment type (collapsed) by decision upon arrival at DT/UT Intersection (Take UT or stay on DT) Treatment in place DT UT Total Control Count % within Treatment 91.4% 8.6% 100.0% % within Decision 24.4% 30.6% 24.8% Ed Count % within Treatment 92.1% 7.9% 100.0% % within Decision 42.1% 48.0% 42.5% Barrier Count % within Treatment 95.4% 4.6% 100.0% % within Decision 33.5% 21.4% 32.7% Total Count Decision upon % within Treatment 93.0% 7.0% 100.0% % within Decision 100.0% 100.0% 100.0% Chi-square = 6.259* (p=.044)
35 Table 16c: This is the same analysis as Table 16c, but with control days removed. Table 16c. Treatment type (collapsed excluding Control) by decision upon arrival at DT/UT Intersection (Take UT or stay on DT) Decision Treatment in place DT UT Total Education Count % within Treatment 92.1% 7.9% 100.0% % within Decision 55.7% 69.1% 56.5% Barrier Count % within Treatment 95.4% 4.6% 100.0% % within Decision 44.3% 30.9% 43.5% Total Count Chi-square = 4.160* (p=.041) % within Treatment 93.6% 6.4% 100.0% % within Decision 100.0% 100.0% 100.0% Table 17: Over 40% of visitors who were observed/surveyed while using a UT reported they Always use designated trails. This suggests that these visitors did not know they were in fact traveling on a UT. Table 17. Behavioral intent vs observed behavior Observed Behavior Do you travel on designated trails? DT UT Total Sometimes Always Total Survey Response Rate Table 18: A total of 220 visitors were invited to complete a survey, yielding a total of 147 completed surveys, for an overall response rate of 68% Table 18. Overall survey response rate Survey Response N Percent Declined Complete Incomplete 3.1 Total Requested Response Rate 68 26
36 Table 19: A total of 147 surveys were collected 86 from UT users and 61 from DT users. UT users were more willing to complete a survey (80% accepted) than were DT users (57% accepted) Table 19. Survey response by trail use Survey Response Observed Trail Use Declined Complete Incomplete Total (%) DT (57%) UT (80%) Total (68%) Table 20a: Surveys were adequately distributed across treatment types. Table 20a. Survey response by treatment type Treatment Survey Response Control Education 1 Education 2 Barrier Barrier/Ed Total Refused Complete Incomplete Total Table 20b: Surveys were adequately distributed across treatment types. Table 20b. Survey response by treatment type collapsed Tx categories Treatment Survey Response Control Education Barrier Total Refused Complete Incomplete Total Survey Response Analysis Table 21. The large majority of respondents indicated their primary activity to be hiking/walking (74%), followed by Running (16%). Table 21. What is your primary activity today? Activity Percent (N=137) Hiking/Walking 74 Running 16 Walking Dog(s) 4 Biking 2 Climbing/Bouldering 0 Horseback Riding 2 Other 4 27
37 Table 22. The majority of respondents were not accompanied by a dog (69%). Table 22. How many dogs did YOU bring today (please do not include dogs another person in your group brought)? Number of dogs Percent (N=144) Table 23. Approximately 22% of respondents were visiting this specific section of trail for the first time. 32% had visited between one and twelve times previously, and 24% had made prior visits. Table 23. How many times have you visited this section of trail in the past 12 months? Previous Visits Percent (N=144) Today is my first visit visits visits visits visits 6 >240 visits 9 Table 24. The majority of respondents (58%) are aware that some OSMP trails are undesignated or not official trails. Table 24. Are you aware that some trails in City of Boulder OSMP are undesignated or not official trails? Response Percent (N = 142) Yes 58 No 42 Table 25. Respondents felt that human recreation behaviors have the potential to cause both ecological and social impact, though the potential for negative ecological impact was believed to be greater than the potential for negative social impact (Mean 4.76 vs 4.12). Table 25. To what extent do you believe that human recreation behaviors have the potential to cause NEGATIVE IMPACT, a) Ecologically, and b) Socially in City of Boulder OSMP? (Select only one answer per item) Type of impact as a result of No Impact At All Moderate Impact Extensive Impact human recreation behaviors N Mean SD Ecological Social
38 Table 26. Respondents were asked to evaluate the appropriateness of a series of off-trail behaviors in OSMP. Traveling off a designated trail to get away from crowds was ranked as the least appropriate reason for off-trail travel (Mean 2.97), while Traveling off a designated trail because there is an alternative established path was the least inappropriate reason (Mean 3.85). Table 26. Please indicate how INAPPROPRIATE or APPROPRIATE you think each of the following activities is for a visitor to do in City of Boulder OSMP. (Select only one answer per item) Very Inappropriate Neutral Very Appropriate Activities N Mean SD a. Traveling off a designated trail to experience the natural environment b. Traveling around muddy spots on a designated trail c. Traveling off a designated trail to explore d. Traveling off a designated trail to take photos e. Traveling off a designated trail to get away from crowds on the trail f. Traveling off a designated trail because there is an alternative established path Table 27. Respondents were asked to indicate how effective they believe certain behaviors are at reducing negative impacts in OSMP. Of the activities provided for reducing negative impacts in OSMP, Adhering to messages on posted signage was reported to be the most effective (Mean = 5.77), followed by Staying on a designated trail (Mean = 5.55). Staying off a trail when conditions are wet and muddy was reported to be the least effective (Mean = 4.81). Table 27. Please indicate how EFFECTIVE the following activities would be at reducing NEGATIVE IMPACTS in City of Boulder OSMP. Never Effective Sometimes Effective Effective Every Time Activities N Mean SD a. Staying on a designated trail b. Traveling in the middle of a designated trail, even when wet or muddy c. Traveling on a designated trail, even when passing other visitors d. Staying off a designated trail when conditions are wet and muddy e. Adhering to messages on posted signage
39 Table 28. Respondents were asked to indicate how difficult various minimum-impact trailuse behaviors are in OSMP. In general, the listed behaviors were considered to be rather easy to perform. Mean scores for all but one item were above 5 on a scale of 1 to 7. Traveling in the middle of a designated trail, even when wet or muddy was indicated to be the most difficult behavior, with a mean of Adhering to messages on posted signage was reported to be the easiest of the behaviors to perform (Mean = 5.89). Table 28. Please indicate how DIFFICULT you think each of the following activities would be for you to do in City of Boulder OSMP. (Select only one answer per item) Very Difficult Neutral Very Easy Activities N Mean SD a. Staying on a designated trail b. Traveling in the middle of a designated trail, even when wet or muddy c. Traveling on a designated trail, even when passing other visitors d. Traveling on a designated trail, even when you have previously traveled on an undesignated trail in the area e. Traveling on a designated trail, even when an undesignated trail is available in the area f. Traveling on a designated trail, even when you have observed another visitor traveling on an undesignated trail g. Adhering to messages on posted signage Table 29a. Respondents were asked to indicate how often they perform the same set of behaviors listed previously. The large majority indicated they either Sometimes, or Always practice the behavior. The most frequently practiced behaviors were Always adhering to messages posted on signage (65%) and Always staying on designated trails (60%). While these findings suggest the majority of people Always practice these minimum-impact trail behaviors, there remains a large percentage of visitors who reported to only Sometimes perform the behavior. The likelihood of traveling on a designated trail appears to decline when the visitor has previously traveled a UT in the area, and/or when a UT is available in the area. Moreover, 11% of respondents indicated they Never travel in the middle of a designated trail, even when wet or muddy. This finding supports the previous that this is also perceived as the most difficult of the behaviors to perform. 30
40 Table 29a. Current trail use behavior Percentage Activities N Never Sometimes Always a. Staying on a designated trail b. Traveling in the middle of a designated trail, even when wet or muddy c. Traveling on a designated trail, even when passing other visitors d. Traveling on a designated trail, even when you have previously traveled on an undesignated trail in the area e. Traveling on a designated trail, even when an undesignated trail is available in the area f. Traveling on a designated trail, even when you have observed another visitor traveling on an undesignated trail g. Adhering to messages on posted signage Table 29b. Intent to perform a behavior in the future is often used as an indicator of the likelihood of one actually following through with said behavior. Here, respondents were asked to indicate how likely they are to perform the same set of previously listed behaviors. Respondents generally indicated a high likelihood of performing each behavior. Adhering to messages on posted signage (Mean = 6.02) and Staying on a designated trail (Mean = 5.98) have the highest likelihood of being performed in the future. This result follows the previous findings these are believed to be the easiest behaviors to perform and are currently reported to be performed most frequently. Behaviors with the lowest likelihood of future performance were: Traveling in the middle of a designated trail, even when wet or muddy (Mean = 5.50), Traveling on a designated trail, even when you have previously traveled on an undesignated trail in the area (Mean = 5.60) and Traveling on a designated trail, even when an undesignated trail is available in the area (5.68). Again, these results follow the pattern found in the previous analysis, in that these are perceived as the more difficult behaviors and are currently reported to be performed less frequently. 31
41 Table 29b. Future trail use behavioral intent Percent Extremely Unlikely Neutral Extremely Likely How likely are you to do this in the future? N Mean SD a. Staying on a designated trail b. Traveling in the middle of a designated trail, even when wet or muddy c. Traveling on a designated trail, even when passing other visitors d. Traveling on a designated trail, even when you have previously traveled on an undesignated trail in the area e. Traveling on a designated trail, even when an undesignated trail is available in the area f. Traveling on a designated trail, even when you have observed another visitor traveling on an undesignated trail g. Adhering to messages on posted signage Table 30. Respondents were asked to report whether they had traveled off a designated trail during their visit. Twenty-eight percent indicated they had, 58% had not, and 13% were unsure. Table 30. Did you travel off a designated trail during your visit today? Response Percent (N = 130) Yes 28 No 58 Don t Know / Unsure 13 32
42 Table 31. Respondents were asked to indicate their reason(s) for traveling off trail during their visit. Of the reasons selected as applicable to their visit, I didn t mean to travel off the designated trail (it was an accident) (30%), and I have done it before and it worked well for my visitor experience (30%) were the most frequent responses. Table 31. Indicate whether or not any of the following reasons for traveling off the designated trail(s) applied to your visit today. (Select only one answer per item) Percent Does Not Apply Because I Only Traveled On Designated Applies N Trails to Me Reasons a. I didn t know that traveling off the designated trail could damage soils and vegetation b. I didn t know that it was recommended to stay on the designated trail c. I didn t mean to travel off the designated trail (it was an accident) d. I think visitors should be able to travel off the designated trail e. I thought that it would improve my visitor experience f. I have done it before and it worked well for my visitor experience g. Other reason (open ended): As long as your actions are not detrimental to the wild Didn't know this wasn't a trail Followed our dog who went off trail I try to always travel on designated trails Less freedom of travel is more restriction to life itself When I didn't know a trail was undesignated Don t Know Mud puddles Needed an isolated location for movie Only time is when weather or other people and it is rare Ordinarily aware and comply with exception of this trail This looked like a designated trail Wasn't posted thus didn't realize 33
43 Table 32. Respondents were provided a list of reasons for traveling only on designated trails and asked to indicate the importance of each. To not damage soils and vegetation (Mean = 5.96) was indicated as the most important, with 52% considering this to be Extremely Important. This was followed by Because Leave No Trace promotes traveling on designated trails (Mean = 5.41). The least important reason was Because I do not want anyone to see me travel off designated trails (Mean = 3.83). Table 32. Please indicate how IMPORTANT these reasons would be for you to travel only on designated trails in the FUTURE. (Select only one answer per item) Percent Not relevant Not At All Important Moderately Important Extremely Important Reasons N Mean SD a. To improve my outdoor experience on OSMP lands b. Because visitors are encouraged to stay on designated trails c. To not damage the soils and vegetation d. To not break the rules e. Because I do not want anyone to see me travel off designated trails f. Because it is unfair for me to travel off designated trails while many other visitors do not g. Because I have no reason to travel off designated trails h. Because Leave No Trace promotes traveling on designated trails i. Because I feel better about myself by not traveling off designated trails Table 33. The majority of respondents (66%) noticed a sign or barrier meant to keep visitors on designated trails, while 50% noticed a combination sign and barrier. Table 33. Did you notice the following on this trail today? (Check all that apply) Items N % Yes % No Informational signage to keep visitors on designated trails Fence or barrier to keep visitors on designated trails Combination of informational signage and fence or barrier to keep visitors on designated trails
44 Table 34. Respondents were asked to rank which management action would be most effective in keeping them off an undesignated trail: informational signage, fence or barrier, or a combination of informational signage and a fence or barrier. The combination sign/barrier was reported to be the most effective, followed by fence/barrier, and informational signage respectively. Table 34. Please RANK the following in order (1 st, 2 nd, and 3 rd ), indicating which would be most effective in keeping you off an undesignated trail. (1 st = Most Effective; 3 rd = Least Effective) Items N Mean Informational signage Fence or barrier Combination of informational signage and fence or barrier Table 35. Mean group size was 1.75, with a mode of 2. Table 35. How many people, including yourself, were part of your group today? N Mean Median Mode SD Table 36a. All respondents indicated they are residents of the US. Table 36a. Do you live in the United States? Response Percent (N=141) Yes 100 No 0 Table 36b. Seventy percent of respondents reported they live within the Boulder City limits. Table 36b. If yes, do you live within Boulder City limits? Response Percent (N=119) Yes 70 No 30 Table 37. Respondents were asked about their beliefs in regard to Leave No Trace practices and the extent to which they would change their behaviors. The majority of respondents (84%) indicated they would change their behavior if they learned their actions in OSMP were damaging the environment. The statement Practicing Leave No Trace does not reduce the environmental harm caused by travel in OSMP received less support, as only 23% responded in agreement. The standard deviation for this item (2.138) suggests there is a considerable amount of disagreement about this statement among respondents. Most 35
45 respondents disagreed that Practicing Leave No Trace takes too much time (85%). Finally, 84% believe Practicing Leave No Trace effectively protects the environment so that future generations may enjoy it. The fact that Items b and d are similar concepts but received very different levels of agreement is of note. This might suggest respondents don t believe Leave No Trace to be as effective at the local OSMP level as it is on a broader more general level. Table 37. Please indicate how strongly you AGREE or DISAGREE with the following statements. Percent Neither Strongly Disagree Agree or Disagree Strongly Agree N Mean SD a. If I learned my actions in OSMP damaged the environment, I would change my behavior b. Practicing Leave No Trace does not reduce the environmental harm caused by travel in OSMP c. Practicing Leave No Trace takes too much time d. Practicing Leave No Trace effectively protects the environment so that future generations may enjoy it Table 38. Respondents were asked about their motivations for visiting OSMP. Enjoying nature (Mean = 6.36) was indicated as the greatest motivation for visiting OSMP, followed by physical fitness (Mean = 5.76), and psychological health (Mean = 5.74). Learning (Mean = 4.08) and physical rest (Mean = 4.39) were among the least important motivations for visitation. Table 38. How IMPORTANT were each of the following reasons for your visit to City of Boulder OSMP today? (Select only one answer per item) Percent Not relevant Not At All Important Moderately Important Extremely Important Reasons N Mean SD a. Physical fitness b. Physical rest c. Psychological health d. Psychological rest e. Escape personal/social pressures f. Enjoying nature g. Learning h. Family/friend togetherness i. Solitude
46 Table 39. Respondents were provided the opportunity to provide additional comments in an open-ended format. Table 39. Open Ended Comments: Is there anything else you would like us to know? If so, please provide additional feedback below: 4 pines suffers from a great deal of braiding and it is hard to see the designated trail 81 yrs old and cannot climb taller than 1stair thus occasionally will take UTs that enable him to hike area A lot to say - see survey Education is the only way to keep people on trail. However, walking off trail to meditate or pull weeds is not the problem. Educate people... I don't know if I should stay on trail when wet/muddy, and if walking in the middle of trail is best - signage would be good if that's what is right I feel this trail should remain open. It provides important direct access to Chautauqua and Royal Arch from Bluebell neighborhood I grew up in British Columbia and live in Switzerland. My answers are impacted by my experiences on trail and backcountry in both. Some areas I stay exclusively on trail; others, off piste is common I like to lie in meadows to connect with the earth. This requires going off trail and is/has been part of my self-care in my work with the homeless and mentally ill. I don't want to harm the environment, at the same time this has been a way I nourish myself and I believe help others through my work. I love the trail! I realize these regulations are important in order to preserve the environment. However, I will always choose personal enjoyment/connection with nature over ANY law or regulation. Sorry. If ever off a designated trail I am on a trail...not just grass Let's not turn open space into a "wilderness area". Disagree with closing some social trails when there is no impact or reason to. Use the U. of C. example - they built the sidewalks where the students prefer to walk. No need to overpolice! Love OSMP - you do good work Love the outdoors! Maybe provide places for photography More signage about staying on trails, specifically muddy trails More trash cans on trails especially for dog poop My favorite color is green and my spirit animal is a space otter Need more mountain bike trails Often is difficult to tell where exactly designated trails exist because of so many social trails People are loving Chautauqua to death! Too, too crowded. I pick up trash and dog waste often when I walk my dog (not with me today he's injured) Please finish the Sanitas Valley trail ASAP. Please take the wooden fence down near the stone cabin/house Poorly worded questionnaire...lots of options not listed Stop making open space restrictive each year Survey is 3x too long and confusingly worded. I don't know how much valuable info you'll be able to get from it because it's really very hard to understand. Very much appreciate the work y'all do and all of the wonderful trails. Surveyor note: This individual felt the survey was too complicated and questions not direct enough Thank you - appreciate these programs Thank you Thanks for helping nature! Thanks for your attention with this issue/ We are loving these trails to death. 37
47 The Q11 answers do not make sense and/or are contradictory to one another The survey seems to miss critical issues like climbing access and established low volume social trails There are always bits of trash, but I'm pleased so far. Nature is more than outdoors, but habit and happenings These survey answers did not encompass the full spectrum. Also the future questions were irrelevant if my attitude towards OSMP doesn't change. Too long of a survey! Too many dogs - they often outnumber the people! Trails should be formalized/designated if social trails indicate a logical path; Step off trail to let leashed dogs pass; walk on pasture after mowing, people need to experience this freedom; OSMP needs to be realistic about which vegetation is worth protecting - brome grass is not an endangered species; brome grass does not need protection When trails have extreme braiding or social trails it is hard to know designated trails Where trails are muddy - close trails Would appreciate more signage to ask people not to collect things like mushrooms and asparagus Survey Response by Use History The following section includes tables and figures related to analysis that explored survey responses by visitor use history number of previous visits. Table 40: Frequent visitors are more likely than those who visit less often to report knowing some OSMP trails are undesignated. Alternatively, those who visit less often are less likely to know some trails are undesignated. This might suggest the more familiar one becomes with the OSMP trails system the more aware they are of the network of undesignated trails. Those who visit less are less aware and might assume UTs to be DTs. Table 40. Relationship between visitation history and awareness of undesignated trails Are you aware some trails are undesignated? Number of previous visits No Yes Total First visit Count % within Previous visit 55.9% 44.1% 100.0% % within Are you aware some trails are undesignated? 30.6% 17.9% 23.3% 1-12 Count % within Previous visit 52.2% 47.8% 100.0% % within Are you aware some trails are undesignated? 38.7% 26.2% 31.5% Count % within Previous visit 44.4% 55.6% 100.0% % within Are you aware some trails are undesignated? 25.8% 23.8% 24.7% 49 or Count more % within Previous visit 10.0% 90.0% 100.0% % within Are you aware some trails are undesignated? 4.8% 32.1% 20.5% Total Count % within Previous visit 42.5% 57.5% 100.0% % within Are you aware some trails are undesignated? 100.0% 100.0% 100.0% Pearson Chi-Square a
48 Table 41. Significant relationships were found between visitation history and attitudes towards the appropriateness of certain trail use behaviors. Those who had visited times previously are least likely to approve of walking around muddy spots. And those who had visited times previously are least likely to approve of traveling off trail to get away from crowds. Interestingly, those who had visited times previously showed consistently lower mean scores across the battery of items, meaning their attitudes are more in line with Leave No Trace. Those who had visited 1-12 times consistently had the highest means, meaning less in line with Leave No Trace. Table 41. Please indicate how INAPPROPRIATE or APPROPRIATE you think each of the following activities is for a visitor to do in City of Boulder OSMP. 1 Number of previous visits Behavior First visit or more Total F Sig. Travel off a designated trail to N experience the natural Mean environment Std. Dev Traveling around muddy spots while on a designated trail Travel off a designated trail to explore Travel off a designated trail to take photos Travel off a designated trail to get away from crowds Travel off a designated trail because there is an alternative established path N Mean 3.94 b 3.95 b 2.83 a 3.65 a,b 3.61 Std. Dev N Mean Std. Dev N Mean Std. Dev N Mean Std. Dev N Mean Std. Dev Scale: 1=Very Inappropriate 7=Very Appropriate a,b Superscripts represent homogeneous subgroups Tukey s post-hoc 39
49 Table 42. No statistically significant results, but some interesting findings are of note. For example, the most frequent visitors had the lowest mean score (more difficult) for difficulty of staying on designated trails. The same is true of Adhering to messages posted on signage. Table 42. Please indicate how DIFFICULT you think each of the following activities would be for you to do in City of Boulder OSMP. 1 Number of previous visits Behavior First visit or more Total F Sig. Staying on a designated trail N Mean Std. Dev Travel in the middle of a DT, even N when wet and muddy Mean Std. Dev Travel on a DT, even when passing other visitors Travel on a DT even when you have previously traveled on a UT in the area Travel on a DT, even when a UT is available in the area Travel on a DT, even when you have observed others traveling on UT Adhering to messages on posted signage N Mean Std. Dev N Mean Std. Dev N Mean Std. Dev N Mean Std. Dev N Mean Std. Dev Scale: 1=Very Difficult 7=Very Easy 40
50 Table 43. No statistically significant relationship was found between visitation history and behavioral intent. However, it is worth noting those who had visited 49 or more previous times were found to be the least likely to Stay on a designated trail and Adhere to messages posted on signage. Table 43. Please indicate how LIKELY you are to do the activity in the future by circling the number of your response for each statement. 1 Number of previous visits Behavior First visit or more Total F Sig. Staying on a designated trail N Mean Std. Dev Travel in the middle of a DT, even when wet and muddy Travel on a DT, even when passing other visitors Travel on a DT even when you have previously traveled on a UT in the area Travel on a DT, even when a UT is available in the area Travel on a DT, even when you have observed others traveling on UT Adhering to messages on posted signage 1 Scale: 1=Very Unlikely 7=Very Likely N Mean Std. Dev N Mean Std. Dev N Mean Std. Dev N Mean Std. Dev N Mean Std. Dev N Mean Std. Dev
51 Table 44: A statistically significant relationship was found between visitation history and reasons for staying on designated trails. Those who had visited 49 or more previous times indicated the reason To not damage the soils and vegetation to be less important of a reason compared to those in the other visitation categories. Moreover, while not statistically significant it is worth noting the 49 or more previous visits category of survey respondents consistently had the lowest mean scores for the items in this block of questions. Table 44. Please indicate how IMPORTANT these reasons would be for you to travel only on designated trails in the FUTURE. 1 Number of previous visits Behavior First visit or more Total F Sig. To improve my outdoor experience N on OSMP lands Mean Std. Dev Because visitors are encouraged to stay on designated trails To not damage the soils and vegetation N Mean Std. Dev N Mean Std. Dev To not break the rules N Mean Std. Dev I do not want others to see me travel off DT It is unfair for me to travel off DT while others do not N Mean Std. Dev N Mean Std. Dev I have no reason to travel off DT N Mean Std. Dev Leave No Trace promotes traveling on DT I feel better about myself by not traveling off DT N Mean Std. Dev N Mean Std. Dev Scale: 1=Not at all important 7=Extremely important 42
52 Table 45: Statistically significant relationships were found between behavioral beliefs and visitation history. A plurality of frequent visitors are less likely to change their behaviors than are those who visit less frequently. Additionally, the most frequent visitors are less likely to agree that practicing Leave No Trace effectively protects the environment than are those who visit less often. Table 45. Please indicate how strongly you AGREE or DISAGREE with the following statements. 1 Number of previous visits Statement First visit or more Total F Sig. If I learned my behaviors N damaged the environment I Mean 6.27b 5.91a, b 6.09b 5.07a 5.87 would change my behavior Std. Dev Practicing Leave No Trace does not reduce the environmental harm caused by travel in OSMP Practicing Leave No Trace takes too much time Practicing Leave No Trace effectively protects the environment for future generations N Mean Std. Dev N Mean Std. Dev N Mean 6.36b 6.25b 5.79a,b 5.10a 5.93 Std. Dev Scale: 1=Strongly Disagree 7=Strongly Agree a, b Superscripts represent homogeneous subgroups Tukeys post-hoc 43
53 Table 46: Statistically significant relationships were found between visitation motivations and visitation history. Those who visit more frequently rate physical fitness as more important than those who visit less frequently. Family/friend togetherness is more important for the less frequent visitors than for those who visit more often. Table 46. Relationship between visitation motivations and visitation history 1 Number of previous visits Reasons First visit or more Total F Sig. Physical fitness** N Mean Std. Dev Physical rest N Mean Std. Dev Psychological health N Mean Std. Dev Psychological rest N Mean Std. Dev Escape personal/social pressures N Mean Std. Dev Enjoying nature N Mean Std. Dev Learning N Mean Std. Dev Family/friend togetherness** N Mean Std. Dev Solitude N Scale: 1=Not at all Important 7=Extremely Important Mean Std. Dev
54 Paired Survey and Observation: Survey Response by Trail Use (DT or UT) This section includes tables and figures related to analysis of survey responses by whether the visitor was surveyed while traveling on a designated trail (DT) or undesignated trail (UT). Table 47. DT users are more likely than UT users to report Always staying on a DT (77% vs 49%). DT users more likely than UT users to report Always staying on DT when UT is available in the area (53% vs 39%). Table 47. Self-reported frequency of trail behavior by observed trail-use 1 Item Never Sometimes Always X 2 value p- How often do you stay on designated trails? DT UT How often do you stay on designated trails when a UT is available in the area? DT UT How often do you adhere to messages on posted signage? DT UT Cell entries are row percentages, totals may not add to 100 due to rounding 45
55 Table 48: Statistically significant results were found for each item in this block of questions. UT users were more likely than DT users to select the Applies to me and Don t Know response options across all items in this block. Moreover, a large proportion of UT users consistently selected the Does not apply because I only travel on DTs option. This might suggest many respondents were not aware they were traveling on a UT. Among UT users, the most commonly selected reasons for traveling off trails were I didn t mean to travel off the designated trail - it was an accident (45%), and I have done it before and it worked well for my visitor experience (43%). Table 48. Self-reported reasons for trail behavior by observed trail-use 1 Does Not Apply Applies to me Don t p- Know X 2 value Item I didn't know traveling off DT would damage soils/vegetation DT UT I didn't know it was recommended to stay on DT <.001 DT UT I didn't mean to travel off DT - was an accident <.001 DT UT I think visitors should be able to travel off DT <.001 DT UT I thought it would improve my experience <.001 DT UT I have done it before and it worked well for my visitor experience DT UT Cell entries are row percentages, totals may not add to 100 due to rounding <.001 Table 49: A statistically significant difference was found between DT and UT users in the importance they placed on the statement I have no reason to travel off DTs as a reason for staying on DTs. This appears to be less important of a reason for UT users than for DT users, which might suggest those who use UTs have reason or intention to use them. Table 49. Analysis of UT and DT survey responses Reasons for staying on designated trails Mean Scores t p-value Item DT UT Reason for staying on designated trails (Scale: 1=Not at all Important 7=Extremely Important) I have no reason to travel off designated trails
56 Survey Response by Place of Residence This section includes tables and figures related to analysis of survey responses by reported place of residence (Boulder resident vs non-bouder residents). Table 50: A significant difference was found between residents and non-residents regarding the difficulty of certain behaviors. Non-residents reported being easier to stay on designated trails than did residents (Mean 6.24 vs 5.44). And compared to residents, nonresidents felt Adhering to messages on postage signage to be easier (Mean 6.32 vs 5.76). Non-residents are significantly more likely to adhere to messages on postage signage (Mean 6.43 vs 5.91). Residents are significantly less likely to agree that Practicing Leave No Trace effectively protects the environment for future generations. (5.81 vs 6.42) Table 50. Analysis of resident and non-resident survey responses Statistically significant results Mean Scores Non- Resident Resident t p-value Perceived Difficulty (Scale: 1=Very Difficult 7=Very Easy) Staying on a designated trail Adhering to messages on posted signage Behavioral Intent (Scale: 1=Very Unlikely 7=Very Likely) Adhering to messages on posted signage Leave No Trace Beliefs (Scale: 1=Strongly Disagree 7=Strongly Agree) Practicing LNT effectively protects the environment for future generations
57 Regression analysis based on Theory of Planned Behavior This section includes tables and figures related to multiple correlation regression path modeling based on the Theory of Planned Behavior. Table 51/Figure 1: Multiple regression model that included the independent variables: perceived effectiveness, appropriateness, and difficulty of staying on designated trails, suggested these constructs predict 55% of the variance in one s self-reported intent to stay on designated trails (R 2 =.546). In this model all three independent variables contributed significantly to behavioral intent. Table 51. Multiple Correlation/Regression analysis of the relationships of perceived appropriateness, effectiveness, and difficulty to future behavioral intent. Independent Variables Bivariate Correlations b-values Partial Correlation Appropriateness -.548*** -.161** -.252** Difficulty.666**.426***.535*** Effectiveness.496**.199**.248** Constant Multiple R.739*** R Adjusted R **significant.01 (2-tailed) ***significant.001 (2-tailed) Figure 1. Multiple correlation regression path model - behavioral intent 48
58 Table 52/Figure 2: When using the same independent variables in a logistic regression model, this time using actual (observed) behavior (use of a DT or UT) as the dependent variable, the predicitive ability of the model dropped to ~9-12% (Cox & Snell R 2 =.086; Nagelkerke R 2 =.115 ). It is also worth noting that in the logistic regression only perceived difficulty held as a significant predictor of behavior (Wald=4.153, p<.05). Table 52. Linear Regression analysis of the relationships of perceived appropriateness, effectiveness, and difficulty to actual observed trail use (DT vs UT). Independent Variables Wald Exp (B) Appropriateness Difficulty 4.153*.656 Effectiveness Cox & Snell R Nagelkerke R **significant.05 (2-tailed) Figure 2. Logistic regression path model - observed trail use behavior 49
59 Discussion The overall goal of this study was to apply a range of management treatments (i.e., two educational signs, a barrier, and a barrier with a educational sign) in conjunction with visitor observations, as well as a self-reported survey, to assess the effectiveness of treaments for reducing undesignated trail use. Specifically, this study explored the following hypotheses: H1: All management treatments would reduce use of undesignated trails from the control level. H2: A combination of treatments (i.e., Treatment 5) would be more effective than any single treatment in reducing use of undesignated trails from the control level. To explore these hypotheses, researchers sampled a total of 25 days over a one-month period and observed a total of n = 2232 visitors interacting across 20 trail junctions that were selected for sampling by OSMP staff. Additionally, an n = 147 respondents completed a paired on-site survey, with a total response rate of 68%. One of the strengths of this study was the consistent observation methodology, which enabled the researchers to document visitor behaviors at the 20 selected sampling sites, representing a system-wide approach to understanding DT and UT use during the 25-day data collection period. Several of the sites received substantial amounts of visitor use during the sampling period, such as Sanitas, Dakota Ridge, and Sanitarium. The majority of visitors were hiking or walking, without a dog, which also correlated with the findings from the paired survey data. Discussion of Hypotheses Results Analysis of observation data suggested that there was a relationship between the management treatments utilized in this study and a decrease in the use of undesignated trails. The level of effectiveness depended on the type of treatment in place. While the results of Treatment 2 ( Stay on designated trails: Even when wet and muddy, to protect trailside plants and minimize erosion. This is Not a Designated Trail ) suggested that it was slightly less effective than control conditions, all other treatments reduced use of UTs. However, results of chi square post hoc analyses comparing treatment to control conditions reveal that only Treatment 5 (combined barrier and education message) produced a statistically significant reduction in UT use from control conditions (Table 16b). Thus, in regards to H1, the authors fail to reject the null hypothesis on the grounds that statistically significant reductions were not produced by all treatments over and above control conditions. Further, the authors reject the null alternative of H2 based on results of 50
60 post hoc tests indicating a statistically significant relationship was observed between Treatment 5 and reduced undesignated trail use, over and above control conditions. While these results indicate that among the treatments utilized in the study only Treatment 5 produced a statistically significant reduction in UT use compared to control conditions, they should be interpreted with caution from an applied management perspective. That is, a statistically significant relationship may not necessarily translate to one of practical significance (Vaske, 2008). Within the context of OSMP lands, it may not be physically, aesthetically, or economically practical to treat every UT intersection in the system with a combination barrier and educational sign. Therefore, Treatments 3 or 4 should not be eliminated as plausible management options soley based upon the statistically significant test result associated with Treatment 5. In cases where UT use is high or very high Treatment 5 may be warranted. But in other contexts that see relatively low levels of UT use a more minimalist approach (i.e. Treatment 3) may be justified. Ultimately, these results provide OSMP managers with a suite of options and associated effectiveness for consideration, which could mitigate UT use. In sum, overall observation findings indicate that Treatment 5, the combined educational message ( Stay on designated trails: Even when wet and muddy, to protect trailside plants and minimize erosion. This is Not a Designated Trail ) with a physical barrier was the most effective method of UT mitigation utilized in this study. Moreover, Treatments 3 and 4 also resulted in observed reductions in UT use (though not statistically significant). The results presented here suggest a range of UT management options exist, each with different levels of effectiveness, which provide managers a set of alternative approaches for use in the mitigation of UT use on the OSMP system depending on resources, management objective, and context. Discussion of Key Findings and Implications for Management The majority of visitors were observed traveling on DTs, while only 10%-15% were observed traveling on UTs. Though this is a comparatively small percentage of overall trail use, previous research suggests that a small amount of visitors can create visible and lasting impacts to ecological systems (see Marion, 2016), such as the creation of the numerous UTs (i.e., the ~150 miles of UTs) currently in existence and use on the OSMP system. A unique component of this study involved the paired self-reported survey with actual visitor observations. Survey results suggested that primary visitor motivations were for nature enjoyment, psychological health, and physical fitness, with the majority of visitors being locals/boulder residents. Knowledge of visitor motivations provides managers a better sense of the types of experiences people are seeking and expecting during their visit. 51
61 Managers might consider leveraging this knowledge in public relations and outreach efforts. For example, undesignated trail closures could be coupled with media outreach discussing management decisions in terms of improving visitor experiences. Since the majority of visitors were local residents, tailored efforts could be focused at the local level. Results also indicated that visitors to OSMP largely believe that recreation behaviors have the potential to cause both ecological and social impact. The majority of respondents indicated that they would change their behaviors if they learned their actions were damaging the environment. Of the list of potential activities provided for reducing negative impacts in OSMP, Adhering to messages on posted signage was reported to be the most effective, followed by Staying on a designated trail. Furthermore, Adhering to messages on posted signage was reported to be the easiest of the behaviors to perform. Aligning with the message in treatments 2 and 5 ( Stay on designated trails: Even when wet and muddy, to protect trailside plants and minimize erosion. This is Not a Designated Trail ), the majority of respondents indicated that the most important reason for only using DTs was To not damage soils and vegetation. Based on these findings, it is recommended to consider the use of attributional-based messages in the design of future information and education campaigns. While attribution theory was not directly applied or tested in this study, previous research suggests attributional messaging to be a particularly effective approach to visitor messaging. Attribution theory suggests that people often interpret their behavior in terms of its cause, and these attributions play a central role in human behavior (Kelley & Michela, 1980). Previous studies (see Bradford & McIntyre, 2007; Alessa, Bennett, & Kliskey, 2003) have found that personal attribution is inversely related to depreciative behaviors. That is, the more visitors believed their behavior had the potential to cause resource degradation, the less likely they were to engage in depreciative behavior. Interestingly, Bradford and Mcintyre (2007) found that recreationists typically do not view themselves as the cause of impacts they tend to attribute impacts to the behaviors of others. Thus, the use of messages informing visitors that their personal recreation behaviors cause, or have the potential to cause, social and ecological resource degradation on OSMP lands is warranted. The survey data yielded valuable insight regarding visitor attitudes toward trail use and associated behaviors. Results indicated that frequent visitors were more likely than those who visited less often to report knowing that some OSMP trails are undesignated. While not statistically significant, individuals who had visited frequently reported being the least likely to Stay on a designated trail and Adhere to messages posted on signage. These findings also aligned with the statistically significant differences found between residents and nonresidents, as non-residents indicated that it was easier to stay on designated trails. Additionally, residents were significantly less likely to agree that Practicing Leave No Trace 52
62 effectively protects the environment for future generations than non-residents. Taken together, these findings suggest that education and outreach efforts regarding the impacts related to undesignated trail use, and the importance of staying on designated trails, be strategically designed to reach local user communities and frequent visitors. More than 40% of survey respondents indicated they were unaware of UTs in the OSMP trail system. This aligned with paired survey and observation data, as nearly 50% of visitors who were observed and surveyed while using a UT reported that they always use DTs, suggesting that these visitors did not know they were in fact traveling on a UT. Furthermore, UT respondents were significantly more likely to report not knowing if they traveled off a DT. Observed behavior paired with survey responses showed that almost half of UT users reported they had not traveled off trail, while approximately 20% of UT users were unsure if they had traveled off the DT. While being unaware may account for a substantial amount of the UT use on OSMP lands, a considerably smaller number of UT users indicated that they had seen management signs than DT users. Thus, this suggests there is a small segment of individuals as also noted through observation data that will use UTs despite management interventions. Given the high visitor use of OSMP, it is important to consider wide-scale implementation of those management actions that are most effective in order to improve compliance by the majority of visitors, and in particular those existing UT users. Survey results suggested that there is a need to better clarify which existing OSMP trails are UTs and DTs. This need also appeared in the open-ended-comments section of the survey. For example, one respondent wrote Often is difficult to tell where exactly designated trails exist because of so many social trails. Another stated, When trails have extreme braiding or social trails it is hard to know designated trails. A third respondent suggested, I don't know if I should stay on trail when wet/muddy, and if walking in the middle of trail is best - signage would be good if that's what is right. It would be valuable to maintain consistent dissemination of information, signage, and management interventions throughout the trail system that signify which trails are DTs. For example, existing infrastructure on UTs, such as block steps, water bars, or small signs indicating no mountain biking may confuse visitors, as those are typically visual cues that indicate a managed (designated) trail segment. Thus, eliminating existing infrastructure on current UTs, coupled with the implementation of Treatment 5 (i.e., educational message and barrier) from this study could enhance mitigation efforts. Furthermore, the authors also suggest increasing outreach to residents and frequent visitors about the effectiveness of Leave No Tracerelated behaviors, and the need for protecting social and ecological wellbeing in OSMP lands. 53
63 Ultimately, the data indicate that many OSMP visitors realize that human recreation behaviors have the potential to cause social and ecological impacts. This study provides evidence that the treatments applied in this research, particularly the educational message paired with a physical barrier, can effectively influence behavior and significantly reduce UT useage from baseline control conditions. Implications for Future Research With regard to methodological considerations and future research, this study demonstrated the strength in pairing self-reported survey data with actual behavioral observations. As noted, self-reported behaviors do not always align with the actions visitors take in the environment. Thus, when feasible, future studies should consider pairing visitor surveys and observations. While it is important to consider systematic approaches to understanding visitor use, further examination of the most effective treatment in this study, set-up long-term in high UT use locations such as Settler s Park, Dry Creek, or Chautauqua could yield greater understanding of the influence of paired indirect and direct management actions on UT use. For example, if the entire DT trail system and associated UT junctions within the Chautauqua area were treated with the barrier and educational signage over a period of two years for instance, researchers and managers could monitor visitor attitudes and behavior change with the methods used in this study. Furthermore, expanding the study over a multi-year period could afford the opportunity to measure ecological change (e.g., vegetation regrowth) resulting from treatment application. It is also worth noting that the scope of this study was to collect, analyze, and interpret data at the system-level. That is, the study was designed to provide a snapshot of undesignated trail use and treatment effectiveness across the OSMP system. Hence the systematic random selection of research sites indicated by OSMP staff as representative of the system, and reporting of results in aggregate. Drilling down to site-level analysis was beyond the scope of this project. Thus further analysis of this data at the site-level is suggested and could provide further insight into setting and contextual factors that are at play. A preliminary site-level analysis is provided in Appendix Q as an example of this line of inquiry. As indicated by this analysis, the Sanitarium site for example, did not follow the same UT use patterns as the other sites when Treatment 5 was in place. When examined in greather detail to understand why this might be the case, it is revealed that this specific UT leads to a site of cultural and historic significance (pictured in Figure 3), and is also marked with interpretive signage. Further, one survey respondent made mention of this site in the open-ended comment section, stating Please take the wooden fence down near the stone cabin/house. Additional site-level analysis such as this could provide further contextual 54

64 and situational understanding of motivations for using UTs. Figure 3. Photograph of stone structure at Sanitarium site Study Limitations Observers used their best judgment when determining if a particular trail user had an interaction with a treatment or control. While it was generally easy to detect no treatment interaction and stop and read, it was more challenging to determine if a trail user should have be categorized as pass and read. Consistant treatment placement (i.e., 5-10 feet from the point of entry onto an undesignated trail) was established to minimize error, and accurately determine visitor intention. Every effort was made to provide a robust, evenly distributed stratified sample, given the vast number of strata, the limited time span of this study, and the available resources. However, there are limitations that should be noted. For example, this sampling effort took place over 25 days, during a 30-day (one-month) period. Visitation patterns and behaviors may have been subject to weather or other environmental factors beyond our control. Additionally, each of the 20 sites received all five of the treatments, however, a.m./p.m. and weekday/weekend stratification was not evenly distributed, given the one month sampling period. Finally, this study only incorporated 20 randomly selected sites, and other OSMP 55
65 undesignated trail sites may produce alternative visitor behaviors and associated perceptions. Although this study attempted to represent system-wide use, some of the sampling sites selected for this study receive relatively low visitation, which is not ideal for a vistor survey. Thus, this is a trade-off. For instance, while the total n could have been increased if the research had taken place at consistently busier OSMP locations, the results would not have represented the entire system, as this study attempted to do. Additionally due to some of the selected sampling sites, the survey sample size is small compared to the large number of visitors observed as part of this study. This can partially be attributed to the purposeful sampling approach whereas only individuals that interacted with a treatment were asked to complete a survey. Finally, it should be noted that some visitors may have felt and acted upon social desirability (i.e., provide responses that they think coincide with the survey administrator s viewpoints) (Vaske, 2008), however, staff were trained extensively to minimize any bias. 56
66 57 References Ajzen, I. (1991). The theory of planned behavior. Organizational Behavior and Human Decision Processes 50, Alessa, L., Bennett, S. M., & Kliskey, A. D. (2003). Effects of knowledge, personal attribution and perception of ecosystem health on depreciative behaviors in the intertidal zone of Pacific Rim National Park and Reserve. Journal of Environmental Management, 68(2), Babbie, E. R. (2005). Survey research methods (Vol. 3): Wadsworth Publishing Company Belmont, CA. Bradford, L., & McIntyre, N. (2007). Off the beaten track: Messages as a means of reducing social trail use at St. Lawrence Islands National Park. Journal of Park and Recreation Administration, 25(1), Cialdini, R. B., Demaine, L. J., Sagarin, B. J., Barrett, D. W., Rhoads, K., & Winter, P. L. (2006). Managing social norms for persuasive impact. Social Influence, 1(1), Cialdini, R. B. (2003). Crafting Normative Messages to Protect the Environment. Current Directions in Psychological Science, 12(4), Cole, D. (2016). Boundary Waters Canoe Area Wilderness A Long History of Management Guided by Science. Journal of Forestry, 114(3), Cole, D. N. (1995). Wilderness management principles: science, logical thinking or personal opinion? Trends, 32(1), 6 9. Cole, D. N., Hammond, T. P., & McCool, S. F. (1997). Information quantity and communication effectiveness: Low impact messages on wilderness trailside bulletin boards. Leisure Sciences, 19(1), Cordell, H. K. (2012). Outdoor recreation trends and futures: a technical document supporting the Forest Service 2010 RPA Assessment: US Department of Agriculture, Forest Service, Southern Research Station. Driver, B.L., Tinsley, H.E., & Manfredo, M.J. (1991). Recreation Experience Preference Scales: Results from two inventories designed to assess the breadth of the perceived
67 psychological benefits of leisure. In B.L. Driver, P.J. Brown, & G.L. Peterson (Eds.), Benefits of Leisure (pp ). State College, PA: Venture Publishing. Guo, T., Smith, J. W., Leung, Y.-F., Seekamp, E., & Moore, R. L. (2015). Determinants of Responsible Hiking Behavior: Results from a Stated Choice Experiment. Environmental Management, Ham, S. H., & Krumpe, E. E. (1996). Identifying audiences and messages for nonformal environmental education - A theoretical framework. Journal of Interpretation Research, 1(1), Hammitt, W. E., & Cole, D. N. (1987). Wildland Recreation. New York: John Wiley & Sons, Inc. Hammitt, W. E., Cole, D. N., & Monz, C. A. (2015). Wildland Recreation. New York: John Wiley & Sons. Hockett, K. S., & Hall, T. E. (2007). The effect of moral and fear appeals on park visitors beliefs about feeding wildlife. Journal of Interpretation Research, 12(1), Johnson, D.R., & Swearingen, T.C. (1992). The effectiveness of selected trailside sign texts in deterring off-trail hiking, Paradise Meadows, Mount Rainier National Park. In H.H.Christensen, D.R. Johnson, and M.H. Brookes, (Eds.), Vandalism: Research, Prevention,and Social Policy. (pp ). General Technical Report PNW-GTR USDA Forest Service, Pacific Northwest Research Station. Kelley, H. H., & Michela, J. L. (1980). Attribution theory and research. Annual Review of Psychology, 31(1), Kidd, A. M., Monz, C., D'Antonio, A., Manning, R. E., Reigner, N., Goonan, K. A., & Jacobi, C. (2015). The effect of minimum impact education on visitor spatial behavior in parks and protected areas: An experimental investigation using GPS-based tracking. Journal of Environmental Management, 162, Lawhon, B., Newman, P., Taff, B. D., & Vaske, J. (2013). Factors Influencing Behavioral Intentions for Leave No Trace Behavior in National Parks. Journal of Interpretation Research, 18(1), Lynn, N. A., & Brown, R. D. (2003). Effects of recreational use impacts on hiking experiences in natural areas. Landscape and Urban Planning, 64(1-2),
68 Manning, R. E. (1999). Studies in outdoor recreation search and research for satisfaction. Corvallis, OR: Oregon State University Press. Manning, R. E. (2003). Emerging principles for using information/education in wilderness management. International Journal of Wilderness, 9(1), Marion, J. L. (2016). A Review and Synthesis of Recreation Ecology Research Supporting Carrying Capacity and Visitor Use Management Decisionmaking. Journal of Forestry, 114(3), Marion, J. L., & Reid, S. E. (2007). Minimising Visitor Impacts to Protected Areas: The Efficacy of Low Impact Education Programmes. Journal of Sustainable Tourism, 15(1), Marion, J. L., Leung, Y.-F., Eagleston, H., & Burroughs, K. (2016). A Review and Synthesis of Recreation Ecology Research Findings on Visitor Impacts to Wilderness and Protected Natural Areas. Journal of Forestry, 114(3), Monz, C. A. (2009). Climbers attitudes toward recreation resource impacts in the Adirondack Park s Giant Mountain Wilderness. International Journal of Wilderness, 15(1), Outdoor Industry Foundation. (2012). Outdoor Recreation Participation Report Boulder, CO. Park, L. O., Manning, R. E., & Marion, J. L. (2008). Managing visitor impacts in parks: A multimethod study of the effectiveness of alternative management practices. Journal of Park and Recreation Administration, 26(1), Peine, John D. (ed) Proceedings of a workshop on unobtrusive techniques to study social behavior in parks, Great Smoky Mountains National Park, May 20-21, USDI, NPS, Southeast Region, Atlanta, GA. 62pp. Petty, R. E., & Cacioppo, J. T. (1986). Communication and persuasion: central and peripheral routes to attitude change. New York, NY: Springer-Verlag. Petty, R. E., & Wegener, D. (2008). Matching versus mismatching attitude functions: Implications for scrutiny of persuasive messages. In: Fazio, R.H., Petty, R.E. (eds.). Attitudes, their structure, function, and consequences: Key readings in social psychology. New York, NY: Psychology Press. 59
69 Reigner, N., & Lawson, S. R. (2009). Improving the Efficacy of Visitor Education in Haleakala National Park Using the Theory of Planned Behavior. Journal of Interpretation Research, 14(2), Taff, B. D., Newman, P., Vagias, W. M., & Lawhon, B. (2014). Comparing day-users and overnight visitors attitudes concerning leave no trace. Journal of Outdoor Recreation, Education, and Leadership, 6(2), Vagias, W. M., Powell, R. B., Moore, D. D., & Wright, B. A. (2014). Predicting Behavioral Intentions to Comply with Recommended Leave No Trace Practices. Leisure Sciences, 36(5), Vande Kamp, M. E. (1994). Social science literature pertinent to deterrence of noncompliant visitor behavior in natural areas: A working bibliography. USDI, NPS, Cooperative Park Studies Unit, University of Washington, Seattle, WA. 25pp. Vaske, J.J. (2008). Survey research and analysis: Application in parks, recreation and human dimensions. State College, Pennsylvania: Venture Publishing. Vaske, J. J., Shelby, L. B., & Donnelly, M. P. (2009). Estimating visitation to Boulder Open Space and Mountain Parks. (HDNRU Report No. 80). Report for Boulder Open Space and Mountain Parks. Fort Collins: Colorado State University, Human Dimensions of Natural Resources. Wimpey, J., & Marion, J. L. (2011). A spatial exploration of informal trail networks within Great Falls Park, VA. Journal of Environmental Management, 92(3), Widner, C. J., & Roggenbuck, J. R. (2003). Understanding park visitors response to reduce petrified wood theft. Journal of Interpretation Research, 8(1), Winter, P. L. (2006). The impact of normative message types on off-trail hiking. Journal of Interpretation Research, 11(1), Winter, P. L., Sagarin, B. J., Rhoads, K., Barrett, D. W., & Cialdini, R. B. (2000). Choosing to Encourage or Discourage: Perceived Effectiveness of Prescriptive Versus Proscriptive Messages. Environmental Management, 26(6), Winter, P., Cialdini, R., Bator, R. J., & Rhoads, K. (1998). An analysis of normative messages in signs at recreation settings. Journal of Interpretation. 60
70 61 Appendices
71 Appendix A. Observation Datasheet 62
72 63
73 Appendix B. Designated Trail (DT) Surveyor Datasheet 64
74 65
75 Appendix C. Undesignated Trail (UT) Surveyor Datasheet 66
76 67
77 Appendix D. Undesignated Trail Study Codebook Observation Code Description Appropriate Response Categories Time Time of visitor interaction e.g., 11:47 am Observ. ID UT or DT If UT, Direction (Trtm. or NTrtm.) 68 Corresponding assigned visitor # associated with observation Visitor observed and/or surveyed coming from an undesignated trail (UT) or designated trail (DT). If visitor goes from DT to UT, they are coded as UT. If visitor observed and/or surveyed on an undesignated trail (UT), did they have an opportunity to experience the treatment (T), or did they not have the opportunity to experience the treatment (NT). e.g., #17 # Visitors in Group Number of visitors in a given group of interest e.g., 2 # Dogs in Group Number of dogs in a given group of interest e.g., 1 Observation Pairing Identifier Descriptive information about the visitor so that observer and surveyor can match participants UT or DT Survey ID Corresponding assigned survey # associated with agreed participation e.g., #13 T (if they approached UT from the direction at which they had an opportunity to experience the treatment) NT (if they approached via the UT, with no opportunity to experience the treatment) Only applicable on for paired survey periods e.g., shirt or backpack color Activity Code Visitor activity H = Hiker R = Runner B = Biker E = Equestrian C = Climber/Boulderer O = Other (describe in notes) Treatment Interactions How did the visitor interact or respond to the treatment? Stop/Read If it was apparent that the visitor read the treatment, stopped, and spent > 3 seconds on contemplating Pass/Read If it was apparent that the visitor read the treatment, as they kept moving by None If it was apparent that the visitor did not look at,
78 OSMP presence Notes Regarding Treatment Interactions/Notes If OSMP staff or ranger are in area (e.g. you see them in your area or there is a staff or ranger vehicle at the access point) Additional notes regarding the visitors interaction with the treatment, or notes about the visitors behavior or interact with the treatment 0, 1 or 2 e.g., Visitor seemed agitated with signage Survey Code Description Appropriate Response Categories Accept/refusen Code Disposition of visitor inquiry when asked to participate in survey Accept, or Refuse ; can use A or R if busy Survey # Survey refusal nonresponse question Language barrier Corresponding assigned survey # associated with each visitor; should be in on-going sequential order for each sampling location; check with researcher for each shift s starting number What is your primary activity today? This question will provide a nonresponse bias check Does the data collector observe a language barrier prohibiting conversation with the visitor? 1, 2, 3, 4 H, R, B, E, C, O ; see Activity Code above for definitions Yes, No ; can use Y or N if busy 69
79 Appendix E. Sampling Site Diagram 70
80 Appendix F. Study Site Names and Locations UT_Jct-04 Sanitarium; Sanitas-Dakota Ridge Trail UT_Jct-07 Chautauqua; Chautauqua McClintock Trail UT_Jct-08 Anemone; Anemone-Red Rocks Trail (Settler s Park TH) UT_Jct-09 Hogback Ridge; North Foothills-Hogback Ridge Trail UT_Jct-10 Lost Gulch; Flagstaff-Lost Gulch Trail UT_Jct-17 BVR; BVR-Cobalt/Sage Trails UT_Jct-20 Settler's; Anemone-Red Rock s Spur Trail (Settler's Park TH) UT_Jct-27 Sanitas; Sanitas-Sanitas Valley Trail UT_Jct-32 Red Rocks; Anemone-Red Rocks Spur Trail (north) UT_Jct-35 Cragmoor Connector; Shanahan-Fern Meadow/Cragmoor Connector Trail UT_Jct-38 Amphitheater; Chautauqua-Amphitheater Trail UT_Jct-39 NCAR; NCAR NCAR Bear Canyon Trial (neighborhood/water access) UT_Jct-41 Coal Seam; Marshall Mesa-Coal Seam Trail UT_Jct-42 Flagstaff; Flagstaff-Flagstaff Trail UT_Jct-43 Dakota Ridge; Sanitas-Dakota Ridge Trail UT_Jct-45 Gunbarrel; Gunbarrel-Gunbarrel Trail UT_Jct-46 Dry Creek; Dry Creek-Dry Creek Trail UT_Jct-47 Four Pines; NIST (Tippet)-Four Pines Trail UT_Jct-48 Red Rocks-south; Anemone-Red Rocks Spur Trail (south) UT_Jct-51 Shanahan Connector; Shanahan -Shanahan Connector Trail 71
81 Appendix G. Definitions Access Point: Points where visitors can enter/exit OSMP-managed lands. Collapse: Process of: 1) classifying the complete suite of ideas represented in verbatim text reported for an open-ended question into a series of categories and/or 2) reducing the full suite of categories into combined categories based upon content analysis of the text. Designated Trail: A trail that is managed, maintained, and mapped, and promoted to visitors as an official trail for use by OSMP. Emergent Category: A theme revealed through content analysis and collapsing of semantically similar verbatim text reported for open-ended questions. Frequency Distribution: The number or percent of respondents giving each possible response to a particular question. Inter-rater or Inter-observer reliability: The degree to which different raters/observers give consistent ratings/estimates of the same phenomenon using the same rating system. Naturalistic observation: A research method commonly used by psychologists and other social scientists which involves observing subjects in their natural environment. This type of research is often utilized in situations where conducting lab research is unrealistic, cost prohibitive or would unduly affect the subject's behavior. Pass Rate: Rate at which visitors pass by the survey administrator before staff has the opportunity to contact them. Population: All OSMP visitors 16 or more years old exiting OSMP lands during the monitoring period. Proportions: Calculated as the number of survey participants reporting a certain response divided by the total number of valid survey responses. Range of Acceptability: A set of bounds defining satisfactory conditions for any measured indicator. Recreation setting: A combination of the physical, biological, managerial and social conditions within a recreation area that gives value to a place (Clark and Stankey 1979). Refusal Rate: Rate at which visitors asked to participate in the survey refuse to do so. 72
82 Reliability: The extent to which an experiment, test or any measuring procedure yields the same result on repeated trials. Sample: All eligible visitors contacted and agreeable to survey participation at selected study locations during the study period. The sample does not include repeat respondents or any officially sanctioned visitors (OSMP staff, volunteers, contractors, etc.) traveling on the trail for official OSMP business. Sampling Frame: The list of undesignated trails that meet the undesignated trail selection criteria. Serial Effect: In survey research, a situation where questions may "lead" participant responses through establishing a certain tone. The serial effect may accrue as several questions establish a pattern of response in the participant, biasing results. Survey: A research tool that includes at least one question which is either open-ended or close-ended and employs an oral or written method for asking these questions. The goal of a survey is to gain specific information about either a specific group or a representative sample of a particular group. Results are typically used to understand the attitudes, beliefs, knowledge or norms of a particular group. Undesignated Trail: A trail that is not managed, maintained, mapped, or promoted to visitors as an official trail for use by OSMP. Validity: The degree to which a study accurately reflects or assesses the specific concept that the researcher is attempting to measure. Visitor: Any person traveling on OSMP lands or trails except those conducting official OSMP business. Visitor trip: A trip to the study area, regardless of how much time a visitor spent on OSMP during their trip. 73
83 Appendix H. Original Sample Schedule - June 2015 Sunday Monday Tuesday Wednesday Thursday Friday Saturday 31 1 Treatment 1 (Control) 2 Treatment 2 (Ed 1) 3 Treatment 3 (Ed 2) 4 Treatment 4 (Barrier) 5 Treatment 5 (Ed/Bar.) 6 Treatment 5 (Ed/Bar.) Paired Paired Observation Paired Observation Paired -A.M. early Sanitarium -P.M. early Lost Gulch -P.M. early Red Rocks -P.M. early Coal Seam -A.M. early Red Rocks -P.M. early Sanitarium -A.M. early Chautauqua -P.M. early BVR -P.M. early Cragmr Con -P.M. early Flagstaff -A.M. early Cragmr Con -P.M. early Chautauqua -A.M. late Anemone -A.M. late Hogback Ridge -P.M. late Settlers Park -P.M. late Sanitas Valley -P.M. late Amphitheatr e -P.M. late NCAR -P.M. late Dakota Rdg -P.M. late Gunbarrel -A.M. late Amphitheatr e -A.M. late NCAR -P.M. late Anemone -P.M. late Hogback Ridge 7 Treatment 1(Control) Observation -A.M. early Lost Gulch -A.M. early BVR -A.M. late Settlers Park -A.M. late Sanitas Valley 8 Treatment 3 (Ed 2) Observation -A.M. early Sanitarium -A.M. early Chautauqua -A.M. late Anemone -A.M. late Hogback Ridge 9 OFF 10 Treatment 1(Control) Paired -P.M. early Dry Creek -P.M. early 4 Pines -P.M. late Red Rks South -P.M. late Shanahan 11 Treatment 2 (Ed 1) Observation -A.M. early Coal Seam -A.M. early Flagstaff -A.M. late Dakota Rdg -A.M. late Gunbarrel 12 Treatment 3 (Ed 2) Paired -P.M. early Lost Gulch -P.M. early BVR -P.M. late Settlers Park -P.M. late Sanitas Valley 13 Treatment 4 (Barrier) Observation -P.M. early Lost Gulch -P.M. early BVR -P.M. late Settlers Park -P.M. late Sanitas Valley 74
84 4 Treatment 1(Control) Observation -P.M. early Coal Seam -P.M. early Flagstaff -P.M. late Dakota Rdg -P.M. late Gunbarrel 15 Treatment 4 (Barrier) Observation -A.M. early Dry Creek -A.M. early 4 Pines -A.M. late Red Rks South -A.M. late Shanahan 16 Treatment 2 (Ed 1) Paired -P.M. early Sanitarium -P.M. early Chautauqua -P.M. late Anemone -P.M. late Hogback Ridge 17 OFF 18 Treatment 1(Control) Paired -A.M. early Red Rocks -A.M. early Cragmr Con -A.M. late Amphitheatr e -A.M. late NCAR 19 Treatment 5 (Ed/Bar.) Observation -P.M. early Coal Seam -P.M. early Flagstaff -P.M. late Dakota Rdg -P.M. late Gunbarrel 20 Treatment 3 (Ed 2) Paired -P.M. early Dry Creek -P.M. early 4 Pines -P.M. late Red Rks South -P.M. late Shanahan 21 OFF 22 Treatment 5 (Ed/Bar.) 23 OFF 24 Treatment 3 (Ed 2) 25 OFF 26 Treatment 4 (Barrier) 27 Treatment 2 (Ed 1) Paired Paired Paired Observation -A.M. early Lost Gulch -A.M. early Coal Seam -A.M. early Sanitarium -A.M. early Dry Creek -A.M. early BVR -A.M. early Flagstaff -A.M. early Chautauqua -A.M. early 4 Pines -A.M. late Settlers Park -A.M. late Sanitas Valley -A.M. late Dakota Rdg -A.M. late Gunbarrel -A.M. late Anemone -A.M. late Hogback Ridge -A.M. late Red Rks South -A.M. late Shanahan 28 Treatment 2 (Ed 1) Paired 29 Treatment 4 (Barrier) Paired 30 Treatment 5 (Ed/Bar.) Paired 1 Make-up Sampling Day 2 Make-up Sampling Day 3 Unavailable (Holiday) 4 Unavailable (Holiday) -P.M. early -A.M. early -A.M. early 75
85 Red Rocks -P.M. early Cragmr Con -P.M. late Amphitheatr e -P.M. late NCAR Red Rocks -A.M. early Cragmr Con -A.M. late Amphitheatr e -A.M. late NCAR Dry Creek -A.M. early 4 Pines -A.M. late Red Rks South -A.M. late Shanahan Code: Paired=Survey & Observation; Observation=Observation Only; A.M. early=6:30-9:30 a.m.; A.M. late=10 a.m.=1 p.m.; P.M. early=1-4 p.m.; P.M. late=4:30-7:30 p.m. 76
86 Appendix I. Revised Sample Schedule (Based on unforeseen events such as weather, illness and treatment issues) Code: Paired=Survey & Observation; Observation=Observation Only; Weather Cancelation=WC; Red denotes Adjustment Made; Noted Barrier Day which required additional planning for set-up and takedown A.M. early=6:30-9:30 a.m.; A.M. late=10 a.m.=1 p.m.; P.M. early=1-4 p.m.; P.M. late=4:30-7:30 p.m. Sunday Monday Tuesday Wednesday Thursday Friday Saturday 31 1 Treatment 1 (Control) 2 Treatment 2 (Ed 1) 3 Treatment 3 (Ed 2) 4 Treatment 4 (Barrier) 5 Treatment 1 (Control) 6 Treatment 5 (Ed/Bar.) Paired -A.M. early Sanitarium Paired -P.M. early Lost Gulch Observation -P.M. early Red Rocks Paired -P.M. early Coal Seam Observation (Was supposed to be Trt 5) Paired -P.M. early Sanitarium -A.M. early Chautauqua -P.M. early BVR -P.M. early Cragmr Con -P.M. early Flagstaff -A.M. early Red Rocks -P.M. early Chautauqua -A.M. late Anemone -A.M. late Hogback Ridge -P.M. late Settlers Park -P.M. late Sanitas Valley -P.M. late Amphitheatr e -P.M. late NCAR -P.M. late Dakota Rdg -P.M. late Gunbarrel -A.M. early Cragmr Con -A.M. late Amphitheatr e (WC) -P.M. late Anemone -P.M. late Hogback Ridge -A.M. late NCAR (WC) 7 Treatment 1(Control) Observation -A.M. early Lost Gulch -A.M. early BVR -A.M. late Settlers Park 8 Treatment 3 (Ed 2) Observation -A.M. early Sanitarium -A.M. early Chautauqua (received Treatment 2) -A.M. late 9 OFF 10 Treatment 1(Control) Paired -P.M. early Dry Creek -P.M. early 4 Pines -P.M. late Red Rks 11 Treatment 2 (Ed 1) Observation -A.M. early Coal Seam -A.M. early Flagstaff -A.M. late 12 Treatment 3 (Ed 2) Paired -P.M. early Lost Gulch -P.M. early BVR -P.M. late 13 Treatment 4 (Barrier) Observation -P.M. early Lost Gulch -P.M. early BVR -P.M. late 77
87 -A.M. late Sanitas Valley Anemone -A.M. late Hogback Ridge South -P.M. late Shanahan Dakota Rdg -A.M. late Gunbarrel Settlers Park -P.M. late Sanitas Valley Settlers Park -P.M. late Sanitas Valley 14 Treatment 1(Control) Observation -P.M. early Coal Seam -P.M. early Flagstaff -P.M. late Dakota Rdg -P.M. late Gunbarrel 15 Treatment 4 (Barrier) Observation -A.M. early Dry Creek -A.M. early 4 Pines -A.M. late Red Rks South -A.M. late Shanahan 16 Treatment 2 (Ed 1) Paired -P.M. early Sanitarium -P.M. early Chautauqua -P.M. late Anemone -P.M. late Hogback Ridge 17 OFF -A.M. early Chautauqua Observation Trt 3 (Making up 6/8) Faith has volunteered to make-up this day 18 Treatment 1(Control) Paired -A.M. early Red Rocks -A.M. early Cragmr Con -A.M. late Amphitheatr e -A.M. late NCAR 19 Treatment 5 (Ed/Bar.) Observation -P.M. early Coal Seam -P.M. early Flagstaff -P.M. late Dakota Rdg -P.M. late Gunbarrel 20 Treatment 3 (Ed 2) Paired -P.M. early Dry Creek -P.M. early 4 Pines -P.M. late Red Rks South -P.M. late Shanahan 21 Treatment 5 (Ed/Bar.) 22 Treatment 5 (Ed/Bar.) 23 OFF 24 Treatment 3 (Ed 2) 25 OFF 26 Treatment 4 (Barrier) 27 Treatment 2 (Ed 1) Observation (Making up 6/5) -A.M. early Red Rocks -A.M. early Cragmr Con Missed, treatment error -A.M. late Paired -A.M. early Lost Gulch -A.M. early BVR -A.M. late Settlers Park -A.M. late Sanitas Paired -A.M. early Coal Seam -A.M. early Flagstaff -A.M. late Dakota Rdg -A.M. late Gunbarrel Paired -A.M. early Sanitarium -A.M. early Chautauqua -A.M. late Anemone -A.M. late Hogback Observation -A.M. early Dry Creek -A.M. early 4 Pines, missed treatment error -A.M. late Red Rks South 78
88 Amphitheatr e -A.M. late NCAR Valley Ridge -A.M. early Cragmr Con -Missed, treatment error -A.M. late Shanahan -P.M. early Coal Seam 28 Treatment 2 (Ed 1) 29 Treatment 5 (Ed/Bar.) 30 Treatment 4 (Barrier) 1 Make Up 2 Make Up 3 4 Paired -P.M. early Red Rocks -P.M. early Cragmr Con -P.M. late Amphitheatr e -P.M. late NCAR Paired (swapped w/ 6/30) -A.M. early Dry Creek -A.M. early 4 Pines -A.M. late Red Rks South -A.M. late Shanahan Paired (swapped w/ 6/29) -A.M. early Red Rocks -A.M. early Cragmr Con -A.M. late Amphitheatr e -A.M. late NCAR -A.M. early 4 Pines, (Trt 2 (Ed 1) Observation -P.M. early Hogback Ridge -- Trt 2 (Ed 1) Paired 79


89 Appendix J. Educational Signage 80

90 Appendix K. Sample Barrier Treatment 81

91 Appendix L. Visitor Survey 82

92 83

93 84

94 85
95 Appendix M. Site Selection Randomization Procedures Undesignated Trail Management and Messaging Study: Description of Sample Design using Spsurvey in R Target population: All intersections of undesignated trails mapped in 2011/2012 with designated trails or OSMP boundaries. These intersections comprise the potential sites where visitors may encounter a treatment to close or restore undesignated trails or an untreated control implemented as part of a contractor study of visitor behavior and attitudes related to undesignated trail closures. Sample Frame: The final sample frame was a point feature class, created through an iterative process of GIS analyses and subsequent staff review and point deletion. OSMP GIS Analyst Jake Cseke produced a shape file UTintersection_AllAccess with 1,542 points comprising the initial target population by intersecting undesignated trails with designated trails or external boundaries of OSMP properties. Under the direction of Megan Bowes, staff reviewed this initial set of points and excluded points that on closer examination did not fit into the target population. Points were excluded if they were located at intersections with 1) roads; 2) facility access paths; 3) driveways; 4) cattle trails not used as visitor trails; and 5) climbing accesses. Points were also excluded if they appeared to be artifacts of the GIS spatial analyses that erroneously overrepresented intersections in the initial shape file. The final sample frame file, UTintersection_final contained 870 points. Survey Design: A Generalized Random Tessellation Stratified (GRTS) survey design for a finite point resource was used. The GRTS design includes reverse hierarchical ordering of the selected sites. The GRTS design was run in the library (group of functions) spsurvey using R which is available online at no charge: Stratification: There was no implicit stratification in the GRTS design. Post-design stratification is possible in spsurvey on the group Access, which could be considered a subpopulation. Panels: There was a single panel. Expected Sample Size: Given a sample of 20 sites, it was expected to draw 12 high volume sites and 8 low volume sites based on the approximate distribution of these categories in the sample frame. Visitor access volume was approximated using trailhead count data from 2004 and no actual stratification occurred. Oversample: 40 sites. 86
96 Final Sample Design: The initial design had 20 base sites with 16 categorized as high volume sites and 4 characterized as low volume sites. Sites were listed in UT_jct order and were evaluated in the field in that order. During field evaluations, 13 of the initial base sites were rejected and replaced with the next 13 oversamples that met the study site criteria. Seventeen of these selected sites were located at the intersection of a designated trail and 3 of the sites were at a property boundary. Description of Sample Design Output: The sites are provided as a shapefile UTint_unstratified_sites_ that can be read directly by ArcMap. The dbf file associated with the shapefile may be read by Excel. The dbf file has the following variable definitions: Variable Name FID SiteID Xcoord Ycoord Mdcaty weight stratum panel EvalStatus EvalReason Access Description Assigned by ArcGIS Unique site identification (character) based on order to be included in the sample and prefaced by UT_Jct NAD_1983_HARN_StatePlane X coordinate NAD_1983_HARN_StatePlane Y coordinate Multi-density categories used for unequal probability selection set to Equal for equal probability sampling Weight (unit?), inverse of inclusion probability, to be used in statistical analyses. Calculated as 1/((1/total sites in sample frame)*#base samples chosen). Strata used in the survey design set to None for this unstratified sample Identifies base sample by panel name Base and Oversample by OverSamp Carried over from sample frame to describe subpopulations of relative access volume Projection Information Projected coordinate system: CS:NAD_1983_HARN_StatePlane_Colorado_North_FIPS_0501_FeetGEOGCS["GCS_ Clarke_1866", Projection: Lambert_Conformal_Conic False_Easting:
97 False_Northing: Central_Meridian: Standard_Parallel_1: Standard_Parallel_2: Latitude_Of_Origin: Linear Unit: Foot_US Geographic Coordinate System: GCS_North_American_1983_HARN Datum: D_North_American_1983_HARN Prime Meridian: Greenwich Angular Unit: Degree The survey design weights that are given in the design file assume that the survey design is implemented as designed. That is, only the sites that are in the base sample (not in the over sample) are used, and all of the base sites are used. This may not occur due to (1) sites not being a member of the target population, (2) a site is not amenable to UT closure or restoration; (3) site no longer intersects an undesignated trail (it has regrown or become a designated trail) or (4) site not sampled for other reasons. Typically, users prefer to replace sites that cannot be sampled with other sites to achieve the sample size planned. The site replacement process is described above. When sites are replaced, the survey design weights are no longer correct and must be adjusted, however the design implemented equal weights to all sites. EvalStatus is initially set to NotEval to indicate that the site has yet to be evaluated for sampling. When a site is evaluated for sampling, then the EvalSelect field indicates a yes for all sites selected. Statistical Analysis Any statistical analysis of data must incorporate information about the monitoring survey design. In particular, when estimates of characteristics for the entire target population are computed, the statistical analysis must account for any stratification or unequal probability selection in the design. Procedures for doing this are available from the Aquatic Resource Monitoring web page given in the bibliography. A statistical analysis library of functions is available from the web page to do common population estimates in the statistical software environment R. References: Diaz-Ramos, S., D. L. Stevens, Jr, and A. R. Olsen EMAP Statistical Methods Manual. EPA/620/R-96/002, U.S. Environmental Protection Agency, Office of Research and Development, NHEERL-Western Ecology Division, Corvallis, Oregon. Stevens, D.L., Jr. and Olsen, A.R Spatially restricted surveys over time for aquatic resources. Journal of Agricultural, Biological, and Environmental Statistics, 4:
98 Stevens, D. L., Jr., and A. R. Olsen Variance estimation for spatially balanced samples of environmental resources. Environmetrics 14: Stevens, D. L., Jr., and A. R. Olsen Spatially-balanced sampling of natural resources in the presence of frame imperfections. Journal of American Statistical Association:99: Web Page: 89
99 Appendix N. Methodological Protocol Background Surveys represent one of the most common types of quantitative, social science research methods. In survey research, the researcher selects a sample of respondents from a population and administers a standardized questionnaire to them. Using surveys, it is possible to collect data from large or small populations, and survey administration provides a systematic and economically feasible method to understand the population s opinions and beliefs on topics of interest. Additionally, standardized questions make measurement more precise when enforcing uniform definitions upon the participants (Babbie, 2005). On-site surveys are specifically advantageous because they can: 1) yield higher response rates because administrators can explain the rationale and importance of the survey; 2) allow administrators to encourage people to complete all questions; and 3) allow participants to ask for clarification when needed (Vaske, 2008, p. 129). Unobtrusive visitor observation is a commonly employed research method. Stationary and roving visitor observation work has been utilized on OSMP over the past several years. In most cases the observer will be unobtrusively observing visitors and thus should not be noticed by them. Observational sampling occured during the month of June, which often sees increased visitation on OSMP lands. Therefore, observers were able to blend in and were not overly noticeable to visitors. Many peer reviewed articles and technical reports (see Peine, 1983; Vande Kamp, 1994) have employed unobtrusive observation methods. The use of such methods was critical to this study. Other methods such as visitor surveys and interviews cannot accurately produce some types of data. However, pairing observed behavior with survery resonses provided robust data on the overall efficacy of each treatment/control utilized in the study. The ability to analyze these relationships was a critical element of the study design. Study Protocols Survey The survey instrument for this study was developed through a collaborative, iterative review process between the PI s and OSMP staff. The instrument was framed within the context of the of the Theory of Planned Behavior (Ajzen, 1991) and developed to incorporate established natural resource-based human dimensions questions, including items stemming from the Recreation Experience Preference scales (see Driver, Tinsley, & Manfredo, 1991; Manfredo, Driver, & Tarrant, 1996), established Leave No Trace-focused 90
100 questions that have been used in numerous peer-reviewed studies (see Lawhon et al., 2013; Taff, Newman, Vagias, & Lawhon, 2014; Vagias & Powell, 2011; Vagias, Powell, Moore, & Wright, 2014), questions regarding trail behaviors and perceptions of intervention treatments (see Park, Manning, Marion, Lawson, & Jacobi, 2008), and questions about visitor use preference, history, and basic demographic information. In the early development of the survey instrument it was pretested with ~30 undergraduate students at a large university; subsequently the instrument was field tested with visitors on OSMP properties in May Pretesting allowed respondents to inform researchers regarding potentially confusing wording and layout issues so that the PI s could revise and improve the instrument for data collection in June Details regarding the survey instrument questions can be reviewed in in subsequent chapters of this report and the final survey instrument can be found in Appendix L. The development of the treatments containing behavioral messaging (i.e., Treatments 2, 3, and 5) was informed by an elicitation study with ~30 visitors on OSMP properties in October Elicitation studies involve a small number of respondents, evaluating a series of potentially influential statements for effectiveness (see Petty & Cacioppo, 1986; Petty & Wegener, 2008). Participants rated nine potential treatment messages, each crafted based upon persuasive communications literature (see Cialdini et al., 2006; Ham & Krumpe, 1996; Hocket & Hall, 2007; Widner & Roggenbuck, 2003; Winter, 2006). Ultimately respondents evaluated: 1) the persuasiveness of the message, and 2) the likeliness that the message would influence their behavior to stay on designated OSMP trails. Two statements were rated as being the most influential: 1) Stay on designated trails: Even when wet and muddy, to protects trailside plants and minimize eroison. This is Not a Designated Trail (Treatment 2), and 2) To Protect OSMP Lands: Please Stay of Designated Trails. This is Not a Designated Trail (Treatment 3). Treatments Applying the results of the elicitation study, the following conditions (Treatments 2 5*) and control (Treatment 1) were developed and employeed for this study (see diagram below, and Appendices J-K): 1. Treatment One Control no educational or barrier treatments in place. 2. Treatment Two Educational treatment #1: Stay muddy hiker * This sign read Stay on designated trails: Even when wet and muddy, to protect trailside plants and minimize eroison. This is Not a Designated Trail. 91
101 3. Treatment Three Educational treatment #2: Protect hiker * This sign read To Protect OSMP Lands: Please Stay on Designated Trails. This is Not a Designated Trail. 4. Treatment Four Physical barrier* Physical barrier made of logs that aesthetically fit with the OSMP environment. 5. Treatment Five Physical barrier with Educational treatment #1* Physical barrier made of logs that aesthetically fit with the OSMP environment with the sign that read Stay on designated trails: Even when wet and muddy, to protect trailside plants and minimize eroison. This is Not a Designated Trail. affixed to the center. *Note: To maintain consistency and accurately determine visitor intentionality, Treatments 2, 3, 4, and 5 were set-back approximately 5 10 feet from the point of entry onto an undesignated trail, barring any physical barriers that inhibit this placement at a given site. Sampling Design and Site Stratification Sampling design was stratified over a one-month period in June Twenty-five days of sampling were allotted for data collection, beginning June 1 and concluding on June 30, with two potential make-up days scheduled for July 1 and 2, which were ultimately needed. Stratification was based upon the following considerations: a) 5 treatments; b) 20 sampling locations, or sites; c) a.m. or p.m. data collection; d) weekday (i.e., Monday, Tuesday, Wednesday, and Thursday) or weekend (i.e., Friday, Saturday, and Sunday) data collection; e) paired surveying with visitor behavior observation, or observation of visitor behavior without the survey instrument; f) availability and quantity of OSMP staff/volunteers and research staff; and g) the limited sampling period spanning over one-month. Each sampling day was divided into four time slots, either in the morning or afternoon, including: early morning (A.M. Early)/late morning (A.M. Late), and early afternoon (P.M. Early)/late afternoon (P.M. Late). During the sampling effort, the time slots were as follows: Early morning: 6:30 a.m.-9:30 a.m. Late morning: 10:00 a.m.-1:00 p.m. Early afternoon: 1:00 p.m.-4:00 p.m. Late afternoon: 4:30 p.m.-7:30 p.m. Thus, on any given sampling day, there were either two a.m. sampling periods (one early/one late) or two p.m. sampling periods (one early/one late). There was no overlap of sampling periods on any given day during the study. 92
102 Sampling locations were selected based on a statistically stratified representation of the various types of trail settings and associated use in OSMP, with the intent to represent DT and UT useage at a systems level. Site selection for this study was suggested and facilitated by OSMP staff. Sampling Sites Sanitarium Anemone Dry Creek Read Rocks South Red Rocks Amphitheatre Lost Gultch Settler s Park Coal Seam Dakota Ridge Chautauqua Hogback Ridge 4 Pines Shanahan Cragmore Con. NCAR BVR Sanitas Valley Flagstaff Gunbarrel Based upon the stratification criteria and the 20 selected sites, accounting for severe weather cancellations, and treatment issues (e.g., one of the treatments was torn down by OSMP visitors), the following represents the final sampling stratification that was used for this study (see final sampling schedule with noted adjustments, Appendix I): All 20 sampling sites received all of the conditions (the control, and the four treatments) at least once during the sampling period All 20 sampling sites received paired visitor survey with visitor behavior observations ( paired ), as well as observations (not paired with surveys observed ) of visitor behavior Site Stratification: Sanitarium: Treatment 1, Paired, Weekday, a.m. Treatment 2, Paired, Weekday, p.m. Treatment 3, Observed, Weekday, a.m. Treatment 4, Paired, Weekend, a.m. Treatment 5, Paired, Weekend, p.m. Chautauqua: 93
103 Treatment 1, Paired, Weekday, a.m. Treatment 2, Paired, Weekday, p.m. Treatment 2, Observed, Weekday, a.m. Treatment 3, Observed, Weekday, a.m. Treatment 4, Paired, Weekend, a.m. Treatment 5, Paired, Weekend, p.m. Anemone: Treatment 1, Paired, Weekday, a.m. Treatment 2, Paired, Weekday, p.m. Treatment 3, Observed, Weekday, a.m. Treatment 4, Paired, Weekend, a.m. Treatment 5, Paired, Weekend, p.m. Hogback Ridge: Treatment 1, Paired, Weekday, a.m. Treatment 2, Paired, Weekday, p.m. Treatment 3, Observed, Weekday, a.m. Treatment 4, Paired, Weekend, a.m. Treatment 5, Paired, Weekend, p.m. Lost Gulch: Treatment 1, Observed, Weekend, a.m. Treatment 2, Paired, Weekday, p.m. Treatment 3, Paired, Weekend, p.m. Treatment 4, Observed, Weekend, p.m. Treatment 5, Paired, Weekday, a.m. BVR: Treatment 1, Observed, Weekend, a.m. Treatment 2, Paired, Weekday, p.m. Treatment 3, Paired, Weekend, p.m. Treatment 4, Observed, Weekend, p.m. Treatment 5, Paired, Weekday, a.m. Settlers Park: 94
104 Treatment 1, Observed, Weekend, a.m. Treatment 2, Paired, Weekday, p.m. Treatment 3, Paired, Weekend, p.m. Treatment 4, Observed, Weekend, p.m. Treatment 5, Paired, Weekday, a.m. Sanitas Valley: Treatment 1, Observed, Weekend, a.m. Treatment 2, Paired, Weekday, p.m. Treatment 3, Paired, Weekend, p.m. Treatment 4, Observed, Weekend, p.m. Treatment 5, Paired, Weekday, a.m. Red Rocks: Treatment 1, Paired, Weekday, a.m. Treatment 1, Observed, Weekend, a.m. Treatment 2, Paired, Weekend, p.m. Treatment 3, Observed, Weekday, p.m. Treatment 4, Paired, Weekday, a.m. Treatment 5, Observed, Weekend, a.m. Cragmoor. Connector: Treatment 1, Paired, Weekday, a.m. Treatment 1, Observed, Weekend, a.m. Treatment 2, Paired, Weekend, p.m. Treatment 3, Observed, Weekday, p.m. Treatment 4, Paired, Weekday, a.m. Treatment 5, Observed, Weekend, a.m. Amphitheatre: Treatment 1, Paired, Weekday, a.m. Treatment 2, Paired, Weekend, p.m. Treatment 3, Observed, Weekday, p.m. Treatment 4, Paired, Weekday, a.m. Treatment 5, Observed, Weekend, a.m. NCAR: 95
105 Treatment 1, Paired, Weekday, a.m. Treatment 2, Paired, Weekend, p.m. Treatment 3, Observed, Weekday, p.m. Treatment 4, Paired, Weekday, a.m. Treatment 5, Observed, Weekend, a.m. Dry Creek: Treatment 1, Paired, Weekday, p.m. Treatment 2, Observed, Weekend, a.m. Treatment 3, Paired, Weekend, p.m. Treatment 4, Observed, Weekday, a.m. Treatment 5, Paired, Weekday, a.m. 4 Pines: Treatment 1, Paired, Weekday, p.m. Treatment 2, Observed, Weekday, a.m. Treatment 3, Paired, Weekend, p.m. Treatment 4, Observed, Weekday, a.m. Treatment 5, Paired, Weekday, a.m. Red Rocks South: Treatment 1, Paired, Weekday, p.m. Treatment 2, Observed, Weekend, a.m. Treatment 3, Paired, Weekend, p.m. Treatment 4, Observed, Weekday, a.m. Treatment 5, Paired, Weekday, a.m. Shanahan: Treatment 1, Paired, Weekday, p.m. Treatment 2, Observed, Weekend, a.m. Treatment 3, Paired, Weekend, p.m. Treatment 4, Observed, Weekday, a.m. Treatment 5, Paired, Weekday, a.m. Coal Seam: Treatment 1, Observed, Weekend, p.m. 96
106 Treatment 2, Observed, Weekday, a.m. Treatment 3, Paired, Weekday, p.m. Treatment 4, Paired, Weekday, p.m. Treatment 5, Observed, Weekend, p.m. Flagstaff: Treatment 1, Observed, Weekend, p.m. Treatment 2, Observed, Weekday, a.m. Treatment 3, Paired, Weekday, p.m. Treatment 4, Paired, Weekday, p.m. Treatment 5, Observed, Weekend, p.m. Dakota Ridge: Treatment 1, Observed, Weekend, p.m. Treatment 2, Observed, Weekday, a.m. Treatment 3, Paired, Weekday, p.m. Treatment 4, Paired, Weekday, p.m. Treatment 5, Observed, Weekend, p.m. Gunbarrel: Treatment 1, Observed, Weekend, p.m. Treatment 2, Observed, Weekday, a.m. Treatment 3, Paired, Weekday, p.m. Treatment 4, Paired, Weekday, p.m. Treatment 5, Observed, Weekend, p.m. Observation The following methods were applied to collect visitor behavior data through direct observation at the selected sampling sites: 97 a. Observers were positioned in a location at the undesignated UT and DT trail intersection under study so as to be as out of sight of visitors as possible. It was very important that the observers presence did not bias/influence the behavior of visitors. b. Observers recorded observations for every individual or visitor party that passed the sample point/interacted with the treatment, regardless of whether they chose to stay on the DT or to continue onto the UT under
107 98 observation (see Appendix E site diagram for specifics; see Appendix D codebook for what observations were made). A visitor party was considered as any recreation group that, in the best judgment of the observer, was intentionally travelling together. Paired Survey and Observation Staff administering the survey/conducting observations received training regarding visitor contact procedures, survey administration, observation protocols, and practice providing unbiased responses to visitor inquiries. Specifically, the observers, and surveyors had the following roles during a given session: Observers: 1. Observers positioned themselves in a location out of sight (as possible) of the trail intersection where treatment was in place, and recorded observations for every visitor party. 2. For visitors who interacted with the treatment, they communicated visitor party identifiers and pairing ID #s to surveyors via a two-way radio: a. Procedures included: i. Recording observation data as usual. ii. Radioing the appropriate surveyor (based on whether a visitor continued on the DT or UT) and provided visitor identifying characteristics, group size and observation ID #s. b. Sampling frame included: i. Control days (days when NO treatment is utilized): Every 3 rd visitor party was surveyed. If the appropriate party (every 3 rd ) refused the survey, the DT surveyor attempted to survey each subsequent party until a survey was taken by a DT user. Once a survey was administered, they reverted back to every 3 rd DT user. ii. Treatment days: Every visitor who passed by the designated trail/undesignated trail intersection and interacted with the treatment. iii. If a designated trail user had no treatment interaction, they were not surveyed*. Note: Given the research questions focused on the role of the treatments, it was determined that only those visitors that had a meaningful, engaged interaction with the treatment would be considered for the survey. Surveyors:
108 Surveyor A (DT surveyor): The role of the DT surveyor was to intercept DT users who interacted with the treatment and made a decision to stay on the DT. These surveyors sampled only those individuals coming from the direction of the trailhead/access point, because these individuals would have not been previously influenced by the treatment (see site diagram below). The observer communicated the observation ID #s for pairing purposes to surveyor A. Surveyors positioned themselves in a location out of sight of the trail intersection where treatment was in place (to the extent possible). Surveryors did not attempt to survey groups of 6 or more visitors. 1. Sampling strategy: a. Control days (days when NO treatment is utilized): Every 3 rd visitor party was surveyed. If the appropriate party (every 3 rd ) refused the survey, the DT surveryer attempted to survey each subsequent party until a survey was taken by a DT user. Once a survey was administered, they reverted back to every 3 rd DT user. b. Treatment days: Every visitor who passed by the designated trail/undesignated trail intersection and interacted with the treatment. c. If a designated trail user had no treatment interaction, they were not surveyed*. Note: Given the research questions focused on the role of the treatments, it was determined that only those visitors that had a meaningful, engaged interaction with the treatment would be considered for the survey. Surveyor B (UT surveyor): 1. The role of the UT surveyor was to intercept all UT users traveling from opposite direction of treatment (Trail User C on site the site diagram provided in Appendix E). 2. Intercepted all DT users who came from the direction of the treatment, and decided to continue onto the UT. On Treatment and control days the Observer will radioed with observation ID #s for pairing purposes. 3. Intercepted every UT trail user encountered (within reason). For example, if in the process of administering a survey, Surveyor B made an effort to stop others passing by. If a visitor was not willing to stop, they made note on survey datasheet. The diagram in Appendix E represents how staff observed and surveyed UT and DT visitors. 99
109 Survey Administration and Protocol Staff attempted to contact every adult (16 years of age or older) visitor who met the sampling criteria for either DT or UT use/treatment or control interaction, and ask her/him to participate in the survey. Staff approached visitors saying approximately: Hello. My name is [Interviewer s name] I am with Open Space and Mountain Parks (OSMP). We are conducting visitor surveys today to help us get an understanding of visitor experiences and improve our visitor management strategies. Would you be willing to help us by completing a short survey? This survey takes most visitors ~7-10 minutes to complete, and offered a clipboard with survey and pen attached. Staff did not attempt to administer the survey to the following ineligible participants: 100 Any person, paid or non-paid, conducting official OSMP business (i.e., on the clock ); this includes OSMP staff, contractors and volunteers Any person who had previously completed a survey Any trail users who did not meet the specified sampling criteria outlined above During the sampling session, staff recorded visitors of the target population who did not take the survey. For those visitors who refused to participate in the survey (refused), passed by the survey administrator before he or she could contact them (passed) or informed the administrator that they had already completed the questionnaire (repeat), staff documented the number of each reported primary activity of those visitors on the appropriate session information datasheet. The presence of accompanying dogs were also noted for visitors that were documented as refusals, passes, or repeats. To be considered a refusal, a visitor had to communicate his or her refusal to take the survey in response to being directly asked to participate by a staff member. Also, individuals were recorded as refusals if they expressed a clear desire to not take the survey, or fail to respond to the surveyor s request to participate. A contacted visitor was recorded as a repeat if he/she volunteered that they had already taken the survey. Visitors were recorded as passed if the administrator did not explicitly ask them to take the survey, and they did not voluntarily inform the surveyor that they did not want to participate. They are also recorded as passed if they did not speak English fluently enough to complete the survey. Non-responding visitors were recorded as individuals (e.g. a party of two hikers and one dog were recorded as one hiker with a dog and one hiker without a dog). If a visitor passed the survey administrator multiple times during a survey session, they were only contacted to participate once per survey session. Similarly, individuals who were documented as a refusals, pass or repeat were only counted once per survey session, regardless of how many times they may have passed by the survey administrator. If staff recognized a visitor as a survey participant from a previous survey session, the staff did not
110 contact the visitor again, but they did doument the visitor as a repeat. During observational sessions, similar protocols applied. Staff were trained to provide unbiased responses to visitor questions about the survey (or the study) so as not to influence a respondent s answers to any survey question. For example, if a visitor asked the survey administrator if survey results will be used to close a particular trail, staff could say generically results will be used to inform OSMP trail management and improve visitor experience. If a visitor demonstrated strong interest in a facet of OSMP management, staff offered them appropriate contact information for the OSMP study liaison. A survey was marked as VOID, after the respondent departed, if 1) the respondent was not part of the target population (e.g., too young, repeat respondent, OSMP volunteer on the clock, not exiting or exiting from a different access point, etc.), or 2) the respondent did not complete at least 75% of the survey. A sampling session was cancelled or finished early if the weather met any of the following conditions: 1) no visitors could be expected; 2) the staff person would be miserable working in those conditions; 3) conditions would put the staff member s health or safety at risk; or 4) conditions prevent the survey from being effectively administered (e.g. blowing rain that would damage survey equipment). If a session started more than one hour later than scheduled, due to staff member delays, that session was treated as cancelled. Similarly, if a session s duration was less than two hours for any reason (e.g. weather deteriorates), that session was treated as cancelled. Weather cancellations and treatment placement issues resulted in several make-up sampling efforts (see Appendix I for final sampling schedule). 101
111 Appendix O. Summary of Key Findings Observed Behaviors The majority of visitors observed in this study were hiking/walking (~76%), traveling alone (~58%), without a dog (~75%). Of the 20 sites selected for this study, Sanitas (n = 348), Dakota Ridge (n = 237), Sanitarium (n = 228) received the most use, while Gunbarrel (n = 24) received the lowest use. Approximately 85% of observed visitors were designated trail (DT) users, while 15% were observed traveling on undesignated trails (UT). The Education/Barrier combination resulted in the greatest visitor interaction/engagement (i.e., stopped and read, or passed and read). Among visitors who traveled past the study site, those who made a decision to use the UT were much more likely to interact with the treatment. Approximately 44% of UT users stopped and interacted the treatment. The combined Barrier/Ed treatment was observed to be the most effective at mitigating undesignated trail use. The Barried/Ed method was ~97% effective at directing visitors to the DT, followed by Barrier (94%), and Ed 2 (94%). Self-reported Survey Closely aligning with observed behavior, the majority of respondents were hiking/walking (~74%), without a dog (~69%). All respondents were from the U.S., and approximately 70% of respondents indicated that they were residents of Boulder, while 30% stated that they were nonresidents. Approximately 22% of respondents indicated that this was their first visit, 32% stated that they have previously visited 1 12 times, 24% had visited times previously, and 22% indicated that they have visited 49 or more times. Regarding potential motivations for visiting OSMP, enjoying nature, physical fitness and psychological health were rated as most important, while learning and physical rest were among the least important reasons for visiting. 102
112 Respondents indicated that human recreation behaviors have the potential to cause both ecological and social impact, though the potential for negative ecological impact was believed to be greater than the potential for negative social impact. Approximately 42% of respondents indicated that they were unaware of undesignated trails. Respondents indicated that Traveling off a designated trail to get away from crowds was the least appropriate reason for off-trail travel, while Traveling off a designated trail because there is an alternative established path was the least inappropriate reason for this behavior. Of the list of potential activities provided for reducing negative impacts on OSMP, Adhering to messages on posted signage was reported to be the most effective, followed by Staying on a designated trail. Staying off a trail when conditions are wet and muddy was reported to be the least effective. When asked, respondents suggested that Traveling in the middle of a designated trail, even when wet or muddy was the most difficult behavior, while Adhering to messages on posted signage was reported to be the easiest of the behaviors to perform. Regarding self-reported current behaviors, the most frequented of the list provided was Always Adhering to messages posted on signage followed by Always Staying on designated trails. While these findings suggest the majority of people Always practice these minimum-impact trail behaviors, there remains a large percentage of visitors who reported only Sometimes performing this behavior. The likelihood of traveling on a designated trail appears to decline when a visitor has previously traveled on a UT in the area, and/or when a UT is available in the area. Regarding self-reported future behaviors, or intent, respondents generally indicated a high likelihood of performing each appropriate (as prescribed by the Leave No Trace Center and OSMP literature) visitor behavior. Adhering to messages on posted signage and Staying on a designated trail resulted in the highest reported likelihood of being performed in the future, while behaviors with the lowest likelihood of future performance included: Traveling in the middle of a designated trail, even when wet or muddy, Traveling on a designated trail, even when you have previously traveled on an undesignated trail in the area, and Traveling on a designated trail, even when an undesignated trail is available in the area. 103
113 Approximately 28% of respondents indicated they had traveled off trail during their visit, 58% had not, and 13% were unsure. Regarding potential reasons for traveling off trail/on UTs, approximately 30% selected I didn t mean to travel off the designated trail (it was an accident) and I have done it before and it worked well for my visitor experience, respectively. Regarding important reasons for only using DTs, To not damage soils and vegetation was indicated as the most important, with 52% of respondents considering this to be Extremely Important. The least important reason was Because I do not want anyone to see me travel off designated trails. The majority of respondents, approximately 84%, indicated they would change their behavior if they Learned their actions in OSMP were damaging the environment. Approximately 85% disagreed that Practicing Leave No Trace takes too much time and approximately 84% believe Practicing Leave No Trace effectively protects the environment so that future generations may enjoy it. The statement Practicing Leave No Trace does not reduce the environmental harm caused by travel in OSMP received less support, as 23% agreed with this statement, suggesting that some respondents do not believe Leave No Trace is as effective at mitigating impacts in OSMP. The majority of respondents, approximately 66%, noticed a sign or barrier meant to keep visitors on DTs, while 50% noticed a combination sign and barrier. The combination sign/barrier was reported to be the most effective management action for keeping visitors on DTs. Results by visitation history 104 Statistically significant relationships were found between visitation motivations and visitation history. Those who visit more frequently rate physical fitness as more important than those who visit less frequently. Family/friend togetherness is more important for the less frequent visitors than for those who visit more often. Frequent visitors are more likely than those who visit less often, to report knowing some OSMP trails are undesignated. Alternatively, those who visit less often are less likely to know some trails are undesignated. This suggest that the more familiar a visitor becomes with the OSMP trail system the more aware they are of the network of UTs. Those who visit less are less aware and thus might assume UTs to be DTs. Respondents who had visited times previously showed consistently lower mean scores across the battery of items related to the appropriateness of Leave No
114 Trace behaviors. Thus, their attitudes are more in line with Leave No Trace, while those that had visited 1-12 times consistently had the highest means, meaning their attitudes are less in line with Leave No Trace promoted behaviors. While no statistically significant relationships were found between visitation history and behavioral intent, individuals who had visited 49 or more previous times were the least likely to stay on a designated trail and adhere to messages posted on signage. A statistically significant relationship was found between visitation history and reasons for staying on DTs. Those who had visited 49 or more previous times indicated the reason To not damage the soils and vegetation to be less important of a reason compared those that selected other, smaller visitation categories. Similarly, the most frequent visitors are less likely to agree that Practicing Leave No Trace effectively protects the environment than are those who visit less often. Results by place of residence: Boulder resident vs. Non-resident A statistically significant difference was found between residents and non-residents regarding the difficulty of certain behaviors. Non-residents reported that it was easier to stay on designated trails than residents, while non-residents felt Adhering to messages on postage signage was easier. Non-residents reported that they are significantly more likely to adhere to messages on postage signage than residents. Boulder resident respondents are significantly less likely to agree that Practicing Leave No Trace effectively protects the environment for future generations than nonresidents. Combined Observation and Survey Nearly 50% of visitors who were observed and surveyed while using a UT reported that they Always use DTs, suggesting that these visitors did not know they were in fact traveling on a UT. DT users are more likely (~77%) than UT users (49%) to report Always staying on a DT. DT users are more likely (~53%) than UT users (39%) to report Always staying on DT when UT is available in the area. 105
115 DT users are more likely (~78%) than UT users (~58%) to report Always adhering to posted messages. Compared to DT users (~12%), UT users (~88%) were more likely to report not knowing if they traveled off a DT. Approximately 46% of UT users indicated they had not traveled off a designated trail, while 34% indicated they had traveled off a designated trail. 20% of UT users were unsure if they had traveled off the DT. Statistically significant differences were found between DT and UT users regarding reasons for traveling off trail/on a UT. UT users were more likely than DT users to select the applies to me and don t know response options across all items in this block. Moreover, a large proportion of UT users consistently selected the Does not apply because I only travel on DTs option, suggesting that many respondents were not aware they were traveling on a UT. Among UT users, the most commonly selected reasons for traveling off trails were I didn t mean to travel off the designated trail (it was an accident) (~45%), and I have done it before and it worked well for my visitor experience (~43%). A statistically significant difference was found between DT and UT users in the importance they placed on the statement I have no reason to travel off DTs as a reason for staying on DTs. This is significantely less important for UT users than for DT users, which could suggest those who use UTs have reason or intention to use them. A statistically significant relationship was found between UT and DT users and whether or not they saw posted signage with messages about trails. Approximately 77% of DT users indicated they had seen signs, whereas only 59% of UT users had seen the signs. The pairing of survey and observation data provided data analysis opportunities that allowed for deeper exploration into the relationships between attitudes and behavior. For example, a multiple regression model that included the independent variables: perceived effectiveness, appropriateness, and difficulty of staying on designated trails, suggested these constructs predict 55% of the variance in one s self-reported intent to stay on designated trails. In this model all three independent variables contributed significantly to behavioral intent. However, when using the same independent variables in a logistic regression model, this time using actual (observed) behavior (use of a DT or UT) as the dependent variable, the predicitive ability of the model dropped to 12%. Moreover, in the logistic regression only perceived difficulty held as a significant predictor of actual behavior. 106

116 Appendix P. Study Site Map 107

117 Appendix Q. Preliminary Site-Level Analysis Treatment effectiveness, by site Treatment effectiveness by site is plotted below. Each facet represents a unique site, of which there are 20. Eight of the 20 sites show a pattern consistent with the overall result that Barrier/Ed increases effectiveness over the control. For the 9 additional sites where data was available, the Barrier/Ed treatment had no effect (n = 8), or actually decreased effectiveness (n = 1; Sanitarium). For the remaining 3 sites (Lost Gulch, Flagstaff, Gunbarrel) there were no visitors observed during Barrier/Ed data collection, thus we can make no determination as to the effectiveness of the Barrier/Ed treatment at these sites. 108


118 Appendix R. Powerpoint slides from May 26, 2016 research presentation 109


119 110

120 111


121 112


122 113

123 114


124 115


125 116


126 117

127 118


128 119

129 120

130 121


131 122

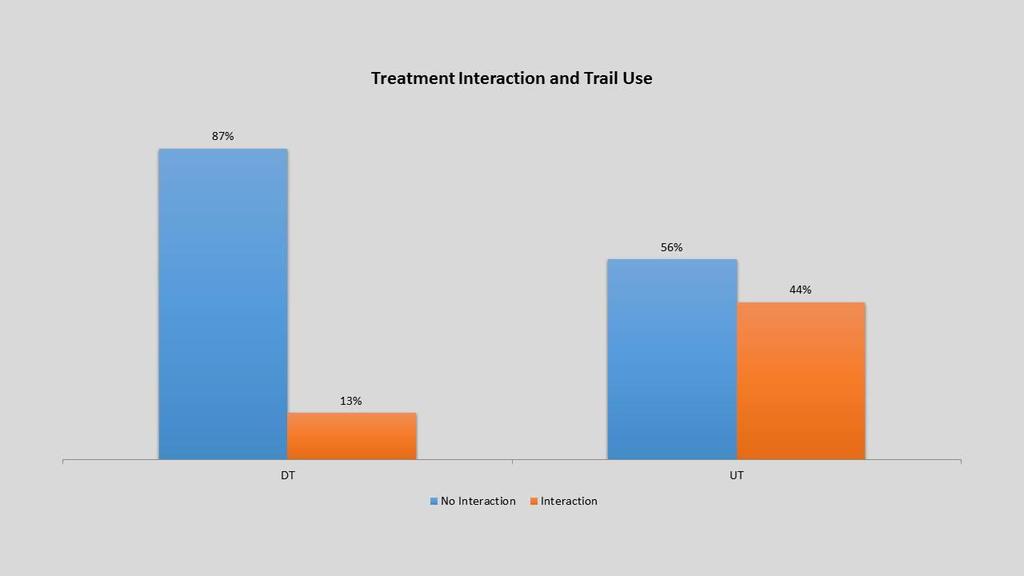
132 123


133 124


134 125


135 126

136 127


137 128


138 129


139 130


140 131


141 132


142 133


143 134


144 135


145 136


146 137


147 138


148 139


149 140

150 141

151 142


152 143

153 144


154 145


155 146

156 147


157 148


158 149

159 150
RE: Access Fund Comments on Yosemite National Park Wilderness Stewardship Plan, Preliminary Ideas and Concepts
 September 30, 2016 Superintendent Yosemite National Park Attn: Wilderness Stewardship Plan P.O. Box 577 Yosemite, CA 95389 RE: Access Fund Comments on Yosemite National Park Wilderness Stewardship Plan,
ARRIVAL CHARACTERISTICS OF PASSENGERS INTENDING TO USE PUBLIC TRANSPORT
 ARRIVAL CHARACTERISTICS OF PASSENGERS INTENDING TO USE PUBLIC TRANSPORT Tiffany Lester, Darren Walton Opus International Consultants, Central Laboratories, Lower Hutt, New Zealand ABSTRACT A public transport
Trail Use in the N.C. Museum of Art Park:
 Trail Use in the N.C. Museum of Art Park: New Connections, New Visitors Jacqueline MacDonald Gibson, PhD Daniel Rodriguez, PhD Taylor Dennerlein, MSEE, MCRP, EIT Jill Mead, MPH Evan Comen University of
2014 West Virginia Image & Advertising Accountability Research
 2014 West Virginia Image & Advertising Accountability Research November 2014 Table of Contents Introduction....... 3 Purpose... 4 Methodology.. 5 Executive Summary...... 7 Conclusions and Recommendations.....
Risk Assessment in Winter Backcountry Travel
 Wilderness and Environmental Medicine, 20, 269 274 (2009) ORIGINAL RESEARCH Risk Assessment in Winter Backcountry Travel Natalie A. Silverton, MD; Scott E. McIntosh, MD; Han S. Kim, PhD, MSPH From the
Managing Informal Trail Impacts. Jeff Marion, Unit Leader/Scientist Virginia Tech Field Unit, USGS, Patuxent WRC
 Managing Informal Trail Impacts Jeff Marion, Unit Leader/Scientist Virginia Tech Field Unit, USGS, Patuxent WRC jmarion@vt.edu, 540-231-6603 Presentation Objectives Informal Trail Management!! Decision
LEAVE NO TRACE CENTER FOR OUTDOOR ETHICS CONSULTING SERVICES
 LEAVE NO TRACE CENTER FOR OUTDOOR ETHICS CONSULTING SERVICES LEAVE NO TRACE PURPOSE Americans love the outdoors. Today, more than 300 million people visit America s national parks and another 150 million
Worksheet: Resolving Trail Use(r) Conflict March 27, 2010
 Conflict March 27, 2010") RI Land & Water Summit Worksheet: Resolving Trail Use(r) Conflict March 27, 2010 John Monroe National Park Service, Rivers & Trails Program 617 223 5049 John_Monroe@nps.gov www.nps.gov/rtca In one sentence,
RI Land & Water Summit Worksheet: Resolving Trail Use(r) Conflict March 27, 2010 John Monroe National Park Service, Rivers & Trails Program 617 223 5049 John_Monroe@nps.gov www.nps.gov/rtca In one sentence,
State Park Visitor Survey
 State Park Visitor Survey Methods, Findings and Conclusions State s Department of Recreation, Park and Tourism Management surveyed state park visitor and trip characteristics, and collected evaluations
WILDERNESS AS A PLACE: HUMAN DIMENSIONS OF THE WILDERNESS EXPERIENCE
 WILDERNESS AS A PLACE: HUMAN DIMENSIONS OF THE WILDERNESS EXPERIENCE Chad P. Dawson State University of New York College of Environmental Science and Forestry Syracuse, NY 13210 Abstract. Understanding
DECISION MEMO. Rawhide Trail #7073 Maintenance and Reconstruction
 Page 1 of 6 Background DECISION MEMO USDA Forest Service Jefferson Ranger District Jefferson County, Montana Rawhide Trail #7073 is located in the Elkhorn Mountain Range approximately 10 miles east of
3.0 LEARNING FROM CHATHAM-KENT S CITIZENS
 3.0 LEARNING FROM CHATHAM-KENT S CITIZENS An important aspect in developing the Chatham-Kent Trails Master Plan was to obtain input from stakeholders and the general public. Throughout the course of the
Visitor Use Computer Simulation Modeling to Address Transportation Planning and User Capacity Management in Yosemite Valley, Yosemite National Park
 Visitor Use Computer Simulation Modeling to Address Transportation Planning and User Capacity Management in Yosemite Valley, Yosemite National Park Final Report Steve Lawson Brett Kiser Karen Hockett Nathan
Wilderness Research. in Alaska s National Parks. Scientists: Heading to the Alaska Wilderness? Introduction
 Wilderness Research in Alaska s National Parks National Park Service U.S. Department of Interior Scientists: Heading to the Alaska Wilderness? Archeologist conducts fieldwork in Gates of the Arctic National
2009 Muskoka Airport Economic Impact Study
 2009 Muskoka Airport Economic Impact Study November 4, 2009 Prepared by The District of Muskoka Planning and Economic Development Department BACKGROUND The Muskoka Airport is situated at the north end
Visitors Experiences and Preferences at Lost Lake in Clatsop State Forest, Oregon
 Visitors Experiences and Preferences at Lost Lake in Clatsop State Forest, Oregon Final Report Mark D. Needham, Ph.D. Assistant Professor Recreation Resource Management Program Department of Forest Resources
18(1) journal. interpretation RESEARCH
 journal. interpretation RESEARCH") 2013 journal of 18(1) interpretation RESEARCH journal of interpretation research Volume 18, Number 1 2013 Editor Carolyn Widner Ward Chief Executive Officer Blue Ridge Parkway Foundation Asheville, North
2013 journal of 18(1) interpretation RESEARCH journal of interpretation research Volume 18, Number 1 2013 Editor Carolyn Widner Ward Chief Executive Officer Blue Ridge Parkway Foundation Asheville, North
Opportunities for Snowmobile Avalanche Education: An Exploration of the Current State of Snowmobiling in the Backcountry
 Opportunities for Snowmobile Avalanche Education: An Exploration of the Current State of Snowmobiling in the Backcountry Proposal of Final Project by Miranda Murphy Master of Arts - Integrated Studies
TAG Guidance Notes on responding to the Civil Aviation Authority s consultation on its Five Year Strategy
 TAG Guidance Notes on responding to the Civil Aviation Authority s consultation on its Five Year Strategy 1. Introduction (Deadline for consultation responses is 19 February 2016) The CAA is currently
The Economic Benefits of Agritourism in Missouri Farms
 The Economic Benefits of Agritourism in Missouri Farms Presented to: Missouri Department of Agriculture Prepared by: Carla Barbieri, Ph.D. Christine Tew, M.S. September 2010 University of Missouri Department
Preferred Recreation Recommendations Stemilt-Squilchuck Recreation Plan March 2018
 Preferred Recreation Recommendations Stemilt-Squilchuck Recreation Plan March 2018 Below are the recommended recreation ideas and strategies that package together the various recreation concepts compiled
Hikers Perspectives on Solitude and Wilderness BY TROY E. HALL
 SCIENCE and RESEARCH Hikers Perspectives on Solitude and Wilderness BY TROY E. HALL Abstract: The role of user encounters in shaping a wilderness experience and sense of solitude was investigated in Shenandoah
Agritourism in Missouri: A Profile of Farms by Visitor Numbers
 Agritourism in Missouri: A Profile of Farms by Visitor Numbers Presented to: Sarah Gehring Missouri Department of Agriculture Prepared by: Carla Barbieri, Ph.D. Christine Tew, MS candidate April 2010 University
MRO 2017 Stakeholder Survey
 MRO 2017 Stakeholder Survey Summary Results Conducted in October 2017 MIDWEST RELIABILITY ORGANIZATION 380 St. Peter Street, Ste.800 St. Paul, MN 55102 P: 651.855.1760 F: 651.855.1712 www.midwestreliability.org
Estimating Tourism Expenditures for the Burlington Waterfront Path and the Island Line Trail
 A report by the University of Vermont Transportation Research Center Estimating Tourism Expenditures for the Burlington Waterfront Path and the Island Line Trail Report # 10-003 February 2010 Estimating
City of Durango 5.8 FUNDING TRAILS DEVELOPMENT
 5.8 FUNDING TRAILS DEVELOPMENT The City has been successful in establishing dedicated local funding sources as well as applying for grants to develop the City s trail system, having received nearly $2.4
CHAPTER FOUR: PERCEIVED CONDITION AND COMFORT
 CHAPTER FOUR: PERCEIVED CONDITION AND COMFORT In order to see how Riverside Park could become a greater asset to the community, it is necessary to investigate and understand the community s perception
San Juan Resource Area Recreation Impact Inventory/Monitoring
 San Juan Resource Area Recreation Impact Inventory/Monitoring Indian Creek Climbing Area Overview & Summary of Findings 2007 Pam Foti, Professor Aaron Divine, Lecturer Janet Lynn, Program Coordinator Northern
Recreationists on the Gifford Pinchot National Forest: A Survey of User Characteristics, Behaviors, and Attitudes
 Recreationists on the Gifford Pinchot National Forest: A Survey of User Characteristics, Behaviors, and Attitudes by Alan R. Graefe The Pennsylvania State University Robert C. Burns University of Florida
Thank you for the opportunity to comment on the proposed action to add trails and trailheads to the Red Rock District trail system.
 July 14, 2010 Jennifer Burns Red Rock Ranger District PO Box 20429 Sedona, AZ 86341 Flagstaff Biking Organization PO Box 23851 Flagstaff, AZ 86002 Dear Jennifer- Thank you for the opportunity to comment
flightops Diminishing Skills? flight safety foundation AeroSafetyWorld July 2010
 Diminishing Skills? 30 flight safety foundation AeroSafetyWorld July 2010 flightops An examination of basic instrument flying by airline pilots reveals performance below ATP standards. BY MICHAEL W. GILLEN
Non-Motorized Outdoor Recreation in British Columbia in 2012: Participation and Economic Contributions
 Non-Motorized Outdoor Recreation in British Columbia in 2012: Participation and Economic Stephen Kux Wolfgang Haider School of Resource and Environmental Management Simon Fraser University Burnaby, British
COMMUNITY BASED TOURISM DEVELOPMENT (A Case Study of Sikkim)
") COMMUNITY BASED TOURISM DEVELOPMENT (A Case Study of Sikkim) SUMMARY BY RINZING LAMA UNDER THE SUPERVISION OF PROFESSOR MANJULA CHAUDHARY DEPARTMENT OF TOURISM AND HOTEL MANAGEMENT KURUKSHETRA UNIVERSITY,
COMMUNITY BASED TOURISM DEVELOPMENT (A Case Study of Sikkim) SUMMARY BY RINZING LAMA UNDER THE SUPERVISION OF PROFESSOR MANJULA CHAUDHARY DEPARTMENT OF TOURISM AND HOTEL MANAGEMENT KURUKSHETRA UNIVERSITY,
Study on Hotel Management Graduates Perceptions and Preferences of Jobs in Hotel Industry in Chennai City
 Study on Hotel Management Graduates Perceptions and Preferences of Jobs in Hotel Industry in Chennai City T.S. Natarajan, Research scholar, Department of Management studies, SCSVMV University, India. E-mail:
Deer, People and Parks
 APPENDIX A: Survey instrument Deer, People and Parks A Survey of Residents Living Near Fire Island National Seashore Research conducted by National Park Service Biological Resource Management Division
Proposal to Redevelop Lower Kananaskis River-Barrier Lake. Bow Valley Provincial Park. Frequently Asked Questions
 Proposal to Redevelop Lower Kananaskis River-Barrier Lake Bow Valley Provincial Park Frequently Asked Questions What is being proposed? What are the details of the proposal? Where is the project area located?
Hickerson, B., & Henderson, K. A. (2010, May/June). Children s summer camp-based physical activity. Camping Magazine, 83(3),
. Children s summer camp-based physical activity. Camping Magazine, 83(3),") Children s Summer Camp-Based Physical Activity By: Benjamin Hickerson and Karla Henderson. Hickerson, B., & Henderson, K. A. (2010, May/June). Children s summer camp-based physical activity. Camping Magazine,
Children s Summer Camp-Based Physical Activity By: Benjamin Hickerson and Karla Henderson. Hickerson, B., & Henderson, K. A. (2010, May/June). Children s summer camp-based physical activity. Camping Magazine,
BACKCOUNTRY PROGRAM WATERSHED REPORT 2002
 BACKCOUNTRY PROGRAM WATERSHED REPORT 2002 Pfeifferhorn Peak, Lone Peak Wilderness Area Salt Lake Ranger District, Wasatch Cache National Forest Prepared by Backcountry Rangers: Joelle Dickson, Greg Hilbig
Visitors Knowledge of Federal Wilderness: Implications for Wilderness User Research and Management
 Visitors Knowledge of Federal Wilderness: Implications for Wilderness User Research and Management Karen S. Hockett Troy E. Hall Abstract Earlier research using interviews of backcountry hikers in Shenandoah
Recreation Opportunity Spectrum for River Management v
 Recreation Opportunity Spectrum for Management v. 120803 Introduction The following Recreation Opportunity Spectrum (ROS) characterizations and matrices mirror the presentation in the ROS Primer and Field
Stress and the Hotel Spa Manager: Outsourced vs Hotel-managed Spas
 Stress and the Hotel Spa Manager: Outsourced vs Hotel-managed Spas (c) fotolia.com Veronica Waldthausen, Demian Hodari & Michael C. Sturman The following article is based on a recent publication entitled
Eastern Lake Ontario Beach User Survey 2003/2004.
 Eastern Lake Ontario Beach User Survey 2003/2004. Introduction The eastern shore of Lake Ontario is a Biodiversity Investment Area that features a 17-mile long barrier beach of Great Lakes dunes and a
Destination Orkney. The Orkney Tourism Strategy Summary
 Destination Orkney The Orkney Tourism Strategy Summary Introduction Adopted by Destination Orkney (formerly Orkney s Area Tourism Partnership), the strategy rocket is a one-page summary of the strategy
January 14, Orange County Transportation Authority Attn: M2 NCCP/HCP 550 South Main Street P.O. Box Orange, CA
 Equestrian Trails, Inc. Corral 357 P.O. Box 1026 Trabuco Canyon, CA 92678 http://saddlebackcanyonriders.com/ President: James Iacono... 714-612-1789 January 14, 2016 Orange County Transportation Authority
BACKCOUNTRY TRAIL FLOOD REHABILITATION PROGRAM
 BACKCOUNTRY TRAIL FLOOD REHABILITATION PROGRAM Backcountry Trail Flood Rehabilitation A June 2013 Flood Recovery Program Summary In June 2013, parts of Southern Alberta were devastated from significant
TONGASS NATIONAL FOREST
 TONGASS NATIONAL FOREST UNITED STATES DEPARTMENT OF AGRICULTURE-FOREST SERVICE Contact: Dennis Neill Phone: 907-228-6201 Release Date: May 17, 2002 SEIS Questions and Answers Q. Why did you prepare this
Is the Big Five Everything? Balancing Conservation and Tourism Goals in South African National Parks
 Is the Big Five Everything? Balancing Conservation and Tourism Goals in South African National Parks Andrew T. Knight, PhD Department of Conservation Ecology and Entomology Stellenbosch University and
EAST DON TRAIL ENVIRONMENTAL ASSESSMENT. Community Liaison Committee Meeting #3 July 15, :30 to 8:30 pm Flemingdon Park Library
 EAST DON TRAIL ENVIRONMENTAL ASSESSMENT Community Liaison Committee Meeting #3 July 15, 2013 6:30 to 8:30 pm Flemingdon Park Library Agenda 1. Welcome 2. Housekeeping and Updates a) Housekeeping b) CLC
Kit Carson-Challenger Ridge Trail Project
 Kit Carson-Challenger Ridge Trail Project Project Accomplishments Report-USFS December 15, 2015 Photo courtesy of Justin Peterson 815 South 25 th Street, Suite 101 Colorado Springs, CO 80904 Dedicated
U.S. Forest Service National Minimum Protocol for Monitoring Outstanding Opportunities for Solitude
 U.S. Forest Service National Minimum Protocol for Monitoring Outstanding Opportunities for Solitude Element 5 of the 10-Year Wilderness Stewardship Challenge May 15, 2014 1 Solitude Minimum Protocol Version
Cooper-Hewitt, National Design Museum Visitors Summer 2008 Summary of Findings
 Introduction Cooper-Hewitt, National Design Museum Visitors Summer 2008 Summary of Findings Office of Policy & Analysis Smithsonian Institution July 2008 In June 2008, the Office of Policy and Analysis
Title VI Service Equity Analysis
 Pierce Transit Title VI Service Equity Analysis Pursuant to FTA Circular 4702.1B NE Tacoma Service May 2016 Pierce Transit Transit Development Dept. PIERCE TRANSIT TITLE VI SERVICE EQUITY ANALYSIS TABLE
PROPOSED ACTION South 3000 East Salt Lake City, UT United States Department of Agriculture
 United States Department of Agriculture Forest Service Uinta-Wasatch-Cache National Forest Salt Lake Ranger District 6944 South 3000 East Salt Lake City, UT 84121 801-733-2660 File Code: 1950/2300 Date:
Photopoint Monitoring in the Adirondack Alpine Zone
 Photopoint Monitoring in the Adirondack Alpine Zone Julia Goren (PI) and Seth Jones Adirondack High Peaks Summit Steward Program Adirondack Mountain Club summit@adk.org PO Box 867, Lake Placid, NY 12946
Preliminary Analysis to Aid Public Comment on TSA s Proposed Nude Body Scanner Rule (Version 0.9 March 29, 2013)
") Preliminary Analysis to Aid Public Comment on TSA s Proposed Nude Body Scanner Rule (Version 0.9 March 29, 2013) On March 26, 2013, the Transportation Security Administration began a courtordered public
Preliminary Analysis to Aid Public Comment on TSA s Proposed Nude Body Scanner Rule (Version 0.9 March 29, 2013) On March 26, 2013, the Transportation Security Administration began a courtordered public
Quantitative Analysis of the Adapted Physical Education Employment Market in Higher Education
 Quantitative Analysis of the Adapted Physical Education Employment Market in Higher Education by Jiabei Zhang, Western Michigan University Abstract The purpose of this study was to analyze the employment
Decision Memo Broken Wheel Ranch Equestrian Outfitter Special-Use Permit Proposed Action
 Decision Memo Broken Wheel Ranch Equestrian Outfitter Special-Use Permit USDA Forest Service Mississippi Bluffs Ranger District, Shawnee National Forest Jackson and Union Counties, Illinois Proposed Action
Testing whether eco certifications sell tourism services
 University of Wollongong Research Online Faculty of Business - Papers Faculty of Business 2014 Testing whether eco certifications sell tourism services Logi Karlsson University of Wollongong, lk976@uowmail.edu.au
ROAD AND TRAIL PROJECT APPROVAL
 ROAD AND TRAIL PROJECT APPROVAL www.marincountyparks.org Marin County Parks, 3501 Civic Center Dr, Suite 260, San Rafael, CA 94903 DATE: July 12, 2017 PRESERVE: Gary Giacomini Open Space Preserve PROJECT:
Economic And Social Values of Vermont State Parks 2002
 Economic And Social Values of Vermont State Parks 2002 Executive Summary Prepared for Vermont State Parks Department of Forest and Parks and Recreation Prepared by: Alphonse H. Gilbert Robert E. Manning
IATOS 2003 Outdoor Enthusiast Survey CTC Market Research March, 2003
 IATOS 2003 Outdoor Enthusiast Survey CTC Market Research March, 2003 The IATOS Expo (International Adventure Travel and Outdoor Sports Show, Chicago, February 2003) provided the CTC s Outdoor Product Development
Decision Memo for Desolation Trail: Mill D to Desolation Lake Trail Relocation
 for Salt Lake County, Utah Uinta-Wasatch-Cache National Forest Salt Lake Ranger District 1. Background The present location of the Desolation Trail (#1159) between Mill D and Desolation Lake follows old
Theme: Predominately natural/natural appearing; rustic improvements to protect resources. Size*: 2,500 + acres Infrastructure**:
 Recreation Opportunity Spectrum (ROS) Classes The Recreation Opportunity Spectrum (ROS) provides a way to describe the variations in the degree of isolation from the sounds and influences of people, and
Thank you for this second opportunity to comment on the proposed revisions to the Coconino National Forest Management plan.
 March 8, 2011 Flagstaff Biking Organization PO Box 23851 Flagstaff, AZ 86002 Yewah Lau Coconino National Forest Attn: Plan Revision 1824 South Thompson Street Flagstaff, Arizona 86001 Sent via electronic
South Colony Basin Recreation Fee Proposal
 South Colony Basin Recreation Fee Proposal Purpose and Need for Collecting Fees in South Colony Basin: Forest Service appropriated funds have not been sufficient to maintain current recreational services
Relevance of crowding effects in a coastal National Park in Germany Results from a case study on Hamburger Hallig Dennis Kalisch
 Relevance of crowding effects in a coastal National Park in Germany Results from a case study on Hamburger Hallig Dennis Kalisch Structure of presentation Conceptual background Research objectives Study
A TYPOLOGY OF CULTURAL HERITAGE ATTRACTION VISITORS
 University of Massachusetts Amherst ScholarWorks@UMass Amherst Tourism Travel and Research Association: Advancing Tourism Research Globally 2007 ttra International Conference A TYPOLOGY OF CULTURAL HERITAGE
Code of conduct on international travel and invasive alien species
 Code of conduct on international travel and invasive alien species Riccardo Scalera Programme officer, IUCN/SSC Invasive Species Specialist Group 37th meeting of the Standing Committee of the Bern Convention
Keeping Wilderness Wild: Increasing Effectiveness With Limited Resources
 Keeping Wilderness Wild: Increasing Effectiveness With Limited Resources Linda Merigliano Bryan Smith Abstract Wilderness managers are forced to make increasingly difficult decisions about where to focus
April 10, Mark Stiles San Juan Public Lands Center Manager 15 Burnett Court Durango, CO Dear Mark,
 Mark Stiles San Juan Public Lands Center Manager 15 Burnett Court Durango, CO 81301 Dear Mark, We are pleased to offer the following comments on the draft San Juan Public Lands Center management plans
CAA consultation on its Environmental Programme
 CAA consultation on its Environmental Programme Response from the Aviation Environment Federation 15.4.14 The Aviation Environment Federation (AEF) is the principal UK NGO concerned exclusively with the
Flight Operations Briefing Notes
 Flight Operations Briefing Notes I Introduction Strict adherence to suitable standard operating procedures (SOPs) and associated normal checklists is a major contribution to preventing and reducing incidents
Outreach: Terrestrial Invasive Species And Recreational Pathways S U S A N B U R K S M N D N R I N V A S I V E S P P P R O G C O O R D
 Outreach: Terrestrial Invasive Species And Recreational Pathways S U S A N B U R K S M N D N R I N V A S I V E S P P P R O G C O O R D Education Project Funded by USFS State & Private Forestry Describe
Tracy Ridge Shared Use Trails and Plan Amendment Project
 Tracy Ridge Shared Use Trails and Plan Amendment Project Scoping Document Forest Service Allegheny National Forest Bradford Ranger District McKean, County, Pennsylvania In accordance with Federal civil
CENTRAL OREGON REGIONAL TRANSIT MASTER PLAN
 Central Oregon Regional Transit Master Plan Volume II: Surveys and Market Research CENTRAL OREGON REGIONAL TRANSIT MASTER PLAN Volume IV: Service Plan Appendices A-B July 213 Nelson\Nygaard Consulting
Economic Impact of Rock Climbing in the Nantahala and Pisgah National Forests
 Economic Impact of Rock Climbing in the Nantahala and Pisgah National Forests JA MES N. M A PLES, PhD MICH A EL J. BR A DLEY, PhD Image Credit: Justin Costner Report submitted to Outdoor Alliance on August
EXECUTIVE SUMMARY PROGRAM DEVELOPMENT REPORT PURPOSE EXISTING SETTING EXPANDING PARKLAND
 EXECUTIVE SUMMARY PROGRAM DEVELOPMENT REPORT PURPOSE As the culmination of the first phase of the master planning process, this Program Development Report creates the framework to develop the Calero County
HEATHROW COMMUNITY NOISE FORUM
 HEATHROW COMMUNITY NOISE FORUM 3Villages flight path analysis report January 216 1 Contents 1. Executive summary 2. Introduction 3. Evolution of traffic from 25 to 215 4. Easterly departures 5. Westerly
Longmont to Boulder Regional Trail Jay Road Connection DRAFT FINAL REPORT
 Longmont to Boulder Regional Trail Jay Road Connection DRAFT FINAL REPORT December 2018 Project Summary Boulder County, Colorado, in partnership with the City of Boulder, is evaluating options for multi-use
Marchand Provincial Park. Management Plan
 Marchand Provincial Park Management Plan 2 Marchand Provincial Park Table of Contents 1. Introduction... 3 2. Park History... 3 3. Park Attributes... 4 3.1 Natural... 4 3.2 Recreational... 4 3.3 Additional
Leave No Trace Practices: Behaviors and Preferences of Wilderness Visitors Regarding Use of Cookstoves and Camping Away From Lakes
 Leave No Trace Practices: Behaviors and Preferences of Wilderness Visitors Regarding Use of Cookstoves and Camping Away From Lakes Neal A. Christensen David N. Cole Abstract This research used descriptive
Logo Department Name Agency Organization Organization Address Information 5700 North Sabino Canyon Road
 Logo Department Name Agency Organization Organization Address Information United States Forest Coronado National Forest 5700 North Sabino Canyon Road Department of Service Santa Catalina Ranger District
SMS HAZARD ANALYSIS AT A UNIVERSITY FLIGHT SCHOOL
 SMS HAZARD ANALYSIS AT A UNIVERSITY FLIGHT SCHOOL Don Crews Middle Tennessee State University Murfreesboro, Tennessee Wendy Beckman Middle Tennessee State University Murfreesboro, Tennessee For the last
2004 SOUTH DAKOTA MOTEL AND CAMPGROUND OCCUPANCY REPORT and INTERNATIONAL VISITOR SURVEY
 2004 SOUTH DAKOTA MOTEL AND CAMPGROUND OCCUPANCY REPORT and INTERNATIONAL VISITOR SURVEY Prepared By: Center for Tourism Research Black Hills State University Spearfish, South Dakota Commissioned by: South
Daisy Dean Trail 628/619 ATV Trail Construction
 Background and Purpose and Need The Daisy Dean ATV Trail Construction Project is located in the Little Belt Mountains, Musselshell Ranger District, Lewis and Clark National Forest approximately 32 miles
The Chu property is a 6.57 acre parcel located in the Town of Superior on the west side of McCaslin Boulevard. In 2014, the Town of Superior acquired
 1 The Chu property is a 6.57 acre parcel located in the Town of Superior on the west side of McCaslin Boulevard. In 2014, the Town of Superior acquired the Chu property for open space with a contribution
Appendix B Ultimate Airport Capacity and Delay Simulation Modeling Analysis
 Appendix B ULTIMATE AIRPORT CAPACITY & DELAY SIMULATION MODELING ANALYSIS B TABLE OF CONTENTS EXHIBITS TABLES B.1 Introduction... 1 B.2 Simulation Modeling Assumption and Methodology... 4 B.2.1 Runway
ABSTRACT. outdoor recreation. Contemporary carrying capacity frameworks rely on formulation of
 ABSTRACT Day Use Social Carrying Capacity Estimating Day Use Social Carrying Capacity in Yosemite National Park Carrying capacity has been a long standing issue in management of parks and outdoor recreation.
Overnight Visitor Use and Computer Simulation Modeling of the Yosemite Wilderness
 Overnight Visitor Use and Computer Simulation Modeling of the Yosemite Wilderness Mark Douglas, Research Assistant, Natural Resources, Humboldt State University, 1 Harpst Street, Arcata, CA 95521; marklanedouglas@gmail.com
FORECASTING FUTURE ACTIVITY
 EXECUTIVE SUMMARY The Eagle County Regional Airport (EGE) is known as a gateway into the heart of the Colorado Rocky Mountains, providing access to some of the nation s top ski resort towns (Vail, Beaver
RUNWAY SAFETY GO-TEAM METHODOLOGY
 RUNWAY SAFETY GO-TEAM METHODOLOGY INTRODUCTION The ICAO Runway Safety Programme (RSP) promotes the establishment of Runway Safety Teams (RSTs) at airports as an effective means to reduce runway related
ANALYSIS OF VISITOR PREFERENCES OF THE HATFIELD-MCCOY TRAILS
 1 ANALYSIS OF VISITOR PREFERENCES OF THE HATFIELD-MCCOY TRAILS Wendy Pace Concord University Recreation and Tourism Management Athens, WV 24712 pacew02@mycu.concor.edu Dr. Roy Ramthun Concord University
WORKSHEET 1 Wilderness Qualities or Attributes Evaluating the Effects of Project Activities on Wilderness Attributes
 WORKSHEET 1 Wilderness Qualities or Attributes Evaluating the Effects of Project Activities on Wilderness Attributes Date: 3/7/2017 Roadless Area: Ruby South Description of Project Activity or Impact to
LATENCY OF TOURISM PERMITS IN THE GREAT BARRIER REEF MARINE PARK AUDIT FOR THE YEAR 2000
 LATENCY OF TOURISM PERMITS IN THE GREAT BARRIER REEF MARINE PARK AUDIT FOR THE YEAR 2 Tourism and Recreation Group December 2 DISCLAIMER The information provided in this Audit is for information and discussion
GUIDANCE MATERIAL CONCERNING FLIGHT TIME AND FLIGHT DUTY TIME LIMITATIONS AND REST PERIODS
 GUIDANCE MATERIAL CONCERNING FLIGHT TIME AND FLIGHT DUTY TIME LIMITATIONS AND REST PERIODS PREAMBLE: Guidance material is provided for any regulation or standard when: (a) (b) The subject area is complex
Project Management Institute Melbourne Chapter Root Causes of Hotel Opening Delays Thursday 30 August 2018
 Project Management Institute Melbourne Chapter Root Causes of Hotel Opening Delays Thursday 30 August 2018 INTRODUCTION Educational and professional background. Nothing at hotel school had prepared me
Understanding user expectations And planning for long term sustainability 1
 Understanding user expectations And planning for long term sustainability 1 What is a natural surface trail? It can be as simple has a mineral soil, mulched or graveled pathway, or as developed as elevated
September 20, Submitted via
 Department of Homeland Security U.S. Citizenship and Immigration Services Office of Policy and Strategy Chief, Regulatory Coordination Division 20 Massachusetts Avenue, NW Washington, DC 20529-2020 Submitted
CODE OF CONDUCT. Corporate Compliance 10.9 Effective: 12/17/13 Reviewed: 1/04/17 Revised: 1/04/17
 Corporate Compliance 10.9 Effective: 12/17/13 Reviewed: 1/04/17 Revised: 1/04/17 1. POLICY This policy defines the commitment that PHI Air Medical, L.L.C has to conducting our activities in full compliance
Final Environmental Impact Statement for the Merced Wild and Scenic River. Comprehensive Management Plan, Yosemite National Park, Madera and Mariposa
 This document is scheduled to be published in the Federal Register on 02/26/2014 and available online at http://federalregister.gov/a/2014-04061, and on FDsys.gov DEPARTMENT OF THE INTERIOR 4312-FF NATIONAL