Non-Motorized Outdoor Recreation in British Columbia in 2012: Participation and Economic Contributions
|
|
|
- Samuel Ward
- 6 years ago
- Views:
Transcription

1 Non-Motorized Outdoor Recreation in British Columbia in 2012: Participation and Economic Stephen Kux Wolfgang Haider School of Resource and Environmental Management Simon Fraser University Burnaby, British Columbia March, 2014 Report Prepared for the Federation of Mountain Clubs of British Columbia
2 Index of Tables Acknowledgements Executive Summary iii iv v 1. Study Background 1 2. Methods 2 3. Results Participation Total Distance Traveled for Non-Motorized Outdoor Recreation Total Economic Impact of Non-Motorized Outdoor Recreation Participation Rates by Geographic Region FMCBC Club Members Participation Rates Analysis by Core FMCBC Activity Groups Single-Day Trip and Multi-Day Trip Expenditures Equipment Expenditures Distances Traveled for Recreation Demographics Analysis by Other Activity Groups Single-Day Trip and Multi-Day Trip Expenditures Equipment Expenditures Distances Traveled for Recreation Demographics Discussion 41 Appendix 1 43 Multiple Screening Methods 43 Comparison With Tourism BC Study 45 Appendix 2 47 Survey Screenshots 47 Appendix 3 61 Margins of Error for Participation Rates 61 References 63 ii
3 Index of Tables Table 1. Participation Rates and Frequency of Participation for All Non-Motorized Activities... 7 Table 2. Participation Rates and Frequency of Participation for All Motorized Activities... 9 Table 3. Estimated Total Number of BC Participants for Each Activity Table 4. Estimated Average and Total Distances Traveled by Respondents and the General BC Population in 2012 (Non-Motorized Activities) Table 5. Estimated Total Expenses Incurred by Recreationists in BC (Non-Motorized Activities) Table 6. Participation Rate by Geographic Region Table 7. Average Number of Single-Day and Multi-Day Trips by Geographic Location Table 8. Participation Rates and Frequency of Participation on Single-Day and Multi-Day Trips (FMCBC Club Members) Table 9. Participants by Core FMCBC Activities (based on selection of Favourite Activity ) Table 10. Average Single-Day Expenses (Core FMCBC Activities) Table 11. Average per day Multi-Day Expenses, Outliers Included (Core FMCBC Activities) Table 12. Average Expenses for Equipment and Skill Development (Core FMCBC Activities) Table 13. Frequency of Distance Ranges Traveled on Single-Day Trips (Core FMCBC Activities) Table 14. Total Number of Times Given Distances were Traveled for Multi-Day Trips for Core FMCBC Activities Table 15. Average Age and Gender Proportions (Core FMCBC Activities) Table 16. Highest Educational Level Obtained (Core FMCBC Activities) Table 17. Household Income Proportions (Core FMCBC Activities) Table 18. Ethnic Group Most Identified with Proportions (Core FMCBC Activities) Table 19. Group Affiliation Proportions (Core FMCBC Activities) Table 20. Participants by Activity Groups (based on selection of Favourite Activity ) Table 21. Average Single-Day Expenses (Activity Groups) Table 22. Average per day Multi-Day Expenses (Activity Groups) Table 23. Average Equipment Expenses (Activity Groups) Table 24. Total Number of Times Distances were Traveled for Single-Day Trips (Activity Groups).. 34 Table 25. Total Number of Times Given Distances were Traveled for Multi-Day Trips (Activity Groups) Table 26. Average Age and Gender Proportions (Activity Groups) Table 27. Highest Educational Level Obtained Proportions (Activity Groups) Table 28. Household Income Proportions (Activity Groups) Table 29. Ethnic Group Most Identified With Proportions (Activity Groups) Table 30. Group Affiliation Proportions (Activity Groups) Table 31. Participation Rates in Outdoor Recreation Activities by Screening Method (Participation Rates published in the activity study of Tourism BC are listed for comparative purposes) Table 32. Margins of error for the participation rates for BC General Population Table 33. Margins of Error for Motorized Activities for BC General Population iii
4 Acknowledgements This report would not have been possible if not for the constant support and advice lent by Dr. Pascal Haegeli who provided guidance at every stage of the research process, from survey design to report writing. Steve Conrad also provided invaluable assistance in the survey design and implementation phases of this project. Also, we would like to extend many thanks to the Federation of Mountain Clubs of BC for their infinite confidence and encouragement and for funding this research. Without their interest in the subject matter at the heart of this report, the project would not have been possible. Last, but certainly not least, we would like to thank all the recreational users who took time out of their day to complete the survey. iv
5 Executive Summary The purpose of this research was to estimate participation rates and economic contributions associated with non-motorized outdoor recreation in British Columbia for the year A total of 28 outdoor recreation activities were examined for participation rates by BC residents. Frequency of participation, separated by single-day and multi-day trips, differences in participation between the Lower Mainland and the rest of the province, distances traveled in pursuit of these activities, expenses associated with the various activities, and demographic characteristics of participants grouped by similar activities were also investigated. Demographic Characteristics 58% of respondents were female, 42% were male. The average age of respondents was 50 years old. The vast majority of respondents were Caucasian (80%). Asian was the second most frequently reported ethnicity among respondents (10%). 28% of respondents had a trades or non-university certificate/diploma, 29% had university degrees, and 14% had pursued post-graduate education. An additional 15% had at least some post-secondary education. Participation General BC Population 50% of the representative sample of the general BC population reported participation in at least one of the outdoor recreation activities listed in the questionnaire. 48% engaged in nonmotorized outdoor recreation at least once during the year The five most popular activities overall were hiking (40% of respondents participating), fishing (18%), motorized boating (13%), snowshoeing (11%), and in-bounds lift-assisted skiing (11%). The five most popular non-motorized activities overall were hiking (40%), fishing (18%), snowshoeing (11%), flatwater kayaking (9%), and trail running (8%). Outdoor Recreationists 87% of respondents who engaged in at least one form of non-motorized outdoor recreation engaged in hiking, which was the most popular activity for outdoor recreationists. Hiking was by far the most frequently engaged in activity overall with a number of participants (n=1,325) more than double that of the next closest activity (fishing, n=597) and a total days (10,010) nearly four times that of the second most commonly participated in activity (fishing, 2,507 total days). Generally speaking, participation rates for the various activities were similar between residents of the Lower Mainland and elsewhere in BC. A few activities (e.g. in-bounds lift-assisted skiing) were more popular in the Lower Mainland and others (e.g. hunting) were more popular among residents elsewhere in BC. Respondents living outside the Lower Mainland reported a greater frequency of participation (number of days participating per year) for 26 of the 28 measured activities on single-day trips. Members of non-motorized outdoor recreation clubs reported significantly higher participation rates for all non-motorized activities compared with the general population of BC. v
6 Club members (their responses where collected separately) reported lower participation rates in all motorized activities except snowmobile trail riding compared with the general population of BC. Club members reported significantly greater numbers of both single-day and multi-day trips for all non-motorized activities. Economic Non-motorized outdoor recreation in BC generated an estimated $3.6 billion in the year Single-day trips accounted for the bulk of this total ($2.5 billion) with multi-day trip expenses making up the remainder ($1.1 billion). The group of activities labeled Climbing generated the greatest average single-day trip expenses ($ per person per day). Hiking, the most popular non-motorized activity, generated average single-day trip expenses of $74.25 per person per day and multi-day trip expenses of $ per person per day. Trail runners reported the highest average multi-day trip expenses of any activity sub-group ($ per person per day, n=24). Trail runners also reported the lowest average single-day trip expenses of any activity subgroup ($55.99 per person per day). Activities requiring a bicycle generated average single-day trip expenses of $66.28 per person per day and average multi-day expenses of $ per person per day. Non-motorized water activities (kayaking and canoeing) generated average single-day trip expenses of $68.92 per person per day and average multi-day trip expenses of $ per person per day. Non-motorized winter activities (skiing, snowshoeing, snowboarding, etc.) generated average single-day trip expenses of $75.58 per person per day and average multi-day trip expenses of $ per person per day. Distance Traveled for Recreation Outdoor recreationists travelled an estimated average of 623 km for non-motorized outdoor recreation in 2012 totaling an estimated 1.3 billion km when extrapolated for all residents of BC. For all activities, single-day trips were much more likely to occur within 50km of the respondents homes than beyond this range. Hikers showed an occasional willingness to travel as much as 100 km (606 trips by 681 participants) or 200 km (150 trips by 681 participants) from home for single-day trips. Hikers reported a comparable number of multi-day trips in ranges from 5 km from home (63 trips) up to 400 km from home (47 trips). Trail runners were most likely to participate in multi-day recreation between 5 and 50 km from their homes. Climbers demonstrated a willingness to travel great distances for multi-day trips, with the most commonly reported ranges being all categories between 200 and greater than 600 km from their homes. Participants in consumptive activities and horseback riding frequently traveled as much as 400 km from home for multi-day recreation; but the most common distance range reported was between 5 and 50 km from home. vi
7 Cyclists were most likely to travel between 200 and 400 km from home for multi-day recreation. Participants in non-motorized water sports reported staying within 5 km of their homes most frequently for multi-day trips, but also frequently traveled between 100 and 200 km from home. Participants in winter sports most frequently traveled between 100 and 200 km from home for multi-day trips. vii
8 1. Study Background In post-industrial societies outdoor recreation is a highly valued component of life and lifestyle that might even determine people s choice of employment and residence. Evidence for these trends abounds throughout BC. Since BC boasts 95% Crown land, many of these outdoor recreation opportunities are located on public land, and therefore are an important component of land-use planning and management decision-making. Outdoor recreation also stimulates economic activity as participants purchase equipment, permits, and engage in travel to their preferred settings. Additionally, participation in outdoor recreation contributes to the physical health of the people who engage in it, improving quality of life and reducing impacts on the public health care system. In spite of its importance, basic data about participation in outdoor recreation, as well as frequency of engagement and economic impacts associated with these activities are often lacking across British Columbia. Some case studies exist either in specific locations or on specific activities (Reilly, Ferguson, Haider & Morris, 2009), but it is an enormous challenge to estimate outdoor recreation participation rates across the vast territory of a jurisdiction such as the Province of BC. Only one other study has investigated outdoors activities province wide (Tourism BC, 2013), but this research focused on a broad range of passive and active outdoor recreation activities taking place both in wilderness and more urban areas. No work exists outlining province-wide participation rates exclusively for active outdoor recreation. Active outdoor recreation activities require physical exertion on the part of the participant. The Federation of Mountain Clubs of BC (FMCBC) is one of the premier groups representing mountain-based outdoor recreation activities in BC. As an interest group it is important for the organization to argue from a solid evidentiary foundation about the importance of its causes in terms of numbers it represents as well as the possible economic impact associated with the activities its members engage in. Therefore, FMCBC approached the Parks and Outdoor Recreation Research Group at Simon Fraser University s School of Resource and Environmental Management to undertake a research project investigating participation rates, frequencies, and economic contributions made by non-motorized outdoor recreationists across the province. Given the vastness of the province, and the very limited funding available, instead of designing an exorbitantly expensive counting effort for eliciting participation rates in the various mountain-based outdoors activities, we undertook a random, internet-based survey of all BC residents, asking them about their mountain-based recreation activities during the previous year. Even though such estimates are subject to recall bias, it seems to be the only method available to obtain somewhat reliable numbers for the entire province and within the budget of a small non-for-profit organization. Sampling was undertaken by Research Now, a market research company with an online pool of respondents who are rewarded for their participation in research such as this. The goal of this research was to develop estimates of participation rates for various outdoor activities and to observe the expenses typically incurred as a result of recreational participation. Particular interest was paid to active non-motorized outdoor recreation, in keeping with the FMCBC mandate to promote self-propelled recreation in the province. The activities that were the focus of this research are self-propelled and require some physical activity. These activities stand in contrast to less active forms of outdoor recreation (animal watching, picnicking, etc.) and activities where participants rely on a motorized vehicle for movement (ATV riding, snowmobiling, etc.) 1
9 2. Methods Data for this study were collected via an online survey which targeted all adult (ages 18 and over) residents of British Columbia as its sampling frame. The sampling was undertaken by Research Now who randomly recruited participants from its online survey panel. Data were collected between March 7 and March 24, 2013 and all questions about outdoor activities pertained to the calendar year of The survey was developed and programmed by the SFU research team, and hosted on an SFU website (see Appendix 2). The survey instrument first presented to each respondent a simple list of outdoor recreation activities and asked them to indicate which they had participated in in the form of a yes / no format. Respondents who indicated that they did not participate in any of the non-motorized activities listed were eliminated at this stage. Data from these eliminated respondents was still used in the computation of overall participation rates for the various activities. Next, participants recorded the number of days they spent engaged in each of their selected activities, separately for single-day trips and multiple-day trips. Thereafter they were asked for their three Favourite Activities, and the remaining questions (economic expenditures and distances traveled for participation) pertained to these three activities only. The separation of single-day and multi-day trips was deemed crucial because respondents participate in trips of very different durations, and expenses and distances travelled will likely differ significantly between single and multi-day trips. The latter also require additional expenses (ex. lodging) that single-day trips do not. Respondents also replied to questions regarding the distances they traveled from their homes for recreation, equipment purchases made during 2012, and several demographic items. The screening method for eligible respondents initially employed by the survey asked a number of primer questions before presenting a list of possible activities. These primer questions asked in a yes/no format if the respondent had participated in active recreation in the province during the year 2012, and if they had participated in non-motorized recreation. Respondents who answered no to either of these questions were screened out. Part of the way through sampling, this approach appeared to be creating difficulties for respondents and the primer questions were dropped in favour of presenting the full list of activities and using responses to it to screen for eligibility. These two groups of respondents based on the different sampling methods did not differ significantly with respect to participation rates for the majority of activities and did not differ at all with respect to subsequent responses. Therefore this report treats them as one homogeneous sample. Several definitions were important to this research. Firstly, non-motorized outdoor activities were defined as any recreational activity during which the participant relies on their own body for movement. This definition excluded activities like snowmobiling and ATV riding, but included activities using a bicycle or non-motorized watercraft (kayak and/or canoe). The definition of nonmotorized activities presented to the respondents specifically excluded activities where a motorized vehicle was used to convey participants between periods of activity (ex. lift-assisted skiing, assisted downhill mountain biking, snowmobile-assisted skiing). Like all motorized activities included in the survey, respondents were able to report participation in these activities but could not use them as Favourite Activities. Consumptive activities (i.e. hunting and fishing) and horseback riding were included in the survey as non-motorized activities but, given the reduced requirements for physical activity, required for most forms of these activities, participants who engaged in these activities 2
10 exclusively were screened out. Therefore all results reported for participants in these activities only represent a subset of the total population. Hiking was also given a special definition in the survey, i.e. a minimum of 2 hours in duration. The definition of single-day and multi-day trips was also important. Single-day trips were defined as any day in which the respondent leaves from and returns to their own residence while participating in recreation in between. Multi-day trips were defined as days spent pursuing recreation where the respondent does not return to their own home afterwards. Multi-day trips therefore could include several days in a row devoted to recreation, or a single day of recreation while a respondent is away from home for an extended period of time. The definition of multi-day trips was structured in this way because the expenses incurred during these days are comparable and distinctly different from the expense profile of a single-day trip. A total of 3,355 members of the Research Now panel received and opened the survey link. Of this Total Sample 1,001 respondents submitted complete surveys. The remaining 2,354 panel members were either ineligible to complete the survey (they did not participate in non-motorized recreation during the year 2012) or they dropped out of the survey before it was complete. Respondents were required to be residents of BC over the age of 18. From the 1,001 complete surveys returned, 823 were valid. Validity was determined by examining the data for illogical response patterns and for required time for survey completion. Respondents who completed the survey in less than 5 minutes were removed as from the various pretests it was apparent that lower completion times could not possibly have conveyed meaningful data. After completion of the random BC wide survey, invitations to the study were sent to FMCBC club members to provide additional insight into outdoor recreation. This convenience sample was not random and the 281 responses received were kept separate from the main sample for all analysis. The results from the sample of FMCBC club members are presented separately in this report and are meant only to serve as a basis for comparison between this interest group and the general population of BC with respect to participation rates. After the introduction and methods, the first section of this report presents participation rates, frequency of participation, and total use days for each activity. Thereafter activities are grouped on the basis of similarity. For example, hiking and trail running are presented together as they are both activities in which participants move under their own power and do not use any specialized vehicles or technical equipment. Throughout the analysis reported below, similar activities with low participation rates have been combined to increase sample size and allow for more accurate statistical analysis. For example, ice climbing, rock climbing, scrambling and mountaineering have been combined and presented as Climbing. This method allowed us to provide more meaningful presentation of trends, and to obtain sufficient sample sizes for the respective groups to undertake simple statistical analysis. Whenever activities have been grouped, it has been indicated in a footnote on that page. 3
11 The main activity groupings in this report are as follows: Core FMCBC Activities o hiking o trail running o climbing outdoor rock climbing scrambling mountaineering ice climbing Consumptive Activities and Horseback Riding o hunting o fishing o horseback riding Biking Activities o cross-country mountain biking o unassisted downhill mountain biking Water Activities o sea kayaking/canoeing o flat-water kayaking/canoeing o white-water kayaking/canoeing Winter Activities o cross-country skiing o snowshoeing o out-of-bounds skiing/snowboarding o backcountry skiing/snowboarding The expenditures reported for each activity grouping are presented both with outliers included and outliers removed, following standard practice in the field. This practice allows the reader to observe the impact of influential observations on the respective means. In this report we have followed the convention of defining an outlier as an observation lying greater than 2 standard deviations from the mean. Assuming a normal distribution of results, this definition preserves over 95% of data points (Howell, 2004). Margins of error for the total sample (n 1 =3,355) were calculated for each activity at the 95% confidence level and are included in Appendix 3. These figures were computed using the formula E = z α/2 /(2 n) where z α/2 = the critical value of the desired confidence level (z=1.96) and n= the sample size. Margins of error were not calculated for any proportions other than overall participation rate by activity. 1 Where results are recorded with an n value n refers to the number of respondents included in a given analysis. 4
12 3. Results The results presented in this section are reported in seven sub-sections. The first describes participation rates for all activities included in the survey as well as the average number of days respondents spent on single-day and multi-day trips for each activity, the resulting total number of use days reported for each activity, and an estimated total number of participants for each activity across the entire province based on 2011 census data. Non-motorized activities are presented first, followed by motorized activities. Next, an estimate of the total distance traveled by respondents for recreation is discussed and used to estimate a total distance traveled by all BC recreationists during the year The next section presents estimates for the total economic impact of non-motorized recreation based on the expenditures reported for the respondents Favourite Activities. Economic contributions of single-day and multi-day trips are presented separately, along with an estimate of the total economic contributions of all activities for the province. The following section compares participation rates and number of days engaged in each activity for residents of the Lower Mainland compared with the rest of the province. The next section outlines the participation rates and number of activity days reported by members of the respective FMCBC clubs. The final two sections of the Results chapter detail the expenses, distances traveled, and demographic characteristics reported by participants in each activity group. The first of these sections focuses on the FMCBC core activities of hiking, trail running, and climbing. The final results section details the same results for the activity groups: consumptive activities and horseback riding, biking activities, water activities, and winter activities. 3.1 Participation Table 1 summarizes the participation rates (based on Survey Question 1) and frequency of participation (Question 2) for all non-motorized activities during 2012 in the Province of British Columbia. Table 2 does likewise for motorized activities. The first two columns in these tables pertain to the total number of individuals recruited to the study (i.e. the total sample of potential respondents contacted by Research Now (n=3355)) who completed the first question. Hence, the percent of total sample actually reflects the general participation rate in any given activity for all of BC, and, assuming a perfectly random sample, also of the population. The remaining columns are based on the Valid Sample of the 823 respondents who submitted complete surveys that were free of obvious errors. Columns 3 and 4 report the average number of days respondents reported for each activity, separated by Single-Day Trips and Multi-Day Trips. The Average Number of Days on Multi-Day Trips for many activities is less than 1 due to the fact that any respondent who did not participate in multi-day recreation for that activity reported a value of 0, thus reducing the overall average for that activity. The Total Number of Days for each activity was calculated by adding the number of single-day trips and days spent on multi-day trips reported by all participants in that activity together. Summary of Participation Findings Almost exactly half of all BC residents surveyed (49.5%) participated in at least one form of outdoor recreation in
13 Nearly half of the general sample of BC residents (48.2%) participated in at least one form of non-motorized outdoor recreation in The five most popular activities overall were hiking (39.5%), fishing (17.8%), motorized boating (13.2%), snowshoeing (11.2%), and in-bounds lift-assisted skiing (10.6%). The five most popular non-motorized activities overall were hiking (39.5%), fishing (17.8%), snowshoeing (11.2%), flat-water kayaking (9.0%), and trail running (8.3%). 86.9% of respondents who reported participating in at least one activity engaged in hiking. Trail running was the most frequently participated in activity for single-day recreation with an average of 13.7 trips per respondent for single-day trips. Hunting and fishing were the non-motorized activities with the highest average number of days per respondent spent on multi day trips with 2.1 and 2.0 days per respondent respectively. Motorized boating had the highest average number of days spent participating per respondent on multi-day trips with an average of 3.0 days. Hiking was by far the most frequently engaged in activity overall with a number of participants (n=1,325) more than double that of the next closest activity (fishing, n=597) and a total days (10,010) nearly four times that of the second most commonly participated in activity (fishing, 2,507 total days). 6
14 Table 1. Participation Rates and Frequency of Participation for All Non-Motorized Activities Activity Number of Participants Percentage of Valid Sample Average Number of Single-Day Trips Perambulatory Activities 3 Percentage of Total Sample 2 (N=3355) (N=823) Average Number of Days on Multi-Day Trips Total Number of Use Days Hiking % 86.9% Trail Running % 18.6% Climbing Activities Outdoor Rock Climbing % 3.2% Mountaineering % 3.8% Scrambling % 3.8% Ice Climbing % 0.9% Bicycling Cross-Country Mountain Biking Downhill Mountain Biking (no assistance) Water Sports % 14.8% % 3.0% Sea Kayaking/Canoeing % 16.4% Flat-Water Kayaking/Canoeing White-water Kayaking/Canoeing % 20.2% % 2.6% See Appendix for margins of error associated with participation proportions as they related to the general population of British Columbia. 3 Defined as activities where a participant proceeds through a landscape on foot. 7
15 Continued Horseback Riding 4 Horseback Riding % 10.4% Consumptive Activities Hunting % 5.5% Fishing % 29.9% Winter Activities Snowshoeing % 26.5% Cross-Country Skiing % 14.8% Out-of-Bounds Downhill Skiing/Snowboarding Backcountry Skiing/Snowboarding % 2.3% % 3.2% Only the Percent of Total Sample column for motorized activities can be considered representative of all participants in Horseback Riding and Consumptive Activities. Since respondents who participated in these activities and no other non-motorized activities were screened out of the sample, responses to the question about number of days participating represent only a subset of this population. 8
16 Table 2. Participation Rates and Frequency of Participation for All Motorized Activities 5 Activity Number of Participants Average Number of Single-Day Trips Summer Activities Downhill Mountain Biking (Assisted) Percentage of Total Sample Percentage of Outdoor Recreationists Average Number of Days on Multi-Day Trips Total Number of Use Days % 2.9% ATV riding % 9.6% Four Wheel Drive Off- Roading % 7.3% Dirt Biking % 5.3% Boating (Motorized) % 23.5% Winter Activities In-Bounds (Lift-Assisted) Skiing/Snowboarding Heli/Cat Skiing/Snowboarding Snowmobile Assisted Skiing/Snowboarding % 24.3% % 1.2% % 1.7% Snowmobile Trail Riding % 6.0% Mountain Snowmobiling % 2.3% Only the Percent of Total Sample column for motorized activities can be considered representative of all participants in these activities. Since respondents who participated in exclusively motorized activities were screened out of the sample, responses to the question about number of days participating represent only a subset of the population of motorized users. 9
17 Table 3. Estimated Total Number of BC Participants for Each Activity Activity Percentage of General BC Population Participating Estimated Total Number of Participants 6 Perambulatory Activities Hiking 39.5% 1,738,023 Trail Running 8.3% 365,205 Climbing Activities Outdoor Rock Climbing 1.7% 74,801 Mountaineering 1.7% 74,801 Scrambling 1.6% 70,401 Ice Climbing 0.4% 17,600 Bicycling Cross-Country Mountain Biking Downhill Mountain Biking (no assistance) Water Sports 6.8% 299, % 66,001 Sea Kayaking/Canoeing 7.5% 330,004 Flat-Water Kayaking/Canoeing White-water Kayaking/Canoeing Horseback Riding 9.0% 396, % 52,801 Horseback Riding 4.8% 211,203 Consumptive Activities Hunting 3.9% 171,602 Fishing 17.8% 783,210 Winter Activities Snowshoeing 11.2% 492,806 Cross-Country Skiing 6.4% 281,604 6 Based on 2011 census data for BC reporting 4,400,057 residents (Stats Canada, 2014). 10
18 Continued Out-of-Bounds Downhill Skiing/Snowboarding Backcountry Skiing/Snowboarding 1.2% 52, % 57, Total Distance Traveled for Non-Motorized Outdoor Recreation Based on the number of trips reported by respondents across a range of possible distances for their three favourite activities (Questions 7 & 9), a total distance, and a total average distance traveled for non-motorized outdoor recreation was calculated based on the following assumptions: For Less than 5 km an estimate of 3 km was assumed as average, for 5 to 50 km an average of 20km was assumed, and for each remaining distance ranges, the average was simply assumed to be the lower bound of the respective distance (e.g. for 50 to 100km the average was simply assumed to be 50km). Given this method of calculation, the estimates for total distance traveled by respondent in this study and the total distance traveled for nonmotorized outdoor recreation by all members of BC population are considered to be conservative. The estimated total number of recreationists in BC for each activity was calculated by multiplying the proportion of the total sample who reported participating in that activity by the Statistics Canada 2011 Census population for British Columbia (4,400,057). Table 4. Estimated Average and Total Distances Traveled by Respondents and the General BC Population in 2012 (Non-Motorized Activities) Average distance per respondent Estimated Total Distance Traveled by Respondents Estimated Total Distance Traveled by Recreationists in British Columbia km 500,000 km 1.3 billion km 3.3 Total Economic Impact of Non-Motorized Outdoor Recreation Based on the average expenses reported by respondents for their three most favourite activities, the total economic impact of non-motorized outdoor recreation was estimated for all of British Columbia. Average expenses for single-day and multi-day trips were multiplied by the average number of single and multi-day trips reported by respondents. These totals were 7 Calculated as the product of the number of non-motorized outdoor recreationist in BC (48.2% of 4,400,057= 2,120,827) and the average distance traveled by a member of the sample (622.5 km). Given the number of assumptions necessary for these calculations, numbers have been rounded and are only approximations based on available data. 11
19 multiplied by the estimated total number recreationists in BC participating in that activity 8. Total single-day and multi-day expenses were added together to calculate the total economic impact of non-motorized recreation in BC. All data included in the calculation of total economic impact was free of outliers (data points greater than 2 standard deviations from the mean; see explanation in Section 2 above). It should be noted that these numbers are estimates that rely on several assumptions. Specifically, these figures assume that the average expenses reported by respondents for their favourite activities are representative of average expenses incurred by recreationists for those activities overall. If participants chose as their Favourite Activities activities which they spend more money on, these estimates will be higher than the true figures. For a full discussion of possible limitations refer to the Discussion. Table 5. Estimated Total Expenses Incurred by Recreationists in BC (Non-Motorized Activities). Estimated Figure Total Average Total Single-Day Expenses $1, Estimated Total Single-Day Expenses $ 2.5 billion Average Total Multi-Day Expenses $ Estimated Total Multi-Day Expenses $ 1.1 billion Total Expenses $ 3.6 billion 8 Reminder: The estimated total number of recreationists in BC for each activity was calculated by multiplying the proportion of the total sample who reported participating in that activity by the Statistics Canada 2011 Census population for British Columbia (4,400,057). 12
20 3.4 Comparison of Participation Rate between Lower Mainland and rest of province Participation rates for each activity (Table 6) and frequency of participation by single and multiday trips (Table 7) were compared between respondents from the Lower Mainland vs. the rest of the province, based on the postal codes reported in the survey. In total 50.7% (n=417) respondents reported residence in the Lower Mainland while 49.3% (n=406) reported residing elsewhere. This section summarizes differences in participation rates by activity and number of days spent on single-day and multi-day trips for these 2 groups of respondents. In each table, the higher proportion for each activity is presented in bold type. Table 6. Participation Rate by Geographic Region Activity Lower Mainland Elsewhere in BC Hiking 85.9% 87.9% Trail Running* 22.5% 14.5% Rock Climbing 3.6% 2.7% Mountaineering 4.8% 2.7% Scrambling 4.3% 3.2% Ice Climbing 1.4% 0.2% XC Mountain Biking* 12.2% 17.5% Downhill Mountain Biking 2.9% 3.2% Assisted Downhill Mountain Biking 3.1% 2.7% Sea Kayaking 17.7% 15.0% Flat Water Kayaking 18.9% 21.4% White Water Kayaking 2.9% 2.2% Horseback Riding 11.0% 9.9% Hunting* 3.4% 7.6% Fishing 28.5% 31.3% ATV Riding 10.1% 9.1% 4X4 Off-Roading 7.4% 7.1% Dirt Biking 6.7% 3.9% Boating (Motorized) 22.3% 24.6% Snowshoeing 29.3% 23.6% Cross-Country Skiing 13.4% 16.3% Out of Bounds Skiing 2.2% 2.5% In Bounds (Lift Assisted) Skiing* 28.1% 20.4% Heli-Skiing 1.0% 1.5% Backcountry Skiing 3.1% 3.2% Snowmobile Trail Riding* 3.8% 8.1% Mountain Snowmobiling 2.2% 2.5% Snowmobile Assisted Skiing 2.4% 1.0% *Statistically significant difference at the 95% confidence level. 13
21 Table 7. Average Number of Single-Day and Multi-Day Trips by Geographic Location Activity Number of Days on Single Day Trips Number of Days on Multi-Day Trips Lower Mainland Elsewhere in BC Lower Mainland Elsewhere in BC Hiking * Trail Running Rock Climbing Mountaineering Scrambling Ice Climbing XC Mountain Biking * Downhill Mountain * Biking Assisted Downhill Mountain Biking Sea Kayaking * Flat Water Kayaking * White Water Kayaking Horseback Riding Hunting * Fishing * ATV Riding X4 Off-Roading Dirt Biking Boating (Motorized) * Snowshoeing * Cross-Country Skiing * Out of Bounds Skiing In Bounds (Lift Assisted) * Skiing Heli-Skiing Backcountry Skiing * Snowmobile Trail * Riding Mountain * Snowmobiling Snowmobile Assisted Skiing *Significant difference at the 95% confidence level. 14
22 Summary of Participation by Geographic Region Residents of the Lower Mainland reported higher rates of participation for 15 of the 28 activities whereas BC residents outside the Lower Mainland reported higher participation rates for 13 activities. Generally speaking, residents of the Lower Mainland reported higher participation rates in activities that do not require heavy investment into equipment (hiking, trail running, rock climbing, mountaineering, and scrambling). Residents of the Lower Mainland also generally reported higher participation rates for motorized activities in the summer. Respondents outside the Lower Mainland generally reported higher participation rates for mountain biking activities, consumptive activities (hunting and fishing), and winter activities. Residents outside the Lower Mainland reported a much higher frequency of participation on single-day trips for 26 of the 28 activities measured. Respondents from outside the Lower Mainland reported average frequencies of participation that were often double, triple, or higher compared to those of Lower Mainland respondents for single-day trips. Residents from the Lower Mainland reported greater frequency of participation in singleday trips for only 2 activities (ice climbing and horseback riding). Participation in multi-day trips was about the same in both regions, and was also balanced between activities. Respondents in each region reported a higher frequency of participation for 14 activities out of FMCBC Club Members Participation Rates A second group of respondents were given access to the survey in order to draw comparisons between the general population of BC and members of organized recreation clubs. A total of 281 members of the communications list of the Federation of Mountain Clubs of British Columbia and its constituent clubs completed the survey. Responses from club members were kept separate from those of the general population for all analysis. This section summarizes the participation and frequency of participation for club members and draws some comparisons to the general population. 15
23 Table 8. Participation Rates and Frequency of Participation on Single-Day and Multi-Day Trips (FMCBC Club Members) Activity Club Members Participation Rate General Population of BC Participation Rate Club Members Average Number of Days (Single- Day Trip) Club Members Average Number of Days (Multi- Day trip) Hiking 96.9% 39.5% (n=198) 6.44 (n=195) Trail Running 23.2% 8.3% (n=46) 0.04 (n=45) Rock Climbing 29.5% 1.7% 6.82 (n=56) 2.53 (n=57) Mountaineering 40.6% 1.7% 2.44 (n=80) 4.16 (n=81) Scrambling 57.1% 1.6% 3.87 (n=111) 2.03 (n=114) Ice Climbing 11.6% 0.4% 2.26 (n=23) 0.87 (n=23) XC Mountain Biking 20.5% 6.8% 8.29 (n=42) 0.46 (n=41) Downhill Mountain Biking 4.5% 1.5% 6.13 (n=8) 0.63 (n=8) Assisted Downhill Mountain Biking 2.2% 1.3% 0.75 (n=4) Sea Kayaking 41.5% 7.5% 3.63 (n=83) Flat Water 30.4% 9.0% 3.02 Kayaking (n=63) White Water 6.7% 1.2% 3.00 Kayaking (n= 12) Horseback 3.6% 4.8% Riding (n=7) Hunting 2.7% 3.9% 4.17 (n=6) Fishing 12.5% 17.8% 2.78 (n=27) ATV Riding 3.1% 5.4% 1.50 (n=6) 4X4 Off-Roading 4.0% 4.1% 3.86 (n=7) 0.50 (n=4) 3.46 (n=82) 1.95 (n=60) 3.38 (n=13) 2.86 (n=7) 6.83 (n=6) 7.73 (n=26) 2.33 (n=6) 2.00 (n=7) 16
24 Continued Dirt Biking 0.9% 3.1% 0.00 (n=2) Boating 7.6% 13.2% 2.31 (Motorized) (n=16) Snowshoeing 66.5% 11.2% 7.21 (n=137) Cross-Country 36.2% 6.4% 7.37 Skiing (n=76) Out of Bounds 12.9% 1.2% 5.20 Skiing (n=25) In Bounds (Lift 37.1% 10.6% 9.94 Assisted) Skiing (n=77) Heli-Skiing 1.3% 0.6% 0.33 (n=3) Backcountry 43.8% 1.3% 6.99 Skiing (n=89) Snowmobile 0.9% 0.8% 1.00 Trail Riding (n=2) Mountain 0.9% 3.0% 1.00 Snowmobiling (n=2) Snowmobile Assisted Skiing 0.4% 1.6% 1.00 (n=1) 0.00 (n=2) 5.44 (n=16) 0.76 (n=135) 1.76 (n=74) 0.00 (n=25) 2.27 (n=75) 0.33 (n=3) 5.89 (n=88) 2.00 (n=2) 2.50 (n=2) 0.00 (n=1) Summary of Club Members Participation Club members reported higher participation rates for all non-motorized activities, except consumptive activities and horseback riding, compared with the general population of BC. Club members participation rates were 3.6% for horseback riding, 2.7% for hunting, and 12.5% for fishing compared with 4.8%, 3.9%, and 17.8% in the general population. Club members reported lower participation rates in all motorized activities except snowmobile trail riding (club members participation rate = 0.9% versus 0.8% in the general population) compared with the general population of BC. Club members reported significantly larger numbers of both single-day and multi-day trips for all non-motorized activities. 17
25 3.6 Core FMCBC Activities Note: This section and all subsequent sections of this report concern the random sample of BC residents and exclude club members data. For more meaningful analysis we needed to group the many separate activities, of which most did not have high participation rates into meaningful higher order groupings to allow for more rigorous analytical comparisons. This consolidation is particularly important for the activities which are of special interest to the FMCBC. The Core Activities included hiking, trail running, and climbing. Climbing itself is an amalgamation of outdoor rock climbing, scrambling, mountaineering, and ice climbing. These activities have been labeled Core FMCBC Activities for reasons of simplicity in representing results. While FMCBC is made up of clubs with diverse interests and aims to represent each equally, the activities in this section represent what the researchers felt were at the heart of mountain recreation in BC. Once again, this separation is only meant to aid in presenting results and does not reflect any sense of priority given to these activities by the researchers or the FMCBC Single-Day Trip and Multi-Day Trip Expenditures The Single-Day Trip and Multi-Day Trip expenses summarized below reflect the values reported by respondents with regards to their Favourite Activities. Table 9. Participants by Core FMCBC Activities (based on selection of Favourite Activity ) Activity Total Number of Participants Number of Participants who Selected Activity as a Favourite Activity Proportion of Participants who Selected Activity as a Favourite Activity Hiking % Trail Running % Climbing % Outliers were defined as observations that were greater than 2 standard deviations from the mean. Means for Commercial Guiding expenses only reflect those respondents who chose to hire a guide for their recreation (values of $0 were removed). The comparatively low numbers of respondents in some groups should be noted when interpreting these findings. 18
26 Table 10. Average Single-Day Expenses (Core FMCBC Activities) Type of Expense Hiking Trail Running Climbing 9 Outliers Included Commercial Guide $61.09 (n=11) Parking $2.50 (n=678) Use Fee $2.65 (n=681) Groceries $15.87 (n=681) Entertainment $17.72 (n=678) Transportation $16.18 (n=677) Other $5.03 (n=680) Total $74.25 (n=557) Outliers Removed $61.09 (n=11) $1.33 (n=653) $1.33 (n=666) $11.51 (n=673) $11.38 (n=673) $8.10 (n=657) $1.36 (n=675) $48.92 (n=542) Outliers Included $95.00 (n=2) $2.69 (n=114) $1.66 (n=113) $7.40 (n=114) $11.24 (n=113) $15.55 (n=114) $4.61 (n=114) $55.99 (n=91) Outliers Removed $95.00 (n=2) $1.59 (n=108) $0.71 (n=109) $3.90 (n=111) $6.88 (n=112) $9.50 (n=113) $0.05 (n=111) $38.15 (n=89) Outliers Included $61.52 (n=13) $13.09 (n=34) $10.74 (n=34) $15.59 (n=34) $15.74 (n=34) $19.41 (n=34) $1.32 (n=34) $ (n=29) Outliers Removed $61.52 (n=13) $1.41 (n=32) $1.45 (n=31) $10.31 (n=32) $7.34 (n=32) $19.24 (n=32) $0.31 (n=32) $45.56 (n=27) Summary for Single-Day Expenses (Outliers Included) Climbers reported greater single-day expenses than hikers and trail runners (Total Expenses = $116.55, $74.25, and $55.99 respectively). Commercial Guiding services were purchased by a minority of respondents only. For those who purchased this service, it was their greatest single-day expense. Climbers paid much greater amounts for Parking and Use Fees than either hikers or trail runners, suggesting that the activities described by Climbing are more likely to occur in regulated areas. Summary for Single-Day Expenses (Outliers Removed) With outliers removed, the elevated total expenses reported by climbers align with the range observed for hikers and trail runners. When outliers are accounted for, hikers reported the greatest total expenses for single-day trips. Climbers still reported higher transportation expenses than hikers and trail runners for single-day trips ($19.24, $8.10, and $9.50 respectively), suggesting that they travel further to reach suitable recreation areas. 9 Climbing is an amalgamation of a number of related activities with small response rates. These activities were Rock Climbing (n=11), Scrambling (n=11), Mountaineering (n=12) and Ice Climbing (n=0). 19
27 Trail runners reported the lowest total expenses for single-day trips. This is in keeping with the nature of the activity, as it is likely to be undertaken for shorter durations than hiking or climbing. Table 11. Average per day Multi-Day Expenses, Outliers Included (Core FMCBC Activities) Type of Expense Hiking Trail Running Climbing Outliers Included Hotel $56.59 Frontcountry Accommodations Backcountry Accommodations (n=174) $21.02 (n=172) $5.32 (n=174) Parking $4.82 Commercial Guide (n=174) $77.43 (n=7) Use Fee $6.43 (n=174) Entertainment $30.68 (n=173) Transportation $34.13 (n=174) Groceries $39.68 (n=173) Other $4.11 (n=174) Total $ (n=153) Outliers Removed $28.83 (n=168) $12.37 (n=167) $1.25 (n=168) $1.25 (n=162) $77.43 (n=7) $3.60 (n=170) $15.18 (n=163) $19.49 (n=167) $22.37 (n=166) $0.60 (n=167) $ (n=145) Outliers Included $ (n=27) $1.35 (n=26) $26.30 (n=27) $15.07 (n=27) $25.00 (n=5) $4.46 (n=27) $57.50 (n=26) $ (n=27) $32.04 (n=27) $0.00 (n=27) $ (n=24) Outliers Removed $77.80 (n=25) $0.40 (n=25) $8.08 (n=26) $7.28 (n=25) $25.00 (n=5) $2.50 (n=26) $28.96 (n=24) $35.20 (n=25) $12.60 (n=25) $0.00 (n=27) $ (n=22) Outliers Included $35.71 (n=14) $30.36 (n=14) $25.71 (n=14) $26.43 (n=14) $32.50 (n=14) $18.57 (n=14) $42.86 (n=14) $36.43 (n=14) $41.57 (n=14) $0.71 (n=14) $ (n=14) Outliers Removed $35.71 (n=14) $30.36 (n=14) $25.71 (n=14) $26.43 (n=14) $75.83 (n=6) $18.57 (n=14) $42.86 (n=14) $36.43 (n=14) $41.47 (n=14) $0.71 (n=14) $ (n=13) Summary for Average Multi-Day Expenses (Outliers Included) Trail runners reported the largest total expenses per day for multi-day trips of the three groups ($ versus $ for hikers and $ for climbers). Trail runners reported much higher hotel and transportation expenses for their multi-day trips, suggesting that they travel further than hikers and climbers and are more likely to seek out hotels for accommodations. 20
28 Of the respondents who purchase commercial guiding services for multi-day trips, hikers paid the most per day of the three groups ($77.43 versus $25.00 for trail runners and $32.50 for climbers). Climbers reported much higher expenses for parking and use fees compared with hikers and trail runners on multi-day trips, suggesting that they are more likely to recreate in regulated areas. Summary for Multi-Day Expenses (Outliers Removed) When outliers are accounted for, climbers reported the greatest expenses per day on multi-day trips, compared with hikers and trail runners ($ versus $ and $ respectively). With outliers removed from the analysis, climbers still reported elevated expenses for parking and use fees, suggesting that their recreation is more likely to occur in regulated areas. Hikers reported the lowest multi-day expenses of the three groups for hotels, backcountry accommodations, parking, entertainment, and transportation. These lower expenses are possibly the result of a greater number of options for hikers with respect to places to visit for recreation. Of the respondents who purchased commercial guiding services, trail runners paid the least ($25.00) for multi-day trips compared with hikers ($77.43) and climbers ($75.83) Equipment Expenditures The equipment expenditures summarized pertains to all respondents who reported participation in a given activity. Participants have not been sorted on the basis of their Favourite Activities for this analysis. Note that equipment purchases include all activities listed in the survey, not only the activity listed in the column heading. For example, Average Total Equipment Purchases for Hiking represents the average amount of money spent on equipment for all activities (climbing, kayaking, skiing, etc.) for a respondent who participated in hiking. Outliers were defined as observations lying greater than 2 standard deviations from the mean. Table 12. Average Expenses for Equipment and Skill Development (Core FMCBC Activities) Type of Expense Hiking Trail Running Climbing Average Total Equipment Purchases (Outliers Included) Average Total Equipment Purchases (Outliers Removed) Average Total Rental Expenses for All Activities Average Skill Development Expenses for All Activities $ (n=715) $ (n=708) $49.40 (n=709) $22.22 (n=709) $ (n=153) $ (n=152) $75.34 (n=152) $40.59 (n=152) $ (n=95) $ (n=94) $86.70 (n=77) $53.12 (n=77) 21
29 Summary for Average Equipment Expenses Climbers reported higher equipment expenses per person in 2012 than hikers or trail runners, while hikers reported the lowest equipment expenses of the three groups. These results were consistent when outliers we accounted for. Climbers reported the largest expenses per person for rental equipment and skill development courses as well, compared with hikers and trail runners. Hikers reported the lowest expenses per person for rental equipment and skill development classes, of the three groups Distances Traveled for Recreation Respondents were asked When you participated in Single-Day Trips/Multi-Day Trips for each of your favourite activities during 2012, for how many trips did you travel each of the following distances (one-way)? Results in this section represent the total number of trips reported by respondents for each distance range. A number of groups have reported traveling distances that do not appear logical. For example, traveling 600 km one-way for a single-day hiking trip was reported 55 times by 681 respondents. It must be assumed that these respondents did not fully understand the definition of single-day and multi-day trips. The latter of which was defined in the survey as any recreation participated in while away from home for multiple days. Therefore, if a respondent was away from home for 5 days and hiked on one day, they were meant to report one day participating in hiking on a multi-day trip. It is also possible that respondents reporting excessively large distances traveled for single day trips mistakenly reported the round trip distance they traveled rather that the requested one-way distance. Given these possibilities, it seems likely that any single-day recreation reported below that occurred more than 400 km from the respondent s home was actually misreported multi-day recreation. Table 13. Frequency of Distance Ranges Traveled on Single-Day Trips (Core FMCBC Activities) Distance from Home Hiking Trail Running Climbing Less than 5km 4183 (n=679) 5 50km 4018 (n=681) km 606 (n=681) km 150 (n=681) km 61 (n=681) km 34 (n=681) Greater than 600km 55 (n=681) 1161 (n=114) 602 (n=113) 23 (n=114) 10 (n=114) 13 (n=114) 5 (n=114) 5 (n=114) 45 (n=35) 173 (n=35) 31 (n=35) 0 (n=35) 1 (n=35) 1 (n=35) 10 (n=35) 22
30 Estimated Average Total Distance Traveled per Respondent Estimated Total Distance Traveled for Activity km km km 197,009 km 25,273 km 11,745 km Summary for Distances Traveled for Single-Day Trips Hikers and trail runners most commonly recreated within 5 km of their homes, while climbers most frequently traveled between 5 and 50 km for single-day recreation opportunities Climbers are proportionately more likely to travel greater than 600 km for a single-day of recreation than hikers or trail runners. Hikers reported the greatest frequency of single-day trips overall. Table 14. Total Number of Times Given Distances were Traveled for Multi-Day Trips for Core FMCBC Activities Distance from Home Hiking Trail Running Climbing Less than 5km 63 (n=174) 2 (n=27) 0 (n=14) 5 50km 44 (n=174) 16 (n=27) 1 (n=14) km 47 (n=174) 0 (n=27) 0 (n=13) km 51 (n=174) 2 (n=27) 1 (n=14) km 47 (n=174) 1 (n=26) 3 (n=14) km 12 (n=174) 1 (n=27) 2 (n=14) Greater than 600km 28 (n=174) 3 (n=27) 2 (n=14) Estimated Average Total Distance 58.0 km 25.7 km 77.7 km Traveled per Respondent Estimated Total Distance Traveled for Activity 39,519 km 2,926 km 2,720 km Summary of Distances Traveled for Multi-Day Trips Climbers are most likely to travel large distances (more than 200 km from their homes) for multi-day recreation opportunities compared with hikers and trail runners. Trail runners are much more likely to stay within 50 km of their homes for multi-day recreation than they are to travel beyond 50 km. Hikers are most likely to engage in multi-day recreation within 5km of their homes. 23
31 Hikers also reported a great number of trips over a variety of distances, with the frequency of trip declining substantially beyond 400 km from their homes Demographics 10 Table 15. Average Age and Gender Proportions (Core FMCBC Activities) Hiking (n=715) Trail Running (n=153) Climbing (n=70) Average Age Male 41.7% 46.4% 50.0% Female 57.8% 52.9% 50.0% Summary for Age and Gender On average, hikers were the oldest of the three groups (average age = 50.11) and trail runners were the youngest (average age = 42.19). More women than men reported participation in hiking and trail running while climbing was more evenly split between genders. Table 16. Highest Educational Level Obtained (Core FMCBC Activities) Highest Educational Level Hiking (n=715) Trail Running (n=153) Climbing (n=70) Less than High School 1.5% 1.3% 0.0% Complete High School 12.2% 3.3% 0.0% Trades or Non-University Certificate 27.6% 24.2% 24.3% Some Post Secondary 15.5% 13.7% 11.4% Completed Post Secondary 29.8% 37.9% 41.4% Post-Graduate Degree 12.9% 19.6% 22.9% 10 The demographic characteristics pertain to all respondents who reported participation in an activity. 24
32 Summary for Highest Educational Level Obtained The majority of respondents in all three groups had a post-secondary degree or higher. Climbers were the group with the highest proportion of respondents with at least a post secondary degree (67.3%) compared with hikers (42.7%) and trail runners (57.5%). Trail runners and climbers were significantly more likely to pursue education beyond high school than not (p < & p = respectively) All respondents in the climbing group pursued education beyond high school. Table 17. Household Income Proportions (Core FMCBC Activities) Household Income Hiking (n=715) Trail Running (n=153) Climbing (n=70) $19,999 or less 3.1% 3.3% 2.9% $20,000 to $39, % 12.4% 10.0% $40,000 to $59, % 13.1% 18.6% $60,000 to $79, % 11.8% 12.9% $80,000 to $99, % 16.3% 18.6% $100,000 to $124, % 19.6% 17.1% $125,000 to $149, % 6.5% 7.1% $150,000 to $199, % 4.6% 2.9% $200,000 or more 1.7% 1.3% 0.0% Summary for Household Income: The mode (most common earnings group) for trail runners ($100,000 to $124,999) was higher than for either hikers ($40,000 to $59,999) or climbers ($80,000 to $99,999). Hiking was arguably the most accessible activity included in this survey, given the few expenses involved in participation compared with other activities. The notion of accessibility is supported by the large proportion of hiking participants in the lower half of the household income scale. 25
33 Table 18. Ethnic Group Most Identified with Proportions (Core FMCBC Activities) 11 Ethnic Group Most Identified With Hiking (n=715) Trail Running (n=153) Climbing (n=70) First Nations 1.1% 0.0% 2.9% Caucasian 80.4% 69.9% 62.9% Middle Eastern 0.1% 0.0% 1.4% South Asian 1.1% 3.9% 2.9% Asian 10.3% 17.6% 17.1% Pacific Islander 0.3% 0.7% 1.4% Black 0.4% 0.7% 0.0% Latino 0.3% 1.3% 0.0% Other 1.7% 2.0% 2.9% Summary for Ethnic Group Most Identified With: The majority of respondents in each of the three groups reported being Caucasian, followed by Asian A greater proportion of hikers identified with the Caucasian ethnicity (80.4%) than either trail runners (69.9%) or climbers (62.9%). Trail runners and climbers were likewise more likely to identify with the Asian ethnicity (17.6% and 17.1% respectively) than hikers (10.3%) Statistics Canada BC Demographic proportions: Caucasian 74.3%, Middle Eastern 0.2%, South Asian 6.4%, Asian 13.8 %, Black 0.7%, Latino 0.7%. First Nations and Pacific Islander not included. 26
34 Table 19. Group Affiliation Proportions (Core FMCBC Activities) 12 Hiking (n=715) Trail Running (n=153) Climbing (n=70) Members of Organized Groups 7.6% 9.8% 14.3% Online Group 1.3% 2.6% 5.7% Informal Group 3.6% 3.9% 10.0% Traditional Group 4.1% 7.2% 8.6% Summary for Group Affiliation: Climbers were more likely to report membership in an organized group (14.3%) than hikers (7.6%) or trail runners (9.8%). Climbers were also the most likely activity group of being members of informal groups (10.0%) compared with hikers (3.6%) and trail runners (3.9%). Hikers and trail runners who reported group membership were most likely to be members of a traditional outdoor recreation club (4.1%) and 7.2% respectively). 12 The proportions reported in Table 19. Group Affiliation Proportions (Core FMCBC Activities)represent the percentage of respondents who indicated participation in each activity who also indicated membership in organized recreation clubs. These clubs could be based online, be informal (no membership fees, no board members, etc.), or traditional clubs (pay membership fees, etc.). 27
35 3.7 Activity Groups This section combines the remaining activities from the list presented to respondents on the basis of similar characteristics. Please refer to the footnotes below Table 21. Average Single-Day Expenses (Activity Groups) for a full description of each group. It should be noted that respondents in the Consumptive Activities and Horseback Riding Group may not accurately represent all participants in these activities due to the fact that respondents were only permitted to complete the entire survey if they participated in other non-motorized activities outside of the Consumptive subset. This process may have excluded the most avid participants in Consumptive Activities and Horseback Riding Single-Day and Multiple Day Trip Expenditures: The Single-Day Trip and Multi-Day Trip expenses summarized below reflect the values report by respondents with regards to their Favourite Activities. Table 20. Participants by Activity Groups (based on selection of Favourite Activity ) Activity Total Number of Participants Number of Participants who Selected Activity as a Favourite Activity Proportion of Participants who Selected Activity as a Favourite Activity Consumptive % Activities & Horseback Riding Biking Activities % Water Activities % Winter Activities % Means for Commercial Guiding expenses only reflect those respondents who chose to hire a guide for their recreation (values of $0 were removed). The comparatively low numbers of respondents should be noted when interpreting these findings. 28
36 Table 21. Average Single-Day Expenses (Activity Groups) Type of Expense Consumptive Activities & Biking Activities 14 Water Activities 15 Winter Activities 16 Horseback Riding 13 Commercial Guide Outliers 17 Included $ (n=32) Parking $1.92 (n=284) Use Fee $5.23 (n=285) Groceries $23.98 (n=285) Entertainment $13.94 (n=285) Transportation $18.23 (n=285) Other $4.73 (n=284) Total $93.81 (n=248) Outliers Removed $ (n=30) $0.62 (n=275) $1.81 (n=280) $17.10 (n=273) $8.55 (n=273) $11.17 (n=274) $2.54 (n=274) $74.02 (n=240) Outliers Included $30.00 (n=1) $2.47 (n=94) $4.29 (n=94) $15.89 (n=94) $11.25 (n=94) $16.00 (n=94) $ 1.97 (n=94) $66.28 (n=74) Outliers Removed $30.00 (n=1) $0.34 (n=88) $0.79 (n=91) $5.88 (n=90) $7.01 (n=90) $3.13 (n=88) $0.28 (n=91) $34.56 (n=71) Outliers Included $96.11 (n=18) $0.90 (n=207) $ 2.66 (n=207) $8.94 (n=207) $ 9.35 (n=207) $21.13 (n=207) $ 5.27 (n=207) $68.92 (n=170) Outliers Removed $96.11 (n=18) $0.19 (n=194) $0.80 (n=196) $6.91 (n=199) $6.25 (n=204) $9.23 (n=203) $ 1.49 (n=202) $47.56 (n=165) Outliers Included $ (n=14) $2.39 (n=246) $7.45 (n=246) $10.29 (n=246) $17.96 (n=246) $20.57 (n=246) $3.82 (n=246) $75.58 (n=222) Outliers Removed $ (n=14) $1.02 (n=232) $3.90 (n=235) $8.08 (n=239) $10.54 (n=233) $12.65 (n=236) $0.61 (n=239) $55.74 (n=216) 13 Consumptive Activities & Horseback Riding combines Fishing (n=192), Hunting (n=32), and Horseback Riding (n=61). 14 Biking Activities combines Cross-Country Mountain Biking (n=83), and Downhill Mountain Biking (n=11). 15 Water Activities combines Sea Kayaking/Canoeing (n=82), Flatwater Kayaking/Canoeing (n=118), and Whitewater Kayaking/Canoeing (n=7). 16 Winter Activities combines Snowshoeing (n=150), Cross-Country Skiing (n=73), Out-of-Bounds Skiing/Snowboarding (n=10), and Backcountry Skiing/Snowboarding (n=13). 17 Outliers were defined as observations that were greater than 2 standard deviations from the mean. 29
37 Summary for Single-Day Expenses (Outliers Included): Participants in consumptive activities & horseback riding (hereafter referred to as consumptive activities ) reported the greatest expenses for single-day trips of the four activity groups outlined in this section (Total Expenses = $93.81 versus $66.28 for biking, $68.92 for water sports, and $75.58 for winter activities). Participants in consumptive activities paid the most on average for commercial guiding ($ per day) and groceries ($23.98 per day) compared with the other activity groups. Participants in winter activities paid the most for use fees ($7.45 per day) and entertainment ($17.96 per day), compared with the other activity groups. Respondents who participated in water sports paid the most for transportation ($21.13 per day), of the four activity groups for single-day trips. Summary for Single-Day Expenses (Outliers Removed): When outliers were accounted for, participants in consumptive activities still paid more than participants in the other activity groups overall ($74.02 versus $34.56, $47.56, and $55.74 for biking, water sports, and winter activities respectively). With outliers removed from the analysis, participants in winter activities paid the most for parking ($1.02 per day), use fees ($3.90 per day), entertainment ($10.54), and transportation ($12.65) of any activity group listed in this section. 30
38 Table 22. Average per day Multi-Day Expenses (Activity Groups) Type of Expense Consumptive Activities Biking Activities Water Activities Winter Activities & Horseback Riding Outliers Outliers Outliers Outliers Outliers Outliers Outliers Outliers Included Removed Included Removed Included Removed Included Removed Hotel $42.22 (n=101) Frontcountry Accommodations $13.94 (n=100) Backcountry Accommodations $5.90 (n=101) Parking $4.69 (n=101) Commercial Guide $ (n=9) Use Fee $6.97 (n=99) Entertainment $28.21 (n=99) Transportation $24.98 (n=101) Groceries $46.96 (n=101) Other $11.27 (n=101) Total $ (n=94) $24.61 (n=96) $8.43 (n=94) $1.24 (n=97) $1.36 (n=95) $ (n=9) $3.76 (n=96) $16.94 (n=97) $19.62 (n=98) $38.78 (n=96) $7.08 (n=100) $ (n=90) $23.33 (n=27) $28.56 (n=27) $6.52 (n=27) $5.78 (n=27) $58.00 (n=2) $16.26 (n=27) $31.93 (n=27) $31.22 (n=27) $36.41 (n=27) $3.70 (n=27) $ (n=22) $16.92 (n=26) $28.31 (n=26) $2.92 (n=26) $4.08 (n=26) $58.00 (n=2) $8.12 (n=26) $23.42 (n=24) $21.79 (n=24) $33.96 (n=26) $0.00 (n=25) $ (n=21) $39.64 (n=55) $7.00 (n=55) $0.00 (n=55) $5.49 (n=55) $30.00 (n=2) $0.22 (n=55) $31.91 (n=55) $48.62 (n=55) $30.73 (n=55) $3.27 (n=55) $ (n=51) $20.19 (n=52) $4.33 (n=52) $0.00 (n=55) $4.48 (n=54) $30.00 (n=2) $0.00 (n=53) $16.44 (n=52) $21.21 (n=53) $22.45 (n=53) $0.57 (n=53) $ (n=48) $80.15 (n=65) $1.85 (n=65) $18.15 (n=65) $18.15 (n=65) $66.43 (n=7) $8.92 (n=65) $50.85 (n=65) $59.69 (n=65) $34.92 (n=65) $1.54 (n=65) $ (n=59) $49.36 (n=62) $0.47 (n=64) $7.80 (n=59) $3.93 (n=61) $66.43 (n=7) $3.17 (n=60) $34.51 (n=61) $20.92 (n=60) $24.13 (n=63) $0.32 (n=63) $ (n=55) 31
39 Summary for Average Multi-Day Expenses (Outliers Included): Participants in winter activities had the highest per day expenses for multi-day trips ($ per day) compared with participants in consumptive activities ($213.19), biking activities ($230.73), and water sports ($181.14). Similar to single-day expenses, participants in consumptive activities reported greater expenses for commercial guiding ($ per day) and groceries ($46.96 per day) than respondents in the other activity groups. Respondents who undertook multi-day recreation for winter activities paid more for hotels ($80.15 per night), backcountry accommodations ($18.15 per night), parking ($18.15 per day), entertainment ($50.85 per day), and transportation ($59.69 per day) than the other activity groups. Cyclists reported greater expenses with regard to use fees ($16.26 per day) and frontcountry accommodations ($28.56 per night) than participants in the other activity groups for multi-day trips. Summary for Multi-Day Expenses (Outliers Removed): When outliers were accounted for, cyclists moved ahead of participants in winter activities for the greatest overall expenses per day on multi-day trips ($ and $ respectively). Cyclist reported greater expenses per day on multi-day trips for frontcountry accommodations ($28.31 per night), use fees ($8.12 per day), and transportation ($21.79 per day) than respondents in the other activity groups. 32
40 3.7.2 Equipment Expenditures: The equipment expenditures summarized below are for all respondents who reported participation in a given activity group. Participants have not been sorted on the basis of their Favourite Activities for this analysis. Note that equipment purchases include all activities listed on the survey, not only the activity listed in the column heading. Outliers were defined as observations lying greater than 2 standard deviations from the mean. Table 23. Average Equipment Expenses (Activity Groups) Type of Expense Consumptive Activities & Horseback Riding Biking Activities Water Activities Average Total Equipment Purchases (Outliers Included) Average Total Equipment Purchases (Outliers Removed) Average Total Rental Expenses for All Activities Average Skill Development Expenses for All Activities $ (n=303) $ (n=298) $79.52 (n=298) $34.04 (n=298) $ (n=129) $ (n=128) $74.12 (n=129) $35.19 (n=129) $ (n=254) $ (n=249) $74.44 (n=250) $46.26 (n=250) Winter Activities $ (n=289) $ (n=285) $84.01 (n=286) $41.85 (n=286) Summary for Average Equipment Expenses: Participants in consumptive activities reported the largest overall equipment expenses when outliers were included in the analysis ($1, during the year 2012), but cyclists had the greatest equipment expenses when outliers were removed ($1, in 2012). Participants in winter activities reported the largest average expenses for rental equipment during 2012 ($84.01). Participants in water sports spent more on average for skill development ($46.26 in 2012) than members of the other activity groups. 33
41 3.7.3 Distances Traveled for Recreation Table 24. Total Number of Times Distances were Traveled for Single-Day Trips (Activity Groups) Distance from Home Consumptive Activities & Horseback Riding Less than 5km 877 (n=282) 5 50km 889 (n=285) km 357 (n=285) km 122 (n=285) km 56 (n=285) km 58 (n=285) Greater than 600km 28 Estimated Average Total Distance Traveled per Respondent Estimated Total Distance Traveled for Activity (n=285) Biking Activities 501 (n=94) 219 (n=94) 92 (n=94) 5 (n=94) 1 (n=94) 2 (n=94) 0 (n=94) Water Activities 407 (n=207) 361 (n=207) 74 (n=207) 49 (n=207) 43 (n=207) 13 (n=207) 16 (n=207) Winter Activities 282 (n=185) 564 (n=186) 101 (n=185) 66 (n=186) 20 (n=186) 5 (n=186) 5 (n=186) km km km km 101,661 km 11,983 km 40,441 km 32,776 km Summary for Distances Traveled for Single-Day Trips: The vast majority of single-day trips for all activity groups occurred within 100km of respondents homes. Participants in consumptive activities traveled greater than 100km from home more often than participants in other activities. Cyclists were the least likely group to travel more than 100 km from their homes for recreation, suggesting a greater availability of local options. 34
42 Table 25. Total Number of Times Given Distances were Traveled for Multi-Day Trips (Activity Groups) Distance from Home Consumptive Activities & Horseback Riding Less than 5km 32 (n=101) 5 50km 66 (n=101) km 38 (n=101) km 42 (n=101) km 32 (n=101) km 9 (n=101) Greater than 600km 13 Estimated Average Total Distance Traveled per Respondent Estimated Total Distance Traveled for Activity (n=101) Biking Activities 3 (n=27) 2 (n=27) 3 (n=27) 0 (n=27) 9 (n=27) 0 (n=27) 6 (n=27) Water Activities 22 (n=55) 0 (n=55) 5 (n=55) 16 (n=55) 8 (n=55) 3 (n=55) 4 (n=55) Winter Activities 1 (n=48) 17 (n=48) 2 (n=48) 24 (n=48) 15 (n=48) 0 (n=48) 4 (n=48) 88.8 km 59.6 km 34.4 km 44.3 km 25,316 km 5,599 km 7,116 km 8,243 km Summary of Distances Traveled for Multi-Day Trips: Participants in consumptive activities were the most likely group to participate in multiday recreation (n=101) compared with the other activity groups. Participants in consumptive activities were also the most likely group to travel great distances (greater than 100km) to engage in recreation. Cyclist were the least likely group to engage in multi-day recreation (n=27), but those who did traveled the greatest distances from home (greater than 600 km) proportionately more often (0.22 trips per person) than members of the other groups (0.13 trips per person for consumptive activities, 0.07 for water sports, and 0.08 for winter activities). 35
43 3.7.4 Demographics Once again, demographic data in this section is taken from all respondents who reported participation in an activity, not only those who indicated the activity was a Favourite Activity. Table 26. Average Age and Gender Proportions (Activity Groups) Consumptive Activities & Horseback Riding (n=297) Biking Activities (n=128) Water Activities (n=251) Winter Activities (n=285) Average Age Male 45.9% 64.3% 36.6% 41.5% Female 53.1% 35.7% 62.6% 57.8% Summary for Age and Gender: On average, cyclists were the oldest of the four groups at years of age and participants in water activities were the youngest (47.17 years old). Cyclists had the largest gender gap for participation with 64.3% of participants being male and 35.7% being female. Water sports also demonstrate a substantial gender gap with 62.6% of respondents being women and 36.6% men. Consumptive activities had the smallest gender gap with 45.9% of respondents being men and 53.1% women. 36
44 Table 27. Highest Educational Level Obtained Proportions (Activity Groups) Highest Educational Level Biking Activities (n=129) Water Activities (n=254) Less than High School Completed High School Trades or Non- University Certificate Some Post Secondary Completed Post Secondary Post- Graduate Degree Consumptive Activities & Horseback Riding (n=303) Winter Activities (n=289) 2.0% 0.8% 1.2% 0.7% 12.5% 3.1% 9.1% 7.6% 30.4% 32.6% 28.7% 25.6% 15.8% 10.1% 18.5% 13.1% 27.4% 33.3% 27.2% 34.9% 11.6% 18.6% 15.0% 17.3% Summary for Highest Educational Level Obtained: The most common education level reported for participants in consumptive activities and water sports was Trades or Non-University Certificate (30.4% and 28.7% of respondents respectively) Most respondents for each activity reported a bachelor s degree or higher. Cyclist were the most likely group to pursue education beyond high school (94.6% with at least some post-secondary education). Cyclists and participants in winter activities were the only groups that were statistically more likely to have pursued education beyond high school rather than not (p = for both groups). 37
45 Table 28. Household Income Proportions (Activity Groups) Household Income $19,999 or less $20,000 to $39,999 $40,000 to $59,999 $60,000 to $79,999 $80,000 to $99,999 $100,000 to $124,999 $125,000 to $149,999 $150,000 to $199,999 $200,000 or more Consumptive Activities & Horseback Riding (n=303) Biking Activities (n=129) Water Activities (n=254) Winter Activities (n=289) 4.3% 2.3% 2.8% 3.1% 7.3% 5.4% 10.6% 8.7% 13.5% 16.3% 14.6% 17.6% 16.2% 17.1% 13.0% 11.1% 13.9% 13.2% 15.4% 14.5% 13.2% 17.1% 15.7% 16.3% 6.9% 6.2% 5.9% 6.2% 4.0% 7.8% 4.7% 4.2% 1.7% 4.7% 2.0% 2.4% Summary for Household Income: The most common earnings bracket for participants in winter activities ($40,000- $59,999) was lower than for the other three activity groups. Cyclists were the most likely activity group to report earnings greater than $200,000 per year (4.7%). Participants in all activity groups were statistically more likely to report household earnings below $100,000 than above (p = 0.05). 38
46 Table 29. Ethnic Group Most Identified With Proportions (Activity Groups) Ethnic Group Most Consumptive Activities & Biking Activities Water Activities (n=254) Winter Activities (n=289) Identified With Horseback Riding (n=303) (n=129) First Nations 2.6% 2.3% 2.0% 1.4% Caucasian 76.9% 79.8% 81.9% 74.4% Middle Eastern 0.7% 0.8% 0.4% 0.3% South Asian 1.7% 0.0% 1.6% 2.4% Asian 10.9% 10.9% 8.3% 14.2% Pacific Islander 0.3% 0.0% 0.4% 0.3% Black 0.3% 0.0% 0.4% 0.3% Latino 0.7% 0.0% 0.4% 0.0% Other 1.7% 1.6% 0.8% 2.1% Summary for Ethnic Group Most Identified With: The vast majority of respondents in all activity groups identified most strongly with the Caucasian ethnicity (76.9% for consumptive activities, 79.8% of cyclists, 81.9% for water sports, and 74.4% of participants in winter activities). The second most common ethnicity reported for all groups was Asian (10.9% for consumptive activities and cyclists, 8.3% for water sports, and a surprisingly high 14.2% of participants in winter activities). 39
47 Table 30. Group Affiliation Proportions (Activity Groups) Consumptive Activities & Horseback Riding (n=303) Biking Activities (n=129) Water Activities (n=254) Members of Organized Groups Online Group Informal Group Traditional Group Winter Activities (n=289) 8.9% 10.9% 8.3% 10.7% 1.3% 1.6% 0.8% 2.1% 2.6% 5.4% 4.3% 4.5% 6.9% 6.2% 5.1% 6.9% Summary for Group Affiliation: Cyclists (10.9%) and participants in winter activities (10.7%) were more likely to be members of organized groups than participants in consumptive activities (8.9%) and water sports (8.3%). Traditional clubs were the most common group affiliation for participants in all activity groups, and online club membership was least common. 40
48 4. Discussion The results of this research contribute significantly to the present understanding of the importance of outdoor recreation to the residents of British Columbia. The findings reported above suggest that half of the population of BC (49.5%) engages in some form of outdoor recreation at least once a year, and approximately the same proportion (48.2%) take part in nonmotorized outdoor recreation activities. These figures are consistent with those presented by other researchers with respect to North American participation rates (Outdoor Foundation, 2012). The Outdoor Foundation (2012) also suggests an upward trend in the proportion of people participating in non-motorized outdoor recreation activities, underscoring the importance of this kind of data to inform land use planning decisions that best serve a growing user base. It should also be noted that our research employed a strict definition of outdoor recreation that excluded primarily urban outdoors activities and imposed a minimum time limit of at least 2 hours on hiking (still the most popular of all activities) in order for it to qualify for consideration in this survey. Research conducted by Tourism BC (2013) suggests that if the definitions employed for the various activities and the criteria for their inclusion were broadened to encompass a wider range of more passive activities such as picnicking and bird watching, and if the time limit on hiking was removed, that participation may grow to as much as 93%. For a full comparison of the research described in this report and the 2013 Tourism BC study, see Appendix 1. The results presented in this report demonstrate that non-motorized outdoor recreationists contribute significantly to the economy of BC. Conservative estimates suggest that residents of the province collectively traveled more than 1.3 billion km to engage in non-motorized outdoor recreation in the year 2012 and that the direct economic contributions of their participation topped $3.5 billion even before equipment purchases were considered. The fact that respondents living outside of the Lower Mainland, where opportunities for pursuing outdoor recreation are more easily accessible, reported higher frequency of participation in single-day trips suggests that the economic contributions of non-motorized recreation are directly linked to the availability of recreation opportunities. Single-day trips alone generated an estimated $2.5 billion in BC in It stands to reason that if recreation opportunities are made more easily accessible to residents living in the province s most densely populated areas, that this figure has the potential to grow even larger. This research was subject to several limitations in its methodology which may have affected the results. First, the use of an internet-based questionnaire has inherent difficulties; for one, researchers are not able to aid individual respondents in their understanding of the survey questions, and individual differences in how respondents interpret questions can influence the manner in which they respond. The use of an online questionnaire also limits potential respondents to a subset of the target population who have access to a computer and the internet. While this is a commonly accepted limitation in modern social scientific research, the subject matter of this study could have warranted the inclusion of less computer savvy respondents. However, any of the relevant sampling methods would have been much more expensive. Second, the use of the existing Research Now panel as a representative sample for distributing the questionnaire may have led to certain response biases. Members of an online survey panel may be more homogeneous in their attitudes and behaviours than a sample collected from a less structured source. Finally the screening method used to filter ineligible respondents from the 41
49 sample was changed midway through the data-collection phase leading to two subsets of the overall sample. Aggregating the responses of these subsets may have impacted the interpretation of results, although all our tests showed that the differences are negligible. For a full discussion of this limitation, see Appendix 1. Further limitations exist with regard to the inclusion of several activities in the nonmotorized classification. Participants in consumptive activities and horseback riding were permitted to continue with the survey only if they engaged in other non-motorized activities that were more in-line with FMCBC s expectations for this survey. As a result, a potentially large number of avid participants in these activities were excluded. This makes the data collected with regard to these few activities unrepresentative of the general population. Limitations also exist with regard to expenditure and distance traveled data for participants Favourite Activities. Respondents were asked to select their most favoured activities about which to provide additional information. This was done to reduce the burden on respondents, but it also may have led to response biases. If a typical respondent chose as a Favourite Activity something that they spend more time and money on than a more casual participant, expense and travel data may have been exaggerated. A number of methods were discussed during the design of the survey for narrowing down the number of activities participants would provide detailed information about, each with their own limitations. Favourite activities were chosen as the preferred method in this case, but future research in this field may view other factors (ex. frequency of participation) as more important. Overall, this research provides very useful information with regards to participation rates for a variety of active outdoor recreation activities. The large number of respondents who engaged in the more accessible summer and winter activities (hiking and snowshoeing, respectively) speaks to the importance of enjoyment of outdoors as part of the regional culture of British Columbians. While future research should monitor participation rates over time to identify trends with respect to popularity, the findings described above can serve as a baseline for this type of research. The figures with respect to economic contributions should also be considered in evaluating the place of outdoor recreation as a means of revenue for the province. Not only do the activities examined by this survey contribute directly to the economy of the province, they do so on a significant scale. Policy makers and land-use planners would do well to consider these contributions in their decision making. 42
50 Appendix 1 Multiple Screening Methods The method for screening eligible respondents was changed during data collection, as the researchers and the market research company together were concerned about the efficiency of the original screening design. The initial screening method (Screener 1) asked potential respondents several general questions (ex. Have you participated in nonmotorized outdoor recreation in BC during the past 12 months?), before presenting them with a full list of activities (See Appendix 1). If respondents indicated that they had engaged in non-motorized outdoor recreation they were allowed to continue, otherwise they were eliminated. The second screening method (Screener 2) was more direct and simply presented respondents with the activity list of all 28 activities considered in the survey, and asked them if they had participated in any of the listed activities during the past 12 months. If at least one non-motorized activity was selected, the participant was allowed to continue. Otherwise they were screened out. Table 31. Participation Rates in Outdoor Recreation Activities by Screening Method (Participation Rates published in the activity study of Tourism BC are listed for comparative purposes) compares the results of the two methods in terms of participation rates in outdoor recreation activities, and also compares the results of this survey with the results of a recent Tourism BC study on participation rates in outdoor recreation (Tourism BC, 2013). Participation rates for most activities were not significantly different between the two screening methods. Comparisons for all other data (frequency of participation, expenditures, distances traveled for participation) did not differ significantly between the two samples, and results have therefore been reported as one joint sample throughout this report. One can think of a number of explanations for the different participation rates between the two screening methods. In the case of all non-motorized activities where differences between the two screening methods exist at the level of significance, participants under Screener 2 reported lower participation rates than those under Screener 1. One explanation for this might be that respondents under Screener 2 were intimidated by the sudden appearance of the long table of activities as their first question. Another explanation could be that the more general questions at the beginning of Screener 1 encouraged respondents to think about their pursuits in a broader sense, leading to increased reporting of participation. These warm up questions may have also helped prime respondents memories with regard to their recreation. 43
51 Table 31. Participation Rates in Outdoor Recreation Activities by Screening Method (Participation Rates published in the activity study of Tourism BC are listed for comparative purposes) Activity Our Research Sig. 2009/10 Outdoor Screener 1 Participation Rate Screener 2 Participation Rate Different? Recreation Study (Tourism BC, 2013) Hiking 41.7% 36.7% Yes 55% Trail Running 9.1% 7.2% Yes Walking/Running = 12% Rock Climbing 1.8% 1.5% No Rock/Mountain Mountaineering 2.0% 1.3% No Climbing = 7% Scrambling 2.3% 0.8% Yes XC Mountain Biking 7.6% 5.8% Yes Mountain biking on Downhill Mountain 1.8% 1.1% No trails with no lift Biking access = 21% Assisted Downhill 1.4% 1.1% No Mountain Biking Sea Kayaking 7.7% 7.1% No 13% Flat Water Kayaking 9.0% 8.9% No Canoeing = 16% White Water Kayaking 1.2% 1.1% No White Water Rafting = 3% Horseback Riding 4.5% 5.1% No 11% Hunting 3.9% 3.9% No Fishing 17.9% 17.7% No Lake = 24% Ocean = 12% ATV Riding 4.7% 6.3% Yes ATVing/4- wheeling/dirt biking = 12% 4X4 Off-Roading 3.4% 5.0% Yes Dirt Biking 2.6% 3.7% No Boating (Motorized) 12.1% 14.7% Yes Lake = 21% Ocean = 15% Snowshoeing 11.7% 10.6% No 24% Cross-Country Skiing 6.9% 5.7% No 16% Ice Climbing 0.4% 0.3% No Out of Bounds Skiing 1.4% 0.9% No In Bounds (Lift 11.5% 9.5% No 19% Assisted) Skiing Heli-Skiing 0.6% 0.6% No Backcountry Skiing 1.5% 1.0% No 6% Snowmobile Trail Riding 2.6% 3.5% No Snowmobiling = 10% Mountain 1.7% 1.6% No Snowmobiling Snowmobile Assisted Skiing 0.9% 0.7% No 44
52 Comparison with Tourism BC Study A study published in January 2013 by Tourism BC attempted to answer similar research questions to those posed by the present research. Although several activities that were studied in the present research also appear in the Tourism BC study, the methods used by the two research teams and definitions presented to respondents are sufficiently different to make both works relevant and valuable in the context of outdoor recreation research in British Columbia. Our study focused on participation rates in non-motorized, active, outdoor recreation activities (ex. Hiking, skiing, snowshoeing). For purposes of comparison, participants in our research were also invited to report participation in motorized outdoor activities. However, since these activities were not the primary focus of this research, data regarding frequency of participation and expenditures were not collected for them. Two consumptive activities (hunting and fishing) were included in the present study, as well as horseback riding, which could be considered a more passive form of recreation. It is important to note that these activities were exceptional and only made up a minor part of the analysis presented above. The reason we focused on non-motorized, active outdoor recreation was because the funding organization for our research (The Federation of Mountain Clubs of BC) has a mandate to promote these activities. By comparison, the research published by Tourism BC was directed by a much broader focus. The activity list presented to respondents included a wide range of passive outdoor activities (ex. Picnicking, visiting a beach, whale watching, bear watching, bird watching, etc.) as well as both passive and active motorized activities (ex. Snowmobiling, RV camping, etc.) The research presented by Tourism BC also collected information about the type of land on which recreation took place (crown land, protected areas, private land, etc.) Our research did not address this concern. Methodological differences may have played a role in the different participation rates observed between the two studies. Whereas our research contacted a random sample of BC residents who were part of the Research Now respondent panel for an online survey, Tourism BC contacted a stratified random sample of BC residents in proportions that reflected the populations of predefined regions within the province for a telephone survey. Therefore, the samples are not only structurally different, but respondents in the Tourism BC study also had the opportunity to ask clarifying questions whereas those responding to our study s online survey did not. These differences have the potential to influence response rates. Some, but not all activities that appear in both studies are directly comparable. However, even if an activity was defined similarly, the method of data collection still differed between the two studies. Differences in definition are apparent in the present study s use of Hiking (for 2 or more hours) versus the presentation of Hiking - Day Trip and Hiking Multi-Day Backpacking Trip in the Tourism BC research. Also different were definitions of fishing (the Tourism BC research separates freshwater and saltwater forms), mountain biking (the present research separates cross-country and mountain 45
53 forms), motorized boating (Tourism BC separates freshwater and saltwater forms), rock climbing/mountaineering/scrambling (presented separately in the present research and collectively in the Tourism BC study), and several others. Because of these differences, the participation rates presented by our research and those of the Tourism BC study are often quite different (See Table 31). The activities measured by both studies demonstrate universally higher participation rates in the Tourism BC research, suggesting a systematic difference between the two studies that can be explained by the previously outlined differences in methodology. Namely, the ability of respondents to ask clarifying questions over the phone and the broader focus and definitions used for many activities in the Tourism BC study may have helped increase the likelihood of participation being reported. 46

54 Appendix 2 Screener 1 47
55 Screener 2 Activity List 48

56 Survey: 49

57 50
58 51
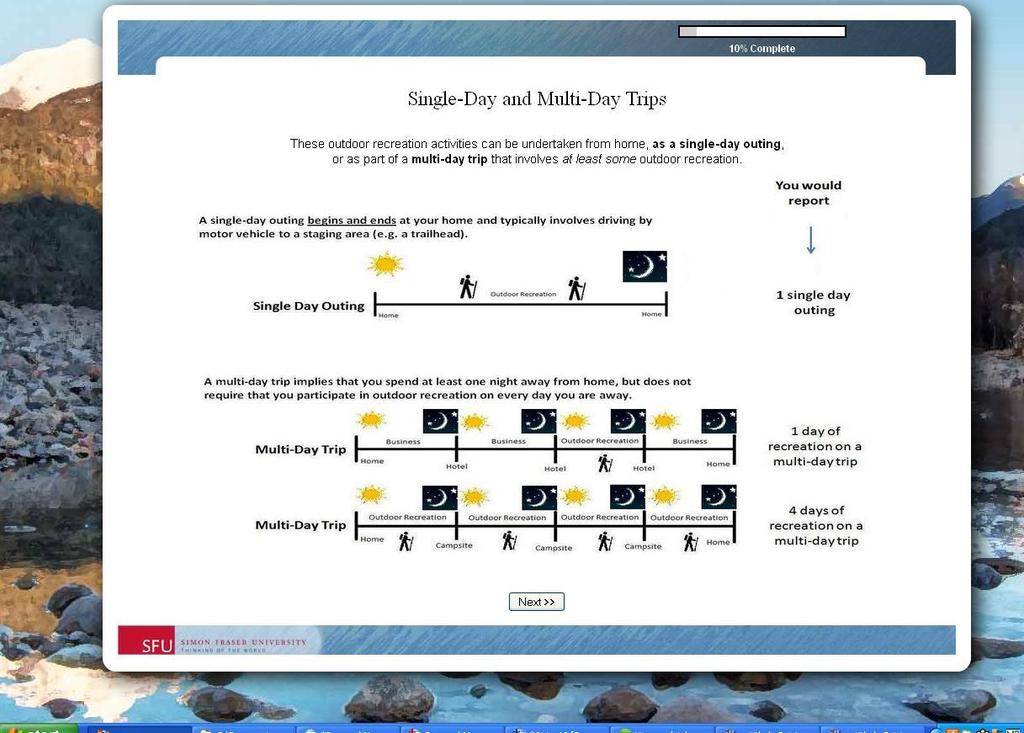
59 52
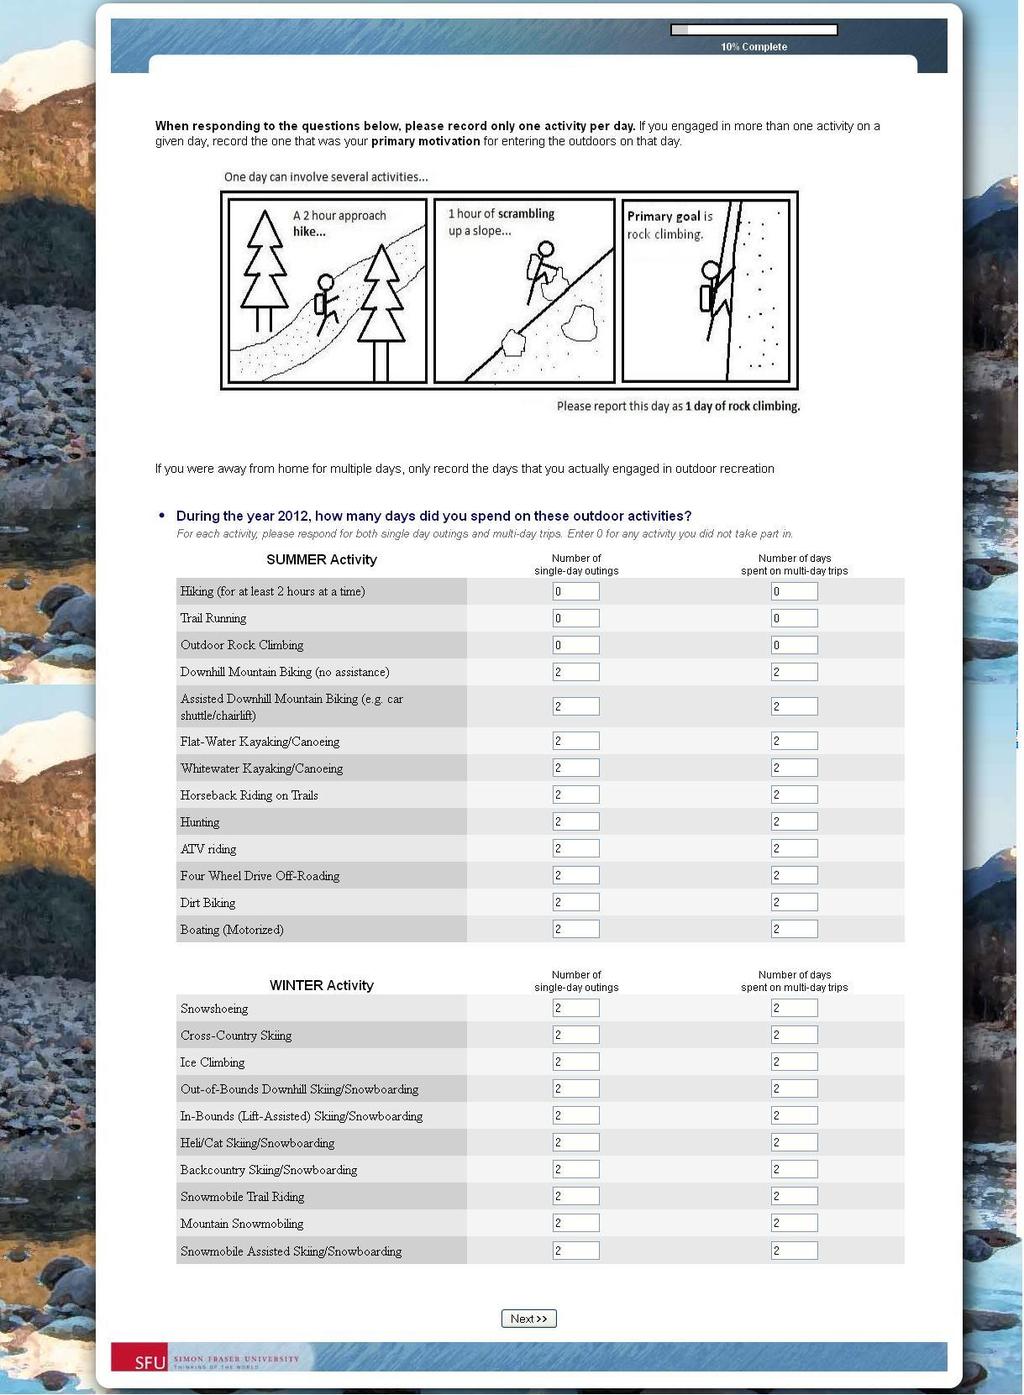
60 53
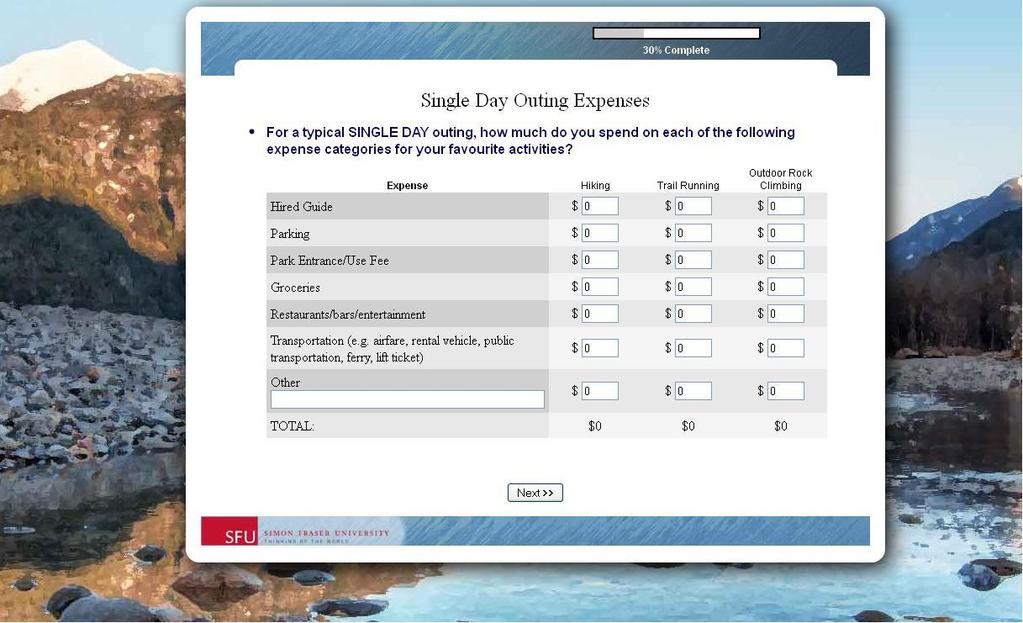
61 54
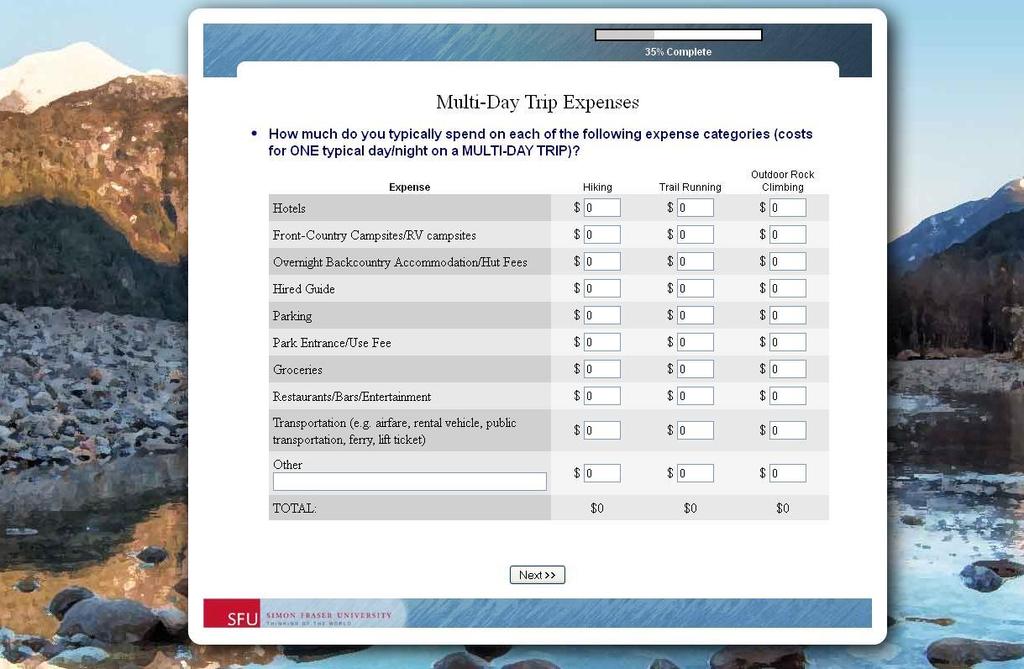
62 55
63 56
64 57
65 58
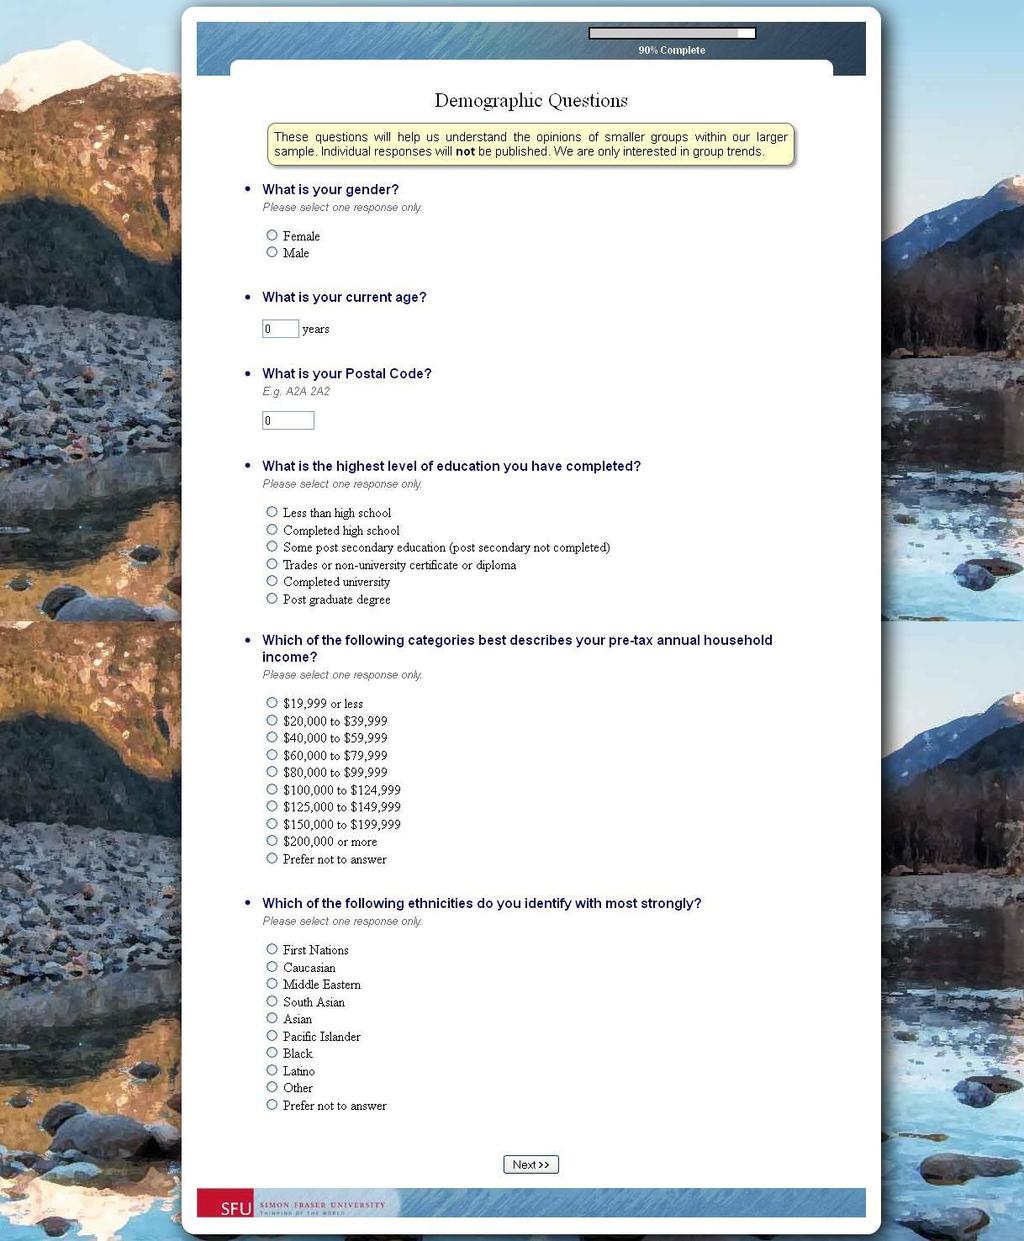
66 59
67 60
Recreationists on the Gifford Pinchot National Forest: A Survey of User Characteristics, Behaviors, and Attitudes
 Recreationists on the Gifford Pinchot National Forest: A Survey of User Characteristics, Behaviors, and Attitudes by Alan R. Graefe The Pennsylvania State University Robert C. Burns University of Florida
2009/10 OUTDOOR RECREATION STUDY BC RESIDENT PARTICIPATION. January 2013
 1 2009/10 OUTDOOR RECREATION STUDY BC RESIDENT PARTICIPATION January 2013 2009/10 Outdoor Recreation Study Prepared by: NRG Research Group Liddie Sorensen-Lawrence, MBA Tel: 604-676-5649 Email: lsl@nrgresearchgroup.com
2009 Muskoka Airport Economic Impact Study
 2009 Muskoka Airport Economic Impact Study November 4, 2009 Prepared by The District of Muskoka Planning and Economic Development Department BACKGROUND The Muskoka Airport is situated at the north end
Juneau Household Waterfront Opinion Survey
 Juneau Household Waterfront Opinion Survey Prepared for: City and Borough of Juneau Prepared by: April 13, 2004 TABLE OF CONTENTS Executive Summary...1 Introduction and Methodology...6 Survey Results...7
2012 In-Market Research Report. Kootenay Rockies
 2012 In-Market Research Report Kootenay Rockies Executive Summary This report summarizes key highlights for the Kootenay Rockies (KR) region taken from the British Columbia In-Market study conducted in
Planning Future Directions. For BC Parks: BC Residents' Views
 Planning Future Directions For BC Parks: BC Residents' Views Summary Report Ministry of Water, Land and Air Protection Province of British Columbia April, 2002 National Library of Canada Cataloguing in
A TYPOLOGY OF CULTURAL HERITAGE ATTRACTION VISITORS
 University of Massachusetts Amherst ScholarWorks@UMass Amherst Tourism Travel and Research Association: Advancing Tourism Research Globally 2007 ttra International Conference A TYPOLOGY OF CULTURAL HERITAGE
Estimating Tourism Expenditures for the Burlington Waterfront Path and the Island Line Trail
 A report by the University of Vermont Transportation Research Center Estimating Tourism Expenditures for the Burlington Waterfront Path and the Island Line Trail Report # 10-003 February 2010 Estimating
Economic Impact Analysis. Tourism on Tasmania s King Island
 Economic Impact Analysis Tourism on Tasmania s King Island i Economic Impact Analysis Tourism on Tasmania s King Island This project has been conducted by REMPLAN Project Team Matthew Nichol Principal
Ontario Arts and Culture Tourism Profile Executive Summary
 Ontario Arts and Culture Tourism Profile Executive Summary Prepared by for Ontario Arts Council November 2012 ONTARIO ARTS AND CULTURE TOURISM PROFILE EXECUTIVE SUMMARY The Ontario Arts Council (OAC) commissioned
Maine Office of Tourism Visitor Tracking Research 2015 Calendar Year Annual Report Regional Insights: Greater Portland & Casco Bay
 Maine Office of Tourism Visitor Tracking Research 2015 Calendar Year Annual Report Regional Insights: Prepared by April 2016 1 1 Table of Contents Research Objectives and Methodology 3 Overnight Visitors:
IATOS 2003 Outdoor Enthusiast Survey CTC Market Research March, 2003
 IATOS 2003 Outdoor Enthusiast Survey CTC Market Research March, 2003 The IATOS Expo (International Adventure Travel and Outdoor Sports Show, Chicago, February 2003) provided the CTC s Outdoor Product Development
Federal Outdoor Recreation Trends Effects on Economic Opportunities
 United States Department of Agriculture Federal Outdoor Recreation Trends Effects on Economic Opportunities The Forest Service National Center for Natural Resources Economic Research is assisting the Federal
Impacts of Visitor Spending on the Local Economy: George Washington Birthplace National Monument, 2004
 Impacts of Visitor Spending on the Local Economy: George Washington Birthplace National Monument, 2004 Daniel J. Stynes Department of Community, Agriculture, Recreation and Resource Studies Michigan State
Tourism Industry Council Tasmania Community Survey 2018 Research Report. May 2018
 Tourism Industry Council Tasmania Community Survey 2018 Research Report May 2018 This report has been prepared by Enterprise Marketing and Research Services 60 Main Road, Moonah TAS 7009 All enquiries
Risk Assessment in Winter Backcountry Travel
 Wilderness and Environmental Medicine, 20, 269 274 (2009) ORIGINAL RESEARCH Risk Assessment in Winter Backcountry Travel Natalie A. Silverton, MD; Scott E. McIntosh, MD; Han S. Kim, PhD, MSPH From the
Outdoor Adventures Department of Recreational Sports Spring 2017
 Outdoor Adventures Department of Recreational Sports Spring 2017 Background The Department of Recreational Sports maintains a more than 400,000 square foot facility visited by thousands of students, faculty,
Maine Office of Tourism Visitor Tracking Research 2014 Calendar Year Annual Report Regional Insights: Greater Portland & Casco Bay
 Maine Office of Tourism Visitor Tracking Research 2014 Calendar Year Annual Report Regional Insights: Prepared by May 2015 1 1 Table of Contents Research Objectives and Methodology 3 Overnight Visitors:
Domestic Tourism Survey 2016
 STATISTICAL RELEASE P0352.1 Domestic Tourism Survey 2016 January to December 2016 Embargoed until: 04 September 2017 10:30 ENQUIRIES: FORTHCOMING ISSUE: EXPECTED RELEASE DATE User Information Services
Appendix A BC Provincial Parks System Goals
 Appendix A BC Provincial Parks System Goals The British Columbia Provincial Parks System has two mandates: To conserve significant and representative natural and cultural resources To provide a wide variety
Visitor Profile - Central Island Region
 TOURISM LABOUR MARKET RESEARCH PROJECT 2003 The Project The Tourism Labour Market Research Project, was designed to study the tourism labour market throughout the Vancouver Island region. The Visitor Survey
San Francisco Municipal Transportation Agency (SFMTA) Travel Decision Survey 2012
 Travel Decision Survey 2012") Note: The weighting used in this report is not consistent with Travel Decision Surveys (TDS) 2013 and 2014, and findings from this report should not be compared with findings from TDS 2013 and TDS 2014.
Note: The weighting used in this report is not consistent with Travel Decision Surveys (TDS) 2013 and 2014, and findings from this report should not be compared with findings from TDS 2013 and TDS 2014.
2013 IRVING HOTEL GUEST SURVEY Final Project Report
 2013 IRVING HOTEL GUEST SURVEY Final Project Report Research prepared for the Irving Convention & Visitors Bureau by Destination Analysts, Inc. Table of Contents SECTION 1 Introduction 2 SECTION 2 Executive
JATA Market Research Study Passenger Survey Results
 JATA Market Research Study Passenger Survey Results Prepared for the Jackson Area Transportation Authority (JATA) April, 2015 3131 South Dixie Hwy. Suite 545 Dayton, OH 45439 937.299.5007 www.rlsandassoc.com
Travel Decision Survey Summary Report. San Francisco Municipal Transportation Agency (SFMTA)
") Note: The weighting used in this report is not consistent with Travel Decision Surveys (TDS) 2013 and 2014, and findings from this report should not be compared with findings from TDS 2013 and TDS 2014.
Note: The weighting used in this report is not consistent with Travel Decision Surveys (TDS) 2013 and 2014, and findings from this report should not be compared with findings from TDS 2013 and TDS 2014.
IRIS Internet Research Information Series
 *************************************************** IRIS Internet Research Information Series **************************************************** OUTDOOR RECREATION ACTIVITY TRENDS: What s Growing, What
The Economic Impacts of Cultural and Sport Tourism in Canada 2007
 The Economic Impacts of Cultural and Sport Tourism in Canada 2007 The Outspan Group Inc. The Economic Impacts of Cultural and Sport Tourism in Canada 2007 March 2009 ISBN: 978-1-100-13917-3 Catalogue number:
Maine Office of Tourism Visitor Tracking Research 2015 Calendar Year Annual Report Canadian Visitors
 Maine Office of Tourism Visitor Tracking Research 2015 Calendar Year Annual Report Prepared by May 2016 1 1 Table of Contents Research Objectives and Methodology 4 Canadian Overnight Visitors: Traveler
2014 NOVEMBER ECONOMIC IMPACTS AND VISITOR PROFILE. Prepared By:
 2014 NOVEMBER ECONOMIC IMPACTS AND VISITOR PROFILE Prepared By: Sisters Folk Festival Economic Impacts and Visitor Profile September 5-7, 2014 November 2014 Prepared for Sisters Folk Festival, Inc. Sisters,
NAPA VALLEY VISITOR INDUSTRY 2012 Economic Impact Report
 Join Visit Napa Valley NAPA VALLEY VISITOR INDUSTRY 2012 Economic Impact Report Research prepared for Visit Napa Valley by Destination Analysts, Inc. Table of Contents SECTION 1 Introduction 2 SECTION
Perth & Kinross Council. Community Planning Partnership Report June 2016
 Perth & Kinross Council Community Planning Partnership Report June 2016 Contents Foreword... 3 Section 1: Spring 2016 destination follow up of 2014/15 school leavers... 4 Background... 4 Section A: Initial
Trail Use in the N.C. Museum of Art Park:
 Trail Use in the N.C. Museum of Art Park: New Connections, New Visitors Jacqueline MacDonald Gibson, PhD Daniel Rodriguez, PhD Taylor Dennerlein, MSEE, MCRP, EIT Jill Mead, MPH Evan Comen University of
Maine Office of Tourism Visitor Tracking Research 2016 Calendar Year Annual Report Regional Insights: Mid-Coast. Prepared by
 Maine Office of Tourism Visitor Tracking Research 2016 Calendar Year Annual Report Regional Insights: Prepared by April 2017 Table of Contents Research Objectives and Methodology 3 Overnight Visitors:
2015 IRVING HOTEL GUEST SURVEY Final Project Report
 2015 IRVING HOTEL GUEST SURVEY Final Project Report Research prepared for the Irving Convention & Visitors Bureau by Destination Analysts, Inc. Table of Contents S E C T I O N 1 Introduction 2 S E C T
A Profile of Nonresident Travelers through Missoula: Winter 1993
 University of Montana ScholarWorks at University of Montana Institute for Tourism and Recreation Research Publications Institute for Tourism and Recreation Research 6-1-1994 A Profile of Nonresident Travelers
State Park Visitor Survey
 State Park Visitor Survey Methods, Findings and Conclusions State s Department of Recreation, Park and Tourism Management surveyed state park visitor and trip characteristics, and collected evaluations
Case study: outbound tourism from New Zealand
 66 related crime, less concerned about the stability and certainty offered by booking a package holiday, and may choose to be independent travellers, organizing their travel and itinerary themselves. Tourists
State-Level Economic Contributions of Active Outdoor Recreation Technical Report on Methods and Findings
 State-Level Economic Contributions of Active Outdoor Recreation Technical Report on Methods and Findings April 13, 2007 Prepared by Southwick Associates, Inc. Fernandina Beach, Florida For: Outdoor Industry
Department of Agricultural and Resource Economics, Fort Collins, CO
 June 2007 EDR 07-15 Department of Agricultural and Resource Economics, Fort Collins, CO 80523-1172 http://dare.colostate.edu/pubs OF WINE AND WILDLIFE: ASSESSING MARKET POTENTIAL FOR COLORADO AGRITOURISM
RESEARCH AND PLANNING FORT STEELE HERITAGE TOWN VISITOR STUDY 2007 RESULTS. May 2008
 RESEARCH AND PLANNING FORT STEELE HERITAGE TOWN VISITOR STUDY 2007 RESULTS May 2008 Research and Planning Tourism British Columbia 300-1803 Douglas St. Box 9830 Stn. Prov. Gov t. Victoria, BC V8W 9W5 Web:
Produced by: Destination Research Sergi Jarques, Director
 Produced by: Destination Research Sergi Jarques, Director Economic Impact of Tourism Epping Forest - 2014 Economic Impact of Tourism Headline Figures Epping Forest - 2014 Total number of trips (day & staying)
Produced by: Destination Research Sergi Jarques, Director
 Produced by: Destination Research Sergi Jarques, Director Economic Impact of Tourism Oxfordshire - 2015 Economic Impact of Tourism Headline Figures Oxfordshire - 2015 Total number of trips (day & staying)
MT SCORP Resident Travel for Outdoor Recreation in Montana
 MT SCORP Resident Travel for Outdoor Recreation in Montana Elizabeth Covelli Metcalf, Ph.D.. Norma Polovitz Nickerson, Ph.D. 0 College of Forestry and Conservation Phone (406) 243-5686 32 Campus Dr. #1234
Commissioned by: Economic Impact of Tourism. Stevenage Results. Produced by: Destination Research
 Commissioned by: Produced by: Destination Research www.destinationresearch.co.uk December 2016 Contents Page Introduction and Contextual Analysis 3 Headline Figures 5 Volume of Tourism 7 Staying Visitors
Economic Impact of Tourism. Hertfordshire Results. Commissioned by: Visit Herts. Produced by:
 Commissioned by: Visit Herts Produced by: Destination Research www.destinationresearch.co.uk December 2016 Contents Page Introduction and Contextual Analysis 3 Headline Figures 5 Volume of Tourism 7 Staying
2007 SUNSHINE COAST VISITOR STUDY FINDINGS
 RESEARCH & PLANNING 2007 SUNSHINE COAST VISITOR STUDY FINDINGS February 2009 Research & Planning, Tourism British Columbia 3 rd Floor, 1803 Douglas Street Victoria, British Columbia V8T 5C3 Web: www.tourismbc.com/research
Proof of Concept Study for a National Database of Air Passenger Survey Data
 NATIONAL CENTER OF EXCELLENCE FOR AVIATION OPERATIONS RESEARCH University of California at Berkeley Development of a National Database of Air Passenger Survey Data Research Report Proof of Concept Study
Maine Office of Tourism Visitor Tracking Research 2012 Calendar Year Annual Report Regional Insights: Maine Lakes and Mountains
 Maine Office of Tourism Visitor Tracking Research 2012 Calendar Year Annual Report Regional Insights: Maine Lakes and Mountains Prepared by April 2013 1 Introduction and Methodology 2 The Maine Office
The Economic Impact of Expenditures By Travelers On Minnesota s Northeast Region and The Profile of Travelers. June 2005 May 2006
 The Economic Impact of Expenditures By Travelers On Minnesota s Northeast Region and The Profile of Travelers Prepared for: Explore Minnesota Tourism State of Minnesota and Minnesota Arrowhead Association
Maine Office of Tourism Visitor Tracking Research 2015 Calendar Year Annual Report Regional Insights: Mid-Coast
 Maine Office of Tourism Visitor Tracking Research 2015 Calendar Year Annual Report Regional Insights: Prepared by April 2016 1 1 Table of Contents Research Objectives and Methodology 3 Overnight Visitors:
NAPA VALLEY VISITOR INDUSTRY 2016 Economic Impact Report
 NAPA VALLEY VISITOR INDUSTRY 2016 Economic Impact Report Research prepared for Visit Napa Valley by Destination Analysts, Inc. Table of Contents S E C T I O N 1 Introduction 2 S E C T I O N 2 Executive
ARRIVAL CHARACTERISTICS OF PASSENGERS INTENDING TO USE PUBLIC TRANSPORT
 ARRIVAL CHARACTERISTICS OF PASSENGERS INTENDING TO USE PUBLIC TRANSPORT Tiffany Lester, Darren Walton Opus International Consultants, Central Laboratories, Lower Hutt, New Zealand ABSTRACT A public transport
NAPA VALLEY VISITOR INDUSTRY 2014 Economic Impact Report
 NAPA VALLEY VISITOR INDUSTRY 2014 Economic Impact Report Research prepared for Visit Napa Valley by Destination Analysts, Inc. Table of Contents SECTION 1 Introduction 2 SECTION 2 Executive Summary 5 SECTION
Economic And Social Values of Vermont State Parks 2002
 Economic And Social Values of Vermont State Parks 2002 Executive Summary Prepared for Vermont State Parks Department of Forest and Parks and Recreation Prepared by: Alphonse H. Gilbert Robert E. Manning
The Economic Impact of Tourism on Scarborough District 2014
 The Economic Impact of Tourism on Scarborough District 2014 Prepared by: Tourism South East Research Unit 40 Chamberlayne Road Eastleigh Hampshire SO50 5JH CONTENTS 1. Summary of Results 1 2. Table of
2004 SOUTH DAKOTA MOTEL AND CAMPGROUND OCCUPANCY REPORT and INTERNATIONAL VISITOR SURVEY
 2004 SOUTH DAKOTA MOTEL AND CAMPGROUND OCCUPANCY REPORT and INTERNATIONAL VISITOR SURVEY Prepared By: Center for Tourism Research Black Hills State University Spearfish, South Dakota Commissioned by: South
IPSOS / REUTERS POLL DATA Prepared by Ipsos Public Affairs
 Ipsos Poll Conducted for Reuters Airlines Poll 6.30.2017 These are findings from an Ipsos poll conducted June 22-29, 2017 on behalf Thomson Reuters. For the survey, a sample of roughly 2,316 adults age
Agritourism in Missouri: A Profile of Farms by Visitor Numbers
 Agritourism in Missouri: A Profile of Farms by Visitor Numbers Presented to: Sarah Gehring Missouri Department of Agriculture Prepared by: Carla Barbieri, Ph.D. Christine Tew, MS candidate April 2010 University
The Economic Contributions of Agritourism in New Jersey
 The Economic Contributions of Agritourism in New Jersey Bulletin E333 Cooperative Extension Brian J. Schilling, Extension Specialist in Agricultural Policy Kevin P. Sullivan, Institutional Research Analyst
The Economic Impact of Tourism Brighton & Hove Prepared by: Tourism South East Research Unit 40 Chamberlayne Road Eastleigh Hampshire SO50 5JH
 The Economic Impact of Tourism Brighton & Hove 2013 Prepared by: Tourism South East Research Unit 40 Chamberlayne Road Eastleigh Hampshire SO50 5JH CONTENTS 1. Summary of Results 1 1.1 Introduction 1 1.2
The Economic Impact of Tourism on the District of Thanet 2011
 The Economic Impact of Tourism on the District of Thanet 2011 Prepared by: Tourism South East Research Unit 40 Chamberlayne Road Eastleigh Hampshire SO50 5JH CONTENTS 1. Summary of Results 1 2. Table of
The Economic Impact of Tourism on Calderdale Prepared by: Tourism South East Research Unit 40 Chamberlayne Road Eastleigh Hampshire SO50 5JH
 The Economic Impact of Tourism on Calderdale 2015 Prepared by: Tourism South East Research Unit 40 Chamberlayne Road Eastleigh Hampshire SO50 5JH CONTENTS 1. Summary of Results 1 2. Table of Results Table
Produced by: Destination Research Sergi Jarques, Director
 Produced by: Destination Research Sergi Jarques, Director Economic Impact of Tourism Oxfordshire - 2016 Economic Impact of Tourism Headline Figures Oxfordshire - 2016 number of trips (day & staying) 27,592,106
Maine Office of Tourism Visitor Tracking Research 2013 Calendar Year Annual Report Regional Insights: Downeast & Acadia
 Maine Office of Tourism Visitor Tracking Research 2013 Calendar Year Annual Report Regional Insights: Prepared by May 2014 1 1 Table of Contents Research Objectives and Methodology 3 Overnight Visitors:
NATURE-BASED OUTDOOR RECREATION
 NATURE-BASED OUTDOOR RECREATION Wild Rivers Coast December 4, 2013 DATA & TRENDS Outdoor Recreation Product Image Oregon has a strong outdoor recreation story to tell Source: 2006 Longwoods Overnight
2014 West Virginia Image & Advertising Accountability Research
 2014 West Virginia Image & Advertising Accountability Research November 2014 Table of Contents Introduction....... 3 Purpose... 4 Methodology.. 5 Executive Summary...... 7 Conclusions and Recommendations.....
State of the Shared Vacation Ownership Industry. ARDA International Foundation (AIF)
") State of the Shared Vacation Ownership Industry ARDA International Foundation (AIF) This paper includes a high-level overview of the timeshare industry with a core focus on financial growth, owner demographics
State of the Shared Vacation Ownership Industry ARDA International Foundation (AIF) This paper includes a high-level overview of the timeshare industry with a core focus on financial growth, owner demographics
2006 RENO-SPARKS VISITOR PROFILE STUDY
 2006 RENO-SPARKS VISITOR PROFILE STUDY PREPARED FOR RENO-SPARKS CONVENTION & VISITOR AUTHORITY Study Conducted and Reported by 475 Hill Street, Suite 2 Reno, Nevada 89501 (775) 323-7677 www.infosearchintl.com
Oregon 2009 Visitor Report June, 2010
 Oregon 2009 Visitor Report June, 200 Table of Contents Introduction...... 3 Methodology.. 4 U.S. Travel Market Size & Structure.. 5 Oregon s Travel Market Size & Structure...... Overnight Trip Detail............
2011 Visitor Profile Survey
 2011 Visitor Profile Survey Prepared for RSCVA February 23, 2012 Executive Summary for RSCVA Board of Directors 436 14th Street, Suite 820 Oakland, CA 94612 (510) 844-0680 Research goals 2 Survey a representative
Creating Content for Travellers.
 + Creating Content for Travellers. Comparison of travellers usage and needs for travel content & information with the beliefs of travel bloggers. Results of independent commissioned studies of travellers
Maine Office of Tourism Visitor Tracking Research 2014 Calendar Year Annual Report First Time and Repeat Visitors: A Comparison
 Maine Office of Tourism Visitor Tracking Research 2014 Calendar Year Annual Report First Time and Repeat Visitors: A Comparison Prepared by June 2015 1 1 Table of Contents Research Objectives and Methodology
TOURISM SPENDING IN ALGONQUIN PROVINCIAL PARK
 TOURISM SPENDING IN ALGONQUIN PROVINCIAL PARK Margaret E. Bowman 1, Paul F.G. Eagles 2 1 Ontario Parks Central Zone, 451 Arrowhead Park Road, RR3, Huntsville, ON P1H 2J4, 2 Department of Recreation and
Report on Palm Beach County Tourism Fiscal Year 2007/2008 (October 2007 September 2008)
") Report on Palm Beach County Tourism Fiscal Year 2007/2008 (October 2007 September 2008) Prepared for: Tourist Development Council of Palm Beach County Prepared by: 4020 S. 57 th Avenue Lake Worth, FL 33463
Report on Palm Beach County Tourism Fiscal Year 2007/2008 (October 2007 September 2008) Prepared for: Tourist Development Council of Palm Beach County Prepared by: 4020 S. 57 th Avenue Lake Worth, FL 33463
HEATHROW COMMUNITY NOISE FORUM
 HEATHROW COMMUNITY NOISE FORUM 3Villages flight path analysis report January 216 1 Contents 1. Executive summary 2. Introduction 3. Evolution of traffic from 25 to 215 4. Easterly departures 5. Westerly
EXPO 88 IMPACT THE IMPACT OF WORLD EXPO 88 ON QUEENSLAND'S TOURISM INDUSTRY QUEENSLAND TOURIST AND TRAVEL CORPORATION GPO BOX 328, BRISBANE, 4001
 EXPO 88 IMPACT THE IMPACT OF WORLD EXPO 88 ON QUEENSLAND'S TOURISM INDUSTRY QUEENSLAND TOURIST AND TRAVEL CORPORATION GPO BOX 328, BRISBANE, 4001 Prepared by The National Centre for Studies in Travel and
Oregon 2011 Visitor Final Report
 Oregon 0 Visitor Final Report Table of Contents Introduction...... 3 Methodology.. U.S. Travel Market Size & Structure..... 5 Oregon Travel Market Size & Structure... Overnight Trip Detail............
Study on Hotel Management Graduates Perceptions and Preferences of Jobs in Hotel Industry in Chennai City
 Study on Hotel Management Graduates Perceptions and Preferences of Jobs in Hotel Industry in Chennai City T.S. Natarajan, Research scholar, Department of Management studies, SCSVMV University, India. E-mail:
Appendix 15.2: Pasha Dere Beach Usage Survey
 Appendix 15.2: Pasha Dere Beach Usage Survey URS-EIA-REP-22375 Table of Contents 15.2 Pasha Dere Beach Usage Survey... 1 15.2.1 Introduction... 1 15.2.2 Beach Surveys... 1 15.2.2.1 Survey Dates, Times
Minnesota River Valley Area Survey Summary Report
 Minnesota River Valley Area Survey Summary Report Report prepared by: Minnesota Department of Natural Resources Office of Management and Budget Services May 2002 ACKNOWLEDGMENTS A number of organizations
Maine Office of Tourism Visitor Tracking Research 2016 Calendar Year Annual Report Regional Insights: Maine Highlands. Prepared by
 Maine Office of Tourism Visitor Tracking Research 2016 Calendar Year Annual Report Regional Insights: Prepared by April 2017 Table of Contents Research Objectives and Methodology 3 Overnight Visitors:
CANADIAN TRAVEL MARKET. Culture & Entertainment Activities While on Trips of One or More Nights. Overview Report.
 CANADIAN TRAVEL MARKET Culture & Entertainment Activities While on Trips of One or More Nights Overview Report February 29, 2008 Prepared by Lang Research Inc. on behalf of: Ontario Ministry of Tourism,
Maine Office of Tourism Visitor Tracking Research 2016 Calendar Year Annual Report Regional Insights: Maine Lakes & Mountains.
 Maine Office of Tourism Visitor Tracking Research 2016 Calendar Year Annual Report Regional Insights: Prepared by April 2017 Table of Contents Research Objectives and Methodology 3 Overnight Visitors:
Produced by: Destination Research Sergi Jarques, Director
 Produced by: Destination Research Sergi Jarques, Director Economic Impact of Tourism North Norfolk District - 2016 Contents Page Summary Results 2 Contextual analysis 4 Volume of Tourism 7 Staying Visitors
Produced by: Destination Research Sergi Jarques, Director
 Produced by: Destination Research Sergi Jarques, Director Economic Impact of Tourism Norfolk - 2016 Contents Page Summary Results 2 Contextual analysis 4 Volume of Tourism 7 Staying Visitors - Accommodation
The Economic Impact of ATV Tourism in New Brunswick by NBATVF Trail Permit Holders
 The Economic Impact of ATV Tourism in New Brunswick by NBATVF Trail Permit Holders 2010 2011 New Brunswick Department of Culture, Tourism and Healthy Living May 17, 2012 Table of Contents Table of Contents...
CANADIAN TRAVEL MARKET. Outdoor Activities While on Trips of One or More Nights. Overview Report. February 29, 2008
 CANADIAN TRAVEL MARKET Outdoor Activities While on Trips of One or More Nights Overview Report February 29, 2008 Prepared by Lang Research Inc. on behalf of: Ontario Ministry of Tourism, Ontario Tourism
Maine Office of Tourism Visitor Tracking Research 2015 Calendar Year Annual Report Regional Insights: Maine Lakes & Mountains
 Maine Office of Tourism Visitor Tracking Research 2015 Calendar Year Annual Report Regional Insights: Prepared by April 2016 1 1 Table of Contents Research Objectives and Methodology 3 Overnight Visitors:
Santa Barbara County Association of Governments 2002 COMMUTE PROFILE
 Santa Barbara County Association of Governments 2002 COMMUTE PROFILE for Santa Barbara, San Luis Obispo and Ventura Counties FINAL REPORT Santa Barbara County Association of Governments - 2002 COMMUTE
Summary Report. Economic Impact Assessment for Beef Australia 2015
 Summary Report Economic Impact Assessment for Beef Australia 2015 September 2015 The Department of State Development The Department of State Development exists to drive the economic development of Queensland.
Restore and implement protected status that is equivalent, or better than what was lost during the mid-1990 s
 THE ROSSLAND RANGE, OLD GLORY AREA. Executive summary. The Friends of the Rossland Range Society, on behalf of the local outdoor community, seeks to accomplish the following with respect to the Old Glory
HOUSEHOLD TRAVEL SURVEY
 HOUSEHOLD TRAVEL SURVEY Household Travel Survey i TABLE OF CONTENTS Page 1.0 INTRODUCTION... 1 2.0 SUMMARY OF TRAVEL... 2 2.1 All-Day Travel Patterns... 2 2.1.1 Automobile Availability... 2 2.1.2 Trip
Maine Office of Tourism Visitor Tracking Research 2014 Calendar Year Annual Report Regional Insights: Maine Lakes & Mountains
 Maine Office of Tourism Visitor Tracking Research 2014 Calendar Year Annual Report Regional Insights: Prepared by May 2015 1 1 Table of Contents Research Objectives and Methodology 3 Overnight Visitors:
Economic Impacts of Campgrounds in New York State
 Economic Impacts of Campgrounds in New York State June 2017 Report Submitted to: Executive Summary Executive Summary New York State is home to approximately 350 privately owned campgrounds with 30,000
O REGON TRAILS SUMMIT. Oregon Trails Summit. Rogue River National Forest
 O REGON TRAILS SUMMIT Oregon Trails Summit 2014 Rogue River National Forest OREGON TRAILS 2015: A VISION FOR THE FUTURE The 2015-2024 Oregon Statewide Trails Plan Why do a trails plan? 2005-2014 Oregon
LATENCY OF TOURISM PERMITS IN THE GREAT BARRIER REEF MARINE PARK AUDIT FOR THE YEAR 2000
 LATENCY OF TOURISM PERMITS IN THE GREAT BARRIER REEF MARINE PARK AUDIT FOR THE YEAR 2 Tourism and Recreation Group December 2 DISCLAIMER The information provided in this Audit is for information and discussion
Economic Impact of Rock Climbing in the Nantahala and Pisgah National Forests
 Economic Impact of Rock Climbing in the Nantahala and Pisgah National Forests JA MES N. M A PLES, PhD MICH A EL J. BR A DLEY, PhD Image Credit: Justin Costner Report submitted to Outdoor Alliance on August
3.0 LEARNING FROM CHATHAM-KENT S CITIZENS
 3.0 LEARNING FROM CHATHAM-KENT S CITIZENS An important aspect in developing the Chatham-Kent Trails Master Plan was to obtain input from stakeholders and the general public. Throughout the course of the
Produced by: Destination Research Sergi Jarques, Director
 Produced by: Destination Research Sergi Jarques, Director Economic Impact of Tourism Norfolk - 2017 Contents Page Summary Results 2 Contextual analysis 4 Volume of Tourism 7 Staying Visitors - Accommodation
Maine Office of Tourism Visitor Tracking Research 2013 Calendar Year Annual Report Regional Insights: Greater Portland & Casco Bay
 Maine Office of Tourism Visitor Tracking Research 2013 Calendar Year Annual Report Regional Insights: Prepared by May 2014 1 1 Table of Contents Research Objectives and Methodology 3 Overnight Visitors: