Recreation Impact Monitoring Analysis and Protocol Development, Glacier Bay National Park
|
|
|
- Jesse Merritt
- 6 years ago
- Views:
Transcription


1 Utah State University From the SelectedWorks of Christopher Monz May, 2015 Recreation Impact Monitoring Analysis and Protocol Development, Glacier Bay National Park K. C. Goonan Christopher Monz, Utah State University B. Bruno T. Lewis Available at:

2 National Park Service U.S. Department of the Interior Natural Resource Stewardship and Science Recreation Impact Monitoring Analysis and Protocol Development Glacier Bay National Park Natural Resource Report NPS/GLBA/NRR 2015/957
, Glacier Bay National Park & Preserve Photograph by Kelly Goonan, Utah State University")
3 ON THIS PAGE Camper-placed rock rings and vegetation loss in Glacier Bay National Park & Preserve Photograph courtesy of Glacier Bay National Park & Preserve ON THE COVER Campsite in Reid Inlet (Survey Area 7), Glacier Bay National Park & Preserve Photograph by Kelly Goonan, Utah State University
4 Recreation Impact Monitoring Analysis and Protocol Development Glacier Bay National Park Natural Resource Report NPS/GLBA/NRR 2015/957 Kelly Goonan, MS 1,, Christopher Monz, Ph.D. 2, Barbara M. Bruno 3, Tania Lewis 4 1 Ph.D. Candidate Utah State University Department of Environment and Society Logan, UT Associate Professor Utah State University Department of Environment and Society Logan, UT Wilderness Coordinator National Park Service Glacier Bay National Park and Preserve Gustavus, AK Wildlife Biologist National Park Service Glacier Bay National Park and Preserve Gustavus, AK May 2015 U.S. Department of the Interior National Park Service Natural Resource Stewardship and Science Fort Collins, Colorado
5 The National Park Service, Natural Resource Stewardship and Science office in Fort Collins, Colorado, publishes a range of reports that address natural resource topics. These reports are of interest and applicability to a broad audience in the National Park Service and others in natural resource management, including scientists, conservation and environmental constituencies, and the public. The Natural Resource Report Series is used to disseminate comprehensive information and analysis about natural resources and related topics concerning lands managed by the National Park Service. The series supports the advancement of science, informed decision-making, and the achievement of the National Park Service mission. The series also provides a forum for presenting more lengthy results that may not be accepted by publications with page limitations. All manuscripts in the series receive the appropriate level of peer review to ensure that the information is scientifically credible, technically accurate, appropriately written for the intended audience, and designed and published in a professional manner. This report received informal peer review by subject-matter experts who were not directly involved in the collection, analysis, or reporting of the data. Views, statements, findings, conclusions, recommendations, and data in this report do not necessarily reflect views and policies of the National Park Service, U.S. Department of the Interior. Mention of trade names or commercial products does not constitute endorsement or recommendation for use by the U.S. Government. This report is available in digital format from the Natural Resource Publications Management website ( To receive this report in a format optimized for screen readers, please irma@nps.gov. Please cite this publication as: Goonan, K., C. Monz, B. Bruno, and T. Lewis Recreation impact monitoring analysis and protocol development: Glacier Bay National Park. Natural Resource Report NPS/GLBA/NRR 2015/957. National Park Service, Fort Collins, Colorado. NPS 132/128528, May 2015 ii
6 Contents Page Contents... iii Tables... v Abstract... vi Introduction... 1 Purpose & Goals... 1 Scientific Background... 1 Approach... 3 Methods, Results, and Discussion... 5 Historical Summary of Glacier Bay Campsite Assessments... 5 Summary of 2012 Campsite Assessment... 9 Comparisons to Historic Data Testing the 2012 Assessment Protocol Test Results Conclusions Implementation Recommendations Literature Cited Appendix I. GLBA Survey Areas Appendix II. Historical Campsite Assessment Summary Appendix III. Number of full assessments completed per survey area each year Appendix IV. Summary of Historical Assessments by Data Source Appendix V. GLBA Data Collection and Handling Recommendations Appendix VI. Glacier Bay National Park Recreation Impact Assessment Protocol v Overview Goal of the Procedural Manual Application to Park Management Staff Training Materials for Collecting Field Data Description of Procedures iii
7 Contents Page Types of Assessments Rapid Assessment Backcountry Campsite Assessment Procedures Survey Area Campsite Suspected Campsite Sensitive Species Vis Created Trail Interstadial Wood Taking Campsite Reference Photos Using the Trimble Nomad GPS Vegetation Reference Photos Cover On Site Cover Off Site Glossary of Terms iv
8 Tables Table 1. Historical summary of campsite assessments by year. Data sources: National Park Service Table 2. Summary of campsite conditions in GLBA 2002/03 (Lewis and Drumheller 2004) Table site attributes, assessment methods, and measurement scale Table 4. Summary of 2012 GLBA Survey Area analysis Table 5. Summary of 2012 Survey Area analysis by survey area Table 6. Summary of campsite conditions in GLBA in Table 7. Summary of campsite conditions by survey area in Table 8. Summary of campsite conditions by survey area in Table 9. Number and percentages of impacts found at campsites by survey area during 2002/03 and 2012 surveys Table 10. Summary of 2012 team surveys by area Table 11. Variability test for continuous measures: summary of campsite conditions by survey area as surveyed by different field teams in Table 12. Variability test for ordinal measures: summary of campsite conditions by survey area as surveyed by different field teams in Table 13. Variability test for campsite substrate: summary of campsites detected in different mineral substrates as surveyed by different field teams in Table 14. Variability test for campsite substrate: summary of campsites detected in different vegetation types as surveyed by different field teams in Page v
9 Abstract This report describes a revised and updated recreation impact assessment protocol developed for Glacier Bay National Park (GLBA). It includes an analysis of historical campsite assessment data, a summary of data collected during development of the revised protocol, recommendations for implementation and all procedures necessary to conduct a baseline recreation impact assessment in coastal areas of Glacier Bay National Park. vi
10 Introduction Purpose & Goals This recreation impact assessment protocol is designed to measure backcountry campsite conditions in coastal areas of Glacier Bay National Park (GLBA). It will be the foundation of an ongoing monitoring program, should the park choose to establish a long-term inventory and assessment program for recreation impacts along the shores of Glacier Bay proper. Specific objectives for an inventory and assessment program would be: 1. Provide initial recreational campsite condition information (current location, number, and condition of campsites and other recreation impacts) in a format conducive to the formation and the evaluation of decisions regarding the management of backcountry camping resources. 2. Provide cumulative and ongoing campsite information that monitors changes in campsite location, number, and condition over time. Scientific Background Recent trends in outdoor recreation participation in the United States suggest that public demand for nature-based recreation opportunities and appreciation of natural areas continues to be prevalent in our society (Cordell 2012). Associated with increasing visitation are human disturbances and impacts to the natural resources of national parks, forests, and wilderness areas (Cole 2004; Monz et al., 2010). Understanding these impacts and tolerance thresholds of ecosystems to human use are key components of contemporary park capacity management. Given these trends and concerns about wildland use, managers of protected areas often examine resource change due to wilderness/backcountry camping. Backcountry camping activities have the potential to affect resource conditions both intensively at the on-site scale and extensively due to site expansion and proliferation (Leung and Marion 1999, Cole 2004). Campsites are important from a managerial and visitor perspective as they serve as destinations and focal points for visitor activities, thereby creating nodes of concentrated use. While numerous studies of campsites in parks and protected areas have examined the degree to which visitor use can affect change on site conditions (e.g., Frissell 1978, Cole, 1983, Monz and Twardock 2010) repeated examinations of trends of change over long periods are more rare (Cole and Hall 1992, Marion and Cole 1996, Cole et al. 2008, Twardock et al., 2010). Campsite assessment studies are useful to managers as they often seek to minimize undesirable resource impacts and the associated aesthetic degradation of sites in order to maintain high quality wildland experiences for visitors. Although less common, other types of campsite studies have used experimental designs to examine functional relationships such as use-impact (Cole 1995, Cole and Monz 2004a) and spatial patterns of impact (Cole and Monz 2004b). Several generalizations about campsite conditions can be drawn from this literature. First, over time on established sites, changes in 1
11 the number and areal extent of impact tend to be more pronounced than changes in intensity of impact. For example, Cole and Hall (1992) studied campsites over an 11-year period in the Eagle Cap Wilderness in Oregon, USA and found campsite size increased substantially but mean vegetation cover was relatively stable. Similar results were found over a 20-year period in Grand Canyon National Park (Cole et al. 2008). Second, total impact (increased number of sites and total area of disturbance) tends to increase over time and may be more of a management concern than the level of degradation at individual sites. An assessment of three wilderness areas in the western U.S. found that over a year period, the total number of sites increased substantially in each area, but degraded in resource condition quality in only one area (Cole 1993). A final generalization is that on a given site, most impact occurs at low use levels and subsequent increases in use do not tend to result in proportional increases in impact (Leung and Marion 2000, Cole and Monz 2004a, Cole et al. 2008). Overall, these findings support the importance of campsite assessment studies in informing management actions to maintain resource condition quality. This research examined the important issue of resource impact as a consequence of at-large camping in Glacier Bay National Park (GLBA). Glacier Bay National Park encompasses a vast wilderness of 3.2 million acres, but the majority of backcountry use occurs along the shoreline within Glacier Bay proper. Glacier Bay National Park currently has approximately 3500 annual wilderness visitor use nights occurring in Glacier Bay proper. This visitation level is about two/thirds of that experienced in the late 90s when wilderness visitation was at its peak. All wilderness visitors to Glacier Bay proper are required to acquire permits and receive an orientation, but there is no quota, nor are routes or campsites prescribed. Wilderness visitors choose their campsites on an at-large basis. Most visitors to Glacier Bay s backcountry travel by sea kayak and do most of their camping, cooking, and hiking in the relatively narrow belt of terrain between the ocean and dense upland vegetation. Some of these areas receive more use than others due to proximity to drop off locations and destinations such as tidewater glaciers, ease of access for kayaks, flat areas for camping and often a readily available stream or other freshwater source. There are unique geologic and biotic aspects of the Glacier Bay shoreline that affect how long human impacts persist. Isostatic rebound causes new land to emerge from the intertidal zone while old beach meadows become shrub covered, erasing old campsites and trails. Vast differences in ecosystems across the length of the bay based on the number of years since deglaciation have relevance to soil type and depth, vegetation type, and human impacts. Additionally, the shoreline of Glacier Bay also supports important biophysical park resources. The same wide beaches and flat open meadows that are most attractive to campers are also prime foraging and travel habitat for many animals and birds. It is important for park planning efforts to understand the location, number and condition of campsites and to be able to assess trends in resource conditions and ecological impacts that occur from recreation in Glacier Bay s backcountry in relationship to areas of critical resource concern. The ecological issues, visitor use patterns, and managerial challenges in GLBA are similar to other areas of the south central and southeast Alaska coast where campsite and visitor use assessment studies have been conducted. For example, an extensive study in Prince William Sound, AK, concluded that impacts such as multiple trailing, tree and shrub damage and large sites were prevalent (Twardock et al., 2010). The intensity and extent of impact tended to vary by environment, 2
12 with campsites on soil substrates in upland forests exhibiting less vegetation cover loss, but also being more sensitive to continued disturbance, compared to sites on beach gravel. Impact trends over time showed increases in areal extent of impact, including the development of new sites, but decreases in impact intensity. The study findings suggest that an at-large camping strategy may not be effective at containing site spread and proliferation, impacts often considered the most important to limit. In addition, another context for this work is that campsite assessments conducted in previous years in GLBA utilized protocol parameters and impact definitions that proved difficult to duplicate and resulted in significant variation between observers (Unertl 2011). This project was initiated in an effort to develop and test a campsite condition assessment protocol that reduces variation between observers and provides a rapid and accurate assessment of campsite locations, numbers and impact parameters. GLBA staff favored a rapid assessment protocol, as it requires less time to assess any given campsite when compared to more intensive measurement-based methods and is a way to quickly acquire baseline inventories. Rapid assessments maximize staff and resource efficiency while yielding accurate assessments of campsite condition, whereas intensive measurement-based methods yield more precise information and require more staff time and resources to conduct. To forward this goal, we reviewed the existing campsite assessment protocol and suggested new and more effective protocols based on previous work on the Alaskan coast (Twardock et al., 2010; Monz and Twardock 2010). In addition we conducted an on-site workshop with park staff to refine the protocol in a field setting. We present an analysis of the protocol developed and data collected by field staff during the 2012 summer season in this report. The discussion of findings will cover continued protocol development and refinement; it does not consider the effect of existing conditions on the visitor experience nor the ecological or managerial significance of current conditions. This report summarizes the development of a protocol that can be used to inventory baseline conditions. This baseline would serve as a foundation of a possible longer term and perhaps more intensive monitoring effort. Additional studies that could use this information could include aspects of visitor use monitoring, visitor survey research examining standards of resource and social conditions, visitor impacts to sensitive wildlife species, and spatial modeling of the locations of campsite occurrence. Approach As mentioned previously, considerable work has been conducted on the development of campsite assessment and monitoring protocols. Historically, protocol development can be traced back to the early work of Frissell and Duncan in the 1960 s (Frisell and Duncan 1965) with more recent advancements contributed by Cole (1989) and Marion (1995). These methods, along with some areaspecific modifications have been used extensively in wilderness and backcountry areas, including several long-term studies in coastal Alaska (Twardock et al., 2010; Monz and Twardock 2010; Klasner et al., 2011). Moreover, a significant literature also exists on ecological parameter selection (e.g., Belnap 1998) and these approaches have been applied to visitor impact assessment approaches, including in Alaska (Monz and D Luhosch 2005). The review of the protocol integrated 3
13 the above approaches with GLBA s current experience and findings with the existing protocol and the PI s experience with long-term studies in Alaska. In this effort the authors first reviewed each specific impact parameter in the current protocol in light of the aforementioned developed protocols. This review developed a comprehensive list of possible parameters that could be included. A second step was to take the existing and suggested protocols in the field and examine them critically in collaboration with field staff. This process was iterative and resulted in on the fly modifications to the protocol with both experienced and new seasonal staff alike. Third, protocol suggestions were presented to GLBA staff in a workshop format in June 2012 and suggestions incorporated as needed. Last, the protocol was tested during the summer 2012 field season and included an examination of inter-rater variability, where different groups of evaluators examine campsites in the same survey areas for a comparison of impact parameters. 4
14 Methods, Results, and Discussion Historical Summary of Glacier Bay Campsite Assessments Campsite assessments have been conducted at GLBA for the past four decades, and the methods used have evolved substantially (See Appendix II). Assessments began in the 1970s, with backcountry rangers focusing attention on structures in the backcountry and recording general descriptive information about site conditions and locations on survey sheets and on paper maps. In the early 1980s, rangers began to turn their attention away from structures and began recording evidence of human use (e.g. number of tent sites, fire rings) and recording descriptive information about the condition of vegetation within the vicinity of the site. A more formal assessment protocol was instituted and utilized in 1986 and Specific indicators of disturbance were measured, and each site was assigned a pass/fail rating based on the observer s judgment of site conditions. Survey sheets and paper maps were used for field data collection through the 1980s. While these early campsite assessments were fairly limited in terms of the areas surveyed, new protocols developed in the early 2000s were intended to measure camping impacts throughout GLBA s extensive coastal backcountry (see Lewis and Drumheller 2004). These protocols utilized modern GPS and GIS methodologies to more accurately map the location of campsites and areas of potential camping activity, while information about sites was recorded on paper survey sheets. Survey Areas locations where camping activities where known, suspected, or likely to take place were established to help organize field sampling efforts and data management (see maps in Appendix I). These areas were defined by creating 100 m buffers surrounding 8000 campsite locations from backcountry visitor surveys and identifying sections of beach known to contain 10 or more camping visits. The GPS-based protocol was administered in 2002 and 2003, and a revised version of this protocol was used to assess campsites in The survey area numbers and boundaries established in remain constant to provide the ability to compare future survey data when possible. Data presented in the following discussion of historical campsite assessments at GLBA is limited to the 2002/03 survey. Assessments conducted in the 1970s and 1980s are excluded from the summary of historical data due to the limited ability to identify the locations of sites surveyed in the 1970s and 1980s within the modern survey Areas. The 2011 campsite survey is also excluded from the following analyses due to the poor condition of the data (Table 1). Where appropriate, the 2011 data and assessment protocol are referenced in the discussion to highlight the evolution of the methods used to measure campsites and provide context for the work completed in 2012 when the protocol was reconsidered and updated. 5
15 Table 1. Historical summary of campsite assessments by year. Data sources: National Park Service. 2002/03 a Number of Complete Campsite Assessments 257 b 76 c 265 Number of Survey Areas Represented d 50 e a 142 sites measured in 2002; 133 sites measured in 2003, 18 sites measured in both years (not included in analysis) b Measured sites using 1 assessment per site only. c 6 sites not measured in 2011 d Survey Area was not specified for 47 sites e 56 survey areas were assessed as part of the 2012 assessment (see Table 5). Campsites were located in 50 survey areas. While at first glance the data in Table 1 appear to show that the number of campsites has remained relatively constant over the past decade, it is important to note that campsite assessments took place in different locations in the park each year. The 2002/03 assessments covered 133 survey areas; whereas the 2012 assessment covered 50 survey areas (see Appendix III). The 2002/03 and 2012 assessments have 34 survey areas in common. However, the 2002/03 assessments measured a main core site and its associated satellite sites: a main core site with multiple satellite sites was considered one campsite under this procedure. New definitions and protocols tested in 2012 specify that each individual site (including previously defined satellite sites) be counted and measured. In addition, in 2002/03, field crews measured human impacts in at least one campsite per survey area. If no evidence of camping was found within a survey area, a campsite was chosen that seemed the most likely to be used by campers within the survey area. In 2012 campsites were only measured if there was evidence of camping. It is reasonable to hypothesize that a campsite assessment effort utilizing the 2012 protocol in the 133 survey areas represented by the 2002/03 assessments would result in a much larger number of campsites being detected. Thus we cannot draw reliable inferences concerning trends or changes in the number of backcountry campsites at GLBA. Due to differences in assessment parameters and the variety of methods used, statistical comparisons of the condition of campsites over time are difficult. In 2002/03, human impacts were measured only in presence or absence at each campsite with no attempts to quantify amounts. Campsite size was categorical (small or large including satellite sites), and were not consistently measured. Campsites were given observer ratings which were then used combined with presence/absence of short and long-term impacts to calculate a Final Impact Rating. Descriptive summaries of the 2002/03 campsite assessments are presented in Table 2. 6
16 Table 2. Summary of campsite conditions in GLBA 2002/03 (Lewis and Drumheller 2004). 2002/03 (N = 257) Site Attribute Frequency Percent Trailing Supratidal fire 22 9 Intertidal fire 14 5 Rock ring Trash Human waste 12 5 Firewood 8 3 Structures Size small Size large Observer rating Observer rating Observer rating Observer rating Observer rating Observer rating Impact rating None Impact rating Low Impact rating Med Impact rating - High Campsite areas were measured and categorized as small or large. A small site is less than 250 square meters in size with two or less satellites. A large campsite is 250 square meters and/or has three or more satellites. The area of the campsite included all satellites. 2 Impacts to vegetation were rated by observers on a scale of 0-5 using comparisons between vegetation in the campsite versus vegetation outside the campsite. Off-site vegetation was considered to be natural and thus the control. These ratings, called observer ratings, were assigned in the field while observing the campsite. The observer rating classification was: 0 = Campsite barely distinguishable: none or minimal disturbance of vegetation and/or organic litter. May be a possible/likely camping location, an old campsite that has not seen recent use, or a location of recent one-time use with no signs of permanent damage. May find evidence of a rock tent ring. 1 = Obvious vegetation difference between campsite and control areas indicate impacts of repeated use. Impacts may be subtle such as smaller, more durable species growing within site while taller more sensitive species growing outside of site. Campsite shape may indicate the cause of this difference in vegetation to be from human use instead of natural causes. May find evidence of a rock tent ring. 2 = Ground vegetation worn away from around center of activity. If vegetation is sparse or non-existent in campsite and control area, soil is compressed at center of activity. 3 = Ground vegetation lost (compared to control) on greater than half of the campsite, but humus and litter (if applicable) still present in all but a few areas. 4 = Bare mineral soil obvious (if control is vegetated). Tree roots exposed on the surface. 5 = Soil erosion obvious. Trees reduced in vigor or dead. 3 A final social impact rating was determined for each measured site by calculating an additive score of these impacts, including the site s observer (vegetation) rating, size, long-lived impacts, and short-lived impacts. Ecological impacts such as plant species and sensitive animal species were not included in final impact ratings. Refer to the 2004 Camper Impact Report (Lewis and Drumheller) for details. 7
17 It should be noted that substantial differences among data sources for these years was observed (Appendix IV); several data sources were incomplete or lacking attribute information. Most of the pertinent information on individual campsites was recorded in the comments field. Comments were read and, where possible, information was extracted and coded into new variables or attributes. However, lack of specificity within the comments did not enable us to reliably extract new variables. For example, some comments would specify that a campsite had 3 (or any given number of) satellite sites, while other comments would merely indicate that a campsite had several satellite sites. These inconsistencies limit analyses to descriptive summaries in the current analysis. Quantitative summaries in Table 2 were derived from the 2004 Camper Impact Report (Lewis and Drumheller). Overall, social impacts found in the in the 2002/03 survey were low, with rock rings, footprints and trash reported as the leading indicator of human use at campsites (Lewis and Drumheller 2004). The highest levels of impacts were found to be generally near tidewater glaciers and camper drop-off locations, between camper drop-off locations and glaciers, and/or in areas of steep terrain that concentrate camping. Organic soil was found to conceal impacts seasonally with lush vegetation, while loose mineral substrates were more prone to visible disturbance and tent rocks are more prevalent. Lewis and Drumheller (2004) recommended continuing to evaluate human impacts while initiating new studies examining the effects of human disturbance on sensitive species, using seasonal closures in areas of concern, and increasing education to backcountry users on ways to minimize disturbance. 8
18 Summary of 2012 Campsite Assessment The revised campsite assessment protocol was field tested during the 2012 summer field season. Variables and attributes measured are summarized in Table 3. Tables 4 and 5 present a summary of survey area conditions. Campsite conditions are summarized in Tables 6, 7, and 8. Table site attributes, assessment methods, and measurement scale. Site Attribute Method Used Measurement Scale Survey Area Fire sign Counts Number of supratidal fire signs Litter and trash Ocular estimation Five level trash quantity scale (1 = None; 2 = Handful or less; 3 = Handful to gallon; 4 = Gallon to 5 gal; 5 = >5 gallons) Human waste Counts Number of individual upland/supratidal human waste sites Structures Counts Number of human-made structures encountered Campsite Landing substrate type Observation Cobble, sand, soil, boulder, cobble/sand Campsite substrate type Observation Boulder, cobble, sand, cobble/sand, soil, compacted gravel Campsite size Ocular estimation Four level campsite size scale (1 = small 1 tent pad; 2 = med 2-3 tents; 3 = large 4-5 tents; 4 = x-large - >5 tents) Tent rocks Counts Number of rocks placed within the site Campfire in site Counts Number of campfire signs within site a Vegetation cover on-site and in Six level cover scale (0-5%, 6-25%, 26- Ocular estimation control areas 50%, 51-75%, 76-95%, %) Sparse herbaceous; dense herbaceous; Vegetation types on-site and in Observation open scrub; dense scrub; graminoid; Dryas control areas mat; moss; lichen; other Number of separate events of humancaused Damage to live trees/shrubs Counts damage to trees or shrubs within 2 meter radius of site Litter and trash Ocular estimation Five level trash quantity scale (1 = None; 2 = Handful or less; 3 = Handful to gallon; 4 = Gallon to 5 gal; 5 = >5 gallons) a Ocular estimates of on-site and off-site vegetation cover are used to calculate a metric of relative vegetation cover loss. Control areas are relatively undisturbed areas adjacent to campsites. The control site should be similar to the campsite in slope, tree canopy cover (amount of sunlight penetrating to the forest floor), and other environmental conditions. The intent is to locate an area which would closely resemble the campsite area had the campsite never been used. Please refer to the revised campsite monitoring protocol included at the end of this document for more information (Appendix VI). 9
19 Table 4. Summary of 2012 GLBA Survey Area analysis. Values are means +/- SD for continuous measures and medians +/- range for ordinal measures (N = 265). Site Attribute GLBA 2012 Study Area N a Continuous Measures Fire signs (#) Human waste (#) Structures (#) Ordinal Measures Litter/trash a 56 survey areas were included in the 2012 Survey Area assessment. However, campsites were recorded in survey areas not represented in the Survey Area assessment (see Table 6 dashes indicate no data for a particular field). Survey areas not included in this assessment are 1, 11, 12, 13, 16, 43, 58, 63, 176, and 202. The unique identifier for one survey area assessed in 2012 is missing from the data. Table 5. Summary of 2012 Survey Area analysis by survey area. Values reported are counts a. Values reported represent data from both the Survey Area analysis and Campsite assessment b. Survey Area Fire Signs Trash a Human Waste 10 Structures No. Campsites No. Suspected Campsites
20 Survey Area Fire Signs Trash a Human Waste Structures No. Campsites No. Suspected Campsites a 1 = None; 2 = Handful or less; 3 = Handful to gallon; 4 = Gallon to 5 gal; 5 = >5 gallons b Dashes indicate no data for a given field. Some survey areas may have campsites or suspected sites recorded (e.g. Survey Area 1) but no formal Survey Area assessment was conducted, resulting in missing values for survey area-level impacts (i.e. fire signs, trash, human waste, structures). Campsites are locations of known camping activity, whereas suspected campsites are locations where camping is likely to have occurred and use is suspected, but no clear evidence is present. See protocol (Appendix VI) for more information and definitions/criteria for identifying campsites and suspected campsites. 11
21 Overall, camping areas in the backcountry of Glacier Bay National Park appear lightly impacted. Campfire signs are uncommon, with most areas having no sign of fire present and a maximum of 4 fire signs observed (Survey Area 32). Very little trash was present at camping areas, and evidence of improperly disposed of human waste was only present at four survey areas (areas 5, 9, 34, and 78). Survey Area 9 has the most campsites, with the maximum of 47. A total of 265 backcountry campsites were assessed in the summer of Tent rocks are commonplace at campsites, with a mean of 10.5 tent rocks per campsite observed during field assessments and 232 sites having more than 3 tent rocks present. Campfires were rarely observed within campsites (n = 13, Table 8), and very little damage to trees and shrubs was noted. Campsites exhibit a moderate amount of vegetation cover loss relative to undisturbed areas (mean = 27.9). Relative vegetation cover loss of greater than 50% was observed at approximately forty percent of campsites assessed (Table 8). Sites tend to be small in size, accommodating one tent on average. Ten sites were considered to be larger than a medium on the campsite size scale. Litter occurred at approximately ten percent of sites. Conditions are also presented by survey area (Table 7, Table 8). Table 6. Summary of campsite conditions in GLBA in Values are means +/- SD for continuous measures and medians +/- range for ordinal measures (N = 265). Site Attribute GLBA 2012 Study Area N Continuous Measures Tent rocks (#) Campfire in site (#) Tree/shrub damage (#) a Vegetation cover loss (%) Ordinal Measures Campsite size Litter/trash a Relative vegetation cover loss is calculated using the following formula: Cover loss = 1 - % cover in campsites % cover in control plots To complete the calculation, the median value of the six-category ocular estimate scale for vegetation cover (see Table 3) is used for the % cover in campsite and % cover in control plot fields. x
22 Table 7. Summary of campsite conditions by survey area in Values are means +/- SD for continuous measures and medians +/- range for ordinal measures (N = 265). Survey Area N Tent Rocks Fire Tree Damage Veg. Loss Site Size Trash (n = 8) (n = 30) (n = 5) (n = 10)
23 Table 7. Summary of campsite conditions by survey area in Values are means +/- SD for continuous measures and medians +/- range for ordinal measures (N = 265) (continued). Survey Area N Tent Rocks Fire Tree Damage Veg. Loss Site Size Trash Table 8. Summary of campsite conditions by survey area in Values are frequencies of observed impact parameters (N = 265). Survey Area No. Sites >3 Tent Rocks a Fire Sites Present b >1 Damaged Trees c >50% Veg. Loss d Site Size >Medium e Trash Present f 14
24 Survey Area No. Sites >3 Tent Rocks a Fire Sites Present b >1 Damaged Trees c >50% Veg. Loss d Site Size >Medium e Trash Present f Total a Number of campsites with more than 3 tent rocks observed b Number of campsites with 1 or more fire sites present c Number of campsites with more than 1 tree or shrub exhibiting human-caused damage d Number of campsites with relative vegetation loss greater than 50% e Number of campsites larger than 2 (medium 2-3 tent pads) on the site size scale f Number of campsites with trash present (category 2 or greater on trash quantity scale) Comparisons to Historic Data In reviewing the campsite assessment data from the last decade, several observations lead us to caution against attempting to compare campsite conditions over time. First and foremost is the definition of a campsite. For the 2002/03 assessment, the term campsite is defined as a location where people are known or suspected to have camped, with sites showing evidence of human use considered as established sites, and sites showing no evidence of human use considered not established. In some cases, campsites were divided into main sites and satellites, or smaller camp 15
25 areas associated with a main site. In 2011, a site not measured feature was added, defined as a site with only one short-lived impact (in contrast, a measured site had two or more short-lived impacts or at least one long-lived impact). Site not measured areas were often those that looked like they could be camped at, but it was difficult to discern whether impacts were caused by human use or natural phenomena (i.e. wildlife, storms, tidal, natural patchy vegetation, other disturbance, etc.). The 2012 revised assessment protocol defines a campsite as a location containing clear evidence of recent (within last 2-3 years) camping activity. Evidence of camping includes: vegetation loss or flattened vegetation clearly caused by human use (i.e. in the pattern of a tent, framed by tent rocks, etc.), compressed gravel clearly caused by human use (i.e. in the pattern of a tent, framed by tent rocks, etc.), recently placed tent rocks, camp trash, recent tree or shrub damage, campfire in site. Each individual location of camping activity is considered a campsite: there are no satellite sites. The 2012 protocol also includes a suspected campsite feature, defined as a backcountry area where overnight camping activities are suspected but no clear evidence of such activities is present. At these sites only a location point is measured. Second, differences in the inventory and measurement of campsites exist among protocols and between survey years. In 2002, field crews measured human impacts in at least one campsite per survey area. In 2003, crews attempted to measure impacts on all established campsites within each survey area. If no evidence of camping was found within a survey area, a campsite was chosen that seemed the most likely to be used by campers within the survey area. In addition, main sites were differentiated from satellite sites, and satellite sites were not measured. The most likely camping spot procedure was dropped from the 2011 protocol. The revised 2012 protocol specifies that all individual campsites within a survey area be measured. Third, variables were inconsistently measured. This was most apparent in the campsite size variable included in the 2002/03 survey. Length and width dimensions for each site were measured. In some cases, the dimensions given were for individually impacted sites (e.g. 4 x 5 meters), whereas in other cases dimensions for a very large area able to accommodate camping activity and containing several individually impacted areas were given (e.g. 30 x 40 meters). In an effort to compare impact parameters between years, we eliminated campsites from the 2003/03 data that had no discernable impacts (to align with 2012 definition of a campsite as having evidence of camping) and only evaluated parameters that were consistently measured between years within the same survey areas (n=34), including the number of sites within each survey area containing: tent rock rings, evidence of fire, and trash (Table 9). While the number of sites within each survey area varies substantially for reasons discussed previously, it is interesting to note that tent rocks were equally prevalent (found at 91-92% of sites) between surveys. Many survey areas containing impacts were consistent between years (ex. # 1, 5, 9, 10, etc) while others contained impacts in one year but not the other (ex. # 11, 23, 120, etc). These patterns may be informative and helpful in choosing survey areas for long-term monitoring. 16
26 Table 9. Number and percentages of impacts found at campsites by survey area during 2002/03 and 2012 surveys. 2002/ Survey Area No. Sites No. Sites Tent Rocks % Sites Rocks No. Sites Fire % Sites Fire No. Sites Trash % Sites Trash No. Sites No. Sites Tent Rocks Total % Sites Rocks No. Sites Fire % Sites Fire No. Sites Trash % Sites Trash 17
27 Testing the 2012 Assessment Protocol To evaluate the reliability of the revised protocol, three field teams of two or three individuals independently applied the protocol in five survey areas: areas 3, 4, 5, 9, and 10 in August These sites include Ptarmigan (survey area 9), Reid Inlet (survey area 5) and the beaches south of Reid Inlet (survey areas 4 and 3). This area was selected because of the complexity of terrain, high levels of use and varying size of the survey areas. Surveyors consisted of three seasoned assessors who had been working on campsite assessments for several previous months. The remaining surveyors had much less experience with the new protocol. Inexperienced members were placed with seasoned members and training consisted of a half-hour refresher prior to the start (which was interrupted by a boat maintenance issue), and on the job training for the remaining three days. In retrospect, this training was likely insufficient and contributed to some of the variability found during the test. Test Results Substantial differences can be observed in the number of campsites identified in survey areas 4, 5, 9, and 10 (Table 10). One complication was the creation of new campsites by visitors, as occurred in survey area 4 during the variability test sampling period. But this one-time occurrence does not explain all the differences in campsite identification. The data suggests that most variability occurs in survey areas consisting of cobble/sand and compacted gravel as a mineral substrate and dense scrub or moss as vegetation types. Some modifications were made to the campsite definitions and an additional field was created to require surveyors to provide their rationale for selecting an area as a campsite. Further recommendations to reduce variability amongst observers are made in the conclusion of this document. Table 10. Summary of 2012 team surveys by area. Survey Area Feature Team KNK Team KC Team TB 3 Campsites (#) Suspected campsites (#) Campsites (#) Suspected campsites (#) Campsites (#) Suspected campsites (#) Campsites (#) Suspected campsites (#) Campsites (#) Suspected campsites (#) Overall, few differences were observed between the impact assessments conducted by the three teams. Exceptions were the assessment of off-site vegetation cover in Survey Area 5 (F = 4.151, p- value =.020) and Survey Area 10 (F 3.335, p-value =.042), the number of tent rocks counted in Survey Area 9 (F = 3.535, p-value =.033), and the amount of trash observed in Survey Area 10 (F = , p-value =.000). Differences in the estimation of site size were observed between groups for Survey Areas 4 (F = 7.984, p-value =.007), 5 (F = 3.342, p-value =.042), and 10 (F = , p- value =.000). However the overall differences in estimated campsite size were substantively small. 18
28 Table 11. Variability test for continuous measures: summary of campsite conditions by survey area as surveyed by different field teams in Survey Area Attribute Team KNK Team KC Team TB Mean SD Mean SD Mean SD F- value 3 Tent rocks (#) 5.33 a a a Fire signs (#).00 a a a Tree/shrub damage (#).00 a a a Veg. cover on site a a a Veg. cover off site a a a Tent rocks (#) a a a Fire signs (#).00 a a a Tree/shrub damage (#).00 a a a Veg. cover on site a a a Veg. cover off site a a a Tent rocks (#) 7.20 a a a Fire signs (#).10 a a a Tree/shrub damage (#).00 a a a Veg. cover on site a a a Veg. cover off site a a,b b Tent rocks (#) 8.24 a b a,b Fire signs (#).00 a a a Tree/shrub damage (#).00 a a a Veg. cover on site a a a Veg. cover off site a a a Tent rocks (#) a a a Fire signs (#).00 a a a Tree/shrub damage (#).00 a a a Veg. cover on site 2.50 a a a Veg. cover off site a,b a b Any two teams that share a superscript are not significantly different (p 0.05) according to Bonferroni s least significant difference test. p- value 19
29 Table 12. Variability test for ordinal measures: summary of campsite conditions by survey area as surveyed by different field teams in Survey Team KC Attribute Team KNK Area Team TB F-value p-value 3 Site size 1.33 a 1.00 a 2.50 a Trash 1.00 a 1.00 a 1.33 a Site size 1.43 a 1.00 a 2.50 b Trash 1.00 a 1.00 a 1.00 a Site size 1.37 a,b 1.17 a 1.69 b Trash 1.07 a 1.26 a 1.23 a Site size 1.30 a 1.48 a 1.14 a Trash 1.03 a 1.11 a 1.00 a Site size 1.30 a,b 1.60 a 1.00 b Trash 1.60 a 1.00 b 1.07 b Any two teams that share a superscript are not significantly different (p 0.05) according to Bonferroni s least significant difference test. Measurement scales are: five level trash quantity scale (1 = None; 2 = Handful or less; 3 = Handful to gallon; 4 = Gallon to 5 gal; 5 = >5 gallons); and four level campsite size scale (1 = small 1 tent pad; 2 = med 2-3 tents; 3 = large 4-5 tents; 4 = x- large - >5 tents). Both measurements based on ocular estimates (refer to Table 4). Some differences were observed in the proportion of campsites detected in various mineral substrates, particularly sites on cobble/sand and compacted gravel substrates (Table 12) (Pearson Chi-Square = , p-value =.000). Differences in the proportion of campsites detected in various vegetation types were observed for campsites located in areas where dominant vegetation was listed as dense scrub or moss (Table 13) (Pearson Chi-Square = , p-value =.000). The data suggests that more care should be taken in searching survey areas for campsites in locations where visual detection may be difficult (i.e. areas of dense scrub vegetation) or natural patchiness of vegetation and substrate may make detecting campsites difficult. Sufficient time should be spent training staff to detect and identify campsites in the various vegetation and substrates to decrease variability Table 13. Variability test for campsite substrate: summary of campsites detected in different mineral substrates as surveyed by different field teams in 2012 (Pearson Chi-Square , p-value =.000; Cramer's V =.248, p-value =.000). Campsite Substrate Team KNK (n = 97) Team KC (n = 109) Team TB (n = 55) Frequency Percent Frequency Percent Frequency Percent Cobble 58 a a a 60.0 Cobble/Sand 29 a b a,b 32.7 Compacted 0 a 0 15 b a 0 Gravel Sand 3 a a a 5.5 Soil 7 a a a 1.8 Kruskal-Wallis non-parametric ANOVA. Each superscript letter denotes a subset of Survey Teams whose column proportions do not differ significantly from each other at the.05 level. 20
30 Table 14. Variability test for campsite substrate: summary of campsites detected in different vegetation types as surveyed by different field teams in 2012 (Pearson Chi-Square , p-value =.000; Cramer's V =.328, p=value =.000). Vegetation Type Team KNK (n = 97) Team KC (n = 109) Team TB (n = 55) Frequency Percent Frequency Percent Frequency Percent Dense Herbaceous 6 a a a 1.8 Dense Scrub 0 a 0 0 a 0 3 b 5.5 Dryas Mat 30 a a b 32.7 Graminoid 4 a a a 3.6 Lichen 1 a a.9 1 a 1.8 Moss 1 a b a 5.5 Open Scrub 5 a a a 16.4 Sparse Herbaceous 30 a a a 25.5 Other 0 a 0 0 a 0 0 a 0 Not Specified 20 a b a,b 7.3 Kruskal-Wallis non-parametric ANOVA. Each superscript letter denotes a subset of Survey Teams whose column proportions do not differ significantly from each other at the.05 level. Conclusions In light of the analysis of the existing data and the PI s past experience with campsite assessment work on the Alaskan coast, several conclusions can be made: First, it currently remains difficult to identify any substantive trends in campsite conditions in Glacier Bay s coastal areas, due to clear differences in protocols used and the highly descriptive nature of early assessment work. Hence, the existing historical data at GLBA may provide an important qualitative basis for future quantitative monitoring established by this protocol, but few quantitative comparisons can be made at present. Second, while substantial variation was observed in discovering and classifying sites as established sites or suspect sites, less variation was observed in the site condition ratings and other parameters. This suggests that the protocol can benefit from refinements of the campsite definition and that the field crews must receive adequate training to locate sites and to classify them in a consistent manner. Some of this can be accomplished by narrowing the number of staff involved in conducting the baseline inventory, increasing the amount of staff training, and ensuring ongoing improvement to existing procedures and definitions in the standing protocol. For example, the Staff Training procedures outlined in the recreation impact assessment protocol have been expanded to include additional time in the field to allow staff to gain experience locating and identifying recreation impacts in a variety of geographic settings within GLBA and to calibrate their assessments to ensure reduced variability. The various condition assessment attributes (Table 3) appear to be less susceptible to inter-rater variability and the results suggest little if any refinement is needed. Some discrepancy will always be present in recreation impact assessments where most data are reliant on observer observations minimizing this variation is a continual challenge. Past research has 21
31 commented on this issue (e.g., Cole et al., 2008; Twardock et al., 2010) and consistency in application of a protocol and consistency of observers can help considerably at minimizing variability. Glacier Bay National Park currently has approximately 3500 annual wilderness visitor use nights occurring in Glacier Bay proper and selection of campsites is on an at-large basis. Glacier Bay National Park has a rare opportunity to document general baseline conditions while visitor use numbers are low and management influences are negligible. These baseline conditions will help GLBA articulate the resource and social conditions it wishes to maintain within the park and to manage visitor use to stay within those parameters. Without a baseline inventory and ongoing monitoring of recreation impacts, these tasks are not possible. NPS managers can use the data collected for the following purposes: To assist in the determination of sustainable visitor capacities and desired future conditions for coastal areas of GLBA. As a measure for wilderness character monitoring. To evaluate the success of management actions to minimize visitor created resource impacts. To create boundaries for various use zones. To assist in developing minimum impact suggestions for GLBA visitors. Implementation Recommendations With adequate training for field crews and oversight, the protocol developed and tested in this project will be an effective tool to document location, number, and general condition of recreation impacts and campsites in a baseline inventory of the coastal areas of Glacier Bay. This baseline will be an effective tool to inform management decisions and planning processes. The importance and efficacy of monitoring programs has been demonstrated in many natural areas over nearly five decades of research (e.g., Frissell and Duncan 1965; Cole 1983: Marion and Leung 1998; Twardock et al., 2010). Understanding trends in conditions of campsites and visitor use locations is a fundamental component in the application of long-term planning strategies such as the Visitor Experience and Resource Protection framework (National Park Service, 1997) and Wilderness Character Monitoring. Determining trends in resource conditions often highlights the need for management actions, and can indicate when more specific research is needed (Boyers, 2000). Since not all inter-rater variability will ever be eliminated, it is recommended that a baseline recreational impact survey be implemented in a campaign style manner, with all survey areas and other campable areas surveyed by the same survey team in a succinct time period. Surveys should take place between June 15 and August 30 of each year (significant vegetation change before and after these dates may alter condition class assessments). This survey would establish a baseline for 22
32 GLBA campsite location, number and general conditions. This would likely take 1-2 seasons to complete in Glacier Bay proper. The baseline inventory also establishes a foundation for further inquiry; once a baseline is established a subset of analysis areas or individual campsites could be selected for more specific measures based on current or potential management issues. Using the baseline data, a monitoring protocol can be developed that allows for timely and effective monitoring of changes in the number, location, and condition of campsites. Since site conditions change rapidly with changes in use levels, especially in a place without static conditions and few hardened sites (like the shorelines of Glacier Bay), a monitoring interval of 5 years would adequately show change over time. The baseline inventory would help determine whether a different monitoring strategy (for example, to only measure certain index survey areas) would suffice in order to create an operationally feasible monitoring protocol. An additional protocol to document restoration/custodial effort is under development by park staff. This protocol will document rock ring, fire ring, and trash removal, and other restoration efforts made by GLBA staff. The data collected in this manner will be useful for end of year reporting, and for documenting restoration /custodial effort in individual survey areas between monitoring intervals. A final campsite inventory and monitoring program for Glacier Bay should include the following components: 1) establish baseline inventory (1-2 field seasons), 2) document site restoration efforts (ongoing), 3) monitor change (frequency, intensity and sampling design TBD following baseline inventory). This, coupled with other visitor use data and future social science work can provide early warning of potential resource change and inform best practices for allocating use and preserving Glacier Bay s opportunities for solitude, and primitive and unconfined recreation as well as other qualities of its superlative wilderness character. 23
33 Literature Cited Belnap, J Choosing indicators of natural resource condition: A case study in Arches National Park, Utah, USA. Environmental Management. 22(4): Boyers, L, M. Fincher, and J. van Wagtendonk Twenty-Eight Years of Wilderness Campsite Monitoring in Yosemite National Park. USDA Forest Service Proceedings RMRS- P15-Vol-5: Cole, D.N Campsites in Three Western Wildernesses: Proliferation and Changes in Condition Over 12 to 16 Years. USDA Forest Service Research Paper INT-463. Intermountain Research Station, Ogden, UT. Cole, D.N Monitoring the condition of wilderness campsites. USDA Forest Service Research Paper INT-302. Intermountain Forest and Range Experiment Station, Ogden, UT. Cole, D.N Wilderness campsite monitoring methods: A sourcebook. USDA Forest Service General Technical Report INT-259. Intermountain Research Station, Ogden, UT. Cole, D.N., and T.E. Hall Trends in campsite condition: Eagle Cap Wilderness, Bob Marshall Wilderness, and Grand Canyon National Park. USDA Forest Service Research Paper INT-453. Intermountain Research Station, Ogden, UT. Cole, D.N Disturbance of natural vegetation by camping: Experimental applications of low level stress. Environmental Management 19: Cole, D.N Impacts of hiking and camping on soils and vegetation. In: Buckley R (ed) Environmental impacts of ecotourism. CABI Publishing, Wallingford, UK, pp Cole, D.N., and C.A. Monz Impacts of camping on vegetation: Response of acute and chronic disturbance on vegetation. Environmental Management 32: Cole, D.N. and C.A. Monz Spatial patterns of recreation impact on experimental campsites. Journal of Environmental Management 70: Cole, D.N., P. Foti and M. Brown Twenty years of change on campsites in the backcountry of Grand Canyon National Park. Environmental Management 41: Cordell, H.K Outdoor Recreation Trends and Futures: A Technical Document Supporting the Forest Service 2010 RPA Assessment. USDA Forest Service General Technical Report SRS-150. Southern Research Station, Asheville, NC. Cordell, H.K Outdoor recreation for 21 st century America. Venture Publishing, State College, PA. Cordell, H.K The latest on trends in nature-based outdoor recreation and tourism. Forest History Today Spring:
34 Frissell, S.S., and D.P. Duncan Campsite preference and deterioration in the Quetico- Superior Canoe Country. Journal of Forestry 63(4): Frissell, S.S Judging recreational impacts on wilderness campsites. Journal of Forestry 76: Klasner, F., C. Monz, and J. Cusick Development of Campsite Monitoring Protocols in Kenai Fjords National Park. Alaska Park Science 10(1): Leung, Y-F, and J.L. Marion Recreation impacts and management in wilderness: A stateof-knowledge review. In D. N Cole and others (compilers), Wilderness Science in a Time of Change Conference Volume 5: Wilderness Ecosystems, Threats and Management. USDA Forest Service Proceedings RMRS-P-15-Vol-5, Rocky Mountain Research Station, Ogden UT. Pp Lewis, T.M., and N. Drumheller Wilderness Camp Impacts: Assessment of Human Effects On The Shoreline of Glacier Bay. NPS GLBA internal document. Marion, J.L Capabilities and management utility of recreation impact monitoring programs. Environmental Management 19: Marion, J.L. and D.N. Cole Spatial and Temporal Variation in Soil and Vegetation Impacts on Campsites. Ecological Society of America 6(2): Marion, J. L. and Y.F. Leung Campsite survey implications for managing designated campsites at Great Smoky Mountains National Park. In: Kulhavy, D. L. & Legg, M. H. (eds.), Wilderness and Natural Areas in Eastern North America: Research, Management and Planning (pp ). Nacogdoches, TX: Stephen F. Austin State University, Center for Applied Studies in Forestry. Monz, C.A., and P. D Luhosch National Park Service Southwest Alaska National Parks visitor impact monitoring: Phase 1 report. 59 pp. Monz, C.A., D.N. Cole, J. Marion, and Y-F. Leung Sustaining Visitor Use in Protected Areas: Future Opportunities in Recreation Ecology Research Based on the USA Experience. Environmental Management 45: Monz, C.A., and P. Twardock A classification of campsites in Prince William Sound, Alaska, USA. Journal of Environmental Management. 91(7) National Park Service VERP: The Visitor Experience and Resource Protection (VERP) framework A handbook for planners and managers. USDI National Park Service, Denver Service Center, Denver. Unertl, K Variability Test for Glacier Bay s Wilderness Campsite Assessment Protocol, NPS GLBA internal document. 25
35 Twardock, P., C.A. Monz, M. Smith, and S. Colt Long-term changes in resource conditions on backcountry campsites in Prince William Sound, Alaska, USA. Northwest Science. 84 (3)
36 Appendix I. GLBA Survey Areas 27
37 28
38 29
39 30
40 Survey Area ID Location Description 1 Scidmore Cut Beach Area is attractive to kayakers who are waiting to get through the high-tide cut into Scidmore Bay, and the western end of the survey area has historically been used as a camper drop-off location Sensitive Species observed include: nesting semi-palmated plovers, nesting spotted sandpipers, oystercatchers, wolverine, river otter sign and abundant bear foods and sign. 2 First Cove Northwest of Scidmore Cut Area is attractive to campers en route from the camper drop-off to the glaciers of the West Arm Sensitive Species observed include: nesting spotted sandpipers, nesting oystercatchers, wolf sign and brown bear with cubs. 3 Small Beach East of Long Beach East of Ibach Point Area is attractive to campers en route from the camper drop-off to the glaciers of the West Arm Sensitive Species observed include: nesting oystercatchers, nesting ptarmigan, river otter sign, possibly denning marmot, and abundant bear sign. 4 Long Beach East of Ibach Point Area is attractive to campers en route from the camper drop-off to the glaciers of the West Arm Sensitive Species observed include: nesting oystercatchers, nesting mew gulls, nesting ptarmigan, nesting sparrows, denning marmots, river otter sign, small salmonids, and abundant bear foods and sign. 5 Reid Inlet, Ibach Point This area is very attractive to campers as it offers views of Reid Glacier, and receives dayuse from people off of boats anchored in Reid Inlet Sensitive Species observed include: nesting oystercatchers, nesting ptarmigan, nesting sparrows, arctic terns, mew gulls, pelagic cormorants, spotted sandpipers, scoters offshore, river otter sign, wolf sign, and abundant bear foods and sign. 6 Head of Reid Inlet, East Side This area has potential to be attractive to campers as it is directly adjacent to Reid Glacier, and receives day-use from people off of boats anchored in Reid Inlet Sensitive Species observed include: nesting mew gulls, parasitic jaegers, oystercatcher nest, and bear sign. 7 Reid Inlet, Western Side of Mouth This area is very attractive to campers as it offers views of Reid Glacier and contains the historic Ibach Cabin remains. For these reasons the area also receives day-use from people off of boats anchored in Reid Inlet Sensitive Species observed include: nesting ptarmigan, nesting least sandpipers, nesting semi-palmated plovers, nesting spotted sandpipers, nesting oystercatchers, nesting sparrows, nesting bald eagles, possibly nesting arctic terns, spawning pink salmon, river otters, and abundant bear sign. 9 Ptarmigan Creek This area is attractive to campers because it is the last large campable area with fresh water before turning into Johns Hopkins Inlet Sensitive Species observed include: nesting oystercatchers, nesting mew gulls, suspected nesting semi-palmated plovers and spotted sandpipers, nesting bank swallows, river otters, and brown bear. 31
41 Survey Area ID Location Description 10 Mary's Beach, East of Lamplugh Glacier A trail along the beach berm heads up the valley to the west, eventually reaching an overview of Lamplugh Glacier. This area is attractive because of this access to a view of Lamplugh Glacier and also because it is the last easily campable beach before turning into Johns Hopkins Inlet Sensitive Species observed include: nesting oystercatchers, denning marmots, nesting barn swallows, nesting sparrows and warblers, nesting bald eagles, nesting spotted sandpipers, boreal toads, river otter sign, and bear sign. 11 Scidmore Bay, Northern End This area is attractive to kayakers waiting to get through the high-tide cut from Scidmore Bay to the West Arm Sensitive Species observed include: nesting arctic terns, nesting semi-palmated plovers, nesting mew gulls, nesting spotted sandpipers, nesting ptarmigan, wolf, black bear and brown bear. Common mergansers, harlequin ducks, and white-winged scoters in, or near, Scidmore Glacier outwash on southern end of survey area. 12 Scidmore Bay, East Side This area holds no particular attraction to campers other than it is a long open beach in the middle of Scidmore Bay Sensitive Species observed include: wolf and bear sign. 13 Entrance to Scidmore Bay, Eastern Shore This area holds no particular attraction to campers other than it is a scenic point overlooking the mouth of Scidmore Bay Sensitive Species observed include: bear sign. 14 Small Island in Hugh Miller West of Blue Mouse Cove This area holds no particular attraction to campers but offers scenic island camping in Hugh Miller Inlet Sensitive Species observed include: oystercatchers, river otter sign, and bear sign. 15 West Blue Mouse Cove - North of Cut to Hugh Miller This area holds no particular attraction to campers except as a place to camp while waiting to get through the tidal cut from Blue Mouse Cove into Hugh Miller Inlet Sensitive Species observed include: bear sign. 16 Blue Mouse Cove This area holds no particular attraction except for years when it is used as a camper drop-off location Sensitive Species observed include: spawning pink salmon, oystercatchers, spotted sandpipers, and bear sign. 20 Sundew Cove This area is attractive to campers during years that it is used as a camper drop-off Sensitive Species observed include: oystercatchers with chicks, common mergansers with chicks, spawning pink salmon, wolf sign and bear sign. 21 Southeast of Gloomy Knob This area is attractive to campers who want to climb Gloomy Knob or hike to Vivid Lake Sensitive Species observed include: spawning pink and sockeye salmon, boreal toads, wolf sign, river otter sign, mountain goat sign, and bear sign. 32
42 Survey Area ID Location Description 22 Northwest of Gloomy Knob One attraction of this area may be a hiking route to Vivid Lake Sensitive Species observed include: nesting oystercatchers, spawning pink and sockeye salmon, semi-palmated plover, spotted sandpiper, river otter sign, and bear sign. 23 Queen Inlet, 2nd Drainage South of Carroll Glacier This area is especially attractive to campers when the camper drop-off is located about 1 mile to the south and this is the nearest campable meadow Sensitive Species observed include: mew gulls and arctic terns with young, nesting oystercatchers, spawning pink salmon, spotted sandpipers, wolves and a brown bear. 24 Queen Inlet, 1st Drainage South of Carroll Glacier This area offers no particular attraction except that it is relatively close to the Queen Inlet camper drop-off Sensitive Species observed include: oystercatchers, wolf sign, a brown bear, and a large number of scoters just offshore. 25 Queen Inlet, 1st Drainage South of Carroll Glacier This area is attractive to campers who are en route from the Queen Inlet drop-off to Rendu Inlet or north to the glaciers Sensitive Species observed include: possible nesting oystercatchers, merlin with young, warblers and sparrows with young, river otter sign, and bear sign. 26 Mouth of Rendu Inlet, Eastern Shore This area is somewhat out of the way and probably only gets use from kayakers exploring Queen and Rendu Inlets Sensitive Species observed include:: nesting oystercatchers, river otter sign, and a brown bear. 27 Rendu Inlet, Romer Glacier Outwash This area is one of the few suitable camping areas near the head of Rendu Inlet Sensitive Species observed include: nesting oystercatchers, wolf sign, river otter sign, brown bears and bear cub sign. 28 First Beach West of Mouth of Rendu Inlet This area is near the Rendu camper drop-off location Sensitive Species observed include: oystercatchers, river otter sign and bear sign. 29 Rendu Camper Drop-off This area is used most heavily in years when the camper drop-off location is here Sensitive Species observed include: nesting spotted sandpipers, oystercatchers, river otter sign and bear sign. 30 Mainland North of SE Tip of Russell Island This area offers no particular attraction to campers Sensitive Species observed include: nesting spotted sandpipers, possible eagle nest inland from beach, river otter sign, bear sign. 31 Northeast Tarr Inlet Survey area contains a trail up a knoll with the remains of a rock cairn on it. This area's greatest attraction is spectacular views of Marjorie and Grand Pacific Glaciers Sensitive Species observed include: nesting spotted sandpipers and bear sign. 33
43 Survey Area ID Location Description 32 Mid-Tarr Inlet, Beach NW of Large Outwash on East Side This area would likely only be used by kayakers heading up Tarr Inlet Sensitive Species observed include: oystercatchers, spotted sandpipers, least sandpipers, wolf sign and a brown bear. 33 Mid-Tarr Inlet, Large outwash on East Side This area would likely only be used by kayakers heading up Tarr Inlet Sensitive Species observed include: ptarmigan with young, oystercatchers with young, possibly nesting spotted sandpipers, common redpolls with young, mew gulls, arctic terns, river otter sign, wolf sign, and bear sign. 34 Northwest Russell Island This area holds no particular attraction to campers except for scenic views of the West Arm Sensitive Species observed include: nesting spotted sandpipers, oystercatchers, warblers and sparrows with young, ptarmigan with young, river otter sign, and bear sign. 35 Southwest Russell Island This area holds no particular attraction to campers except for scenic views of the West Arm Sensitive Species observed include: abundant river otter sign and bear sign. 36 Southeast Russell Island This area holds no particular attraction to campers except for scenic views of the West Arm Sensitive Species observed include: warblers with young, scoters off shore, river otter sign, and bear sign. 37 Johns Hopkins Head, West Shore This area is the closest possible campsite to Johns Hopkins Glacier and offers a spectacular view. It is, however, difficult to get to at times of heavy ice and questionable in safety due to calving induced waves Sensitive Species observed include: harbor seals hauled out on icebergs, kittiwakes, glaucous-winged and mew gulls. 38 Johns Hopkins, Chocolate Falls (Seal Camp) This area is very close to Johns Hopkins Glacier and offers a spectacular view. It is also difficult to get to at times of heavy ice. The area has been used as a harbor seal research camp for several weeks per summer from Sensitive Species observed include: harbor seals hauled out on icebergs, nesting oystercatchers, and bear sign. 39 Topeka Outwash This area has been closed to camping since the early 1990s due to bear problems. The exception to this rule is Alaska Discovery, the Park guided kayaking concessionaire, has been allowed to camp there since year If this area were to open to the general public for camping, the attraction would be a large open campable area at the mouth of Johns Hopkins inlet with spectacular views and access into the inlet Sensitive Species observed include: mew gulls with young, oystercatchers and arctic terns with suspected young, spotted sandpiper nests, ptarmigan with young, and bear sign. 34
44 Survey Area ID Location Description 41 Queen Inlet, Camper Drop-off Two rock cairns are present on beach, probably from drop-off. Area is likely only attractive to campers when it is a drop-off location because there is little campable terrain and there is a high danger of rocks falling onto this area Sensitive Species observed include: nesting oystercatchers, spotted sandpipers with young, and bear sign. 42 Point at the Mouth of Tidal Inlet, South Shore Area holds no particular attraction to campers unless they were passing by Sensitive Species observed include: nesting eagles, oystercatchers with young, river otter sign and bear sign. 43 Tiny Peninsula 1 Mile South of Tidal Inlet Area holds no particular attraction to campers unless they were passing by Sensitive Species observed include: nesting oystercatchers, spotted sandpipers, wolf sign, river otter sign and bear sign. 50 Northeast Lester Island Area holds no particular attraction to campers unless they were passing by. Evidence of 2003 Sensitive Species observed include: river otter and bear sign. 51 Island North of Lester Area holds no particular attraction to campers unless they were passing by Sensitive Species observed include: blue grouse with young, coyote sign, river otter sign and bear sign. 52 South Tip of Island South of Kidney Island Area holds no particular attraction to campers unless they were passing by Sensitive Species observed include: blue grouse with young, nesting crows, oystercatchers, river otter sign and bear sign. 53 North End of Island South of Kidney Island Area holds no particular attraction to campers unless they were passing by Sensitive Species observed include: river otter sign, coyote sign, and bear sign. 54 South Kidney Stone Island Area holds no particular attraction to campers unless they were passing by. Evidence of 2003 Sensitive Species observed include: river otter sign and bear sign. 55 South Hutchins Bay, Mainland peninsula East of Kidney island Area holds no particular attraction to campers unless they were passing by Sensitive Species observed include: nesting ravens and river otter sign. 56 Hutchins Bay This area is one of the few places in the Beardslee Islands that has a consistent supply of fresh water Sensitive Species observed include: river otter sign and bear sign. 57 Northeast Kidney Island Area holds no particular attraction to campers unless they were passing by Sensitive Species observed include: river otter sign, coyote sign and bear sign. 35
45 Survey Area ID Location Description 58 Northwest Kidney Island There is a dilapidated small shack in woods. Area holds no particular attraction to campers unless they were passing by Sensitive Species observed include: spotted sandpiper, river otter sign and bear sign. 59 Southern tip of Link Island Area holds no particular attraction to campers unless they were passing by Sensitive Species observed include: nesting oystercatchers, nesting warblers, river otter sign, coyote sign, and a black bear. Survey area is near seal haulout. 60 Small Island West of South Tip of Link Island Area holds no particular attraction to campers unless they were passing by Sensitive Species observed include: nesting oystercatchers, semi-palmated plovers suspected nesting, river otter sign and a black bear with bear sign including den. 61 Tiny Island with SPIDER Geo-marker Area holds no particular attraction to campers unless they were passing by Sensitive Species observed include: river otter and bear sign. 62 Peninsula Due North of SPIDER Geo-marker Area holds no particular attraction to campers unless they were passing by Sensitive Species observed include: boreal toad, river otter sign and a black bear. 63 South End of Northern-most Island in the Beardslees. Area holds no particular attraction to campers unless they were passing by except for a possible waiting area for access through the high-tide cut into Beartrack Cove Sensitive Species observed include: river otter sign and bear sign, including sign of cubs. 64 Southwest Corner of Northern-most Beardslee Island Area holds no particular attraction to campers unless they were passing by Sensitive Species observed include: oystercatchers, river otter sign and bear sign. 65 Northern-most Tip of the Beardslees Survey area is at the northernmost tip of the Beardslee Islands in Beartrack Cove and is a natural stopping point for kayakers waiting to access the Beardslees through a high-tide cut Sensitive Species observed include: nesting oystercatchers, semi-palmated plovers, spotted sandpipers, nesting sparrows, lady slipper orchid, river otter sign and bear sign including an old den and sign of cubs. 66 North Tip of Mainland, Beardslees Area holds no particular attraction to campers unless they were passing by except for a possible waiting area for access through the high-tide cut into the Beardslee Islands Sensitive Species observed include: raft of over 500 common mergansers off shore, sign of small weasel including den, sign of bear including den. 67 East Side of Peninsula West of Beartrack Cove Area holds no particular attraction to campers unless they were passing by except for a possible waiting area for access through the high-tide cut into the Beardslee Islands Sensitive Species observed include: river otter sign, and sign of bear including den. 68 Island Due East of Boulder Island, West Side. Area holds no particular attraction to campers unless they were passing by Sensitive Species observed include: a large flock (120) of oystercatchers, coyotes, and bear sign including possible den. 36
46 Survey Area ID Location Description 69 Island Due West of Tiny Island with SPIDER Geo-Marker. Area holds no particular attraction to campers unless they were passing by Sensitive Species observed include: river otter sign including possible den, and bear sign. 70 Island Southwest of Spider Geo-marker, South Tip Area holds no particular attraction to campers unless they were passing by Sensitive Species observed include: oystercatcher nest, nesting hairy woodpecker, spotted sandpiper, nesting sparrows, river otter sign, black bear and a dug up den, possible coyote or river otter. 71 Island North of White crow Island with SOCK Geo-marker. Area holds no particular attraction to campers unless they were passing by Sensitive Species observed include: river otter sign with possible den and a black bear. 72 Linear Island Northeast of White crow Area holds no particular attraction to campers unless they were passing by Sensitive Species observed include: river otter sign and black bears. 73 West White Crow Island Area holds no particular attraction to campers except for being on a southwest facing point at the southern end of the Beardslee Islands. This site receives use from harbor seal researchers 1-3 weeks per year Sensitive Species observed include: nesting oystercatchers, coyote, river otter sign, bear sign. Nearby reefs are used by arctic terns, gulls, oystercatchers harlequin ducks and harbor seals that may be impacted by kayakers in this area. 74 Southeast Strawberry Island Area holds no particular attraction to campers unless they were passing by Sensitive Species observed include: river otter sign and bear sign. 75 Southwest Strawberry Island Holds no particular attraction to campers unless they were passing by except for being the westernmost point of Strawberry Island and a natural stopping point for kayakers traveling through the northern part of Sitakaday Narrows Sensitive Species observed include: oystercatchers, black turnstones, river otter sign and bear sign. 76 Northern Tip Young Island Area holds no particular attraction to campers unless they were passing by Sensitive Species observed include: nesting sparrows, river otter sign and bear sign. 77 East Side of Island in Secret Bay Area holds no particular attraction to campers unless they were passing by. The only sensitive species observed in 2003 was a black bear. 78 Cove West Side Young Island Area holds no particular attraction to campers except for kayakers traveling through Sitakaday Narrows Sensitive Species observed include: oystercatchers, river otter sign and bear sign. 37
47 Survey Area ID Location Description 80 First Cove South of York Creek Area holds no particular attraction to campers unless they were passing by Sensitive Species observed include: wolf sign, river otter sign, and bear sign. 81 York Creek This area is a natural stopover for kayakers traveling up the east side of the bay as it offers level campable terrain and fresh water Sensitive Species observed include: river otter sign and bear sign. 82 South Leland Island This area is very attractive to kayakers traveling up or down the east side of the bay because the "island hopping" route is the most direct and the rest of Leland Island is closed to camping Sensitive Species observed include: nesting oystercatchers, nesting gulls of unknown species, and river otter sign. A nearby harbor seal haulout is extremely susceptible to disturbance from kayakers entering or leaving this area. 83 1st Drainage S. of Spokane Cove The main attraction of this area is probably that it is the last campable area at the southern end of a long beach camping closure and has freshwater available Sensitive Species observed include: river otter sign, coyote sign, and bear sign. 85 South Sturgess Island This area is very attractive to kayakers traveling up or down the east side of the bay because the "island hopping" route is the most direct and the adjacent mainland is closed to camping Sensitive Species observed include: river otter sign. 86 North Sturgess Island This area is very attractive to kayakers traveling up or down the east side of the bay because the "island hopping" route is the most direct and the adjacent mainland is closed to camping Sensitive Species observed include: oystercatchers, nesting crows, and river otter sign. 87 North Garforth Island This area is particularly attractive to campers when the camper drop-off is located nearby at Mt. Wright Sensitive Species observed include: river otter and bear sign. 88 Mount Wright This area is particularly attractive to campers when the camper drop-off is located nearby at Mt. Wright Sensitive Species observed include: bear sign. 89 Muir Point This area has been used as a camper drop-of location and is also close to the Mt. Wright camper drop-off. It is also attractive in its location at the southern mouth of Adams Inlet Sensitive Species observed include: oystercatchers with young, river otters and a black bear. 90 Creek West of Tlingit Point This area is especially attractive when the camper drop-off location is at nearby Sebree Island and because of its freshwater creek Sensitive Species observed include: eagle nest, spawning salmon, wolf sign, otter sign and bear sign. 38
48 Survey Area ID Location Description 91 Small Island south of Tlingit Point This area is probably attractive when the camper drop-off location is at nearby Sebree Island Sensitive Species observed include: over 260 oystercatchers, arctic terns, a large raft of scoters, several cormorants and mew and glaucous-winged gulls. 92 Tlingit Point This area is probably attractive when the camper drop-off location is at nearby Sebree Island, but beach terrace appears to be eroding and past evidence of use may have been erased Sensitive Species observed include: oystercatchers, nesting crows, river otter sign and bear sign. 94 SW Sebree Island This area is often the location of a camper drop-off and is most likely used more heavily during those times Sensitive Species observed include: river otter sign and bear sign. 95 SE Sebree Island This area is probably attractive when the camper drop-off location is nearby on the southwest side of Sebree Island Sensitive Species observed include: river otter sign and bear sign. 96 Caroline Point This area is attractive to campers traveling up and down Muir Inlet, particularly when the camper drop-off is at Sebree Island Sensitive Species observed include: arctic terns, oystercatchers, scoters off shore, river otter sign and bear sign. 97 Shore North of Ice Valley Outflow This area may be attractive to campers traveling up and down Muir Inlet but holds no other significant attractions Sensitive Species observed include: spotted sandpipers suspected nesting, harlequin ducks with young, and bear sign. 98 Morse Glacier Outwash This area may be attractive to campers traveling up and down Muir Inlet but holds no other significant attractions other than freshwater Sensitive Species observed include: oystercatcher with young, arctic terns, semipalmated plovers and spotted sandpipers acting defensively, sparrows and warblers with young, wolf sign, coyote sign, and bear sign. 99 Creek across Muir Arm form Klotz Hills This area may be attractive to campers traveling up and down Muir Inlet but holds no other significant attractions other than freshwater Sensitive Species observed include: wolf sign, river otter sign and bear sign. 100 Adams Glacier Outwash This area may be attractive to campers who wish to hike the outwash Sensitive Species observed include: semi-palmated plovers, oystercatchers, arctic terns, wolf sign, and bear sign. 101 Southwest of Adams Glacier Outwash No specific attractions in this survey area Sensitive Species observed include: spotted sandpipers, oystercatchers, and bear sign. 39
49 Survey Area ID Location Description 103 South of Casement Glacier Outwash across Adams Inlet No specific attractions in this survey area Sensitive Species observed include: wolf sign and bear sign. 104 Mid-Adams Inlet, South side No specific attractions in this survey area except as a mid-point in Adams Inlet Sensitive Species observed include: nesting juncos, wolf sign, and bear sign. 105 Point George The main attraction of this area is its location at the northern mouth of Adams Inlet Sensitive Species observed include: oystercatchers and bear sign. 106 Maquina Cove No specific attractions in this survey area Sensitive Species observed include: bear sign. 107 South Klotz Hills No specific attractions in this survey area. No sensitive species observed in survey area. 108 First Cove North of Klotz Hills No specific attractions associated with this survey area Sensitive Species observed include: suspected nesting spotted sandpipers and semi-palmated plovers, oystercatcher, river otter sign, brown bear. 109 Large Former River Fan, South of Forest Creek. No specific attractions associated with this survey area Sensitive Species observed include: oystercatchers, parasitic jaegers, and bear sign. 110 Center of Small Cove at South End of Forest Creek Fan No specific attractions associated with this survey area Sensitive Species observed include: river otter sign, wolf sign and bear sign. 111 North End of Forest Creek Fan No specific attractions associated with this survey area Sensitive Species observed include: wolf sign and bear sign. 112 Goose Cove The attraction of this area is a small tidal lagoon and freshwater stream Sensitive Species observed include: defensive oystercatchers, wolf sign and bear sign. Stream is believed to contain spawning salmon. 113 Sealer's Island 2003 Sensitive Species observed include: nesting arctic terns, nesting mew gulls, nesting oystercatchers, nesting glaucous-winged gulls, nesting crows, river otter sign, and a brown bear. 114 Rounded Peninsula between Nunatak and Goose Coves. No specific attraction in this area except that it offers extensive camping possibilities Sensitive Species observed include: defensive oystercatchers, nesting warblers, and bear sign. 40
50 Survey Area ID Location Description 115 Nunatak (1st cove North of Nunatak) No specific attractions in this survey area Sensitive Species observed include: bear sign. 116 Wolf Point No specific attractions in this survey area except for freshwater stream Sensitive Species observed include: defensive semi-palmated plovers, mew gulls, oystercatchers, and bear sign. 117 Stump Cove No specific attractions in this survey area except for freshwater stream Sensitive Species observed include: defensive oystercatchers and bear sign. 118 North Side Wachusetts Inlet No specific attractions in this survey area Sensitive Species observed include: nesting sparrows and bear sign. 119 Rowlee Point This area's main attraction is its location at the southern mouth of Wachusetts Inlet Sensitive Species observed include: defensive spotted sandpipers, oystercatchers, coyote sign and bear sign. 120 Hunter Cove North No specific attractions in this survey area except for freshwater stream Sensitive Species observed include: defensive semi-palmated plovers and spotted sandpipers, oystercatchers, coyote sign, and a brown bear. 121 Hunter Cove South No specific attractions in this survey area except for freshwater stream Sensitive Species observed include: river otter sign, wolf sign, and bear sign. 130 Mouth of Geikie, North Shore 2003 Sensitive Species observed include: oystercatchers, spawning pink and chum salmon, river otter sign, a wolverine, and black bears and a brown bear. 131 North shore Geikie with ARCH Geomarker No specific attractions in this survey area except for freshwater stream Sensitive Species observed include: oystercatchers, spawning pink salmon, coyote sign, river otter sign, and a blue color phase black bear (glacier bear). 132 First Site East of Charpentier Valley No specific attractions in this survey area except for freshwater stream Sensitive Species observed include: river otter sign and bear sign. 133 Valley From Charpentier Inlet No specific attractions in this survey area except for freshwater stream Sensitive Species observed include: common mergansers with young, oystercatchers and bear sign. 134 Mid North Shore, Geikie Inlet No specific attractions in this survey area except for freshwater stream Sensitive Species observed include: a black bear. 41
51 Survey Area ID Location Description 135 Stream Off of South Mt. Bulky, Geikie Inlet Rock cairn in survey area likely from camper drop-off. This area was used as a drop-off location for at least one year. Otherwise, no specific attractions in this survey area except for freshwater stream Sensitive Species observed include: brown bears. 136 North Shore Geikie, about 1 mile from the head. No specific attractions in this survey area except for access to Geikie Glacier Outwash Sensitive Species observed include: bear sign. 137 Head of Geikie Inlet, South Shore No specific attractions in this survey area except for access to Geikie Glacier Outwash and freshwater stream Sensitive Species observed include: bear sign. 138 Mouth of Tyndall Inlet, West shore No specific attractions in this survey area except for freshwater stream Sensitive Species observed include: black turnstones, wolf sign and bear sign. 139 West island of the two islands in Geikie Inlet No specific attractions in this survey area except for being an island with scenic views Sensitive Species observed include: black turnstones, oystercatchers and bear sign. 140 Island at Mouth of Shag Cove, Geikie Inlet No specific attractions in this survey area except for being an island with scenic views Sensitive Species observed include: nesting bald eagles, river otter sign and bear sign. 150 East Drake Island No specific attractions in this survey area except for being on an island with scenic views Sensitive Species observed include: river otter sign and bear sign. 151 Johnson Cove, Willoughby Island Historic structure remnants were found in survey area. This area is attractive because it is located within a protected cove on the outside of Willoughby Island, and thus a natural stopover for kayakers passing by Sensitive Species observed include: several species of orchids, river otter sign and bear sign. 160 Large cove south of McBride Inlet No specific attractions in this survey area except for freshwater stream 2003 Sensitive Species observed include: oystercatchers, wolf sign and bear sign. 161 Long beach north of McBride Inlet This area is attractive to campers because of its proximity to McBride Glacier and access to freshwater. Many Alaska Discovery guided kayaking trips begin or end in this location Sensitive Species observed include: river otter, defensive oystercatcher, semipalmated plovers, coyote and bear sign. 162 Riggs Glacier This area is attractive to campers because of the spectacular views of Riggs Glacier Sensitive Species observed include: nesting semi-palmated sandpipers, spotted sandpipers, oystercatchers, finches with young, coyote, wolf and bear sign. Nesting arctic terns and mew gulls in vicinity that could be impacted by campers in this area. 42
52 Survey Area ID Location Description 164 South Shore, Mid Upper Muir Inlet This area is attractive to campers traveling in upper Muir Inlet because it is one of the few campable areas, and may be an access point for hiking up White Thunder Ridge Sensitive Species observed include: nesting oystercatchers, suspected nesting spotted sandpipers, nesting swallows, wolf sign and bear sign. 165 North Shore, Mid Upper Muir Inlet This area is attractive to campers traveling in upper Muir Inlet because it is one of the few campable areas and has freshwater Sensitive Species observed include: nesting arctic terns, mew gulls with young, oystercatchers with young, nesting semi-palmated plovers, nesting glaucous-winged gulls, nesting herring gulls, and a spotted sandpiper. Boreal toad tadpoles were later reported at this site. 166 North Shore, West End of Muir Inlet This area is attractive to campers traveling in upper Muir Inlet because it is one of the few campable areas and has freshwater Sensitive Species observed include: nesting mew gulls with young, nesting oystercatchers, nesting glaucous-winged gulls, defensive spotted sandpipers, semipalmated plovers, and American pipits. 167 North spit McBride Inlet This area is very attractive to campers because of the spectacular views of McBride Glacier Sensitive Species observed include: nesting oystercatchers, nesting gulls of unknown species, defensive semi-palmated plovers, coyote sign, bear sign, and wolf sign including evidence of pups. Harbor seals pupping and molting in fjord would potentially be disturbed by campers in this area. Arctic terns have been observed nesting in area in past, but no evidence of nesting was observed in 2002 or South spit McBride Inlet This area is very attractive to campers because of the spectacular views of McBride Glacier Sensitive Species observed include: oystercatchers with nests, semi-palmated plovers, spotted sandpipers, wolf sign, bear sign, and possible river otter sign. Harbor seals pupping and molting in fjord would potentially be disturbed by campers in this area. 170 Garforth Island, South End This area is probably most attractive to campers when the camper drop-off is nearby at Mt. Wright Sensitive Species observed include: oystercatchers, river otter sign and bear sign. 171 Blue Mouse Cove, Southeast Area holds no particular attraction to campers unless they were passing by Sensitive Species observed include: river otter sign and bear sign. 172 Small Island in South Blue Mouse Cove Area holds no particular attraction to campers unless they were passing by Sensitive Species observed include: bear sign. 173 North tip of Mainland Peninsula in Mid-Hugh Miller Inlet Area holds no particular attraction to campers unless they were passing by Sensitive Species observed include: oystercatchers, a black bear and river otter sign. 43
53 Survey Area ID Location Description 174 Northeast Mouth of Charpentier Inlet Area holds no particular attraction to campers unless they were passing by Sensitive Species observed include: young spotted sandpipers, river otter sign, and bear sign. 175 Small Island at Mouth of Charpentier Inlet Area holds no particular attraction to campers except for being an island with scenic views Sensitive Species observed include: mew gulls with young, oystercatchers with young, arctic terns, dowitchers, black turnstones, crow nest, and bear sign. 176 South Tip of Island off Southeast Tip of Gilbert Peninsula No established sites or evidence of human use. Area holds no particular attraction to campers unless they were passing by Sensitive Species observed include: river otter sign, mink sign, and bear sign including evidence of cubs. 177 South of Entrance to Weird Bay, mouth of Scidmore Bay Area holds no particular attraction to campers unless they were passing by Sensitive Species observed include: oystercatchers, glaucous-winged gulls and molting harlequin ducks. 180 Mt. Wright Drop-off This area is sometimes the location of a camper drop-off and probably receives most of its use during these times. The potential for falling rocks makes this area hazardous for camping Sensitive Species observed include: river otter sign and bear sign. 181 Topeka Outwash East Created in Topeka Outwash West Created in Tarr Inlet West Side Created in Tarr Inlet West Side Created in Tarr Inlet West Side Created in Sebree Created in
54 Appendix II. Historical Campsite Assessment Summary Survey Year Location Information/Data Source(s) Attribute Information Completeness of Data Comparison to 2012 Possible 1970s Survey sheets Paper maps General descriptive information; focus on structures (e.g. cabins, tent platforms, etc.) Selected areas Lacking Survey Area ID Narrative report would require coding No 1982/83 Survey sheets Paper maps General descriptive information Counted tent sites, fire rings Descriptive information about vegetation condition (e.g. trampled, flattened, dead, recovering ) Selected areas Lacking Survey Area ID Narrative report would require coding Minimal 1986/87 Survey sheets Paper maps Frequency of use Substrate Dominant vegetation Area of vegetation impact (square feet) Area of substrate impact (square feet) Fire rings (count) Human alteration Human waste Trash Trails (yes/no) Condition (pass/fail) General comments Selected areas Data sheets mostly complete Some areas have associated Survey Area ID Open-ended comments would require coding Not all reports distinguish between satellite sites and individually impacted sites Minimal 2002/03 GIS locations Unique campsite ID Links to Access database Minimal 45
55 Survey Year Location Information/Data Source(s) Attribute Information Completeness of Data Comparison to 2012 Possible 2002/03 Digitized data sheets (electronic spreadsheets) Site Name Location description Landing substrate Site substrate Veg type in site Veg type off site Site length Site width General observations Trailing Supratidal fire pit Rock ring Intertidal firepit Trash Human waste Firewood Structures Footprints Size Long-lasting impact Short-lived impact Impact number Impact rating Observer rating Attribute information mostly complete Descriptive observations require coding Many variables coded as presence (TRUE) or absence (FALSE) Inconsistency in measurement/ application of protocol (e.g. site dimensions; using vague terms like several instead of giving a number) Minimal 46
56 Survey Year Location Information/Data Source(s) Attribute Information Completeness of Data Comparison to 2012 Possible 2011 GIS locations Location description Type of site Landing substrate Campsite substrate No. satellite sites Condition class Veg cover on site Veg cover off site Trash Human waste Campfire Rock rings Size category Campable area Size estimate Size dimension Dominant vegetation type Attribute information missing for most locations Missing Survey Area ID for each site can be overlaid with Survey Area layer in GIS Lacking complete spatial information for 2011 survey areas (i.e. no polygon layer) No 47
57 Survey Year Location Information/Data Source(s) Attribute Information Completeness of Data Comparison to 2012 Possible 2011 Digitized data sheets (electronic spreadsheets) Site Name Location description Landing substrate Site substrate Veg type in site Veg type off site Site length Site width General observations Trailing Supratidal fire pit Rock ring Intertidal firepit Trash Human waste Firewood Structures Footprints Size Long-lasting impact Short-lived impact Impact number Impact rating Observer rating Attribute information mostly complete Descriptive observations require coding Many variables coded as presence (TRUE) or absence (FALSE) Inconsistency in measurement/ application of protocol (e.g. site dimensions; using vague terms like several instead of giving a number) Several sites not measured Minimal 2012 GIS locations Landing substrate Campsite substrate Dominant vegetation type Tent rocks Campfire Tree/shrub damage Veg cover on site Veg cover off site Site size Trash Mostly complete lacking size information for 7 measured campsites N/A 48
58 Appendix III. Number of full assessments completed per survey area each year Data sources: Export_WCIsites3.xlsx and tblsiteobs.xlsx, provided by National Park Service Survey Area Not Given
59 Survey Area
60 Survey Area
61 Survey Area
62 Survey Area Total number of measured sites a 15 sites not measured in 2002 b 1 site not measured in 2003 c 6 sites not measured in a 133 b 76 c
63 Appendix IV. Summary of Historical Assessments by Data Source Survey Area Not Given 2002 GIS 2002 tblssiteobs 2003 GIS 2003 tblsiteobs 2004 Report 2011 GIS 2011 tblsiteobs
64 Survey Area GIS tblssiteobs GIS tblsiteobs Report GIS tblsiteobs
65 Survey Area GIS tblssiteobs GIS tblsiteobs Report GIS tblsiteobs
66 Survey Area GIS tblssiteobs GIS tblsiteobs Report GIS tblsiteobs
67 Survey Area GIS tblssiteobs GIS tblsiteobs Report GIS tblsiteobs
68 Survey Area GIS tblssiteobs GIS tblsiteobs Report GIS tblsiteobs
69 2002 GIS Survey Area Total number of sites a 15 sites not measured in 2002 b 1 site not measured in tblssiteobs 2003 GIS 2003 tblsiteobs 2004 Report 2011 GIS 2011 tblsiteobs a b 257 c d 265 c 268 sites identified in 2002/2003; 257 measured and rated d 6 sites not measured in 2011 GIS values for 2002, 2003, and 2011 were derived by overlaying campsite point data with survey area polygons in ArcMap and counting the number of campsites within each survey area. Attribute tables from the point shapefiles were edited to include each point s corresponding survey area number. tblsiteobs values for 2002, 2003, and 2011 were derived by (i) manually merging tblsiteobs.xls (attribute data) and Export_WCIsites3.xls (spatial location data) and then (ii) selecting sites for which the field Measured was TRUE Report values were taken from the Lewis and Drumheller (2004) camper impact report. This report summarizes the campsite monitoring data collected in 2002 and
70 Appendix V. GLBA Data Collection and Handling Recommendations For each feature collected, enter all attribute information Minimize comments/field notes to relevant information not adequately captured in the attribute fields. Reading comments for all sites is very time consuming, and coding the information can be difficult (multiple observers, clarity/specificity of information provided, etc.). Be as specific as possible (within reason!) in comments. For example, instead of multiple tent pads or several tent rocks, record a number. This will enable analysis of trends and comparisons between sites/areas. Do not separate out data. Having data in too many places makes it difficult to ensure all sites are being counted and hinders the ability to make comparisons over time. Maintain all data in GIS format (e.g. shapefiles, geodatabases). Files can be merged to ease data management (e.g. create one campsite file for each survey year by merging individual files collected in the field). Attribute information can be exported to a flat file format (.xls,.csv, etc.) for statistical analysis/summarizing. Do not separate attribute information from spatial information (e.g. create multiple tables/files). If you must for analysis purposes, make sure to keep the original file. Develop a standard protocol for naming files Create a metadata file for each data file Future data needs: updated polygon layer of Survey Areas 61
71 Appendix VI. Glacier Bay National Park Recreation Impact Assessment Protocol v.5. Overview Goal of the Procedural Manual This manual describes all procedures necessary to conduct initial and repeat campsite assessments in coastal areas of Glacier Bay National Park. Application to Park Management Local land managers can use past, current, and future data in the following manner: Document current impacts and condition of campsites. Create Limits of Acceptable Change (LAC) standards and indicators. Develop minimum impact suggestions for users. Assist in the determination of sustainable visitor capacities for Glacier Bay National Park. Create boundaries for various use zones. Staff Training Although this manual contains all the information necessary to conduct the inventory and monitoring program, it is not meant to be a substitute for proper on-site staff training. The objective of staff training is to communicate and illustrate field procedures, develop and refine experience and judgment, and build a commitment to quality. A minimum of two days of staff training is recommended. Training can be organized as outlined below: Day 1: Field staff read and discuss procedural manual Glacier Bay National Park Recreation Impact Assessment Protocol. Day 2: For Quality Control, assessment procedures are demonstrated on a typical campsite. Following discussion and question and answer session, field staff, independently or in small groups, will apply procedures to a common survey area and group of campsites. The entire group reviews evaluations of each campsite. Differences are examined and resolved by referring to the manual and group critique. A minimum of two field personnel are needed to conduct the inventory. 62
72 Materials for Collecting Field Data Glacier Bay National Park Recreation Impact Assessment Protocol one per person Glacier Bay topographic map Compass Flagged wire pins 25 minimum (two separate colors if more than one group is working in same area) Trimble Nomad or GeoXT GPS unit, Stylus Data Dictionary: GLBA2012_Rapid_v7 Survey area polygons loaded onto GPS units or aerial photo Digital camera (for back-up) Note pad and pencil Description of Procedures This manual describes procedures for conducting inventories and resource condition assessments necessary to document changes in condition of coastal campsites in Glacier Bay National Park. Types of Assessments Survey Area For the purposes of this manual, survey areas are defined as areas where camping activities are known or suspected to take place. These areas will be walked and scouted for campsites and other signs of visitor use. Polygons of survey areas collected in will be used to guide field crews. Survey areas are (often but not always) predefined by the camper impact survey. Make sure you are covering the entire survey area as defined in the Trimble or the aerial photo given to you prior to your trip. Make sure you sweep the entire area from mean high tide and then inland to the logical end of most camper activity. If new survey areas are established, please start numbers at 200. Campsites Definition of a campsite: For the purposes of this manual, campsites are defined as locations where there is clear evidence of recent (within last 2-3 years) camping activity. Each campsite is distinct and separated by vegetation, geographic restrictions, etc. If you are questioning whether a large site is multiple sites or a single site, please record it as multiple sites. Conversely, do not call multiple sites a single site (i.e. no satellite sites!). Evidence includes: Vegetation loss or change clearly caused by human use (i.e. in the pattern of a tent, framed by tent rocks, etc.). Flattened vegetation clearly caused by human use (i.e. in the pattern of a tent, etc.) Compressed gravel clearly caused by human use (i.e. in the pattern of a tent, framed by tent rocks, etc.). Recently placed tent rocks Camp trash 63
73 Recent tree or shrub damage Campfire in site Finding sites to add to the inventory/monitoring program A goal of the inventory/monitoring program is to keep informed of campsite conditions in Glacier Bay National Park. To achieve this goal, new visitor sites are added to the inventory as they are discovered. Survey areas must be thoroughly searched to identify locations of visitor sites to add to the program and locate previously surveyed campsites including those no longer used. After landing on a beach with potential camping, conduct searches for new visitor sites by following all visitor-created trails, however faint, to search out likely camping areas. Analyze visitor sites vegetation by comparing site to adjacent areas of similar topography compare a disturbed beach berm with a similar undisturbed beach berm. For coastal visitor sites (those along or near beaches), be sure to analyze the site for natural influences, such as tidal and weather, to determine whether the vegetation inconsistencies are due to human or environmental influence. If you are in doubt as to whether the site is a campsite please log it as a suspect site! Suspected Campsites For the purposes of this manual, suspected campsites are defined as a location where camping is likely to have occurred and use is suspected, but no clear evidence is present. If evidence of recent camping is present (see above list), the location should be recorded and measured as a campsite. If you are in doubt that the site is indeed a suspect site, do not record the site! Visitor-Created Trails A visitor-created trail connects known areas of visitor use, such as campsites, water sources, food storage areas, viewpoints, and intertidal access. Only include trails that are 5-meters in length or longer. Do not map wildlife trails Sensitive Species Collect a waypoint for sensitive species or species of concern including: nesting birds, dens, exotic plants, and hauled out and/or unusual animal species. Interstadial Wood Gather a point for interstadial wood that is in place (i.e. large logs or stumps that are embedded in the soil). Do not include driftwood. Indicate whether or not there are signs of human-caused damage, such as cuts, charring, or burn scars. 64
74 Rapid Assessment Backcountry Campsite Assessment Procedures Survey Area Survey areas are (often but not always) predefined by the camper impact survey. Make sure you are covering the entire survey area as defined in the Trimble or the aerial photo given to you prior to your trip. Make sure you sweep the entire area from mean high tide and then inland to the logical end of most camper activity. Begin at one end of the survey area. Walk the entire area to search for campsites and other signs of visitor use. As you walk, do the following: Place a pin flag in each campsite and suspected campsite that you encounter. Keep a tally of the number of fire signs, human waste sites, structures, and amount of trash you find. When you have concluded your sweep of the survey area, start the GPS and do the following: 1. Open TerraSynch and create new file. Use the numeric code for the survey area to name the file. 2. Load GLBA2012_Rapid_v7 data dictionary. 3. Collect Survey Area point within the survey area polygon and record attributes Attributes 1. Survey Area Number: Enter pre-assigned three-digit survey area code 2. Surveyed By: Enter the initials of the field crew conducting the assessment 3. Fire Signs: Enter the number of supratidal fire signs you encountered in the survey area. Fire signs include fire rings, charcoal piles, and large burnt logs. Do not include burnt scattered pieces of charcoal or washed-up firewood. 4. Trash: Use the drop down menu to choose a category for the amount of camping trash found in the survey area. Do not include trash found in campsites (this will be counted later) or flotsam that has been washed ashore. a. None b. Handful or less c. Handful to gallon d. Gallon to 5 gallons e. More than 5 gallons 5. Human Waste: Follow all trails in the vicinity of campsites to conduct a quick search of likely toilet areas, typically just out of site of campsites. Count the number of individual human waste sites, defined as separate locations exhibiting toilet paper and/or human feces. 65
75 The intent is to identify the extent to which the improper disposal of human waste is a problem. Enter the number of individual human waste sites found within the survey area. Include upland and supratidal sites only. Note: use individual counts for each location (e.g. one multi-day/use pile is 1 site). 6. Structures: Enter the number of human-made structures encountered. Include beach furniture made of rock, wood, or other available materials; stacked rocks such as cairns. Do not include tent rocks, fire rings. 7. Comments: Enter any notable comments, if any, about the area. 8. Field Notes: Use the drop down menu to indicate whether any field notes were recorded separate from the information collected using the GPS unit. 9. Date/Time: Created automatically with feature. Campsite Walk the survey area again, using the pin flags you placed during the initial sweep to help locate campsites observed during the initial sweep of the survey area. At the campsite, stand in the center and collect a high-accuracy GPS point (minimum of 20 locations collected on the GPS for each site). A high-accuracy point is critical in relocating campsites during future monitoring. Do not move from the center of the campsite while the GPS is logging. If you must move or the GPS has logged at least 20 positions, select the Pause button before moving. You can continue entering attribute information while the data logger is paused. Remove the pin flag before moving on to the next site. Attributes 1. Survey Area Number: Enter the three-digit number of the survey area where the campsite is located. 2. Campsite Number: Enter a number for the campsite, beginning at 1 for each survey area and increasing incrementally. 3. Surveyed By: Enter the initials of the field crew conducting the assessment 4. Rationale: Specify why you are designating the location as a campsite by choosing an option from the drop down menu: a. Veg loss or change Primary reason for recording the location as a campsite is due to vegetation loss or change clearly caused by human use (i.e. in the pattern of a tent, framed by tent rocks, etc.). b. Flattened veg Primary reason for recording the location as a campsite is due to flattened vegetation clearly caused by human use (i.e. in the pattern of a tent, etc.). c. Compressed gravel Primary reason for recording the location as a campsite is due to compressed gravel clearly caused by human use (i.e. in the pattern of a tent, framed by tent rocks, etc.). 66
76 d. Tent rocks Primary reason for recording the location as a campsite is due to the presence of recently placed tent rocks. e. Camp trash Primary reason for recording the location as a campsite is due to the presence of camping trash in the site. f. Tree/shrub damage Primary reason for recording the location as a campsite is due to recent tree or shrub damage caused by human use (i.e. sawed limbs or branches, axe/hatchet scars, burn scars, cut stump, broken or twisted branches, etc.). g. Campfire Primary reason for recording the location as a campsite is due to the presence of a campfire in the site. h. Other There is another reason for considering this location a campsite. Specify the reason in the Comments field at the end of the data dictionary. 5. Landing Substrate: Record the predominant substrate where visitors using this site would land their boats by choosing one of the categories below from the drop down menu: a. Cobble includes gravel size stone and larger; smaller than boulders b. Sand includes sandy beach soils which do not form a surface crust in trampled areas c. Soil includes clays to loamy soils d. Boulder includes large rocks 8-inches in diameter or larger (think melon-size or larger) e. Cobble/Sand combination of cobble and sand 6. Campsite Substrate: Record the predominant substrate of the campsite by choosing one of the categories below from the drop down menu: a. Boulder includes large rocks 8-inches in diameter or larger b. Cobble includes gravel size stone and larger; smaller than boulders c. Sand includes sandy beach soils which do not form a surface crust in trampled areas d. Cobble/Sand combination of cobble and sand e. Soil includes clays to loamy soils f. Compacted gravel small size stone that has been compacted and flattened into an obvious tent pad. Common in recently deglaciated areas that have little or no vegetation. 7. Campsite Size: Record the size of the campsite by choosing one of the categories below from the drop down menu. Assume a 5 x7 tent with enough room for normal camp activities. If in doubt, divide into multiple campsites. a. Small 1 tent pad b. Medium 2-3 tents c. Large 4-5 tents d. X-large more than 5 tents 67
77 8. Tent Rocks: Count all rocks within the site that have been moved and placed by humans. A tent rock should be fist-size or larger and obviously placed within the site. 9. Campfire IN Site: Count the number of campfire signs within the campsite. 10. Veg Cover ON Site: An estimate of the percentage of live non-woody vegetative ground cover (including herbs, grasses, and mosses. Exclude tree seedlings, saplings, and shrubs) within the campsite boundaries using the categories listed below. Exclude undisturbed islands of vegetation. For this and the following parameter, it is often helpful to narrow your decision to two categories and concentrate on the boundary that separates them. For example, if the vegetation cover is either 6-25% or 26-50%, you can simplify your decision by focusing on whether vegetative cover is greater than 25%. Do not extrapolate the amount of ground cover that could or should be seen. Use total leaf coverage, not stem or stock coverage, to determine percent. Refer to the color photos provided in this manual for further guidance. a. 0-5% b. 6-25% c % d % e % f % 11. Veg Cover OFF Site: An estimate of the percentage of vegetative ground cover in an adjacent but largely undisturbed control area. Use the categories listed below. The control site should be similar to the campsite in slope, tree canopy cover (amount of sunlight penetrating to the forest floor), and other environmental conditions. The intent is to locate an area which would closely resemble the campsite area had the campsite never been used. In instances where you cannot decide between two categories, select the category with less vegetative cover. The rationale for this is simply that, all other factors being equal, the first campers would have selected a site with the least amount of vegetation cover. Refer to the color photos provided in this manual for further guidance. a. 0-5% b. 6-25% c % d % e % f % 12. Veg Type 1 IN Site: Indicate the dominant vegetation type within the site by choosing from the drop down menu: 68
78 a. Sparse Herbacerous leafy forbs and herbs growing intermittently within the campsite boundaries b. Dense Herbaceous leafy forbs and herbs growing closely together or continuously within the campsite boundaries c. Open Scrub shrub or alder scrub that is open enough to allow for easy walking among plants d. Dense Scrub shrub or alder scrub with plants growing densely together and providing a barrier to easy walking e. Graminoid grasses and grass-like plants (sedges) f. Dryas Mat low growing mats of Dryas spp. g. Moss h. Lichen i. Other 13. Veg Type 2 IN Site: If vegetation within the boundaries of a campsite is an equal mixture of two types (e.g. Moss and Lichens), indicate the co-dominant vegetation type here by choosing one of the categories listed below from the drop down menu. If there is one clear dominant vegetation type, leave this attribute blank. a. Sparse Herbacerous leafy forbs and herbs growing intermittently within the campsite boundaries b. Dense Herbaceous leafy forbs and herbs growing closely together or continuously within the campsite boundaries c. Open Scrub shrub or alder scrub that is open enough to allow for easy walking among plants d. Dense Scrub shrub or alder scrub with plants growing densely together and providing a barrier to easy walking e. Graminoid grasses and grass-like plants (sedges) f. Dryas Mat low growing mats of Dryas spp. g. Moss h. Lichen i. Other 14. Veg Type 1 OFF Site: Indicate the dominant vegetation type present in an adjacent but largely undisturbed control area. Use the categories listed below. The control site should be similar to the campsite in slope, tree canopy cover (amount of sunlight penetrating to the forest floor), and other environmental conditions. The intent is to locate an area which would closely resemble the campsite area had the campsite never been used. If the campsite is located in a forested area with tall trees, indicate the dominant understory vegetation type. a. Sparse Herbacerous leafy forbs and herbs growing b. Dense Herbaceous leafy forbs and herbs growing closely together or continuously 69
79 c. Open Scrub shrub or alder scrub that is open enough to allow for easy walking among plants d. Dense Scrub shrub or alder scrub with plants growing densely together and providing a barrier to easy walking e. Graminoid grasses and grass-like plants (sedges) f. Dryas Mat low growing mats of Dryas spp. g. Moss h. Lichen i. Other 15. Veg Type 2 OFF Site: If vegetation within the control area is an equal mixture of two types (e.g. Moss and Lichens), indicate the co-dominant vegetation type here by choosing one of the categories listed below from the drop down menu. If there is one clear dominant vegetation type, leave this attribute blank. a. Sparse Herbacerous leafy forbs and herbs growing intermittently b. Dense Herbaceous leafy forbs and herbs growing closely together or continuously c. Open Scrub shrub or alder scrub that is open enough to allow for easy walking among plants d. Dense Scrub shrub or alder scrub with plants growing densely together and providing a barrier to easy walking e. Graminoid grasses and grass-like plants (sedges) f. Dryas Mat low growing mats of Dryas spp. g. Moss h. Lichen i. Other 16. Trash: Include all recreational use litter or trash that is present within the boundaries of the campsite. Choose an amount from the drop down menu: a. None b. Handful or less c. Handful to gallon d. Gallon to 5 gallons e. More than 5 gallons 17. Tree/Shrub Damage: Count the number of separate events of tree or shrub damage within a 2 meter radius of the campsite that is clearly caused by humans. Examples of tree/shrub damage include sawed limbs or branches, axe/hatchet scars, burn scars, cut stump, broken or twisted branches. Do not include tree and shrub damage caused by wildlife (e.g. scraping or scratching from bears, moose, and other animals) or storm damage. 70
80 18. Reference Photo: Take a photo of the campsite using the Trimble camera and link the file to the campsite feature here (see directions below). If the GPS unit you are using does not have a camera or the camera is not working, take a photo using a separate digital camera and indicate the file name in the Comments section. When taking the photo, choose the best vantage point that gives you a clear perspective of the campsite. 19. Photo Bearing: Enter compass bearing from the location where you take the campsite reference photo. This will aid in future relocation of the campsite. 20. Comments: Record comments regarding anything noteworthy about this campsite. If you selected Other in the Rationale field, explain why you recorded this location as a campsite. 21. Field Notes: Use the drop down menu to indicate whether field notes associated with this campsite were taken separately from the information recorded in the GPS unit during the assessment. 22. Date/Time: Created automatically when the campsite feature is created. Suspected Campsite In locations where camping is suspected but no clear evidence of recent camping is present, a Suspected Campsite feature can be created with the GPS. Stand in the center of the suspected site and collect a high-accuracy point. Note any relevant information in the Comments field. The rationale for collecting location information for suspected campsites is that these sites can be relocated during future monitoring and inspected for evidence of camping activities. A suspected campsite may develop into a campsite over time. Attributes 1. Surveyed By: Enter the initials of the field crew conducting the assessment. 2. Comments: Specify why you designated this location as a suspected campsite. 3. Date/Time: Created automatically when the suspected campsite feature is created. 71
81 Sensitive Species Collect a waypoint for sensitive species or species of concern including: nesting birds, dens, exotic plants, and hauled out and/or unusual animal species. Please try NOT to disturb the nest, den or animals by getting too close. Take the GPS point from a distance at which the animals behavior is not changed by your presence. Attributes 1. Type: Choose one of the following from the menu of sensitive species: a. Bird nest b. Mammal den c. Animals d. Hauled out pinniped e. Exotic plant f. Other 2. Species: Choose one of the following from the menu: a. BLOY b. ARTE c. Gull d. Weasel e. Canine f. Bear g. Marmot h. Boreal Toad i. Dandelions j. Other k. Unknown 3. Number: If applicable, enter the number of nests, dens, or other sensitive species. Not necessary for dandelions, etc. 4. Description: A 50 character memo field to write any necessary notes on your observation. Vis Created Trail A visitor-created trail connects known areas of visitor use, such as campsites, water sources, food storage areas, viewpoints, and intertidal access. Only include trails that are 5-meters in length or longer. Do not map wildlife trails. Walk and map any visitor-created trails in the survey area. The Vis Created Trail is set to collect a location every 1 second. This creates a more precise line feature. However, you don t want to stop and stand around without pausing while logging or you ll get a big jumbled mess of lines! Record any relevant information in the Comments field. 72
82 Interstadial Wood Collect a point to indicate the location of any large pieces of interstadial wood within the survey area. Use the drop down menu to indicate whether there is any Human-caused damage present. Record any relevant information in the Comments field. Taking Campsite Reference Photos Using the Trimble Nomad GPS Before taking the photo, make sure the data logger is paused and the GPS is not collecting any position data. 1. From TerraSynch, tap on the Windows icon in the top left corner of the screen. Select Pictures and Videos from the drop down menu. A new window will open. 2. Tap the Camera icon in the top left corner of the window. 3. Aim the front of the Nomad at the campsite. The screen will function as the viewfinder of the camera. 4. Press the Enter button [ ] on the front of the Nomad to take the picture. 5. Underneath the picture, select Menu. 6. Click on Properties. Name the file using the 3-digit survey area code and campsite number using the following format: <survey area>_<campsite number>. For example, the reference photo for campsite 4 in survey area 007 would be named 007_4.jpg. 7. Close the camera program by clicking OK in the top right corner. You will be back in the campsite feature in TerraSynch that you collected previously. 8. Under the Reference Photo field, tap the box with the stylus. You should see a list of files in the My Pictures folder. If necessary, navigate to the correct folder by tapping the [ ] icon next to the drop down box. 9. Select the file for this campsite (007_4.jpg). The most recent photo should appear at the top of the list. To view or verify the file, tap the Play button (looks like a right-pointing triangle) next to the box. The picture you have selected will be displayed. To clear the preview, click OK. 73
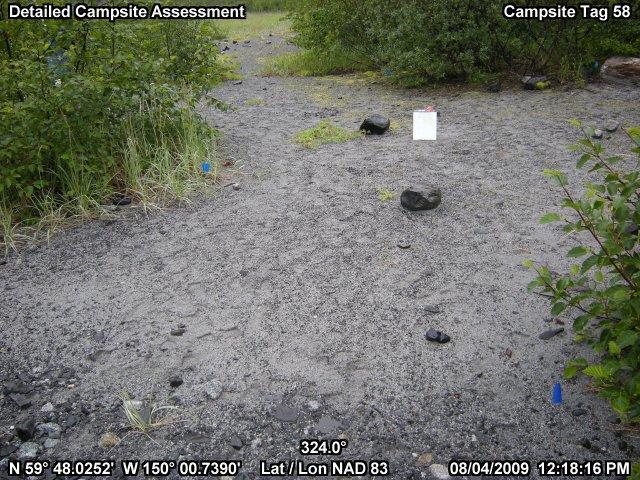
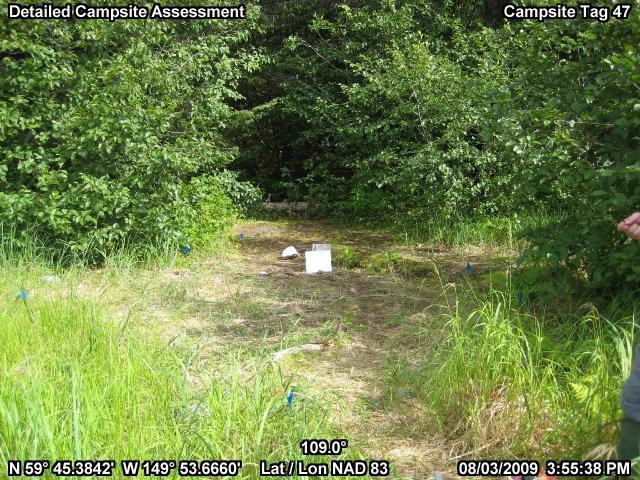
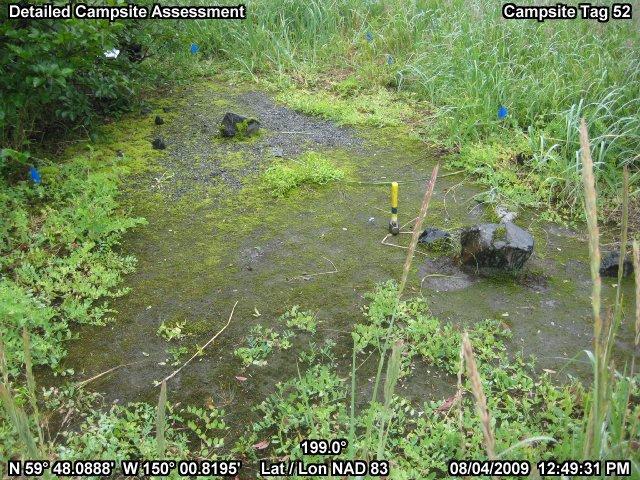
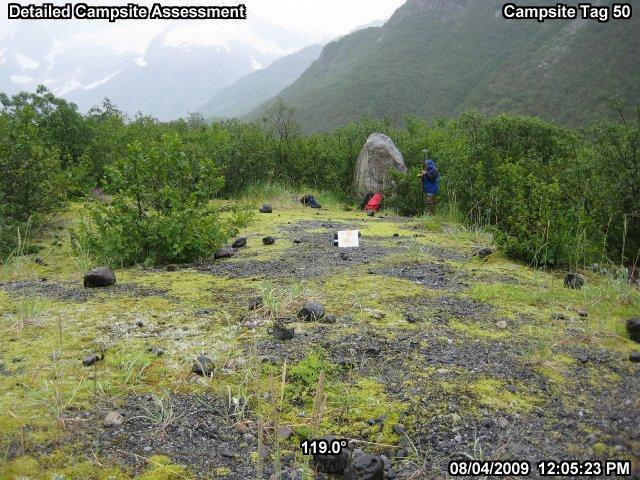
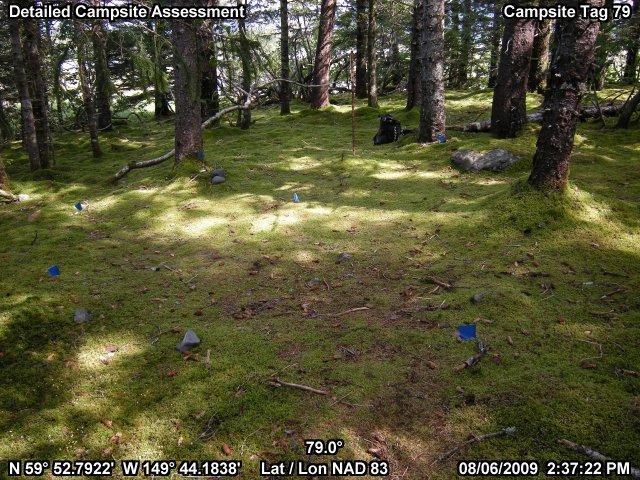
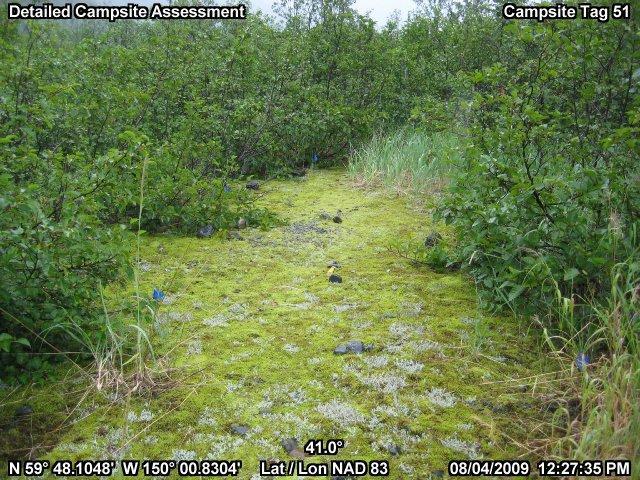
83 Vegetation Reference Photos Cover On Site 0-5% cover 6-25% cover 26-50% cover 51-75% cover 76-95% cover % cover 74


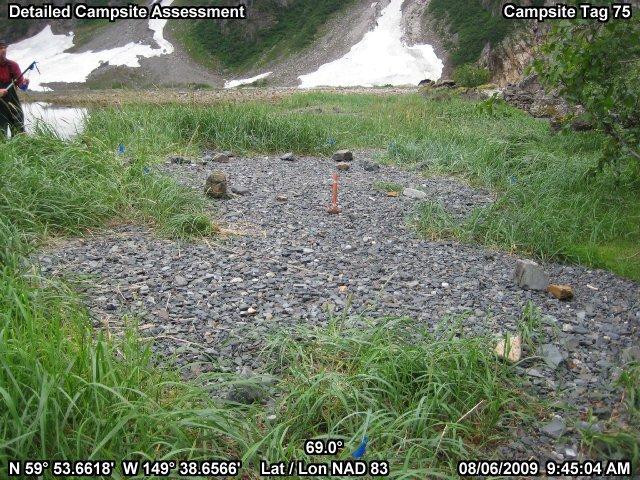
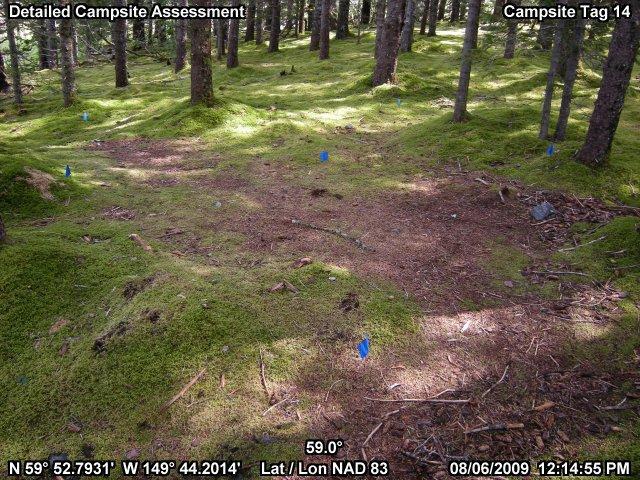
84 Cover Off Site 0-5% cover 6-25% cover 26-50% cover 51-75% cover 76-95% cover % cover 75
More people floated the Colorado River through
 STEWARDSHIP Managing Campsite Impacts on Wild Rivers Are There Lessons for Wilderness Managers? BY DAVID N. COLE Abstract: Campsites on popular wild rivers in the United States are heavily used by large
Recreation Opportunity Spectrum for River Management v
 Recreation Opportunity Spectrum for Management v. 120803 Introduction The following Recreation Opportunity Spectrum (ROS) characterizations and matrices mirror the presentation in the ROS Primer and Field
Labrador - Island Transmission Link Target Rare Plant Survey Locations
 27-28- Figure: 36 of 55 29-28- Figure: 37 of 55 29- Figure: 38 of 55 #* Figure: 39 of 55 30- - east side Figure: 40 of 55 31- Figure: 41 of 55 31- Figure: 42 of 55 32- - secondary Figure: 43 of 55 32-
A Relatively Nonrestrictive Approach to Reducing Campsite Impact
 SCIENCE and RESEARCH A Relatively Nonrestrictive Approach to Reducing Campsite Impact Caney Creek Wilderness, Arkansas BY DAVID N. COLE AND THOMAS E. FERGUSON Abstract: An excessive number of highly impacted
Development of Campsite Monitoring Protocols in Kenai Fjords
 Utah State University From the SelectedWorks of Christopher Monz January 1, 2011 Development of Campsite Monitoring Protocols in Kenai Fjords F. Klasner Christopher Monz, Utah State University J. Cusick
U.S. Forest Service National Minimum Protocol for Monitoring Outstanding Opportunities for Solitude
 U.S. Forest Service National Minimum Protocol for Monitoring Outstanding Opportunities for Solitude Element 5 of the 10-Year Wilderness Stewardship Challenge May 15, 2014 1 Solitude Minimum Protocol Version
Appalachian Trail Sustainability Research Study
 Appalachian Trail Sustainability Research Study Appalachian National Scenic Trail 2,175 mile footpath from Maine to Georgia Crosses 14 states, 6 NPS units, and 8 National Forests, Managed by the NPS A.T.
DIRECTOR S ORDER #41: Wilderness Preservation and Management
 These are relevant sections about Wilderness Management Plans from National Park Service 2006 Management Policies, Director s Orders #41 and Reference Manual 41. National Park Service U.S. Department of
RE: Access Fund Comments on Yosemite National Park Wilderness Stewardship Plan, Preliminary Ideas and Concepts
 September 30, 2016 Superintendent Yosemite National Park Attn: Wilderness Stewardship Plan P.O. Box 577 Yosemite, CA 95389 RE: Access Fund Comments on Yosemite National Park Wilderness Stewardship Plan,
Connie Rudd Superintendent, Black Canyon of the Gunnison National Park
 National Park Service U.S. Department of the Interior Black Canyon of the Gunnison National Park and Curecanti National Recreation Area Information Brochure #1 Wilderness and Backcountry Management Plan
Theme: Predominately natural/natural appearing; rustic improvements to protect resources. Size*: 2,500 + acres Infrastructure**:
 Recreation Opportunity Spectrum (ROS) Classes The Recreation Opportunity Spectrum (ROS) provides a way to describe the variations in the degree of isolation from the sounds and influences of people, and
San Juan Resource Area Recreation Impact Inventory/Monitoring
 San Juan Resource Area Recreation Impact Inventory/Monitoring Indian Creek Climbing Area Overview & Summary of Findings 2007 Pam Foti, Professor Aaron Divine, Lecturer Janet Lynn, Program Coordinator Northern
Keeping Wilderness Wild: Increasing Effectiveness With Limited Resources
 Keeping Wilderness Wild: Increasing Effectiveness With Limited Resources Linda Merigliano Bryan Smith Abstract Wilderness managers are forced to make increasingly difficult decisions about where to focus
WORKSHEET 1 Wilderness Qualities or Attributes Evaluating the Effects of Project Activities on Wilderness Attributes
 WORKSHEET 1 Wilderness Qualities or Attributes Evaluating the Effects of Project Activities on Wilderness Attributes Date: 3/7/2017 Roadless Area: Ruby South Description of Project Activity or Impact to
Marchand Provincial Park. Management Plan
 Marchand Provincial Park Management Plan 2 Marchand Provincial Park Table of Contents 1. Introduction... 3 2. Park History... 3 3. Park Attributes... 4 3.1 Natural... 4 3.2 Recreational... 4 3.3 Additional
CONGESTION MONITORING THE NEW ZEALAND EXPERIENCE. By Mike Curran, Manager Strategic Policy, Transit New Zealand
 CONGESTION MONITORING THE NEW ZEALAND EXPERIENCE 26 th Australasian Transport Research Forum Wellington New Zealand 1-3 October 2003 By, Manager Strategic Policy, Transit New Zealand Abstract New Zealand
The Roots of Carrying Capacity
 1 Applying Carrying Capacity Concepts in Wilderness 1872 1964...shall be preserved for the use & enjoyment of the American people...in such manner as will leave them unimpaired for future generations...
Wilderness Stewardship Plan Scoping Newsletter Winter 2013
 Olympic National Park National Park Service U.S. Department of the Interior Wilderness Stewardship Plan Scoping Newsletter Winter 2013 Dear Friends and Neighbors, The Olympic Wilderness was established
Appendix A BC Provincial Parks System Goals
 Appendix A BC Provincial Parks System Goals The British Columbia Provincial Parks System has two mandates: To conserve significant and representative natural and cultural resources To provide a wide variety
Applying Carrying Capacity Concepts in Wilderness
 Applying Carrying Capacity Concepts in Wilderness...shall be preserved for the use & enjoyment of the American people...in such manner as will leave them unimpaired for future generations... CSS 490 Professor
MEASURING ACCESSIBILITY TO PASSENGER FLIGHTS IN EUROPE: TOWARDS HARMONISED INDICATORS AT THE REGIONAL LEVEL. Regional Focus.
 Regional Focus A series of short papers on regional research and indicators produced by the Directorate-General for Regional and Urban Policy 01/2013 SEPTEMBER 2013 MEASURING ACCESSIBILITY TO PASSENGER
RECREATION. Seven issues were identified that pertain to the effects of travel management on outdoor recreation within portions of the project area.
 RECREATION Seven issues were identified that pertain to the effects of travel management on outdoor recreation within portions of the project area. OPPORTUNITIES FOR SOLITUDE / QUIET TRAILS. One attraction
Draft Concept Alternatives Analysis for the Inaugural Airport Program September 2005
 Draft Concept Alternatives Analysis for the Inaugural Airport Program September 2005 Section 3 - Refinement of the Ultimate Airfield Concept Using the Base Concept identified in Section 2, IDOT re-examined
Dear Reviewing Officer:
 From: To: Subject: Date: Attachments: Peter Hart FS-r02admin-review Objection Re: Maroon Bells Snowmass Wilderness Overnight Visitor Use Management Plan Monday, August 14, 2017 8:38:01 PM Final Objection
Decision Memo Broken Wheel Ranch Equestrian Outfitter Special-Use Permit Proposed Action
 Decision Memo Broken Wheel Ranch Equestrian Outfitter Special-Use Permit USDA Forest Service Mississippi Bluffs Ranger District, Shawnee National Forest Jackson and Union Counties, Illinois Proposed Action
Overview. Wilderness Act of Statement of Need. What is Wilderness Character. Monitoring Wilderness Character
 Overview Monitoring Wilderness Character What What & Why? How? How? Conceptual Development How? How? Implementation Future? Future? Troy Hall Steve Boutcher USFS Wilderness & Wild and Scenic River Program
Kicking the Alpine Plants Out Mountain Goat Wallows In Mount Peale Research Natural Area (La Sal Mountains, Utah)
") Kicking the Alpine Plants Out Mountain Goat Wallows In Mount Peale Research Natural Area (La Sal Mountains, Utah) Marc Coles-Ritchie, Grand Canyon Trust November 21, 2017 Mountain goats are digging up
Kicking the Alpine Plants Out Mountain Goat Wallows In Mount Peale Research Natural Area (La Sal Mountains, Utah) Marc Coles-Ritchie, Grand Canyon Trust November 21, 2017 Mountain goats are digging up
Sawtooth National Forest Fairfield Ranger District
 United States Department of Agriculture Forest Service Sawtooth National Forest Fairfield Ranger District P.O. Box 189 Fairfield, ID. 83327 208-764-3202 Fax: 208-764-3211 File Code: 1950/7700 Date: December
HOW TO IMPROVE HIGH-FREQUENCY BUS SERVICE RELIABILITY THROUGH SCHEDULING
 HOW TO IMPROVE HIGH-FREQUENCY BUS SERVICE RELIABILITY THROUGH SCHEDULING Ms. Grace Fattouche Abstract This paper outlines a scheduling process for improving high-frequency bus service reliability based
TONGASS NATIONAL FOREST
 TONGASS NATIONAL FOREST UNITED STATES DEPARTMENT OF AGRICULTURE-FOREST SERVICE Contact: Dennis Neill Phone: 907-228-6201 Release Date: May 17, 2002 SEIS Questions and Answers Q. Why did you prepare this
DECISION MEMO. Rawhide Trail #7073 Maintenance and Reconstruction
 Page 1 of 6 Background DECISION MEMO USDA Forest Service Jefferson Ranger District Jefferson County, Montana Rawhide Trail #7073 is located in the Elkhorn Mountain Range approximately 10 miles east of
Flying Cloud Airport (FCM) Zoning Process: Informing a Mn/DOT Path Forward
 Zoning Process: Informing a Mn/DOT Path Forward") : Informing a Mn/DOT Path Forward A Review of the Flying Cloud Airport (FCM) Joint Airport Zoning Board (JAZB) Process and the Draft Airport Zoning Ordinance B A RPZ RPZ A B C Zone Chad E. Leqve Director
: Informing a Mn/DOT Path Forward A Review of the Flying Cloud Airport (FCM) Joint Airport Zoning Board (JAZB) Process and the Draft Airport Zoning Ordinance B A RPZ RPZ A B C Zone Chad E. Leqve Director
WILDERNESS AS A PLACE: HUMAN DIMENSIONS OF THE WILDERNESS EXPERIENCE
 WILDERNESS AS A PLACE: HUMAN DIMENSIONS OF THE WILDERNESS EXPERIENCE Chad P. Dawson State University of New York College of Environmental Science and Forestry Syracuse, NY 13210 Abstract. Understanding
City of Durango 5.8 FUNDING TRAILS DEVELOPMENT
 5.8 FUNDING TRAILS DEVELOPMENT The City has been successful in establishing dedicated local funding sources as well as applying for grants to develop the City s trail system, having received nearly $2.4
PROPOSED PARK ALTERNATIVES
 8 Chimne y Rock State Park M a ster Pl an 2011 PROPOSED PARK ALTERNATIVES Introduction Three different park development concepts were prepared and presented to the citizens of North Carolina through a
Preferred Recreation Recommendations Stemilt-Squilchuck Recreation Plan March 2018
 Preferred Recreation Recommendations Stemilt-Squilchuck Recreation Plan March 2018 Below are the recommended recreation ideas and strategies that package together the various recreation concepts compiled
Daisy Dean Trail 628/619 ATV Trail Construction
 Background and Purpose and Need The Daisy Dean ATV Trail Construction Project is located in the Little Belt Mountains, Musselshell Ranger District, Lewis and Clark National Forest approximately 32 miles
Central Cascades Wilderness Strategies Project
 Central Cascades Wilderness Strategies Project Wilderness is Unique What makes designated Wilderness different from other national forest lands? Wilderness Act of 1964 to assure that an increasing population
Final Environmental Impact Statement for the Merced Wild and Scenic River. Comprehensive Management Plan, Yosemite National Park, Madera and Mariposa
 This document is scheduled to be published in the Federal Register on 02/26/2014 and available online at http://federalregister.gov/a/2014-04061, and on FDsys.gov DEPARTMENT OF THE INTERIOR 4312-FF NATIONAL
Executive Summary. MASTER PLAN UPDATE Fort Collins-Loveland Municipal Airport
 Executive Summary MASTER PLAN UPDATE Fort Collins-Loveland Municipal Airport As a general aviation and commercial service airport, Fort Collins- Loveland Municipal Airport serves as an important niche
Logo Department Name Agency Organization Organization Address Information 5700 North Sabino Canyon Road
 Logo Department Name Agency Organization Organization Address Information United States Forest Coronado National Forest 5700 North Sabino Canyon Road Department of Service Santa Catalina Ranger District
LATENCY OF TOURISM PERMITS IN THE GREAT BARRIER REEF MARINE PARK AUDIT FOR THE YEAR 2000
 LATENCY OF TOURISM PERMITS IN THE GREAT BARRIER REEF MARINE PARK AUDIT FOR THE YEAR 2 Tourism and Recreation Group December 2 DISCLAIMER The information provided in this Audit is for information and discussion
Numaykoos Lake Provincial Park. Management Plan
 Numaykoos Lake Provincial Park Management Plan 2 Numaykoos Lake Provincial Park Table of Contents 1. Introduction... 3 2. Background... 3 3. Park Purpose... 5 4. Park Management Guidelines... 6 Appendix...
NETWORK MANAGER - SISG SAFETY STUDY
 NETWORK MANAGER - SISG SAFETY STUDY "Runway Incursion Serious Incidents & Accidents - SAFMAP analysis of - data sample" Edition Number Edition Validity Date :. : APRIL 7 Runway Incursion Serious Incidents
TEACHER PAGE Trial Version
 TEACHER PAGE Trial Version * After completion of the lesson, please take a moment to fill out the feedback form on our web site (https://www.cresis.ku.edu/education/k-12/online-data-portal)* Lesson Title:
Watchorn Provincial Park. Management Plan
 Watchorn Provincial Park Management Plan 2 Watchorn Provincial Park Table of Contents 1. Introduction... 3 2. Park History... 3 3. Park Attributes... 3 3.1 Natural... 4 3.2 Recreational... 4 3.3 Additional
A GIS Analysis of Probable High Recreation Use Areas in Three Sisters Wilderness Deschutes and Willamette National Forests
 Lindsey Kiesz Geo 565 Term Project 3/15/2010 A GIS Analysis of Probable High Recreation Use Areas in Three Sisters Wilderness Deschutes and Willamette National Forests Introduction The Three Sisters Wilderness
Aboriginal and Torres Strait Islander Life Expectancy and Mortality Trend Reporting
 Aboriginal and Torres Strait Islander Life Expectancy and Mortality Trend Reporting Technical Report December 2015 Amended May 2016 Authors: Clare Coleman, Nicola Fortune, Vanessa Lee, Kalinda Griffiths,
SEGMENT ASSESSMENT REPORT
 2017 SEGMENT ASSESSMENT REPORT SEGMENT 3: MT ROSE / TAHOE MEADOWS TO SPOONER SUMMIT REPORT SUMMARY This report is a compilation of information collected on the Tahoe Rim Trail during assessments performed
Wilderness Research. in Alaska s National Parks. Scientists: Heading to the Alaska Wilderness? Introduction
 Wilderness Research in Alaska s National Parks National Park Service U.S. Department of Interior Scientists: Heading to the Alaska Wilderness? Archeologist conducts fieldwork in Gates of the Arctic National
Pembina Valley Provincial Park. Draft Management Plan
 Pembina Valley Provincial Park Draft Management Plan 2 Pembina Valley Provincial Park Table of Contents 1. Introduction... 3 2. Park History... 3 3. Park Attributes... 3 3.1 Natural... 3 3.2 Recreational...
National Wilderness Steering Committee
 National Wilderness Steering Committee Guidance White Paper Number 1 Issue: Cultural Resources and Wilderness Date: November 30, 2002 Introduction to the Issue Two of the purposes of the National Wilderness
Visual and Sensory Aspect
 Updated All Wales LANDMAP Statistics 2017 Visual and Sensory Aspect Final Report for Natural Resources Wales February 2018 Tel: 029 2043 7841 Email: sw@whiteconsultants.co.uk Web: www.whiteconsultants.co.uk
Wallowa Falls Hydroelectric Project FERC Project No. P-308 Proposed Study Plans - Recreation August 2011
 Wallowa Falls Hydroelectric Project FERC Project No. P-308 August 2011 Prepared by: PacifiCorp Energy Hydro Resources 825 NE Multnomah, Suite 1500 Portland, OR 97232 For Public Review Wallowa Falls Hydroelectric
SOCIAL CONFLICT BETWEEN MOTORIZED AND NON-MOTORIZED RECREATIONAL ACTIVITIES.
 SOCIAL CONFLICT BETWEEN MOTORIZED AND NON-MOTORIZED RECREATIONAL ACTIVITIES. There is a great disparity in opinions about the effects on a person s recreational experience when they encounter others on
Exemplar for Internal Achievement Standard Geography Level 1. Conduct geographic research, with direction
 Exemplar for internal assessment resource Geography for Achievement Standard 91011 Exemplar for Internal Achievement Standard Geography Level 1 This exemplar supports assessment against: Achievement Standard
Aboriginal and Torres Strait Islander Life Expectancy and Mortality Trend Reporting to 2014
 Aboriginal and Torres Strait Islander Life Expectancy and Mortality Trend Reporting to 2014 Technical Report June 2016 Authors: Clare Coleman, Nicola Fortune, Vanessa Lee, Kalinda Griffiths, Richard Madden
PURPOSE AND NEED. Introduction
 Public Scoping: Allocation of Recreation Capacity for Commercial Outfitter Guide Services on North Kruzof Island Trails (Kruzof Island Outfitter Guide) PURPOSE AND NEED Introduction The U.S. Department
FLORIDA DEPARTMENT OF ENVIRONMENTAL PROTECTION DIVISION OF RECREATION AND PARKS RECREATIONAL CARRYING CAPACITY GUIDELINES
 FLORIDA DEPARTMENT OF ENVIRONMENTAL PROTECTION DIVISION OF RECREATION AND PARKS RECREATIONAL CARRYING CAPACITY GUIDELINES THE SELECTION AND CAPACITY DETERMINATION OF USE SITES Introduction The Division
Chattahoochee- Oconee National Forests. Decision Memo
 Page 1 of 6 USDA Forest Service Chattahoochee- Oconee National Forests Decision Memo Chattahoochee-Oconee National Forests Home Page Recreation Information Forest History Forest Facts Forest Management
USDA Trails Strategy WRI: ENGLISH PEAK SURVEY. Theodore Mendoza San Diego State University June 6 th 2016 August 18 th Advisor: Sam Commarto
 WRI: ENGLISH PEAK SURVEY Theodore Mendoza San Diego State University June 6 th 2016 August 18 th 2016 Advisor: Sam Commarto Klamath National Forest Submitted: March 21, 2017 Table of Contents Acknowledgements
An Econometric Study of Flight Delay Causes at O Hare International Airport Nathan Daniel Boettcher, Dr. Don Thompson*
 An Econometric Study of Flight Delay Causes at O Hare International Airport Nathan Daniel Boettcher, Dr. Don Thompson* Abstract This study examined the relationship between sources of delay and the level
American Airlines Next Top Model
 Page 1 of 12 American Airlines Next Top Model Introduction Airlines employ several distinct strategies for the boarding and deboarding of airplanes in an attempt to minimize the time each plane spends
MANAGING AMERICA S WILDERNESS ENDURING RESOURCE
 PUB #l96 MANAGING AMERICA S ENDURING WILDERNESS RESOURCE Campsite Management and Monitoring in Wilderness Some Principles To Guide Wilderness Campsite Management David N. Cole EDITED BY: David W. Lime
SAMTRANS TITLE VI STANDARDS AND POLICIES
 SAMTRANS TITLE VI STANDARDS AND POLICIES Adopted March 13, 2013 Federal Title VI requirements of the Civil Rights Act of 1964 were recently updated by the Federal Transit Administration (FTA) and now require
Wallace Lake Provincial Park. Management Plan
 Wallace Lake Provincial Park Management Plan 2 Wallace Lake Provincial Park Table of Contents 1. Introduction... 3 2. Park History... 3 3. Park Attributes... 4 3.1 Natural... 4 3.2 Recreational... 4 4.
METROBUS SERVICE GUIDELINES
 METROBUS SERVICE GUIDELINES In the late 1990's when stabilization of bus service was accomplished between WMATA and the local jurisdictional bus systems, the need for service planning processes and procedures
Photopoint Monitoring in the Adirondack Alpine Zone
 Photopoint Monitoring in the Adirondack Alpine Zone Julia Goren (PI) and Seth Jones Adirondack High Peaks Summit Steward Program Adirondack Mountain Club summit@adk.org PO Box 867, Lake Placid, NY 12946
Thank you for this second opportunity to comment on the proposed revisions to the Coconino National Forest Management plan.
 March 8, 2011 Flagstaff Biking Organization PO Box 23851 Flagstaff, AZ 86002 Yewah Lau Coconino National Forest Attn: Plan Revision 1824 South Thompson Street Flagstaff, Arizona 86001 Sent via electronic
Rogue River Access and Management Plan Draft Alternatives
 Rogue River Access and Management Plan Draft Alternatives The Rogue River Access and Management Plan was initiated in December, 2011 and is being led by Jackson County Parks (JCP) and Oregon Department
DRONE SIGHTINGS ANALYSIS AND RECOMMENDATIONS
 DRONE SIGHTINGS ANALYSIS AND RECOMMENDATIONS UNMANNED AIRCRAFT SAFETY TEAM DRONE SIGHTINGS WORKING GROUP DECEMBER 12, 2017 1 UNMANNED AIRCRAFT SAFETY TEAM DRONE SIGHTINGS WORKING GROUP EXECUTIVE SUMMARY
Ecological impacts in mountain protected areas
 Ecological impacts in mountain protected areas International Programme on Research and Training on Sustainable Management of Mountain Areas (IPROMO) July 2010 International Centre for Ecotourism Research,
Decision Memo for Desolation Trail: Mill D to Desolation Lake Trail Relocation
 for Salt Lake County, Utah Uinta-Wasatch-Cache National Forest Salt Lake Ranger District 1. Background The present location of the Desolation Trail (#1159) between Mill D and Desolation Lake follows old
A GUIDE TO MANITOBA PROTECTED AREAS & LANDS PROTECTION
 A GUIDE TO MANITOBA PROTECTED AREAS & LANDS PROTECTION Manitoba Wildands December 2008 Discussions about the establishment of protected lands need to be clear about the definition of protection. We will
ARRIVAL CHARACTERISTICS OF PASSENGERS INTENDING TO USE PUBLIC TRANSPORT
 ARRIVAL CHARACTERISTICS OF PASSENGERS INTENDING TO USE PUBLIC TRANSPORT Tiffany Lester, Darren Walton Opus International Consultants, Central Laboratories, Lower Hutt, New Zealand ABSTRACT A public transport
2013 Business & Legislative Session Visitor Satisfaction Survey Results
 2013 Business & Legislative Session Visitor Satisfaction Survey Results Completed by Juneau Economic Development Council in partnership with The Alaska Committee August 2013 JEDC research efforts are supported
JOSLIN FIELD, MAGIC VALLEY REGIONAL AIRPORT DECEMBER 2012
 1. Introduction The Federal Aviation Administration (FAA) recommends that airport master plans be updated every 5 years or as necessary to keep them current. The Master Plan for Joslin Field, Magic Valley
VAST Challenge 2017 Reviewer Guide: Mini-Challenge 1
 VAST Challenge 2017 Reviewer Guide: Mini-Challenge 1 This document provides information to support peer review of submissions to VAST Challenge 2017, Mini-Challenge 1. It covers background about the submission
Cultural Resource Management Report Deer Valley 4wd Restoration and Blue Lakes Road Maintenance Project R
 Cultural Resource Management Report R2015-05-03-10005 Undertaking Description: The proposes to perform road maintenance and meadow restoration on the Deer Valley 4wd trail and road maintenance on the Blue
Estimates of the Economic Importance of Tourism
 Estimates of the Economic Importance of Tourism 2008-2013 Coverage: UK Date: 03 December 2014 Geographical Area: UK Theme: People and Places Theme: Economy Theme: Travel and Transport Key Points This article
Susitna-Watana Hydroelectric Project (FERC No ) Recreation Resources Study Study Plan Section Study Implementation Report
 Recreation Resources Study Study Plan Section Study Implementation Report") (FERC No. 14241) Recreation Resources Study Study Plan Section 12.5 2014 Study Implementation Report Prepared for Prepared by AECOM November 2015 TABLE OF CONTENTS 1. Introduction... 4 2. Study Objectives...
(FERC No. 14241) Recreation Resources Study Study Plan Section 12.5 2014 Study Implementation Report Prepared for Prepared by AECOM November 2015 TABLE OF CONTENTS 1. Introduction... 4 2. Study Objectives...
Recreational Carrying Capacity
 9 th Annual Caribbean Sustainable Tourism Conference Recreational Carrying Capacity Graham C Barrow What is Recreational Carrying Capacity? It s not about fixing absolute numbers of visitors/tourists that
Underwater Acoustic Monitoring in US National Parks
 Underwater Acoustic Monitoring in US National Parks Megan F McKenna 1, Christopher Garsha 2, Erik Stabenau 1, Christine Gabriele 1, Timothy Clark 1, Clayton Pollock 1, Brinnen Carter 1, Samantha Bietsch
AURORA WILDLIFE RESEARCH
 AURORA WILDLIFE RESEARCH Kim Poole 2305 Annable Rd. Nelson, BC, V1L 6K4 Canada Tel: (250) 825-4063; Fax: (250) 825-4073 e-mail: klpoole@shaw.ca 27 April 2005 Mike Gall Conservation Specialist and Glenn
Managing Informal Trail Impacts. Jeff Marion, Unit Leader/Scientist Virginia Tech Field Unit, USGS, Patuxent WRC
 Managing Informal Trail Impacts Jeff Marion, Unit Leader/Scientist Virginia Tech Field Unit, USGS, Patuxent WRC jmarion@vt.edu, 540-231-6603 Presentation Objectives Informal Trail Management!! Decision
THIRTEENTH AIR NAVIGATION CONFERENCE
 International Civil Aviation Organization AN-Conf/13-WP/22 14/6/18 WORKING PAPER THIRTEENTH AIR NAVIGATION CONFERENCE Agenda Item 1: Air navigation global strategy 1.4: Air navigation business cases Montréal,
CHAPTER 3 ALTERNATIVES CONSIDERED
 CHAPTER 3 ALTERNATIVES CONSIDERED 3.0 ALTERNATIVES The 2010 Stevensville Airport Master Plan contained five (5) airside development options designed to meet projected demands. Each of the options from
CHAPTER IV. CHARACTERIZING BACKCOUNTRY CAMPING IMPACTS AND THEIR SPATIAL PATTERNS IN GREAT SMOKY MOUNTAINS NATIONAL PARK
 CHAPTER IV. CHARACTERIZING BACKCOUNTRY CAMPING IMPACTS AND THEIR SPATIAL PATTERNS IN GREAT SMOKY MOUNTAINS NATIONAL PARK Abstract This study investigates resource impacts and spatial patterns of backcountry
National Park Service Wilderness Action Plan
 National Park Service U.S. Department of the Interior National Park Service Wilderness Action Plan National Wilderness Steering Committee National Park Service "The mountains can be reached in all seasons.
Birch Point Provincial Park. Management Plan
 Birch Point Provincial Park Management Plan 2 Birch Point Provincial Park Table of Contents 1. Introduction... 3 2. Park History... 3 3. Park Attributes... 4 3.1 Natural... 4 3.2 Recreational... 4 4. Park
White Mountain National Forest
 White Mountain National Forest United States Department of Agriculture Forest Service Eastern Region Boles Brook Snowmobile Bridge Decision Memo Boles Brook Snowmobile Bridge Project Town of Woodstock
Submission to NSW Koala Strategy Consultation Process. March 2017
 Submission to NSW Koala Strategy Consultation Process March 2017 Table of contents Opening 3 Response 3 Whole-of-government NSW koala strategy 3 State Environment Planning Policy (SEPP) 44 3 The draft
Beaver Creek Provincial Park. Management Plan
 Beaver Creek Provincial Park Management Plan 2 Beaver Creek Provincial Park Table of Contents 1. Introduction... 3 2. Park History... 3 3. Park Attributes... 4 3.1 Natural... 4 3.2 Recreational... 4 4.
Appendix B Ultimate Airport Capacity and Delay Simulation Modeling Analysis
 Appendix B ULTIMATE AIRPORT CAPACITY & DELAY SIMULATION MODELING ANALYSIS B TABLE OF CONTENTS EXHIBITS TABLES B.1 Introduction... 1 B.2 Simulation Modeling Assumption and Methodology... 4 B.2.1 Runway
Visitors Experiences and Preferences at Lost Lake in Clatsop State Forest, Oregon
 Visitors Experiences and Preferences at Lost Lake in Clatsop State Forest, Oregon Final Report Mark D. Needham, Ph.D. Assistant Professor Recreation Resource Management Program Department of Forest Resources
RE: Draft AC , titled Determining the Classification of a Change to Type Design
 Aeronautical Repair Station Association 121 North Henry Street Alexandria, VA 22314-2903 T: 703 739 9543 F: 703 739 9488 arsa@arsa.org www.arsa.org Sent Via: E-mail: 9AWAAVSDraftAC2193@faa.gov Sarbhpreet
USE OF 3D GIS IN ANALYSIS OF AIRSPACE OBSTRUCTIONS
 USE OF 3D GIS IN ANALYSIS OF AIRSPACE OBSTRUCTIONS A project by by Samuka D. W. F19/1461/2010 Supervisor; Dr D. N. Siriba 1 Background and Problem Statement The Airports in Kenya are the main link between
PREFACE. Service frequency; Hours of service; Service coverage; Passenger loading; Reliability, and Transit vs. auto travel time.
 PREFACE The Florida Department of Transportation (FDOT) has embarked upon a statewide evaluation of transit system performance. The outcome of this evaluation is a benchmark of transit performance that
PASSENGER SHIP SAFETY. Damage stability of cruise passenger ships. Submitted by the Cruise Lines International Association (CLIA) SUMMARY
 SUMMARY") E MARITIME SAFETY COMMITTEE 93rd session Agenda item 6 MSC 93/6/6 11 March 2014 Original: ENGLISH PASSENGER SHIP SAFETY Damage stability of cruise passenger ships Submitted by the Cruise Lines International
E MARITIME SAFETY COMMITTEE 93rd session Agenda item 6 MSC 93/6/6 11 March 2014 Original: ENGLISH PASSENGER SHIP SAFETY Damage stability of cruise passenger ships Submitted by the Cruise Lines International
Proposal to Redevelop Lower Kananaskis River-Barrier Lake. Bow Valley Provincial Park
 Frequently Asked Questions Proposal to Redevelop Lower Kananaskis River-Barrier Lake Bow Valley Provincial Park Frequently Asked Questions What has been decided? What are the details of the plan? What