Cornwall Visitor Survey 2010
|
|
|
- Everett Hodges
- 5 years ago
- Views:
Transcription
1 Cornwall Visitor Survey Report Produced for and on behalf of VisitCornwall by The South West Research Company March 2011 The South West Research Company
2 Contents Slide Summary 3 Introduction 15 Visitor Profile 22 Characteristics of Visit 31 Information Sourcing 45 Environmental Quality 55 Destinations Visited & Other Activities Undertaken 75 Recommendation, Likes & Dislikes, Suggestions for Improvement 87 APPENDICES 2
3 Overview The South West Research Company
4 Overview The findings contained within this report clearly highlight that Cornwall has a loyal following of visitors who are generally very satisfied with the holiday product on offer to them. Indeed, the majority of staying visitors had not considered visiting any other destination for their trip and would be likely to recommend the county as a place to visit to their friends and/or family. The internet has now become the number one information source amongst visitors to the county (prior to their actual trip) with the majority going on-line to book their accommodation and/or attraction tickets/car hire etc. Wi-Fi internet access appears to be less important amongst staying visitors once on holiday in the county with the Tourist Information Centre remaining a key information source for them during this time. The recent strength of the Euro appears to have impacted relatively little on the holiday making decisions of staying visitors to Cornwall with the majority likely to holiday in the county regardless of the exchange rate. Encouragingly, a good proportion of staying visitors who indicated that they did change their holiday plans as a result of the poor exchange rate would still decide to holiday in the UK if the Euro were to return to a more favourable level in the future. Whilst the car remains the most popular form of transport for reaching the county with very few visitors considering any alternatives mode of travel, once on holiday however, a good proportion of staying visitors do enjoy car free days out in the county. Making improvements to the public transport network and ensuring more information is made readily available about public transport routes will be the key drivers to further increasing car free travel amongst visitors to the county. A good proportion of visitors to the county were visiting attractions/places of interest and taking part in activities such as walking and shopping whilst on their trip to Cornwall. Whilst a high level of visitors were aware of the Blue Flag scheme for beaches and Cornwall s historic mining landscape the level of influence of each of these in either helping visitors to decide which beaches to visit or on their decision to visit Cornwall was relatively low. 4

5 Summary The South West Research Company

6 Executive Summary - Context The main aims and objectives of the Cornwall Visitor Survey were: To provide up-to-date information on the profile of tourism in Cornwall and, where appropriate, to compare with the results from previous surveys to identify any emerging trends in the profile of tourism in the county. 555 on street face-to-face interviews with visitors to the county were carried out by a fully trained team of interviewers between July and December. 6

 with a significant proportion living within the South West region (22%).")
7 Executive Summary Visitor Profile Regardless of the time of year 9 out of 10 visitors encountered during the survey were staying overnight in Cornwall during their visit. 82% of adults visiting Cornwall during were doing so in adult only groups. Average group size was 2.72 people. 41% of visitors to the county were aged 55+ years. 54% of visitors were classified into socio economic category ABC1. Almost all visitors interviewed during the survey period were from the UK (94%) with a significant proportion living within the South West region (22%). 6% of visitors were from overseas including 2% from Germany. 7


8 Executive Summary Characteristics of Visit 88% of visitors interviewed during the survey were on a leisure/holiday visit to Cornwall. Around 1 in 5 staying visitors to Cornwall during the survey (19%) were staying in Newquay at the time of their interview. 35% of staying visitors to the county during were on a 7 night stay in Cornwall at the time of their interview. Average length of stay was 6.63 nights. 88% of visitors interviewed during the survey were on a repeat visit to the county. 45% of previous visitors to the county had visited within the last 12 months including 23% within the last six months and 6% within the last month. 8


9 Executive Summary Characteristics of Visit Nine out of ten staying visitors indicated that the recent strength of the Euro and the poor exchange rate had not impacted on their holiday decision. 94% of staying visitors who said the recent strength of the Euro had not impacted on their decision to holiday in the UK this year said their decision would not change if the Euro were to return to a more favourable level. 43% of staying visitors who said that the recent strength of the Euro had impacted on their decision to holiday in the UK this year said their decision would not change if the Euro were to return to a more favourable level. 53% of these staying visitors would choose to go abroad instead if the Euro returned to a more favourable level. 87% of staying visitors had not chosen their holiday to Cornwall in direct preference to another destination suggesting they were planning to visit the county regardless. 9

10 Executive Summary Information Sourcing 41% of staying visitors had used the internet to source information about visiting Cornwall prior to their actual visit. 36% of internet users had used it to source information only whilst 64% had booked their accommodation on-line and /or purchased other goods and services such as car hire, flights etc. over the internet. 80% of internet users had used a search engine site such as Google/Yahoo etc. and a further 31% had used the VisitCornwall website At 60%, the town centre Tourist Information Centre was considered by far the most helpful place to access information whilst on holiday amongst staying visitors followed by their accommodation establishment (43%). 10


11 Executive Summary Information Sourcing The majority of staying visitors (58%) felt it was very unimportant that they had Wi-Fi internet access whilst on holiday followed by a further 13% who also felt it was unimportant but to a lesser degree. 20% of all staying visitors did consider it to be important (13%) or very important (7%) to them that they had Wi-Fi internet access whilst they were on holiday. 54% had used the internet for leisure purposes only whilst on holiday. A further 43% used it for both leisure and business/work purposes and just 5% for business/work purposes only. 72% of staying visitors for whom Wi-Fi internet access was important or very important for them whilst on holiday agreed with statement I do not expect to pay for Wi-Fi internet access whilst on holiday. 11
 had considered using an alterative form of transport for their journey to the county.")

12 Executive Summary Environmental Quality 74% of visitors to Cornwall during the survey had travelled by car or van for the longest part of their journey to the county during their current visit/day trip. Of the 412 visitors in the survey who had arrived by car, van, motorcycle etc. only 37 (9%) had considered using an alterative form of transport for their journey to the county. The average number of car travel hours per day was 1.27 hours or 1 hour 16 minutes. The average number of days car free was 1.06 days or 29%. On days when staying visitors did not use their car 35% of their time was either spent on public transport or in areas close to their accommodation and so they did not require transport. 30% of their time was spent using other forms of transport. 32% of respondents indicated that an improved public transport network would encourage them to take more car free days out whilst visiting the county. A further 31% mentioned better information being available about public transport routes. 12
13 Executive Summary Environmental Quality The average hourly charge considered to be fair and reasonable for car parking in Cornwall was calculated at % of respondents prefer pay on entry machines at car parks which take cash only and a further 57% prefer pay on exit machines which accept both cash and credit card payments. Just 6% of the visitors interviewed as part of the survey were aware of the Highways Agency Holiday Travel Campaign. 84% of the visitors were aware of the Blue Flag scheme for beaches. 23% of visitors were going/or had already been onto a beach with a Blue Flag during their visit to the county. 44% of visitors had not been/or planned to go onto a Blue Flag beach during their visit and 35% did not know. 40% of respondents indicated that the presence of a Blue Flag did influence which beaches they decide to visit, 51% said it did not influence them whilst the remaining 9% were unsure/did not know. 13
14 Executive Summary Environmental Quality 27% of all visitors interviewed as part of the survey were dog owners with 67% of these respondents indicating that they always or sometimes bring their dog with them on holiday/day trips. Overall, the survey findings suggest that 70% of visitors regardless of whether they are a dog owner or not, are happy for dogs to be allowed on designated beaches. 30% of respondents agreed with the statement I think dogs should be allowed on designated beaches only without restriction including 48% dog owners, whist a further 19% agreed with the statement I think dogs should not be allowed on beaches between 1 st May to 30 th Sept with 21% of non dog owners agreeing with this statement. 30% of all respondents did not feel dogs should be allowed on beaches at all at any time of the year and agreed with the statement I think dogs should be banned from all beaches at all times including 38% non dog owners and 9% of dog owners. 14
15 Executive Summary Destinations Visited & Other Activities Undertaken As was the case during previous survey years, St Ives (38%), Truro (38%) and Newquay (37%) were the towns listed by visitors as those which they were most likely to have visited or intended to visit during. 55% of visitors had been/or intended to visit an attraction/place of interest during their trip to Cornwall. The Eden Project (35%), National Trust/English Heritage properties (excl. Lanhydrock House and Tintagel Castle - 19%) and Land s End (18%) were amongst the most popular attractions/places to visit visitors had or were intending to visit during their trip to Cornwall. 87% of the visitors interviewed were aware of the county s historic mining landscape. 54% of visitors were aware that Cornwall has a World Heritage Site status because of it s mining landscape. 9% of respondents indicated that Cornwall s historic mining landscape had influenced their decision to visit the county. 83% of all visitors to Cornwall during the survey had/or were planning to take part in some form of activity during their trip/visit to the county. Going for a short walk (83%) and shopping (79%) were the most popular activities. 15


16 Executive Summary Recommendation, Likes & Dislikes, Suggestions for Improvement Cornwall achieved a high Net Promoter Score of +65% for respondents likelihood of recommending the county as a place to visit to their friends and/or family. The scenery/landscape (27%), ambience/atmosphere of the county (10%) and coastline/sea (10%) were the top 3 factors listed by respondents as things they particularly liked about their visit to Cornwall. The weather (17%) and poor road network (16%), along with the distance of the county from their homes (11%) were the top three factors mentioned by visitors as things they least liked about their visit. When asked if anything could be improved in Cornwall, better/cheaper car parking was suggested by 19% of respondents as well as a further 11% who felt the need for road improvements on the A30/A39 and within some of the towns/villages etc. 16


17 Introduction The South West Research Company
18 Introduction This report presents the findings of the Cornwall Visitor Survey conducted between July and December. The survey was undertaken by The South West Research Company on behalf of VisitCornwall. The survey has been undertaken in the county every two years since 1983 and aims to explore a wide range of topics including, amongst other things, the profile of visitors to the county, the characteristics of holiday visits, visitor motivations and satisfaction levels, information sourcing and transportation. The aim of the research was to provide up-to-date information on the profile of tourism in Cornwall and, where appropriate, to compare with the results from previous surveys to identify any emerging trends in the profile of tourism in the county. Throughout this report direct comparisons have been made, where available, with data from the 2006/7 and 2008/9 surveys to identify any emerging trends over the last four years and between the summer and autumn/winter periods. 555 adults (aged 16 yrs+) were interviewed between July and December at on-street face to face locations throughout the county. 18
19 Background For the purposes of data collection and analysis the survey was divided into two data collection periods: Summer July & August (264 interviews) Autumn/Winter September - December (291 interviews) The report to follow contains the results for the full annual survey including a breakdown of the results by the survey periods detailed above. Where comparative data is available the results have been compared with those from the 2008/9 and 2006/7 surveys. 19
20 Research Aims & Objectives The specific objectives of the research were : To provide up-to-date information on the origin, profile and behaviour of visitors to Cornwall and to explore the nature of their trips made to the county during. To ascertain visitors attitudes towards Wi-Fi internet access whilst on holiday, the impact of the exchange rate on their holiday-taking decisions and car parking charges. To identify visitors motivations to visit Cornwall as well as the quality of their visitor experience whilst on holiday in the county i.e. visitor satisfaction. To establish visitors information requirements before and during their holiday. To ascertain the level of awareness of Cornwall s historic mining landscape amongst visitors and it s level of influence in their decision to visit the county. To establish visitors awareness of the Blue Flag scheme for beaches and it s level of influence when they are deciding which beaches to visit. To ascertain the proportion of visitors bringing a dog on holiday with them and visitors attitudes towards dogs being allowed onto beaches. To identify key trends in relation to all of the above and, where possible, to compare with previous visitor surveys undertaken in Cornwall to identify any long-term and emerging trends so that more informed decisions can be made in relation to marketing initiatives and facility provision, as well as strategic planning. 20
21 Methodology A face to face questionnaire survey was conducted by experienced interviewers between the 23 rd July and 14 th December. Adults (aged 16+ yrs) were sampled on a random basis. 43 interviewing sessions, each lasting approximately 6 hours and typically between 10am and 4pm were undertaken over the survey period. A total of 555 questionnaires were completed during July and August (summer period) and 291 between September and December (autumn/winter period). To ensure only visitors to the county were interviewed filter questions were used to exclude residents of Cornwall and those on day visits concerned with their normal work or regular/household shopping. 21
22 Statistical reliability All sample surveys are subject to statistical error. The size of this error varies with the sample size and also with the order of magnitude of the research findings being considered. The survey results in this report are presented for all visitors and separately for those interviewed during the summer and autumn/winter periods. The table below shows the sample achieved for each type and gives the margins within which one can be 95% certain that the true figures will fall (assuming the sample is random). The figures shown are at the 95% confidence limits. Thus, for example, we can be 95% certain that for all visitors with a result of 50% the true percentage is in the range of 45.8% to 54.2%. For the summer sample the possible range is wider between 44% and 56%. These margins of error shown above should be borne in mind when interpreting the results contained in this report. All Visitors Summer period Autumn/winter period Research findings Sample: 555 Sample: 264 Sample: % or 90% +/ / / % or 80% +/ / / % or 70% +/ / / % or 60% +/ / / % +/ / /
23 Interview locations For comparison with previous years Cornwall Visitor Surveys the interviews were undertaken in six locations within the county. The percentage of interviews achieved at each location is shown in the table below: Interview locations Bude Falmouth Looe Newquay St Ives Trur o All visitors 24% 17% 16% 16% 14% 12% 23

24 Visitor Profile The South West Research Company
25 Summary Regardless of the time of year 9 out of 10 visitors encountered during the survey were staying overnight in Cornwall during their visit. 82% of adults visiting Cornwall during were doing so in adult only groups. Average group size was 2.72 people. 41% of visitors to the county were aged 55+ years. 54% of visitors were classified into socio economic category ABC1. Almost all visitors interviewed during the survey period were from the UK (94%) with a significant proportion living within the South West region (22%). 6% of visitors were from overseas including 2% from Germany. 25
26 Introduction This chapter summarises the main demographic profile of visitors to Cornwall between July and December and reviews the results of a series of questions used to determine this including: Type of visitor (day vs. staying) Group composition (including number of people in the group and average group size) Age group Socio economic grouping Visitor origins 26

27 Visitor Type 9 out of 10 visitors to Cornwall during were staying overnight in the county for one or more nights with this proportion almost unchanged compared with previous survey years. There was little change in visitor type according to the time of year. Visitor Type 4% 5% Type of visitor by season Summer Aut/Win All visitors Day visitor from home 4% 5% 4% Day visitor on holiday 5% 5% 5% 90% Day visitor from home Day visitor on holiday Staying visitor Staying visitor 91 90% 90% 4% of visitors were on a day trip from home i.e. they were travelling to and from their homes on the day of their visit whilst the remaining 5% were on a day trip from a holiday base outside of the county (day visitors on holiday). 27
28 Group Composition 82% of adults visiting Cornwall during were doing so in adult only groups whilst the remaining 18% were visiting the county with children. When comparing the composition of groups visiting the county according to the time of year there is clearly a significant shift in profile. The summer months of saw almost double the proportion of adults with children visiting the county (31%) compared with 17% during the autumn/winter period. Group Composition Group composition by season Summer Aut/Win All visitors Adults with children, 18% Adults only 69% 93% 82% Adults with children 31% 7% 18% Ave. group size by season Summer Aut/Win All visitors Adults only, 82% Ave. children Ave. adults Ave. total group size Average total group size during was 2.72 people, including 0.34 children and 2.37 adults. 28


29 Age Profile Excluding children aged 15 years or younger (who represented 13% of all visitors to the county during ), 41% were aged 55+ including 20% aged and 21% aged % of all visitors were male and 53% female. Age group by season Summer Aut/Win All visitors Age Profile 0-15 yrs 19% 5% 13% yrs 10% 7% 8% yrs 8% 6% 7% yrs 14% 9% 12% yrs 20% 18% 19% yrs 16% 25% 20% 65+ yrs 14% 30% 21% The age profile of visitors to the county clearly changes according to the time of year of visit. The summer months (July and August) saw almost four times as many children coming to the county (19% aged 0-15 yrs) compared with only 5% during the autumn/winter period. In contrast, the autumn/winter saw a significant increase in the proportion of adults aged 55+ (55%) visiting the county compared with just over half this proportion (30%) during the summer time. 20% 21% 19% 13% 8% 7% 12% 0 15 yrs yrs yrs yrs yrs yrs 65+ yrs 29

30 Socio Economic Grouping Using the results from two questions which explored the main occupation of the chief income earner in the respondents household it was possible to categorise interviewees into one of four standard socio economic classifications. Socio Economic Grouping DE, 16% AB, 23% 54% of visitors to the county during the survey were classified as ABC1 s including 23% as AB s and 31% as C1 s. A further 31% of visitors fell into socio economic group C2 and the remaining 16% group DE. A - Approximately 3% of the total population. These are professional people, very senior managers C2, 31% C1, 31% B - Approximately 20% of the total population Middle management executives in large organisations, principal officers in local government, top management or owners of small business concerns. C1 - Approximately 28% of the total population. Junior management, owners of small establishments, and all others in non-manual positions. Socio economic profile by season Summer Aut/Win All visitors AB 25% 21% 23% C1 28% 33% 31% C2 29% 33% 31% DE 18% 13% 16% C2 - Approximately 21% of the total population. All skilled manual workers, and those manual workers with responsibility for other people. D - Approximately 18% of the total population. All semi-skilled and un-skilled manual workers, apprentices and trainees to skilled workers. E - Approximately 10% of the total population. All those entirely dependent on the state long-term, through sickness, unemployment, old age or other reasons. Those unemployed for a period exceeding six months 30
 the same proportion as during the 2008/9 survey.")
31 Visitor Origin 4% Lancashire 4% West Midlands 5% Wales 4% Somerset 10% Devon 94% of visitors to Cornwall during the survey were UK residents compared with 92% during the 2008/9 survey. 22% of all domestic visitors lived within the South West region (but outside of Cornwall*) the same proportion as during the 2008/9 survey. 10% of visitors to the county lived in Devon, compared with 12% during the 2008/9 survey. The county also received a significant proportion of visitors from Wales (5%), Hampshire (5%), the West Midlands (4%), Lancashire (4%) and Somerset (4%). 6% of all visitors to Cornwall during were from overseas a 2% point decrease compared with two years ago (8% during the 2008/9 survey), including 2% from Germany For a full list of visitor origins by UK and overseas see Appendix 2. 5% Hampshire * Please note that Cornish residents were excluded from the survey. 31
32 Trend Data Visitor Type Day visitors from home Day visitors on holiday Staying visitors 2006/7 6% 6% 88% 2008/9 6% 5% 89% 4% 5% 90% Group Composition Adults only Adults with children Average group size 2006/7 82% 18% /9 79% 21% % 18% 2.72 Age Group /7 13% 7% 7% 15% 16% 21% 21% 2008/9 14% 8% 8% 16% 12% 18% 20% 13% 8% 7% 12% 19% 20% 21% Socio-Economic Grouping AB C1 C2 DE 2006/7 15% 38% 35% 17% 2008/9 16% 31% 34% 18% 23% 31% 31% 16% 32

33 Characteristics of Visits The South West Research Company
34 Summary 88% of visitors interviewed during the survey were on a leisure/holiday visit to Cornwall. Around 1 in 5 staying visitors to Cornwall during the survey (19%) were staying in Newquay at the time of their interview. 35% of staying visitors to the county during were on a 7 night stay in Cornwall at the time of their interview. Average length of stay was 6.63 nights. 88% of visitors interviewed during the survey were on a repeat visit to the county. 45% of previous visitors to the county had visited within the last 12 months including 23% within the last six months and 6% within the last month. Nine out of ten staying visitors indicated that the recent strength of the Euro and the poor exchange rate had not impacted on their holiday decision. 94% of staying visitors who said the recent strength of the Euro had not impacted on their decision to holiday in the UK this year said their decision would not change if the Euro were to return to a more favourable level. 43% of staying visitors who said that the recent strength of the Euro had impacted on their decision to holiday in the UK this year said their decision would not change if the Euro were to return to a more favourable level. 53% of these staying visitors would choose to go abroad instead if the Euro returned to a more favourable level. 87% of staying visitors had not chosen their holiday to Cornwall in direct preference to another destination suggesting they were planning to visit the county regardless. 34
35 Introduction This chapter explores in more detail the nature of these trips made to the county including: Main purpose of visit Location of staying visit Duration of stay (nights) - staying visitors First time/repeat visits When last visited Cornwall The impact of the Euro Destination preference 35

36 Main Purpose of Visit 88% of visitors interviewed during the survey were on a leisure/holiday visit to Cornwall. A further 9% were visiting friends or relatives who lived in the county whilst 1% were on a business trip/attending a conference in Cornwall at the time of their interview. Main reason for visit 9% 1% 1% 88% Main purpose of visit Summer Aut/Win All visitors Leisure/ holiday 88% 89% 88% VFR 10% 8% 9% Business/ conference - 2% 1% Other 2% 1% 1% There was little change in respondents main purpose for visiting the county according to the time of year of their visit. Leisure/holiday Business/conference VFR Other For a full list of the other main reasons for visiting the county see Appendix 2. 36
37 Location of Staying Visit Around 1 in 5 staying visitors to Cornwall during the survey (19%) were staying in Newquay at the time of their interview. A further 15% were staying in Looe and 11% in St Ives. 8% of staying visitors were based at accommodation in Falmouth and a further 5% in Bude. Nearest town where staying Summer Aut/Win All visitors All visitors 2008/9 All visitors 2006/7 Newquay 18% 20% 19% 19% 20% Looe 18% 13% 15% 11% 8% Falmouth 10% 7% 8% 10% 9% St Ives 5% 17% 11% 13% 13% Bude 7% 8% 5% 9% 9% Looe and Falmouth were more popular amongst visitors during the summer months whilst St Ives was more popular during the autumn/winter period. For a full list of all the towns where staying visitors were based please see Appendix 2. 37


38 Duration of Stay (nights) Staying Visitors 35% of staying visitors to the county during were on a 7 night stay in Cornwall at the time of their interview whilst a further 20% were on a shorter, 3 to 4 night break in the county. 14% of all staying visitors were on a 5 to 6 night stay at the time of their interview. Average length of stay during the survey was 6.63 nights % Number of nights staying in Cornwall % 14 11% 15+ 6% 7 35% 1 2 5% % % Duration of stay (nights) by season Summer Aut/Win All visitors 1-2 4% 5% 5% % 29% 20% % 13% 14% 7 38% 33% 35% % 5% 7% % 2% 2% 14 15% 7% 11% 15+ 6% 6% 6% Ave. length of stay Not surprisingly, length of stay was highest during the summer period at 6.95 nights compared with 6.32 nights during the autumn/winter period. 38
 Comparative")
39 Duration of Stay (nights) Comparative data
40 First Time/Repeat Visit 88% of visitors interviewed during the survey were on a repeat visit to the county whilst 12% were first time visitors to Cornwall. First time/repeat visit Repeat visit 88% First time visit 12% First time/ repeat visit by season Summer Aut/Win All Visitors First visit 14% 10% 12% Repeat visit 86% 90% 88% At 14%, the proportion of first time visitors was highest during the summer months compared with 10% during the autumn/winter period. 40

41 First Time/Repeat Visit Comparative data


42 When Last Visited Cornwall Previous Visitors 45% of previous visitors to the county had visited within the last 12 months including 23% within the last six months and 6% within the last month. A further 24% had last visited the county 1-2 years ago, 9% 2-4 years ago and 20% 5 or more years ago. When last visited Cornwall 2 4 yrs ago 9% 5 or more yrs ago 20% Within the last month 6% Within the last 6 mths 23% When last visited Cornwall by season Summer Aut/Win All Visitors Within last month 6% 7% 6% Within last six mths 14% 31% 23% Within last 12 mths 21% 12% 16% 1-2 yrs ago 26% 23% 24% 2-4 yrs ago 7% 11% 9% 5 or more yrs ago 26% 16% 20% 1 2 yrs ago 24% Within the last 12 mths 16% A slightly higher proportion of visitors interviewed in the autumn/winter months had previously visited the county within the last 12 months (50%) than those interviewed during the summer period (41%). 42


43 The Impact of the Euro For the first time during the survey staying visitors were asked whether the recent strength of the Euro and the poor exchange rate had impacted on their decision to holiday in the UK this year. Nine out of ten staying visitors indicated that it had not impacted on their holiday decision, 9% that it had and 1% did not know/were undecided. Whether strength of the Euro impacted on the decision to holiday in the UK this year Don't know 1% No 90% Yes 9% Whether strength of the Euro impacted on decision to holiday in the UK this year Summer Aut/Win All Visitors Yes 11% 7% 9% No 88% 92% 90% Don t know 1% - 1% A slightly higher proportion of staying visitors interviewed during the main summer months of July and August indicated that the recent strength of the Euro and the poor exchange rate had impacted on their decision to holiday in the UK this year (11%) compared with only 7% of staying visitors during the autumn/winter months. This may be the result of the higher proportion of families with children visiting the county during the summer months where budget and value for money is likely to have been of higher importance. 43
44 The Impact of the Euro Staying visitors were also asked whether their decision to holiday in the UK would change if the Euro were to return to it s previous, more favourable level. 94% of staying visitors who said the recent strength of the Euro had not impacted on their decision to holiday in the UK this year said their decision would not change if the Euro were to return to a more favourable level (n=402). This compares with 43% (n=13) of staying visitors who said that the recent strength of the Euro had impacted on their decision to holiday in the UK this year. 53% of these staying visitors (n=16) would choose to go abroad instead if the Euro returned to a more favourable level. n=sample size If the Euro were to return to it s previous, more favourable level would your decision to holiday in the UK change? Has the recent strength of the Euro and the poor exchange rate had an impact on your decision to holiday in the UK this year? No Yes DK/ unsure Yes I would go abroad instead of the UK 6% 53% 29% No I would still holiday in the UK 94% 43% 64% Don t know/unsure - 3% 7% 44
45 Destination Preference 87% of staying visitors had not chosen their holiday to Cornwall in direct preference to another destination suggesting they were planning to visit the county regardless. 13% had chosen Cornwall in direct preference to another location including 18% of staying visitors during the summer months (8% autumn/winter). Whether chose holiday to Cornwall in direct preference to another destination Whether chose holiday to Cornwall in direct preference to another destination Summer Aut/Win All Visitors Yes 18% 8% 13% No 82% 92% 87% No 87% Yes 13% Don t know 1% % of staying visitors who had chosen to visit Cornwall in direct preference to another destination had considered holidaying at another UK location including Devon, Scotland the Lake District and Wales. 40% chose the county in preference to an overseas location including France, Greece/Greek Islands and Spain. A full list of the other destinations considered for a holiday can be found in Appendix 2. 45
46 Trend Data Main Purpose of Visit Leisure/ holiday VFR Business/ conference 2006/7 85% 11% 1% 2% 2008/9 83% 11% 2% 3% 88% 9% 1% 1% Nearest town where staying - all staying visitors Other Newquay Looe Falmouth St Ives Bude 2006/7 20% 8% 9% 13% 9% 2008/9 19% 11% 10% 13% 9% 19% 15% 8% 11% 5% Duration of stay (nights) - all staying visitors Ave. length of stay 2006/7 6% 24% 17% 32% 7% 3% 9% 2% /9 7% 23% 15% 30% 8% 2% 9% 6% % 20% 14% 35% 7% 2% 11% 6% 6.63 First Time/Repeat Visit First Visit Repeat Visit 2006/7 10% 90% 2008/9 12% 88% 12% 88% 46


47 Information Sourcing The South West Research Company
48 Summary 41% of staying visitors had used the internet to source information about visiting Cornwall prior to their actual visit. 36% of internet users had used it to source information only whilst 64% had booked their accommodation on-line and /or purchased other goods and services such as car hire, flights etc. over the internet. 80% of internet users had used a search engine site such as Google/Yahoo etc. and a further 31% had used the VisitCornwall website At 60%, the town centre Tourist Information Centre was considered by far the most helpful place to access information whilst on holiday amongst staying visitors followed by their accommodation establishment (43%). The majority of staying visitors (58%) felt it was very unimportant that they had Wi-Fi internet access whilst on holiday followed by a further 13% who also felt it was unimportant but to a lesser degree. 20% of all staying visitors did consider it to be important (13%) or very important (7%) to them that they had Wi-Fi internet access whilst they were on holiday. 54% had used the internet for leisure purposes only whilst on holiday. A further 43% used it for both leisure and business/work purposes and just 5% for business/work purposes only. 72% of staying visitors for whom Wi-Fi internet access was important or very important for them whilst on holiday agreed with statement I do not expect to pay for Wi-Fi internet access whilst on holiday. 48
49 Introduction This chapter examines the sources of information used by those visitors staying overnight in Cornwall. It includes: Information sourcing prior to and during visit Use of the internet Wi-Fi internet access whilst on holiday 49
50 Information Sourcing Prior to Visit At 41% the internet (PC) was the most commonly used information source amongst staying visitors prior to their actual trip to the county followed closely by their knowledge gained from a previous visit (40%). 14% had used a brochure/guide whilst a further 9% relied on a recommendation. 5% had seen a newspaper advert. For a full list of the other information sources used by visitors see Appendix 2. Where obtained information PRIOR TO VISIT by season Staying visitors Summer Aut/Win All Visitors Previous visit 43% 37% 40% Recommendation 9% 10% 9% Newspaper advert 4% 5% 5% Travel agent 1% - 1% Tourist Info. Centre (TIC 1% 1% 1% Brochure/guide 10% 19% 14% Internet PC 35% 47% 41% Internet mobile phone Sat Nav information system Other 13% 20% 16% 50
51 Use of the Internet 209 staying visitor respondents (41%) had used the internet to source information about visiting Cornwall prior to their actual visit. Whilst 36% of these internet users had used it to source information only, the remaining 64% had booked their accommodation on-line and /or purchased other goods and services such as car hire, flights etc. What did you use the internet for? (Staying visitors and internet users only) Summer Aut/Win All Visitors Information sourcing ONLY 35% 37% 36% Information sourcing AND to book accommodation etc. 65% 63% 64% When asked which types of internet sites/search engines they had used to source information and/or book their accommodation etc. 80% of internet users had used a search engine site such as Google/Yahoo etc. and a further 31% had used the VisitCornwall website Lower proportions had used the regional tourist board website, a social networking site such as Facebook or Twitter (1%) or a review site such as Trip Advisor (5%). Did you use any of the following when searching for information about Cornwall on the internet? (Staying visitors and internet users only) Summer Aut/Win All Visitors Search engine sites e.g. Google/Yahoo etc. 87% 74% 80% 24% 38% 31% 9% 8% 8% Social networking sites e.g. Facebook/Twitter etc. 1% - 1% Review sites e.g. Trip Advisor etc. 2% 6% 5% 51


52 Information Sourcing Whilst on Holiday At 60%, the town centre Tourist Information Centre was considered by far the most helpful place to access information whilst on holiday amongst staying visitors followed by their accommodation establishment (43%). For a full list of the other places where staying visitors find it most helpful to source information whilst on holiday see Appendix 2. 52
 felt it was very unimportant followed by a further 13% who also felt it was unimportant but to a lesser degree.")

53 Wi-Fi Internet Access Whilst on Holiday For the first time during the survey staying visitors were asked how important it was to them that they have Wi-Fi internet access whilst on holiday. The majority of staying visitors (58%) felt it was very unimportant followed by a further 13% who also felt it was unimportant but to a lesser degree. 20% of all staying visitors (101 respondents) did consider it to be important (13%) or very important (7%) to them. 9% did not consider it to be unimportant or important to them. Importance of having Wi Fi internet access whilst on holiday All staying visitors Important 13% Very important 7% Wi-Fi internet access whilst on holiday Summer Aut/Win All Visitors Very unimportant 57% 59% 58% Unimportant 13% 12% 13% Neither unimportant nor important 8% 10% 9% Neither unimportant nor important 9% Unimportant 13% Very unimportant 58% Important 15% 11% 13% Very important 7% 7% 7% There was little variation in the importance placed on Wi-Fi internet access according to the time of year of interview. 53
54 Wi-Fi Internet Access Whilst on Holiday Those staying visitors for whom Wi-Fi internet access was important or very important were then asked what they use their Wi-Fi internet access for whilst they are on holiday. For the majority of these staying visitors (54%) they used it for leisure purposes only, whilst a further 43% used it for both leisure and business/work purposes and just 5% for business/work purposes only. What do you use your Wi-Fi internet access for whilst on holiday? (Staying visitors for whom Wi-Fi internet access was important or very important for them whilst on holiday Summer Aut/Win All Visitors Leisure purposes only 56% 51% 54% Business/work purposes only 8% 2% 5% Leisure and business/work purposes 40% 47% 43% 8% of staying visitors interviewed during the summer months indicated that they used it for business/work purposes only compared with a quarter of this proportion (2%) during the autumn/winter period. 54
55 Wi-Fi Internet Access Whilst on Holiday Those staying visitors for whom Wi-Fi internet access was important or very important were also asked which statement (from the 3 listed in the table below) best described their opinion of paying for Wi-Fi internet access whilst they were on holiday. The majority (72%) agreed with the statement I do not expect to pay for Wi-Fi internet access whilst on holiday whilst 19% agreed I would be happy for the price of my holiday accommodation to be increased slightly to include unlimited Wi-Fi internet access for the duration of my stay. Only 9% felt the statement I am happy to pay for my Wi-Fi internet access as an additional cost on top of my holiday accommodation best described their opinion. Which one of these statements best describes your opinion of paying for Wi-Fi internet access whilst on holiday? (Staying visitors for whom Wi-Fi internet access was important or very important for them whilst on holiday Summer Aut/Win All Visitors I am happy to pay for my Wi-Fi internet access as an additional cost on top of my holiday accommodation I would be happy for the price of my holiday accommodation to be increased slightly to include unlimited Wi-Fi internet access for the duration of my stay 6% 13% 9% 27% 10% 19% I do not expect to pay for Wi-Fi internet access whilst on holiday 67% 77% 72% 55
56 Trend Data Information sourcing prior to visit /7 2008/9 Previous visit 40% 36% 40% Recommendation/via family/friends 19% 17% 9% (recommendation) Tourist board/travel agent 5% 1% 1% (travel agent) Newspaper/magazine 6% 2% 5% (newspaper advert) Tourist Info. Centre (TIC) 2% 1% 1% Brochure/guide/leaflet 15% 10% 14% (brochure/guide) Internet/website 21% 23% 41% (internet PC) Other 5% 9% 16% 56
57 Environmental Quality The South West Research Company
58 Summary 74% of visitors to Cornwall during the survey had travelled by car or van for the longest part of their journey to the county during their current visit/day trip. Of the 412 visitors in the survey who had arrived by car, van, motorcycle etc. only 37 (9%) had considered using an alterative form of transport for their journey to the county. The average number of car travel hours per day was 1.27 hours or 1 hour 16 minutes. The average number of days car free was 1.06 days or 29%. On days that visitors did not use their car 35% of their time was either spent on public transport or in areas close to their accommodation and so they did not require transport. 30% of their time was spent using other forms of transport. 32% of respondents indicated that an improved public transport network would encourage them to take more car free days out whist visiting the county whilst a further 31% mentioned better information being available about public transport routes. The average hourly charge considered to be fair and reasonable for car parking in Cornwall was calculated at % of respondents prefer pay on entry machines at car parks which take cash only and a further 57% prefer pay on exit machines which accept both cash and credit card payments. Just 6% of the visitors interviewed as part of the survey were aware of the Highways Agency Holiday Travel Campaign. 58
59 Summary 84% of visitors were aware of the Blue Flag scheme for beaches. 23% of visitors were going/or had already been onto a beach with a Blue Flag during their visit to the county, 44% of visitors had not been/or planned to go onto a Blue Flag beach during their visit and 35% did not know. 40% of respondents indicated that the presence of a Blue Flag did influence which beaches they decide to visit. 51% said it did not influence their decision whilst the remaining 9% were unsure/did not know. 27% of all visitors interviewed as part of the survey were dog owners with 67% of these respondents indicating that they always or sometimes bring their dog with them on holiday/day trips. Overall, the survey findings suggest that the majority of visitors (70%), regardless of whether they are a dog owner or not, are happy for dogs to be allowed on beaches provided there is some form of designated exercise area for them or a restriction on the time of year of use. 30% of respondents agreed with the statement I think dogs should be allowed on designated beaches only without restriction including 48% dog owners, whilst a further 19% agreed with the statement I think dogs should not be allowed on beaches between 1 st May to 30 th Sept with 21% of non dog owners agreeing with this statement. 30% of all respondents did not feel dogs should be allowed on beaches at all at any time of the year and agreed with the statement I think dogs should be banned from all beaches at all times including 38% non dog owners and 9% of dog owners. 59
60 Introduction This chapter examines the issues around transportation and car free travel whilst on holiday in the county as well as awareness levels of the Blue Flag scheme and dog walking on beaches. It includes: Transportation Car free travel Car parking charges Highways Agency holiday travel campaign Blue Flag scheme for beaches Dog ownership & holiday taking/dogs on beaches 60


61 Car Use 74% of visitors to Cornwall during the survey had travelled by car or van for the longest part of their journey to the county during their current visit/day trip. A further 11% had arrived by organised coach tour, 5% each via bus/coach service or train and 4% by plane/air travel. Main form of transport for longest part of journery to Cornwall during visit/this trip By plane/air travel 4% Organised coach tour Bus/coach 11% service 5% Train 5% Car/van etc. 74% Main form of transport Car/van/motorcycle etc. Summer Aut/Win All Visitors 75% 73% 74% Bus/coach service 8% 3% 5% Organised coach tour 8% 13% 11% By plane/air travel 2% 5% 4% Train 5% 5% 5% 61
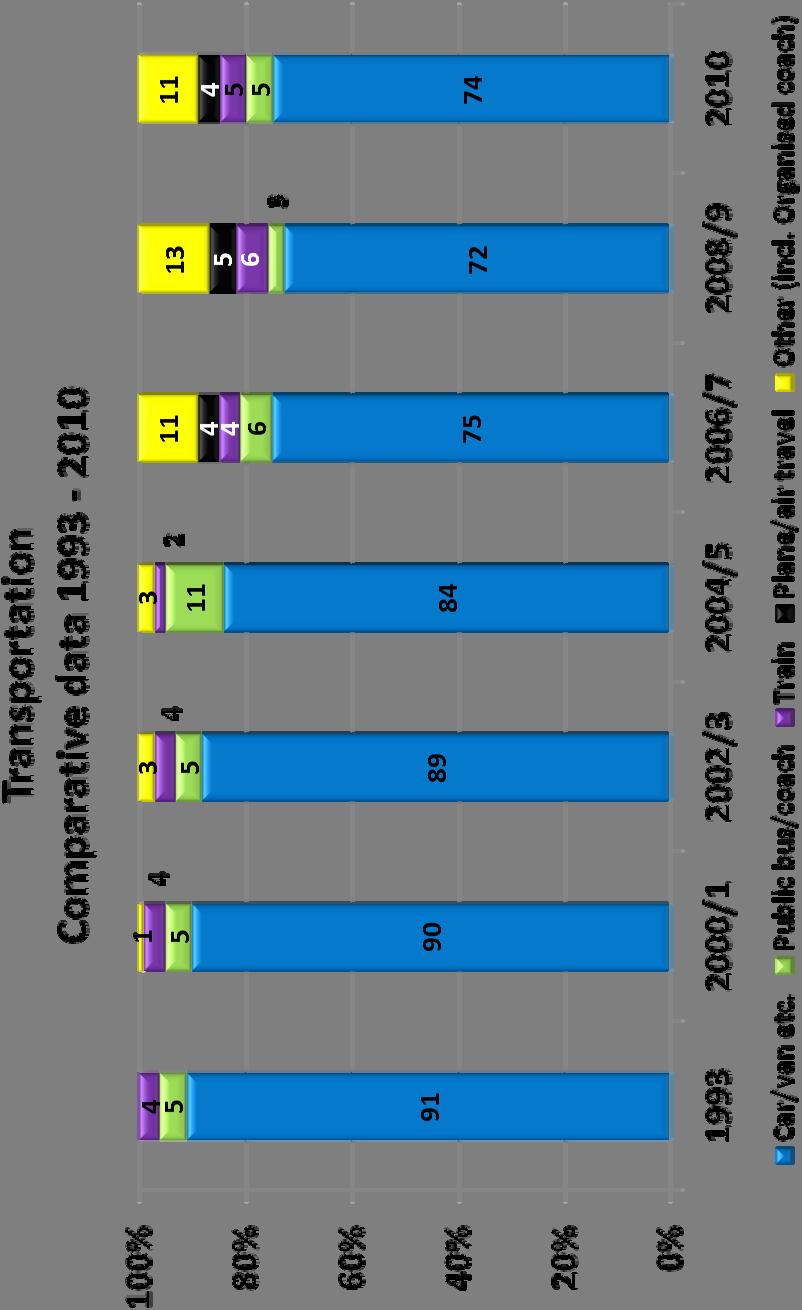
62 Transportation Comparative data
63 Alternative Modes of Transport Those staying visitors who had travelled by car, van, motorcycle etc. for the longest part of their journey to Cornwall were asked if they had considered using any alternative forms of transport. Of the 412 visitors in the survey only 37 (9%) had considered doing so. Did you consider any alternative forms of transport for the longest part of your journey to Cornwall during this visit/day trip? Car/van users etc. Summer Aut/Win All Visitors Yes 11% 8% 9% No 89% 92% 91% 11% and 8% of visitors during the summer and autumn/winter periods respectively had considered alternative forms of transport. 63

64 Average Hours Travelling by Car The chart below shows the average number of hours spent travelling by car for all staying visitors and by season. The average number of car travel hours per day for all staying visitors was 1.27 hours or 1 hour 16 minutes. The highest average hours of car travel per day were driven during the autumn/winter period (1.32 hours or 1 hour 19 minutes) and lowest during the summer months (1.23 hours or 1 hour 14 minutes). 64
65 Car Free Days The chart below shows the average number of days spent car free for all staying visitors to the county during and by period. The average number of days car free for all staying visitors was 1.06 days. The highest number of car free days was amongst those visitors to Cornwall during the autumn/winter period (1.08 days) and lowest amongst those during the summer months (1.03 days) These numbers were then used to derive the proportion of car free days shown overleaf. 65


66 Proportion of Car Free Days The chart below shows the proportion of days spent car free for all staying visitors and by period. The average proportion of days car free for all visitors was 29%. The highest proportion of car free days was amongst those staying visitors to the county during the autumn/winter period (32%) and lowest amongst those during the summer months (26%). 66


67 Travel Without a Car On days that staying visitors did not use their car 35% of their time was either spent on public transport or in areas close to their accommodation and so they did not require transport. 30% of their time was spent using other forms of transport. There was little variation according to the time of year of interview. Transport used on car free days Other transport 30% In area close to accomm. 35% Public transport 35% Transport used on car free days Summer Aut/Win All Staying Visitors Public transport 35% 35% 35% In area close to accommodation so no transport needed 37% 34% 35% Other transport 28% 31% 30% 67
68 Increasing Car Free Travel staying visitors who had arrived in the county by car, van, motorcycle etc. were asked what would encourage them to take a car free day out/more car free days out whilst on their trip in the county. 32% of respondents indicated that an improved public transport network would encourage them to take more car free days out whilst visiting the county. A further 31% mentioned better information being available about public transport routes. 28% of respondents mentioned the need for the improved frequency of public transport services and 24% cheaper public transport fares. For a full list of the other things suggested by respondents see Appendix 2. What would encourage you to take a car free day out/more car free days out whilst on your trip to Cornwall? Other (please specify below) 28% Nothing I would not take a car free day out Better information available about public transport routes Discounts at attractions for those travelling by pubic transport Cheaper public transport fares Improved frequency of public transport services Improved public transport network 15% 22% 31% 24% 28% 32% 0% 10% 20% 30% 40% 50% 68
69 Car Parking Charges & Facilities survey respondents who had arrived in the county by car, van, motorcycle etc. were asked what they considered to be a fair and reasonable hourly charge for car parking in Cornwall. The average charge was calculated at 0.98 and varied little according to the time of year of interview. These respondents were also asked how they prefer to pay for their car parking. As the chart below illustrates 68% prefer pay on entry machines which take cash only and a further 57% prefer pay on exit machines which accept both cash and credit card payments. There was little variation in the results according to the time of year of interview. How prefer to pay for car parking Payment via phone/mobile phone facility 9% Pay on exit cash and/or credit card facilities 57% Pay on entry machine credit card facility 6% Pay on entry machine cash only 68% 0% 20% 40% 60% 80% 100% 69
70 The Highways Agency Holiday Travel Campaign visitors to the county were asked if they were aware of the Highways Agency Holiday Travel Campaign an online campaign set up and designed by the Highways Agency to assist holiday makers with planning their journeys/holiday routes etc. with top tips on avoiding peak times and travelling safely. For further information please go to: Just 6% of the visitors were aware of the campaign with little variation in this proportion according to the time of year of interview. 70
71 Blue Flag Scheme for Beaches visitors to the county were also asked if they were aware of the Blue Flag scheme for beaches. 84% of the visitors interviewed were aware of the scheme including 83% of respondents interviewed during the summer months and 85% of those interviewed during the autumn/winter period. 23% of visitors were going/or had already been onto a beach with a Blue Flag during their visit to the county. This proportion was, unsurprisingly, significantly higher during the summer months (29%) than during the autumn/winter period (17%). A further 44% of visitors had not been/or planned to go onto a Blue Flag beach during their visit (35% and 51% during the summer and autumn/winter respectively) and 35% did not know. Whether going/already been onto a beach with a Blue Flag during this visit to Cornwall by season Summer Aut/Win All Visitors Yes 29% 17% 23% No 35% 51% 44% Don t know 36% 32% 34% 71
72 Blue Flag Scheme for Beaches The survey also explored the level of influence of the presence of a Blue Flag when visitors decide which beaches to visit. 40% of respondents indicated that the presence of a Blue Flag did influence which beaches they decided to visit, 51% said it did not influence them whilst the remaining 9% were unsure/did not know. There was little variation in the results according to the time of year of interview. Does a Blue Flag influence your decision on which beaches to visit? Summer Aut/Win All Visitors Yes 41% 39% 40% No 51% 50% 51% Don t know 8% 11% 9% 72
73 Dog Ownership & Holiday Taking 27% (n=148) of all visitors interviewed as part of the survey were dog owners with 67% of these respondents (n=95) indicating that they always (37%, n=52) or sometimes (30%, n=43) bring their dog with them on holiday/day trips. Are you a dog owner? Summer Aut/Win All Visitors Yes 30% 23% 27% No 70% 77% 73% Do you usually bring your dog on holiday/day trips with you? Summer Aut/Win All Visitors Yes always 38% 35% 37% Yes sometimes 37% 23% 30% No - never 25% 42% 33% 73
74 Dogs on Beaches visitors to Cornwall were also asked which statement (from a list of 5) regarding dogs on beaches they agreed with most. Overall, the survey findings suggest that the majority of visitors (70%), regardless of whether they are a dog owner or not, are happy for dogs to be allowed on beaches provided there is some form of designated exercise area for them or a restriction on the time of year of use. 30% of respondents agreed with the statement I think dogs should be allowed on designated beaches only without restriction including 48% dog owners, whist a further 19% agreed with the statement I think dogs should not be allowed on beaches between 1 st May to 30 th Sept with 21% of non dog owners agreeing with this statement. 16% of all respondents felt that all beaches should have dog free and dog friendly sections including 22% of dog owners and 13% of non dog owners agreeing with this statement. 5% of all respondents felt that dogs should be allowed on all beaches without restriction including 8% of dog owners and 4% of non dog owners agreeing with this statement. 30% of all respondents did not feel dogs should be allowed on beaches at all at any time of the year and agreed with the statement I think dogs should be banned from all beaches at all times including 38% non dog owners and 9% of dog owners. See the chart overleaf for a full breakdown of the results by dog owners/non dog owners. 74
75 Dogs on Beaches Dogs on beaches I think dogs should be allowed on all beaches without restriction I think all beaches should have 'dog free' and 'dog friendly' sections 4% 8% 5% 13% 22% 16% Not a dog owner Dog owner All visitors I think dogs should not be allowed on beaches between 1st May to 30th Sept 12% 21% 19% I think dogs should be banned from all beaches at all times 9% 30% 38% I think dogs should be allowed on designated beaches only without restriction 24% 30% 48% 0% 10% 20% 30% 40% 50% 60% 75
76 Trend Data Main form of transport /7 2008/9 Car/van/motorcycle etc. 75% 72% 74% Bus/coach service 6% 3% 5% Organised coach tour 8% 11% 11% By plane/air travel 4% 5% 4% Train 4% 6% 5% Other 4% 2% - 76

77 Destinations Visited & Other Activities Undertaken The South West Research Company
78 Summary As was the case during previous survey years, St Ives (38%), Truro (38%) and Newquay (37%) were the towns listed by visitors as those which they were most likely to have visited or intended to visit during. 55% of visitors had been/or intended to visit an attraction/place of interest during their trip to Cornwall. The Eden Project (35%), National Trust/English Heritage properties (excl. Lanhydrock House and Tintagel Castle - 19%) and Land s End (18%) were amongst the most popular attractions/places to visit that visitors had or were intending to visit during their trip. 87% of the visitors interviewed were aware of the county s historic mining landscape. 54% of visitors were aware that Cornwall has a World Heritage Site status because of it s mining landscape. 9% of respondents indicated that Cornwall s historic mining landscape had influenced their decision to visit the county. 83% of all visitors to Cornwall during the survey had/or were planning to take part in some form of activity during their trip/visit to the county. Going for a short walk (83%) and shopping (79%) were the most popular activities. 78
79 Introduction This chapter explores visits made to the towns and attractions/places of interest by visitors during their trip to the county as well as activities that visitors had or would be participating in during their stay/trip. In addition, it explores awareness levels of Cornwall s historic mining landscape and it s level of influence in respondents decision to visit Cornwall. This chapter details the findings for: Town visits Attractions/places of interest visited Cornwall s historic mining landscape Activities undertaken during the trip 79
80 Towns Visited As was the case during previous survey years St Ives (38%), Truro (38%) and Newquay (37%) were the towns listed by visitors as those which they were most likely to have visited or intended to visit during. Please note that the towns visited were heavily influenced by the location where the interview took place and the geographical proximity of the locations in relation to each other. Towns visited/plan to visit in Cornwall by period Summer Aut/Win All visitors St Ives 35% 41% 38% Mevagissey 10% 10% 10% Polperro 34% 25% 29% Perranporth/St Agnes 14% 9% 11% St Austell 16% 11% 13% Padstow/Polzeath 26% 15% 26% Falmouth/Penryn 40% 33% 36% Truro 40% 37% 38% Penzance/Newlyn 23% 23% 23% Newquay 42% 33% 37% Other 42% 40% 42% For a full list of the other towns visited see Appendix 2. 80
81 Attractions/Places to Visit 55% of visitors had been/or intended to visit an attraction/place of interest during their trip to Cornwall. The Eden Project (35%), National Trust/English Heritage properties (excl. Lanhydrock House and Tintagel Castle - 19%) and Land s End (18%) were amongst the most popular attractions/places to visit. For a full list of the other attractions visited see Appendix 2. Attractions/places to visit visited/plan to visit in Cornwall by period Summer Aut/Win All visitors Lands End 22% 13% 18% The Eden Project 40% 29% 35% Wheal Martyn (formerly China Clay Country Park) - 1% 1% Lanhydrock House 6% 6% 5% Geevor Tin Mine 4% 3% 3% Tintagel Castle 8% 5% 6% Other National Trust/English Heritage properties/sites 15% 22% 19% Trevarno Gardens 3% 2% 2% Flambards 6% 6% 6% National Maritime Museum 6% 9% 8% Poldark Mine - 1% - Lost Gardens of Heligan 12% 11% 12% Tate St Ives 10% 15% 13% Blue Reef Aquarium 10% 3% 7% Mineral Tramways - - St Michael s Mount 16% 10% 13% Minack Theatre 6% 5% 6% Liskeard District Museum 2% 1% 1% Other 39% 34% 36% 81
82 Cornwall s Historic Mining Landscape visitors to the county were asked if they were aware that Cornwall has an historic mining landscape. 87% of the visitors interviewed were aware of this including 85% of respondents interviewed during the summer months and 88% of those interviewed during the autumn/winter period. A further 54% of visitors were aware that Cornwall has a World Heritage Site status because of it s mining landscape including 46% of respondents interviewed during the summer months and 62% of those interviewed during the autumn/winter period. The survey also explored the level of influence of the historic mining landscape (amongst those respondents aware of it) in their decision to visit the county. 9% of respondents (n=41) did indicate that it had influenced their decision to visit whilst 91% said it had not influenced their decision. There was little variation in the results according to the time of year of interview. Did the historic mining landscape influence your decision to visit Cornwall? Those aware of the historic mining landscape only Summer Aut/Win All Visitors Yes 9% 8% 9% No 90% 91% 91% Don t know 1% - 1% 82
83 Activities 83% of all visitors to Cornwall during the survey had/or were planning to take part in some form of activity during their trip/visit to the county. Going for a short walk (83%) and shopping (79%) were the most popular activities. For a full list of the other activities see Appendix 2. Activities undertaken by period Summer Aut/Win All visitors Spending half a day or more on the beach 61% 34% 47% Swimming in the sea 42% 9% 25% Visiting museums/art galleries 37% 35% 36% Visiting heritage sites 47% 43% 45% Visiting theme parks 12% 5% 8% Visiting the cinema 9% 5% 7% Shopping 78% 81% 79% Short walk up to 2 miles 83% 84% 83% Long walk more than 2 miles 47% 49% 48% Cycling 15% 4% 9% Sailing/yachting/boating 12% 4% 8% Other water sports e.g surfing/windsurfing 18% 7% 12% Swimming (pool) 19% 12% 15% Fishing 13% 5% 9% Other outdoor sport/pursuit 4% - 2% Golf 7% 2% 5% Other 17% 11% 14% 83
84 Activities Main Reason for Visit Activities undertaken - whether main reason for visit by period Please note: the percentages above are based on the proportion of visitors who were taking part in a particular activity who then indicated that it was their main reason for visiting the county and does not represent the proportion of all visitors interviewed for the survey. For a full list of the other main activities see Appendix 2. Summer Aut/Win All visitors taking part in an activity Spending half a day or more on the beach 18% 12% 16% Swimming in the sea 2% 4% 2% Visiting museums/art galleries Visiting heritage sites Visiting theme parks Visiting the cinema Shopping Short walk up to 2 miles Long walk more than 2 miles 10% 17% 14% Cycling 5% 9% 6% Sailing/yachting/boating Other water sports e.g surfing/windsurfing 13% 16% 14% Swimming (pool) Fishing 6% 14% 8% Other outdoor sport/pursuit Golf - 14% 4% Other 33% 41% 36% 84
85 Trend Data Towns visited 2006/ 2006/7 2008/9 St Ives 44% 41% 38% Mevagissey 15% 10% 10% Polperro 18% 13% 29% Perranporth/St Agnes 13% 13% 11% St Austell 17% 14% 13% Padstow/Polzeath 25% 22% 26% Falmouth/Penryn 39% 34% 36% Truro 39% 41% 38% Penzance/Newlyn 24% 22% 23% Newquay 36% 39% 37% Other 38% 49% 42% 85
86 Trend Data Attractions/places to visit visited/plan to visit in Cornwall /7 2008/9 Lands End 28% 18% 18% The Eden Project 39% 41% 35% Lanhydrock House - 11% 5% Tintagel Castle - 11% 6% Other National Trust/English Heritage properties/sites 25% 24% 19% Flambards 6% 5% 6% National Maritime Museum 9% 8% 8% Lost Gardens of Heligan 15% 15% 12% Tate St Ives 3% 12% 13% Blue Reef Aquarium 8% 10% 7% St Michael s Mount 18% 13% 13% Minack Theatre 9% 5% 6% Other 21% 20% 36% 86
87 Trend Data Activities undertaken /7 2008/9 Spending half a day or more on the beach 40% 41% 47% Swimming in the sea 21% 18% 25% Visiting museums/art galleries 30% 34% 36% Visiting heritage sites 35% 41% 45% Visiting theme parks 8% 9% 8% Visiting the cinema 5% 7% 7% Shopping 76% 78% 79% Short walk up to 2 miles 87% 79% 83% Long walk more than 2 miles 44% 44% 48% Cycling 4% 6% 9% Sailing/yachting/boating 6% 7% 8% Other water sports e.g surfing/windsurfing 7% 8% 12% Swimming (pool) 15% 14% 15% Fishing 7% 7% 9% Other outdoor sport/pursuit 4% 2% 2% Golf 3% 4% 5% Other 10% 10% 14% 87
88 Trend Data Activities undertaken main reason for visit /7 2008/9 Spending half a day or more on the beach 19% 13% 16% Swimming in the sea 5% 1% 2% Visiting museums/art galleries 2% 1% - Visiting heritage sites 1% 2% - Visiting theme parks 1% - - Visiting the cinema Shopping 5% 1% - Short walk up to 2 miles 10% - - Long walk more than 2 miles 16% 9% 14% Cycling 1% 3% 6% Sailing/yachting/boating 3% 1% - Other water sports e.g surfing/windsurfing 7% 14% 14% Swimming (pool) 1% - - Fishing 3% 3% 8% Other outdoor sport/pursuit 1% 5% - Golf 1% - 4% Other 31% 51% 36% 88
89 Recommendation, Likes & Dislikes/Suggestions for Improvement The South West Research Company
90 Summary Cornwall achieved a high Net Promoter Score of +65% for respondents likelihood of recommending the county as a place to visit to their friends and/or family. The scenery/landscape (27%), ambience/atmosphere of the county (10%) and coastline/sea (10%) were the top 3 factors listed by respondents as things they particularly liked about their visit. The weather (17%) and poor road network (16%) along with the distance of the county from their homes (11%) were the top three factors mentioned by visitors as things they least liked about their visit. When asked if anything could be improved in Cornwall, better/cheaper car parking was suggested by 19% of respondents as well as a further 11% who felt the need for road improvements on the A30/A39 and within some of the towns/villages etc. 90
91 Introduction This chapter explores how likely visitors would be to recommend Cornwall as a place to visit, their particular likes or dislikes about their visit to Cornwall and their suggestions for improvement. It details the findings for: Likelihood of recommending Cornwall Net Promoter Score Particular likes Dislikes/suggestions for improvement 91
92 Likelihood of Recommending Cornwall Net Promoter Scores (NPS) are a simple but effective new method for measuring customer loyalty invented by Bain consultant Fred Reicheld who discovered that a single question provides the ultimate measure of just how loyal customers are and that this method could then be used to accurately predict future revenue growth. Promoter Scores (NPS) are calculated by asking a sample of customers a single question How likely is it that you would recommend xyz to a friend or colleague?. The respondent is asked to respond on an 11 point scale from 0 (not at all likely) to 10 (extremely likely) depending on how positive they feel about the product/event/location. The proportion of those who think it unlikely they would recommend it (Detractors) subtracted from the proportion that are likely to recommend it (Promoters) produces a single number know as a Net Promoter Score or NPS. Based on their response to this question respondents are then divided into three distinct groups: 0-6 score are Detractors These are customers that have generated sales but are actually bad for the company over the long haul. They are less likely to buy anything/visit the event/location again and more likely to spread bad word of mouth and more costly to serve because of their dissatisfaction. 7-8 are Passives These customers are generally more positive about the product/event/location but are significantly less valuable than Promoters. Many companies over estimate their success by assuming relatively high customer satisfaction will lead to future growth. In reality Passives may be satisfied but that may not be enough in the longer term are Promoters These customers drive business growth. The company/product/event/location has gone beyond satisfying their needs and truly delights them. As a result they will buy more from this company or visit an event or location again in the future, will recommend it to many others and therefore the company/product/event/location will not need to undertake costly ad campaigns or sales promotions to retain their business. The Net Promoter Score or NPS is created by calculating what percentage of the customer base are Promoters and then subtracting the percentage who are Detractors. % Promoters - % Detractors = NPS The higher or more positive the NPS score the more satisfied the customer base. 92

.")

 3% 2% 3% Passives (score of 7-8) 31% 28% 29% Promoters (score of 9-10) 67% 69% 68% NET PROMOTER SCORE (NPS)")
93 Likelihood of Recommending Cornwall For the first time during the survey visitors to the county were asked On a scale of 0 to 10 where 0 is extremely unlikely and 10 is extremely likely, how likely would you be to recommend Cornwall as a place to visit to your friends and/or family? Using the results from this question the Net Promoter Score or NPS (as described on the previous slide) has been calculated. Cornwall achieved a high Net Promoter Score of +65%, comparable with that of the South West region as a whole (+66%). 68% of visitors to the county were categorised as Promoters giving a score of 9 or 10 out of 10 for their likelihood of recommending the county to their friends or family. 29% gave a score of 7 or 8 and were categorised as Passives whilst just 3% gave a score of 0-6 for their likelihood of recommending Cornwall and were therefore categorised as Detractors. This a good score for the county on a metric that can range from -100% to +100% and thus demonstrates the strength of Cornwall as a destination. Cornwall Summer Aut/Win All Visitors Detractors (score of 0-6) 3% 2% 3% Passives (score of 7-8) 31% 28% 29% Promoters (score of 9-10) 67% 69% 68% NET PROMOTER SCORE (NPS) +64% +67% +65% South West region NPS +66% Autumn/winter visitors had a slightly higher NPS score (+67%) compared with those visiting the county during the summer months (+64%). 93

, ambience/atmosphere of the county (10%) and")
94 Likes The survey asked visitors to indicate what they most liked about their visit to Cornwall. The top answers (with a response of more than 1%) are listed below: The scenery/landscape (27%), ambience/atmosphere of the county (10%) and coastline/sea (10%) were the top 3 factors listed by respondents. 94

, along with the distance of the county from their homes (11%) were the top three factors mentioned by")
95 Dislikes The survey also asked visitors to indicate what they least enjoyed about their visit to Cornwall. 41% of those interviewed during the survey did not cite anything that had spoilt their enjoyment of the visit. The top dislikes (with a response of more than 1%) are listed below: The weather (17%) and poor road network (16%), along with the distance of the county from their homes (11%) were the top three factors mentioned by visitors. 95


96 Improvements Visitors were also asked what, if anything, they thought could be improved in Cornwall. 53% of interviewees did not cite anything that they thought could be improved. The top suggestions (with a response of more than 1%) are listed below: Better/cheaper car parking was suggested by 19% of respondents as well as a further 11% who felt the need for road improvements on the A30/A39 and within some of the towns/villages etc. 96
CORNWALL VISITOR SURVEY 06/07. Final report. Produced by South West Tourism Research Department For and on behalf of Visit Cornwall.
 CORNWALL VISITOR SURVEY 06/07 Final report Produced by South West Tourism Research Department For and on behalf of Visit Cornwall September 2007 Contents Slide Executive summary 3 Chapter 1: Introduction
Cornwall Visitor Survey 2008/09
 Cornwall Visitor Survey 2008/09 Full year Final report (July 2008 to June 2009) Produced for and on behalf of VisitCornwall by The South West Research Company September 2009 The South West Research Company
Cornwall Visitor Survey Quarterly Update Report Summer & Autumn Interviewing Periods 2016
 Cornwall Visitor Survey 2016 Quarterly Update Report Summer & Autumn Interviewing Periods 2016 Produced for and on behalf of Visit Cornwall By The South West Research Company Ltd. December 2016 Background
TABLE OF CONTENTS. TOURIST EXPENDITURE 31 Average Spend per Person per Night ( ) 31 Tourist Expenditure per Annum ( ) 32
 31 Tourist Expenditure per Annum ( ) 32") FALKLAND ISLANDS International Tourism Statistics Report 2013 2 3 4 TABLE OF CONTENTS PAGE INTRODUCTION 6 KEY FACTS AND FIGURES 7 INBOUND TOURISM (OVERNIGHT VISITORS) 8 TOURIST ARRIVALS 8 Tourist Arrivals
FALKLAND ISLANDS International Tourism Statistics Report 2013 2 3 4 TABLE OF CONTENTS PAGE INTRODUCTION 6 KEY FACTS AND FIGURES 7 INBOUND TOURISM (OVERNIGHT VISITORS) 8 TOURIST ARRIVALS 8 Tourist Arrivals
Domestic Tourism to South West Wales in 2006, 2007 and 2008 Factsheet
 Domestic Tourism to South West Wales in 2006, 2007 and 2008 Factsheet Introduction Published June 2009 This factsheet provides summary tables of key tourism figures to South West Wales in 2006, 2007 and
Isles of Scilly Visitor Survey Final report. Produced for and on behalf of the Islands Partnership. May 2017
 Isles of Scilly Visitor Survey 2016 Final report Produced for and on behalf of the Islands Partnership by The South West Research Company Ltd. May 2017 Contents Page Summary 3 6 Introduction 7 10 Visitor
Isles of Scilly Online Visitor Survey Final report. Produced for and on behalf of the Islands Partnership. May 2016
 Isles of Scilly Online Visitor Survey 2015 Final report Produced for and on behalf of the Islands Partnership by The South West Research Company Ltd. May 2016 Contents Page Summary 3 Introduction 7 Visitor
The Economic Impact of Tourism Brighton & Hove Prepared by: Tourism South East Research Unit 40 Chamberlayne Road Eastleigh Hampshire SO50 5JH
 The Economic Impact of Tourism Brighton & Hove 2013 Prepared by: Tourism South East Research Unit 40 Chamberlayne Road Eastleigh Hampshire SO50 5JH CONTENTS 1. Summary of Results 1 1.1 Introduction 1 1.2
CEREDIGION VISITOR SURVEY 2011 TOTAL SAMPLE. November 2011
 CEREDIGION VISITOR SURVEY 2011 TOTAL SAMPLE November 2011 TERMS OF CONTRACT Unless otherwise agreed, the findings of this study remain the copyright of Beaufort Research Ltd and may not be quoted, published
PEMBROKESHIRE & CORNWALL VISITOR SURVEYS 2011/12 COMPARING THE DESTINATIONS. February 2013
 PEMBROKESHIRE & CORNWALL VISITOR SURVEYS 2011/12 COMPARING THE DESTINATIONS February 2013 Prepared for: Visit / Destination Pembrokeshire Partnership Client Contact: Emma Rojano/ Mark Horner TERMS OF CONTRACT
ISLANDS VISITOR SURVEY
 ISLANDS VISITOR SURVEY 2012-2013 Summary of Results Overview The Islands Visitor Survey 2012-2013 was conducted by Scotinform Limited and Reference Economics for the islands of the Outer Hebrides, Orkney
2015 Travel Survey. for the States of Guernsey Commerce & Employment Department RESEARCH REPORT ON Q1 2015
 215 Travel Survey for the States of Guernsey Commerce & Employment Department RESEARCH REPORT ON Q1 215 April 28 th 215 Table of Contents Page No. Summary of Results 1 Survey Results 2 Breakdown of departing
The Economic Impact of Tourism on Scarborough District 2014
 The Economic Impact of Tourism on Scarborough District 2014 Prepared by: Tourism South East Research Unit 40 Chamberlayne Road Eastleigh Hampshire SO50 5JH CONTENTS 1. Summary of Results 1 2. Table of
ISLANDS VISITOR SURVEY
 ISLANDS VISITOR SURVEY 2012-2013 Summary of Results Overview The Islands Visitor Survey 2012-2013 was conducted by Scotinform Limited and Reference Economics for the islands of Shetland, Orkney and the
The Economic Impact of Tourism on Calderdale Prepared by: Tourism South East Research Unit 40 Chamberlayne Road Eastleigh Hampshire SO50 5JH
 The Economic Impact of Tourism on Calderdale 2015 Prepared by: Tourism South East Research Unit 40 Chamberlayne Road Eastleigh Hampshire SO50 5JH CONTENTS 1. Summary of Results 1 2. Table of Results Table
The Economic Impact of Tourism Brighton & Hove Prepared by: Tourism South East Research Unit 40 Chamberlayne Road Eastleigh Hampshire SO50 5JH
 The Economic Impact of Tourism Brighton & Hove 2014 Prepared by: Tourism South East Research Unit 40 Chamberlayne Road Eastleigh Hampshire SO50 5JH CONTENTS 1. Summary of Results 1 1.1 Introduction 1 1.2
The Economic Impact of Tourism on the District of Thanet 2011
 The Economic Impact of Tourism on the District of Thanet 2011 Prepared by: Tourism South East Research Unit 40 Chamberlayne Road Eastleigh Hampshire SO50 5JH CONTENTS 1. Summary of Results 1 2. Table of
2013 Travel Survey. for the States of Guernsey Commerce & Employment Department RESEARCH REPORT ON Q1 2013
 213 Travel Survey for the States of Guernsey Commerce & Employment Department RESEARCH REPORT ON Q1 213 May 21st 213 Table of Contents Page No. Summary of Results 1 Survey Results 2 Breakdown of departing
The Economic Impact of Tourism Eastbourne Prepared by: Tourism South East Research Unit 40 Chamberlayne Road Eastleigh Hampshire SO50 5JH
 The Economic Impact of Tourism Eastbourne 2016 Prepared by: Tourism South East Research Unit 40 Chamberlayne Road Eastleigh Hampshire SO50 5JH CONTENTS Page 1. Summary of Results 1 1.1 Introduction 1 1.2
NEWCASTLE VISITOR PROFILE AND SATISFACTION REPORT. Summary of results OCTOBER Image: Newcastle Marina, courtesy of Newcastle Tourism
 NEWCASTLE VISITOR PROFILE AND SATISFACTION REPORT Summary of results OCTOBER 2013 Image: Newcastle Marina, courtesy of Newcastle Tourism 3 NEWCASTLE VISITOR PROFILE AND SATISFACTION REPORT: SUMMARY OF
Tourism to the Regions of Wales 2008
 Tourism to the Regions of Wales 28 Key Facts on UK Domestic Tourism North Wales North Wales accounts for 37% of all trips and 35% of all spend in Wales 87% of visits to North Wales are for holiday purposes
Produced by: Destination Research Sergi Jarques, Director
 Produced by: Destination Research Sergi Jarques, Director Economic Impact of Tourism Oxfordshire - 2015 Economic Impact of Tourism Headline Figures Oxfordshire - 2015 Total number of trips (day & staying)
Irish Fair of Minnesota: 2017 Attendee Profile
 TOURISM CENTER Irish Fair of Minnesota: 2017 Attendee Profile Authored by Xinyi Qian, Ph.D. Irish Fair of Minnesota: 2017 Attendee Profile November 13, 2017 Authored by Xinyi (Lisa) Qian, Ph.D., University
South West Coast Path Monitoring & Evaluation Framework. Year 1 Key Findings Summary. Produced for and on behalf of the South West Coast Path team
 South West Coast Path Monitoring & Evaluation Framework Year 1 Key Findings Summary Produced for and on behalf of the South West Coast Path team By The South West Research Company Ltd. February 2013 The
National Rail Passenger Survey Autumn 2015 Main Report
 National Rail Passenger Survey Autumn 2015 Main Report Transport Focus is the independent transport user watchdog Our mission is to get the best deal for passengers and road users. With a strong emphasis
National Passenger Survey Spring putting rail passengers first
 National Passenger Survey putting rail passengers first What is Passenger Focus? Passenger Focus is the independent national rail consumer watchdog. Our mission is to get the best deal for Britain s rail
Regional Spread of Inbound Tourism. VisitBritain Research, August 2018
 Regional Spread of Inbound Tourism VisitBritain Research, August 218 1 Contents Introduction Summary Key metrics by UK area Analysis by UK area Summary of growth by UK area Scotland Wales North East North
Lord Howe Island Visitor Survey 2017
 INTRODUCTION Lord Howe Island Visitor Survey 2017 Lord Howe Island is one of Australia s premier holiday destinations, part of a World Heritage-listed island group that is known for its outstanding natural
Produced by: Destination Research Sergi Jarques, Director
 Produced by: Destination Research Sergi Jarques, Director Economic Impact of Tourism Epping Forest - 2014 Economic Impact of Tourism Headline Figures Epping Forest - 2014 Total number of trips (day & staying)
Dover Town Visitor Survey Report of findings
 Dover Town Visitor Survey Report of findings February 2018 Dover Visitor Survey - Report of Findings Introduction Contents: Introduction. Page 3 Executive Summary. Page 5 Visitor Profile. Page 9 Trip Characteristics.
Yorkshire Dales National Park Visitor Survey
 2017 Yorkshire Dales National Park Visitor Survey Information by Design 01482 467467 Authority Customer Survey 2017 Final Draft Our thanks are given to: Mark Allum, Head of Access and Engagement, YDNPA
National Rail Passenger Survey Autumn 2013 Main Report
 National Rail Passenger Survey Autumn 2013 Main Report What is Passenger Focus? Passenger Focus is the independent consumer watchdog for Britain s rail passengers and England s bus, coach and tram passengers
Domestic VFR travel to NSW
 Domestic VFR travel to NSW Year ended December 2015 INTRODUCTION The and (VFR) market is of considerable importance to Australia and NSW. It is the second largest purpose of visit segment, after the Holiday
NTA Passenger Transport Surveys at Dublin, Cork and Shannon Airports Final Report
 Passenger Transport Surveys at Dublin, Cork and Shannon Airports 2016 Final Report National Transport Authority, Dun Scèine, Harcourt Lane, Dublin 2. 2016 Contents Page 1. Introduction 1 1.1 Background
National Passenger Survey Autumn putting rail passengers first
 National Passenger Survey Autumn 2005 putting rail passengers first What is Passenger Focus? Passenger Focus is the independent national rail consumer watchdog. Our mission is to get the best deal for
National Passenger Survey Spring putting rail passengers first
 National Passenger Survey Spring 2006 putting rail passengers first What is Passenger Focus? Passenger Focus is the independent national rail consumer watchdog. Our mission is to get the best deal for
Produced by: Destination Research Sergi Jarques, Director
 Produced by: Destination Research Sergi Jarques, Director Economic Impact of Tourism Oxfordshire - 2016 Economic Impact of Tourism Headline Figures Oxfordshire - 2016 number of trips (day & staying) 27,592,106
CORNWALL VISITOR FREQUENCY SURVEY
 CORNWALL VISITOR FREQUENCY SURVEY Analysis and Report from PFA Research Ltd 2 nd December 2015 Authors: Robert Rush, Managing Director robert.rush@pfa-research.com Emma Lydon, Research & Marketing Consultant
Produced by: Destination Research Sergi Jarques, Director
 Produced by: Destination Research Sergi Jarques, Director Economic Impact of Tourism North Norfolk District - 2016 Contents Page Summary Results 2 Contextual analysis 4 Volume of Tourism 7 Staying Visitors
Produced by: Destination Research Sergi Jarques, Director
 Produced by: Destination Research Sergi Jarques, Director Economic Impact of Tourism Norfolk - 2016 Contents Page Summary Results 2 Contextual analysis 4 Volume of Tourism 7 Staying Visitors - Accommodation
National Rail Passenger Survey Main Report Spring 2018
 National Rail Passenger Survey Main Report Spring 2018 Transport Focus is the independent transport user watchdog Our mission is to get the best deal for passengers and road users. With a strong emphasis
Royal Parks Stakeholder Research Programme 2014
 1 Royal Parks Stakeholder Research Programme 2014 Park profile: Greenwich Park (Waves 1-3) January 2015 Technical note 2 This slide deck presents findings from three waves of survey research conducted
Dorset Visitors Survey 2009
 Dorset Visitors Survey 2009 (March 2010) Prepared by: The Market Research Group, DG12a, Dorset House, Bournemouth University. a Executive Summary Visitor demographics The majority of visitors to Dorset
77% of visitors to Aberdeen City & Shire spend one or more nights in the area
 SCOTLAND VISITOR SURVEY 2012 REGIONAL RESULTS: Aberdeen City & Shire Market overview 2011 Aberdeenshire and Grampian attracted 1.62 million visitors in 2011, spending 359 million. of visitors are from
Produced by: Destination Research Sergi Jarques, Director
 Produced by: Destination Research Sergi Jarques, Director Economic Impact of Tourism Norfolk - 2017 Contents Page Summary Results 2 Contextual analysis 4 Volume of Tourism 7 Staying Visitors - Accommodation
The Economic Impact of Tourism New Forest Prepared by: Tourism South East Research Unit 40 Chamberlayne Road Eastleigh Hampshire SO50 5JH
 The Economic Impact of Tourism New Forest 2008 Prepared by: Tourism South East Research Unit 40 Chamberlayne Road Eastleigh Hampshire SO50 5JH CONTENTS Glossary of terms 1 1. Summary of Results 4 2. Table
Understanding Business Visits
 Understanding Business Visits Foresight issue 153 VisitBritain Research 1 Contents Introduction Summary and Highlights Business Visits in Context UK Business visits and spend Averages Duration of stay
The Economic Impact of Tourism on Oxfordshire Estimates for 2013
 The Economic Impact of Tourism on Oxfordshire Estimates for 2013 County and District Results September 2014 Prepared by: Tourism South East Research Unit 40 Chamberlayne Road Eastleigh Hampshire SO50 5JH
Commissioned by: Visit Kent. Economic Impact of Tourism. Canterbury Results. Produced by: Destination Research
 Commissioned by: Visit Kent Produced by: Destination Research www.destinationresearch.co.uk November 2016 Contents Page Introduction and Contextual Analysis 3 Headline Figures 6 Volume of Tourism 8 Staying
Seattle Southside Digital Media Conversion Study. Prepared by
 Seattle Southside Digital Media Conversion Study Prepared by Project Overview PURPOSE The purpose of the Seattle Southside Visitor Services Digital Media Conversion Study was to measure the conversion
Commissioned by: Economic Impact of Tourism. Stevenage Results. Produced by: Destination Research
 Commissioned by: Produced by: Destination Research www.destinationresearch.co.uk December 2016 Contents Page Introduction and Contextual Analysis 3 Headline Figures 5 Volume of Tourism 7 Staying Visitors
Caravan & Camping Park Sector Annual Report 2011
 W Scottish Accommodation Occupancy Surveys Caravan & Camping Park Sector Annual Report 211 211 TNS UK Limited JN218761 May 212 211 TNS UK Ltd P a g e Contents Executive summary p. 1 Survey method p. 3
Guernsey Travel Survey
 Guernsey Travel Survey Quarter 2 2017 Issue date July 2017 The Guernsey Travel Survey shows the number of air and sea passengers, broken down by type, purpose and origin, based upon exit surveys undertaken
Economic Impact of Tourism. Hertfordshire Results. Commissioned by: Visit Herts. Produced by:
 Commissioned by: Visit Herts Produced by: Destination Research www.destinationresearch.co.uk December 2016 Contents Page Introduction and Contextual Analysis 3 Headline Figures 5 Volume of Tourism 7 Staying
Introduction...1. Methodology...2. Questionnaire design...2. Method...2. Sample size...3. Data analysis...3. Limitations...3. Key findings...
 Visitor Survey Report 2013 Contents 1. 2. 2.1 2.2 2.3 2.4 2.5 3. 3.1 3.2 3.3 3.4 3.5 3.6 3.7 4. 5. 5.1 5.2 Introduction...1 Methodology...2 Questionnaire design...2 Method...2 Sample size...3 Data analysis...3
Inverness, Culloden and Suburbs Settlement Economic Overview
 Strategic planning and research Economic information December 2007 Inverness, Culloden and Suburbs Settlement Economic Overview Summary Between 2001 and 2006, the population of Inverness, Culloden and
SHIPSTON-ON-STOUR VISITOR SURVEY 2012 FINAL REPORT
 SHIPSTON-ON-STOUR VISITOR SURVEY FINAL REPORT Produced by: Stratford-on-Avon District Council Consultation Unit December CONTENTS Page 1. Introduction 1.1 Background 1 1.2 Sample/Methodology 1 1.3 Statistical
Report on Palm Beach County Tourism Fiscal Year 2007/2008 (October 2007 September 2008)
") Report on Palm Beach County Tourism Fiscal Year 2007/2008 (October 2007 September 2008) Prepared for: Tourist Development Council of Palm Beach County Prepared by: 4020 S. 57 th Avenue Lake Worth, FL 33463
Report on Palm Beach County Tourism Fiscal Year 2007/2008 (October 2007 September 2008) Prepared for: Tourist Development Council of Palm Beach County Prepared by: 4020 S. 57 th Avenue Lake Worth, FL 33463
SCOTLAND S PEOPLE AND NATURE SURVEY 2013/14 SPECIAL INTEREST REPORT NO.1 PARTICIPATION IN OUTDOOR RECREATION
 SCOTLAND S PEOPLE AND NATURE SURVEY 013/14 SPECIAL INTEREST REPORT NO.1 PARTICIPATION IN OUTDOOR RECREATION 1. Background This summary report on participation in outdoor recreation is one of a series describing
SURVEY RESULTS: HOTEL AND HOSTEL GUESTS
 Stavovi i potrošnja turista i posjetitelja a EXECUTIVE SUMMARY TOMAS SURVEY Survey on attitudes and expenditures of tourists and visitors in in. Conducted for the fifth time (1998, 2003, 2005, 2006 and
Economic Impact of Tourism. Cambridgeshire 2010 Results
 Economic Impact of Tourism Cambridgeshire 2010 Results Produced by: Tourism South East Research Department 40 Chamberlayne Road, Eastleigh, Hampshire, SO50 5JH sjarques@tourismse.com http://www.tourismsoutheast.com
National Passenger Survey Autumn putting rail passengers first
 National Passenger Survey Autumn putting rail passengers first What is Passenger Focus? Passenger Focus is the independent national rail consumer watchdog. Our mission is to get the best deal for Britain
Tram Passenger Survey
 Key findings Autumn 2015 Foreword Jeff Halliwell Now in its third year, our Tram Passenger Survey has covered passengers views of their journey in six network areas in Britain. For the second time this
Holiday Habits Report. ABTA Consumer Survey 2015
 Holiday Habits Report ABTA Consumer Survey 2015 Number of holidays taken Our research findings suggest that growth in the number of holidays is being driven by more affluent consumers. Overall 77% of Britons
Guernsey Travel Survey
 Guernsey Travel Survey Quarter 2 218 Issue date July 218 The Guernsey Travel Survey shows the number of air and sea passengers, broken down by type, purpose and origin, based upon exit surveys undertaken
The Economic Impact of Tourism West Oxfordshire Prepared by: Tourism South East Research Unit 40 Chamberlayne Road Eastleigh Hampshire SO50 5JH
 The Economic Impact of Tourism West Oxfordshire 2014 Prepared by: Tourism South East Research Unit 40 Chamberlayne Road Eastleigh Hampshire SO50 5JH CONTENTS 1. Summary of Results 1 1.1 Introduction 1
Brighton Visitor Survey 2016
 Report of Findings for VisitBrighton Brighton Visitor Survey 2016 November 2016 Prepared by: TSE Research 40 Chamberlayne Road Eastleigh Hampshire SO50 5JH Registered in England No. 01345038 Registered
Events Tasmania Research Program Hobart Baroque Festival
 Events Tasmania Research Program Hobart Baroque Festival Research Report 2014 Prepared by This report has been prepared by Enterprise Marketing and Research Services Pty. Ltd. 60 Main Road, Moonah, 7009
Community Rail Partnership Action Plan The Bishop Line Survey of Rail Users and Non-Users August 2011 Report of Findings
 Community Rail Partnership Action Plan The Bishop Line Survey of Rail Users and Non-Users August 2011 Report of Findings Analysis and report NWA Social Research 1 Contents Page No. A. Summary of Main Findings...
The Millennial Traveller 2018
 The Millennial Traveller 2018 Counter Intelligence Retail Counter Intelligence Retail is the travel retail industry s leading agency, with services covering areas including research, category development
Insight Department: Scotland The key facts on tourism in 2016
 Insight Department: Scotland The key facts on tourism in 2016 September 2017 Executive Summary & Background Information In 2016 just under 14.5 million overnight tourism trips were undertaken in Scotland.
FALKLAND ISLANDS International Tourism Statistics Report 2012
 FALKLAND ISLANDS International Tourism Statistics Report 2012 2 Falkland Islands Tourism 2012 Land-Based Tourism Number of tourist arrivals All tourists: Leisure tourists: 7,791 17% compared to 2011 1,937
ARRIVAL CHARACTERISTICS OF PASSENGERS INTENDING TO USE PUBLIC TRANSPORT
 ARRIVAL CHARACTERISTICS OF PASSENGERS INTENDING TO USE PUBLIC TRANSPORT Tiffany Lester, Darren Walton Opus International Consultants, Central Laboratories, Lower Hutt, New Zealand ABSTRACT A public transport
Perth & Kinross Council. Community Planning Partnership Report June 2016
 Perth & Kinross Council Community Planning Partnership Report June 2016 Contents Foreword... 3 Section 1: Spring 2016 destination follow up of 2014/15 school leavers... 4 Background... 4 Section A: Initial
NORTHUMBERLAND VISITOR SURVEY 2010
 NORTHUMBERLAND VISITOR SURVEY 2010 1 CONTENTS 1. INTRODUCTION 3 2. METHODOLOGY 3 3. KEY FINDINGS 5 4. VISITOR TYPE AND ORIGIN 7 4.1 Visitor Type 7 4.2 Group Composition 7 4.3 Visit Frequency 8 4.4 Origin
Byron Shire Visitor Profile and Satisfaction Report: Summary and Discussion of Results
 Byron Shire Visitor Profile and Satisfaction Report: Summary and Discussion of Results Introduction The Byron Shire Visitor Profile and Satisfaction (VPS) project was completed as part of the Destination
The regional value of tourism in the UK: 2013
 Article: The regional value of tourism in the UK: 2013 Estimates of the economic value of tourism within UK regions and sub-regions. It includes supply and demand data relating to tourism and tourism industries.
Methodology and coverage of the survey. Background
 Methodology and coverage of the survey Background The International Passenger Survey (IPS) is a large multi-purpose survey that collects information from passengers as they enter or leave the United Kingdom.
The Role of Online in Travel Purchases. Hungary
 The Role of Online in Travel Purchases Hungary Methodology Vertical Deep Dive Travel Hungary Target group: Internet user in Hungary, 18 years and older Sample: n=1,000 Internet users Methodology: Online
HOUSEHOLD TRAVEL SURVEY
 HOUSEHOLD TRAVEL SURVEY Household Travel Survey i TABLE OF CONTENTS Page 1.0 INTRODUCTION... 1 2.0 SUMMARY OF TRAVEL... 2 2.1 All-Day Travel Patterns... 2 2.1.1 Automobile Availability... 2 2.1.2 Trip
Booking a holiday. Foresight issue 151. VisitBritain Research
 Booking a holiday Foresight issue 151 VisitBritain Research 1 Contents 1. Introduction 2. Summary 3. How are travel and accommodation booked? 1. Booked separately or together 2. Booked direct with provider
Tourism Industry Council Tasmania Community Survey 2018 Research Report. May 2018
 Tourism Industry Council Tasmania Community Survey 2018 Research Report May 2018 This report has been prepared by Enterprise Marketing and Research Services 60 Main Road, Moonah TAS 7009 All enquiries
Objective is to refresh the Canal & River Trust s understanding of the experiences, opinion, behaviours and preferences of licenced boaters
 Background Objective is to refresh the Canal & River Trust s understanding of the experiences, opinion, behaviours and preferences of licenced boaters Methodology Online survey conducted in March 2016-1,024
The Visitor Experience in Britain
 The Visitor Experience in Britain Welcome, Expectations, Satisfaction & Recommendation Foresight issue 154 VisitBritain Research 1 Contents 1. Introduction 2. Summary 3. Britain s Welcome (CAA Passenger
Bus Passenger Survey
 March 2012 Contents 1 Foreword 3 2 Key findings 4 3 Results by area Merseyside PTE (Merseytravel) South Yorkshire PTE Transport for Greater Manchester (TfGM) West Yorkshire PTE (Metro) Tyne & Wear PTE
Employment Characteristics of Tourism Industries, 2011
 Employment Characteristics of Tourism Industries, 2011 Coverage: UK Date: 22 March 2013 Geographical Area: UK Theme: Labour Market Theme: People and Places Theme: Travel and Transport Theme: Economy Key
LOCAL AREA TOURISM IMPACT MODEL. Wandsworth borough report
 LOCAL AREA TOURISM IMPACT MODEL Wandsworth borough report London Development Agency May 2008 CONTENTS 1. Introduction... 3 2. Tourism in London and the UK: recent trends... 4 3. The LATI model: a brief
The Economic Impact of Tourism on Oxfordshire Estimates for 2014
 The Economic Impact of Tourism on Oxfordshire Estimates for 2014 County and District Results August 2015 Prepared by: Tourism South East Research Unit 40 Chamberlayne Road Eastleigh Hampshire SO50 5JH
BUSINESS BAROMETER December 2018
 Credit: Chris Orange BUSINESS BAROMETER December Credit: Nigel Moore 1 Contents Summary of findings 3 Annual monthly performance: visitor attractions..4 Visit Herts Team update 5 National context.8 Visitor
Destination Visitor Survey Strategic Regional Research Queensland: Understanding the Queensland Touring Group
 Destination Visitor Survey Strategic Regional Research : Understanding the Touring Group Introduction Tourism is a major industry for (Qld), directly contributing around 124,000 jobs annually. In the year
RESULTS FROM WYOMING SNOWMOBILE SURVEY: EXECUTIVE SUMMARY
 RESULTS FROM 2000-2001 WYOMING SNOWMOBILE SURVEY: EXECUTIVE SUMMARY Prepared for the Wyoming Department of State Parks and Historic Sites, Wyoming State Trails Program. Prepared By: Chelsey McManus, Roger
1987 SUMMER USE SURVEY OF MINNESOTA STATE PARK VISITORS
 This document is made available electronically by the Minnesota Legislative Reference Library as part of an ongoing digital archiving project. http://www.leg.state.mn.us/lrl/lrl.asp (Funding for document
2013 Business & Legislative Session Visitor Satisfaction Survey Results
 2013 Business & Legislative Session Visitor Satisfaction Survey Results Completed by Juneau Economic Development Council in partnership with The Alaska Committee August 2013 JEDC research efforts are supported
2010 Nova Scotia Visitor Exit Survey Regional Report
 2010 Nova Scotia Visitor Exit Survey Regional Report A Look at Visitors Who Included Cape Breton in their Trip to Nova Scotia Reproduction in whole or in part is not permitted without the express permission
ISE INDUSTRY FORUM CSISG 2018 Q2 RESULTS Announcement INSTITUTE OF SERVICE EXCELLENCE SINGAPORE MANAGEMENT UNIVERSITY
 ISE INDUSTRY FORUM CSISG 2018 Q2 RESULTS Announcement INSTITUTE OF SERVICE EXCELLENCE SINGAPORE MANAGEMENT UNIVERSITY CSISG 2018 Q2 RESULTS LAND TRANSPORT & AIR TRANSPORT INSTITUTE OF SERVICE EXCELLENCE
REPORT. VisitEngland 2010 Business Confidence Monitor. Wave 1 New Year
 REPORT VisitEngland Wave 1 New Year 5-7 Museum Place Cardiff, Wales CF10 3BD Tel: ++44 (0)29 2030 3100 Fax: ++44 (0)29 2023 6556 www.strategic-marketing.co.uk Contents Page 1. Headline Findings... 3 2.
Cedar Rapids Area Convention and Visitors Bureau Visitor Study
 Cedar Rapids Area Convention and Visitors Bureau Visitor Study 2003-2004 University of Northern Iowa Sustainable Tourism & The Environment Program www.uni.edu/step Project Directors: Sam Lankford, Ph.D.
Insight Department: Scotland The key facts on tourism in 2016
 Insight Department: Scotland The key facts on tourism in 2016 September 2017 Executive Summary & Background Information In 2016 just under 14.5 million overnight tourism trips were undertaken in Scotland.
Civil Aviation Authority:
 Civil Aviation Authority: UK Aviation Consumer Survey August 2018 CONTENTS Background and method Headline measures Flying behaviour Recent experience Travel disruption Disability Key driver analysis Public
LIST OF CONTENTS. EXECUTIVE SUMMARY IMPACT ANALYSIS World Wrestling Championships September 2009 City of Herning, Denmark. Preface...
 LIST OF CONTENTS EXECUTIVE SUMMARY IMPACT ANALYSIS World Wrestling Championships 21 27 September 2009 City of Herning, Denmark Preface... 1 Public contributions... 2 Contents... 2 Structure... 2 Chapter