Yorkshire Dales National Park Visitor Survey
|
|
|
- Louisa Chapman
- 5 years ago
- Views:
Transcription


1 2017 Yorkshire Dales National Park Visitor Survey Information by Design
2 Authority Customer Survey 2017 Final Draft Our thanks are given to: Mark Allum, Head of Access and Engagement, YDNPA Members of the public who gave their valuable time to the research Yorkshire Dales National Park Authors: Gillian Roberts, Kate Marshall, Steve Wisher Information by Design Newlands Science Park Inglemire Lane HULL HU6 7TQ Telephone:
3 Contents Yorkshire Dales National Park EXECUTIVE SUMMARY BACKGROUND AND METHODOLOGY... 7 Background... 7 Methodology SURVEY RESULTS Demographics Origin of Visitors Visitor Type Duration of Stay Group Composition Awareness of the Yorkshire Dales National Park Travel to the Yorkshire Dales National Park Repeat and first time visitors Source of Information used when planning trip Sources of information used during trip Yorkshire Dales National Park Special Qualities Activities Barriers to enjoyment Satisfaction with overall visit USAGE AND Satisfaction with facilities Likelihood to return and recommendation Differences between old and new sites CONCLUSIONS APPENDIX 1 - Demographics APPENDIX 2 Home Locations of Interviewees APPENDIX 3 Survey Questionnaire APPENDIX 4 Other responses to Thinking broadly about your decision to visit the Yorkshire Dales, what was it that attracted you to visit here on this occasion?
4 EXECUTIVE SUMMARY This report contains a summary of the findings from a survey conducted on behalf of the Yorkshire Dales National Park Authority by Information by Design. The survey fieldwork was undertaken between July and October 2017 in 12 locations in total, including two in the new area of the National Park, which were Orton and Devil s Bridge. 652 interviews were completed in total and survey results are accurate to within approximately ±3.8%. Key findings from the survey include: Half of respondents were male and half female; the age profile is broadly comparable to the 2013 survey with 23% aged 16-44, 21% and 27% aged and 29% aged 65 and over. The social grade of respondents was determined, and showed that 75% of respondents were social grade A/B/C1 and a 25% C2/D/E. The profile of respondents by social grade is similar to 2013 but has a higher proportion from the higher social grade than nationally, where the comparable figure is 53%. The majority of respondents (94%) were from the UK and 6% were from outside of the UK. Ninety-five percent (95%) of respondents from the UK were from England, and over half of these (58%) were from Yorkshire and the Humber and the North West. 42% of respondents were day visitors and 58% were overnight visitors. The group respondents were in when interviewed contained a mean of 3.0 adults and 0.4 children under the age of % of respondents were in a group that contained children. The majority of respondents (94%) were aware that the area they were in when interviewed was part of the Yorkshire Dales National Park. The majority of respondents (87%) had travelled to the Yorkshire Dales by private car or van. 86% of respondents had visited the Yorkshire Dales National Park before, with 57% having visited numerous times in the last 12 months. 3 were visiting for the first time in the last 12 months and 14% were visiting for the first time ever. Google was the online source used by most respondents (42%) when planning a trip to the Yorkshire Dales. Nearly half of respondents (47%) had not used any online sources when planning their trip. When planning their visit, OS or other maps were the top off-line source of information used by respondents. Nearly two-fifths (39%) had not used an off-line source of information when planning their visit. During their visit one-third (33%) had actually used, or were planning to use, Google maps as a source of information. 31% of respondents had talked to locals for information, 3 had used a National Park Visitor Centre, 27% had used brochures or leaflets from their accommodation and 24% had used websites. Nearly a quarter (23%) of respondents had not used or did not plan to use any of the sources of information asked about during their visit. The majority of respondents (84%) said they saw natural beauty, scenery and views as one of the special qualities of the Yorkshire Dales National Park. 3 of respondents had been attracted to the Yorkshire Dales on the occasion they were interviewed because they had been there before and wanted to come back 4
5 and 29% had been attracted to the Yorkshire Dales by the scenery, landscape and connecting to nature. 64% of respondents had visited, or were planning to visit, a café or tea room during their visit. 58% of respondents had participated in, or would participate in, general sightseeing, 57% in walking for more than one hour and 47% had visited or would visit a country pub. Walking for more than one hour was the main activity participated in during their visit for 43% of respondents. General sightseeing was the main activity for 2 of respondents. Just over three-quarters (76%) of respondents said that nothing had spoiled their enjoyment of their visit to the Yorkshire Dales. 1 of respondents said the enjoyment of their visit was spoiled by bad weather. 95% of respondents were very satisfied with their overall visit to the Yorkshire Dales National Park, giving it a score of 5 or 6 out of 6. No respondents were not at all satisfied with their visit (i.e. no one gave a score of 1 or 2). Over three-quarters of respondents (77%) had used a car park during their visit to the Yorkshire Dales. 72% had used a café, pub or restaurant, 69% had used toilets and 56% had used rights of way. There were high levels of satisfaction with most of the facilities and services respondents had used during their visit to the Yorkshire Dales. Over 8 of respondents were very satisfied (a score of 5 or 6 out of 6) with all facilities and services asked about, apart from wi-fi and mobile phone coverage. Only half of respondents were very satisfied (a score of 5 or 6) with wi-fi and mobile coverage while nearly a quarter (24%) were not at all satisfied (a score of 1 or 2). 77% of respondents were very likely to return to the area in the next two years (a score of 9 or 10 out of 10). Only 4% of respondents were not at all likely to return to the area in the next two years (a score of 0 or 1). 91% of respondents were very likely to recommend the area to friends and family (a score of 9 or 10 out of 10). Only 1% of respondents were not at all likely to recommend the area (a score of 0 or 1). The net promoter score, a measure of customer recommendation, was very high 88%, in comparison with several national brands. This report includes differences between the 2013 and 2017 surveys. As a whole, the profile of visitors surveyed is broadly similar in 2017 as in Visitors continue to be from the more affluent social grades, suggesting that there is an under-representation of those from social grades C2/D/E. There is a suggestion that the profile of staying visitors appears to have changed, with a higher proportion staying overnight outside of the National Park, and a higher proportion staying one or two nights rather than for longer breaks. However, there is a small increase in new visitors to the National Park, who are more likely to be staying visitors rather than day visitors. Further analysis of these segments of visitors could support marketing and other interventions. There are also some important pointers on the use of online and offline sources, with the use of offline sources diminishing as online information becomes the main source of information. In addition, recommendation and word of mouth are clearly important factors influencing the decision to visit. 5
6 There are a number of differences in visitor characteristics by social grade, and in particular, strong differences in the activities undertaken as part of a visit to the National Park. Those from lower social grades are less likely to have taken part in a walk of an hour or more. Visitors are generally highly satisfied with their visit and satisfaction has continued to increase over the years. In addition, satisfaction with particular facilities has continued to rise, the most notable being the increase in satisfaction with the National Park Centres. This suggests that the work of the YDNPA is crucial to ensuring that the area continues to be a successful visitor destination with high levels of visitor satisfaction. This is reflected in the extremely high Net Promoter Score, a measure of how likely respondents are to recommend, which exceeds major household name brands such as Apple. Information by Design March 2017 Final Draft 6
7 1 BACKGROUND AND METHODOLOGY BACKGROUND 1.1 This report gives the results from the survey conducted with visitors to the Yorkshire Dales National Park (YDNP). The survey was commissioned by Yorkshire Dales Park Authority (YDNPA) and conducted by Information by Design. 1.2 The main objectives of the Customer Survey were to: Provide information from existing customers visiting the Yorkshire Dales National Park area on their views of various aspects of the National Park and services provided for customers. Compare the findings from the 2017 survey with those from the earlier survey conducted in 2013, and, where possible, to earlier customer surveys. Examine survey responses from the new locations included in the survey due to the expansion in the YDNP area. 1.3 There has been a significant development to the YDNP area since the previous survey in The National Park was extended in August 2016 to include new areas in the Lune Valley, northern Howgills and Westmorland Dales. This increased the National Park area by 24%. METHODOLOGY 1.4 Face-to-face interviews were conducted with visitors to the Yorkshire Dales National Park at 12 locations (see map on following page): Aysgarth Falls Buckden Dent Devil's Bridge near Kirkby Lonsdale Grassington Hawes Horton in Ribblesdale Malham Cove Muker Orton Reeth Ribblehead The new locations (from 2013) within the extended National Park area were Orton and Devil s Bridge. A copy of the survey questionnaire can be found in Appendix 3. 7
. Both weekdays and weekend days were covered. 1.6 In total, 652 interviews were completed.")
8 1.5 The fieldwork was conducted from July to October 2017, with interviews conducted before the school summer holiday period (pre), during the school summer holiday period (peak) and after the school summer holiday period (post). Both weekdays and weekend days were covered. 1.6 In total, 652 interviews were completed. The table below shows the number of interviews completed by location and time period. It should be noted that respondents were able to choose not to answer questions, and so the base size (the number of respondents answering each question) for some of the questions is slightly smaller than 652. Number of interviews by location and time period Pre Peak Post Total Aysgarth Falls Buckden Dent Devil's Bridge Grassington Hawes Horton in Ribblesdale Malham Cove Muker Orton Reeth Ribblehead Total
9 1.7 The survey population was defined as all visitors to the National Park. This included those who live locally (within the National Park area) who were visiting the location of the interview but excluded anyone on a regular shopping trip, visiting for work or business and spending less than 3 hours in the location. Potential respondents to the survey were selected at random, with the next person being selected for interview as soon as the previous interview was completed. 1.8 The achieved sample size of 652 respondents means that the overall results to the survey are accurate to within approximately ±3.8%. This means that for a survey result of 5 for example, we can be reasonably sure (95% confident) that the true value (of the population of all visitors) lies within 46.2% and 53.8%. 9
10 2 SURVEY RESULTS 2.1 This section details the results from the survey with visitors to the Yorkshire Dales National Park. DEMOGRAPHICS 2.2 Half of respondents (5) were male and half were female. 2.3 Nearly a quarter (23%) of respondents were aged between 16 and 44 years, 21% were aged 45-54, 27% were aged and 29% were aged 65 and over. This age profile is broadly comparable to the 2013 survey where 58% of respondents were aged 55+ (56% in 2017). 2.4 Respondents were asked the occupation of the main wage earner in the household. This information was later coded against standard occupational classifications (SOC) to provide the social grade of the respondent. Social grades are defined as: Social Grade A B C1 C2 D E Description Upper Middle Class: Higher Managerial, Administrative or Professional Middle Class: Intermediate Managerial, Administrative or Professional Lower Middle Class: Supervisory or Clerical, Junior managerial, Administrative or Professional Skilled Working Class: Skilled Manual Workers Working Class: Semi and Unskilled Manual Workers Those at lowest level of subsistence: State Pensioners or Widows (no other earner), Casual or Lowest Grade Workers 2.5 Three quarters (75%) of respondents were social grade A/B/C1 and a quarter were C2/D/E. The profile of respondents by social grade is similar to In this 2017 survey, a slightly higher proportion of visitors were from social grades D and E, but the proportion from the lower social grades (C2, D and E) are around a quarter in both surveys. Nationally, 53% of the population are in the social grade A/B/C1, 47% are C2/D/E 1. Social Grade 5 45% 4 41% 44% 35% 3 25% 2 15% 1 5% 32% 26% 18% 16% 9% 7% 5% 3% 1% A B C1 C2 D E Census. See table QS613EW Social Grade for England and Wales. 10
11 2.6 The table below shows the social grade of respondents compared to the North West and Yorkshire and Humber regions and to England and Wales. A higher proportion of respondents to the survey were social grade AB and C1 than in the North West and Yorkshire and Humber regions. The proportion of survey respondents that were C2 and DE was lower than in the North West and Yorkshire and Humber regions. Social Grade North West Yorkshire and England the Humber and Wales AB 35% 31% 2 19% 23% C1 41% 44% 3 29% 3 C2 18% 16% 22% 23% 22% DE 7% 1 28% 29% 25% 2.7 The majority of respondents (91%) were White British. 7% were from other white ethnic groups, 2% from mixed ethnic groups and 1% were from Asian ethnic groups. 2.8 The question on ethnicity was updated in this 2017 survey to use the question from the 2011 census. This allows those from Other White ethnic groups to be recorded separately (in the 2013 questionnaire, White/British/Irish/Other White background was one category). Key results from this are: In 2013, 99% were recorded in the White ethnic groups category, compared to 98% in In 2017, 7% of visitors were from the White Other group. This includes those from Europe, including Eastern Europe. 2.9 The table below shows the ethnic group of respondents compared to the North West and Yorkshire and Humber regions and England and Wales. A higher proportion of survey respondents were from white ethnic groups and a lower proportion were from Asian ethnic groups than in the North West and Yorkshire and Humber regions. Ethnic group 2017 North West Yorkshire and the Humber England and Wales White: British 91% 87% 86% 8 White: Other 7% 3% 3% 5% Mixed 2% 2% 2% 2% Asian 1% 6% 7% 8% Black 1% 2% 3% Other 1% 1% 1% 2.10 Just over one in ten (12%) of respondents where in a party where a member of the party had a long-term health issue or disability that limits their daily activities. This is similar to the figure recorded in The 2013 figure here takes account of those who said prefer not to say. 11
12 ORIGIN OF VISITORS 2.11 The majority of respondents (94%) were from the UK and 6% were from outside of the UK. In 2008 and 2013, 2% and 7% respectively were from outside of the UK Ninety-five percent (95%) of respondents from the UK were from England, 3% were from Scotland, 1% were from Wales and less than 1% were from Northern Ireland and the Channel Islands. Over half (58%) were from Yorkshire and the Humber and the North-West. Region 2017 (Count) 2017 (%) 2013 (%) Yorkshire and The Humber % 34% North West % 17% North East 46 8% 9% East of England 41 7% 9% South East 39 6% 6% East Midlands 38 6% 6% South West 22 4% 5% West Midlands 22 4% 5% Scotland 20 3% 4% London 16 3% 3% Wales 7 1% 1% Northern Ireland 2 Channel Island 1 Total The table below shows the region of the UK for respondents interviewed at the two new sites used in this research, Orton and Devil s Bridge, compared to the other ten sites. Respondents interviewed at the two new sites where more likely to be from the North West, with 54% of respondents interviewed at Orton or Devil s Bridge from North West compared to 17% of respondents interviewed at the other ten sites. Region Sites used in previous research New sites used in 2017 research (Orton & Devil s Bridge) Count % Count % Yorkshire and the Humber % 7 11% North West 94 17% 35 54% North East 38 7% 8 12% East of England 40 7% 1 2% South East 37 7% 2 3% East Midlands 34 6% 4 6% South West 20 4% 2 3% West Midlands 20 4% 2 3% Scotland 18 3% 2 3% London 14 3% 2 3% Wales 7 1% 0 Northern Ireland 2 0 Channel Island 1 0 Total
13 2.14 A map showing the home location of respondents, based on postcodes, is contained in Appendix In the 2013 survey, 34% of visitors were from the Yorkshire and Humberside region, and 17% were from the North-West. The proportion from the North West is the same in 2017 when the two new sites used in 2017 (Orton and Devil s Bridge) are excluded, with 17% from this region. The proportion from the Yorkshire and Humberside region is higher in 2017 than in 2013 when the two new sites are excluded, with 41% were from this region in 2017, compared to the 34% in VISITOR TYPE 2.16 Forty-three percent (43%) of respondents were day visitors to the Yorkshire Dales National Park, with 6% living within the Yorkshire Dales National Park (11 respondents) and 37% having come from outside the Yorkshire Dales National Park. 58% of respondents were overnight visitors, with 43% staying overnight in the Yorkshire Dales National Park and 15% staying overnight outside of the park. Which of the following best describes your visit today? Staying overnight outside the Yorkshire Dales National Park 15% Staying overnight in the Yorkshire Dales National Park 43% On a day Visit from home outside the Yorkshire Dales National Park 37% On a day Visit from home within the Yorkshire Dales National Park 6% 5% 1 15% 2 25% 3 35% 4 45% 5 Base: There were some differences in the profile of day and overnight staying visitors by social grade. Amongst visitors who were from the C2/D/E social grade, 47% were day visitors, whereas for those who were from the A/B/C1 social grade, 41% were day visitors. This difference is further emphasised by the home location of respondents. Visitors who were from social grade C2/D/E were more likely to be from the Yorkshire and Humber region, with 44% of visitors who were C2/D/E from the Yorkshire and the Humber region, whereas for those from the A/B/C1 social grade only 33% were from this region The profile of visitors is again broadly comparable to earlier surveys (see chart below). Key points from comparisons over time are: In 2017, 43% of visitors were day visitors. This compares with 42% in 2013 and 53% in The proportion of day visitors is lower than the 2008 survey, but shows no change between 2013 and
14 For staying visitors, the proportion of visitors in 2017 was 58%. This is the same as in the 2013 survey. However, there has been a change in the make-up of staying visitors over the three surveys. In 2017, 15% of visitors were staying outside the YDNP; 43% were staying in the YDNP. In 2013 and 2008, smaller proportions of visitors were staying outside the YDNP 9% and 3% respectively. It is important to note that this shows the proportion of staying and day visitors has changed, and does not relate to the overall visitor numbers. Which of the following best describes your visit today? Staying overnight outside the Yorkshire Dales National Park 3% 9% 15% Staying overnight in the Yorkshire Dales National Park On a day Visit from home outside the Yorkshire Dales National Park 44% 49% 43% 47% 34% 37% On a day Visit from home within the Yorkshire Dales National Park 6% 8% 6% Base: 652 DURATION OF STAY 2.19 Visitors who were staying overnight (either in the YDNP or outside) were asked how many nights they were staying. In this 2017 survey, 15% were staying for one night, 21% for two nights and 27% for a week. The chart below shows the lengths of stay for both the 2017 and 2013 surveys. In this latest survey, a greater proportion of visitors interviewed were staying for short breaks of one or two nights (compared to the 2013 survey). 35% If staying overnight, how many nights have you spent during your stay? 3 25% 2 15% 1 5% % nights nights Base:
15 2.20 The table below compares the average number of nights stayed by overnight visitors. The mean number of nights stayed is lower in 2017 than in 2013 (4.49 nights and 5.45 nights respectively) but is still higher than Average Mean Mode (top three) length of stay nights 7 nights (27% gave this answer) 2 nights (21%) 3 nights (15%) nights 7 nights (3) 2 nights (14%) 3 nights (14%) nights 2 nights (32%) 7 nights (22%) 3 nights (12%) GROUP COMPOSITION 2.21 The mean number of adults in the group respondents were with when interviewed was 3.0, with the number ranging from 1 to 42. There is a cluster of high outliers with 15 or more adults. Excluding the 13 cases with 15 or more adults the mean is 2.5 adults The mean number of children aged under 16 in the group was 0.4, with the number ranging from 0 to % of respondents were in a group that contained children. There is a cluster of high outliers with 14 or more children. Excluding the 3 cases with 14 or more children the mean is 0.3 children. These results are similar to those in the 2013 survey when the average group size was 2.81 adults and 0.25 children. AWARENESS OF THE YORKSHIRE DALES NATIONAL PARK 2.23 Respondents were asked if they were aware that the area they were in was a part of the Yorkshire Dales National Park. The majority of respondents (94%) were aware that the area they were in, when interviewed, was part of the Yorkshire Dales National Park, with 91% definitely aware and 3% possibly aware. Only 6% of respondents were not aware that the area was part of the Yorkshire Dales National Park, with 2.6% definitely not aware and 3.7% possibly not aware. All respondents knew what a National Park was. Respondents interviewed in Orton and Devil s Bridge were less likely to be aware that the area they were in was part of the Yorkshire Dales National Park, with 79% aware that the area they were in was part of the Yorkshire Dales National Park compared to 96% for the other ten sites. Overall, respondents who were (definitely or possibly) not aware that the area they were in was part of the YDNP were more likely to be from social grades C2, D and E (1 of this group, compared to 5% of those in social grades A, B and C1). (See chart overleaf) 15
16 Were you aware that this area was a part of the Yorkshire Dales National Park? Yorkshire Dales National Park Don t know what a National Park is No, definitely not 3% No, possibly not 4% Yes, possibly 3% Yes, definitely 91% Base: 652 TRAVEL TO THE YORKSHIRE DALES NATIONAL PARK 2.24 The majority of respondents (87%) had travelled to the location they were interviewed in by private car or van. 4% had travelled on foot, 3% by motorbike, 3% by public bus or coach, 1% by private bus or coach, 1% by train, 1% by bicycle and less that 1% by another method. How did you travel here today? By private car/van 87% On foot Motorbike Public bus/ coach Private bus/ coach Train Bicycle Other On horse back 4% 3% 3% 1% 1% 1% Base: The results are similar to the 2013 survey. In 2013, 89% travelled to the location they were interviewed in that day by private car/van (87% in 2017), 3% travelled by public bus/coach (3% in 2017) and 2% by private bus/coach (1% in 2017). 16
17 REPEAT AND FIRST TIME VISITORS 2.26 Eighty-six percent (86%) of respondents had visited the Yorkshire Dales National Park before, with 57% having visited numerous times in the last 12 months and 3 visiting for the first time in the last 12 months. 14% of respondents were visiting the Yorkshire Dales National Park for the first time ever. Approximately how many times, (including today), have you visited the Yorkshire Dales National Park in the last 12 months? 6 57% % 1 Base: 652 Numerous times Today is my first time in the last 12 months First ever trip 2.27 Although this question has changed since the 2013 survey, there are still some comparisons over time that can be made. This year, 86% of respondents said they had visited the YDNP in the last 12 months. This is an increase from 7 in 2013 and 64% in Additionally, in 2017, 14% of respondents said that this was their first ever trip to the YDNP. This compares with 1 in 2013 and 7% in There is a significant difference in the pattern of visits between day visitors and those staying overnight in the YDNP. Staying visitors were more likely to be visiting for the first time in the last 12 months (42% staying visitors compared to 2 of day visitors). Day visitors were more likely to have visited the YDNP numerous times in the last 12 months (69% of day visitors compared to 41% of staying visitors). Staying visitors were also more likely to be on their first ever trip to the YDNP than day visitors (17% of staying visitors compared to 11% of day visitors). 17
18 SOURCE OF INFORMATION USED WHEN PLANNING TRIP Yorkshire Dales National Park 2.30 The online sources used by most respondents when planning a trip to the Yorkshire Dales was Google, which was used by 42% of respondents. 12% of respondents had used a traveller review website and 12% had used the Yorkshire Dales National Park website. Nearly half of respondents (47%) had not used any online sources when planning their trip. Only a very small proportion used social media (Facebook, Twitter) as sources of information. Which of the following online sources did you use when planning your trip to the Yorkshire Dales? Didn t use online sources 47% Google 42% Traveller review websites Yorkshire Dales National Park website 12% 12% Individual business/attraction website Other website 6% 6% Smartphone App Other search engines Transport provider website Facebook Magazine/newspaper website Twitter Pinterest 3% 3% 3% 2% 2% 1% 5% 1 15% 2 25% 3 35% 4 45% 5 Base: There are some comparisons which can be made to earlier surveys. The question in this 2017 survey was re-designed to split both online and offline sources of information (in previous surveys they were combined), and to bring the potential information sources up-to-date. Key comparisons of online sources used are: In 2017, 12% of respondents had used the YDNP website when planning their trip. This is an increase from 8% in 2013, and in 2008 (the same figure). In 2017, only 6% used an other website; in 2013 the figure was 19%, in 2008 it was 15%. This could be a reflection of the large proportion (42%) of respondents now using Google as a source of information. 18
19 2.32 There are some differences in the online information sources used by different groups when planning a trip to the YDNP. For example, 14% of visitors who were staying overnight in the YDNP used the YDNP website when planning their visit, compared with 9% of day visitors. This is a small difference (and not statistically significant). There are, however, bigger differences between day visitors and those staying overnight in the YDNP for the following online information sources as shown in the table below. Online sources used Day visitors Staying visitor Traveller review website 7% 18% Individual business/attraction website 4% 8% Google 33% 54% 2.33 OS or other maps were the off-line source of information referred to by most respondents when planning their visit, with 39% of respondents using this source of information. 16% of respondents had used information from friends and family, 14% had used a guide book and 13% had used printed leaflets when planning their visit. Nearly two-fifths (39%) had not used any off-line source of information when planning their visit. What other information did you refer to, to plan your visit? OS or other Map 39% Didn t use any information to plan visit 35% Information from friends/family 16% Guide Book Printed Leaflet 14% 13% Other The Visitor magazine Magazine Article Public transport information Contacted a National Park Visitor Centre Radio/TV programme 5% 5% 4% 3% 2% 2% 5% 1 15% 2 25% 3 35% 4 45% Base: Similarly, comparisons between the 2017 results and earlier surveys for offline sources are: OS and other maps was again the main offline source used by visitors in planning their visit. In 2017, 39% used this as a source, compared to 26% in 2013 and 52% in Information from family and friends was used as a source by a higher proportion of visitors in % used this source in 2017, 9% in 2013 and 8% in A guide book and printed leaflets were used by 14% and 13% respectively in In 2013, the comparable figures were also 14% and 13% (both reductions from the 2008 survey 22% for each source). 19
20 2.35 Again, there are significant differences between day and staying visitors in the offline information sources used. Those staying overnight in the YDNP were more likely to have used the following sources in planning their trip: Offline sources used Day visitor Staying visitor OS or other map 35% 43% Printed leaflet 8% 2 Magazine article 2% 7% The Visitor Magazine 3% 8% Information from friends/family 14% There are also significant differences in the offline information sources used to plan the visit by social grade. Visitors from the C2/D/E grades were less likely to use OS or other maps (42% of A/B/C1 compared to 3 of C2/D/E) and less likely to use a guide book (16% of A/B/C1 and 8% of C2/D/E). SOURCES OF INFORMATION USED DURING TRIP 2.37 One-third of respondents (33%) had used, or were planning to use, Google maps as a source of information during their visit. 31% of respondents had talked to locals, 3 had used a National Park Visitor Centre, 27% had used brochures or leaflets from their accommodation and 24% had used websites. Nearly a quarter (23%) of respondents had not used and did not plan to use any of the sources of information listed during their visit. This is likely to be because they are repeat visitors with knowledge of the area already. Respondents who had visited the YDNP numerous times in the last 12 months were less likely to have used, or planned to use, any of the sources of information, with 33% of those who had visited the YDNP numerous times in the last 12 months, 12% of those who had visited YDNP previously but this was their first visit in the last 12 months, and 7% of those on their first ever trip to YDNP not having used, or planned to use, any of the sources of information. During your visit which of the following sources of information have you or will you use to look for things to see and do? Google maps Talking with locals National Park Visitor Centre 3 31% 33% Brochures/leaflets in accommodation 27% Websites None of these 24% 23% Personal advice from accommodation provider 12% Other Traveller review/ratings 6% 6% Apps Social media sites 4% 3% 5% 1 15% 2 25% 3 35% Base:
21 2.38 There were significant differences in the information sources used during their visit between day visitors and those staying in the YDNP overnight. Staying visitors were more likely to have used the following as sources of information during their trip. Information sources Day visitors Staying visitors during trip Talking with locals 24% 4 Websites 17% 33% National Park Visitor Centre 22% 4 Personal advice from accommodation providers Brochures/leaflets in accommodation 7% 19% 16% 41% 2.39 There was also a significant difference in information sources used during the visit by social grade. Those from social grade C2/D/E were more likely to use social media as a source during their visit There were significant differences in the information sources used during their visit between those who had visited the YDNP numerous times in the last 12 months, 12%, those who had visited YDNP previously but this was their first visit in the last 12 months, and those on their first ever trip to YDNP. Information sources during trip Numerous times Today is my first time in the last 12 months First ever trip Talking with locals 26% 32% 47% Google maps 3 32% 46% Websites 2 25% 39% National Park Visitor Centre 22% 41% 36% Personal advice from 7% 18% 22% accommodation provider Brochures/leaflets in 16% 4 43% accommodation Traveller review/ratings 4% 5% 17% 21
22 YORKSHIRE DALES NATIONAL PARK SPECIAL QUALITIES Yorkshire Dales National Park 2.41 When asked what they see as the special qualities of the Yorkshire Dales National Park, the majority of respondents (84%) said one of its special qualities was natural beauty, scenery and views. 35% of respondents thought one of the special qualities of the Yorkshire Dales was walks and walking and 33% thought one of the special qualities was peace and tranquillity. With regards to the Yorkshire Dales National Park, what do you see as its special qualities? Natural Beauty/scenery/views 84% Walks and walking Peaceful/ tranquil Other 33% 33% 35% Open space/freedom/ remoteness 26% Villages/ traditional buildings Hills/dales/ valleys Waterfalls Wildlife Barns and walls Clean/ unpolluted Limestone scenery Outdoor activities Social history Hay meadows Dark skies 21% 16% 16% 16% 11% 11% 1 1 6% 6% 4% Base: Staying visitors were more likely to think that each of the 15 aspects listed in the questionnaire were special qualities of the YDNP. Three of the aspects considered as special qualities of the YDNP were less likely to be mentioned by day visitors than staying visitors (and were significantly different statistically). These were villages/traditional buildings, waterfalls and peaceful/tranquil. Aspect considered a special Day visitors Staying visitors quality of the YDNP Villages/traditional buildings 18% 24% Waterfalls 13% 2 Peaceful/tranquil 28% The question asked in the 2017 survey was the same as in the previous surveys in 2008 and 2013, with the minor change of including an option of dark skies to the 2017 survey questionnaire. 22
23 2.44 Looking at the results over time shows that natural beauty/scenery/views was seen as the main special quality of the YDNP in each of the 3 surveys. This year, 84% gave this as its special quality, compared with 78% in 2013 and 94% in The results do show some important changes over time for other aspects, including: Peaceful/tranquil a third (33%) saw this as a special quality in 2017, up from 29% in 2013 and 22% in This increase is partly balanced by a slight reduction in those who responded that a special quality of the park was open space/freedom/remoteness. Villages/traditional buildings the proportion who thought this is a special quality of YDNP increased from 1 in 2008 to 15% in 2013, and to 21% in Waterfalls, wildlife, barns and walls for each of these aspects the proportion thinking they are a special quality has increased a statistically significant increase since 2008 and (See chart below) With regards to the Yorkshire Dales National Park, what do you see as its special qualities? Natural Beauty/scenery/views Walks and walking Peaceful/ tranquil Other Open space/freedom/ remoteness Villages/ traditional buildings Hills/dales/ valleys Waterfalls Wildlife Barns and walls Clean/ unpolluted Limestone scenery Outdoor activities Social history Hay meadows 34% 26% 35% 22% 29% 33% 25% 13% 33% 39% 37% 26% 1 15% 21% 12% 17% 16% 2% 3% 16% 4% 4% 16% 2% 4% 11% 7% 6% 11% 6% 13% 1 2% 2% 1 1% 3% 6% 1% 6% 84% 78% 84% Dark skies 4% Base: 2017 = 651, 2013 = 502, 2008 = As shown in the chart below, when asked what had attracted them to the Yorkshire Dales on the occasion they were interviewed, 3 of respondents 23
24 had been there before and wanted to come back and 29% had been attracted to the Yorkshire Dales by the scenery, landscape and connecting to nature. 23% had come to the Yorkshire Dales to enjoy an outdoor activity and 18% had come because it s one of their favourite places or they always come here. 37% of respondents had been attracted to the Yorkshire Dales by something else. Thinking broadly about your decision to visit the Yorkshire Dales, what was it that attracted you to visit here on this occasion? Other 37% Been before and wanted to come back The scenery, landscape, connecting to nature 3 29% To enjoy an outdoor activity 23% One of my favourite places/always come here 18% To get away from it all/for peace and tranquillity Easy to get to To visit friends or family who live here For a friends and family event or celebration 7% 6% 6% 6% The history and culture To go to a visitor attraction Some where to go with good weather forecast To take part in an outdoor challenge To attend a show or festival 4% 4% 3% 2% 5% 1 15% 2 25% 3 35% 4 Base: There were significant differences in what attracted visitors to the YDNP between day and staying visitors. Those staying overnight in the YDNP were more likely to have come for the scenery/landscape/connecting to nature, because it is one of their favourite places, and to get away from it all. Aspect that attracted respondents to the YD on this occasion Day Visitors Staying Visitors Scenery/landscape/connecting to nature 26% 34% One of my favourite places/always come 13% 25% here Somewhere to go with good weather 4% 1% forecast To get away from it all/for peace and tranquility 4% A large proportion of respondents to the survey gave other as a response to this question 37% in total. As illustrated in the word-cloud diagram below (which shows the most commonly used words in the other responses) there was a wide range of responses in terms of other aspects. Some came to walk or to shop or to visit their caravan in the area all of which are highlighted as larger words in the word-cloud. Others visited for specific events or attractions, including three peaks cheese shop steam train, Pen-y-Ghent and a range of named pubs. Another cluster of responses are connected to celebration type 24

25 events, and friends and family. A list of the other responses is contained in Appendix 4. This question was a new introduction into the survey in 2017 and there are therefore no comparable results from earlier years. ACTIVITIES 2.48 When asked what activities they had participated in, or would participate in, during their visit, 64% of respondents had visited, or were planning to visit, a café or tea room. 58% of respondents had participated in, or would participate in, general sightseeing, 57% in walking for more than one hour and 47% had visited, or would visit, a country pub. Around a quarter of visitors (23%) said that they had or will visit an attraction as part of their visit. What activities have you or will you participated in during your visit today? Cafe / tea room General sightseeing Walking (more than one hour) Country pub Walking (less than one hour) Visit a National Park Visitor Centre Shopping Car touring Visit an attraction Having a picnic For wildlife watching Visit a heritage or historic site Other Go cycling or mountain biking Come for a special event 28% 27% 25% 23% 23% 23% 17% 14% 9% 4% 3% 47% 58% 57% 64% Base:
26 2.49 Unsurprisingly, due to their longer stay, those staying overnight in the YDNP were significantly more likely to have taken part in a range of activities during their visit, compared to day visitors. These are shown in the table below. Activities have or will participate in during visit Day visitors Staying visitors Walking (more than one hour) 53% 62% General sightseeing 51% 67% Country pub 4 57% Shopping 19% 32% Car touring 18% 31% Visit a national park centre 2 36% Visit a heritage or historic site 11% 17% 2.50 There are also differences in the activities undertaken during the visit by social grade. Those in social grade A/B/C1 were more likely to have taken part in a walk of one hour or more (59% of A/B/C1, 49% of C2/D/E). Those in social grade C2/D/E were more likely to have taken part in general sightseeing (56% of A/B/C1, 64% of C2/D/E) and car touring (21% of A/B/C1, 29% of C2/D/E) When asked what was the main activity they had participated in, or would participate in, during their visit, 43% of respondents stated that their main activity would be walking for more than one hour. General sightseeing was the main activity for 2 of respondents. Only 7% said that visiting an attraction was the main activity of their visit. What is, or will be, your main activity today? Walking (more than one hour) General sightseeing Visit an attraction Other Walking (less than one hour) Car touring Country pub Cafe / tea room Come for a special event Go cycling or mountain biking Shopping Visit a heritage or historic site For wildlife watching Having a picnic Visit a National Park Visitor Centre 7% 6% 6% 3% 3% 3% 2% 2% 1% 1% 1% 1% 2 43% Base: Walking was the main activity of the visit for 45% of A/B/C1 visitors and 31% of C2/D/E visitors. General sightseeing was the main activity of the visit for 17% of A/B/C1 visitors and 31% of C2/D/E visitors Both questions above (what activities have or will be undertaken and what or will be the main activity) were new questions in the 2017 questionnaire and so there are no comparable results for previous years. 26
27 BARRIERS TO ENJOYMENT 2.54 When asked if anything had spoiled the enjoyment of their visit to the Yorkshire Dales, just over three-quarters (76%) of respondents said that nothing had spoiled their enjoyment. One-in-ten (1) respondents said the enjoyment of their visit was spoiled by bad weather and 12% said that something else had spoiled the enjoyment of their visit. Has anything spoiled the enjoyment of your visit to the Yorkshire Dales today? Nothing 76% Other Bad weather 12% 1 Traffic congestion on road Finding somewhere to park Motorbikes on road Lack of waymarking Condition of path rocky/stony Toilet facilities Start of visit Too many people Condition of path rutted/muddy/boggy Condition of path after repair work Facilities at National Park Information Centre Off road trail bike/4x4 noise Litter 1% 1% Base: Whilst there were some changes in the responses given to the question on aspects that may have spoilt the visit this year, the results to this 2017 survey are broadly comparable with those from the 2013 survey. Key comparisons are shown in the table below. Negative aspect Nothing 76% 75% 59% Bad weather 1 9% 16% Traffic congestion on road 1% 4% 5% Finding somewhere to park 1% 1% 27
28 SATISFACTION WITH OVERALL VISIT 2.56 The majority of respondents were very satisfied with their overall visit to the Yorkshire Dales National Park, with 79% of respondents giving a score of 6 out of 6. No respondents were not at all satisfied with their visit (a score of 1 or 2). Taking into account, how satisfied or dissatisfied are you overall with your visit to the Yorkshire Dales National Park? % % 1 Base: Not at all satisfied 2.57 There were no significant differences in overall satisfaction with the visit to the YDNP between day and staying visitors. 79% of day visitors were very satisfied, compared with 8 of those staying overnight The results show a continued increase in the proportion of visitors who were very satisfied with their visit to the YDNP over time. The comparable figures for the proportion who were very satisfied with their visit in 2013, 2008 and 2002 were 77%, 73% and 51% respectively. 9 4% Very satisfied Don't know Taking everything into account, how satisfied or dissatisfied are you overall with your visit to the Yorkshire Dales National Park? 1% % 77% 73% % 16% % 1 - Not at all satisfied 4% 5% 2% Very satisfied 1% 1% 1% Don't know Base: 2017 = 648, 2013 = 502, 2008 =
29 USAGE AND SATISFACTION WITH FACILITIES 2.59 Over three-quarters of respondents (77%) had used a car park during their visit to the Yorkshire Dales. 72% of respondents had used a café, pub or restaurant, 69% had used public toilets and 56% had used rights of way. During your visit to the Yorkshire Dales have you used any of the following facilities or services? Car parks Café/pub/restaurants Toilets 72% 69% 77% Rights of way (footpaths) 56% Accommodation Information boards Wi-fi or mobile coverage 39% 37% 35% National Park Centres National Park Leaflets 26% 22% Picnic sites Public transport information Guided walks Public transport provision 9% 6% 5% 4% Base: Again unsurprisingly there were some significant differences in the facilities and services used during the visit to the YDNP between day and overnight visitors. Those staying in the area overnight were more likely to have used a range of facilities/services. Facilities and Services used Day Visitors Staying visitors Toilets 65% 73% Rights of way 49% 64% Café/pub/restaurant 66% 8 Information boards 3 45% National Park leaflets 15% 33% Guided walks 4% 7% National Park Centres 16% 4 Picnic sites 6% 12% Wi-fi or mobile coverage 23% 51% Accommodation 14% 72% 29
30 2.61 There are some changes over time in the usage of different facilities see chart below. These include: The proportion of visitors using car parks has declined slightly on previous years 77% in 2017, compared to 86% in 2013 and 81% in 2008 (a similar proportion had travelled to the area by private car or van in all three years 87% in 2017, 89% in 2013 and 9 in 2008). The proportion of visitors using cafes, pubs or restaurants has increased from previous surveys from 46% in 2013 and 49% in 2008, to 72% in The proportion of visitors using rights of way/footpaths has also increased since the previous surveys from 15% in 2008, to 45% in 2013 and now to 56% in The proportion using National Parks Centres has remained fairly constant over the 3 surveys and remains at approximately a quarter (26%) of visitors. This is also the case for National Park leaflets Two new categories were introduced in this 2017 survey. Thirty-nine percent had used accommodation during their visit, and over a third (35%) had used wi-fi or mobile coverage. During your visit to the Yorkshire Dales have you used any of the following facilities or services? Car parks 81% 86% 77% Café/pub/restaurants 49% 46% 72% Toilets 62% 69% 75% Rights of way (footpaths) 15% 45% 56% Accommodation Information boards Wi-fi or mobile coverage National Park Centres National Park Leaflets 39% 36% 37% 37% 35% 31% 23% 26% 27% 18% 22% Picnic sites Public transport information Guided walks Public transport provision 5% 8% 9% 5% 3% 6% 9% 5% 5% 4% 2% 4% Base: 2017 = 652, 2013 = 502, 2008 = varying 30
31 2.63 There were high levels of satisfaction with most of the facilities and services respondents had used during their visit to the Yorkshire Dales: Over 9 of respondents who had used the facility or service were very satisfied (a score of 5 or 6 out of 6) with guided walks, National Park Centres, café/pub/restaurants, National Park leaflets, rights of way (footpaths), picnic sites, information boards and accommodation. Over 8 of respondents were very satisfied (a score of 5 or 6) with public transport information, public transport provision, car parks and toilets. Satisfaction with wi-fi or mobile coverage was lower. 51% of respondents were very satisfied (a score of 5 or 6) with wi-fi and mobile coverage while nearly a quarter (24%) were not at all satisfied (a score of 1 or 2). (See chart below). How satisfied or dissatisfied were you with the standard of? Guided walks 82% 15% 3% National Park Centres 76% 18% 4% Café/pub/restaurants 73% 21% 4% National Park Leaflets 7 23% 5% Rights of way (footpaths) 68% 25% 5% Picnic sites 66% 27% 7% Information boards 65% 27% 6% Accommodation 76% 15% 5% 3% Public transport information 56% 33% 8% 3% Public transport provision 59% 28% 3% 3% 7% Car parks 62% 23% 7% 4% 2% Toilets 56% 27% 9% 4% 2% Wi-fi or mobile coverage 33% 18% 12% 14% 11% 13% Very satisfied Not at all satisfied Base: (Small base size for guided walks (33), public transport information (36) and public transport provision (29)) 2.64 Levels of satisfaction with the various facilities and services were compared for day and staying visitors. There was only one aspect where there was a significant difference. Those staying overnight were slightly more satisfied with toilets than day visitors (85% of staying visitors gave satisfaction with toilets a score of 5 or 6, compared with 82% of day visitors). 31
32 2.65 For many of the facilities or services with the highest levels of satisfaction, there has been an increase in satisfaction since the 2013 survey. For example, the proportion who were satisfied with National Park Centres increased from 83% in 2013 to 95% in this 2017 survey (168 sample size). Similarly, guided walks (small sample size), cafes/pubs/restaurants, national park leaflets, picnic sites (small sample size) and public transport provision (small sample size) also saw large increases in satisfaction between 2013 and Comparison of the results from 2013 and 2017 are shown in the chart below. How satisfied or dissatisfied were you with the standard of? Satisfied (5 or 6) Guided walks National Park Centres Café/pub/restaurants National Park Leaflets Rights of way (footpaths) Picnic sites Information boards Accommodation Public transport information Public transport provision Car parks Toilets Wi-fi or mobile coverage Base: 2017 = , 2013 = varying LIKELIHOOD TO RETURN AND RECOMMENDATION 2.66 Over three-quarters (77%) of respondents were very likely to return to the area in the next two years (a score of 9 or 10 out of 10). Only 3% of respondents were not at all likely to return to the area in the next two years (a score of 0 or 1). 5 67% 78% 83% 86% 86% 85% 8 84% 91% 97% 88% 94% 88% 93% 92% 93% 93% 92% 91% 88% 89% 95% How likely or unlikely are you to return to this area in the next two years? % Base: 650 2% 1% 1% 0 - Not at all likely 4% Very likely 2% 4% 7% 5% 32
33 2.67 Comparison of the results on likelihood to return to the YDNP area in the next 2 years by social grade shows some differences. 76% of A/B/C1 gave a score of 9 or 10 out of 10 on likelihood to return, compared with 83% of C2/D/E visitors The question on likelihood to return to the area was updated from the 2013 survey. The 2013 question used a 5-point scale (nationally recognised scale of 0-10 used in 2017) and also asked about likelihood of visiting the area in the next 5 years (2 years used in 2017). However, some comparisons can be made. In 2017, 77% of visitors said that they are very likely to return to the area in the next 2 years in 2013, 82% said they were likely to return in the next 5 years The majority of respondents (91%) were very likely to recommend the area to friends and family (a score of 9 or 10 out of 10). Only 1% of respondents were not at all likely to recommend the area (a score of 0 or 1). How likely or unlikely are you to recommend this area to your friends and family? % Base: 651 1% 1% 1% 1% 0 - Not at all likely 4% 4% Very likely 2.70 C2/D/E visitors were also slightly more likely to recommend the area to friends and family. 91% of A/B/C1 gave a score of 9 or 10 out of 10, 93% of C2/D/E. This was a new question in the 2017 survey and there are therefore no comparisons to earlier surveys There are no significant differences in likelihood to recommend the area between day and staying visitors. 87% of both day visitors and those staying overnight gave a likelihood to recommend score of 10 out of


34 2.72 Likelihood to recommend the Yorkshire Dales National Park area can be used to calculate a net promoter score (NPS). The Net Promoter Score is a measure which is used by a number of major organizations to understand their customer loyalty. NPS is calculated by subtracting the percentage of respondents who gave a score of 0-6 (detractors) from the percentage of respondents who gave a score of 9 or 10 (promoters). Respondents who gave a score of 7 or 8 are classed as passives and are not included in the calculation As shown in the chart below, 91% of respondents were promoters (gave a score of 9-10) and 3% were detractors (gave a score of 9 or 10) giving the Yorkshire Dales National Park an NPS of 88%. Net promoter score % 88% 1 Base: 651 3% 2.74 The NPS for YDNP is very high and higher than that of many major brands for example, Apple has an NPS of 66% and Dell has an NPS of 55%. Major food chains have an NPS ranging from -8 (Macdonalds) to 78 (Pizza Hut) It is much higher than Easyjet, which is -16. Collection of NPS scores from other National Park areas would be helpful to interpret this figure. 6% Detractors (0-6) Passives (7-8) Promoters (9-10) NPS 34
35 DIFFERENCES BETWEEN OLD AND NEW SITES 2.75 The table below summarises the differences between the sites used in previous research and used again in this research, and the two new sites, Orton and Devil s Bridge, included in 2017 for the first time. For each question it shows the category, the result for the sites used in the previous research, the results for the new sites and then the difference between the two. It can be seen that there are some very large differences, for example in the first question, there was a 23% difference between those who were staying overnight between the old sites used in the previous research and the new sites. Question Category Sites used in previous research New sites used in 2017 research (Orton & Devil s Bridge) Difference Which of the following best describes your visit today? If staying overnight, how many nights have you spent during your stay? How many adults (aged 16 and over) are in your group today? Staying overnight (in or outside of the Yorkshire Dales National Park) 6 37% -23% Mean number Mean number Region of UK North West 17% 54% 37% Before I spoke to you today, were you aware that this area was a part of the Yorkshire Dales National Park? Yorkshire and The Humber Yes, definitely / Yes, possibly 41% 11% -3 96% 79% -17% How did you travel here today? Private car/van 89% 72% -17% Which of the following online sources did you use when planning your trip to the Yorkshire Dales? What other information did you refer to, to plan your visit Motorbike 1% 2 19% Traveller review websites 13% -13% Google 44% 3-14% Didn t use online sources 45% 62% 17% OS or other Map 4 25% -15% Printed Leaflet 14% 4% -1 Guide Book 15% 3% -12% Information from friends/family Didn t use any information to plan visit 18% 7% -11% 32% 56% 24% 35
36 Question Category Sites used in previous research During your visit which of the following sources of information have you or will you use to look for things to see and do? With regards to the Yorkshire Dales National Park, what do you see as its special qualities? Thinking broadly about your decision to visit the Yorkshire Dales, what was it that attracted you to visit here on this occasion? What activities have you or will you participate in during your visit today? What is, or will be, your main activity today? Has anything spoiled the enjoyment of your visit to the Yorkshire Dales today? During your visit to the Yorkshire Dales have you used any of the following facilities or services? Yorkshire Dales National Park New sites used in 2017 research (Orton & Devil s Bridge) Difference Websites 25% 14% -11% National Park Visitor 32% 1-22% Centre Brochures/leaflets in accommodation 29% 1-19% Walks and walking 37% 23% -14% Clean/ unpolluted 12% 3% -9% Barns 12% 4% -8% Waterfalls 17% 7% -1 To visit friends or family 5% 14% 9% who live here Easy to get to 14% -14% Cafe / tea room 62% 77% 15% Walking (more than one 61% 24% -37% hour) Country pub 5 27% -23% Visit a National Park 29% 7% -22% Visitor Centre Visit a heritage or historic site 15% 6% -9% Cafe / tea room 2% 13% 11% Walking (more than one 46% 17% -29% hour) General sightseeing 19% 3 11% Nothing 74% 9 16% Toilets 71% 49% -22% Car parks 79% 61% -18% Rights of way (footpaths) 58% 32% -26% Information boards 4 11% -29% National Park Leaflets 25% 4% -21% National Park Centres 29% 3% -26% Wi-fi or mobile coverage 36% 23% -14% Accommodation 41% 21% -2 36
37 3 CONCLUSIONS 3.1 This customer survey in 2017 updated data on the characteristics, behaviour and attitudes of visitors to the YDNP previously collected in It also included an additional sample covering the extended National Park area by including 71 interviews conducted at Orton and Devil s Bridge. This provides some insight into visitors to the extended National Park area. Some key differences were that those who were visiting the new areas were less likely to be staying overnight, more likely to be from the North-West region of the UK, less likely to be aware that the areas was a part of the YDNP, use different sources of information, undertake different activities and have different views about the national park area. 3.2 The profile of visitors to the YDNP area was found to be broadly similar in 2017 to that found in the 2013 survey. Some key points here are: Around three-quarters of visitors to the YDNP are from within the more affluent social grades A, B and C1, with a quarter from the less affluent C2, D and E grades. This suggests that those from social grades C2/D/E are underrepresented in visitors to the park nationally in England and Wales almost a half of the population (47%) are from social grade C2/D/E and in the North West and Yorkshire and Humber regions 51% are from social grade C2/D/E. Whilst not directly comparable to 2013, the survey this year shows that 7% of visitors were from the White Other ethnic group. This includes UK residents from European countries, including Eastern Europe 3. The proportion of visitors with a long-term health issue or disability has been the same for both the 2013 and 2017 surveys. Just over one-in-ten were in a party where a member of the party had a health issue or disability. The proportion of visitors who were day visitors or staying visitors has remained approximately the same between 2013 and However, the profile of staying visitors appears to have changed. In 2017, a larger proportion of visitors were visiting the YDNP but staying overnight outside of the National Park. The profile of staying visitors also appears to have changed in terms of length of stay. The 2017 results show a larger proportion of staying visitors who were on short breaks, staying one or two nights rather than longer breaks of 4-6 nights. The proportion of staying visitors on weekly breaks is consistent between 2013 and The results to the 2017 survey show a small, but significant increase in new visitors to the YDNP. The proportion of visitors who were on their first ever visit in 2017 is higher than in 2013, double the proportion in 2008 and is respectively 14%, 1 and 7%. 3.4 Visitors on their first ever trip were more likely to be staying visitors than day visitors. This was also the case for visitors who were on their first visit in the last 12 months and may be related to geography of home address. It does, however, show the significance of visitors having a good experience on their first visit and then going on to become repeat visitors. 3 In the 2011 Census, the White other group had increased by 1.1 million since Amongst this group, people from Poland as a country of birth were the second largest group of non-uk born residents in
38 3.5 The results for regular visitors, those who are on their first ever visit, and those who are on their first visit for 12 months provides a segmentation of visitors to the YDNP. Further analysis could be undertaken to profile each of these three segments with the objective of supporting marketing decisions and interventions by the YDNPA and others. 3.6 Web-searching, particularly through Google, are very common amongst visitors planning a trip to the YDNP. This is especially the case for visitors staying overnight, where over a half had sourced information through Google when planning their trip. Offline sources such as OS and other maps are still popular in planning a trip to the YDNP, but use of other offline sources is diminishing over time, as Google and other online approaches become the main source of information. However, getting information from family and friends in planning a trip to the YDNP appears to have increased over time. This highlights the importance of recommendation and word of mouth in developing marketing strategies to attract visitors to the National Park. 3.7 Walking is clearly a key activity that attracts visitors to the YDNP. Almost twothirds of visitors said they have had a walk (for more than an hour) during their visit; just under a half said that walking was their main activity of their visit. Many other services benefit from visitors attracted to the Park for walking, including cafés, pubs, and shops. Visiting attractions was the main activity of the visit for less than one-in-ten visitors, although almost a quarter said they would visit an attraction as part of their visit. 3.8 There are strong social grade differences in the activities undertaken as part of a visit to the YDNP. Those in social grade C2/D/E were less likely to have taken part in a walk of an hour or more or to say that walking was the main activity of their visit than those from A/B/C1 groups. Visitors from social grades C2/D/E were also more likely to visit YDNP for general sightseeing than visitors from A/B/C1 grades. 3.9 The results to the 2017 survey show some increases in the usage of the National Park facilities and services over time. Cafés, pubs, restaurants and rights of way (footpaths) were two aspects that have seen large increases in usage over time. For the first time a question was asked about Wi-fi or mobile coverage, this was used by over a third of visitors during their visit Visitors to the YDNP are, in the vast majority of cases, very satisfied with their visit. The results to the 2017 survey show a continued rise in satisfaction levels compared to those in 2013, 2008, and Satisfaction with particular facilities and services has also increased between 2013 and Perhaps the most notable has been the increase in satisfaction with the National Park Centres, which show an increase in satisfaction of over 1 between the 2013 and 2017 surveys from 83% to 95% The survey results also show very high levels of likely recommendation for the YDNP area. Over nine out of ten visitors were very likely to recommend the area to friends and family. This is common to all visitors regardless of social grades or whether a day or staying visitor. The recommendation scores translate into an extremely high Net Promoter Score; one that exceeds major household named 38
39 brands. This is a key strength that could be utilised in marketing the National Park and in attracting under-represented groups There are a number of key differences between the new and old areas of the National Park and this needs to be monitored in future surveys, with the possibility of using pulse surveys in those areas between this and the next full survey in Information by Design March 2018 Final Draft 39
40 APPENDIX 1 - DEMOGRAPHICS Gender Survey North Yorkshire and England and West The Humber Wales Male 5 49% 49% 49% Female 5 51% 51% 51% Transgender Prefer not to say Age Survey North West Yorkshire and The Humber England and Wales % 15% 16% 15% % 16% 16% 17% % 17% 17% 17% % 17% 17% 17% % 15% 15% 14% 65+ years 29% Social Grade Survey North West Yorkshire and The Humber England and Wales AB 35% 2 19% 23% C1 41% 3 29% 3 C2 18% 22% 23% 22% DE 7% 28% 29% 25% Ethnic Group Survey North West Yorkshire and The Humber England and Wales White 91% 87% 86% 8 British Other 7% 3% 3% 5% White Mixed 2% 2% 2% 2% Asian 1% 6% 7% 8% Black 1% 2% 3% Other 1% 1% 1% 40
41 Do you or any of your party have a long-standing health issue or disability that limits your daily activities? Yes (on survey) / Day-to-day activities limited a lot / a little (2011 census) No (on survey) / Day-to-day activities not limited (2011 census) Yorkshire Dales National Park Survey North West Yorkshire and The Humber 12% 2 19% 18% 88% 8 81% 82% Don't know

42 APPENDIX 2 HOME LOCATIONS OF INTERVIEWEES 42
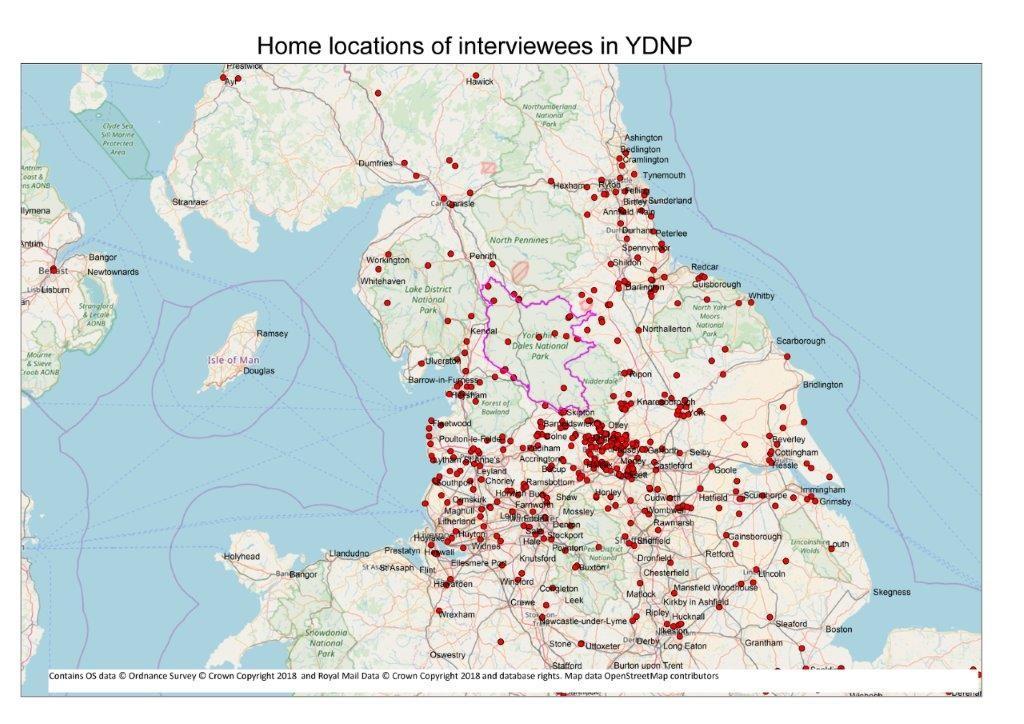
43 43
Yorkshire Dales National Park Authority. Results from Customer Survey 2017
 Yorkshire Dales National Park Authority Results from Customer Survey 2017 Methodology 652 interviews in the YDNP area 12 locations including new locations of Orton and Devil s Bridge 652 Face-to-face interviews
PEMBROKESHIRE & CORNWALL VISITOR SURVEYS 2011/12 COMPARING THE DESTINATIONS. February 2013
 PEMBROKESHIRE & CORNWALL VISITOR SURVEYS 2011/12 COMPARING THE DESTINATIONS February 2013 Prepared for: Visit / Destination Pembrokeshire Partnership Client Contact: Emma Rojano/ Mark Horner TERMS OF CONTRACT
MOURNE & SLIEVE CROOB AONB. VISITORS SURVEY Summary Report
 MOURNE & SLIEVE CROOB AONB VISITORS SURVEY Summary Report November 2004 This project was funded by 1 EXECUTIVE SUMMARY INTRODUCTION In 2004 Mourne Heritage Trust secured funding for the implementation
CEREDIGION VISITOR SURVEY 2011 TOTAL SAMPLE. November 2011
 CEREDIGION VISITOR SURVEY 2011 TOTAL SAMPLE November 2011 TERMS OF CONTRACT Unless otherwise agreed, the findings of this study remain the copyright of Beaufort Research Ltd and may not be quoted, published
CORNWALL VISITOR SURVEY 06/07. Final report. Produced by South West Tourism Research Department For and on behalf of Visit Cornwall.
 CORNWALL VISITOR SURVEY 06/07 Final report Produced by South West Tourism Research Department For and on behalf of Visit Cornwall September 2007 Contents Slide Executive summary 3 Chapter 1: Introduction
Introduction...1. Methodology...2. Questionnaire design...2. Method...2. Sample size...3. Data analysis...3. Limitations...3. Key findings...
 Visitor Survey Report 2013 Contents 1. 2. 2.1 2.2 2.3 2.4 2.5 3. 3.1 3.2 3.3 3.4 3.5 3.6 3.7 4. 5. 5.1 5.2 Introduction...1 Methodology...2 Questionnaire design...2 Method...2 Sample size...3 Data analysis...3
SCOTLAND S PEOPLE AND NATURE SURVEY 2013/14 SPECIAL INTEREST REPORT NO.1 PARTICIPATION IN OUTDOOR RECREATION
 SCOTLAND S PEOPLE AND NATURE SURVEY 013/14 SPECIAL INTEREST REPORT NO.1 PARTICIPATION IN OUTDOOR RECREATION 1. Background This summary report on participation in outdoor recreation is one of a series describing
ISLANDS VISITOR SURVEY
 ISLANDS VISITOR SURVEY 2012-2013 Summary of Results Overview The Islands Visitor Survey 2012-2013 was conducted by Scotinform Limited and Reference Economics for the islands of the Outer Hebrides, Orkney
Dover Town Visitor Survey Report of findings
 Dover Town Visitor Survey Report of findings February 2018 Dover Visitor Survey - Report of Findings Introduction Contents: Introduction. Page 3 Executive Summary. Page 5 Visitor Profile. Page 9 Trip Characteristics.
CORNWALL VISITOR FREQUENCY SURVEY
 CORNWALL VISITOR FREQUENCY SURVEY Analysis and Report from PFA Research Ltd 2 nd December 2015 Authors: Robert Rush, Managing Director robert.rush@pfa-research.com Emma Lydon, Research & Marketing Consultant
REPORT. VisitEngland Business Confidence Monitor Wave 5 Autumn
 REPORT VisitEngland Business Confidence Monitor 2011 5-7 Museum Place Cardiff, Wales CF10 3BD Tel: ++44 (0)29 2030 3100 Fax: ++44 (0)29 2023 6556 www.strategic-marketing.co.uk Page 2 of 31 Contents Page
SHIPSTON-ON-STOUR VISITOR SURVEY 2012 FINAL REPORT
 SHIPSTON-ON-STOUR VISITOR SURVEY FINAL REPORT Produced by: Stratford-on-Avon District Council Consultation Unit December CONTENTS Page 1. Introduction 1.1 Background 1 1.2 Sample/Methodology 1 1.3 Statistical
Community Rail Partnership Action Plan The Bishop Line Survey of Rail Users and Non-Users August 2011 Report of Findings
 Community Rail Partnership Action Plan The Bishop Line Survey of Rail Users and Non-Users August 2011 Report of Findings Analysis and report NWA Social Research 1 Contents Page No. A. Summary of Main Findings...
Lord Howe Island Visitor Survey 2017
 INTRODUCTION Lord Howe Island Visitor Survey 2017 Lord Howe Island is one of Australia s premier holiday destinations, part of a World Heritage-listed island group that is known for its outstanding natural
Royal Parks Stakeholder Research Programme 2014
 1 Royal Parks Stakeholder Research Programme 2014 Park profile: Greenwich Park (Waves 1-3) January 2015 Technical note 2 This slide deck presents findings from three waves of survey research conducted
National Rail Passenger Survey Autumn 2013 Main Report
 National Rail Passenger Survey Autumn 2013 Main Report What is Passenger Focus? Passenger Focus is the independent consumer watchdog for Britain s rail passengers and England s bus, coach and tram passengers
2013 Business & Legislative Session Visitor Satisfaction Survey Results
 2013 Business & Legislative Session Visitor Satisfaction Survey Results Completed by Juneau Economic Development Council in partnership with The Alaska Committee August 2013 JEDC research efforts are supported
National Passenger Survey Spring putting rail passengers first
 National Passenger Survey Spring 2006 putting rail passengers first What is Passenger Focus? Passenger Focus is the independent national rail consumer watchdog. Our mission is to get the best deal for
The Economic Impact of Tourism Brighton & Hove Prepared by: Tourism South East Research Unit 40 Chamberlayne Road Eastleigh Hampshire SO50 5JH
 The Economic Impact of Tourism Brighton & Hove 2013 Prepared by: Tourism South East Research Unit 40 Chamberlayne Road Eastleigh Hampshire SO50 5JH CONTENTS 1. Summary of Results 1 1.1 Introduction 1 1.2
Angus Visitor Survey. Findings from July 2016 to June tourism consumer insights. tourir
 Angus Visitor Survey Findings from July 2016 to June 2017 tourir Contents 1. Background 2. Methodology 3. Visitor Profile 4. Visit Planning 5. Visit Characteristics 6. Visit Activities 7. Visit Satisfaction
Isles of Scilly Visitor Survey Final report. Produced for and on behalf of the Islands Partnership. May 2017
 Isles of Scilly Visitor Survey 2016 Final report Produced for and on behalf of the Islands Partnership by The South West Research Company Ltd. May 2017 Contents Page Summary 3 6 Introduction 7 10 Visitor
SURVEY OF U3A MEMBERS (PART 1)
") SURVEY OF U3A MEMBERS (PART 1) Introduction To provide a satisfactory service to its member U3As, The Third Age Trust recognised that it needs to be aware of the diversity of individual U3A members and
SURVEY OF U3A MEMBERS (PART 1) Introduction To provide a satisfactory service to its member U3As, The Third Age Trust recognised that it needs to be aware of the diversity of individual U3A members and
Domestic Tourism to South West Wales in 2006, 2007 and 2008 Factsheet
 Domestic Tourism to South West Wales in 2006, 2007 and 2008 Factsheet Introduction Published June 2009 This factsheet provides summary tables of key tourism figures to South West Wales in 2006, 2007 and
Byron Shire Visitor Profile and Satisfaction Report: Summary and Discussion of Results
 Byron Shire Visitor Profile and Satisfaction Report: Summary and Discussion of Results Introduction The Byron Shire Visitor Profile and Satisfaction (VPS) project was completed as part of the Destination
Irish Fair of Minnesota: 2017 Attendee Profile
 TOURISM CENTER Irish Fair of Minnesota: 2017 Attendee Profile Authored by Xinyi Qian, Ph.D. Irish Fair of Minnesota: 2017 Attendee Profile November 13, 2017 Authored by Xinyi (Lisa) Qian, Ph.D., University
Civil Aviation Authority:
 Civil Aviation Authority: UK Aviation Consumer Survey August 2018 CONTENTS Background and method Headline measures Flying behaviour Recent experience Travel disruption Disability Key driver analysis Public
Activities in Britain s nations and regions
 Activities in Britain s nations and regions Foresight issue 165 VisitBritain Research January 2019 1 Contents Please note: underlined text can be used to navigate through this document Introduction UK
The Economic Impact of Tourism on Scarborough District 2014
 The Economic Impact of Tourism on Scarborough District 2014 Prepared by: Tourism South East Research Unit 40 Chamberlayne Road Eastleigh Hampshire SO50 5JH CONTENTS 1. Summary of Results 1 2. Table of
National Passenger Survey Spring putting rail passengers first
 National Passenger Survey putting rail passengers first What is Passenger Focus? Passenger Focus is the independent national rail consumer watchdog. Our mission is to get the best deal for Britain s rail
TABLE OF CONTENTS. TOURIST EXPENDITURE 31 Average Spend per Person per Night ( ) 31 Tourist Expenditure per Annum ( ) 32
 31 Tourist Expenditure per Annum ( ) 32") FALKLAND ISLANDS International Tourism Statistics Report 2013 2 3 4 TABLE OF CONTENTS PAGE INTRODUCTION 6 KEY FACTS AND FIGURES 7 INBOUND TOURISM (OVERNIGHT VISITORS) 8 TOURIST ARRIVALS 8 Tourist Arrivals
FALKLAND ISLANDS International Tourism Statistics Report 2013 2 3 4 TABLE OF CONTENTS PAGE INTRODUCTION 6 KEY FACTS AND FIGURES 7 INBOUND TOURISM (OVERNIGHT VISITORS) 8 TOURIST ARRIVALS 8 Tourist Arrivals
The Economic Impact of Tourism on Calderdale Prepared by: Tourism South East Research Unit 40 Chamberlayne Road Eastleigh Hampshire SO50 5JH
 The Economic Impact of Tourism on Calderdale 2015 Prepared by: Tourism South East Research Unit 40 Chamberlayne Road Eastleigh Hampshire SO50 5JH CONTENTS 1. Summary of Results 1 2. Table of Results Table
Juneau Household Waterfront Opinion Survey
 Juneau Household Waterfront Opinion Survey Prepared for: City and Borough of Juneau Prepared by: April 13, 2004 TABLE OF CONTENTS Executive Summary...1 Introduction and Methodology...6 Survey Results...7
National Passenger Survey Autumn putting rail passengers first
 National Passenger Survey Autumn 2005 putting rail passengers first What is Passenger Focus? Passenger Focus is the independent national rail consumer watchdog. Our mission is to get the best deal for
Tourism Business Monitor Visitor Attractions Report. Wave 2 Post-Easter holidays
 Tourism Business Monitor 20 Visitor Attractions Report Wave 2 Post-Easter holidays Background, objectives and research method Tourism Business Monitor designed to measure, monitor and understand tourism
National Passenger Survey Autumn putting rail passengers first
 National Passenger Survey Autumn putting rail passengers first What is Passenger Focus? Passenger Focus is the independent national rail consumer watchdog. Our mission is to get the best deal for Britain
Survey into foreign visitors to Tallinn Target market: Cruise voyagers. TNS Emor March 2012
 Survey into foreign visitors to Tallinn 2008 2011 Target market: Cruise voyagers TNS Emor March 2012 Table of contents 1 Introduction 3 2 Planning a trip to Tallinn 9 3 Visiting Tallinn and impressions
ISLANDS VISITOR SURVEY
 ISLANDS VISITOR SURVEY 2012-2013 Summary of Results Overview The Islands Visitor Survey 2012-2013 was conducted by Scotinform Limited and Reference Economics for the islands of Shetland, Orkney and the
NEWCASTLE VISITOR PROFILE AND SATISFACTION REPORT. Summary of results OCTOBER Image: Newcastle Marina, courtesy of Newcastle Tourism
 NEWCASTLE VISITOR PROFILE AND SATISFACTION REPORT Summary of results OCTOBER 2013 Image: Newcastle Marina, courtesy of Newcastle Tourism 3 NEWCASTLE VISITOR PROFILE AND SATISFACTION REPORT: SUMMARY OF
Heritage Line Community Rail Partnership Darlington to Bishop Auckland Railway Line Survey of Users and Non-Users January to March 2010
 Heritage Line Community Rail Partnership Darlington to Bishop Auckland Railway Line Survey of Users and Non-Users January to March 2010 Analysis and report NWA Social Research 1 Contents Page No. A. Summary
The Economic Impact of Tourism on the District of Thanet 2011
 The Economic Impact of Tourism on the District of Thanet 2011 Prepared by: Tourism South East Research Unit 40 Chamberlayne Road Eastleigh Hampshire SO50 5JH CONTENTS 1. Summary of Results 1 2. Table of
East Dunbartonshire Area Profile
 East Dunbartonshire Area Profile May 2014 Contents Executive Summary.. page 3 Introduction.. page 6 Population page 7 Age Structure. page 9 Population Projections page 11 Life Expectancy page 12 Ethnicity.
2006 RENO-SPARKS VISITOR PROFILE STUDY
 2006 RENO-SPARKS VISITOR PROFILE STUDY PREPARED FOR RENO-SPARKS CONVENTION & VISITOR AUTHORITY Study Conducted and Reported by 475 Hill Street, Suite 2 Reno, Nevada 89501 (775) 323-7677 www.infosearchintl.com
Isles of Scilly Online Visitor Survey Final report. Produced for and on behalf of the Islands Partnership. May 2016
 Isles of Scilly Online Visitor Survey 2015 Final report Produced for and on behalf of the Islands Partnership by The South West Research Company Ltd. May 2016 Contents Page Summary 3 Introduction 7 Visitor
2013 Travel Survey. for the States of Guernsey Commerce & Employment Department RESEARCH REPORT ON Q1 2013
 213 Travel Survey for the States of Guernsey Commerce & Employment Department RESEARCH REPORT ON Q1 213 May 21st 213 Table of Contents Page No. Summary of Results 1 Survey Results 2 Breakdown of departing
Taking Part 2015/16: WEST MIDLANDS
 Taking Part 2015/16: WEST MIDLANDS 1 This report provides an overview of the arts and cultural engagement of adults living in the West Midlands. Data is taken from the Taking Part Survey 2015/16 and makes
East Dunbartonshire Area Profile
 East Dunbartonshire Area Profile May 2015 Contents Executive Summary.. page 3 Introduction.. page 6 Population page 7 Age Structure. page 9 Population Estimates..page 11 Population Projections page 13
Cairngorms National Park Visitor Survey 2009/2010 Summary
 Cairngorms National Park Visitor Survey 2009/2010 Summary Published by Cairngorms National Park Authority Cairngorms National Park Visitor Survey 2009/2010 Summary Please contact the Cairngorms National
REPORT. VisitEngland 2010 Business Confidence Monitor. Wave 1 New Year
 REPORT VisitEngland Wave 1 New Year 5-7 Museum Place Cardiff, Wales CF10 3BD Tel: ++44 (0)29 2030 3100 Fax: ++44 (0)29 2023 6556 www.strategic-marketing.co.uk Contents Page 1. Headline Findings... 3 2.
1987 SUMMER USE SURVEY OF MINNESOTA STATE PARK VISITORS
 This document is made available electronically by the Minnesota Legislative Reference Library as part of an ongoing digital archiving project. http://www.leg.state.mn.us/lrl/lrl.asp (Funding for document
National Rail Passenger Survey Autumn 2015 Main Report
 National Rail Passenger Survey Autumn 2015 Main Report Transport Focus is the independent transport user watchdog Our mission is to get the best deal for passengers and road users. With a strong emphasis
The Millennial Traveller 2018
 The Millennial Traveller 2018 Counter Intelligence Retail Counter Intelligence Retail is the travel retail industry s leading agency, with services covering areas including research, category development
The Role of Online in Travel Purchases. Hungary
 The Role of Online in Travel Purchases Hungary Methodology Vertical Deep Dive Travel Hungary Target group: Internet user in Hungary, 18 years and older Sample: n=1,000 Internet users Methodology: Online
Holiday Habits Report. ABTA Consumer Survey 2015
 Holiday Habits Report ABTA Consumer Survey 2015 Number of holidays taken Our research findings suggest that growth in the number of holidays is being driven by more affluent consumers. Overall 77% of Britons
The Economic Impact of Tourism New Forest Prepared by: Tourism South East Research Unit 40 Chamberlayne Road Eastleigh Hampshire SO50 5JH
 The Economic Impact of Tourism New Forest 2008 Prepared by: Tourism South East Research Unit 40 Chamberlayne Road Eastleigh Hampshire SO50 5JH CONTENTS Glossary of terms 1 1. Summary of Results 4 2. Table
The Economic Impact of Tourism on Oxfordshire Estimates for 2013
 The Economic Impact of Tourism on Oxfordshire Estimates for 2013 County and District Results September 2014 Prepared by: Tourism South East Research Unit 40 Chamberlayne Road Eastleigh Hampshire SO50 5JH
Events Tasmania Research Program Hobart Baroque Festival
 Events Tasmania Research Program Hobart Baroque Festival Research Report 2014 Prepared by This report has been prepared by Enterprise Marketing and Research Services Pty. Ltd. 60 Main Road, Moonah, 7009
2015 Travel Survey. for the States of Guernsey Commerce & Employment Department RESEARCH REPORT ON Q1 2015
 215 Travel Survey for the States of Guernsey Commerce & Employment Department RESEARCH REPORT ON Q1 215 April 28 th 215 Table of Contents Page No. Summary of Results 1 Survey Results 2 Breakdown of departing
YORKSHIRE DALES NATIONAL PARK AUTHORITY ITEM 10 CHARGING FOR THE USE OF AUTHORITY OWNED PUBLIC TOILETS
 YORKSHIRE DALES NATIONAL PARK AUTHORITY ITEM 10 Date: 31 March 2015 Report: CHARGING FOR THE USE OF AUTHORITY OWNED PUBLIC TOILETS Purpose of the report 1. To seek Members approval to trial for two years,
Intelligence enquiries relating to the study should be directed to Joanne Cuff, Tourism Analyst at
 Contact Details & Republication Notification The Greater Manchester Leisure Visitor Survey 2014 was commissioned by Marketing Manchester with financial support from partners; Transport for Greater Manchester,
Bringing clarity, delivering breakthroughs. Transport Focus Surface Access to Airports - Research Report August 2018
 Bringing clarity, delivering breakthroughs Transport Focus Surface Access to Airports - Research Report August 2018 Introduction and methodology Most recent flight Booking transport to the airport Travelling
NAPA VALLEY VISITOR INDUSTRY 2014 Economic Impact Report
 NAPA VALLEY VISITOR INDUSTRY 2014 Economic Impact Report Research prepared for Visit Napa Valley by Destination Analysts, Inc. Table of Contents SECTION 1 Introduction 2 SECTION 2 Executive Summary 5 SECTION
Cornwall Visitor Survey 2010
 Cornwall Visitor Survey Report Produced for and on behalf of VisitCornwall by The South West Research Company March 2011 The South West Research Company Contents Slide Summary 3 Introduction 15 Visitor
Cruise tourism in Akaroa: Visitor experiences, business stakeholder perceptions, and community attitudes Michael Shone & Jude Wilson 31 July 2013
 Cruise tourism in Akaroa: Visitor experiences, business stakeholder perceptions, and community attitudes Michael Shone & Jude Wilson 31 July 2013 Part A: Cruise ship visitor experiences and expenditure,
Tourism Kelowna Visitor Intercept Survey Findings by Season FINAL DRAFT REPORT
 Tourism Kelowna Visitor Intercept Survey Findings by Season FINAL DRAFT REPORT January 17, 2017 1 Table of Contents Executive Summary... 3 Methodology.. 7 Visitor Intercept Survey Findings.. 9 Visitor
Dorset Visitors Survey 2009
 Dorset Visitors Survey 2009 (March 2010) Prepared by: The Market Research Group, DG12a, Dorset House, Bournemouth University. a Executive Summary Visitor demographics The majority of visitors to Dorset
The Economic Impact of Tourism Brighton & Hove Prepared by: Tourism South East Research Unit 40 Chamberlayne Road Eastleigh Hampshire SO50 5JH
 The Economic Impact of Tourism Brighton & Hove 2014 Prepared by: Tourism South East Research Unit 40 Chamberlayne Road Eastleigh Hampshire SO50 5JH CONTENTS 1. Summary of Results 1 1.1 Introduction 1 1.2
Brighton Visitor Survey 2018
 Brighton Visitor Survey 2018 October 2018 Prepared by: TSE Research 40 Chamberlayne Road Eastleigh Hampshire SO50 5JH Registered in England No. 01345038 Registered office: 40 Chamberlayne Road Eastleigh
Domestic VFR travel to NSW
 Domestic VFR travel to NSW Year ended December 2015 INTRODUCTION The and (VFR) market is of considerable importance to Australia and NSW. It is the second largest purpose of visit segment, after the Holiday
Tourism Business Monitor Accommodation Report. Wave 5 Mid-September until the end of October
 Tourism Business Monitor Accommodation Report Wave 5 Mid-ember until the end of October Background, objectives and research method Tourism Business Monitor designed to measure, monitor and understand tourism
NAPA VALLEY VISITOR INDUSTRY 2012 Economic Impact Report
 Join Visit Napa Valley NAPA VALLEY VISITOR INDUSTRY 2012 Economic Impact Report Research prepared for Visit Napa Valley by Destination Analysts, Inc. Table of Contents SECTION 1 Introduction 2 SECTION
NAPA VALLEY VISITOR INDUSTRY 2016 Economic Impact Report
 NAPA VALLEY VISITOR INDUSTRY 2016 Economic Impact Report Research prepared for Visit Napa Valley by Destination Analysts, Inc. Table of Contents S E C T I O N 1 Introduction 2 S E C T I O N 2 Executive
Tourism Business Monitor Accommodation Report. Wave 2 Post-Easter holidays
 Tourism Business Monitor 2017 Accommodation Report Wave 2 Post-Easter holidays Contents Background Key Findings Business Dashboards Visitor Profile Business Performance Workforce Business Confidence 2
Chapter 1: The Population of NHS Greater Glasgow and Clyde
 Population Estimate (thousands) Chapter 1: The Population of NHS Greater Glasgow and Clyde Population Trends and Projections National Records of Scotland estimated (NRS SAPE) 1 the 2013 NHS Greater Glasgow
Tourism Business Monitor Visitor Attractions Report. Wave 2 Easter up until the end of May
 Tourism Business Monitor 20 Visitor Attractions Report Wave 2 Easter up until the end of May Background, objectives and research method Tourism Business Monitor designed to measure, monitor and understand
National Passenger Survey TOC Report for Chiltern Railways Autumn 2011
 National Passenger Survey TOC Report for Contacts: David Greeno Passenger Focus 1 Drummond Gate London, SW1V QY Tel: 13 837 Email: david.greeno@passengerfocus.org.uk David Chilvers BDRC Continental Kingsbourne
The following slides collate the insights relating to transport only.
 1 2 The following slides collate the insights relating to transport only. To see the full results and to put this extract into context please click on this link: Scotland Visitor Survey Objectives 3 Methodology:
National Rail Passenger Survey Main Report Spring 2018
 National Rail Passenger Survey Main Report Spring 2018 Transport Focus is the independent transport user watchdog Our mission is to get the best deal for passengers and road users. With a strong emphasis
National Station Improvement Programme. Uckfield Station Final report
 National Station Improvement Programme Uckfield Station Final report January 2010 National Station Improvement Plan Uckfield Station Summary Report Passenger Focus April 2009 Prepared by:... Approved by:...
Papua New Guinea International Visitor Survey. January December 2017 Simon Milne
 Papua New Guinea International Visitor Survey January December 2017 Simon Milne Summary of the Key Findings Total Direct Economic Impact for Jan-Dec 2017 Figures exclude employment and cruise visitors
Rail passengers priorities for improvement November 2017
 Rail passengers priorities for improvement November 2017 Rail passengers priorities for improvement November 2017 Foreword We asked more than 12,800 passengers across the country to rank 31 possible improvements
FALKLAND ISLANDS International Tourism Statistics Report 2012
 FALKLAND ISLANDS International Tourism Statistics Report 2012 2 Falkland Islands Tourism 2012 Land-Based Tourism Number of tourist arrivals All tourists: Leisure tourists: 7,791 17% compared to 2011 1,937
National Station Improvement Programme. Halifax Station - Final report
 National Station Improvement Programme Halifax Station - Final report January 2010 National Station Improvement Plan Halifax Station Summary Report Passenger Focus April 2009 Prepared by:... Approved by:...
The UK Tourist. Statistics 2005
 The Tourist Statistics 2005 Tourist 2005 Tourism Volumes and Values in 2005 Tourism by residents of the United Kingdom in 2005: this report presents the principal findings of the United Kingdom Tourism
London and Domestic Tourism
 London and Domestic Tourism London London has a population of 8.5 million, representing 16% of the total England population. Value to Domestic Tourism in England In 2015, there were 12.9 million domestic
The Visitor Experience in Britain
 The Visitor Experience in Britain Welcome, Expectations, Satisfaction & Recommendation Foresight issue 154 VisitBritain Research 1 Contents 1. Introduction 2. Summary 3. Britain s Welcome (CAA Passenger
Guernsey Travel Survey
 Guernsey Travel Survey Quarter 2 218 Issue date July 218 The Guernsey Travel Survey shows the number of air and sea passengers, broken down by type, purpose and origin, based upon exit surveys undertaken
Tourism Business Monitor Accommodation Report. Wave 3 Post-Easter until mid-july
 Tourism Business Monitor 20 Accommodation Report Wave 3 Post-Easter until mid-july Background, objectives and research method Tourism Business Monitor designed to measure, monitor and understand tourism
Tourism Kelowna Visitor Intercept Survey Findings FINAL DRAFT REPORT
 Tourism Kelowna Visitor Intercept Survey Findings FINAL DRAFT REPORT January 17, 2017 1 Table of Contents Executive Summary... 3 Methodology.. 7 Visitor Intercept Survey Findings.. 9 Visitor Profile. 9
Brighton Visitor Survey 2016
 Report of Findings for VisitBrighton Brighton Visitor Survey 2016 November 2016 Prepared by: TSE Research 40 Chamberlayne Road Eastleigh Hampshire SO50 5JH Registered in England No. 01345038 Registered
Tram Passenger Survey (TPS) All networks
 All networks") Tram Passenger Survey (TPS) All networks Rosie Giles Tel: Email: Rosie.Giles@transportfocus.org.uk results March Insight Team, Transport Focus, Fleetbank House, - Salisbury Square, London, ECY JX Contents
Tram Passenger Survey (TPS) All networks Rosie Giles Tel: Email: Rosie.Giles@transportfocus.org.uk results March Insight Team, Transport Focus, Fleetbank House, - Salisbury Square, London, ECY JX Contents
Produced by: Destination Research Sergi Jarques, Director
 Produced by: Destination Research Sergi Jarques, Director Economic Impact of Tourism Epping Forest - 2014 Economic Impact of Tourism Headline Figures Epping Forest - 2014 Total number of trips (day & staying)
Timetable Change Research. Re-contact survey key findings
 Timetable Change Research Re-contact survey key findings Key project objectives Measure the impact of the timetable changes on customers, what actions have they taken as a result Gauge how have the timetable
Recreationists on the Gifford Pinchot National Forest: A Survey of User Characteristics, Behaviors, and Attitudes
 Recreationists on the Gifford Pinchot National Forest: A Survey of User Characteristics, Behaviors, and Attitudes by Alan R. Graefe The Pennsylvania State University Robert C. Burns University of Florida
Produced by: Destination Research Sergi Jarques, Director
 Produced by: Destination Research Sergi Jarques, Director Economic Impact of Tourism Oxfordshire - 2015 Economic Impact of Tourism Headline Figures Oxfordshire - 2015 Total number of trips (day & staying)
Bus Passenger Survey
 March 2012 Contents 1 Foreword 3 2 Key findings 4 3 Results by area Merseyside PTE (Merseytravel) South Yorkshire PTE Transport for Greater Manchester (TfGM) West Yorkshire PTE (Metro) Tyne & Wear PTE
Visitor Attraction Trends in England Full Report
 Visitor Attraction Trends in England 2016 Full Report Contents Acknowledgement & Introduction Sample Headlines Weather Summary Visitor admission trends Category, Region, Charge, Geographic location, Size,
Booking a holiday. Foresight issue 151. VisitBritain Research
 Booking a holiday Foresight issue 151 VisitBritain Research 1 Contents 1. Introduction 2. Summary 3. How are travel and accommodation booked? 1. Booked separately or together 2. Booked direct with provider
Produced by: Destination Research Sergi Jarques, Director
 Produced by: Destination Research Sergi Jarques, Director Economic Impact of Tourism North Norfolk District - 2016 Contents Page Summary Results 2 Contextual analysis 4 Volume of Tourism 7 Staying Visitors
Produced by: Destination Research Sergi Jarques, Director
 Produced by: Destination Research Sergi Jarques, Director Economic Impact of Tourism Norfolk - 2016 Contents Page Summary Results 2 Contextual analysis 4 Volume of Tourism 7 Staying Visitors - Accommodation
Over 5,000 consumers in GB England, Wales and Scotland
 GB Market Insight Research Methodology Key Findings Visitors by Demographics Travel Preferences Experience of Belfast Customer Segments Perceptions of Belfast CONTENTS Market Potential Summary Key Takeaways