Parks and Protected Areas. How are we Doing? A Survey of Campers to Alberta s Parks and Protected Areas Provincial Summary
|
|
|
- Julian Edwards
- 5 years ago
- Views:
Transcription
1 Parks and Protected Areas How are we Doing? 2004 A Survey of Campers to Alberta s Parks and Protected Areas Provincial Summary
2 Prepared by: Alberta Parks and Protected Areas Division Policy and Program Coordination Branch April 2004
3 Table of Contents: About this Survey:... 1 Supplemental Questions:... 1 In-Season Changes: Results:...3 Satisfaction Measures:... 4 Summary of Camper Satisfaction:... 5 Areas of High Satisfaction:... 6 Areas for Improvement:... 8 Areas of Concern:... 8 Additional Comments Analysis:... 9 Performance Measure: Performance Analysis: Camper Profiles: Party Size: Origin: Repeat Visitation: Length of Stay: Camping Equipment: Activity Participation: Appendix 1. Satisfaction Score Results Detailed Summary Appendix Survey Distribution / Collection Quotas Appendix 3. Questionnaire Appendix 4. Comment Analysis Summary Appendix 5. Traffic Light Summary by Survey Locations... 44
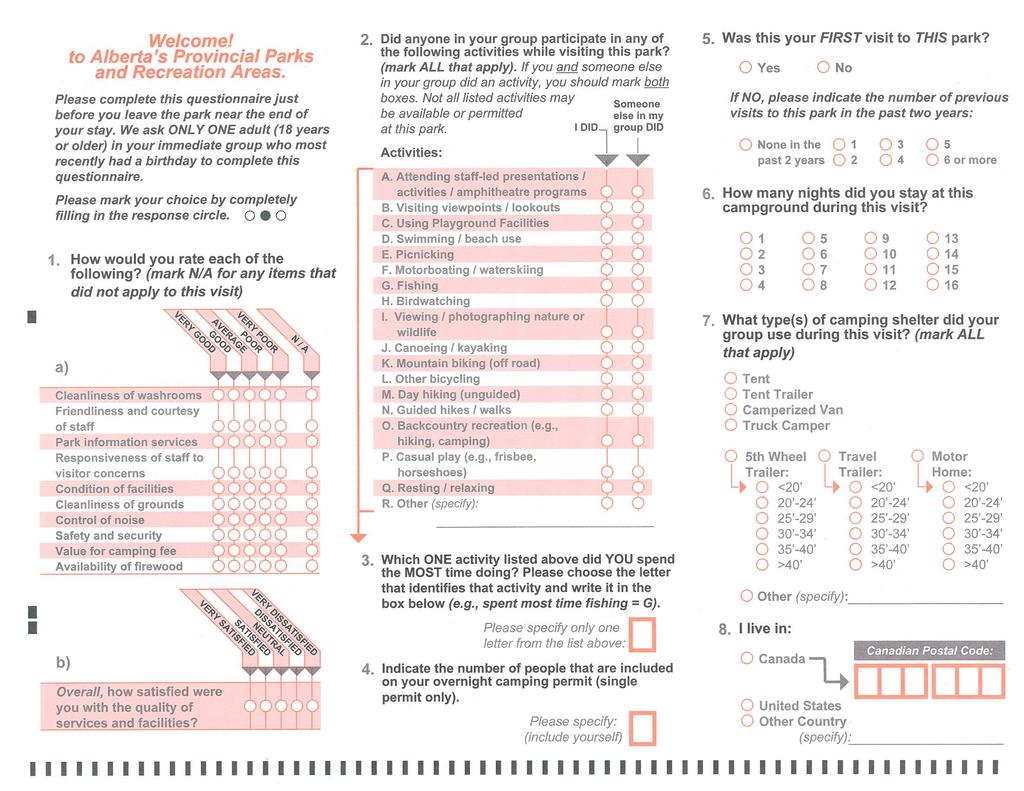
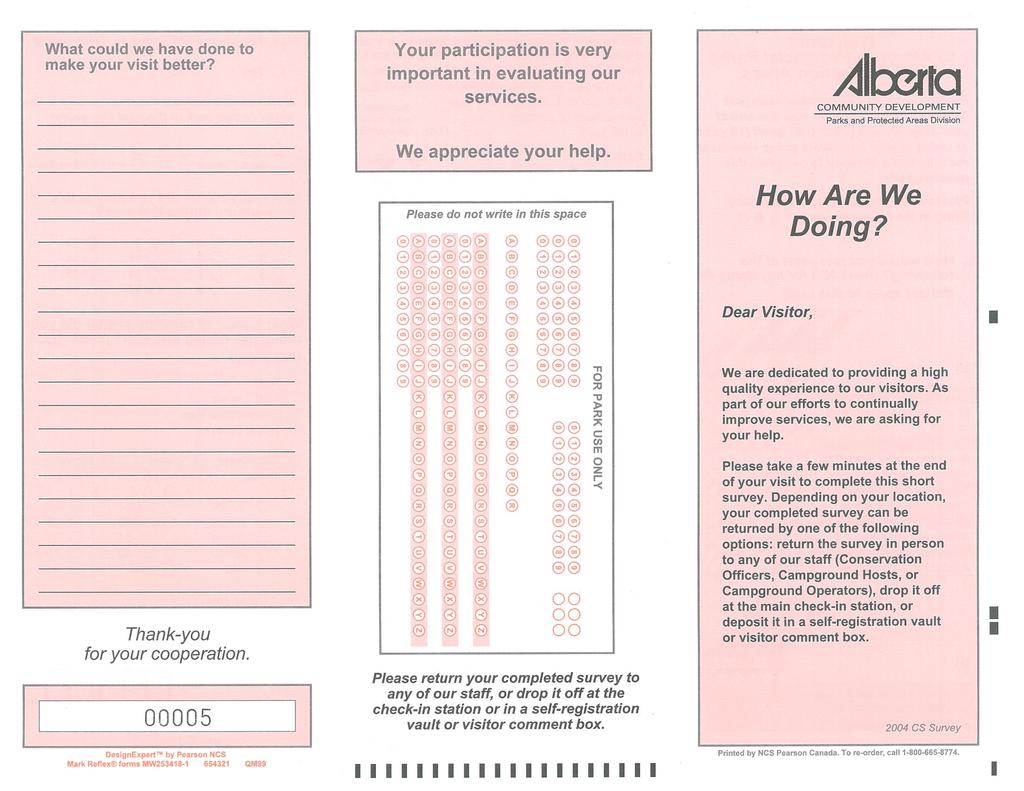
4 About this Survey: Initiated in 2002, the Camper Satisfaction (CS) Survey program includes a representative cross-section of 106 provincial parks or recreation area campgrounds according to size (visitation) and geography. Only campgrounds where visitation is greater than 1,050 occupied campsite nights (OCN s) were initially included in the program. Alberta Parks and Protected Areas Division surveys campers at approximately 35 campgrounds per year on a 3-year rotational cycle. Each campground included in the program will be surveyed at least once every 3-year cycle. The objectives of the 2004 CS Survey were to: establish a performance target for 2005 and to allow for long-term monitoring; determine the level of satisfaction with services, facilities and overall satisfaction on a site specific and province-wide basis; and collect ongoing demographic and visit information about campers to identify trends. Respondents for the 2004 CS Survey were randomly selected from the target population of all campers to auto-accessible campgrounds in Alberta s provincial parks and recreation areas using a sampling frame defined as: all campers (over the age of 18) who visit any one of the 36 pre-selected survey locations from May 25 to September 6, Sample sizes were calculated to provide statistically valid results on a site-by-site basis with a 7% margin of error at a 95% confidence interval. The reliability of site-specific results is a direct function of the total number of valid surveys returned at each site. (See Appendix 2. for sample targets and final response). Supplemental Questions: Every year, supplemental questions (i.e., those questions that are not part of the core question regarding satisfaction with campground services and facilities) are included in the survey and change from year to year. In 2002 a question regarding type of campsite preference was included. In 2003 this question was dropped and two additional questions were added to the survey to obtain data regarding party size (defined as the number of individuals included on a single overnight camping permit) and camper s opinions regarding the quality of various campsite features. In 2004 the question regarding party size was kept, while the campsite features question was dropped. Two new questions regarding activity participation were added. The first question asked what activities anyone in their group participated in while visiting the park (e.g., fishing, day hiking, resting/relaxing etc.). The second question asked which activity respondents spent the most time doing. 1
5 In-Season Changes: Although 36 campgrounds were initially identified for sampling in the 2004 season, not all sites and/or surveys are included in the provincial summary analysis or any further reporting of the results for at least one of the following reasons: Two sites did not participate in survey sampling program due to nonparticipation (non-compliance with the program). Two sites did not achieve an adequate sample size/return. Statistically, a minimum sample size of 30 is required to provide reliable analysis on an individual site basis. As such, it was decided that sites with a sample size of less than 30 should not be included in the provincial summary or any further analysis due to the potential bias from poor or inadequate sampling/distribution methods and results. Results from the following 4 campgrounds (Table 1) were removed entirely from the provincial summary and any further analysis for the reasons identified. A total of 3,289 surveys were returned province-wide, of which 25 from these sites were excluded from further analysis. Table 1: Survey Locations Excluded from Provincial Analysis Campground: Sample Size # Surveys excluded: Reason excluded from analysis: Dutch Creek PRA inadequate sample size Oldman River PRA inadequate sample size Police Outpost PP 0 n/a non-participation (non-compliance with the program) Crane Lake East PRA 0 n/a non-participation (non-compliance with the program) Total Survey - ALL sites 3, Total Survey - Revised sites 3,264 n/a Included in Provincial Analysis 2
6 2004 Results: This report provides provincial summary results from the 2004 CS Survey based on surveys collected at 32 campgrounds throughout Alberta * (Table 2). A total of 3,289 surveys were returned province-wide, of which 3,264 are included in this analysis (see Table 1 for an explanation of exclusions). The 2004 provincial summary results have a 1.6% margin of error at the 95% confidence level. For the purposes of the CS Survey, satisfaction was measured using 10 individual attributes related to services and facilities (see Summary of Camper Satisfaction, page 5) and a single overall satisfaction attribute. The attributes were chosen based on a comparison of key issues identified from previous surveys and a review of attributes used by other selected park agencies to measure visitor satisfaction. A detailed account of the sampling rationale, design and methodology is described in the 2004 Visitor Satisfaction Survey Planning Report. 1 Individual reports detailing the specific survey results for each campground with an adequate sample size (i.e., >95) will also be released subsequent to the provincial summary. Table 2: 2004 Survey Locations included in Provincial Summary* Provincial Parks: # Surveys Returned Aspen Beach - Lakeview 76 Bow Valley (KC) 37 Cold Lake 63 Crimson Lake - Twin Lakes 68 Cypress Hills - Ferguson Hill 199 Dinosaur 114 Lesser Slave Lake - Martin River 153 Park Lake 114 Peter Lougheed - Boulton (KC) 176 Peter Lougheed - Elkwood (KC) 273 Peter Lougheed - Mount Sarrail (KC) 73 Pigeon Lake - Zeiner 334 Queen Elizabeth 108 Sheep River Valley- Sandy McNabb (KC) 118 Sir Winston Churchill 83 Thunder Lake 59 Wabamun Lake 45 Whitney Lakes - Ross Lake 45 Willow Creek 54 Winagami Lake 71 Writing-On-Stone 82 Provincial Recreation Areas: Bow Valley - Bow River (KC) 30 Brazeau Reservoir - Reservoir 49 Elbow Falls - Beaver Flats (KC) 125 Elbow River - Paddys Flat (KC) 144 Highwood/Cataract Cataract (KC) 116 Kootenay Plains - Two O clock Creek 119 Lakeland - Touchwood Lake 89 Oldman Dam - Cottonwood 32 Racehorse 61 Sibbald - Sibbald Lake (KC) 45 Thompson Creek 109 Provincial Total 3,264 (KC) denotes Kananaskis Country locations. 1 Copies of this report are available upon request by contacting Roy Finzel at Alberta Parks and Protected Areas ( ). * 4 sites not included in this list were identified for inclusion in the 2004 CS Survey, but were excluded from the results due to nonparticipation and/or inadequate sample sizes (see Table 1). No further reporting of results from these sites will occur. 3
7 Satisfaction Measures: Campers were asked to rate 10 of the campground s services and facilities using a fivepoint Likert scale (see questionnaire in) where: 5=Very Good, 4=Good, 3=Average, 2=Poor, and 1=Very Poor. Scores calculated from these ratings are assumed to reflect satisfaction. Campers also rated their overall satisfaction with the quality of services and facilities at the campground using a five-point Likert scale where: 5=Very Satisfied, 4=Satisfied, 3=Neutral, 2=Dissatisfied, and 1=Very Dissatisfied. Scores calculated from these ratings directly reflect satisfaction. Satisfaction was then summarized using three interpretive measures: average score, top box, and low box. Average Score represents the mean score or average level of satisfaction with a given attribute. A threshold score of 4.0 or higher is described as satisfied, while a score less than 4.0 suggests the attribute may need attention. Top box (5=very good or 5=very satisfied) represents the proportion of respondents who are considered very satisfied (i.e., select a rating of 5) with a given attribute. It is assumed that a threshold of 40% or more of campers will choose the top box if we are doing a good job of satisfying our clients. Low box (1=very poor/dissatisfied or 2=poor/dissatisfied) represents the proportion of respondents who are considered dissatisfied (i.e., select ratings of 1 or 2) with a given attribute. Attributes for which a threshold of 10% or more of campers chooses the low box may need attention. Each attribute is then assigned a traffic light score based on the set thresholds of each satisfaction measure outlined above as follows: A green light indicates High Satisfaction (all 3 measures meet set thresholds) An amber light indicates Moderate Satisfaction (1 of 3 measures fail to meet thresholds) A red light indicates potentially Low Satisfaction (2 or 3 measures fail to meet thresholds) Traffic light scores (green, amber, red) are intended to provide an easily interpretable summary of satisfaction results and quickly highlight areas of potentially high, moderate and low satisfaction. 4
8 Summary of Camper Satisfaction: 2004 Park Services and Facilities 2003 R A G R A G Control of Noise 2 Cleanliness of Washrooms 3 Friendliness and Courtesy of Staff Availability of Firewood 1 Condition of Facilities Safety and Security Cleanliness of Grounds Value of Camping Fee 1 Responsiveness of Staff to Visitor Concerns 1 Park Information Services 1 Overall, how satisfied were you with the quality of services and facilities? Legend (G) High Satisfaction (all 3 measures meet set thresholds) (A) Moderate Satisfaction (1 of 3 measures fail to meet thresholds) (R) Potentially Low Satisfaction (2 or 3 measures fail to meet thresholds) 1 At least one of the three measures barely passed set thresholds 2 Two of the three measures barely passed set thresholds 3 Three of the three measures barely passed set thresholds A few patterns emerged from the satisfaction scores across the province: In the 2004 season, most campers were highly satisfied on average with the 10 services and facilities province-wide. Campers were least satisfied with the value for the camping fee, park information services, and availability of firewood, similar with results from A few services and facilities barely passed set thresholds as denoted in the table above (note that some traffic lights are followed by a 1, 2 or 3 indicating how many of the measures were barely above set thresholds). For instance, two measures for cleanliness of washrooms barely met set thresholds (denoted by the number 2 following the green traffic light), which may reveal that it is an area for improvement, rather than an area of high satisfaction as it appears on first glance. In addition, at least one of the measures for the Park Information Services barely passed thresholds, indicating that it too, may be an area for improvement rather than one of moderate satisfaction. As in 2003, campers were again highly satisfied with the Overall quality of services and facilities in Only 4 survey locations in 2004 received a red light score for the overall quality of services and facilities, although 6 locations received an amber light score indicating there is room for improvement. For a detailed summary of ratings and satisfaction measures / thresholds for the province, please see Appendix 1. 5
9 Areas of High Satisfaction: Responsiveness to Visitor Concerns 53% of campers were very satisfied with this attribute. However, it should be noted that over a third (36%) of all responses to this attribute indicated that it was not applicable. Although this attribute had a high level of satisfaction provincially, 7 campgrounds received a low level of satisfaction (red light) for this attribute. 2 Of the 84 comments regarding staff, only 8% were related to staff responsiveness. The lack of available staff (29%) and the need for additional staff (16%) were frequently mentioned staff-related concerns, and are likely related to responsiveness issues. 3 Cleanliness of Grounds Similar to results from 2002 and 2003, over half (59%) of all campers in 2004 were very satisfied with the cleanliness of grounds. Only 3 campgrounds received a red light for this attribute in comments (3% of all comments) were received concerning the cleanliness of grounds and campsites. Of the related comments, those regarding the beach or swimming are being dirty (25%), dirty campsites (23%), and the grounds being dirty (18%) were the most common. Control of Noise Over half (52%) of campers were very satisfied with this attribute and only 8 campgrounds did not receive a green light for controlling noise. Noise complaints only accounted for 3% of all negative comments received. Campers were most concerned with late-night noise levels (30% of all noise complaints), although barking dogs, loud music and generator noise were also frequently mentioned as irritants. Safety and Security Campers at campgrounds surveyed in 2004 generally rated their satisfaction with safety and security slightly higher than in Almost half (49%) of campers in 2004 were very satisfied with this attribute (compared to 46% in 2003), although a relatively high number of campgrounds received either an amber (4) or red (4) light for this attribute. Comments regarding safety and security accounted for 5% of all comments received. Of the 194 related comments, those regarding other enforcement/safety issues accounted for (41%) of comments of this category. ATV/Quad issues were the most frequent concern of the other enforcement/safety issues category; however motorised boating on lakes, regulation of quiet time, concern of random camping, and requests for increased rules regarding dogs on site were also frequent. The other comments for this attribute addressed the need for additional patrols (13%), enforcement issues including excessive vehicle speed in campgrounds (22%), and complaints about dogs off leash (16%). Friendliness and Courtesy of Staff Over two thirds (68%) of campers were very satisfied with this attribute and all but one campgrounds received a green light for this attribute. Campers in 2002, 2003 and 2004 consistently rated their satisfaction with friendliness and courtesy of staff the highest of all measured services and facilities. In 2004, 20% of comments related to staff concerned rude or unfriendly staff. However, only 2% of all comments were staff-related (n=84). It should be noted that this survey attribute did not distinguish between departmental staff and contractor staff. 2 Traffic light summaries for each survey are included in Appendix 5. 3 A summary of the comments analysis is included in Appendix 4. 6
10 Areas of High Satisfaction : continued Condition of Facilities Although 45% of all campers were very satisfied with the condition of facilities, 11 campgrounds received an amber light for this attribute and 6 campgrounds received a red light for this attribute. 11% of all negative comments received in the 2004 survey were related to the deteriorating condition of facilities. Comments of this nature were made on 26% of all the surveys received with negative comments. Campers are consistently concerned with the deteriorating condition of facilities as indicated by the number of comments received. In 2002 and 2003, the majority of negative comments received from campers were also related to the deteriorating facilities, similar to Of the 437 comments concerning the condition of facilities, the most common issues in 2004 were the deteriorating condition of campsite features (e.g., fire-pits, picnic tables, more gravel in sites needed), campground facilities (e.g., landscaping, boat launch, beaches, buildings, trails, playground) and roadways (potholes, dust). Specifically, comments from campers regarding the poor or deteriorating condition of the beach/swimming area (n=51), landscaping (n=45) and boat launches (n=38) were the most common within this category. Although this attribute achieved a green light, the proportion of negative comments related to deteriorating facilities indicates that this attribute warrants closer attention. Cleanliness of Washrooms Although washroom cleanliness received a green light provincially, two of the three measures were very close to failing set thresholds (pass level 2). Scarcely 40% of campers were very satisfied with this attribute, while 7% were considered dissatisfied. 14 (almost half) of the campgrounds received a red light for this attribute. Washrooms and showers are a key concern for many campers as indicated by the number of comments consistently received regarding these facilities in 2002, 2003, and now Almost one fifth (18%) of all negative comments received were related to washrooms and showers in general, making it the most common general category (n=715). 43% of all surveys received with negative comments contained complaints of this nature. However, complaints related to the cleanliness or odours of washrooms and showers (n=227) only accounted for 6% of all negative comments. If all washroom and shower-related comments are amalgamated, then the need for new or additional shower facilities (15%), poor cleanliness (18%) and offensive odours (14%) were the most common concerns. Other washroom-related concerns were generally focused on the need for additional upgrades (8%), the need for flush toilets and running water (8%), and for the need of supplies (toilet paper, soap, light bulbs etc.) (6%). Although this attribute achieved a green light, both the proportion of negative comments and percentage of dissatisfied respondents were high enough that this attribute warrants closer attention. 7
11 Areas for Improvement: Park Information Services Similar to results from 2002 and 2003, campers in 2004 indicated that they are only moderately satisfied with information services at surveyed campgrounds. Only 8 campgrounds received a green light for this attribute and only 34% of all campers were very satisfied with this attribute. Notably, 7% of campers were dissatisfied with information services. Interestingly, 14% of all responses to this attribute indicated that it was not applicable, potentially pointing to some confusion with park information services. Of the 231 relevant comments, the majority were concerned with inadequate signage within the campground (25%), a need for improved trail maps (16%), and a need for improved campground maps (11%). Although perhaps only indirectly related to this attribute, complaints regarding the campsite reservation system were also common (n=91). These included complaints about the need for a reservation system (28%), overbooking the campground (21%), and improper reservation use (14%). Availability of Firewood Consistent with results from 2002 and 2003, 48% of campers in 2004 were very satisfied with wood availability. However some campers were considered dissatisfied (10%). Of the 466 firewood-related comments, those regarding limited supply (11%), access to firewood (22%) and poor quality firewood (24%) were common. However, similar to 2002 and 2003, the majority of firewoodrelated comments concerned the cost of firewood (26%) indicating it should be free or less expensive. Although only 12% of all negative comments were firewood-related, they accounted for 28% of all surveys with negative comments. Areas of Concern: Value of Camping Fee Value for camping fees has consistently been an issue for campers in both 2002 and 2003, and now 2004 receiving the poorest scores of all attributes in all years. Only 11 campgrounds in 2004 received a green light for this attribute. In 2004, just over one-third (38%) of all campers were very satisfied with the value for camping fees. The average score for this attribute (3.9) was the lowest out of all attributes province-wide. A number of campers were dissatisfied (7%) with the value for camping fees. Although campers were dissatisfied with the value for camping, related comments only accounted for 3% of all comments received. Campers were primarily concerned with the high or increasing cost of camping (n=94). Charges for additional camping units on a single campsite (n=26) were also frequent concerns. 8
12 Additional Comments Analysis: Unsolicited comments supplied by campers in the completed surveys provide valuable insight into potential issues in Alberta s provincial parks and recreation areas. A single unsolicited comment is potentially more important than is apparent from the frequency of the comment. As such, it is important to highlight all of the issues that came out of camper s feedback and to understand that every comment is potentially important. In addition to the comments associated with services and facilities highlighted in the previous section, several additional types of comments were frequently mentioned in the completed surveys. The most common of these included requests for additional services/facilities, specifically installation of power campsites (n=123), installation of shower facilities (n=111), need for a concession/store (n=76), more playgrounds (n=63), additional/better campground signs (n=58), flush toilets/running water (n=54), sewage dump-station (n=54), and more potable water need (n=48). Comments regarding firewood were also mentioned, accounting for 12% of all comments. Specifically the cost of firewood, poor quality, and poor access were a concern to campers. A shelter or upgrade to the firewood shelter was also noted (n=28). Other comments regarding campsite preferences were also raised, accounting for 3% of all comments (n=106). The most common preferences noted in the surveys were for more larger/wider campsites, followed by sites with more privacy, shaded/wooded sites, additional campsites, more grass cover, and better tent pads in sites. There were also a number of comments regarding campground operations (n=135) such as requests for change in fee structures to include day-users or incorporate seasonal passes/fees, a request for discounts (e.g., seniors, weekdays), opposition to contracted operations, and the request for extended booth/store hours. Other less frequent comments included the need for trail signage and concern of trail deterioration (n=88), animal or insect complaints (n=76), inadequate beach size or poor lake water quality (n=63), and the need for more interpretive programs and activities (n=38). Specific comment summaries for each campground surveyed are outlined in the various site-specific reports. 9
13 Rank Order of Negative Comments General Category: n % of ALL comments % of ALL surveys represented Firewood % 28.0% Condition of Facilities: % 26.2% Hook-ups / Dump-stations / % 18.5% Water Washrooms: Other % 16.1% Campground Facilities % 15.7% Information Services % 13.9% Washrooms & Showers: % 13.6% Cleanliness Showers: Other % 13.2% Safety & Security % 11.7% Miscellaneous % 8.7% Campground Operations % 8.1% Noise Complaints % 7.4% Value for Camping % 7.3% Grounds & Campsite Cleanliness % 6.6% Campsite Preferences % 6.4% Playgrounds / Play Areas % 5.5% Reservation System % 5.5% Trails % 5.3% Staffing % 5.1% Animal / Insect Complaints % 4.6% Beach / Lake % 3.8% Interpretive Programs % 2.3% Fishing % 1.6% TOTAL NEGATIVE COMMENTS: 3, % 234.8% Note: Percent of all surveys represented add up to >100% as many respondents made comments that applied to more than one general category and/or more than one subcategory. For a detailed summary of comments, please see Appendix 4. 10
14 Performance Measure: As mentioned previously, one of the main objectives of this survey is to monitor visitor satisfaction, which will be used to gauge performance and set targets for the future. By asking visitors about their level of satisfaction on an annual basis using the same questions and procedures, measurable targets of performance can be established and compared year to year. These in turn can be used to improve on the quality of services and facilities being offered. In addition, visitor satisfaction provides valuable information that can contribute to program improvements. The performance target for visitor satisfaction was established in The target was set at 91% based on the average of 2003 and 2004 results. A stretch factor was not applied because three years of data were not available (see note below). Table 3: Performance Measure: Overall Satisfaction with Quality of Services and Facilities quality of services and facilities? Performance Measure: 2004 (n=3,136) Very Satisfied 52% Satisfied 39% 91% 2003 (n=3,006) Very Satisfied 46% Satisfied 44% 90% 2002 (n=5,336) Very Good (~ Very Satisfied ) Good (~ Satisfied ) 43% 44% 87% Note: Due to a modification of the Likert scale wording measuring camper satisfaction, the results from 2002 should not be compared to 2003 and results are provided for reference purposes only. In the 2004 season, 91% of the 3,136 respondents who rated their overall satisfaction with quality of services and facilities were either satisfied or very satisfied. Of those, 52% of respondents were considered very satisfied, while 39% were considered satisfied (Table 3). 11
15 Performance Analysis: If similar thresholds to those used by Parks Canada and in our topbox measure are used, we can expect that 91% of the campers at each park or recreation area will rate their overall experience as at least satisfied and assume that 45% of all campers surveyed will be very satisfied with their visit. (N.B. The thresholds used in this analysis are for internal comparison only). Applying these thresholds to each of the 10 measured attributes lends perspective to the overall measure and highlights problem areas that may not necessarily be apparent in the generalized traffic light summary results outlined previously. Table 4 highlights the number of survey locations in 2004 that either met or exceeded targets based on these thresholds. Table 4: Number of Survey Locations Meeting or Exceeding Targets in 2004 (n=32) Targets Cleanliness of Washrooms Friendliness and Courtesy of Staff Park Information Services Responsiveness of Staff to Visitor Concerns Condition of Facilities Cleanliness of Grounds Control of Noise Safety and Security Value for Camping Fee Availability of Firewood Overall Satisfaction 91% of campers satisfied or very satisfied % of campers very satisfied Although overall satisfaction was relatively high at several (66%) of the survey locations in 2004, fewer than half of the survey locations failed to meet or exceed the 91% satisfied or very satisfied target for 8 of the attributes: cleanliness of washrooms, park information services, responsiveness of staff to visitor concerns, condition of facilities, control of noise, safety and security, value for camping fee, and availability of firewood. Of these attributes cleanliness of washrooms received a green light provincially, but may be an area of concern or improvement at many of the survey locations. Two of the three attributes that did not receive green lights provincially, park information services and value for camping fee, had a low number (13% and 28% respectively) of the survey locations meet or exceed the 45% very satisfied target. However, availability of firewood had 53% of survey locations meet or exceed the 45% very satisfied target. Few survey locations were able to meet the 91% satisfied target for any of these three attributes. However, survey locations in 2004 were most likely to meet or exceed both the 91% and 45% satisfaction targets when campers were asked to rate their satisfaction with the friendliness and courtesy of staff, cleanliness of grounds, and safety and security. 12
16 Table 5: Percentage of Locations Meeting or Exceeding Targets for all Years Targets Cleanliness of Washrooms Friendliness and Courtesy of Staff Park Information Services Responsiveness of Staff to Visitor Concerns Condition of Facilities Cleanliness of Grounds Control of Noise Safety and Security Value for Camping Fee Availability of Firewood Overall Satisfaction 2004 (n=32) 2003 (n=29) 2002 (n=36) 91% of campers satisfied or very satisfied 45% of campers very satisfied 91% of campers satisfied or very satisfied 45% of campers very satisfied 91% of campers satisfied or very satisfied 45% of campers very satisfied 16% 72% 6% 38% 25% 59% 34% 38% 9% 9% 66% 31% 97% 13% 59% 37% 78% 72% 53% 28% 53% 59% 14% 66% 7% 41% 38% 55% 45% 45% 3% 21% 59% 48% 93% 31% 66% 55% 66% 69% 59% 24% 59% 59% 11% 53% 6% 25% 14% 44% 6% 17% 3% 25% 31% 22% 92% 11% 61% 36% 64% 25% 22% 17% 50% 44% Compared to 2003, fewer sites in 2004 met or exceeded the 91% satisfied or very satisfied target for park information services, responsiveness of staff to visitor concerns, condition of facilities, control of noise, safety and security, and availability of firewood in particular (Table 5). In fact, 8 attributes had fewer than half of the survey locations that met or exceeded the 91% satisfied target in Over half of the sites met or exceeded the 45% very satisfied target for 6 attributes in 2004 compared to 7 attributes in Two thirds of locations in 2004 met or exceeded the 91% target for overall satisfaction compared to only one third in
17 Camper Profiles: Party Size: The average party size (defined as the number of campers included on an overnight permit) for all sites surveyed in 2004 was 3 campers. In 2004, most camping parties were made up of either 2 (42%) or 4 campers (24%) on an overnight permit. Intriguingly, although the maximum number of people allowed on a permit (site) is 6, campers reported that their party size (the number of people included on one overnight permit) ranged from 1 camper to 12 campers per permit. Nonetheless, only 3% of campers reported party sizes greater than 6. Origin: Similar to previous results, 98% of all campers in 2004 are from Canada (United States=1% and Other Country =1%). The origin of Canadian campers in 2004 is virtually identical to 2003 and In 2004, 93% of Canadian campers are from Alberta, 3% are from British Columbia, 2% are from Saskatchewan, 1% are from Ontario and 1% are from the rest of Canada. The largest single centres of camping origin in the province were Calgary (32%) and Edmonton (13%), mirroring the two largest population centres of the province. The next largest centres of origin were Medicine Hat (4%), Lethbridge (4%), and Sherwood Park (3%). Together, these five cities accounted for 56% of all Alberta campers to surveyed campgrounds in Origin All Campers Origin Canadian Campers 2004 (n=3,222) 2003 (n=3,043) 2002 (n=5,369) 2004 (n=2,997) 2003 (n=2,869) 2002 (n=4,675) Canada 97.5% 96.6% 97.2% Alberta 92.9% 92.9% 93.1% United States 1.5% 2.3% 2.0% British Columbia 2.5% 3.1% 3.4% Other International 1.0% 1.1% 0.8% Saskatchewan 1.6% 2.0% 1.4% Ontario 1.5% 1.1% 1.1% Other Canada 1.5% 1.3% 1.0% 14
18 Repeat Visitation: 64% of all campers in 2004 had previously visited the campground at which they were surveyed. First time Visitor? 2004 (n=3,240) All Campers 2003 (n=3,073) 2002 (n=5,369) Yes 36% 37% 40% No (repeat) 64% 63% 60% Just over 99% of all repeat campers are Canadian, of which 96% are from Alberta. Origin Canadian Campers 2004 (n=1,946) Repeat Campers 2003 (n=1,865) 2002 (n=2,861) Alberta 96.3% 96.4% 96.1% British Columbia 1.2% 1.4% 2.1% Saskatchewan 1.1% 1.8% 1.0% Other Canada 1.5% 0.4% 0.8% Similar to previous results, a quarter (25%) of all repeat campers in 2004 had visited the same site 6 or more times within the last 2 years. 30% 25% 25% % 19% 15% 15% 13% 13% 10% 11% 5% 5% 0% None # Trips within the last 2 Years 15
19 Length of Stay: In 2004, most campers stayed either 2 or 3 nights at their campground. The average length of stay for all campers in 2004 was just over 3 nights. 45% 40% 35% 30% 25% 20% 15% 10% 5% 10% 37% 21% 11% 14% % Average Length of Stay: (nights) 2004 = = = % Length of Stay (# nights) RVers (towable and motorized), on average, were on longer camping trips (3.7 nights) then tent campers (2.6 nights). Campers from Saskatchewan, the Yukon, Alberta, and British Columbia stayed the longest on average at their campgrounds. Saskatchewan Yukon* Alberta British Columbia Quebec* Manitoba* N.B. *Statistics calculated on very small sample sizes for some provinces should be interpreted with caution. Ontario Maritimes* Nunavut/NWT* Average Length of Stay (# nights) 16
20 Camping Equipment: 88% of respondents in 2004 used a single type of camping equipment during their visit, a slight decrease from The graphic at the right shows the single type of camping equipment respondents utilized over the past three years. Compared to 2003 tent camping in 2004 increased in popularity, while 5 th wheel trailer and motor home use decreased slightly in popularity. The majority of campers (61%) use a type of RV, either towable or motorized. For the 12% of respondents who used more than one type of camping equipment, the three most commonly used combinations were tent/travel trailer (14%), followed by tent/tent trailer (13%) and tent/5 th wheel trailer (9%). In fact, tents in combination with other equipment accounted for 64% of all combinations and were included in the 4 most frequently used combinations % 19% 22% 22% 22% 21% 15% 18% 17% 10% 15% 12% 7% 8% 7% 4% 6% 6% 3% 2% 3% 20% 18% 16% 14% 12% 10% 8% 6% 4% 2% 0% AF AB AE AG AD BF CG DF AC AH DE DG ABF FG CF EE EG ABE ADE Camping Eqipment Combinations A=Tent B=Tent Trailer C=Camperized Van D=Truck Camper E=5th Wheel Trailer F=Travel Trailer G=Motorhome H=Other 17
21 Units less than 29 in length accounted for most of the travel trailers used, while nearly 50% of 5 th Wheel trailers tended to be between The most common length for motorhomes was Relatively few RV s used in 2004 were longer than 35. Activity Participation: Length of RV Travel Trailer % of Campers Using.. 5 th Wheel Trailer Motorhome < <1 2 7 >40 <1 0 1 Resting / Relaxing was the most popular activity with a participation rate of 89%, followed by day hiking (unguided) (50%), and visiting viewpoints / lookouts (49%). Activities that campers spent the most time doing included resting/relaxing (49%), day hiking (unguided) (14%), swimming / beach use (7%), and fishing (7%). Picnicking (0.2%), guided hikes/walks (0.4%), and canoeing / kayaking (0.6%) were the three activities that campers spent the least time doing. 18
22 2004 Camper Activities Participation Rates Did anyone in your group participate in any of the following activities while visiting this park? Participation Rate Resting / relaxing 89% Day Hiking (unguided) 50% Visiting viewpoints / lookouts 49% Top Five Viewing / photographing nature or wildlife 44% Swimming / beach use 38% Casual play (e.g., Frisbee, horseshoes) 35% Using playground facilities 31% Birdwatching 26% Other bicycling 26% Fishing 26% Picnicking 18% Attending staff-led presentations / activities / amphitheatre programs 17% Backcountry recreation (e.g., hiking, camping) 16% Mountain biking (off road) 13% Motorboating / waterskiing 10% Guided hikes / walks 8% Other 7% Canoeing / kayaking 5% 19
23 Appendix 1. Satisfaction Score Results Detailed Summary 20
24
25 How would you rate each of the following services and facilities? N/A Very Poor How Would You Rate Each of the Following? Satisfaction with 10 Park Services and Facilities 2004 Provincial Summary Poor Average Good Very Good Number of Respondents Mean Score # % # % # % # % # % # % # mean Evaluation Lowbox Topbox Score Total % poor + % very # very poor good Cleanliness of washrooms , , , ,047 Friendliness and courtesy of staff , , ,101 Park information services , , ,667 Responsiveness of staff to visitor concerns 1, , , ,014 Condition of facilities , , , ,161 Cleanliness of grounds , , , ,221 Control of noise , , , ,014 Safety and security , , , ,986 Value for camping fee , , , ,207 Availability of firewood , , ,901 * Low Box, Top Box and Mean Scores are calculated using only rated responses. All not applicable responses were removed for traffic-light evaluation purposes. Overall Satisfaction: Overall, how satisfied were you with the quality of services and facilities? Overall Satisfaction with Services and Facilities 2004 Provincial Summary Very Dissatisfied Dissatisfied Neutral Satisfied Very Satisfied Number of Respondents Mean Score # % # % # % # % # % # mean Lowbox % poor + very poor Topbox Evaluation Score Total , , , ,136 % very good # 22
26 Park Services and Facilities: Satisfaction Measures: Thresholds and Traffic Light Scores for 10 Park Services and Facilities 2004 Provincial Summary Mean Score threshold Lowbox threshold Topbox threshold Traffic Light Evaluation*1 Poor + Very Very Good mean >4.00 <10% >40% Poor (%) (%) Cleanliness of washrooms 4.08 Pass 6.6 Pass 40.3 Pass Green 2 Friendliness and courtesy of staff 4.60 Pass 1.3 Pass 68.3 Pass Green Park information services 4.00 Pass 6.7 Pass 33.7 Fail Amber 1 Responsiveness of staff to visitor concerns 4.34 Pass 3.5 Pass 53.3 Pass Green Condition of facilities 4.24 Pass 3.4 Pass 44.7 Pass Green Cleanliness of grounds 4.46 Pass 1.7 Pass 58.6 Pass Green Control of noise 4.33 Pass 3.5 Pass 52.3 Pass Green Safety and security 4.34 Pass 1.7 Pass 49.0 Pass Green Value for camping fee 3.98 Fail 7.5 Pass 37.7 Fail Red Availability of firewood 4.10 Pass 10.1 Fail 47.8 Pass Amber Overall Satisfaction Measure: Thresholds and Traffic Light Scores 2004 Provincial Summary Pass Level*2 Overall Satisfaction: Overall, how satisfied were you with the quality of services and facilities? Mean Score mean >4.00 threshold Lowbox threshold Topbox threshold Poor + Very Poor (%) <10% Very Good (%) >40% Traffic Light Evaluation*1 Pass Level* Pass 2.8 Pass 51.5 Pass Green N/A * 1 Legend: * 2 Pass Level (Green) High Satisfaction (all 3 measures meet set thresholds) 1 At least one of the three measures barely passed set thresholds (Amber) Moderate Satisfaction (1 of 3 measures fail to meet thresholds) 2 Two of the three measures barely passed set thresholds (Red) Potentially Low Satisfaction (2 or 3 measures fail to meet thresholds) 3 Three of the three measures barely passed set thresholds 23
27 Appendix Survey Distribution / Collection Quotas 24
28
29 Distribution and Collection Guidelines and Final Response Number of Surveys by Survey Location (includes returns from survey locations not included in final analysis) Collected Sample Targets Distributed Actual Returns 2004 Park / PRA Adjusted Population 1 (OCN/2) Sample Target to be Collected 2 Sample Target to be Distributed 3 MAY JUNE JULY AUGUST SEPTEMBER MAY JUNE JULY AUGUST SEPTEMBER Actual Return (# Surveys) % of Collection Target Achieved Aspen Beach Lakeview 6, % Bow Valley Bow River 1, % Bow Valley 5, % Brazeau Reservoir Reservoir % Cold Lake 1, % Crane Lake East* % Crimson Lake Twin Lakes % Cypress Hills Ferguson Hill 1, % Dinosaur 4, % Dutch Creek* (0) 7% Elbow Valley Beaver Flats 1, % Elbow Valley Paddys Flat 2, % Highwood/Cataract Cataract % Kootenay Plains Two O clock Creek % Lakeland Touchwood Lake 1, % Lesser Slave Lake Martin River 2, % Oldman Dam Cottonwood 1, % Oldman River* (0) 8% Park Lake 1, % Peter Lougheed Park Boulton 3, % Peter Lougheed Park Elkwood 3, % Peter Lougheed Park Mount Sarrail % Continued. 1 Population sizes are based on recent camping visitation statistics: 2 or 3 year averages of most recent reported occupied campsite nights (OCN) from May - September for each site (estimates were not used in calculations). Populations are then adjusted to account for average length of stay of 2 nights/party (= OCN / 2). 2 Collection targets are calculated to achieve a ±7% margin of error at a 95% confidence interval. 3 Distribution targets are calculated assuming a 45% non-response rate. * Some or all completed surveys from survey locations eliminated from provincial analysis (total # included in analysis is in brackets). 26
30 2004 Park / PRA Adjusted Population 1 (OCN/2) Sample Target to be Collected 2 Sample Target to be Distributed 3 Sample Targets Collected Distributed Actual Returns MAY JUNE JULY AUGUST SEPTEMBER MAY JUNE JULY AUGUST SEPTEMBER Actual Return (# Surveys) % of Collection Target Achieved Pigeon Lake Zeiner 2, % Police Outpost * % Queen Elizabeth % Racehorse % Sheep River Valley Sandy McNabb 1, % Sibbald 2, % Sir Winston Churchill 1, % Thompson Creek 1, % Thunder Lake 2, % Wabamun Lake 4, % Whitney Lakes Ross Lake 1, % Willow Creek % Winagami Lake % Writing-On-Stone 2, % Provincial Total: 4 68,043 6,190 11,200 3,264 53% 1 Population sizes are based on recent camping visitation statistics: 2 or 3 year averages of most recent reported occupied campsite nights (OCN s) from May - September for each site (estimates were not used in calculations). Populations are then adjusted to account for average length of stay of 2 nights/party (= OCN s / 2). 2 Collection targets are calculated to achieve a ±7% margin of error at a 95% confidence interval. 3 Distribution targets are calculated assuming a 45% non-response rate. * Some or all completed surveys from survey locations eliminated from provincial analysis (total # included in analysis is in brackets). 4 Provincial total is NOT an estimate of the number of surveys needed to provided statistically valid results provincewide (i.e., only 200 surveys were needed provincially to provide statistically valid results at the 95% confidence interval with a ±7% margin of error). 27
31 Appendix 3. Questionnaire 28
32
33
34
35 Appendix 4. What Could We Have Done to Make Your Visit Better? Comment Analysis Summary 32
36
37 Comment Analysis: As completed surveys were received over the 2004 survey season, all comments were entered and coded according to a comprehensive, pre-coded list. This list was developed based on all comments received in 2002 and consists of both general and sub-categories of comments as outlined in the table in the following pages. For analysis purposes, negative and positive comments were analysed separately. Negative comments were reported to provide additional insight into the traffic light analysis for each of the 10 measured attributes. Additional comments that did not fall into one of the 10 attribute categories were also reported briefly. 34
38 General Category: Condition of Facilities: n 2004 Comment Analysis - Negative Comments Only % of ALL comments* % of ALL surveys represented Sub-Category: % 26.2% See 3 Main Subcategories Below Campsite % 6.2% n % of category* % of ALL comments Campsites Need Levelling % 0.7% Picnic Tables Deteriorating % 0.6% Firepits Deteriorating / Need Holes / Bigger % 0.6% Campsites Need More Gravel % 0.4% Campsite Needs to be Rearranged (position of firepit, posts) 9 2.1% 0.2% Campsites - Other 6 1.4% 0.2% Grounds % 16.6% 0.0% Roads % 3.4% Poor Condition of Beach / Swimming Area (sand, size, weeds) Landscaping (grass needs cutting, trim overgrowth, need more trees/shrubs) Boat Launch Deteriorating / Location / Needed % 1.3% % 1.2% % 1.0% Washroom Facilities Deteriorating % 0.9% Dock Facilities Deteriorating / Needed / Other Playgrounds Run Down / Need Upgrading / More Equipment General Deterioration / Needs Work, Upgrading % 0.7% % 0.5% % 0.5% Tree Hazards / Dead Fall % 0.3% Shower Facilities Deteriorating % 0.3% Trails / Pathways Deteriorating / Needed / Poor Positioning Fish Cleaning Station Deteriorating / Needed / Other Dusty Roads / Pave Roads (campground and access roads) Poor Campground Road Conditions (potholes, washboard) 9 2.1% 0.2% 4 0.9% 0.1% % 0.6% % 0.5% Roads - Other 7 1.6% 0.2% Poor Access Road Conditions (potholes, washboard) 6 1.4% 0.2% 35
39 2004 Comment Analysis - Negative Comments Only (continued) General Category: n % of ALL comments* % of ALL surveys represented Firewood % 28.0% Hook-ups / Dumpstations / Water % 18.5% Washrooms: Other % 16.1% Sub-Category: n % of category* % of ALL comments Cost (too expensive, should be free) % 3.0% Poor Quality (too long, wet) % 2.9% Poor Access (location, timing) % 2.6% Firewood Quantity (not enough, no wood) % 1.3% Firewood Delivery Needed and other % 0.9% Firewood Shelter Needed/Upgraded % 0.7% Firewood Should be Included in Fees % 0.5% Install or Additional Power Campsites % 3.2% Sewage Dump-stations Needed / Dirty / Full Poor Drinking Water Quality / Need Potable Water % 1.4% % 1.2% Water Hook-ups Needed % 0.7% Other (specific amperage, water filling station needed) Full Power-Water-Sewer Hook-ups Needed % 0.5% % 0.3% Grey-water Disposal Needed % 0.3% More Taps / Water Locations 8 2.6% 0.2% Running Water Needed (not washroom related) 7 2.3% 0.2% Additional Upgrades Needed % 1.4% Flush Toilets/Running Water Needed % 1.4% Supplies Needed (paper, soap) % 1.1% Timing of Cleaning % 1.0% Washroom Lighting Needed (indoor, outdoor) % 0.7% More Washroom Facilities Needed % 0.7% Poor Accessibility (disabled, general) % 0.3% Other (water, disrupted) 8 3.0% 0.2% 36
40 2004 Comment Analysis - Negative Comments Only (continued) General Category: Campground Facilities n % of ALL comments* % of ALL surveys represented % 15.7% Showers: Other % 13.2% Washrooms & Showers: Cleanliness Campsite Preferences % 13.6% % 6.4% Sub-Category: Store Needed / Have More Supplies / Too Expensive Need More Facilities (firepits, marina etc.) n % of category* % of ALL comments % 1.9% % 1.3% Other % 1.1% More Garbage Bins Needed % 0.7% Boat/Seadoo Rentals Needed % 0.7% Need / Additional Phone Booth % 0.4% Need / Additional Laundry Facilities % 0.3% Recycle Bins Needed 7 2.7% 0.2% Install Shower Facilities % 2.8% Additional Shower Facilities Needed % 0.8% Upgrades Needed (shelves, mats, disabled access) % 0.8% Problems with Temperature / Pressure / Time Allotment % 0.7% Should be Free / Less Expensive % 0.4% Poor Accessibility 2 1.1% 0.1% Offensive Odour % 2.6% Poor Washroom Cleanliness % 2.4% Poor Shower Cleanliness % 0.9% Too Small / Narrow % 0.8% Other Preferences % 0.6% More Private % 0.4% More Shaded / Wooded % 0.3% Need Additional Campsites % 0.3% More Grass Cover 6 5.7% 0.2% Need Tent Pads 3 2.8% 0.1% Closer to the Lake / Water 3 2.8% 0.1% Need Pull-through Campsites 1 1.0% 0.03% 37
2015 British Columbia Parks. Visitor Survey. Juan De Fuca Park. China Beach
 2015 British Columbia Parks Visitor Survey Juan De Fuca Park China Beach 1 Contents Introduction 3 Methodology 3 Limitations 3 How this report is organized 3 Part 1 - Visitor Satisfaction 4 Part 2 - Visitor
2009/10 NWT Park User Satisfaction Survey Report
 2009/10 NWT Park User Satisfaction Survey Report Industry, Tourism and Investment Government of the Northwest Territories Table of Contents Survey Methodology. 3 Survey Sample...3 Satisfaction with Services
2015 British Columbia Parks. Visitor Survey. Provincial Summary
 2015 British Columbia Parks Visitor Survey Provincial Summary 1 Contents Introduction 3 Methodology 4 Limitations 4 How this report is organized 4 Part 1 - Visitor Satisfaction 5 Part 2 - Visitor Prile
Planning Future Directions. For BC Parks: BC Residents' Views
 Planning Future Directions For BC Parks: BC Residents' Views Summary Report Ministry of Water, Land and Air Protection Province of British Columbia April, 2002 National Library of Canada Cataloguing in
Prince Edward Island National Park of Canada
 Prince Edward Island National Park of Canada Things you should know regarding Cavendish and Stanhope Campgrounds Important Notices General Camping Information Fees If There is No Vacancy Require Additional
Visitors Experiences and Preferences at Lost Lake in Clatsop State Forest, Oregon
 Visitors Experiences and Preferences at Lost Lake in Clatsop State Forest, Oregon Final Report Mark D. Needham, Ph.D. Assistant Professor Recreation Resource Management Program Department of Forest Resources
RESEARCH AND PLANNING FORT STEELE HERITAGE TOWN VISITOR STUDY 2007 RESULTS. May 2008
 RESEARCH AND PLANNING FORT STEELE HERITAGE TOWN VISITOR STUDY 2007 RESULTS May 2008 Research and Planning Tourism British Columbia 300-1803 Douglas St. Box 9830 Stn. Prov. Gov t. Victoria, BC V8W 9W5 Web:
1987 SUMMER USE SURVEY OF MINNESOTA STATE PARK VISITORS
 This document is made available electronically by the Minnesota Legislative Reference Library as part of an ongoing digital archiving project. http://www.leg.state.mn.us/lrl/lrl.asp (Funding for document
Waterton Lakes National Park of Canada
 Waterton Lakes National Park of Canada Things you should know regarding Townsite Campground Updated September 11, 2017 Important Notices: Important Notices General Camping Information Fees If There is
Prince Edward Island National Park of Canada
 Prince Edward Island National Park of Canada Things you should know regarding Cavendish and Stanhope Campgrounds Updated October 20, 2017 Important Notices: Important Notices General Camping Information
Banff National Park of Canada
 Banff National Park of Canada Things you should know regarding Tunnel Mountain Village I and Tunnel Mountain Village II Campgrounds Updated July 13, 2012 Important Notices Important Notices General Campground
Recreationists on the Gifford Pinchot National Forest: A Survey of User Characteristics, Behaviors, and Attitudes
 Recreationists on the Gifford Pinchot National Forest: A Survey of User Characteristics, Behaviors, and Attitudes by Alan R. Graefe The Pennsylvania State University Robert C. Burns University of Florida
SAXON HARBOR REDEVELOPMENT SURVEY
 SAXON HARBOR REDEVELOPMENT SURVEY SEPTEMBER, 2016 1,173 RESPONSES 1 BACKGROUND 1. WHAT TYPES OF ACTIVITIES DO YOU ENGAGE IN AT SAXON HARBOR Sightseeing Swimming Picnicing Fishing Camping Photography Motorized
Prepared for: TOMM Committee Kangaroo Island CB Contact: Naomi Downer, Account Director Phone: (08)
") Prepared for: TOMM Committee Kangaroo Island CB Contact: Naomi Downer, Account Director Phone: (08) 8373 3822 Email: naomi.downer@colmarbrunton.com Issue Date: 14 November, 2016 Project number: TOMM0002
Prepared for: TOMM Committee Kangaroo Island CB Contact: Naomi Downer, Account Director Phone: (08) 8373 3822 Email: naomi.downer@colmarbrunton.com Issue Date: 14 November, 2016 Project number: TOMM0002
Domestic Tourism in Edmonton and Area Tourism Region A Summary of 2015 Domestic Visitor Numbers, Expenditures and Characteristics August 2017
 Domestic Tourism in Edmonton and Area Tourism A Summary of 2015 Domestic Visitor Numbers, Expenditures and Characteristics August 2017 tourism.alberta.ca August 2017 Introduction Whether it was to see
2016/17 Alberta Parks Capital Programs
 2016/17 Alberta s Capital Programs Capital Maintenance and Renewal (CMR) Major Projects Region Description Central Blackfoot/Cooking Lake Provincial Trail System Upgrade Central Jarvis Bay Upgrade Central
2016 Camper Survey. Prepared by: Dr. Dwayne Baker Social Research Unit Parks Division Ministry of Parks, Culture and Sport
 2016 Camper Survey Prepared by: Dr. Dwayne Baker Social Research Unit Parks Division Ministry of Parks, Culture and Sport Last Updated: February 2017 TABLE OF CONTENTS Page EXECUTIVE SUMMARY... 1 SECTION
Prepared for: TOMM Committee Kangaroo Island CB Contact: Ben Nitschke, Account Manager Phone: (08)
") Prepared for: TOMM Committee Kangaroo Island CB Contact: Ben Nitschke, Account Manager Phone: (08) 8373 3822 Email: ben.nitschke@colmarbrunton.com Issue Date: 24 August, 2017 Project number: TOMM0003 www.colmarbrunton.com
Prepared for: TOMM Committee Kangaroo Island CB Contact: Ben Nitschke, Account Manager Phone: (08) 8373 3822 Email: ben.nitschke@colmarbrunton.com Issue Date: 24 August, 2017 Project number: TOMM0003 www.colmarbrunton.com
RIO ARRIBA COUNTY RV PARK- Project #14024 RV Research
 - Project #14024 RV Research 09.05.2014 Trends in Recreational Vehicles and Owners: Motorhomes and trailers over 30 in length are becoming increasingly popular. Many of these include slide-outs which can
Customer Satisfaction Tracking Annual Report British Columbia Ferry Services Inc.
 Customer Satisfaction Tracking Annual Report 2003 British Columbia Ferry Services Inc. Presented to: British Columbia Ferry Services Inc. Victoria, British Columbia 402 1505 West Second Avenue Vancouver
Customer Satisfaction Tracking Annual Report British Columbia Ferry Services Inc.
 Customer Satisfaction Tracking Annual Report 0 British Columbia Ferry Services Inc. Presented to: British Columbia Ferry Services Inc. Victoria, British Columbia 0 05 West Second Avenue Vancouver BC V6H
Customer Satisfaction Tracking Annual Report British Columbia Ferry Services Inc.
 Customer Satisfaction Tracking Annual Report 2007 British Columbia Ferry Services Inc. Presented to: British Columbia Ferry Services Inc. Victoria, British Columbia 02 10 West Second Avenue Vancouver BC
The striking colours of the setting sun reflecting on the waters is how Crimson Lake received its name. Crimson Lake Provincial Park is a meeting
 The striking colours of the setting sun reflecting on the waters is how Crimson Lake received its name. Crimson Lake Provincial Park is a meeting place of foothills forests in the west, bog and muskeg
1998 Pomme de Terre State Park Visitor Survey
 Missouri Department of Natural Resources Division of State Parks 800-334-6946 1998 Pomme de Terre State Park Visitor Survey Project Completion Report Submitted to Missouri Department of Natural Resources
Jasper National Park of Canada
 Jasper National Park of Canada Things you should know regarding Wabasso, Wapiti, Whistlers and Pocahontas Campgrounds Updated January 2, 2018 Important Notices: Important Notices General Camping Information
Customer Satisfaction Tracking Annual Report British Columbia Ferry Services Inc.
 Customer Satisfaction Tracking Annual Report British Columbia Ferry Services Inc. Presented to: British Columbia Ferry Services Inc. Victoria, British Columbia 0 0 West Second Avenue Vancouver BC VH Y
2009 Muskoka Airport Economic Impact Study
 2009 Muskoka Airport Economic Impact Study November 4, 2009 Prepared by The District of Muskoka Planning and Economic Development Department BACKGROUND The Muskoka Airport is situated at the north end
2018 Oneida County Outdoor Recreation Plan (ORP) Survey Results Summary
 Survey Results Summary") 2018 Oneida County Outdoor Recreation Plan (ORP) Survey Results Summary In the spring of 2018 NCWRPC mailed survey notices to each town, and either emailed or mailed survey notices to a whole list of outdoor
2018 Oneida County Outdoor Recreation Plan (ORP) Survey Results Summary In the spring of 2018 NCWRPC mailed survey notices to each town, and either emailed or mailed survey notices to a whole list of outdoor
Watchorn Provincial Park. Management Plan
 Watchorn Provincial Park Management Plan 2 Watchorn Provincial Park Table of Contents 1. Introduction... 3 2. Park History... 3 3. Park Attributes... 3 3.1 Natural... 4 3.2 Recreational... 4 3.3 Additional
Domestic Tourism in Alberta 2016
 A Summary of 2016 Domestic Visitor Numbers, Expenditures and Characteristics July 2018 tourism.alberta.ca July 2018 Introduction Whether to see their friends and relatives, for business, or for pleasure,
Non-Motorized Outdoor Recreation in British Columbia in 2012: Participation and Economic Contributions
 Non-Motorized Outdoor Recreation in British Columbia in 2012: Participation and Economic Stephen Kux Wolfgang Haider School of Resource and Environmental Management Simon Fraser University Burnaby, British
Proposal to Redevelop Lower Kananaskis River-Barrier Lake. Bow Valley Provincial Park
 Frequently Asked Questions Proposal to Redevelop Lower Kananaskis River-Barrier Lake Bow Valley Provincial Park Frequently Asked Questions What has been decided? What are the details of the plan? What
Proposal to Redevelop Lower Kananaskis River-Barrier Lake. Bow Valley Provincial Park. Frequently Asked Questions
 Proposal to Redevelop Lower Kananaskis River-Barrier Lake Bow Valley Provincial Park Frequently Asked Questions What is being proposed? What are the details of the proposal? Where is the project area located?
2013 Business & Legislative Session Visitor Satisfaction Survey Results
 2013 Business & Legislative Session Visitor Satisfaction Survey Results Completed by Juneau Economic Development Council in partnership with The Alaska Committee August 2013 JEDC research efforts are supported
2007 SUNSHINE COAST VISITOR STUDY FINDINGS
 RESEARCH & PLANNING 2007 SUNSHINE COAST VISITOR STUDY FINDINGS February 2009 Research & Planning, Tourism British Columbia 3 rd Floor, 1803 Douglas Street Victoria, British Columbia V8T 5C3 Web: www.tourismbc.com/research
TOURISM & PUBLIC SERVICES RURAL SIGNAGE POLICY
 Policy and Procedures Subject Title: Tourism and Public Services Rural Signage Policy Corporate Policy (Approved by Council): X Policy Ref. No.: ROADS-01-07 Administrative Policy (Approved by CAO): By-Law
Royal Parks Stakeholder Research Programme 2014
 1 Royal Parks Stakeholder Research Programme 2014 Park profile: Greenwich Park (Waves 1-3) January 2015 Technical note 2 This slide deck presents findings from three waves of survey research conducted
Customer Satisfaction Tracking Annual Report British Columbia Ferry Services Inc.
 Customer Satisfaction Tracking Annual Report 2006 British Columbia Ferry Services Inc. Presented to: British Columbia Ferry Services Inc. Victoria, British Columbia 02 1505 West Second Avenue Vancouver
Appendix 15.2: Pasha Dere Beach Usage Survey
 Appendix 15.2: Pasha Dere Beach Usage Survey URS-EIA-REP-22375 Table of Contents 15.2 Pasha Dere Beach Usage Survey... 1 15.2.1 Introduction... 1 15.2.2 Beach Surveys... 1 15.2.2.1 Survey Dates, Times
2006 Residential Property Taxes and Utility Charges Survey
 2006 Residential Property Taxes and Utility Charges Survey Prepared by: Jong Huang Chief Economist January 2007 TABLE OF CONTENTS Acknowledgements Introduction... 1 Summary... 2 Part 1: Major Canadian
1999 Wakonda State Park Visitor Survey
 Missouri Department of Natural Resources Division of State Parks 800-334-6946 1999 Wakonda State Park Visitor Survey Project Completion Report Submitted to Missouri Department of Natural Resources Division
Juneau Household Waterfront Opinion Survey
 Juneau Household Waterfront Opinion Survey Prepared for: City and Borough of Juneau Prepared by: April 13, 2004 TABLE OF CONTENTS Executive Summary...1 Introduction and Methodology...6 Survey Results...7
Northern Rockies District Value of Tourism Research Project December 2007
 Northern Rockies District Value of Tourism Research Project December 2007 Project Partners: Northern Rockies Regional District, Tourism British Columbia, Northern Rockies Alaska Highway Tourism Association,
Visitor Tradeoffs and Preferences for Conditions at Henry Rierson Spruce Run Campground in Clatsop State Forest, Oregon
 Visitor Tradeoffs and Preferences for Conditions at Henry Rierson Spruce Run Campground in Clatsop State Forest, Oregon Final Report Mark D. Needham, Ph.D. Assistant Professor Recreation Resource Management
2010 Nova Scotia Visitor Exit Survey Regional Report
 2010 Nova Scotia Visitor Exit Survey Regional Report A Look at Visitors Who Included Cape Breton in their Trip to Nova Scotia Reproduction in whole or in part is not permitted without the express permission
BOAT DOCKS AND LAUNCHES. Public Engagement Report July 2015
 BOAT DOCKS AND LAUNCHES Public Engagement Report July 2015 TABLE OF CONTENTS BACKGROUND 3 STAKEHOLDER CONSULTATION 6 PARTICIPANT PROFILE 7 RESPONSE THEMES 8 CONCLUSION 16 BACKGROUND The North Saskatchewan
Proposal to Redevelop Lower Kananaskis Lake Campgrounds in Peter Lougheed Provincial Park. What We Heard
 Proposal to Redevelop Lower Kananaskis Lake Campgrounds in Peter Lougheed Provincial Park What We Heard In December 2016, Alberta Parks proposed to make several changes to campgrounds in the Lower Kananaskis
Survey into foreign visitors to Tallinn Target market: Cruise voyagers. TNS Emor March 2012
 Survey into foreign visitors to Tallinn 2008 2011 Target market: Cruise voyagers TNS Emor March 2012 Table of contents 1 Introduction 3 2 Planning a trip to Tallinn 9 3 Visiting Tallinn and impressions
TALL TIMBER LEISURE PARK 2018/19 RULES and REGULATIONS (Board approved) March 24, 2018
 March 24, 2018") TALL TIMBER LEISURE PARK 2018/19 RULES and REGULATIONS (Board approved) March 24, 2018 The purpose of these Rules and Regulations are for the safety and enjoyment of all residents and their guests. The
TALL TIMBER LEISURE PARK 2018/19 RULES and REGULATIONS (Board approved) March 24, 2018 The purpose of these Rules and Regulations are for the safety and enjoyment of all residents and their guests. The
2000 Roaring River State Park Visitor Survey
 Missouri Department of Natural Resources Division of State Parks 800-334-6946 2000 Roaring River State Park Visitor Survey Project Completion Report Submitted to Missouri Department of Natural Resources
2012 Mat Su Valley Collision Avoidance Survey
 Table of Contents Table of Contents 1 INTRODUCTION Measurement Objectives 3 Methodology and Notes 4 Key Findings 5 PILOT LOCATION Activity in the Area 7 Pilot Location 8 Altitudes Flown 9 SAFETY IN THE
2015 Metro User Christchurch
 2015 Metro User Christchurch Research Report June 2015 www.researchfirst.co.nz Contents 2015 Metro User Christchurch 1 Research Context and Design 03 1.1 Introduction 03 1.2 Research Objectives 03 1.3
2012 In-Market Research Report. Kootenay Rockies
 2012 In-Market Research Report Kootenay Rockies Executive Summary This report summarizes key highlights for the Kootenay Rockies (KR) region taken from the British Columbia In-Market study conducted in
Tourism in Calgary and Area Tourism Region A Summary of 2014 Visitor Numbers, Expenditures and Characteristics July 2016
 Tourism in Calgary and Area Tourism Region 2014 A Summary of 2014 Visitor Numbers, Expenditures and Characteristics July 2016 Tourism.alberta.ca July 2016 Introduction Whether to see their friends and
Domestic Tourism in Calgary and Area Tourism Region 2016
 Domestic Tourism in Calgary and Area Tourism A Summary of 2016 Domestic Visitor Numbers, Expenditures and Characteristics July 2018 Tourism.alberta.ca July 2018 Introduction Whether it was to see friends
O REGON TRAILS SUMMIT. Oregon Trails Summit. Rogue River National Forest
 O REGON TRAILS SUMMIT Oregon Trails Summit 2014 Rogue River National Forest OREGON TRAILS 2015: A VISION FOR THE FUTURE The 2015-2024 Oregon Statewide Trails Plan Why do a trails plan? 2005-2014 Oregon
ANAGEMENT. LAN November, 1996
 M ANAGEMENT P LAN November, 1996 for Paul Lake Provincial Park Ministry of Environment, Lands and Parks BC Parks Department Paul Lake Provincial Park M ANAGEMENT P LAN Prepared by BC Parks Kamloops Area
1999 Reservations Northwest Users Survey Methodology and Results November 1999
 1999 Reservations Northwest Users Survey Methodology and Results November 1999 Oregon Survey Research Laboratory University of Oregon Eugene OR 97403-5245 541-346-0822 Fax: 541-346-5026 Internet: OSRL@OREGON.UOREGON.EDU
Tourism in Alberta. A Summary Of Visitor Numbers, Revenue & Characteristics Research Resolutions & Consulting Ltd.
 Tourism in Alberta A Summary Of Visitor Numbers, Revenue & Characteristics 2001 Alberta North Canadian Rockies Edmonton & Area Alberta Central Calgary & Area Policy & Economic Analysis Alberta South March
Economic And Social Values of Vermont State Parks 2002
 Economic And Social Values of Vermont State Parks 2002 Executive Summary Prepared for Vermont State Parks Department of Forest and Parks and Recreation Prepared by: Alphonse H. Gilbert Robert E. Manning
TOURISM SPENDING IN ALGONQUIN PROVINCIAL PARK
 TOURISM SPENDING IN ALGONQUIN PROVINCIAL PARK Margaret E. Bowman 1, Paul F.G. Eagles 2 1 Ontario Parks Central Zone, 451 Arrowhead Park Road, RR3, Huntsville, ON P1H 2J4, 2 Department of Recreation and
Visitor Profile - Central Island Region
 TOURISM LABOUR MARKET RESEARCH PROJECT 2003 The Project The Tourism Labour Market Research Project, was designed to study the tourism labour market throughout the Vancouver Island region. The Visitor Survey
BACKCOUNTRY TRAIL FLOOD REHABILITATION PROGRAM
 BACKCOUNTRY TRAIL FLOOD REHABILITATION PROGRAM Backcountry Trail Flood Rehabilitation A June 2013 Flood Recovery Program Summary In June 2013, parts of Southern Alberta were devastated from significant
Ewen Maddock Dam RECREATION GUIDE
 Ewen Maddock Dam RECREATION GUIDE seqwater.com.au About Ewen Maddock Dam OUR VISION To manage access to recreation opportunities while protecting natural resources and water quality. Ewen Maddock Dam,
Rules and Regulations
 Rules and Regulations General Site Rules: RV Site vehicle Occupancy and Rules: o No more than two vehicles per site are allowed. o Vehicles must not block roadways or vacant sites. o There must be NO PARKING
Cedar Rapids Area Convention and Visitors Bureau Visitor Study
 Cedar Rapids Area Convention and Visitors Bureau Visitor Study 2003-2004 University of Northern Iowa Sustainable Tourism & The Environment Program www.uni.edu/step Project Directors: Sam Lankford, Ph.D.
City of Durango 5.8 FUNDING TRAILS DEVELOPMENT
 5.8 FUNDING TRAILS DEVELOPMENT The City has been successful in establishing dedicated local funding sources as well as applying for grants to develop the City s trail system, having received nearly $2.4
Tourism in Alberta. A Summary of 2011 Visitor Numbers and Characteristics. June 2013
 Tourism in Alberta 2011 A Summary of 2011 Visitor Numbers and Characteristics June 2013 Due to methodological changes to the 2011 Travel Survey of Residents of Canada, there is a historical break in the
National Rail Passenger Survey Autumn 2013 Main Report
 National Rail Passenger Survey Autumn 2013 Main Report What is Passenger Focus? Passenger Focus is the independent consumer watchdog for Britain s rail passengers and England s bus, coach and tram passengers
Tourism in Alberta. A Summary Of Visitor Numbers, Revenue & Characteristics 2004
 Tourism in Alberta A Summary Of Visitor Numbers, Revenue & Characteristics 2004 Alberta North Based on the 2004 Canadian & International Travel Surveys (Statistics Canada) Canadian Rockies Edmonton & Area
Banff National Park of Canada Lake Louise
 Banff National Park of Canada Lake Louise Things you should know regarding Lake Louise Hard- Sided and Soft-Sided Trailer/Tent Campgrounds Updated September 12, 2017 Important Notices: Important Notices
Pinnacles National Park Camper Study
 U.S. Department of the Interior National Park Service Social Science Program Visitor Services Project Pinnacles National Park Camper Study 2 Pinnacles National Park Camper Study MB Approval: 1024-0224
Eastern Lake Ontario Beach User Survey 2003/2004.
 Eastern Lake Ontario Beach User Survey 2003/2004. Introduction The eastern shore of Lake Ontario is a Biodiversity Investment Area that features a 17-mile long barrier beach of Great Lakes dunes and a
RE: Access Fund Comments on Yosemite National Park Wilderness Stewardship Plan, Preliminary Ideas and Concepts
 September 30, 2016 Superintendent Yosemite National Park Attn: Wilderness Stewardship Plan P.O. Box 577 Yosemite, CA 95389 RE: Access Fund Comments on Yosemite National Park Wilderness Stewardship Plan,
By Prapimporn Rathakette, Research Assistant
 OCTOBER 2000 RESERVATIONS NORTHWEST SURVEY: METHODOLOGY AND RESULTS OREGON PARKS AND RECREATION DEPARTMENT OREGON SURVEY RESEARCH LABORATORY 5245 UNIVERSITY OF OREGON EUGENE, OR 97403-5245 TELEPHONE: 541-346-0824
JUNEAU BUSINESS VISITOR SATISFACTION SURVEY RESULTS
 2018 JUNEAU BUSINESS VISITOR SATISFACTION SURVEY RESULTS Completed by the Juneau Economic Development Council in partnership with the Alaska Committee. JEDC research efforts are supported by core funding
Updated 15/12/ SEASONAL RULES
 Updated 15/12/2018 2019 SEASONAL RULES Table of Contents 1. Seasonal Qualifications... 3 2. Seasonal Rates, Fees and Payment Schedule... 3 3. General Rules... 4 4. Sites... 4 5. Services... 5 6. Gate Cards...
State Park Visitor Survey
 State Park Visitor Survey Methods, Findings and Conclusions State s Department of Recreation, Park and Tourism Management surveyed state park visitor and trip characteristics, and collected evaluations
IATOS 2003 Outdoor Enthusiast Survey CTC Market Research March, 2003
 IATOS 2003 Outdoor Enthusiast Survey CTC Market Research March, 2003 The IATOS Expo (International Adventure Travel and Outdoor Sports Show, Chicago, February 2003) provided the CTC s Outdoor Product Development
Cedars RV Resort Owners Handbook. Phases 1,2,3
 Cedars RV Resort Owners Handbook Phases 1,2,3 NOTICE TO READER This document can and will evolve over time. Every effort has been made to provide simple clarity to common topics requiring definition. Should
Maine Office of Tourism Visitor Tracking Research Winter 2017 Seasonal Topline. Prepared by
 Maine Office of Tourism Visitor Tracking Research Winter 2017 Seasonal Topline Prepared by June 2017 Research Objectives and Methodology 2 Research Objectives Three distinct online surveys are used to
Seasonal Camping Agreement Beavermead Family Campground 2018
 Seasonal Camping Agreement Beavermead Family Campground 2018 No person shall occupy or make use of a seasonal campsite until all camping fees have been paid in full, and the seasonal camping permit has
Tourism Kelowna Visitor Intercept Survey Findings by Season FINAL DRAFT REPORT
 Tourism Kelowna Visitor Intercept Survey Findings by Season FINAL DRAFT REPORT January 17, 2017 1 Table of Contents Executive Summary... 3 Methodology.. 7 Visitor Intercept Survey Findings.. 9 Visitor
Customer Satisfaction Tracking Annual Report British Columbia Ferry Services Inc.
 Customer Satisfaction Tracking Annual Report 2008 British Columbia Ferry Services Inc. Presented to: British Columbia Ferry Services Inc. Victoria, British Columbia 02 10 West Second Avenue Vancouver BC
National Rail Passenger Survey Autumn 2015 Main Report
 National Rail Passenger Survey Autumn 2015 Main Report Transport Focus is the independent transport user watchdog Our mission is to get the best deal for passengers and road users. With a strong emphasis
Division of Governmental Studies and Services. Final Report. Washington State Outdoor Recreation Survey Report
 D 1 Appendix D: Survey Analysis Division of Governmental Studies and Services Final Report November 29, 2017 Washington State Outdoor Recreation Survey Report Report Authors: Christina Sanders, Acting
Tourism in Alberta. A Summary of 2012 Visitor Numbers and Characteristics. June 2014
 Tourism in Alberta 2012 A Summary of 2012 Visitor Numbers and Characteristics June 2014 Introduction Whether to see their friends and relatives, for business, or for pleasure, 33.1 million total visits
Byron Shire Visitor Profile and Satisfaction Report: Summary and Discussion of Results
 Byron Shire Visitor Profile and Satisfaction Report: Summary and Discussion of Results Introduction The Byron Shire Visitor Profile and Satisfaction (VPS) project was completed as part of the Destination
Riding Mountain National Park of Canada
 Riding Mountain National Park of Canada Things you should know regarding the otentiks and the Yurt and Equipped Camping in the Wasagaming Campground Important Notices General otentik and Yurt Information
Manassas National Battlefield Park. Visitor Study. Summer Kristin FitzGerald Margaret Littlejohn. VSP Report 80. April 1996
 Manassas National Battlefield Park Visitor Study Summer 1995 Kristin FitzGerald Margaret Littlejohn VSP Report 80 April 1996 Margaret Littlejohn is VSP Coordinator, National Park Service based at the Cooperative
VALUE OF THE QUEEN CHARLOTTE CITY VISITOR INFO CENTRE STUDY RESULTS - FOR DISTRIBUTION
 RESEARCH SERVICES VALUE OF THE QUEEN CHARLOTTE CITY VISITOR INFO CENTRE STUDY RESULTS - FOR DISTRIBUTION September 2003 Research Services Tourism British Columbia 300-1803 Douglas St. Box 9830 Stn. Prov.
City of Galion Park Satisfaction Survey Results
 City of Galion Park Satisfaction Survey Results Dec. 5, 2016 Goal: To get feedback from the community on: 1. General satisfaction of city-owned parks 2. How to improve park facilities and recreation opportunities
Tourism Kelowna Visitor Intercept Survey Findings FINAL DRAFT REPORT
 Tourism Kelowna Visitor Intercept Survey Findings FINAL DRAFT REPORT January 17, 2017 1 Table of Contents Executive Summary... 3 Methodology.. 7 Visitor Intercept Survey Findings.. 9 Visitor Profile. 9
Review of 2009 Camping Season
 Review of 2009 Camping Season Tourism and Parks Department of Industry, Tourism and Investment Government of the Northwest Territories 3/31/2010 1.0 Introduction The Department of Industry, Tourism and
Campground Reservations Open
 For Immediate Release Thursday, January 10, 2019 Prince Albert National Park Campground Reservations Open There may be snow on the ground but now is the time to start planning summer camping trips according
Trail Use in the N.C. Museum of Art Park:
 Trail Use in the N.C. Museum of Art Park: New Connections, New Visitors Jacqueline MacDonald Gibson, PhD Daniel Rodriguez, PhD Taylor Dennerlein, MSEE, MCRP, EIT Jill Mead, MPH Evan Comen University of
m, Ph.D. and rger, Ph.D.
 Comparison of Day Users, Overnight Users, and Survey Approaches at Champoeg State Heritage Area Final Report Mark D. Needham m, Ph.D. and Randall S. Rosenber rger, Ph.D. Department of Forest Ecosystems
ORDINANCE NO EXHIBIT A
 ORDINANCE NO. 2017-05 EXHIBIT A City of Lake Dallas, Texas Park Rules and Regulations for Willow Grove Park Preamble: Willow Grove Park ( the Park ) is a public park operated and maintained by the City
1987 SUMMER USE SURVEY OF MINNESOTA STATE PARK VISITORS
 This document is made available electronically by the Minnesota Legislative Reference Library as part of an ongoing digital archiving project. http://www.leg.state.mn.us/lrl/lrl.asp (Funding for document
TABLE OF CONTENTS. TOURIST EXPENDITURE 31 Average Spend per Person per Night ( ) 31 Tourist Expenditure per Annum ( ) 32
 31 Tourist Expenditure per Annum ( ) 32") FALKLAND ISLANDS International Tourism Statistics Report 2013 2 3 4 TABLE OF CONTENTS PAGE INTRODUCTION 6 KEY FACTS AND FIGURES 7 INBOUND TOURISM (OVERNIGHT VISITORS) 8 TOURIST ARRIVALS 8 Tourist Arrivals
FALKLAND ISLANDS International Tourism Statistics Report 2013 2 3 4 TABLE OF CONTENTS PAGE INTRODUCTION 6 KEY FACTS AND FIGURES 7 INBOUND TOURISM (OVERNIGHT VISITORS) 8 TOURIST ARRIVALS 8 Tourist Arrivals