Overseas and Mexican Visitors To California
|
|
|
- Beatrice Crawford
- 5 years ago
- Views:
Transcription

1 Overseas and Mexican Visitors To California 2013 A joint marketing venture of Visit California and the California Business, Transportation and Housing Agency, Division of Tourism October 2014
2 CIC Research, Inc Vickers Street San Diego, CA PH: (858) , FAX: (858) Prepared by For Visit California 555 Capitol Mall, Suite 1100 Sacramento, California PH: (916) , FAX: (916) ii
3 EXECUTIVE SUMMARY OVERSEAS AND MEXICAN VISITORS TO CALIFORNIA (2013) Total Overseas Market. There were approximately 32.0 million overseas visitors to the U.S. in 2013, up 7.7% from 29.8 million in Approximately 6.6 million overseas visitors (20.6%) indicated California was a destination on their U.S. trip, up 6.6% from 6.2 million overseas visitors to California in Mexican (Air). There were approximately 2,218,000 Mexican travelers who arrived in the U.S. by air in 2013 (a 4.7% increase from 2012). Approximately 515,000 (23.2%) of these Mexican travelers visited California during their U.S. Trip (a 2.2% decrease from 2012). 1 Country of Origin. California's top ten overseas visitor market countries were: Overseas Visitors to California Rank Country Percentage Change 1) China (excl. Hong Kong) 671, , % 2) United Kingdom 635, , % 3) Australia 522, , % 4) Japan 558, , % 5) Germany 399, , % 6) France 373, , % 7) South Korea 388, , % 8) India 190, , % 9) Brazil 183, , % 10) Taiwan 138, , % In 2013, China, the U.K., and Australia combined generated approximately 31% of the overseas visitors to California. The number of Chinese visitors to California increased by almost 22% in 2013 (818,000) from 2012 (671,000). This resulted in the ranking of Chinese visitors to California remaining in first place. U.K. visitor volume to California increased by approximately 3%, thereby keeping their ranking in second place. The number of Australian visitors went up 6% from 522,000 to 553,000, resulting in the Australian ranking going from fourth to third place. Japanese visitors decreased by approximately 4% thereby going from third to fourth place in the rankings. There was an increase in the volume of overseas visitors to California for all of the top ten overseas visitor market countries with the exception of Japan. 1 The majority of Mexican visitors to California in 2013 arrived by ground transportation through a U.S. border port of entry. Mexican visitors arriving in the U.S. by ground transportation are not included in the Survey of International Air Travelers and are not included in this study. Please note that Canadians, whether arriving by air or land, are not included in the Survey of International Air Travelers or this study. iii
4 (This page was intentionally left blank) iv
5 Overseas Visitors to the U.S. and California Millions Overseas to U.S Overseas to CA Market Share. Among the ten largest overseas visitor markets, California's share of visitors increased in 2013 from 2012 for visitors from the U.K., Germany, France, India and Taiwan. California Market Share of U.S. Visitors from Selected Overseas Countries Rank By Volume Country ) China (excl. Hong Kong) 45.5% 45.3% 2) United Kingdom 16.9% 17.0% 3) Japan 15.1% 14.4% 4) Australia 46.5% 45.9% 5) Germany 21.3% 22.0% 6) South Korea 31.0% 28.6% 7) France 25.6% 25.9% 8) Brazil 10.2% 10.0% 9) India 26.2% 27.9% 10) Taiwan 47.6% 48.4% Trend in Overseas Visitor Market Share. California s market share of overseas visitors to the U.S. has recorded a general decline since the late 1990s. In 1997, California s market share of overseas visitors to the U.S. was at a high of 26.6%. By 2004, the market share had dropped to 20.7%. In 2009 California s market share of overseas visitors fell to 20.1%, increased to 22.0% in 2011 and dropped again in 2013 to 20.6%. v
6 (This page was intentionally left blank) vi
7 Main Destination. More than three-quarters (77%) of overseas visitors to California indicated that California was their main destination, similar to that reported in previous years. California MSAs Visited. Similar to last year s data, the most common Metropolitan Statistical Areas (MSAs) visited by overseas visitors to California included Los Angeles - Long Beach (58%) and San Francisco (47%), followed by San Diego (13%), Anaheim-Santa Ana, and San Jose (7% and 6% respectively). Main Purpose of Trip. The main purpose of trip among overseas travelers to California was vacation (52%), followed by visiting friends and relatives (17%), and business (15%). Purpose of Trip. Overseas travelers to California listed multiple reasons for their trip in addition to the main purpose. These included: vacation (64%), visiting friends/relatives (32%), and business (20%). Compared to other overseas travelers, visitors from Australia reported the highest proportion of travelers on vacation/holiday (89%), while visitors from Mexico (air) and India reported the highest proportion of those visiting friends and relatives (35%). Visitors from India and Japan (49% and 46%, respectively) reported the highest proportion of business travelers. Leisure/Recreation Activities. Shopping (88%), sightseeing (84%), and national parks/monuments (49%) were the most common leisure and recreation activities of overseas visitors to California in More than nine in ten visitors from Australia reported shopping (96%) or sightseeing (93%) as a recreation activity, while almost two-thirds of Australian visitors (66%) reported national parks/monuments. Use of Travel Agents. Travel agent usage in 2013 declined slightly compared with 2012 (31% versus 32% respectively.) Visitors from Australia (58%) and Japan (40%) report the highest dependence on travel agents to book their air trips, though use of the travel agents service declined among each of these groups. Overseas travelers who relied on travel agents to pre-book their lodging arrangements remained at 15% in 2013 as in An Internet booking service was reportedly used by 31% of travelers in 2013, while 19% reported contacting the hotels/motels directly, and 10% reported that their company s travel department booked their lodging. Accommodations. Similar to 2012, more than three-fourths of overseas travelers to California in 2013 reported staying in hotels or motels at some time during their trip (76%). Visitors from Mexico (air) and India reported the lowest hotel usage (59% and 66%, respectively), while visitors from Japan and Australia and France (88%, 86%, and 84% respectively) reported the highest hotel usage. Gender and Age. Similar to results from previous years, approximately 58% of overseas travelers to California during 2013 were adult males and 42% were adult females. During 2013, the average age of traveling adult males (42 years old) was three years older than the average traveling adult female (39 years old). vii
8 (This page was intentionally left blank) viii
9 Length of Stay. During 2013, California's overseas visitors spent an average of 23 nights in the U.S. and 12 nights in California, similar to the numbers in Once again, visitors from India reported the highest number of nights stayed in the U.S. (38 nights) as well as in California (21 nights). Visitors from Japan and Mexico (air) reported the least amount of time spent in the U.S. (10 nights and 15 nights respectively), while visitors from Mexico (air) reported the least amount of time in California (7 nights). First International Trip. More than one quarter of overseas visitors to California in 2013 were traveling on their first international U.S. trip (28%) as compared with 26% in Transportation Use. Approximately four in ten overseas visitors to California made use of airlines, a rental car, or a company or private auto (46%, 43%, and 37% respectively) as a means of transportation within the U.S. These were followed by use of the city subway/tram/bus (33%) and a taxi/cab/limousine (33%). Visitors from Australia were most likely to fly between U.S. Cities (80%), while visitors from Germany and Brazil were most likely to make use of a rental car (63% and 61% respectively). Visitors from Mexico (air) were most likely to make use of a company or private auto (51%), and visitors from Australia and India (58% and 50% respectively) were most likely to make use of a taxi/cab/limousine. Advance Trip Decision. In 2013 the average overseas visitor to California decided to travel a median of 65 days prior to the actual trip, longer than that reported in 2012 (60 days). Visitors from Australia reported the longest trip planning time (median = 150 days). Advance Ticket Reservation and Payment. Overseas visitors to California in 2013 reserved their airline ticket a median of 47 days prior to the actual trip, nearly the same timeframe as that reported in Visitors from India reported the shortest time frame from airline reservation to departure date (median = 20 days). On the other hand, visitors from Australia and Germany reported the longest time frame from airline reservation to departure (median = 100 days and 90 days respectively). Overseas visitors to California paid for their airline ticket a median of 42 days prior to the actual trip, 5 days after reserving the ticket. Visitors from South Korea and India paid for their ticket a median of 20 days prior to the actual trip (shortest timeframe), while visitors from France and Australia paid for their ticket a median of 90 days prior to their actual trip (longest timeframe). Travel Insurance. More than six in ten (63%) overseas visitors to California in 2013 purchased travel insurance, while 37% did not. Travel Companions. The highest proportion of overseas travelers to California (61%) were traveling alone, while 21% were traveling with their spouse, 13% with family/relatives, 6% with friends, and 4% with business associates. There was a slightly higher proportion of travelers to California traveling alone in 2013 (61%) compared with 2012 (59%). Travel Party Size. Consistent with results from previous years, the average travel party size for all overseas visitors to California during 2013 was 1.6 people. Visitors from China and France were the most likely to include children (16% and 14%, respectively). Prepaid Trip Package. Package tours were used by 15% of all 2013 visitors to California, as compared with 16% in During 2013, visitors to California who reported the highest use of inclusive tours were from France (24%). ix
10 (This page was intentionally left blank) x
11 Total Spending in the U.S. by Overseas Visitors to California. In 2013 Overseas visitors to California reported total spending in the U.S. of $23.6 billion. Approximately $12.8 billion (54%) of their total spending in the U.S. was spent in California. Overseas visitors to California reported average spending in the U.S. of $3,577 per visitor. By country, the highest spending in the U.S. was reported by California visitors from South Korea ($4,997 per visitor) followed by visitors from France ($4,148), Australia ($4,129), and China ($4,127). Expenditures in California. 2 In 2013, the total number of overseas visitors to California was 6,609,000, compared with 6,197,000 in These visitors reported spending an average of $159 per day and they stayed an average of 12.2 nights in California. Estimated spending per visitor in California was about $1,940 in 2013, for an estimated total spending of $12.8 billion in the state. Expenditures in California - Mexican (air) visitors. 3 In 2013, the total number of Mexican (air) visitors to California was 515,000, up from 504,000 in These visitors reported spending an average of $134 per day and they stayed an average of 7.4 nights in California (3.2 nights shorter than in 2012). Each visitor from Mexico (air) generated average spending of $994 in California during The total estimated spending by all Mexican (air) visitors to California was $512 million in Credit Card Use. In 2013, 66% of overseas visitors to California made use of a credit card for purchases and 31% used their credit cards to withdraw cash. Almost two-thirds (65%) used cash from home or travelers checks, 14% withdrew cash using a debit card and 12% used their debit card for purchases. These percentages are from a multiple-response question which records all purchase methods used, unlike previous years where only the main purchase method used was reported. 2 Spending estimates for visitors to the U.S. and California were prepared by Tourism Economics for Visit California and were based on SIAT data and other secondary data sources. 3 Ibid. xi
12 xii
13 (This page was intentionally left blank) xii
14 OVERSEAS AND MEXICAN VISITORS TO CALIFORNIA* SELECTED HIGHLIGHTS (2013) ALL OVERSEAS VISITORS UNITED KINGDOM GERMANY FRANCE ITALY AUSTRALIA CHINA W/O HK INDIA JAPAN SOUTH KOREA BRAZIL MEXICO (AIR) Estimated Travelers 6,609, , , , , , , , , , , ,000 Purpose: Business (% Change 2012/2013) 20% (1%) 20% (6%) 13% (-2%) 13% (-1%) 18% (10%) 6% (-3%) 19% (-9%) 49% (-1%) 46% (13%) 19% (1%) 7% (-4%) 19% (4%) Purpose: Vacation (% Change 2012/2013) 64% (1%) 68% (-5%) 72% (-2%) 79% (5%) 74% (-4%) 89% (3%) 57% (10%) 24% (2%) 35% (-9%) 56% (8%) 79% (15%) 62% (0%) Adv. Trip Decision (mean days) Adv. Air Decision (mean days) Mean Travel Party Size Median Male Age (years) Median Female Age (years) Mean Household Income ($000) $100,889 $131,449 $104,007 $75,323 $102,893 $125,395 $63,389 $53,546 $135,054 $78,226 $110,525 $65,230 Nights CA (mean) Nights CA (median) (Mean change 2011/2012) (0.9 nts) (-0.3 nts) (-0.2 nts) (-3.6 nts) (-0.4 nts) (2.9 nts) (0.6 nts) (0.1 nts) (0.3 nts) (-0.3 nts) (3.3 nts) (3.2) nts Hotel/Motel 76.4% 78.5% 70.5% 84.0% 77.0% 86.1% 68.6% 66.1% 87.9% 71.3% 80.9% 59.3% Private Home 27.0% 28.0% 30.8% 27.2% 23.0% 13.0% 24.2% 39.1% 14.6% 29.8% 25.1% 43.6% Rental Car 43.0% 45.0% 63.0% 52.6% 55.2% 38.6% 36.2% 21.8% 31.5% 36.1% 60.6% 34.6% Total Spending in CA ($Bil.) $12.8 Bil. $0.87 Bil. $0.70 Bil. $0.67 Bil. $0.31 Bil. $0.99 Bil. $1.95 Bil. $0.45 Bil. $1.05 Bil. $0.91 Bil. $0.44 Bil. $0.51 Bil. Spending /visitor in CA $1,940 $1,329 $1,670 $1,734 $1,987 $1,791 $2,377 $1,859 $1,964 $2,335 $2,106 $994 Mean Spending /day in CA $159 $129 $148 $189 $191 $166 $165 $90 $231 $234 $140 $134 *Does not include Canadian visitors. Only Mexican visitors arriving in the U.S. by air were included in the study. Source: : U.S. Department of Commerce, NTTO, Survey of International Air Travelers, 2013 CIC Research, Inc., and Visit California. xiii
15 (This page was intentionally left blank) xiv
16 OVERSEAS AND MEXICAN LEISURE VISITORS TO CALIFORNIA* SELECTED HIGHLIGHTS (2013) ALL OVERSEAS VISITORS UNITED KINGDOM GERMANY FRANCE ITALY AUSTRALIA CHINA W/O HK INDIA JAPAN SOUTH KOREA BRAZIL MEXICO (AIR) Estimated Travelers 4,508, , , , , , , , , , , ,000 Purpose: Business 1.3% 0.4% 0.6% 0.0% 4.1% 1.0% 3.3% 0.0% 3.5% 0.3% 1.3% 3.6% Purpose: Vacation 85.2% 85.8% 87.8% 91.0% 93.2% 97.8% 81.3% 52.6% 79.3% 77.8% 89.4% 72.5% Adv. Trip Decision (mean days) Adv. Air Decision (mean days) Mean Travel Party Size Median Male Age (years) Median Female Age (years) Mean Household Income ($000) $96 $122 $96 $73 $90 $125 $67 $52 $132 $74 $111 $86 Nights CA (mean) Nights CA (median) Hotel/Motel 73.1% 76.7% 69.1% 81.8% 75.4% 86.6% 61.0% 40.8% 74.7% 65.4% 81.9% 49.8% Private Home 30.2% 30.2% 28.1% 29.6% 24.4% 12.2% 26.6% 69.0% 33.4% 36.9% 23.5% 55.2% Rental Car 46.5% 50.7% 68.3% 53.9% 59.5% 40.9% 41.7% 14.8% 27.9% 29.2% 69.5% 39.4% Total Spending in CA ($Bil.) $8.7 Bil. $0.63 Bil. $0.47 Bil. $0.56 Bil. $0.26 Bil. $0.80 Bil. $1.31 Bil. $0.10 Bil. $0.28 Bil. $0.89 Bil. $0.35 Bil. $0.39 Bil. Spending /visitor in CA $1,921 $1,327 $1,504 $1,777 $2,092 $1,639 $2,694 $980 $1,329 $3,543 $2,196 $1,005 Mean Spending /day in $181 $128 $155 $191 $180 $176 $284 $50 $182 $362 $236 $123 CA *Does not include Canadian visitors. Only Mexican visitors arriving in the U.S. by air were included in the study. Source: U.S. Department of Commerce, NTTO, Survey of International Air Travelers, 2013 CIC Research, Inc., and Visit California. xv

17 Figure 1 TOP TEN COUNTRIES OF RESIDENCE OVERSEAS VISITORS TO CALIFORNIA (2013) Visitors (000's) CHINA 818 UNITED KINGDOM AUSTRALIA JAPAN GERMANY FRANCE SOUTH KOREA INDIA BRAZIL TAIWAN Source: U.S. Department of Commerce, NTTO In-Flight Survey, 2013 CIC Research, Inc. xvi
18 Table 1 RESIDENCE OF VISITORS TO THE UNITED STATES AND CALIFORNIA (2013) UNITED STATES CALIFORNIA Number of Estimated CA Share of Visitors Percent Visitors to Percent Visitors from RESIDENCE OF VISITORS to the U.S. Change California Change* this Country EUROPE 12,895, % 2,502, % 19.4% W. EUROPE 12,034, % 2,335, % 19.4% Austria 186, % 43, % 23.0% Belgium 265, % 44, % 16.4% Denmark 269, % 70, % 26.1% France 1,504, % 389, % 25.9% Germany 1,916, % 421, % 22.0% Ireland 367, % 88, % 24.0% Italy 838, % 157, % 18.7% Netherlands 589, % 113, % 19.2% Norway 284, % 53, % 18.5% Spain 619, % 92, % 14.8% Sweden 476, % 97, % 20.3% Switzerland 473, % 111, % 23.5% United Kingdom 3,835, % 652, % 17.0% Other Western Europe 407, % 5, % 1.2% E. EUROPE 860, % 179, % 20.8% CARIBBEAN 1,155, % 7, % 0.6% Cayman Islands 39, , % Trinidad & Tobago 134, % 3, % 1.9% Other Caribbean 369, , % Note: "--" Represents an estimate of less than 500 visitors or a response of less than 0.05%. * Large variances may occur due to small sample sizes. xvii
19 (This page was intentionally left blank) xviii
20 Table 1 (Cont.) RESIDENCE OF VISITORS TO THE UNITED STATES AND CALIFORNIA (2013) UNITED STATES CALIFORNIA Number of Estimated CA Share of Visitors Percent Visitors to Percent Visitors from RESIDENCE OF VISITORS to the U.S. Change California Change* this Country SOUTH AMERICA 5,141, % 427, % 8.3% Argentina 686, % 47, % 6.9% Brazil 2,060, % 206, % 10.0% Chile 212, % 21, % 10.1% Colombia 748, % 59, % 7.9% Ecuador 254, % 8, % 3.2% Peru 217, % 13, % 5.9% Venezuela 788, % 75, % 9.5% CENTRAL AMERICA (Excld. Mexico) 833, % 88, % 10.6% Costa Rica 182, % 17, % 9.6% Guatemala 202, % 24, % 11.9% Honduras 138, % 1, % 0.9% Panama 141, % 12, % 8.6% Other Central America 169, % 34, % 20.1% AFRICA 439, % 38, % 8.7% South Africa, Rep. of 105, % 18, % 17.4% Other Africa 334, % 20, % 6.0% OCEANIA 1,429, % 700, % 49.0% Australia 1,205, % 553, % 45.9% New Zealand 209, % 119, % 56.9% Note: "--" Represents an estimate of less than 500 visitors or a response of less than 0.05%. * Large variances may occur due to small sample sizes. xix
21 (This page was intentionally left blank) xx
22 Table 1 (Cont.) RESIDENCE OF VISITORS TO THE UNITED STATES AND CALIFORNIA (2013) UNITED STATES CALIFORNIA Number of Estimated CA Share of Visitors Percent Visitors to Percent Visitors from RESIDENCE OF VISITORS to the U.S. Change California Change* this Country ASIA 9,084, % 2,389, % 26.3% Hong Kong 122, % 62, % 50.8% India 859, % 240, % 27.9% Indonesia 88, % 48, % 53.9% Japan 3,730, % 536, % 14.4% Korea, South 1,359, % 389, % 28.6% People's Republic of China 1,806, % 818, % 45.3% Philippines 200, % 99, % 49.2% Republic of China (Taiwan) 384, % 186, % 48.4% Singapore 152, % 67, % 44.1% Thailand 88, % 40, % 45.1% MIDDLE EAST 1,058, % 225, % 21.3% Egypt 66, % 5, % 7.4% Israel 331, % 61, % 18.3% Saudi Arabia 221, % 55, % 24.7% Turkey 160, % 40, % 25.0% Other Middle East 278, % 64, % 23.0% TOTAL OVERSEAS VISITORS 32,038, % 6,609, % 20.6% (Number of Respondents) (36,681) (6,744) Mexico (Air Arrivals Only) 2,218, % 515, % 23.2% Note: "--" Represents an estimate of less than 500 visitors or a response of less than 0.05%. Countries and World Region visitor volumes are independently estimated and may not sum to total visitors. * Large variances may occur due to small sample sizes. Sources: U.S. Department of Commerce, NTTO, Survey of International Air Travelers, CIC Research, Inc., and Visit California. xxi
23 (This page was intentionally left blank) xxii
24 Table 2 OVERSEAS AND MEXICAN VISITORS TO CALIFORNIA SHARE OF TOTAL U.S. MARKET BY COUNTRY AND VISITOR VOLUME ESTIMATE ( ) California's Share of Overseas Visitors to the U.S. from Europe and Mexico (Air) YEAR ALL OVERSEAS ALL EUROPE GERMANY UNITED KINGDOM FRANCE ITALY NETHERLANDS IRELAND % 18.2% 20.6% 15.4% 24.5% 25.0% 19.6% 15.3% 18.1% 30.6% % 19.2% 20.4% 17.3% 23.7% 24.6% 22.1% 21.8% 18.8% 27.3% % 20.3% 21.1% 17.4% 24.7% 19.8% 25.2% 23.9% 23.7% 32.3% % 18.0% 21.5% 15.9% 24.4% 24.6% 27.0% 11.1% 15.2% 27.4% % 20.0% 21.7% 16.6% 25.9% 20.7% 25.2% 26.2% 21.1% 29.7% % 18.1% 18.7% 16.0% 23.4% 20.8% 21.7% 18.2% 17.7% 27.2% % 18.1% 20.5% 15.8% 23.5% 20.7% 22.7% 13.2% 16.9% 22.8% % 19.0% 20.8% 16.1% 23.9% 19.6% 26.0% 22.2% 18.3% 24.8% % 18.0% 20.0% 15.2% 22.8% 18.1% 20.4% 21.2% 17.7% 22.2% % 19.7% 22.0% 15.8% 28.2% 23.0% 20.3% 20.0% 18.5% 23.8% % 20.6% 22.4% 17.1% 29.6% 20.7% 19.1% 19.9% 20.1% 25.2% % 19.4% 21.3% 16.9% 25.6% 19.7% 20.6% 23.5% 17.9% 23.8% % 19.4% 22.0% 17.0% 25.9% 18.7% 19.2% 24.0% 17.7% 23.2% OTHER EUROPE MEXICO (AIR) Estimated Volume of Visitors to California from Europe and Mexico (Air) YEAR ALL OVERSEAS ALL EUROPE GERMANY UNITED KINGDOM FRANCE ITALY NETHERLANDS IRELAND ,847,000 1,728, , , , ,000 81,000 42, , , ,196,000 1,652, , , , ,000 78,000 57, , , ,031,000 1,754, , , ,000 81,000 86,000 58, , , ,378,000 1,743, , , , , ,000 60, , , ,808,000 2,063, , , , , , , , , ,710,000 1,835, , , , ,000 93,000 96, , , ,171,000 2,065, , , , , , , , , ,292,000 2,431, , , , , , , , , ,670,000 2,078, , , , , ,000 87, , , ,572,000 2,358, , , , , ,000 72, , , ,145,000 2,613, , , , , ,000 69, , , ,197,000 2,421, , , , , ,000 78, , , ,609,000 2,502, , , , , ,000 88, , ,000 OTHER EUROPE MEXICO (AIR) xxiii
25 (This page was intentionally left blank) xxiv
26 Table 2 (Cont.) OVERSEAS AND MEXICAN VISITORS TO CALIFORNIA SHARE OF TOTAL U.S. MARKET BY COUNTRY AND VISITOR VOLUME ESTIMATE ( ) California's Share of Overseas Visitors to the U.S. from Asia, Australia, and South America YEAR ASIA JAPAN SOUTH KOREA HONG KONG TAIWAN INDIA CHINA OTHER ASIA AUSTRALIA SOUTH AMERICA % 20.8% 46.3% 60.8% 65.0% 43.0% 64.1% 54.1% 52.1% 11.5% % 18.5% 43.1% 54.9% 64.2% 35.0% 54.5% 46.2% 48.9% 10.2% % 18.8% 47.3% 56.3% 62.8% 40.0% 48.3% 55.1% 49.5% 9.7% % 17.6% 44.2% 46.3% 60.1% 35.9% 51.8% 43.2% 49.2% 11.0% % 18.1% 38.6% 59.8% 59.9% 30.4% 54.0% 47.2% 51.2% 8.8% % 17.3% 41.3% 48.0% 59.6% 31.7% 57.4% 50.7% 49.2% 7.9% % 18.4% 40.9% 59.3% 62.7% 31.7% 53.8% 49.7% 49.0% 9.7% % 18.0% 38.2% 58.0% 61.4% 29.4% 48.5% 55.9% 49.1% 8.5% % 15.0% 37.9% 55.2% 56.4% 27.8% 46.3% 45.9% 50.0% 8.5% % 15.4% 37.7% 54.7% 53.2% 28.0% 47.6% 33.4% 54.6% 8.6% % 16.9% 34.4% 52.1% 50.6% 27.7% 43.1% 40.7% 53.0% 9.0% % 15.1% 31.0% 47.3% 47.6% 26.2% 45.5% 21.8% 46.5% 8.4% % 14.4% 28.6% 50.8% 48.4% 27.9% 45.3% 19.2% 45.9% 8.3% Estimated Volume of Visitors to California from Asia, Australia, and South America YEAR ASIA JAPAN SOUTH KOREA HONG KONG TAIWAN INDIA CHINA OTHER ASIA AUSTRALIA SOUTH AMERICA ,053, , , , , , , , , , ,656, , ,000 74, ,000 90, , , , , ,526, , ,000 64, , ,000 76, , , , ,607, , ,000 57, , , , , , , ,754, , ,000 81, , , , , , , ,790, , ,000 66, , , , , , , ,964, , ,000 84, , , , , , , ,907, , ,000 81, , , , , , , ,581, , ,000 64, , , , , , , ,941, , ,000 72, , , , , , , ,084, , ,000 67, , , , , , , ,169, , ,000 63, , , , , , , ,389, , ,000 62, , , , , , ,000 xxv
27 (This page was intentionally left blank) xxviii
28 TABLE OF CONTENTS Page EXECUTIVE SUMMARY: OVERSEAS AND MEXICAN VISITORS TO CALIFORNIA... iii OVERSEAS AND MEXICAN VISITORS TO CA HIGHLIGHTS (2013)...xiii OVERSEAS AND MEXICAN LEISURE VISITORS TO CA HIGHLIGHTS (2013)... xv Table 1 RESIDENCE OF VISITORS TO THE U.S. AND CALIFORNIA (2013)...xvii Table 2 OVERSEAS AND MEXICAN VISITORS TO CALIFORNIA AND SHARE OF TOTAL U.S. MARKET BY COUNTRY xxiii LIST OF FIGURES...xxxi INTRODUCTION... 1 OVERSEAS AND MEXICAN VISITORS TO CALIFORNIA... 3 COUNTRY OF RESIDENCE BY: Table 3 - MAIN DESTINATION BY STATE... 5 Table 4 - CALIFORNIA MSAs VISITED... 7 Table 5 - TRAVEL COMPANIONS Table 6 - MAIN PURPOSE OF TRIP Table 7 - PURPOSE OF TRIP Table 8 - LEISURE-RECREATION ACTIVITIES Table 9 - ADVANCE TRIP DECISION Table 10 - ADVANCE TICKET RESERVATION Table 11 - ADVANCE INTERNATIONAL TICKET PAYMENT Table 12 - MEANS OF BOOKING AIR TRIP AND LODGING Table 13 - U.S. TRIP INFORMATION SOURCES Table 14 - AIRLINE TICKET CLASS AND PREPAID TRIP PACKAGE Table 15 - TRAVEL PARTY SIZE Table 16 - GENDER AND AGE Table 17 - ANNUAL HOUSEHOLD INCOME Table 18 - NIGHTS AWAY FROM HOME Table 19 - PORT OF ENTRY Table 20 - OVERNIGHT ACCOMMODATIONS Table 21 - TRANSPORTATION IN THE U.S Table 22 - PAYMENT METHODS FOR TRIP EXPENSES Table 23 - TRIP EXPENDITURES Table 24 - CALIFORNIA ONLY EXPENDITURES xxix
29 (This page was intentionally left blank) xxx
30 TABLE OF CONTENTS (continued) Page OVERSEAS AND MEXICAN LEISURE VISITORS TO CALIFORNIA Table 25 - RESIDENCE OF OVERSEAS AND MEXICAN LEISURE VISITORS LEISURE TRAVELERS COUNTRY OF RESIDENCE BY: Table 26 - MAIN DESTINATION BY STATE Table 27 - CALIFORNIA MSAs VISITED Table 28 - TRAVEL COMPANIONS Table 29 - MAIN PURPOSE OF TRIP Table 30 - PURPOSE OF TRIP Table 31 - LEISURE-RECREATION ACTIVITIES Table 32 - ADVANCE TRIP DECISION Table 33 - MEANS OF BOOKING AIR TRIP AND LODGING Table 34 - TRIP INFORMATION SOURCES Table 35 - AIRLINE TICKET CLASS AND PREPAID TRIP PACKAGE Table 36 - TRAVEL PARTY SIZE Table 37 - GENDER AND AGE Table 38 - ANNUAL HOUSEHOLD INCOME Table 39 - NIGHTS AWAY FROM HOME Table 40 - PORT OF ENTRY Table 41 - OVERNIGHT ACCOMMODATIONS Table 42 - TRANSPORTATION IN THE U.S Table 43 - PAYMENT METHODS FOR TRIP EXPENSES Table 44 - TRIP EXPENDITURES Table 45 - CALIFORNIA ONLY EXPENDITURES APPENDIX A - Survey Background APPENDIX B - Questionnaire APPENDIX C - World by Region and Country or Territory xxxi
31 (This page was intentionally left blank) xxxii
32 LIST OF FIGURES Figure Page 1 TOP TEN COUNTRIES OF RESIDENCE... xvi 2 MAIN STATE DESTINATION TOP TEN MSA DESTINATIONS TRAVEL COMPANIONS MAIN PURPOSE OF TRIP PURPOSE OF U.S. TRIP LEISURE RECREATION ACTIVITIES ADVANCE TRIP DECISION ADVANCE AIRLINE DECISION TRAVEL INFORMATION SOURCES TRAVEL PARTY SIZE GENDER OF OVERSEAS AND MEXICAN VISITORS INCOME PROFILE OF OVERSEAS AND MEXICAN VISITORS TOTAL NIGHTS IN THE U.S PORT OF ENTRY OF OVERSEAS AND MEXICAN VISITORS OVERNIGHT ACCOMMODATIONS TRANSPORTATION IN THE U.S PAYMENT METHOD FOR TRIP EXPENSES TRIP EXPENDITURES xxxiii
33 (This page was intentionally left blank) xxxiv
34 INTRODUCTION This report on overseas visitors to California is based on data compiled from the 2013 National Travel and Tourism Office (NTTO) "Survey of International Air Travelers. The survey is conducted by CIC Research, Inc. in cooperation with over 90 major airlines on a sample of their international flights departing from U.S. airports. The survey information is collected from passengers through questionnaires covering traveler demographics, trip activities, places visited and travel expenditures. This survey program was initiated in response to a growing need for information on the volume, characteristics, and travel patterns of international air travelers to and from the United States. The data from the survey are used by the public and private sectors to guide strategic planning and marketing to international air travelers 4. Approximately 6,700 survey respondents reported a California visit in This is a very robust sample size, providing a unique opportunity to evaluate the characteristics of the international visitor market. However, since airline participation is voluntary and varies from quarter to quarter, country level data should be viewed cautiously. For example, if a major carrier for a particular country was unable to participate for a quarter, the data may not fully represent the market's international travel to California. In order to increase the overall accuracy of the visitor profile for selected countries with small sample sizes, multiple years of survey data were combined for these individual countries. Countries with combined years are indicated at the top of each column for the crosstabulation tables appearing in the body of the report. 4 The international visitor volume estimates appearing in this report were based on the U.S. Department of Commerce, NTTO, "Survey of International Air Travelers" and then were adjusted by the CTTC to reflect additional market information regarding travel to California. 1
35 With the exception of the number of respondents, all the data in the tables are statistical estimates, based on responses to the survey and supplemented with data from the U.S. Department of Homeland Security. Passengers on most charter flights and passengers traveling by air between the U.S. and Canada are excluded. Travelers to the U.S. from Mexico arriving on an international flight have been included in the 2013 report. However, most travelers from Mexico to California arrive in the U.S. through a land port of entry. A more detailed explanation of the survey methodology appears in Appendix A and a copy of the survey questionnaire in Appendix B. 2
36 OVERSEAS AND MEXICAN (AIR) VISITORS TO CALIFORNIA (2013) 3
37 Figure 2 MAIN STATE DESTINATION OVERSEAS VISITORS TO CALIFORNIA (2013) Other, 11% Florida, 1% Hawaiian Islands, 2% Nevada, 4% New York, 5% California, 77% Source: : U.S. Department of Commerce, NTTO, In-Flight Survey, 2013 CIC Research, Inc. 4
38 Table 3 MAIN DESTINATION BY STATE OVERSEAS AND MEXICAN VISITORS TO CALIFORNIA (2013) More than three in four (77%) overseas visitors to California in 2013 indicated that California was their main destination on their U.S. trip. Of all overseas visitors to California, Japanese, South Korea, Mexico (air), and Indian visitors (89%, 86%, 85% and 82% respectively) reported the highest proportion with California as their main state of destination in the U.S. COUNTRY OF RESIDENCE OF VISITORS MAIN DESTINATION* TOTAL OVERSEAS U.K. GERMANY FRANCE ITALY AUSTRALIA CHINA w/o HK INDIA JAPAN SOUTH KOREA BRAZIL MEXICO (AIR) ESTIMATED TRAVELERS 6,609, , , , , , , , , , , ,000 (Number of Respondents) (4,772) (476) (315) (190) (111) (182) (249) (175) (834) (266) (142) (111) California 76.7% 79.5% 76.2% 78.3% 73.6% 39.9% 73.3% 82.2% 88.9% 85.9% 73.3% 84.8% New York Nevada Hawaiian Islands Florida *Visitors may report only one destination -- States with less than one percent response were not listed. Sources: U.S. Department of Commerce, NTTO, Survey of International Air Travelers, CIC Research, Inc., and Visit California. 5

39 Figure 3 TOP TEN MSA DESTINATIONS OVERSEAS VISITORS TO CALIFORNIA (2013) Los Angeles - Long Beach 57.2% San Francisco 46.1% San Diego 12.6% Anaheim San Jose Salinas Riverside Santa Barbara - Lompoc Sacramento San Luis Obispo 7.3% 6.3% 4.4% 3.4% 2.9% 2.9% 1.9% 0% 10% 20% 30% 40% 50% 60% 70% Source: U.S. Department of Commerce, NTTO, Survey of International Air Travelers, 2013 CIC Research, Inc. 6
40 Table 4 CALIFORNIA MSAs VISITED OVERSEAS AND MEXICAN VISITORS TO CALIFORNIA* (2013) The most common Metropolitan Statistical Areas (MSAs) visited by overseas visitors to California in 2013 were Los Angeles Long Beach (57%) (58% in 2012), San Francisco (46%) (48% in 2012), San Diego (13%) (13% in 2012), Anaheim Santa Ana (7%) (8% in 2012), followed by San Jose (6%), Salinas (4%), Riverside-San Bernardino, Santa Barbara, and Sacramento (3% each respectively). METROPOLITAN STATISTICAL AREA* COUNTRY OF RESIDENCE OF VISITORS TOTAL OVERSEAS U.K. GERMANY FRANCE ITALY AUSTRALIA CHINA w/o HK INDIA JAPAN ESTIMATED TRAVELERS 6,609, , , , , , , , , , , ,000 (Number of Respondents) (6,543) (566) (438) (280) (146) (358) (454) (223) (1,098) (361) (175) (111) SOUTH KOREA BRAZIL MEXICO (AIR) Los Angeles-Long Beach MSA 3,781, , , ,000 44, , ,000 83, , , , ,000 (Los Angeles County) 57.2% 52.3% 51.1% 68.1% 28.0% 69.3% 74.4% 34.6% 36.9% 61.4% 60.2% 41.7% San Francisco MSA 3,044, , , ,000 73, , ,000 97, , ,000 99,000 78,000 (San Francisco-Marin-San Mateo Counties) 46.1% 50.0% 57.0% 72.2% 46.5% 43.8% 46.3% 40.4% 27.1% 46.5% 48.1% 15.1% San Diego MSA 833,000 96,000 71,000 50,000 13,000 71,000 83,000 23,000 67,000 27,000 35,000 35,000 (San Diego County) 12.6% 14.7% 16.9% 12.9% 8.3% 12.8% 10.1% 9.6% 12.5% 6.9% 17.0% 6.8% Anaheim-Santa Ana MSA 481,000 65,000 21,000 17,000 2, ,000 14,000 14,000 52,000 31,000 16,000 64,000 (Orange County) 7.3% 10.0% 5.0% 4.4% 1.3% 19.0% 1.7% 5.8% 9.7% 8.0% 7.8% 12.4% San Jose MSA 416,000 46,000 29,000 14,000 3,000 13,000 31,000 63,000 56,000 22,000 4,000 33,000 (Santa Clara County) 6.3% 7.1% 6.9% 3.6% 1.9% 2.4% 3.8% 26.3% 10.4% 5.7% 1.9% 6.4% Salinas MSA 288,000 81,000 25,000 35,000 8,000 11,000 23,000-4,000 3,000 14,000 18,000 (Monterey County) 4.4% 12.4% 5.9% 9.0% 5.1% 2.0% 2.8% - 0.7% 0.8% 6.8% 3.5% Riverside-San Bernardino MSA 224,000 50,000 27,000 9,000 2,000 13,000 13,000 3,000 7,000 5,000 8,000 20,000 (Riverside-San Bernardino Counties) 3.4% 7.7% 6.4% 2.3% 1.3% 2.4% 1.6% 1.3% 1.3% 1.3% 3.9% 3.9% 7
41 (This page was intentionally left blank) 8
42 METROPOLITAN STATISTICAL AREA* Table 4 (Cont.) COUNTRY OF RESIDENCE OF VISITORS TOTAL OVERSEAS U.K. GERMANY FRANCE ITALY AUSTRALIA CHINA w/o HK INDIA JAPAN ESTIMATED TRAVELERS 6,609, , , , , , , , , , , ,000 (NUMBER OF RESPONDENTS) (6,543) (566) (438) (280) (146) (358) (454) (223) (1,098) (361) (175) (111) SOUTH KOREA BRAZIL MEXICO (AIR) Santa Barbara-Lompoc MSA 192,000 35,000 15,000 20,000 8,000 8,000 11,000 2,000 11,000-14,000 7,000 (Santa Barbara County) 2.9% 5.4% 3.6% 5.1% 5.1% 1.4% 1.3% 0.8% 2.1% - 6.8% 1.4% Sacramento MSA 192,000 19,000 17,000 11,000 3,000 7,000 18,000 9,000 7,000 19,000 6,000 - (El Dorado-Placer-Sacramento- Yolo Counties) 2.9% 2.9% 4.0% 2.8% 1.9% 1.3% 2.2% 3.8% 1.3% 4.9% 2.9% - San Luis Obispo MSA 128,000 38,000 19,000 17,000 4,000 12,000 2, ,000 8,000 - (San Luis Obispo County) 1.9% 5.8% 4.5% 4.4% 2.5% 2.2% 0.2% % 3.9% - Oakland MSA 128,000 12,000 13,000 6,000 2,000 2,000 20,000-11,000 10,000 4,000 27,000 (Alameda-Contra Costa Counties) 1.9% 1.8% 3.1% 1.5% 1.3% 0.4% 2.4% - 2.1% 2.6% 1.9% 5.2% *Visitors may report multiple destinations -- percentages are read down the column. Counties with less than a two percent share of the California market were not listed. Sources: U.S. Department of Commerce, NTTO, Survey of International Air Travelers, CIC Research, Inc., and Visit California. 9

43 Figure 4 TRAVEL COMPANIONS OVERSEAS VISITORS TO CALIFORNIA / U.S. (2013) 70% 60% 61.1% 58.5% California Visitors U.S. Visitors 50% 40% 30% 21.3% 22.6% 20% 13.2% 15.5% 10% 0% 5.9% 6.0% 3.8% 2.8% 0.7% 0.3% Traveling Alone Spouse/Partner Family/Relatives Friends Business Assoc. Tour Group Source: U.S. Department of Commerce, NTTO Survey of International Air Travelers, 2013 CIC Research, Inc. 10
44 Table 5 TRAVEL COMPANIONS OVERSEAS AND MEXICAN VISITORS TO CALIFORNIA (2013) More than six in ten overseas visitors to California (61%) were traveling alone, 21% were traveling with a spouse/partner, and 13% were traveling with family or relatives. Visitors from India (81%) had the highest proportion of respondents who were traveling alone, while visitors from Italy (36%) and Australia (35%) had the highest proportion that was traveling with a spouse/partner. Visitors from Mexico (air) (23%) had the highest proportion of respondents who were traveling with family/relatives, and visitors from Japan (14%) and China (9%), had the highest proportion traveling with business associates. COUNTRY OF RESIDENCE OF VISITORS TRAVEL COMPANIONS* TOTAL OVERSEAS U.K. GERMANY FRANCE ITALY AUSTRALIA CHINA w/o HK INDIA JAPAN SOUTH KOREA BRAZIL MEXICO (AIR) ESTIMATED TRAVELERS 6,609, , , , , , , , , , , ,000 (Number of Respondents) (6,700) (590) (461) (285) (148) (365) (460) (231) (1,122) (367) (176) (119) Traveling Alone 61.1% 62.4% 59.4% 54.4% 46.0% 50.0% 54.7% 80.9% 65.7% 58.8% 60.1% 57.4% Spouse/Partner Family/Relatives Friends Business Associates Tour Group *Column percentages may total more than 100% due to multiple responses. Sources: U.S. Department of Commerce, NTTO, Survey of International Air Travelers, CIC Research, Inc., and Visit California. 11
45 Figure 5 MAIN PURPOSE OF U.S. TRIP OVERSEAS VISITORS TO CALIFORNIA / U.S. (2013) 70% 60% 51.6% 56.9% California Visitors 50% US Visitors 40% 30% 20% 10% 16.6% 17.1% 15.3% 12.0% 9.0% 7.2% 5.7% 4.6% 1.8% 2.4% 0% Vacation Friend/Relative Business Convention Education Other Source: U.S. Department of Commerce, NTTO, Survey of International Air Travelers, 2013 CIC Research, Inc. 12
46 Table 6 MAIN PURPOSE OF TRIP OVERSEAS AND MEXICAN VISITORS TO CALIFORNIA (2013) The greatest proportion of overseas visitors to California reported the main purpose of their trip as vacation/holidays (52%). This was followed by those whose main purpose was visiting friends/relatives (17%), and those whose main purpose was business/professional (15%). Visitors from Australia (79%), France (71%), Italy (70%), and Brazil (65%) had the highest proportion of visitors whose main purpose was vacation/holidays, while visitors from India (30%) and South Korea (21%) had the highest proportion of visitors whose main purpose was visiting friends/relatives. Visitors from Japan and India (38% each) had the highest proportion of visitors whose main purpose was business/professional. COUNTRY OF RESIDENCE OF VISITORS MAIN PURPOSE OF TRIP TOTAL OVERSEAS U.K. GERMANY FRANCE ITALY AUSTRALIA CHINA w/o HK INDIA JAPAN SOUTH KOREA BRAZIL MEXICO (AIR) ESTIMATED TRAVELERS 6,609, , , , , , , , , , , ,000 (Number of Respondents) (6,097) (550) (423) (272) (138) (345) (420) (193) (1,019) (335) (162) (103) Vacation/Holidays 51.6% 56.8% 57.2% 70.8% 69.7% 79.4% 44.2% 12.6% 26.2% 43.9% 65.0% 50.0% Visit Friends/Relatives Business/Professional Attend A Convention Education Other Sources: U.S. Department of Commerce, NTTO, Survey of International Air Travelers, CIC Research, Inc., and Visit California. 13
47 70% 60% 64.1% Figure 6 PURPOSE OF U.S. TRIP OVERSEAS VISITORS TO CALIFORNIA / U.S. (2013) 66.7% California Visitors U.S. Visitors 50% 40% 30% 32.2% 28.6% 20% 10% 19.7% 15.4% 12.1% 9.5% 8.3% 6.6% 4.0% 3.6% 0% Vacation Friend/Relative Business Convention Education Other Source: U.S. Department of Commerce, NTTO, Survey of International Air Travelers, 2013 CIC Research, Inc. 14
48 Table 7 PURPOSE OF TRIP OVERSEAS AND MEXICAN VISITORS TO CALIFORNIA (2013) More than six in ten (64%) overseas visitors to California reported visiting for vacation/holiday purposes, while 32% were visiting friends/relatives (63% in 2012 were on vacation/holiday, and 33% were visiting friends/relatives), and 20% were on business (19% in 2012). Visitors to California attending a convention/conference/trade show accounted for 12% (the same as in 2012). Visitors were allowed to list more than one purpose of their trip. Visitors from Australia (89%) indicated high proportions of vacationing during their U.S. trip, while visitors from India (21%) and Japan (20%) reported high proportions of attending a convention/conference/trade show when compared with visitors from other countries. Visitors to California from India (49%) and Japan (46%) reported a high proportion of visiting for business purposes when compared with visitors from other countries, while visitors from Brazil (7%) and Australia (6%) reported the lowest proportion visiting for this reason. COUNTRY OF RESIDENCE OF VISITORS PURPOSE OF TRIP* TOTAL OVERSEAS U.K. GERMANY FRANCE ITALY AUSTRALIA CHINA w/o HK INDIA JAPAN SOUTH KOREA BRAZIL MEXICO (AIR) ESTIMATED TRAVELERS 6,609, , , , , , , , , , , ,000 (Number of Respondents) (6,600) (582) (459) (281) (146) (365) (453) (227) (1,089) (356) (177) (117) Vacation/Holidays 64.1% 67.6% 72.0% 79.3% 74.2% 88.5% 56.8% 23.5% 34.5% 55.9% 79.3% 61.9% Visit Friends/Relatives Business/Professional Attend A Convention Education Other *Column percentages may total more than 100% due to multiple responses. Sources: U.S. Department of Commerce, NTTO, Survey of International Air Travelers, CIC Research, Inc., and Visit California. 15

49 Figure 7 LEISURE RECREATION ACTIVITIES OVERSEAS VISITORS TO CALIFORNIA (2013) Shopping Sightseeing 87.6% 83.7% National Parks/Monuments Experience Fine Dining Small Towns/Countryside Amusement/Theme Parks Historical Locations Guided Tours Art Gallery/Museum 48.9% 42.5% 41.1% 38.3% 36.7% 33.2% 30.4% 0% 20% 40% 60% 80% 100% Source: U.S. Department of Commerce, NTTO, Survey of International Air Travelers, 2013 CIC Research, Inc. 16
50 Table 8 LEISURE-RECREATION ACTIVITIES OVERSEAS AND MEXICAN VISITORS TO CALIFORNIA (2013) Shopping (88%) followed by sightseeing (84%) and visiting national parks/monuments (49%) were the most common leisure and recreation activities enjoyed by overseas visitors to California in Visitors from Australia had the highest proportion of respondents who mentioned shopping, sightseeing, or visiting national parks/monuments as a favorite leisure/recreation activity (96%, 93% and 66% respectively.) Experiencing fine dining was mentioned most frequently by visitors from Australia (55%) and China (51%). COUNTRY OF RESIDENCE OF VISITORS LEISURE/RECREATION ACTIVITIES* TOTAL OVERSEAS U.K. GERMANY FRANCE ITALY AUSTRALIA CHINA w/o HK INDIA JAPAN SOUTH KOREA BRAZIL MEXICO (AIR) ESTIMATED TRAVELERS 6,609, ,00 421, , , , , , , , , ,000 (Number of Respondents) (5,604) (522) (400) (250) (119) (338) (395) (174) (768) (306) (162) (97)** Shopping 87.6% 84.6% 89.5% 86.6% 80.5% 95.8% 86.7% 88.1% 81.1% 78.2% 91.6% 90.2% Sightseeing National Parks/Monuments Experience Fine Dining Small Towns/Countryside Amusement/Theme Parks Historical Locations Guided Tours Art Gallery/Museum Casinos/Gambling Cultural/Ethnic Heritage Concert/Play/Musical Nightclubs/Dancing Sporting Event Visit Am. Indian Comm Camping/Hiking Water Sports Environ./Eco. Excursions Golfing/Tennis Snow Sports Hunting/Fishing *Multiple response. Only responses one percent or greater are detailed. **Caution - small sample size. Sources: U.S. Department of Commerce, NTTO, Survey of International Air Travelers, CIC Research, Inc., and Visit California. 17

51 Figure 8 ADVANCE TRIP DECISION OVERSEAS VISITORS TO CALIFORNIA / U.S. (2013) 40% 30% 20.8% 21.0% 20.4% California Visitors Avg. = 105 Days Median = 65 Days 24.3% 23.1% U.S. Visitors Avg. = 94 Days Median = 60 Days 20% 11.7% 11.8% 17.4% 14.7% 12.3% 10.9% 11.4% 10% 0% Days Source: U.S. Department of Commerce, NTTO, Survey of International Air Travelers, 2013 CIC Research, Inc. 18
52 Table 9 ADVANCE TRIP DECISION OVERSEAS AND MEXICAN VISITORS TO CALIFORNIA (2013) The median time period for overseas visitors decision to travel was 65 days before the actual trip. In the four previous years, this decision was made a median of 60 days prior to the trip. Respondents from Australia had the longest planning time frame, with a median of 150 days. India, South Korea, and Mexico (air) had the shortest planning time frame with a median of just 30 days. COUNTRY OF RESIDENCE OF VISITORS ADVANCE TRIP TOTAL CHINA SOUTH MEXICO DECISION* OVERSEAS U.K. GERMANY FRANCE ITALY AUSTRALIA w/o HK INDIA JAPAN KOREA BRAZIL (AIR) ESTIMATED TRAVELERS 6,609, , , , , , , , , , , ,000 (Number of Respondents) (6,462) (569) (447) (276) (148) (355) (432) (226) (1,084) (355) (173) (115) 14 Days or Less 11.7% 13.0% 9.7% 4.3% 7.9% 4.5% 13.0% 20.8% 19.0% 14.2% 3.5% 17.5% Days Days Days Days or More Days TOTAL 100.0% 100.0% 100.0% 100.0% 100.0% 100.0% 100.0% 100.0% 100.0% 100.0% 100.0% 100.0% Average No. of Days Median No. of Days *Column percentages may not total 100% due to rounding. Sources: U.S. Department of Commerce, NTTO, Survey of International Air Travelers, CIC Research, Inc., and Visit California. 19
53 Figure 9 ADVANCE AIRLINE DECISION OVERSEAS VISITORS TO CALIFORNIA / U.S. (2013) 40% 30% 25.7% 26.4% California Visitors Avg. = 72 Days Median = 47 Days U.S. Visitors Avg. = 69 Days Median = 45 Days 20% 19.2% 18.7% 17.2% 21.2% 20.1% 20.6% 10% 9.4% 8.3% 7.2% 6.0% 0% Days Source: U.S. Department of Commerce, NTTO, Survey of International Air Travelers, 2013 CIC Research, Inc. 20
54 Table 10 ADVANCE AIRLINE TICKET RESERVATION OVERSEAS AND MEXICAN VISITORS TO CALIFORNIA (2013) In 2013 an overseas visitor committed to an airline ticket reservation a median of 47 days prior to the actual trip. Seven percent of travelers booked their airline reservations six months or more in advance of their trip. Visitors from Australia made their airline travel reservations a median of 100 days in advance. By contrast, visitors from India booked their airline tickets a median of only 20 days in advance of their U.S. trip. COUNTRY OF RESIDENCE OF VISITORS ADVANCE AIRLINE RESERVATIONS* TOTAL OVERSEAS U.K. GERMANY FRANCE ITALY AUSTRALIA CHINA w/o HK INDIA JAPAN SOUTH KOREA BRAZIL MEXICO (AIR) ESTIMATED TRAVELERS 6,609, , , , , , , , , , , ,000 (Number of Respondents) (6,206) (549) (431) (265) (143) (349) (412) (217) (1,031) (346) (169) (113) 14 Days or less 19.2% 18.2% 14.1% 9.0% 16.6% 10.9% 22.9% 33.7% 30.9% 32.4% 8.5% 26.3% Days Days Days Days or More Days TOTAL 100.0% 100.0% 100.0% 100.0% 100.0% 100.0% 100.0% 100.0% 100.0% 100.0% 100.0% 100.0% Average No. of Days Median No. of Days *Column percentages may not total 100% due to rounding. Sources: U.S. Department of Commerce, NTTO, Survey of International Air Travelers, CIC Research, Inc., and Visit California. 21
55 (This page was intentionally left blank) 22
56 Table 11 ADVANCE INTERNATIONAL AIRLINE TICKET PAYMENT OVERSEAS AND MEXICAN VISITORS TO CALIFORNIA (2013) In 2013 an overseas visitor paid for their international airline ticket a median of 42 days prior to the actual trip. More than five percent of travelers paid for their airline reservations six months or more in advance of their trip. Visitors from France and Australia paid for their international airline tickets a median of 3 months in advance. By contrast, visitors from India and South Korea paid for their airline tickets a median of only 20 days in advance of their U.S. trip. COUNTRY OF RESIDENCE OF VISITORS ADVANCE AIRLINE PAYMENT* TOTAL OVERSEAS U.K. GERMANY FRANCE ITALY AUSTRALIA CHINA w/o HK INDIA JAPAN SOUTH KOREA BRAZIL MEXICO (AIR) ESTIMATED TRAVELERS 6,609, , , , , , , , , , , ,000 (Number of Respondents) (5,987) (550) (406) (266) (137) (351) (409) (204) (940) (338) (161) (108) 14 Days or less 24.0% 18.5% 15.3% 8.1% 17.9% 12.4% 30.5% 41.8% 38.4% 46.2% 11.7% 28.0% Days Days Days Days or More Days TOTAL 100.0% 100.0% 100.0% 100.0% 100.0% 100.0% 100.0% 100.0% 100.0% 100.0% 100.0% 100.0% Average No. of Days Median No. of Days *Column percentages may not total 100% due to rounding. Sources: U.S. Department of Commerce, NTTO, Survey of International Air Travelers, CIC Research, Inc., and Visit California. 23
57 (This page was intentionally left blank) 24
58 Table 12 MEANS OF BOOKING AIR TRIP AND LODGING OVERSEAS AND MEXICAN VISITORS TO CALIFORNIA (2013) In 2013, 31% of overseas visitors to California used a travel agent to make airline reservations. This was followed by 28% who made airline reservations directly with the airline and 24% who made reservations via an Internet booking service. These results are almost unchanged from the previous year. Visitors from Australia reported the highest use of travel agents in booking their air trip (58%). Visitors from Mexico (air) as well as the UK reported the highest use of booking directly with the airline (42% and 41% respectively), while visitors from Mexico (air) (40%), followed by Brazil (32%), Germany and China (30% each) reported the highest use of an Internet booking service to make airline reservations. In comparison, when making lodging reservations, 31% of visitors to California made use of an Internet booking service, 19% contacted the lodging establishment directly, and 15% used a travel agency office. Visitors from Australia (39%) reported the highest proportion who booked their lodging via an Internet booking service. Visitors from Mexico (air) reported the highest proportion who booked directly with the lodging establishment (35%), while visitors from Australia (36%) reported the highest use of a travel agency office in booking their lodging. COUNTRY OF RESIDENCE OF VISITORS MEANS OF BOOKING AIR TRIP* TOTAL OVERSEAS U.K. GERMANY FRANCE ITALY AUSTRALIA CHINA w/o HK INDIA JAPAN SOUTH KOREA BRAZIL MEXICO (AIR) ESTIMATED TRAVELERS 6,609, , , , , , , , , , , ,000 (Number of Respondents) (6,683) (587) (456) (284) (148) (364) (460) (231) (1,111) (368) (178) (119) Travel Agency Office 30.8% 17.3% 33.3% 21.7% 34.1% 58.2% 21.2% 30.8% 39.5% 25.4% 30.7% 22.0% Directly with the Airline Internet Booking Service Corporate Travel Dept Tour Operator/Travel Club Other TOTAL 100.0% 100.0% 100.0% 100.0% 100.0% 100.0% 100.0% 100.0% 100.0% 100.0% 100.0% 100.0% MEANS OF BOOKING LODGING (Number of Respondents) (6,324) (576) (436) (265) (136) (353) (433) (213) (1,059) (342) (171) (110) Yes, Booked by** 71.2% 75.5% 68.0% 66.8% 69.5% 88.6% 77.0% 51.9% 78.1% 61.1% 72.5% 63.1% Internet Booking Service 30.5% 26.9% 32.2% 30.8% 28.5% 39.0% 34.6% 10.3% 23.0% 28.5% 34.0% 22.6% The Lodging Establish Travel Agency Office Corporate Travel Dept Tour Operator/Travel Club Other No 28.8% 24.5% 32.0% 33.2% 30.5% 11.4% 23.0% 48.1% 21.9% 38.9% 27.5% 36.9% *Column percentages may not total to 100% due to rounding. ** Multiple Response. Percentages based on total number of respondents. Sources: U.S. Department of Commerce, NTTO, Survey of International Air Travelers, CIC Research, Inc., and Visit California. 25
 Airline Online Travel Agency Personal Recommendation Travel Agency Office Travel Guide Corporate Travel Department National/State/City Travel Office Tour Operator/Travel Club Other 14.")
59 Figure 10 TRAVEL INFORMATION SOURCES OVERSEAS VISITORS TO CALIFORNIA / U.S. (2013) Airline Online Travel Agency Personal Recommendation Travel Agency Office Travel Guide Corporate Travel Department National/State/City Travel Office Tour Operator/Travel Club Other 14.5% 12.4% 14.3% 12.8% 8.0% 9.6% 8.8% 8.5% 5.2% 5.1% 30.6% 30.5% 25.8% 24.1% 25.8% 23.9% 42.6% 43.1% California Visitors U.S. Visitors Source: U.S. Department of Commerce, NTTO, Survey of International Air Travelers, 2013 CIC Research, Inc. 26
60 Table 13 U.S. TRIP INFORMATION SOURCES OVERSEAS AND MEXICAN VISITORS TO CALIFORNIA (2013) Trip information sources used by overseas travelers to California in 2013 to plan their trip, consisted of calling the airlines directly (43%), use of an online travel agency (31%), followed by a personal recommendation and a travel agency office (26% each). Use of a travel guide (15%) and corporate travel department (14%) rounded out the top information sources. These results are very similar to those from the previous year. Travelers from the U.K., Mexico (air), and Brazil (56% 51%, and 50% respectively) reported the highest use of calling the airline directly. The use of an online travel agency as an information source was indicated by the highest proportion of visitors from Mexico (air), Italy, and Germany (44%, 41%, and 41% respectively). Use of a personal recommendation as a source of trip information was greatest among visitors from Brazil (50%), while use of a travel agency office was greatest among visitors from Australia (52%). INFORMATION SOURCES* COUNTRY OF RESIDENCE OF VISITORS TOTAL OVERSEAS U.K. GERMANY FRANCE ITALY AUSTRALIA CHINA w/o HK INDIA JAPAN ESTIMATED TRAVELERS 6,609, , , , , , , , , , , ,000 (Number of Respondents) (6,616) (583) (457) (280) (143) (365) (450) (226) (1,097) (361) (177) (119) Airline 42.6% 55.5% 36.9% 37.9% 34.6% 34.1% 34.6% 38.3% 43.2% 36.1% 50.0% 50.7% Online Travel Agency Personal Recommendation Travel Agency Office Travel Guide Corporate Travel Dept Government Travel Office Tour Operator/Travel Club SOUTH KOREA BRAZIL MEXICO (AIR) *Column percentages may total more than 100% due to multiple responses. Sources: U.S. Department of Commerce, NTTO, Survey of International Air Travelers, CIC Research, Inc., and Visit California. 27
61 (This page was intentionally left blank) 28
62 Table 14 AIRLINE TICKET CLASS AND PREPAID TRIP PACKAGE OVERSEAS AND MEXICAN VISITORS TO CALIFORNIA (2013) More than three-quarters (78%) of overseas visitors to California in 2013 used a paid ticket, while 6% used a discount/group fare, and almost 4% used a frequent flier award ticket. Visitors from India, the U.K., Italy, and Australia reported the highest use of a paid fare (86%, 85%, 85%, and 85% respectively), while visitors from Australia and Brazil reported the highest use of a frequent flier award ticket (6% each), and visitors from China and South Korea reported the highest use of a discount/group fare (18% and 17% respectively). Fifteen percent (15%) of overseas travelers to California traveled with a prepaid inclusive tour package, where airfare, lodging, ground transportation, or other items were prepaid prior to departure. In order to qualify as a package, in the 2013 survey, both prepaid airfare and prepaid accommodations needed to be included at a minimum. Visitors from France, China and Italy took the greatest advantage of all inclusive tour packages (24%, 23% and 23% respectively). On the other hand, visitors from Mexico (air) and India used packages the least (5% and 8% respectively). TYPE OF AIRLINE TICKET* COUNTRY OF RESIDENCE OF VISITORS TOTAL OVERSEAS U.K. GERMANY FRANCE ITALY AUSTRALIA CHINA w/o HK INDIA JAPAN ESTIMATED TRAVELERS 6,609, , , , , , , , , , , ,000 (Number of Respondents) (6,051) (533) (407) (256) (136) (328) (405) (207) (1,042) (345) (162) (100) Paid Ticket 78.1% 85.2% 79.1% 77.8% 84.9% 84.5% 72.0% 85.8% 69.0% 59.7% 71.6% 49.9% Discount/Group Fare Frequent Flyer Award Ticket Paid Upgrade Non-Revenue Frequent Flyer Upgrade Don't Know USE OF PREPAID PACKAGE (Number of Respondents) (6,517) (576) (444) (278) (142) (360) (446) (211) (1,106) (359) (172) (111) YES** 14.6% 14.4% 10.1% 23.8% 22.8% 16.7% 23.2% 7.8% 16.0% 18.3% 10.2% 5.1% Bus/Coach Attract./Events/Entertain Meals Guided Tours Tour Guide for Entire Trip Rental Car Airfare & Accom. Only Cruise Recreation Rail Tickets NO 85.4% 85.6% 89.9% 76.2% 77.2% 83.3% 76.8% 92.2% 84.0% 81.7% 89.8% 94.9% *Column percentages may not total 100% due to multiple responses. **Multiple response. Includes all package combinations. Each category not mutually exclusive. Sources: U.S. Department of Commerce, NTTO, Survey of International Air Travelers, CIC Research, Inc., and Visit California. 29 SOUTH KOREA BRAZIL MEXICO (AIR)

63 Figure 11 TRAVEL PARTY SIZE OVERSEAS VISITORS TO CALIFORNIA / U.S. (2013) 100% 91.1% 90.2% California Visitors Avg. Party Size: % U.S. Visitors Avg. Party Size: % 40% 20% 8.9% 9.8% 0% Adults Only Adults and Children Source: U.S. Department of Commerce, NTTO, Survey of International Air Travelers, 2013 CIC Research, Inc. 30
64 Table 15 TRAVEL PARTY SIZE OVERSEAS AND MEXICAN VISITORS TO CALIFORNIA (2013) The mean total party size for all overseas travelers in 2013 was 1.6 persons. Overall, 91% of overseas travel parties were adults only and nine percent were adults traveling with children. The greatest proportion of visitors who reported traveling with children was from China (16%) and France (14%), followed by South Korea, Mexico (air) and Brazil (12% each). COUNTRY OF RESIDENCE OF VISITORS TRAVEL PARTY SIZE TOTAL OVERSEAS U.K. GERMANY FRANCE ITALY AUSTRALIA CHINA w/o HK INDIA JAPAN SOUTH KOREA BRAZIL MEXICO (AIR) ESTIMATED TRAVELERS 6,609, , , , , , , , , , , ,000 (Number of Respondents) (6,716) (591) (461) (284) (148) (365) (463) (231) (1,124) (367) (178) (118) Adults Only 91.1% 92.8% 92.8% 86.2% 91.6% 89.7% 84.0% 96.9% 94.6% 87.8% 88.4% 87.7% Adults and Children TOTAL 100.0% 100.0% 100.0% 100.0% 100.0% 100.0% 100.0% 100.0% 100.0% 100.0% 100.0% 100.0% Average Total Party Size Median Total Party Size ADULTS ONLY (Number of Respondents) (5,909) (533) (415) (228) (133) (315) (366) (220) (1,057) (316) (152) (103) Average Adult Party Size Median Adult Party Size ADULTS AND CHILDREN (Number of Respondents) (807) (58)* (46)* (56)* (15)* (50)* (97)* (11)* (67)* (51)* (26)* (15)* Average Party Size Median Party Size *Caution - Small sample size. Sources: U.S. Department of Commerce, NTTO, Survey of International Air Travelers, CIC Research, Inc., and Visit California. 31


65 Figure 12 GENDER OF OVERSEAS VISITORS OVERSEAS VISITORS TO CALIFORNIA / U.S. (2013) 70% 60% 58.1% 55.5% California Visitors U.S. Visitors 50% 41.9% 44.5% 40% 30% 20% 10% 0% Male Adults Female Adults Source: U.S. Department of Commerce, NTTO, Survey of International Air Travelers, 2013 CIC Research, Inc. 32
66 Table 16 GENDER AND AGE OVERSEAS AND MEXICAN VISITORS TO CALIFORNIA (2013) Almost six in ten (58%) overseas travelers to California were adult males, and four in ten (42%) were adult females. The average age of traveling adult males was 42 years, versus 39 years for traveling adult females. COUNTRY OF RESIDENCE OF VISITORS GENDER AND AGE OF VISITOR* TOTAL OVERSEAS U.K. GERMANY FRANCE ITALY AUSTRALIA CHINA w/o HK INDIA JAPAN SOUTH KOREA BRAZIL MEXICO (AIR) ESTIMATED TRAVELERS 6,609, , , , , , , , , , , ,000 (Number of Respondents) (6,219) (536) (411) (268) (139) (337) (425) (209) (1,065) (352) (165) (106) MALE ADULTS 58.1% 60.9% 54.2% 49.4% 60.9% 51.3% 56.1% 77.1% 76.0% 54.4% 50.4% 48.6% Years Years Years Years Average Male Age Median Male Age FEMALE ADULTS 41.9% 39.1% 45.8% 50.6% 39.1% 48.7% 43.9% 22.9% 24.0% 45.6% 49.6% 51.4% Years Years Years Years Average Female Age Median Female Age *Column percentages may not total to 100% due to rounding. Sources: U.S. Department of Commerce, NTTO, Survey of International Air Travelers, CIC Research, Inc., and Visit California. 33

67 Figure 13 INCOME PROFILE OF OVERSEAS VISITORS OVERSEAS VISITORS TO CALIFORNIA / U.S. (2013) <$20K 14.6% 17.1% $20 - $59K 27.7% 27.0% $60 - $99K 21.9% 21.7% $100 - $139K 13.6% 14.5% $140 - $179K 7.4% 6.9% California Visitors Avg. Income = $100,900 >$180K 4.8% 14.8% U.S. Visitors Avg. Income = $94,800 Source: U.S. Department of Commerce, NTTO, Survey of International Air Travelers, 2013 CIC Research, Inc. 34
68 Table 17 ANNUAL HOUSEHOLD INCOME OVERSEAS AND MEXICAN VISITORS TO CALIFORNIA (2013) The mean household income for overseas visitors to California in 2013 was $100,900, down from $102,600 in 2012 and up from $96,500 in During 2013 visitors from Japan ($135,100), the U.K. ($131,400), and Australia ($125,400) reported the highest annual average income. Visitors from India ($53,500), China ($63,400), and Mexico (air) ($65,200) reported the lowest annual household income. COUNTRY OF RESIDENCE OF VISITORS ANNUAL HOUSEHOLD INCOME* TOTAL OVERSEAS U.K. GERMANY FRANCE ITALY AUSTRALIA CHINA w/o HK INDIA JAPAN SOUTH KOREA BRAZIL MEXICO (AIR) ESTIMATED TRAVELERS 6,609, , , , , , , , , , , ,000 (NUMBER OF RESPONDENTS) (4,239) (333) (218) (156) (68)* (236) (324) (136) (792) (257) (109) (73)* Under $20, % 2.6% 14.9% 19.2% 10.4% 5.6% 19.3% 39.5% 4.5% 18.0% 25.4% 42.4% $20,000 - $59, $60,000 - $99, $100,000 - $139, $140,000 - $179, $180,000 and over TOTAL 100% 100.0% 100.0% 100.0% 100.0% 100.0% 100.0% 100.0% 100.0% 100.0% 100.0% 100.0% Average Annual Income $100,900 $131,400 $104,000 $75,300 $102,900 $125,400 $63,400 $53,500 $135,100 $78,200 $110,500 $65,200 Median Annual Income $72,000 $96,600 $81,400 $61,600 $66,300 $100,000 $47,700 $25,600 $101,500 $56,400 $50,000 $32,200 *Column percentages may not total to 100% due to rounding. **Caution - Small sample size. Sources: U.S. Department of Commerce, NTTO, Survey of International Air Travelers, CIC Research, Inc., and Visit California. 35

69 Figure 14 TOTAL NIGHTS IN THE U.S. OVERSEAS VISITORS TO CALIFORNIA / U.S. (2013) 1 to 3 6.2% 11.7% 4 to % 31.6% 8 to % 29.6% 15 to % 21.1% 22 to to % 3.7% 5.2% 3.1% 10.0% 7.3% California Visitors Median = 14 Nights in U.S. Avg. = 23 Nights in U.S. U.S. Visitors Median = 10 Nights in U.S. Avg. = 20 Nights in U.S. Source: U.S. Department of Commerce, NTTO, Survey of International Air Travelers, 2013 CIC Research, Inc. 36
70 Table 18 NIGHTS AWAY FROM HOME / FIRST INTERNATIONAL TRIP OVERSEAS AND MEXICAN VISITORS TO CALIFORNIA (2013) Overseas visitors to California in 2013 stayed an average of 23 nights in the U.S. and 14 nights in California (up from 23 nights and 11 nights in 2012). Nationalities varied in their average length of U.S. trip. Similar to results from 2012, visitors from Japan and Mexico (air) spent the least amount of time in the U.S. (10 nights and 15 nights respectively), while visitors from Japan and South Korea spent the least amount of time in California (4 nights and 5 nights respectively). Visitors from India spent the most time in the U.S. (38 nights), as well as in California (21 nights). More than one-quarter (28%) of overseas visitors to California were on their first international trip. Visitors from China (51%) followed by visitors from Australia (44%) and South Korea (41%) had the highest proportion traveling internationally for the first time. COUNTRY OF RESIDENCE OF VISITORS NIGHTS IN U.S. TOTAL OVERSEAS U.K. GERMANY FRANCE ITALY AUSTRALIA CHINA w/o HK INDIA JAPAN SOUTH KOREA BRAZIL MEXICO (AIR) ESTIMATED TRAVELERS 6,609, , , , , , , , , , , ,000 (Number of Respondents) (6,700) (586) (458) (284) (148) (365) (464) (225) (1,126) (369) (178) (117) Average No. Nights Median No. Nights NIGHTS IN CALIFORNIA (Number of Respondents) (5,792) (522) (386) (255) (131) (339) (377) (175) (1,036) (311) (161) (87)* Average Nts. in Dest Median Nts. in Dest FIRST INTERNATIONAL TRIP (Number of Respondents) (5,920) (530) (397) (257) (130) (331) (395) (201) (999) (318) (163) (97)* Yes 27.9% 14.5% 24.8% 33.5% 23.6% 44.4% 51.2% 26.7% 9.5% 41.1% 22.5% 19.7% No *Caution - Small sample size. Sources: U.S. Department of Commerce, NTTO, Survey of International Air Travelers, CIC Research, Inc., and Visit California. 37

71 Figure 15 PORT OF ENTRY OF OVERSEAS VISITORS OVERSEAS VISITORS TO CALIFORNIA (2013) Los Angeles, CA San Francisco, CA New York, NY Other Chicago, IL Miami, FL Las Vegas, NV Atlanta, GA Seattle, WA Newark, NJ Dallas/Ft. Worth, TX 5.3% 6.9% 3.1% 3.5% 1.9% 1.5% 1.5% 1.9% 1.0% 25.9% 43.3% Source: U.S. Department of Commerce, NTTO, Survey of International Air Travelers, 2013 CIC Research, Inc. 38
72 Table 19 PORT OF ENTRY OVERSEAS AND MEXICAN VISITORS TO CALIFORNIA (2013) A high ratio of California ports of entry is expected for overseas visitors to the State. California ports of entry in 2013 (69%) were reported either through Los Angeles (43%) or San Francisco (26%). These results were the same as in 2012 (69%) and similar to 2011 (67%). PORT OF ENTRY* COUNTRY OF RESIDENCE OF VISITORS TOTAL OVERSEAS U.K. GERMANY FRANCE ITALY AUSTRALIA CHINA w/o HK INDIA JAPAN ESTIMATED TRAVELERS 6,609, , , , , , , , , , , ,000 (Number of Respondents) (6,744) (591) (462) (285) (149) (365) (465) (231) (1,127) (369) (179) (121) Atlanta, GA 1.5% 0.9% 3.6% 1.6% 1.4% % % 0.6% Chicago, IL % 3.3% % 0.2% Dallas/Ft. Worth, TX Detroit, MI Honolulu, HI Houston, TX Las Vegas, NV Los Angeles, CA Miami, FL New York, NY Newark, NJ Orlando, FL San Francisco, CA Seattle, WA Washington, DC Other TOTAL 100.0% 100.0% 100.0% 100.0% 100.0% 100.0% 100.0% 100.0% 100.0% 100.0% 100.0% 100.0% SOUTH KOREA BRAZIL MEXICO (AIR) *Column percentages may not total to 100% due to rounding. Sources: U.S. Department of Commerce, NTTO, Survey of International Air Travelers, CIC Research, Inc., and Visit California. 39

73 Figure 16 OVERNIGHT ACCOMMODATIONS OVERSEAS VISITORS TO CALIFORNIA / U.S. (2013) 76.4% 78.4% California Visitors U.S. Visitors 27.0% 29.9% 5.7% 4.2% Hotel / Motel Private Home Other Source: U.S. Department of Commerce, NTTO, Survey of International Air Travelers, 2013 CIC Research, Inc. 40
74 Table 20 OVERNIGHT ACCOMMODATIONS OVERSEAS AND MEXICAN VISITORS TO CALIFORNIA (2013) Approximately three-fourths (76%) of California visitors chose to stay in a hotel/motel during their stay this year, compared with 78% in Visitors from Japan and Australia (88% and 86% respectively), followed by France and Brazil (84% and 81% respectively) reported the highest use of hotels/ motels. Visitors from Mexico (air) reported the lowest hotel/motel usage (59%). The highest use of private homes was found among visitors from Mexico (air) (44%), followed by India (39%). COUNTRY OF RESIDENCE OF VISITORS TYPE OF ACCOMMODATIONS* TOTAL OVERSEAS U.K. GERMANY FRANCE ITALY AUSTRALIA CHINA w/o HK INDIA JAPAN SOUTH KOREA BRAZIL MEXICO (AIR) ESTIMATED TRAVELERS 6,609, , , , , , , , , , , ,000 (Number of Respondents) (5,350) (504) (361) (237) (120) (317) (306) (162) (935) (289) (157) (87)** Hotel / Motel 76.4% 78.5% 70.5% 84.0% 77.0% 86.1% 68.6% 66.1% 87.9% 71.3% 80.9% 59.3% Average Nights in Dest Median Nights in Dest Private Home 27.0% 28.0% 30.8% 27.2% 23.0% 13.0% 24.2% 39.1% 14.6% 29.8% 25.1% 43.6% Average Nights in Dest Median Nights in Dest Other 5.7% 7.7% 12.1% 5.3% 8.4% 5.3% 12.6% 4.4% 2.7% 3.2% 1.7% 1.4% *Column percentages may not total to 100% due to multiple responses. Sources: U.S. Department of Commerce, NTTO, Survey of International Air Travelers, CIC Research, Inc., and Visit California. 41

 Air Travel between U.S. Cities Rented Auto Auto, Private or Company City Subway/Tram/Bus Taxicab/Limousine Bus")
75 Figure 17 TRANSPORTATION IN THE U.S. OVERSEAS VISITORS TO CALIFORNIA / U.S. (2013) Air Travel between U.S. Cities Rented Auto Auto, Private or Company City Subway/Tram/Bus Taxicab/Limousine Bus between Cities Ferry/River Taxi/Srt Scenic Cruise Railroad between Cities Rented Bicycle/Motorcycle/ Cruise Ship/River Boat 1+ Nights Motor Home/Camper 11.6% 10.2% 7.7% 6.7% 5.4% 2.9% 4.2% 4.2% 1.8% 0.9% 18.2% 18.2% 32.7% 33.3% 37.1% 31.3% 33.0% 32.3% 32.8% 34.8% California Visitors U.S. Visitors 43.0% 45.5% Source: U.S. Department of Commerce, NTTO, Survey of International Air Travelers, 2013 CIC Research, Inc. 42
76 Table 21 TRANSPORTATION IN THE U.S OVERSEAS AND MEXICAN VISITORS TO CALIFORNIA (2013) Transportation in the U.S. used by visitors to California in 2013 was predominantly airlines (46%), rented autos (43%), company/private auto (37%), city subway/tram/bus (33%), and taxi/cab/limousines (33%). Visitors from Australia made the highest use of airlines (80%) as well as city subway/tram/bus (53%) and taxi/cab/limousines (58%) to travel around the U.S. Visitors to California from Germany and Brazil (63%, and 61% respectively) made the highest use of a rented auto, while the highest use of a company or private auto was among visitors from Mexico (air) (51%). TRANSPORTATION IN U.S.* COUNTRY OF RESIDENCE OF VISITORS TOTAL OVERSEAS U.K. GERMANY FRANCE ITALY AUSTRALIA CHINA w/o HK INDIA JAPAN ESTIMATED TRAVELERS 6,609, , , , , , , , , , , ,000 (Number of Respondents) (5,995) (532) (430) (262) (137) (331) (406) (194) (1,009) (328) (167) (91)** Air Travel btw. U.S. Cities 45.5% 31.8% 44.3% 32.1% 41.2% 79.6% 43.7% 49.6% 33.2% 32.5% 62.7% 21.7% Rented Auto Company or Private Auto City Subway/Tram/Bus Taxi/Cab/Limousine Bus between Cities Ferry/River Taxi/Short Scenic Cruise SOUTH KOREA BRAZIL Railroad between Cities Rented Bicycle /Motorcycle/Moped Cruise Ship/River Boat 1+ Nights Motor Home/Camper MEXICO (AIR) *Column percentages may not total to 100% due to multiple responses. **Caution - Small sample size. Sources: U.S. Department of Commerce, NTTO, Survey of International Air Travelers, CIC Research, Inc., and Visit California. 43


77 Figure 18 PAYMENT METHOD FOR TRIP EXPENSES OVERSEAS VISITORS TO CALIFORNIA / U.S. (2013) Purchases Using Credit Card 41.5% 44.1% Cash from Home/Travelers Checks 26.0% 31.3% Cash Adv./Wdrawal Using Credit Card Cash Adv./Wdrawal Using Debit Card 6.6% 5.7% 17.5% 15.8% California Visitors U.S. Visitors Purchases Using Debit Card 5.7% 5.7% Source: U.S. Department of Commerce, NTTO, Survey of International Air Travelers, 2013 CIC Research, Inc. 44
78 Table 22 PAYMENT METHODS FOR TRIP EXPENSES OVERSEAS AND MEXICAN VISITORS TO CALIFORNIA (2013) The question concerning payment methods for trip expenses used by visitors to California was changed in 2012 and is therefore not comparable in years prior to Similar to results in 2012, purchases in 2013 using a credit card (44%) followed by cash from home/travelers checks (26%) were the predominant forms of trip expense payment methods. These were followed by cash advance/withdrawal using a credit card (18%). Visitors to California in 2013 from China (56%) followed by visitors from Italy (55%), Germany and Japan (54% each) were most likely to use a credit card as a payment method. On the other hand, cash from home/travelers checks was most likely to be used by visitors from South Korea (44%). Visitors from South Korea, France, and Germany had the highest propensity to use a cash advance/withdrawal using a credit card (24%, 23% and 23% respectively), while visitors from Australia (16%) and India (15%) had the highest propensity to use a cash advance/withdrawal using a debit card. Visitors from Australia and Brazil were the most likely to make purchases using a debit card (15% each). TRIP EXPENSES PAYMENT METHOD* COUNTRY OF RESIDENCE OF VISITORS TOTAL OVERSEAS U.K. GERMANY FRANCE ITALY AUSTRALIA CHINA w/o HK INDIA JAPAN ESTIMATED TRAVELERS 6,609, , , , , , , , , , , ,000 (Number of Respondents) (4,962) (415) (321) (229) (100) (268) (322) (134) (968) (279) (116) (83)** Purchases Using Credit Card 44.1% 37.4% 54.4% 35.1% 55.4% 34.5% 56.0% 41.4% 53.8% 28.9% 44.3% 49.3% Cash from Home/Travelers Checks Cash Adv./Wdrawal Using Credit Card Cash Adv./Wdrawal Using Debit Card Purchases Using Debit Card SOUTH KOREA BRAZIL MEXICO (AIR) *Column percentages may not total to 100% due to rounding. **Caution - Small sample size. Sources: U.S. Department of Commerce, NTTO, Survey of International Air Travelers, CIC Research, Inc., and Visit California. 45

79 Figure 19 TRIP EXPENDITURES OVERSEAS VISITORS TO CALIFORNIA / U.S. (2013) California Visitors Expenditure in U.S. $1,732 $2,270 U.S. Visitors International Airfare $1,558 $1,885 Inclusive Tour Price $2,365 $3,670 Total Trip $3,435 $4,415 Source: U.S. Department of Commerce, NTTO, Survey of International Air Travelers, 2013 CIC Research, Inc. 46
80 Table 23 TRIP EXPENDITURES OVERSEAS AND MEXICAN VISITORS TO CALIFORNIA (2013) Overseas visitors to California in 2013 spent an estimated $1,940 per capita in California. Total spending in California by the 6.6 million overseas visitors in 2013 was an estimated $12.8 billion in the state out of their total spending in the U.S. of $23.6 billion. Visitors from China reported the highest average spending in California of $2,377 per visitor. The lowest average spending $994 was reported by visitors to California from Mexico. COUNTRY OF RESIDENCE OF VISITORS VISITOR SPENDING* TOTAL OVERSEAS U.K. GERMANY FRANCE ITALY AUSTRALIA CHINA w/o HK INDIA JAPAN TOTAL VISITORS TO THE U.S. 32,038,000 3,835,268 1,916,471 1,504, ,883 1,205,060 1,806, ,156 3,730,287 1,359,924 2,060,291 2,218,000 Total Spending in the U.S. ($ Mil.) $106,772 $9,212 $5,059 $4,373 $2,886 $5,017 $7,643 $3,735 $11,612 $4,685 $7,038 $3,168 Spending in the U.S. per Visitor $3,333 $2,402 $2,640 $2,907 $3,440 $4,163 $4,231 $4,347 $3,113 $3,445 $3,416 $1,428 SOUTH KOREA BRAZIL MEXICO (AIR) CALIFORNIA VISITORS SPENDING AND NIGHTS ESTIMATED VISITORS TO CA 6,609, , , , , , , , , , , ,000 (Number of Respondents) (2,736) (264) (180) (117) (64)** (173) (125) (60)** (487) (156) (70)** (48)** Total Spending in CA ($ Mil.) $12,820 $867 $703 $673 $312 $990 $1,948 $446 $1,052 $909 $435 $512 Est. Spending in CA per Visitor $1,940 $1,329 $1,670 $1,734 $1,987 $1,791 $2,377 $1,859 $1,964 $2,335 $2,106 $994 Est. Spending in CA per Day $159 $129 $148 $189 $191 $166 $165 $90 $231 $234 $140 $134 Average Nights in CA Median Nights in CA SPENDING IN THE U.S. BY VISITORS TO CA* Total Spending in U.S. ($ Mil.) $23,643 $1,346 $1,643 $1,613 $504 $2,283 $3,376 $826 $1,288 $1,944 $732 $1,024 Spending in U.S. per CA Visitor $3,577 $2,065 $3,902 $4,148 $3,210 $4,129 $4,127 $3,440 $2,403 $4,997 $3,553 $1,988 Nights in U.S.-- CA Visitors SPENDING IN THE U.S. BY CATEGORY (%) Lodging in U.S. 29.1% 35.5% 33.2% 23.3% 36.4% 26.1% 19.2% 44.7% 48.4% 23.9% 27.9% 31.7% Air Transport in U.S. 6.9% 3.0% 6.0% 6.5% 4.3% 8.8% 11.8% 7.0% 4.3% 5.0% 3.6% 9.3% Entertainment 12.2% 13.9% 13.7% 16.4% 12.6% 16.9% 8.6% 8.7% 7.1% 12.2% 13.4% 9.8% Food and Beverages 17.8% 23.9% 21.3% 24.3% 24.7% 21.6% 11.3% 13.9% 17.8% 19.2% 12.9% 16.8% Ground Trans. in U.S. 5.6% 6.1% 6.6% 6.3% 5.4% 3.8% 7.2% 10.1% 5.7% 6.9% 7.5% 3.4% Gifts and Souvenirs 21.9% 14.0% 13.9% 18.3% 13.4% 19.7% 37.2% 12.8% 13.2% 23.4% 27.8% 23.4% Other 6.3% 3.5% 4.8% 5.1% 3.0% 3.0% 4.7% 2.7% 3.3% 9.5% 6.9% 4.9% * Spending estimates were based on SIAT survey data and revised by Tourism Economics for Visit California, August **Caution - Small sample size. Sources: U.S. Department of Commerce, NTTO, Survey of International Air Travelers, CIC Research, Inc. and Tourism Economics 47
81 (This page was intentionally left blank) 48
82 Table 24 EXPENDITURES OVERSEAS VISITORS WHO REPORTED ONLY CALIFORNIA DESTINATIONS* (2013) Almost half (45%) of overseas visitors to California in 2013 did not visit any other state in the U.S. while on their international trip. Visitors who only visited California during their U.S. trip reported spending $2,177 per capita in California. This was higher than the average spending in California of $1,940 reported for All Overseas visitors to California. As should be expected the California-only visitors reported longer lengths of stay in California (16.5 days v days). Average daily spending by California only visitors was $132 per day, which was lower than the average daily spending of $159 per day reported for all overseas visitors to California. AVERAGE PER VISITOR TRIP EXPENDITURES OVERSEAS TRAVELERS WHO ONLY VISITED CALIFORNIA ON THEIR U.S. TRIP ALL OVERSEAS VISITORS TO CALIFORNIA (NUMBER OF RESPONDENTS) (1,277) (2,736) SPENDING IN CALIFORNIA (est.)** $2,177 $1,940 PER DAY $132 $159 SPENDING IN THE U.S. BY VISITORS TO CALIFORNIA (%) AIR TRANSPORT IN U.S. 4% 29% GROUND TRANSPORT IN U.S. 5% 7% LODGING 35% 12% FOOD, BEVERAGES 19% 18% GIFTS, SOUVENIRS 22% 6% ENTERTAINMENT 10% 22% OTHER 6% 6% AVERAGE NIGHTS IN CALIFORNIA *Overseas visitors could report up to eight U.S. destinations. ** Spending estimates were based on SIAT survey data and revised by Tourism Economics for Visit California, August Sources: U.S. Department of Commerce, NTTO, Survey of International Air Travelers, CIC Research, Inc. and Tourism Economics. 49
83 (This page was intentionally left blank) 50

84 OVERSEAS AND MEXICAN LEISURE VISITORS TO CALIFORNIA* (2013) * Leisure visitors were defined as those visitors whose main purpose of trip was vacation/holidays or visiting friends and relatives. 51
85 (This page was intentionally left blank) 52
86 Table 25 RESIDENCE OF OVERSEAS AND MEXICAN LEISURE VISITORS TO THE UNITED STATES AND CALIFORNIA (2013) UNITED STATES CALIFORNIA ESTIMATED ESTIMATED CALIFORNIA LEISURE 2012/2013 LEISURE 2012/2013 SHARE OF VISITORS PERCENT VISITORS PERCENT VISITORS FROM RESIDENCE OF VISITORS TO THE U.S. CHANGE TO CALIFORNIA CHANGE* THIS COUNTRY EUROPE 9,851, % 1,789, % 18.2% W. EUROPE 9,254, % 1,688, % 18.2% Austria 136, % 31, % 22.8% Belgium 190, % 33, % 17.4% Denmark 197, % 55, % 27.9% France 1,181, % 317, % 26.8% Germany 1,391, % 311, % 22.4% Ireland 255, % 69, % 27.1% Italy 613, % 122, % 19.9% Netherlands 444, % 81, % 18.2% Norway 197, % 33, % 16.8% Spain 483, % 53, % 11.0% Sweden 362, % 64, % 17.7% Switzerland 375, % 86, % 22.9% United Kingdom 3,118, % 475, % 15.2% E. EUROPE 565, % 100, % 17.7% CARIBBEAN 753, % 7, % 0.9% Note: -- Represents a sample size of less than 50 visitors to California who gave a main purpose of trip, or a response of less than 0.05%. Countries and World Region visitor volumes are independently estimated and may not sum to total visitors. * Large variances may occur due to small sample sizes. 53
87 (This page was intentionally left blank) 54
88 Table 25 (Cont.) UNITED STATES CALIFORNIA ESTIMATED ESTIMATED CALIFORNIA LEISURE 2012/2013 LEISURE 2012/2013 SHARE OF VISITORS PERCENT VISITORS PERCENT VISITORS FROM RESIDENCE OF VISITORS TO THE U.S. CHANGE TO CALIFORNIA CHANGE* THIS COUNTRY SOUTH AMERICA 4,180, % 347, % 8.3% Argentina 582, % 40, % 6.9% Brazil 1,652, % 160, % 9.7% Chile 165, % 17, % 10.3% Colombia 551, % 43, % 7.8% Ecuador 229, % 4, % 1.7% Peru 183, % 12, % 6.6% Venezuela 705, % 68, % 9.6% Other South America 113, % 3, % 2.7% CENTRAL AMERICA (Excluding Mexico) 581, % 45, % 7.7% Costa Rica 135, % 3, % 2.2% Guatemala 137, % 23, % 16.8% Panama 103, % 3, % 2.9% Other Central America 206, % 16, % 7.8% AFRICA 260, % 20, % 7.7% South Africa, Rep. of 53, % 11, % 20.8% Other Africa 207, % 9, % 4.3% OCEANIA 1,242, % 610, % 49.1% Australia 1,054, % 487, % 46.2% New Zealand 174, % 100, % 57.5% Note: -- Represents a sample size of less than 50 visitors to California who gave a main purpose of trip, or a response of less than 0.05%. Countries and World Region visitor volumes are independently estimated and may not sum to total visitors. * Large variances may occur due to small sample sizes. 55
89 (This page was intentionally left blank) 56
90 Table 25 (Cont.) UNITED STATES CALIFORNIA ESTIMATED ESTIMATED CALIFORNIA LEISURE 2012/2013 LEISURE 2012/2013 SHARE OF VISITORS PERCENT VISITORS PERCENT VISITORS FROM RESIDENCE OF VISITORS TO THE U.S. CHANGE TO CALIFORNIA CHANGE* THIS COUNTRY ASIA 6,032, % 1,216, % 20.2% Hong Kong 66, % 34, % 51.5% India 363, % 102, % 28.1% Indonesia 52, % 24, % 46.2% Japan 2,884, % 209, % 7.2% Korea, South 957, % 250, % 26.1% Malaysia 45, % 26, % 57.8% People's Republic of China 956, % 485, % 50.7% Philippines 155, % 81, % 52.3% Republic of China (Taiwan) 243, % 107, % 44.0% Singapore 63, % 32, % 50.8% Thailand 44, % 20, % 45.5% MIDDLE EAST 671, % 161, % 24.0% Israel 204, % 38, % 18.6% Saudi Arabia 150, % 39, % 26.0% Turkey 98, % 24, % 24.5% Other Middle East 219, % 60, % 27.4% Total Overseas Leisure Visitors 23,675, % 4,508, % 19.0% (Number of Respondents) (24,912) (3,823) Mexico (Air Travelers Only) 1,519, % 391, % 25.7% Note: -- Represents a sample size of less than 50 visitors to California who gave a main purpose of trip, or a response of less than 0.05%. Countries and World Region visitor volumes are independently estimated and may not sum to total visitors. Sources: U.S. Department of Commerce, NTTO, Survey of International Air Travelers, CIC Research, Inc., and Visit California. 57
91 (This page was intentionally left blank) 58
92 Table 26 MAIN DESTINATION BY STATE OVERSEAS AND MEXICAN LEISURE VISITORS TO CALIFORNIA (2013) California was the main U.S. state destination for almost three-quarters (73%) of overseas leisure travelers to California in 2013, similar to the proportion from previous years. The highest proportion of leisure travelers, with California as their main destination, was from Mexico (air) (87%), followed by Japan (86%), and France (80%). Australia once again reported the lowest proportion of leisure travelers with California as their main destination (34%). This result was down from 48% in COUNTRY OF RESIDENCE OF VISITORS MAIN DESTINATION* TOTAL OVERSEAS U.K. GERMANY FRANCE ITALY AUSTRALIA CHINA w/o HK INDIA JAPAN SOUTH KOREA BRAZIL MEXICO (AIR) ESTIMATED TRAVELERS 4,508, , , , , , , , , , , ,000 (Number of Respondents) (2,561) (312) (193) (136) (75)** (146) (102) (59)** (277) (141) (88)** (71)** California 73.1% 75.3% 74.2% 79.8% 70.1% 34.1% 72.4% 70.8% 85.7% 83.7% 70.2% 87.0% New York Nevada Hawaiian Islands Florida *Visitors may report only one destination States with less than one percent response were not listed. **Caution Small sample size Sources: U.S. Department of Commerce, NTTO, Survey of International Air Travelers, 2013 CIC Research, Inc. and the California Travel and Tourism Commission. 59
93 (This page was intentionally left blank) 60
94 Table 27 MAIN DESTINATION BY STATE OVERSEAS AND MEXICAN LEISURE VISITORS TO CALIFORNIA (2013) The most common Metropolitan Statistical Areas (MSAs) visited by overseas leisure travelers to California in 2013 were Los Angeles Long Beach (68%) and San Francisco (53%), followed by San Diego (14%), Anaheim (8%), Salinas (6%), and Riverside-San Bernardino (4%). MAIN DESTINATION* COUNTRY OF RESIDENCE OF VISITORS TOTAL OVERSEAS U.K. GERMANY FRANCE ITALY AUSTRALIA CHINA w/o HK INDIA JAPAN ESTIMATED TRAVELERS 4,508, , , , , , , , , , , ,000 (Number of Respondents) (3,700) (378) (293) (214) (104) (297) (240) (78) (368) (198) (109) (69) Los Angeles-Long Beach MSA 3,047, , , ,000 92, , ,000 52, , , , ,000 (Los Angeles County) 67.6% 60.2% 61.1% 72.5% 75.1% 72.4% 82.3% 51.3% 49.5% 73.2% 75.5% 49.2% SOUTH KOREA BRAZIL MEXICO (AIR) San Francisco MSA 2,376, , , ,000 81, , ,000 41,000 72, , ,000 69,000 (San Francisco-Marin-San Mateo Counties) 52.7% 52.1% 64.2% 74.8% 66.3% 45.7% 51.1% 39.8% 34.3% 49.7% 62.3% 17.6% San Diego MSA 618,000 85,000 59,000 45,000 9,000 59,000 52,000 16,000 27,000 10,000 24,000 46,000 (San Diego County) 13.7% 17.9% 19.1% 14.3% 7.6% 12.2% 10.7% 15.9% 13.0% 3.9% 15.2% 11.8% Anaheim-Santa Ana MSA 374,000 47,000 16,000 9,000 2, ,000 5,000 9,000 35,000 24,000 11,000 93,000 (Orange County) 8.3% 9.8% 5.0% 2.8% 1.7% 21.4% 1.0% 8.5% 16.7% 9.4% 7.1% 23.9% Salinas MSA 248,000 61,000 21,000 25,000 10,000 11,000 20,000-3,000 1,000 17,000 22,000 (Monterey County) 5.5% 12.9% 6.6% 7.8% 8.6% 2.3% 4.1% - 1.5% 0.3% 10.8% 5.7% Riverside-San Bernardino MSA 194,000 40,000 26,000 7,000 2,000 7,000 7,000 3,000 5,000 4,000 9,000 30,000 (Riverside-San Bernardino Counties) 4.3% 8.5% 8.3% 2.2% 1.8% 1.5% 1.4% 3.4% 2.2% 1.4% 5.6% 7.6% 61
95 (This page was intentionally left blank) 62
96 Table 27 (Cont.) COUNTRY OF RESIDENCE OF VISITORS MAIN DESTINATION* TOTAL OVERSEAS U.K. GERMANY FRANCE ITALY AUSTRALIA CHINA w/o HK INDIA JAPAN SOUTH KOREA BRAZIL MEXICO (AIR) ESTIMATED TRAVELERS 4,508, , , , , , , , , , , ,000 (Number of Respondents) (3,700) (378) (293) (214) (104) (297) (240) (78) (368) (198) (109) (69) Santa Barbara-Lompoc MSA 180,000 31,000 13,000 16,000 12,000 8,000 11,000 <1,000 4,000 1,000 18,000 9,000 (Santa Barbara County) 4.0% 6.6% 4.2% 4.9% 9.8% 1.7% 2.3% 0.6% 1.8% 0.3% 11.0% 2.2% Sacramento MSA 149,000 15,000 16,000 10,000 3,000 2,000 10,000 7,000 5,000 7,000 1,000 - (El Dorado-Placer- Sacramento-Yolo Counties) 3.3% 3.1% 5.1% 3.2% 2.7% 0.5% 2.1% 7.0% 2.6% 2.7% 0.8% - San Jose MSA 144,000 17,000 12,000 6,000 5,000 1,000 16,000 25,000 9,000 4,000 2,000 35,000 (Santa Clara County) 3.2% 3.6% 3.8% 2.0% 3.8% 0.2% 3.2% 24.3% 4.5% 1.6% 1.4% 9.0% *Visitors may report multiple destinations -- percentages are read down the column. Counties with less than a two percent share of the California leisure market were not listed. Sources: U.S. Department of Commerce, NTTO, Survey of International Air Travelers, CIC Research, Inc., and Visit California. 63
97 (This page was intentionally left blank) 64
98 Table 28 TRAVEL COMPANIONS OVERSEAS AND MEXICAN LEISURE VISITORS TO CALIFORNIA (2013) The highest proportion of Overseas and Mexican leisure visitors to California were traveling alone (47%), followed by 33% traveling with a spouse/partner and 20% traveling with family/relatives. Visitors from India and China (56% and 51% respectively) had the highest proportion of respondents who were traveling alone, while visitors from Brazil and Italy (52% and 48% respectively) had the highest proportion of respondents who were traveling with a spouse/partner. Visitors from Mexico (air) (33%) had the highest proportion of respondents who were traveling with family/relatives. COUNTRY OF RESIDENCE OF VISITORS TRAVEL COMPANIONS* TOTAL OVERSEAS U.K. GERMANY FRANCE ITALY AUSTRALIA CHINA w/o HK INDIA JAPAN SOUTH KOREA BRAZIL MEXICO (AIR) ESTIMATED TRAVELERS 4,508, , , , , , , , , , , ,000 (Number of Respondents) (3,801) (395) (313) (217) (105) (304) (244) (83)** (374) (199) (109) (76)** Traveling Alone 46.9% 48.0% 39.8% 40.1% 35.0% 38.8% 50.6% 55.8% 48.4% 49.3% 37.4% 44.8% Spouse/Partner Family/Relatives Friends Tour Group Business Associates *Column percentages may total more than 100% due to multiple responses. **Caution-Small sample size Sources: U.S. Department of Commerce, NTTO, Survey of International Air Travelers, CIC Research, Inc., and Visit California. 65
99 (This page was intentionally left blank) 66
100 Table 29 MAIN PURPOSE OF TRIP OVERSEAS AND MEXICAN LEISURE VISITORS TO CALIFORNIA (2013) Overseas leisure visitors to California reported the main purpose of their trip as predominantly vacation/holidays (76%) and, to a lesser extent, visiting friends/relatives (24%). Leisure visitors from Australia (90%) and Italy (89%), followed by leisure visitors from Brazil (84%) had the highest proportion of visitors whose main purpose was vacation/holidays, while leisure visitors from Mexico (air) (34%) followed by Japan and South Korea (33%, 32% respectively) had the highest proportion of visitors whose main purpose was visiting friends/relatives. COUNTRY OF RESIDENCE OF VISITORS MAIN PURPOSE OF TRIP TOTAL OVERSEAS U.K. GERMANY FRANCE ITALY AUSTRALIA CHINA w/o HK INDIA JAPAN SOUTH KOREA BRAZIL MEXICO (AIR) ESTIMATED TRAVELERS 4,508, , , , , , , , , , , ,000 (Number of Respondents) (3,823) (396) (313) (217) (106) (304) (248) (83)* (375) (200) (111) (76)* Vacation/ Holidays 75.6% 77.8% 77.5% 87.0% 89.3% 90.2% 74.8% 29.7% 67.2% 68.2% 83.9% 65.9% Visit Friends/Relatives *Caution-Small sample size Sources: U.S. Department of Commerce, NTTO, Survey of International Air Travelers, CIC Research, Inc., and Visit California. 67
101 (This page was intentionally left blank) 68
102 Table 30 PURPOSE OF TRIP OVERSEAS AND MEXICAN LEISURE VISITORS TO CALIFORNIA (2013) More than eight in ten (85%) overseas leisure travelers to California reported they were on vacation/holiday, while 40% reported visiting friends or relatives. This is similar to results from previous years. Leisure travelers from Australia, Italy, and France (98%, 93%, and 91% respectively) recorded the highest proportion of travelers on vacation/holiday in On the other hand, only 53% of leisure visitors from India reported they were on vacation/holiday. A large proportion of visitors from India (74%) reported coming to California to visit friends and relatives, while only 22% of travelers from Italy reported this purpose. COUNTRY OF RESIDENCE OF VISITORS PURPOSE OF TRIP* TOTAL OVERSEAS U.K. GERMANY FRANCE ITALY AUSTRALIA CHINA w/o HK INDIA JAPAN SOUTH KOREA BRAZIL MEXICO (AIR) ESTIMATED TRAVELERS 4,508, , , , , , , , , , , ,000 (Number of Respondents) (3,823) (396) (313) (217) (106) (304) (248) (83)** (375) (200) (111) (76)** Vacation/ Holidays 85.2% 85.8% 87.8% 91.0% 93.2% 97.8% 81.3% 52.6% 79.3% 77.8% 89.4% 72.5% Visit Friends/Relatives Education Business Attend Convention Other *Column percentages may total more than 100% due to multiple responses. ** Caution-Small Sample Size Sources: U.S. Department of Commerce, NTTO, Survey of International Air Travelers, CIC Research, Inc., and Visit California. 69
103 (This page was intentionally left blank) 70
104 Table 31 LEISURE-RECREATION ACTIVITIES OVERSEAS AND MEXICAN LEISURE VISITORS TO CALIFORNIA (2013) Overseas leisure visitors reported a greater participation rate in almost all activities, compared with all overseas visitors to California (Table 8). Sightseeing (89%) and shopping (89%) were the most common leisure and recreation activities of overseas leisure visitors to California in These results are similar to those mentioned in Categories listed in prior years were different, thus no comparison can be made with results prior to COUNTRY OF RESIDENCE OF VISITORS LEISURE/RECREATION ACTIVITIES* TOTAL OVERSEAS U.K. GERMANY FRANCE ITALY AUSTRALIA CHINA w/o HK INDIA JAPAN SOUTH KOREA BRAZIL MEXICO (AIR) ESTIMATED TRAVELERS 4,508, , , , , , , , , , , ,000 (Number of Respondents) (3,385) (360) (281) (191) (89)** (284) (212) (65)** (319) (178) (102) (61)** Sightseeing 89.4% 92.9% 90.6% 88.7% 72.5% 95.5% 83.6% 94.1% 87.8% 90.3% 93.3% 76.3% Shopping National Parks/Monuments Small Towns/Countryside Amusement/Theme Parks Experience Fine Dining Historical Locations Guided Tour(s) Art Galleries/Museums Casino/Gamble Cultural/Ethnic Heritage Concert/Play/Musical Nightclubbing/Dancing Sporting Event American Indian Camping/Hiking Water Sports Environmental/Eco Golfing/Tennis Snow Sports Hunting/Fishing *Multiple response. Only responses greater than one percent are detailed. **Caution Small sample size. Sources: U.S. Department of Commerce, NTTO, Survey of International Air Travelers, CIC Research, Inc., and Visit California. 71
105 (This page was intentionally left blank) 72
106 Table 32 ADVANCE TRIP DECISION OVERSEAS AND MEXICAN LEISURE VISITORS TO CALIFORNIA (2013) Overseas leisure visitors to California reported a median advance trip decision period of 90 days, 25 days longer than the 65 days for all overseas visitors to California (Table 9). The median advance airline ticket reservation period for leisure visitors was 60 days in 2013, (similar to previous years) compared with a median of 47 days for all overseas visitors to California (Table 10). In 2013 leisure visitors from South Korea (45 days), followed by Mexico (air), China and Japan (60 days each respectively) had the shortest advance trip decision period, as well as the shortest advance airline ticket reservation time (30, 30, 30 and 60 days respectively). Leisure visitors from Australia reported the longest advance trip decision period (180 days), as well as the longest advance airline ticket reservation time (120 days), compared to visitors from other countries. COUNTRY OF RESIDENCE OF VISITORS ADVANCE TRIP DECISION* TOTAL OVERSEAS U.K. GERMANY FRANCE ITALY AUSTRALIA CHINA w/o HK INDIA JAPAN SOUTH KOREA BRAZIL MEXICO (AIR) ESTIMATED TRAVELERS 4,508, , , , , , , , , , , ,000 (Number of Respondents) (3,662) (381) (303) (209) (105) (297) (232) (83)** (359) (192) (109) (72)** 14 Days or Less 6.7% 6.1% 6.6% 2.5% 4.9% 3.0% 9.3% 6.5% 6.5% 6.5% 1.4% 12.4% Days Days Days Days or More TOTAL 100.0% 100.0% 100.0% 100.0% 100.0% 100.0% 100.0% 100.0% 100.0% 100.0% 100.0% 100.0% Average No. of Days Median No. of Days ADVANCE AIRLINE RESERVATIONS* ESTIMATED TRAVELERS 4,508, , , , , , , , , , , ,000 (Number of Respondents) (3,493) (367) (295) (200) (101) (289) (215) (80)** (317) (188) (106) (72)** 14 Days or less 12.2% 10.9% 8.6% 5.4% 9.8% 9.0% 13.6% 13.6% 12.8% 26.7% 7.3% 22.2% Days Days Days Days or More TOTAL 100.0% 100.0% 100.0% 100.0% 100.0% 100.0% 100.0% 100.0% 100.0% 100.0% 100.0% 100.0% Mean No. of Days Median No. of Days *Column percentages may not total to 100% due to rounding. **Caution-Small sample size Sources: U.S. Department of Commerce, NTTO, Survey of International Air Travelers, CIC Research, Inc., and Visit California. 73
107 (This page was intentionally left blank) 74
108 Table 33 MEANS OF BOOKING AIR TRIP AND LODGING OVERSEAS AND MEXICAN LEISURE VISITORS TO CALIFORNIA (2013) Travel agents booked 33% of airline ticket reservations for overseas leisure travelers to California in 2013, compared with 34% in 2012, and 47% in The proportion of travel agent air bookings ranged from a low of 21% for leisure travelers from the U.K., to a high of 62% for leisure travelers from Australia. Booking directly with the airline was the second most common method used by overseas leisure visitors to book air trips (31%). Use of this means was highest among leisure visitors from the U.K. (46%) and Mexico (air) (38%), and lowest among leisure visitors from India and Italy (17% and 21% respectively). An Internet booking service played a role in booking U.S. airline (27%) as well as lodging reservations (35%) for all overseas travelers to California in COUNTRY OF RESIDENCE OF VISITORS MEANS OF BOOKING AIR TRIP* TOTAL OVERSEAS U.K. GERMANY FRANCE ITALY AUSTRALIA CHINA w/o HK INDIA JAPAN SOUTH KOREA BRAZIL MEXICO (AIR) ESTIMATED TRAVELERS 4,508, ,00 311, , ,00 487, , , , , , ,000 (Number of Respondents) (3,797) (394) (311) (217) (106) (303) (247) (83)*** (369) (200) (110) (75)*** Travel Agency Office 32.9% 21.3% 36.8% 23.3% 36.2% 62.1% 23.5% 56.0% 34.1% 23.3% 25.9% 23.4% Airline Directly Internet Booking Srvc Tour Oper./Travel Club Corporate Travel Dept Other/Don t Know TOTAL 100.0% % 100.0% 100.0% 100.0% 100.0% 100.0% 100.0% 100.0% 100.0% 100.0% MEANS OF BOOKING LODGING** (Number of Respondents) (3,608) (388) (302) (201) (98)*** (293) (232) (77)*** (353) (188) (106) (71)*** Yes, Booked by: 70.2% 76.0% 71.2% 65.9% 69.5% 90.8% 77.3% 30.7% 68.7% 54.4% 73.7% 60.1% Internet Booking Srvc. 34.5% 32.2% 34.1% 32.3% 29.1% 42.0% 37.2% 16.7% 26.6% 27.2% 42.7% 28.0% Hotel/Motel Directly Travel Agency Office Tour Oper./Travel Club Corporate Travel Dept Airline Staff Other No 29.8% 24.0% 28.8% 34.1% 30.5% 9.2% 22.7% 69.3% 31.3% 45.6% 26.3% 39.9% *Column percentages may not total to 100% due to rounding. ** Multiple Response. Percentages based on total number of respondents. ***Caution-Small sample size Sources: U.S. Department of Commerce, NTTO, Survey of International Air Travelers, CIC Research, Inc., and Visit California. 75
109 (This page was intentionally left blank) 76
110 Table 34 U.S. TRIP INFORMATION SOURCES OVERSEAS AND MEXICAN LEISURE VISITORS TO CALIFORNIA (2013) Referring directly to the airlines (44%) was a key source of trip information and travel planning among leisure visitors to California. This was followed by use of an online travel agency (36%), personal recommendation (30%) and travel agency office (28%). Use of a travel guide was the next most frequently mentioned trip information source among leisure travelers to California (18%). Results are similar to those from However, due to the categories changing in 2012, prior years results cannot be compared. Use of the airline directly was highest among leisure visitors from the U.K. (60%) followed by Brazil (48%), and lowest among leisure visitors from Italy and Australia (34% each). Use of an online travel agency was highest among leisure visitors from Mexico (air) and Italy (49% each), and lowest among visitors from Japan and India (24% and 27% respectively). Use of a personal recommendation was highest among leisure visitors from Brazil and India (55% and 40% respectively) and lowest among leisure visitors from Japan and Mexico (air) (23% and 24% respectively). INFORMATION SOURCES* COUNTRY OF RESIDENCE OF VISITORS TOTAL OVERSEAS U.K. GERMANY FRANCE ITALY AUSTRALIA CHINA w/o HK INDIA JAPAN ESTIMATED TRAVELERS 4,508, , , , , , , , , , , ,000 (Number of Respondents) (3,770) (392) (311) (213) (102) (304) (244) (81)** (368) (195) (110) (75)** Airlines Directly 43.8% 59.7% 38.2% 35.6% 34.0% 34.2% 35.7% 40.6% 44.7% 40.9% 48.4% 44.9% Online Travel Agency Personal Recommendation Travel Agency Office Travel Guide Tour Operator/Travel Club Government Travel Office Corporate Travel Dept Other SOUTH KOREA BRAZIL MEXICO (AIR) *Column percentages may not total to 100% due to multiple responses. **Caution-Small sample size Sources: U.S. Department of Commerce, NTTO, Survey of International Air Travelers, CIC Research, Inc., and Visit California. 77
111 (This page was intentionally left blank) 78
112 Table 35 AIRLINE TICKET CLASS AND PREPAID TRIP PACKAGE OVERSEAS AND MEXICAN LEISURE VISITORS TO CALIFORNIA (2013) Most of the overseas leisure travelers to California (77%) purchased their airline ticket, particularly visitors from Italy, Australia, India and the UK (85%, 84% 83% and 82% respectively). Leisure visitors from Mexico (air) (44%) and South Korea (55%) had the lowest tendency toward purchasing an airline ticket. Results are similar to those from 2012, but cannot be compared with years prior to that due to a change in categories in Similar to 2012, approximately 17% of overseas leisure travelers to California used a prepaid inclusive tour package. Results cannot be compared with years prior to 2012 due to a change in wording of the question. TYPE OF AIRLINE TICKET COUNTRY OF RESIDENCE OF VISITORS TOTAL OVERSEAS U.K. GERMANY FRANCE ITALY AUSTRALIA CHINA w/o HK INDIA JAPAN ESTIMATED TRAVELERS 4,508, , , , , , , , , , , ,000 (Number of Respondents) (3,424) (361) (277) (190) (95)** (272) (215) (75)** (348) (186) (101) (60)** Paid Ticket Discount/Group Fare Frequent Flyer Award Paid Upgrade Non-revenue Frequent Flyer Upgrade Don't Know SOUTH KOREA BRAZIL MEXICO (AIR) USE OF PREPAID PACKAGE (Number of Respondents) (3,691) (386) (300) (212) (102) (301) (237) (73)** (367) (196) (106) (71)** Yes, Airfare and Accom.* 17.2% 19.4% 13.4% 27.2% 28.2% 17.6% 27.2% 1.0% 28.3% 24.1% 9.0% 6.1% Airfare and Accom. Only 2.4% 4.5% 2.9% 2.3% 2.9% 0.6% 3.6% - 7.2% 1.4% 1.5% - Bus/Coach Attractions/Events/Ent Guided Tours Meals Rental Car Cruise Rail Tickets Recreation Tour Guide for Entire Trip No 82.8% 80.6% 86.6% 72.8% 71.8% 82.4% 72.8% 99.0% 71.7% 75.9% 91.0% 93.9% TOTAL 100.0% 100.0% 100.0% 100.0% 100.0% 100.0% 100.0% 100.0% 100.0% 100.0% 100.0% 100.0% * Multiple Response. Must include airfare and accommodation and may include others. **Caution - Small sample size. Sources: U.S. Department of Commerce, NTTO, Survey of International Air Travelers, CIC Research, Inc., and Visit California. 79
113 (This page was intentionally left blank) 80
114 Table 36 TRAVEL PARTY SIZE OVERSEAS AND MEXICAN LEISURE VISITORS TO CALIFORNIA (2013) Almost nine in ten (87%) of all leisure travel groups to California consisted of adults only, while 13% were adults traveling with children. The mean total party size for leisure travelers was 1.8 persons. These results are nearly the same as those from the previous year. TRAVEL PARTY SIZE* COUNTRY OF RESIDENCE OF VISITORS TOTAL OVERSEAS U.K. GERMANY FRANCE ITALY AUSTRALIA CHINA w/o HK INDIA JAPAN ESTIMATED TRAVELERS 4,508, , , , , , , , , , , ,000 (Number of Respondents) (3,809) (396) (313) (216) (105) (304) (246) (83)** (375) (199) (111) (75)** Adults Only 86.8% 89.0% 89.5% 80.4% 91.2% 88.0% 80.1% 91.2% 86.7% 82.6% 80.9% 85.3% Adults and Children TOTAL 100.0% 100.0% 100.0% 100.0% 100.0% 100.0% 100.0% 100.0% 100.0% 100.0% 100.0% 100.0% SOUTH KOREA BRAZIL MEXICO (AIR) Mean Total Party Size Median Total Party Size ADULTS ONLY (Number of Respondents) (3,153) (345) (275) (162) (93)** (259) (179) (75)** (324) (162) (87)** (62)** Mean Adult Party Size Median Adult Party Size ADULTS AND CHILDREN (Number of Respondents) (656) (51)** (38)** (54)** (12)** (45)** (67)** (8)** (51)** (37)** (24)** (13)** Mean Party Size Median Party Size *Column percentages may total more than 100% due to rounding. **Caution - Small sample size. Sources: U.S. Department of Commerce, NTTO, Survey of International Air Travelers, CIC Research, Inc., and Visit California. 81
115 (This page was intentionally left blank) 82
116 Table 37 GENDER AND AGE OVERSEAS AND MEXICAN LEISURE VISITORS TO CALIFORNIA (2013) Slightly more female (53%) than male (47%) overseas leisure visitors to California were surveyed. The median age for females in 2013 was 38 years (36 years in 2012), versus 41 years for males (the same as that in 2012). GENDER AND AGE OF VISITOR* COUNTRY OF RESIDENCE OF VISITORS TOTAL OVERSEAS U.K. GERMANY FRANCE ITALY AUSTRALIA CHINA w/o HK INDIA JAPAN ESTIMATED TRAVELERS 4,508, , , , , , , , , , , ,000 (Number of Respondents) (3,493) (356) (275) (204) (97)** (279) (225) (77)** (347) (189) (100) (67)** MALE ADULTS 47.3% 52.2% 48.2% 46.3% 52.0% 45.0% 45.3% 54.6% 51.1% 35.9% 55.6% 41.6% Years Years Years Years Average Male Age Median Male Age SOUTH KOREA BRAZIL MEXICO (AIR) FEMALE ADULTS 52.7% 47.8% 51.8% 53.7% 48.0% 55.0% 54.7% 45.4% 48.9% 64.1% 44.4% 58.4% Years Years Years Years Average Female Age Median Female Age *Column percentages may not total to 100% due to rounding. **Caution Small sample size. Sources: U.S. Department of Commerce, NTTO, Survey of International Air Travelers, CIC Research, Inc., and Visit California. 83
117 (This page was intentionally left blank) 84
118 Table 38 ANNUAL HOUSEHOLD INCOME OVERSEAS AND MEXICAN LEISURE VISITORS TO CALIFORNIA (2013) Overseas leisure travelers to California in 2013 had a median household income of $66,700, down slightly from $75,000 in Results cannot be compared with years prior to 2012 as the data is captured differently in previous years. The median household income for all overseas travelers to California in 2013 (Table 17) was $72,000. Overseas leisure visitors from Australia ($95,300) and the U.K. ($92,000) reported the highest median household income. Leisure visitors from India ($15,800) reported the lowest median household income. COUNTRY OF RESIDENCE OF VISITORS ANNUAL HOUSEHOLD INCOME* TOTAL OVERSEAS U.K. GERMANY FRANCE ITALY AUSTRALIA CHINA w/o HK INDIA JAPAN SOUTH KOREA BRAZIL MEXICO (AIR) ESTIMATED TRAVELERS 4,508, , , , , , , , , , , ,000 (NUMBER OF RESPONDENTS) (2,258) (213) (141) (119) (44)** (189) (175) (40)** (237) (134) (75)** (44)** Under $20, % 3.7% 13.3% 20.8% 15.2% 6.3% 16.3% 54.7% 4.3% 17.8% 24.5% 29.0% $20,000 - $59, $60,000 - $99, $100,000 - $139, $140,000 - $179, $180,000 and over TOTAL 100.0% 100.0% 100.0% 100.0% 100.0% 100.0% 100.0% 100.0% 100.0% 100.0% 100.0% 100.0% Average Annual Income $96,400 $122,100 $95,500 $72,800 $90,300 $125,300 $66,600 $52,200 $132,500 $74,300 $110,600 $85,600 Median Annual Income $66,700 $92,000 $74,700 $59,700 $65,300 $95,300 $48,500 $15,800 $83,200 $55,800 $68,600 $38,400 *Column percentages may not total to 100% due to rounding. **Caution - Small sample size. Sources: U.S. Department of Commerce, NTTO, Survey of International Air Travelers, CIC Research, Inc., and Visit California. 85
119 (This page was intentionally left blank) 86
120 Table 39 NIGHTS AWAY FROM HOME / FIRST INTERNATIONAL TRIP OVERSEAS AND MEXICAN LEISURE VISITORS TO CALIFORNIA (2013) Overseas leisure visitors to California in 2013 had an average U.S. trip stay of 20 nights and an average stay in California of 11 nights. Leisure travelers from India and Australia reported the longest stays in the U.S. (46 nights and 25 nights respectively), while those from India and Italy reported the longest stays in California (20 nights and 12 nights respectively). (Caution small sample size for India and Mexico Air). Japanese (9 nights) followed by Mexico (air) leisure travelers (12 nights) reported the shortest trip stays in the U.S., while Japanese, and Mexico (air) leisure visitors reported the shortest stays in California (7 nights and 8 nights respectively). In 2013, 31% of overseas leisure visitors to California were on their first international trip (29% in 2012). Leisure visitors from China (55%), Australia (49%), and South Korea (47%) had the highest proportion traveling internationally for the first time. NIGHTS IN U.S. COUNTRY OF RESIDENCE OF VISITORS TOTAL OVERSEAS U.K. GERMANY FRANCE ITALY AUSTRALIA CHINA w/o HK INDIA JAPAN ESTIMATED TRAVELERS 4,508, , , , , , , , , , , ,000 (Number of Respondents) (3,802) (392) (312) (216) (105) (304) (247) (82)* (374) (200) (111) (73)* Mean No. Nights Median No. Nights SOUTH KOREA BRAZIL MEXICO (AIR) NIGHTS IN CALIFORNIA (Number of Respondents) (3,266) (352) (263) (193) (94)* (281) (204) (63)* (335) (165) (100) (54)* Mean Nights in Dest Median Nights in Dest FIRST INTERNATIONAL TRIP (Number of Respondents) (3,340) (358) (266) (195) (91)* (275) (208) (71)* (329) (170) (100) (57)* Yes No *Caution Small sample size. Sources: U.S. Department of Commerce, NTTO, Survey of International Air Travelers, CIC Research, Inc., and Visit California. 87
121 (This page was intentionally left blank) 88
122 Table 40 PORT OF ENTRY OVERSEAS AND MEXICAN LEISURE VISITORS TO CALIFORNIA (2013) Similar to results from previous years, Los Angeles was the major port of entry for all leisure travelers to California (46%) followed by San Francisco (23%). COUNTRY OF RESIDENCE OF VISITORS PORT OF ENTRY* TOTAL OVERSEAS U.K. GERMANY FRANCE ITALY AUSTRALIA CHINA w/o HK INDIA JAPAN SOUTH KOREA BRAZIL MEXICO (AIR) ESTIMATED TRAVELERS 4,508, , , , , , , , , , , ,000 (Number of Respondents) (3,823) (396) (313) (217) (106) (304) (248) (83)** (375) (200) (111) (76)** Atlanta, GA 1.7% 0.7% 4.2% 1.4% % % 1.0% Boston, MA Chicago, IL % 0.2% 4.3% % Dallas/Ft. Worth, TX Detroit, MI Honolulu, HI Houston, TX Las Vegas, NV Los Angeles, CA Miami, FL Minn./St. Paul, MN New York, NY Newark, NJ Philadelphia, PA San Francisco, CA Seattle, WA Washington, DC Other Port TOTAL 100.0% 100.0% 100.0% 100.0% 100.0% 100.0% 100.0% 100.0% 100.0% 100.0% 100.0% 100.0% *Column percentages may not total to 100% due to rounding. Sources: U.S. Department of Commerce, NTTO, Survey of International Air Travelers, CIC Research, Inc., and Visit California. 89
123 (This page was intentionally left blank) 90
124 Table 41 OVERNIGHT ACCOMMODATIONS OVERSEAS AND MEXICAN LEISURE VISITORS TO CALIFORNIA (2013) Nearly three-quarters (73%) of overseas leisure travelers to California reported staying in hotels or motels at some time during their trip, and 30% reported staying in private homes. Hotel usage was highest among visitors from Australia (87%) followed by visitors from France and Brazil (82% each). Similar to 2012, hotel usage was lowest among visitors from India (41%), followed by Mexico (air) (50%). A high proportion of Indian (69%) and Mexico (air) (55%) leisure travelers stayed in private homes. COUNTRY OF RESIDENCE OF VISITORS TYPE OF ACCOMMODATIONS * TOTAL OVERSEAS U.K. GERMANY FRANCE ITALY AUSTRALIA CHINA w/o HK INDIA JAPAN SOUTH KOREA BRAZIL MEXICO (AIR) ESTIMATED TRAVELERS 4,508, , , , , , , , , , , ,000 (Number of Respondents) (3,000) (342) (244) (181) (86)** (261) (161) (57)** (297) (148) (100) (55)** Hotel / Motel 73.1% 76.7% 69.1% 81.8% 75.4% 86.6% 61.0% 40.8% 74.7% 65.4% 81.9% 49.8% Mean Nights in Dest Median Nights in Dest Private Home 30.2% 30.2% 28.1% 29.6% 24.4% 12.2% 26.6% 69.0% 33.4% 36.9% 23.5% 55.2% Mean Nights in Dest Median Nights in Dest Other 6.9% 8.2% 15.0% 6.7% 9.5% 5.9% 18.4% 7.8% 3.5% 1.8% 0.3% 0.1% *Column percentages may not total to 100% due to multiple responses. **Caution - Small sample size. Sources: U.S. Department of Commerce, NTTO, Survey of International Air Travelers, CIC Research, Inc., and Visit California. 91
125 (This page was intentionally left blank) 92
126 Table 42 TRANSPORTATION IN THE U.S OVERSEAS AND MEXICAN LEISURE VISITORS TO CALIFORNIA (2013) Leisure travelers relied upon a variety of transportation means within the U.S. including rental cars (47%), domestic flights (46%), private or company autos (38%), subways/trams/buses (35%), and taxis/limousines (29%). Rental car use was highest among Brazilian and German leisure visitors (70% and 68% respectively). Leisure visitors from Australia had the highest use of domestic airline travel (84%), subways/trams/buses (54%), as well as taxi/cab/limousines (58%). Leisure visitors from Mexico (air) (56%) relied heavily on a company or private auto. COUNTRY OF RESIDENCE OF VISITORS TRANSPORTATION IN U.S.* TOTAL OVERSEAS U.K. GERMANY FRANCE ITALY AUSTRALIA CHINA w/o HK INDIA JAPAN SOUTH KOREA BRAZIL MEXICO (AIR) ESTIMATED TRAVELERS 4,508, , , , , , , , , , , ,000 (Number of Respondents) (3,381) (354) (292) (198) (98)** (278) (215) (68)** (312) (178) (104) (56)** Rented Auto 46.5% 50.7% 68.3% 53.9% 59.5% 40.9% 41.7% 14.8% 27.9% 29.2% 69.5% 39.4% Airlines in U.S Company or Private Auto City Subway/Tram/Bus Taxicab/Limousine Bus between Cities Ferry/River Taxi/Srt. Cruise Railroad between Cities Rented Bicycle /Motorcycle/Moped Cruise Ship/River Boat Motor Home/Camper *Column percentages may not total to 100% due to multiple responses. **Caution Small sample size. Sources: U.S. Department of Commerce, NTTO, Survey of International Air Travelers, CIC Research, Inc., and Visit California. 93
127 (This page was intentionally left blank) 94
128 Table 43 PAYMENT METHODS FOR TRIP EXPENSES OVERSEAS AND MEXICAN LEISURE VISITORS TO CALIFORNIA (2013) Leisure travelers to California predominantly make use of a credit card (39%), cash from home/travelers checks (30%), as well as a cash advance/withdrawal using a credit card (17%) as a method of payment for their trip expenses. Leisure visitors from Italy, Germany, and China (55%, 54%, and 53% respectively) had the highest use of credit cards for purchases, while leisure visitors from South Korea and France had the highest use of cash/travelers checks (48% and 40% respectively), and along with Germany, the highest use of cash advance/withdrawal using credit card (22% each). TRIP EXPENSES PAYMENT METHOD* COUNTRY OF RESIDENCE OF VISITORS TOTAL OVERSEAS U.K. GERMANY FRANCE ITALY AUSTRALIA CHINA w/o HK INDIA JAPAN ESTIMATED TRAVELERS 4,508, , , , , , , , , , , ,000 (Number of Respondents) (2,705) (270) (210) (168) (66)** (221) (171) (37)** (304) (159) (70)** (51)** Purchases Using Credit Card 39.4% 28.3% 54.3% 31.1% 54.8% 32.8% 53.2% 37.2% 46.0% 27.3% 48.0% 47.0% Cash from Home/Travelers Checks Cash Adv./Withdrawal Using Credit Card Purchases Using Debit Card Cash Adv./Withdrawal Using Debit Card SOUTH KOREA BRAZIL MEXICO (AIR) *Column percentages may not total to 100% due to rounding. **Caution Small sample size. Sources: U.S. Department of Commerce, NTTO, Survey of International Air Travelers, CIC Research, Inc., and Visit California. 95
129 (This page was intentionally left blank) 96
130 Table 44 TRIP EXPENDITURES OVERSEAS AND MEXICAN LEISURE VISITORS TO CALIFORNIA (2013) Overseas leisure travelers to California in 2013 reported total expenditures in California of $8.7 billion. The 2013 mean daily expenditure in California per leisure visitor, was $181, with total spending in California of $1,921 per visitor. As a comparison, all overseas travelers to California reported spending $1,940 per visitor in CA (Table 23). COUNTRY OF RESIDENCE OF VISITORS LEISURE VISITOR SPENDING* TOTAL OVERSEAS U.K. GERMANY FRANCE ITALY AUSTRALIA CHINA w/o HK INDIA JAPAN TOTAL LEIS. VISIT. TO U.S. 23,675,000 3,118,000 1,391,000 1,181, ,000 1,054, , ,000 2,884, ,000 1,652,000 1,519,000 Total Spending in the U.S. ($ Mil.) $77,671 $7,362 $3,648 $3,181 $1,986 $4,540 $4,678 $816 $7,885 $3,084 $5,763 $1,951 Spending in the U.S. per Leis. Visitor. $3,281 $2,361 $2,623 $2,693 $3,241 $4,308 $4,893 $2,248 $2,734 $3,223 $3,488 $1,285 CALIFORNIA LESIURE VISITORS SPENDING AND NIGHTS EST. LEISURE VISIT. TO CA 4,508, , , , , , , , , , , ,000 (Number of Respondents) (1,442) (171) (111) (83)** (38)** (139) (58)** (17)** (144) (79)** (46)** (31)** Total Spending in CA ($ Mil.) $8,661 $631 $468 $563 $255 $798 $1,307 $100 $278 $886 $351 $393 Spend. in CA per Leis. Visitor $1,921 $1,327 $1,504 $1,777 $2,092 $1,639 $2,694 $980 $1,329 $3,543 $2,196 $1,005 Spending in CA per Day $181 $128 $155 $191 $180 $176 $284 $50 $182 $362 $236 $123 Average Nights in CA Median Nights in CA SPENDING IN THE U.S. BY LEISURE VISITORS TO CA* Total Spending in U.S ($ Mil.) $16,015 $958 $926 $1,115 $409 $2,111 $2,517 $235 $335 $1,446 $593 $589 Spending in U.S. per CA Leis. Visitor $3,553 $2,017 $2,978 $3,516 $3,354 $4,336 $5,190 $2,301 $1,602 $5,785 $3,707 $1,507 Nts in U.S. per CA Leis. Visitor SPENDING IN THE U.S. BY CATEGORY (%) Lodging in U.S. 23.5% 27.9% 26.1% 21.7% 31.8% 24.4% 17.0% 9.0% 27.0% 15.8% 28.0% 10.0% Air Transport in U.S. 7.9% 3.5% 4.2% 5.1% 4.2% 9.5% 13.0% 8.1% 3.4% 5.4% 2.6% 17.2% Entertainment 14.8% 17.2% 16.0% 16.0% 15.2% 18.1% 8.6% 18.1% 13.4% 14.7% 14.9% 13.6% Food and Beverages 18.8% 25.8% 23.6% 23.6% 26.5% 20.1% 11.4% 14.6% 20.1% 20.3% 13.0% 12.2% Ground Trans. in U.S. 5.8% 6.2% 8.5% 7.4% 5.9% 3.6% 7.6% 16.8% 6.4% 6.1% 7.0% 2.9% Gifts and Souvenirs 25.2% 16.0% 18.3% 19.8% 14.0% 21.0% 39.1% 30.0% 25.3% 29.8% 29.7% 35.6% Other 4.0% 3.4% 3.2% 6.4% 2.4% 3.3% 3.4% 3.5% 4.7% 7.8% 4.8% 8.5% * Spending estimates were based on SIAT survey data and revised by Tourism Economics for Visit California, August **Caution - Small sample size. Sources: U.S. Department of Commerce, NTTO, Survey of International Air Travelers, CIC Research, Inc. and Tourism Economics SOUTH KOREA BRAZIL MEXICO (AIR) 97
131 (This page was intentionally left blank) 98
132 Table 45 EXPENDITURES OVERSEAS LEISURE VISITORS WHO REPORTED ONLY CALIFORNIA DESTINATIONS* (2013) Almost four out of ten (37%) overseas leisure visitors to California in 2013 did not visit any other state in the U.S. while on their international trip. Leisure visitors who only visited California during their U.S. trip reported spending $1,979 per capita in California. This was a little more than the average spending in California of $1,921 reported for All Overseas leisure visitors to California. As should be expected the California-only leisure visitors reported longer lengths of stay in California (15.0 days v days). Average daily spending by California only leisure visitors was $132 per day, which was lower than the average daily spending of $181 per day reported for all overseas leisure visitors to California. AVERAGE PER VISITOR TRIP EXPENDITURES OVERSEAS LEISURE TRAVELERS WHO ONLY VISITED CALIFORNIA ON THEIR U.S. TRIP ALL OVERSEAS LEISURE VISITORS TO CALIFORNIA EXPENDITURE IN CALIFORNIA $1,979 $1,921 PER DAY $132 $181 (NUMBER OF RESPONDENTS) (523) (1,442) AVERAGE ITEMIZED EXPENDITURES IN CA AIR TRANSPORT IN U.S. 4% 23% GROUND TRANSPORT IN U.S. 5% 8% LODGING 21% 15% FOOD, BEVERAGES 21% 19% GIFTS, SOUVENIRS 29% 6% ENTERTAINMENT 13% 25% OTHER 6% 4% AVERAGE NIGHTS IN CALIFORNIA *Overseas visitors could report up to eight U.S. destinations. ** Spending estimates were based on SIAT survey data and revised by Tourism Economics for Visit California, August Sources: U.S. Department of Commerce, NTTO, Survey of International Air Travelers, CIC Research, Inc. and Tourism Economics. 99
133 (This page was intentionally left blank) 100
134 APPENDIX A SURVEY BACKGROUND Introduction This report on overseas visitors to California is based on data compiled from the National Travel and Tourism Office (NTTO), Survey of International Air Travelers. The survey information is collected from passengers through questionnaires covering the traveler, the air trip, activities and places visited, and air travel expenditures. The survey is conducted voluntarily by selected major airlines on a sample of their international flights departing from U.S. airports. This survey program was initiated in response to a growing need for information on the volume, characteristics, and travel patterns of international air travelers to and from the United States. The data from the survey are used to guide planning oriented toward the activities of international air travelers for both the public and private sectors. Survey Operations Data are collected monthly through in-flight passenger surveys conducted on a sample of the participating airlines' scheduled international flights that depart from United States airports during the seven days beginning with the third Monday of the month. Participating airlines receive advance listings of the flights to be surveyed, followed by a survey kit for each sample flight. The kits each contain instructions and questionnaires in the appropriate language. (The questionnaire is available in English, French, German, Italian, Japanese, Spanish, Korean and Chinese). Airline cabin personnel distribute the self-administered questionnaires to all adult passengers and collect the completed forms prior to debarkation. Questionnaire Content The survey questionnaire is designed to obtain responses from U.S. as well as non-u.s. residents. The questionnaire contains questions about the travelers (e.g., age, sex, family income, country and city of residence, previous travel experience, etc.). It also contains many basic questions about the current trip (e.g., type of air ticket, travel party composition, nights away from home, trip purpose, etc.). The distinguishing features of this questionnaire are the complete trip itinerary and the trip expenditure data items. These items collect more complete data on these areas than are available elsewhere. Every major destination visited is covered, as is the length of stay and the type of accommodations utilized. Travel expenditures are also covered by type of expenditure. The entire questionnaire is reproduced in Appendix B. Sample Design The sample is designed around the geographic detail desired for the resulting estimates and the specific airlines willing to participate in the survey. The design is a stratified, two-stage cluster sample, where scheduled flights are randomly selected from strata defined by airline and foreign destination in the first stage of the sample. When the survey is conducted on a selected flight, those passengers who respond are considered to represent all passengers on that flight. Understanding the Estimates Since airline participation is voluntary and changes from quarter to quarter, country level data should be viewed cautiously. For example, if a major carrier for a particular country was unable to participate for a quarter, the data for that country may not fully represent the country's international travel. 101
135 (This page was intentionally left blank) 102
136 With the exception of the number of respondents, all the data in the tables are statistical estimates, based on responses to the survey and supplemented with data from the Immigration and Naturalization Service. Passengers on charter flights and persons traveling by air between the U.S. and Canada are excluded. The estimates are subject to a certain amount of error resulting from the sampling, data collection, and estimation processes. Because of the complicated nature of the sample design and the resulting computational burden, sampling variability has not been calculated for the estimates. Instead, an indication of the reliability of a set of related estimates is given by the number of respondents to the relevant questionnaire items. The reader must exercise judgment in determining the amount of confidence to place in an estimate and in its proper use. For example, an estimate based on 500 respondents is more reliable than one based on 200 respondents. Several kinds of estimates appear in the tables. The majority are in the form of percent distributions of the responses to questionnaire items. Distributions for items allowing only one choice of response will total to 100%. Those allowing more than one choice may total to more than 100%. Where the symbol -- appears, this means that no or limited data is available for that response. In addition to estimates of percents, estimates of means and medians are shown for travel party size, age, annual family income, number of nights stayed and by type of accommodations. Definitions Notes of explanation for selected variables appearing in the row headings of the tables are given below. Residence of Visitors: In the overseas tables the major trafficgenerating countries are listed by world regions, as described in Appendix C. Countries not listed are combined by region into the "Other Region X" categories. Type and Size of Travel Party: A travel party can fall into only one of these categories: traveling alone; family group; business group; and mixed business, family, and other. These four categories total 100%. A party is classified as mixed if the party is a combination of two or more of the other categories. Mean and median party size are computed from the distribution of frequencies of parties of different sizes (for example, three passengers traveling together are counted as a single party in the frequency distribution from which mean and median party size are computed). Air Expenditures: The amounts shown for mean international airfare and mean expenditures while in the United States on this trip are those amounts spent over and above any inclusive tour expenditures paid prior to beginning the trip. The categories are mutually exclusive. Mean: The mean is the sum of all responses divided by the number of responses. Median: The median is that value for which 50% of the values lie below it and 50% are above it. Leisure Visitors: Are defined as those visitors whose main purpose of trip is vacation/holidays or visiting friends/relatives. 103
137 (This page was intentionally left blank) 104
138 APPENDIX B QUESTIONNAIRE 105
139 106
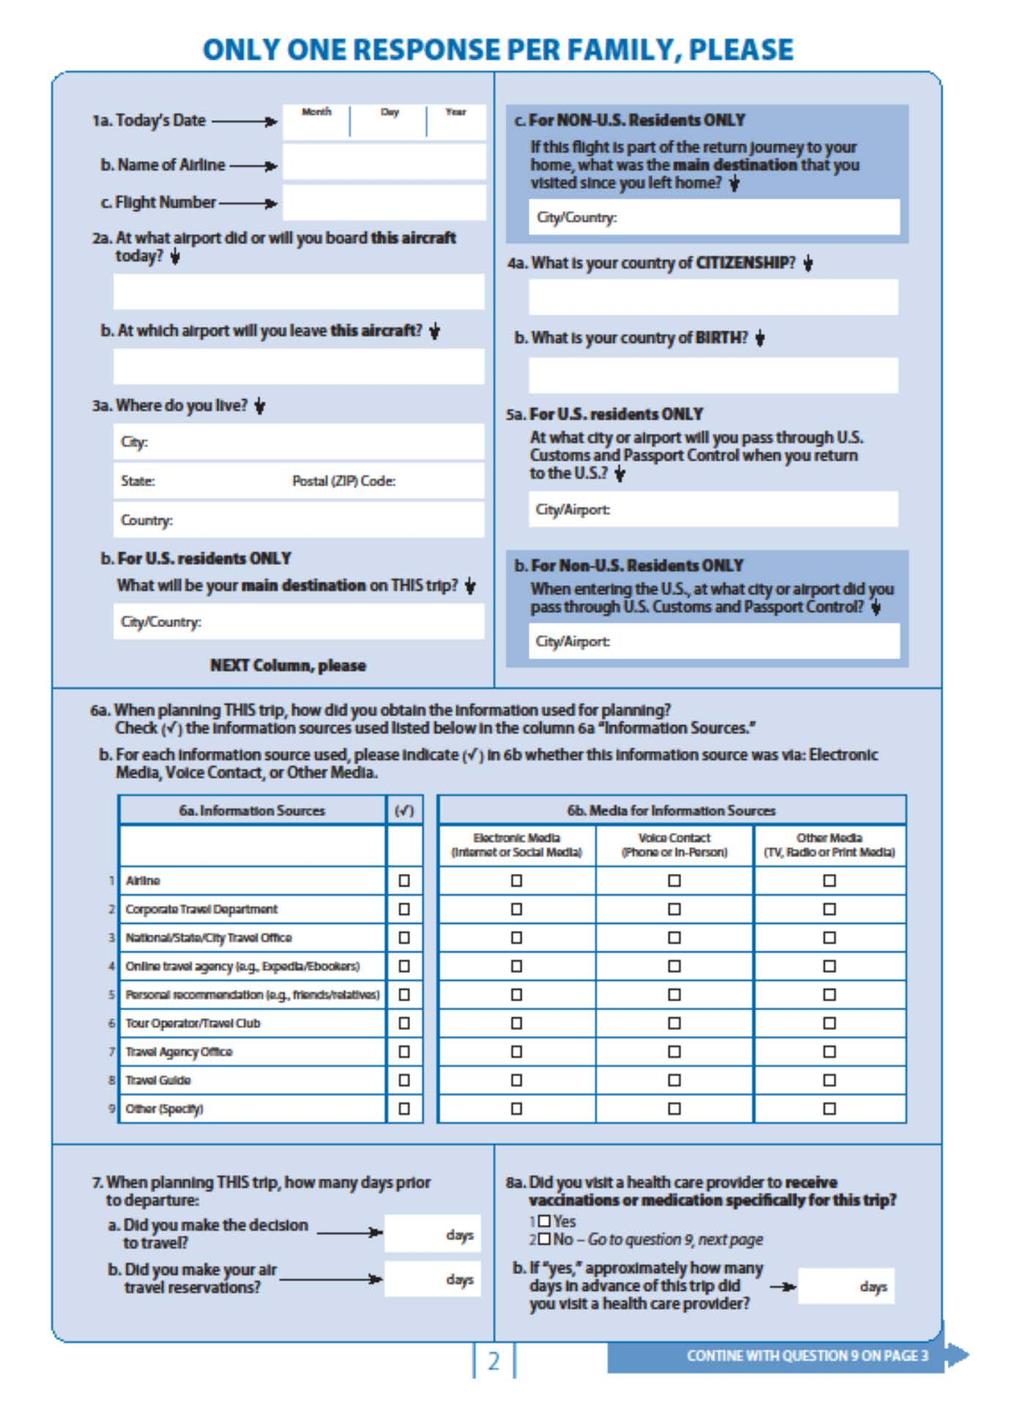
140 107
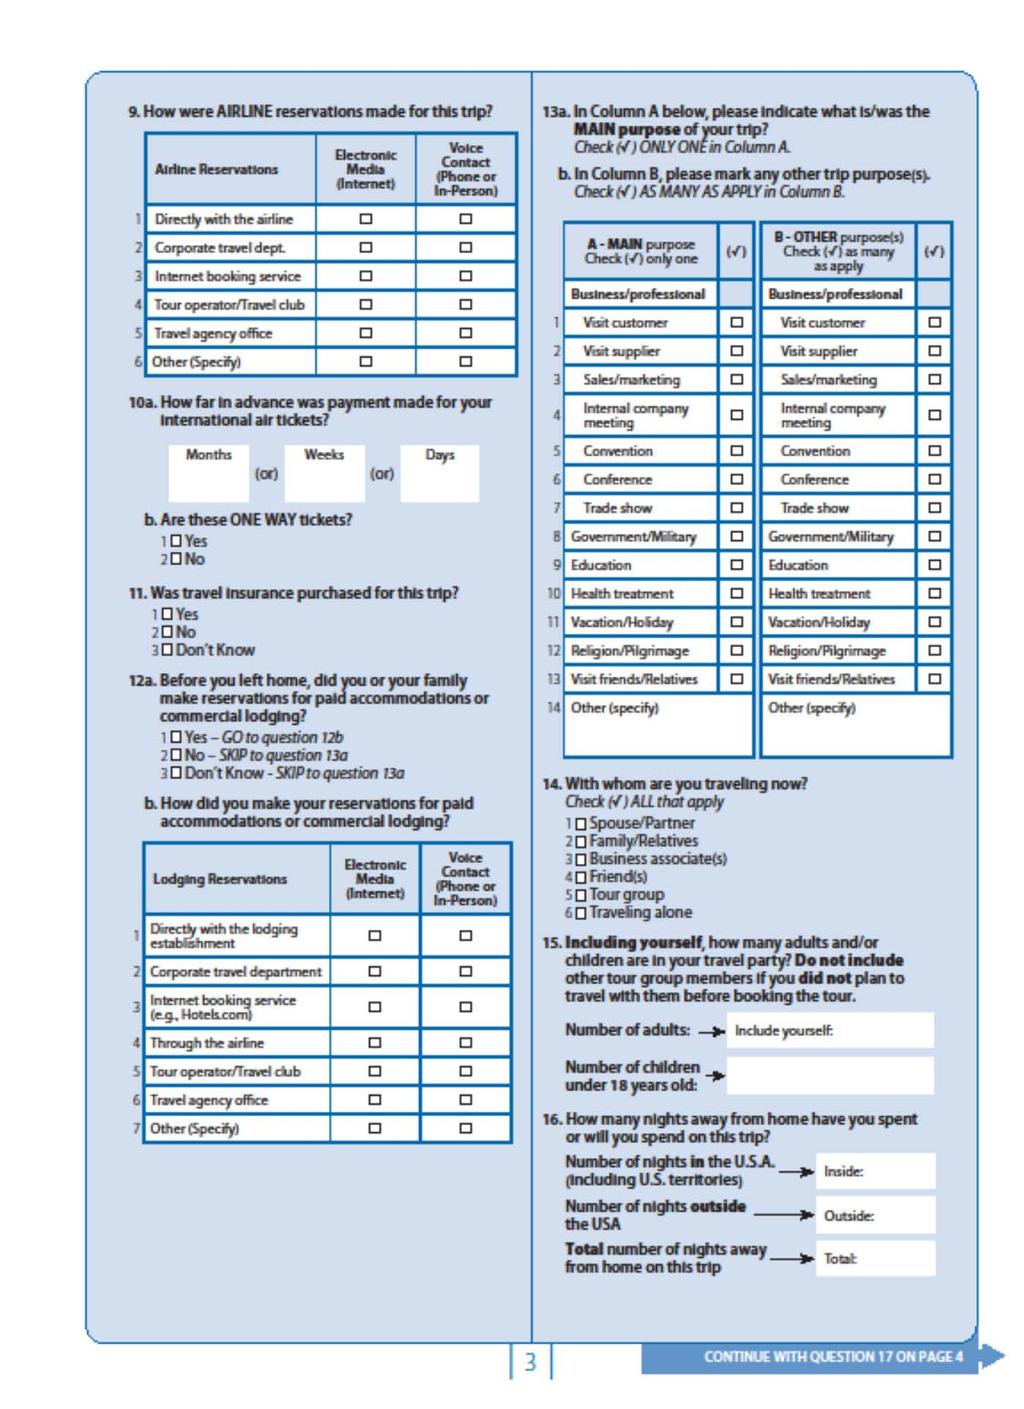
141 108
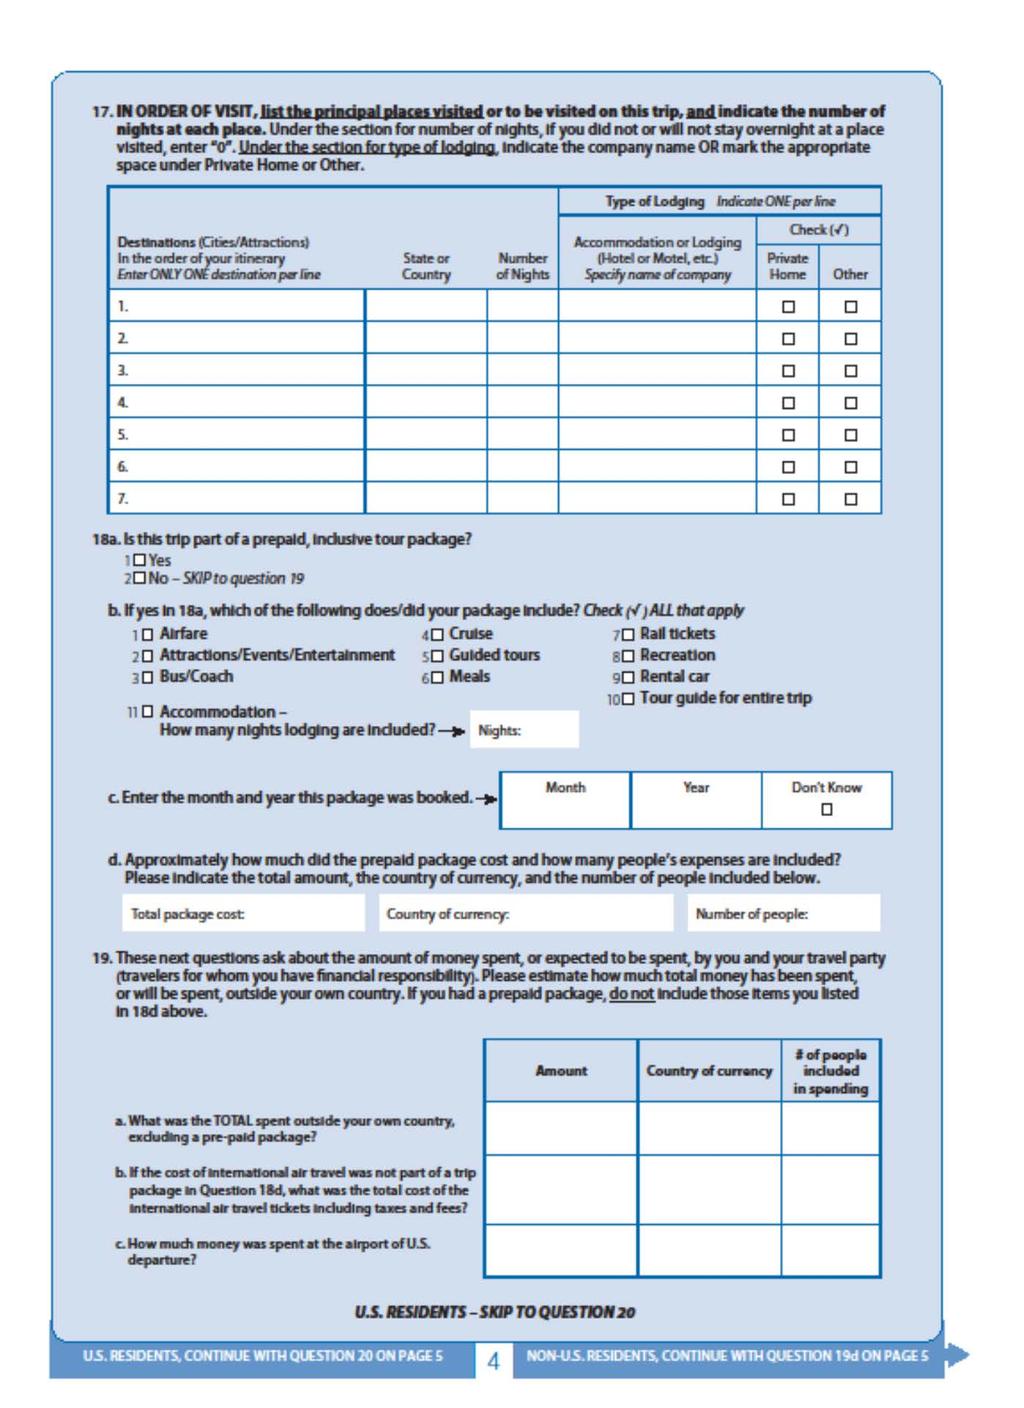
142 109
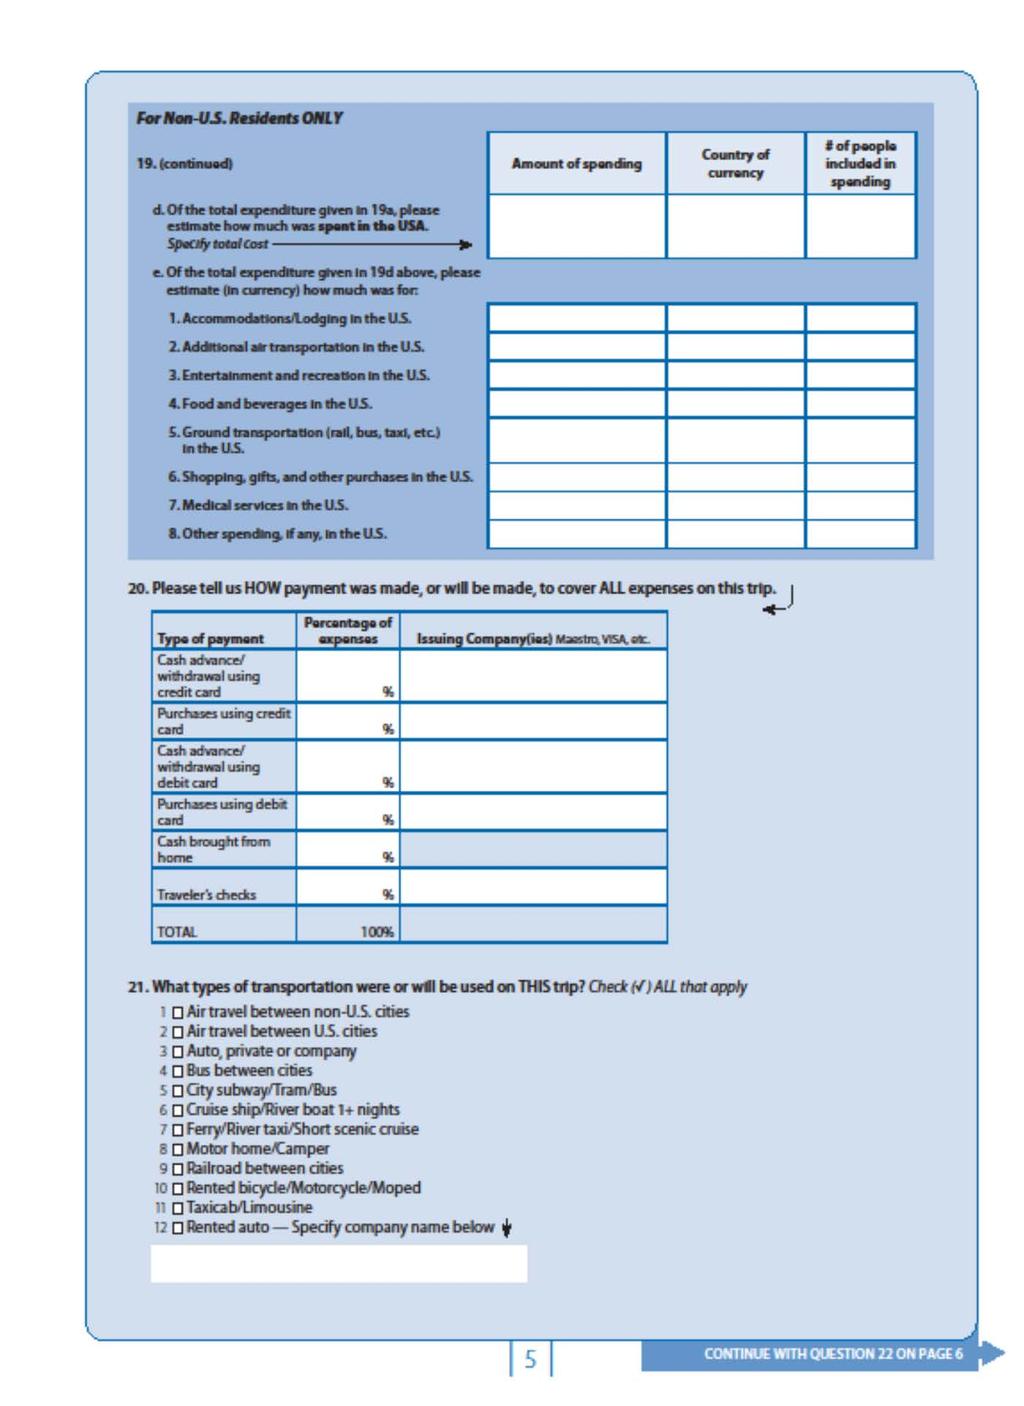
143 110
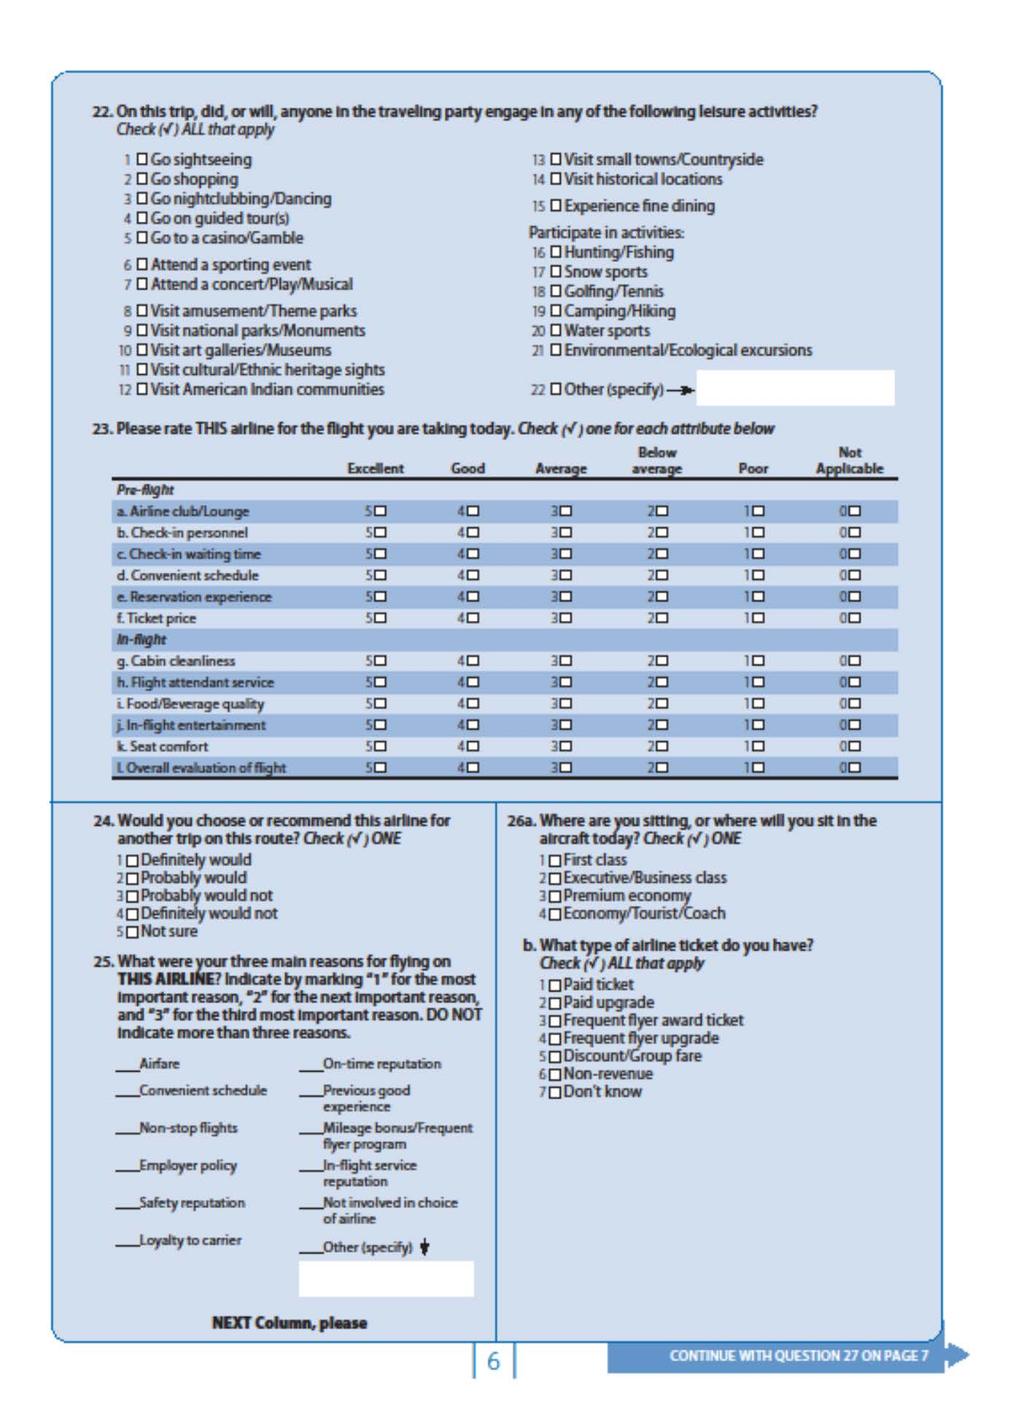
144 111
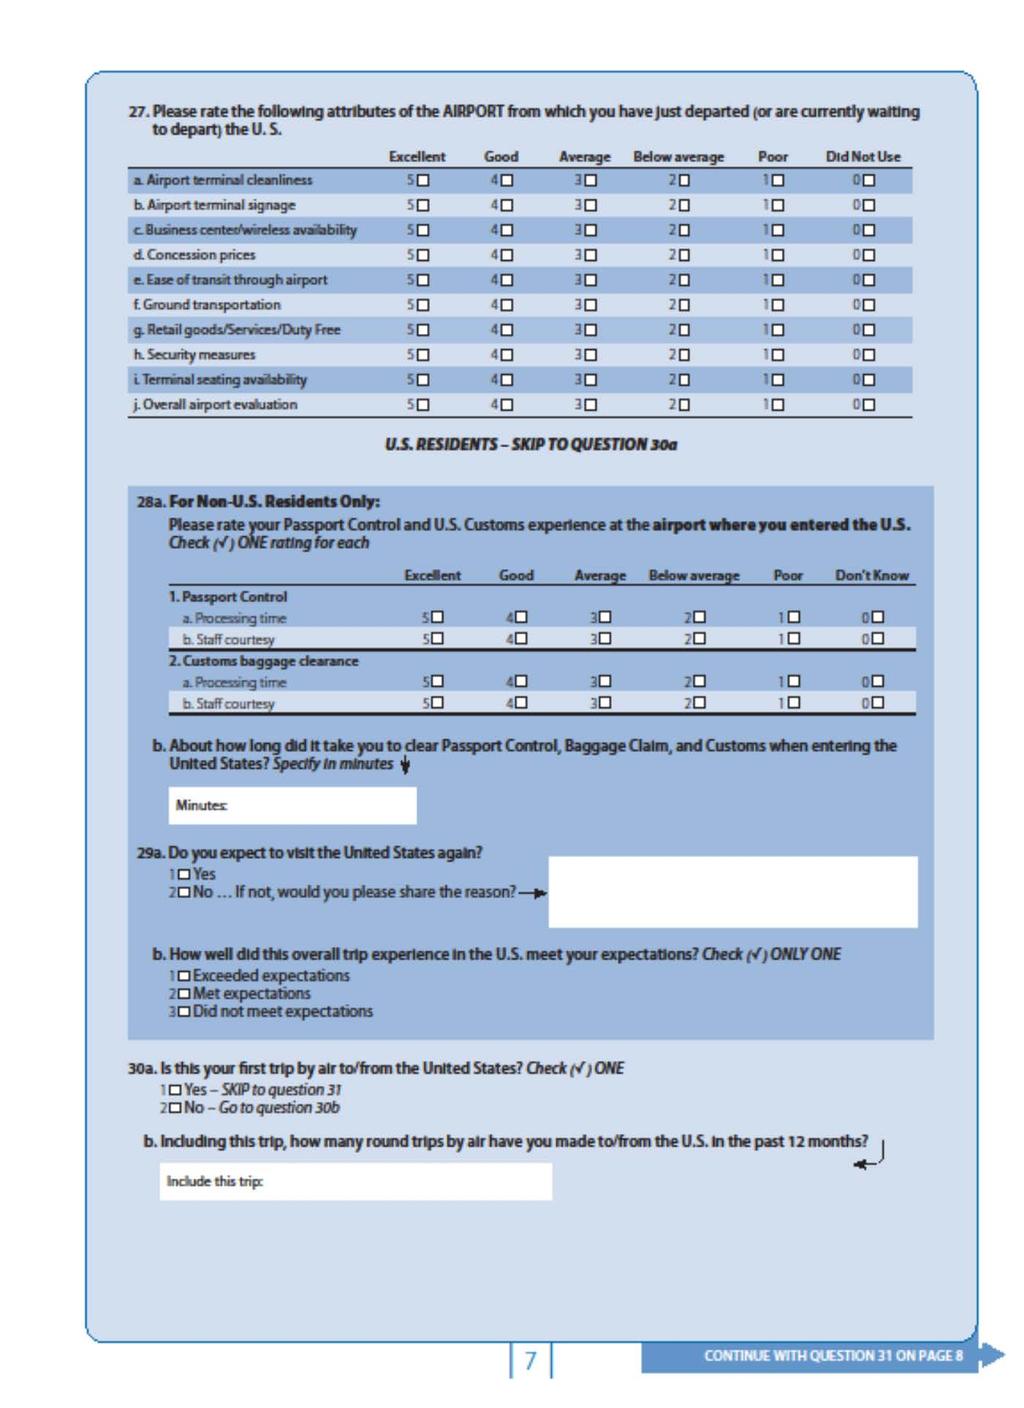
145 112
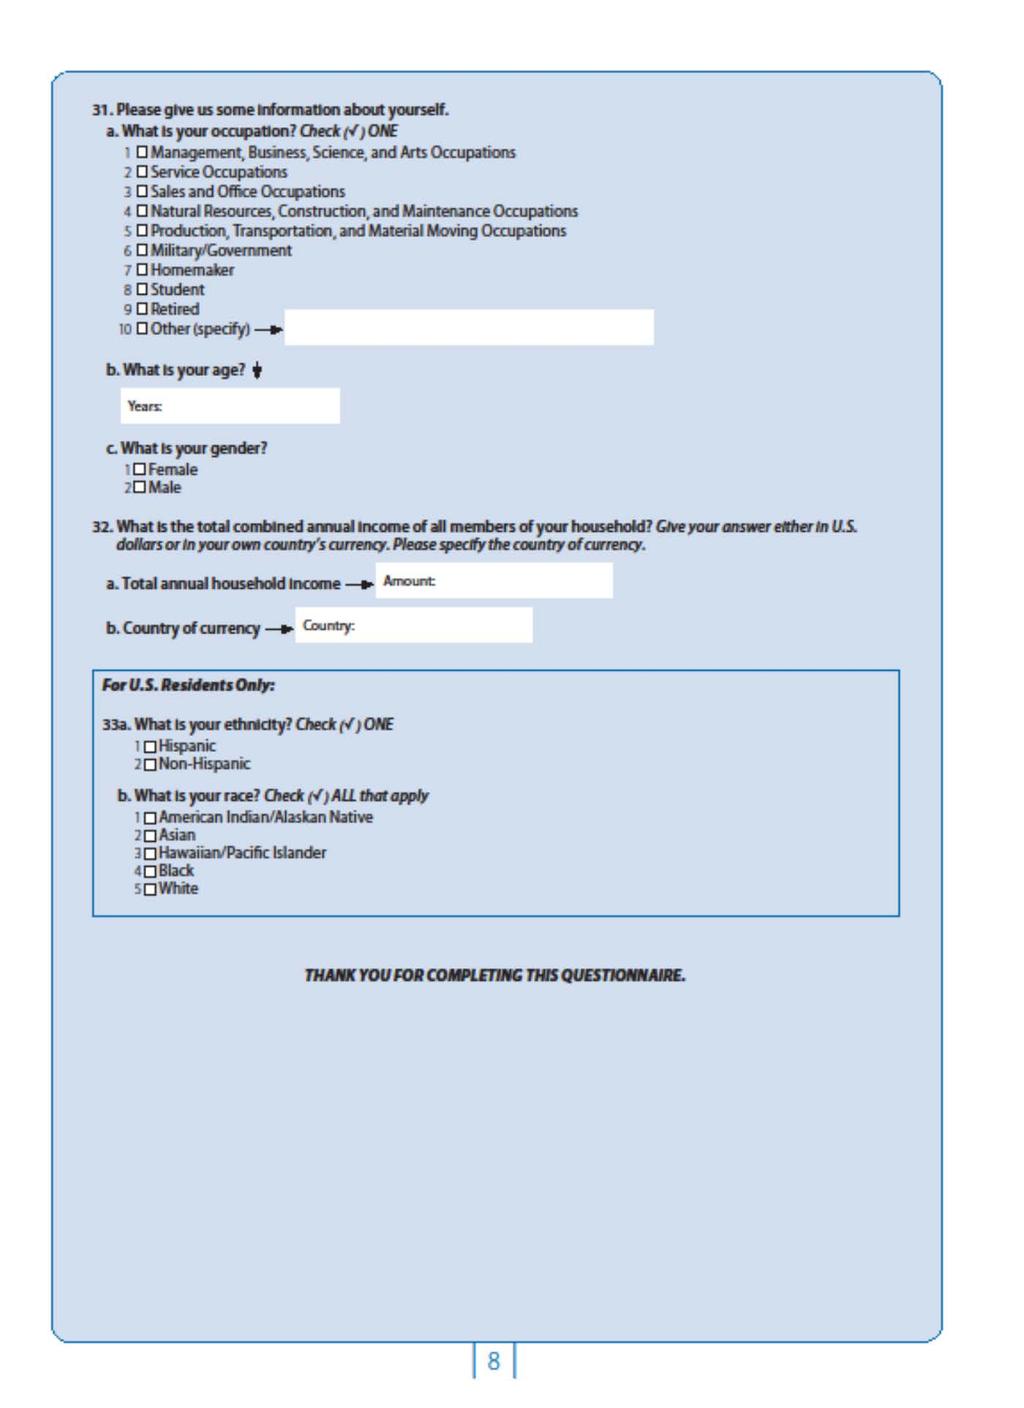
146 113
Overseas and Mexican Visitors To California
 Overseas and Mexican Visitors To California 2014 A joint marketing venture of Visit California and the California Business, Transportation and Housing Agency, Division of Tourism November 2015 CIC Research,
Overseas and Mexican Visitors To California
 Overseas and Mexican Visitors To California 2012 A joint marketing venture of Visit California and the California Business, Transportation and Housing Agency, Division of Tourism January 2014 CIC Research,
CHARACTERISTICS OF TRAVELERS FROM CHINA TO CALIFORNIA
 CHARACTERISTICS OF TRAVELERS FROM CHINA TO CALIFORNIA - 2015 In 2015 visitation to California rose to a record high of approximately 1,162,000, making California s largest overseas market.* Collectively,
CHARACTERISTICS OF TRAVELERS FROM AUSTRALIA TO CALIFORNIA 2015
 CHARACTERISTICS OF TRAVELERS FROM AUSTRALIA TO CALIFORNIA 2015 In 2015, was California s third largest overseas market to California with approximately 610,000 visitors to California. It was surpassed
CHARACTERISTICS OF TRAVELERS FROM MEXICO (Air) TO CALIFORNIA
 TO CALIFORNIA") CHARACTERISTICS OF TRAVELERS FROM MEXICO (Air) TO CALIFORNIA - 2013 Air travelers from Mexico represent one of the largest international markets for California with approximately 515,000 visitors to the
CHARACTERISTICS OF TRAVELERS FROM MEXICO (Air) TO CALIFORNIA - 2013 Air travelers from Mexico represent one of the largest international markets for California with approximately 515,000 visitors to the
CHARACTERISTICS OF TRAVELERS FROM AUSTRALIA TO CALIFORNIA 2013
 CHARACTERISTICS OF TRAVELERS FROM AUSTRALIA TO CALIFORNIA 2013 In 2013, was California s third largest overseas market to California with approximately 553,000 visitors to California. It was surpassed
CHARACTERISTICS OF TRAVELERS FROM THE UNITED KINGDOM TO CALIFORNIA
 CHARACTERISTICS OF TRAVELERS FROM THE UNITED KINGDOM TO CALIFORNIA - 2015 The UK was California s second largest overseas market with approximately 705,000 visitors to California in 2015, up from 686,000
CHARACTERISTICS OF TRAVELERS FROM SOUTH AMERICA TO CALIFORNIA 2015
 CHARACTERISTICS OF TRAVELERS FROM SOUTH AMERICA TO CALIFORNIA 2015 The South n region is a large and growing overseas market with approximately 492,000 combined visitors to California in 2015. Collectively
CHARACTERISTICS OF TRAVELERS FROM SOUTH AMERICA TO CALIFORNIA 2014
 CHARACTERISTICS OF TRAVELERS FROM SOUTH AMERICA TO CALIFORNIA 2014 South was one of California s large overseas markets with approximately 467,000 visitors to California in 2014. Collectively visitors
CHARACTERISTICS OF TRAVELERS FROM SCANDINAVIA TO CALIFORNIA
 CHARACTERISTICS OF TRAVELERS FROM SCANDINAVIA TO CALIFORNIA - 2008 The n region was defined as the combined countries of Denmark, Finland, Norway and Sweden. was one of California s large overseas markets
Sprint Real Solutions VPN SDS International Rates from the U.S. Mainland, Hawaii, Puerto Rico, and the U.S. Virgin Islands 1*
 1* The international rates below apply to calls from the U.S. Mainland, Hawaii, Puerto Rico, and the U.S. Virgin Islands where available. The rates, which are shown below in full minute increments, are
CHARACTERISTICS OF TRAVELERS FROM NEW ZEALAND TO CALIFORNIA
 CHARACTERISTICS OF TRAVELERS FROM NEW ZEALAND TO CALIFORNIA - 2010 New was one of California s large overseas markets with approximately 108,000 visitors to California in 2010. Collectively visitors spent
CHARACTERISTICS OF TRAVELERS FROM THAILAND TO CALIFORNIA
 CHARACTERISTICS OF TRAVELERS FROM THAILAND TO CALIFORNIA - 2007 was one of California s overseas markets with approximately 34,000 visitors to California in 2007. Collectively visitors spent approximately
Alumni. Section 8: Alumni
 Alumni Section 8: Alumni This section includes a table and three maps showing the distribution of all living alumni in California counties, in each state, and across the world. All data was provided by
FINLAND. Table 1. FDI flows in the host economy, by geographical origin. (Millions of US dollars)
") Table 1. FDI flows in the host economy, by geographical origin World 3 732 8 046 3 319 2 823 4 750 7 652 12 451-1 144 718 7 359 2 550 4 158 Developed economies 3 638 8 003 2 382 2 863 4 934 7 258 12 450-855
Table 1. FDI flows in the host economy, by geographical origin World 3 732 8 046 3 319 2 823 4 750 7 652 12 451-1 144 718 7 359 2 550 4 158 Developed economies 3 638 8 003 2 382 2 863 4 934 7 258 12 450-855
Sprint Real Solutions Switched Data Service International Rates from the U.S. Mainland, Hawaii, Puerto Rico, and the U.S.
 1* The international rates below apply to calls from the U.S. Mainland, Hawaii, Puerto Rico, and the U.S. Virgin Islands. The usage rates below reflex the discount found in Section 6.4 of Schedule No.
Sprint Real Solutions Option A SDS International Outbound Rates from the U.S. Mainland, Hawaii, Puerto Rico, and the U.S.
 1* The international rates below apply to calls from the U.S. Mainland, Hawaii, Puerto Rico, and the U.S. Virgin Islands. For additional termination poinst for some countries, see International Termination
TOP INTERNATIONAL MARKETS FOR NATIVE AMERICAN TOURISM
 TOP INTERNATIONAL MARKETS FOR NATIVE AMERICAN TOURISM Ron Erdmann National Travel & Tourism Office Industry & Analysis, International Trade Administration September 12, 2017 National Travel & Tourism Office
MONTHLY NATURAL GAS SURVEY. November 2009
 MONTHLY NATURAL GAS SURVEY November 2009 INTERNATIONAL ENERGY AGENCY INTERNATIONAL ENERGY AGENCY Next Release: 12 March 2010 MONTHLY NATURAL GAS SURVEY - 1 CONTENTS TABLE 1 Natural Gas Balances in OECD
2013 International Visitation to North Carolina
 2013 International Visitation to North Carolina Visit North Carolina A Unit of the Economic Development Partnership of North Carolina Report developed in conjunction with Executive Summary Applying conservative
BRAZIL INTERNATIONAL INBOUND TRAVEL MARKET PROFILE (2011) Copyright 2012 by the U.S. Travel Association. All Rights Reserved.
 Copyright 2012 by the U.S. Travel Association. All Rights Reserved.") BRAZIL INTERNATIONAL INBOUND TRAVEL MARKET PROFILE (211) Copyright 212 by the U.S. Travel Association. All Rights Reserved. EXECUTIVE SUMMARY With a population of nearly 2 million and a GDP exceeding $2
BRAZIL INTERNATIONAL INBOUND TRAVEL MARKET PROFILE (211) Copyright 212 by the U.S. Travel Association. All Rights Reserved. EXECUTIVE SUMMARY With a population of nearly 2 million and a GDP exceeding $2
International Visitation to the Northern Territory. Year ending March 2018
 International Visitation to the Northern Territory Year ending March 2018 The following is a summary of information relevant to the Northern Territory (NT) tourism industry including visitation results
SOUTHERN AFRICA TRAVEL AND TOURISM BAROMETER REPORT 2015
 SOUTHERN AFRICA TRAVEL AND TOURISM BAROMETER REPORT 2015 1 Contents 1. TOURISM TRENDS: GLOBAL AND SOUTHERN AFRICA S MARKET SHARE IN AFRICA... 4 1.1. TOURIST ARRIVALS... 4 1.1.1. Global Tourist Arrivals
IMD World Talent Report Factor 1 : Investment and Development
 THAILAND 2012 2013 2014 2015 2016 Overall Investment & Development Appeal Rank 2016 37 42 24 Readiness 49 of 61 Factor 1 : Investment and Development Total Public Expenditure on Education Percentage of
2016 VISITOR STATISTICS WASHINGTON, DC
 2016 VISITOR STATISTICS WASHINGTON, DC TOTAL VISITATION TO WASHINGTON, DC WASHINGTON, DC (DISTRICT OF COLUMBIA) VISITORS (IN MILLIONS) 20 15 10 Overseas Domestic 15.1 14.9 1.0 1.0 14.1 13.9 18.3 19.0 17.8
EUROPEAN CENTRE FOR DISEASE PREVENTION AND CONTROLInfluenza A(H1N1)v
v") Table 1: Reported new confirmed cases and cumulative number of influenza A(H1N1)v and cumulative deaths among confirmed cases by country as of August, 1: hours (CEST) in the EU and EFTA countries Confirmed
Table 1: Reported new confirmed cases and cumulative number of influenza A(H1N1)v and cumulative deaths among confirmed cases by country as of August, 1: hours (CEST) in the EU and EFTA countries Confirmed
SLOVAKIA. Table 1. FDI flows in the host economy, by geographical origin. (Millions of US dollars)
") Table 1. FDI flows in the host economy, by geographical origin World 1 271 4 095 1 060 1 058 714 4 693 3 267 4 692-6 1 769 3 491 2 825 Developed economies 1 204 4 050 1 036 1 113 485 4 265 1 001 5 084-881
Table 1. FDI flows in the host economy, by geographical origin World 1 271 4 095 1 060 1 058 714 4 693 3 267 4 692-6 1 769 3 491 2 825 Developed economies 1 204 4 050 1 036 1 113 485 4 265 1 001 5 084-881
KINGDOM OF CAMBODIA NATION RELIGION KING 3
 KINGDOM OF CAMBODIA NATION RELIGION KING 3 TOURISM STATISTICS REPORT March 2014 MINISTRY OF TOURISM Statistics and Tourism Information Department No. A3, Street 169, Sangkat Veal Vong, Khan 7 Makara, Phnom
KINGDOM OF CAMBODIA NATION RELIGION KING 3
 KINGDOM OF CAMBODIA NATION RELIGION KING 3 TOURISM STATISTICS REPORT September 2014 MINISTRY OF TOURISM Statistics and Tourism Information Department No. A3, Street 169, Sangkat Veal Vong, Khan 7 Makara,
Effective for all tickets issued where American validation is used. IATA-approved locations classified by American as full service.
 Commissions Base Commission Rates Agencies Located in 50 U.S, Puerto Rico, U.S. Virgin Islands and Canada Agencies Located Outside the 50 U.S., Puerto Rico, U.S. Virgin Islands and Canada Offshore/Trans-border
37th. 36th. 24th 30th 450, , , ,000. Holiday Arrivals 250, , , ,000 50,000 USA. Sweden. Israel. Italy.
 Australia China USA UK Japan Germany Korea Canada Singapore France Malaysia Hong Kong India Taiwan Netherlands New Caledonia French Polynesia Switzerland Thailand Indonesia Sweden Spain Denmark Brazil
Washington, DC 2013 Visitor Statistics
 Washington, DC 2013 Visitor Statistics Washington, DC 2013 Visitor Statistics TOTAL VISITATION TO WASHINGTON, DC In Millions 20 18 16 14 15.8 15.4 1.0 0.8 14.8 15.1 14.9 1.0 1.0 1.0 15.9 1.1 16.6 1.4 16.3
KINGDOM OF CAMBODIA NATION RELIGION KING 3
 KINGDOM OF CAMBODIA NATION RELIGION KING 3 TOURISM STATISTICS REPORT October 2015 MINISTRY OF TOURISM Statistics and Tourism Information Department No. A3, Street 169, Sangkat Veal Vong, Khan 7 Makara,
5.3. Cannabis: Wholesale and Street Prices and Purity Levels
 5. Prices: Cannabis 5.3. Cannabis: Wholesale and Street Prices and Purity Levels HERBAL CANNABIS Africa East Africa Ghana 51.0 39.2-62.7 1999 Kenya 0.2 0.1-0.3-2002 119.8-1996 Madagascar 1.3 1.1-1.4 100.0
KINGDOM OF CAMBODIA NATION RELIGION KING 3
 KINGDOM OF CAMBODIA NATION RELIGION KING 3 TOURISM STATISTICS REPORT June 2014 MINISTRY OF TOURISM Statistics and Tourism Information Department No. A3, Street 169, Sangkat Veal Vong, Khan 7 Makara, Phnom
Base Commission To all destinations 0%
 Commissions Offshore/Transborder Ticketing American Airlines does not pay base commission for tickets issued by travel agents on itineraries originating within the territory of the United States, including
International Tourism Snapshot
 Australia on a high International visitors to Australia Australia welcomed 7.8m international visitors in the year ending June International visitor expenditure in Australia 2017, more than any previous
Tourism Snapshot. A focus on the markets in which the CTC and its partners are active. January 2013 Volume 9, Issue 1.
 Tourism Snapshot Nathan Phillips Square Skating Rink at City Hall Francisco Pardo A focus on the markets in which the CTC and its partners are active www.canada.travel/corporate January 2013 Volume 9,
International Visitation to the Northern Territory. Year ending September 2018
 International Visitation to the Northern Territory Year ending September 2018 INTERNATIONAL VISITORS IN THE NORTHERN TERRITORY YEAR ENDING SEPTEMBER 2018 VISITORS 289,000-1.1% NIGHTS 3.6 MILLION EXPENDITURE
Pistachio Industry Inventory Shipment Report Pounds Crop Year
 Pistachio Industry Inventory Shipment Report Pounds March 2017 Year to Date Summary - Pounds 2016-2017 Crop Year Open Inshell AO Closed Shell Shelling Stock Total 8/31/16 Carryover 46,956,408 41,224,713
DEVELOPMENT AID AT A GLANCE
 DEVELOPMENT AID AT A GLANCE STATISTICS BY REGION 3. AMERICA 2018 edition All the data in this report are available at: http://www.oecd.org/dac/financing-sustainable-development/ 3.1. ODA TO AMERICA - SUMMARY
Post Show Report. The 19th China International Pet Show (CIPS 2015) National Exhibition and Convention Center (Shanghai)
 National Exhibition and Convention Center (Shanghai)") 2015.11.4-7 National Exhibition and Convention Center (Shanghai) The 19th China International Pet Show (CIPS 2015) China Great Wall International Exhibition Co. Ltd. November 2015 Content OVERVIEW... 1
2015.11.4-7 National Exhibition and Convention Center (Shanghai) The 19th China International Pet Show (CIPS 2015) China Great Wall International Exhibition Co. Ltd. November 2015 Content OVERVIEW... 1
International Tourism Snapshot
 International visitors to Australia International visits continue to grow Australia hosted a record number of international visitors in the year ending International visitor expenditure in Australia September
MARKET TRENDS AND OPPORTUNITIES
 Team North America Chicago Los Angeles New York San Francisco MARKET TRENDS AND OPPORTUNITIES Tourism Marketing Workshop Manila, Philippines 10-12 October 2012 Historical Outbound Travel Data United States,
Overseas Visitation Estimates for U.S. States, Cities, and Census Regions: 2015
 U.S. Department of Commerce International Trade Administration National Travel and Tourism Office Overseas Estimates for U.S. States, Cities, and Census Regions: Overseas to U.S. States, Cities, and Census
Exports of Canadian Grain and Wheat Flour
 Canadian Grain Commission Commission canadienne des grain JANUARY CROP YEAR 2011 Exports of Canadian Grain and Wheat Flour date Tonnes (millions) 8.0 7.0 6.0 5.0 4.0 3.0 2.0 1.0 0.0 4.0 3.5 3.0 2.5 2.0
III. TRADE IN COMMERCIAL SERVICES BY CATEGORY
 .. TRADE IN COMMERCIAL SERVICES BY CATEGORY Transportation services China records impressive growth of world transportation services reached $750 billion in 2007, an increase of 19 per cent, following
Exports of Canadian Grain and Wheat Flour
 Canadian Grain Commission Commission canadienne des grain FEBRUARY CROP YEAR 2012 Exports of Canadian Grain and Wheat Flour date Tonnes (millions) 10.0 9.0 8.0 7.0 6.0 5.0 4.0 3.0 2.0 1.0 0.0 6.0 5.5 5.0
THE GROWTH OF THE HOSPITALITY INDUSTRY IN DUBAI
 THE GROWTH OF THE HOSPITALITY INDUSTRY IN DUBAI THE DEFINITION OF TOURISM Tourism is travel for recreational, leisure or business purposes. The World Tourism Organization defines tourists as people "traveling
Exports of Canadian Grain and Wheat Flour
 Canadian Grain Commission Commission canadienne des grain JULY CROP YEAR 2012 Exports of Canadian Grain and Wheat Flour date Tonnes (millions) 14.0 12.0 10.0 8.0 6.0 4.0 2.0 0.0 9.0 8.0 7.0 6.0 5.0 4.0
Intra-African Air Services Liberalization
 Intra-African Air Services Liberalization James Wiltshire Senior Economist, www.iata.org/economics To represent, lead and serve the airline industry Aviation connects African businesses to world markets
2012 Coach & Charter Seminar. 21 February 2012 Presented by Amanda Coghlan Strategic Insights Analyst
 2012 Coach & Charter Seminar 21 February 2012 Presented by Amanda Coghlan Strategic Insights Analyst Destination NSW Lead Government agency for the NSW tourism and events sectors Established as a statutory
Expenditure Share of Visitors Visitor Expenditure expenditure nights per visitor
 Table 23 Modelled domestic overnight visitor expenditure (a) in the top 20 regions ranked by expenditure, including airfares and long distance transport costs Year ended 31 March 2010 (a) (b) Expenditure
International Tourism Snapshot
 International visitors to Australia Total holiday 4,447,000 5.0% 18.9-0.7% NZ 490,000-1.4% 7.5-9.4% Asia 2,292,000 8.6% 15.5-5.3% North America 496,000 4.6% 15.2-7.1% Europe 554,000 0.2% 38.5 8.3% UK 400,000
TABLE 1 VISITOR ARRIVALS. Total Visitor Arrivals +/ Month / / /18
 TABLE 1 VISITOR ARRIVALS Stopover Arrivals +/ Cruise Passengers +/ Total Visitor Arrivals +/ Month 2018 2019 2019/18 2018 2019 2019/18 2018 2019 2019/18 January 194,609 216,509 11.3% 249,635 249,239 0.2%
Cost of Food at Home for a week in Alaska - March 2000
 Cost of Food at Home for a week in Alaska - March 2000 Kenai Soldotna Mat-Su Bor. Portland Oregon Family of 2 (20-50 years) 58.53 95.24 87.67 103.2 57.74 62.12 65.53 60.73 78.78 65.76 92.92 70.29 85.24
U.S. Travel and Tourism Report
 2014/TWG44/010 Agenda Item: 18 U.S. Travel and Tourism Report Purpose: Information Submitted by: United States 44 th Tourism Working Group Meeting Cusco, Peru 9-10 April 2014 U.S. Travel and Tourism Report
DEVELOPMENT AID AT A GLANCE
 DEVELOPMENT AID AT A GLANCE STATISTICS BY REGION 3. AMERICA 26 edition 3.. ODA TO AMERICA - SUMMARY 3... Top ODA receipts by recipient USD million, net disbursements in 24 3..3. Trends in ODA Colombia
Exports of Canadian Grain and Wheat Flour
 Canadian Grain Commission Commission canadienne des grain MAY 2011 CROP YEAR Exports of Canadian Grain and Wheat Flour date Tonnes (millions) 14.0 12.0 10.0 8.0 6.0 4.0 2.0 0.0 7.0 6.0 5.0 4.0 3.0 2.0
International Students Headcount & Credit Hour Enrollment Summary
 International Students & Credit Hour Enrollment Summary by Student Classification Fall & Fall // - Census - - -.%.% -.%.% Student Type: First-time First Time-PreCollege First Time-New in College First
Tourism Snapshot A focus on the markets that the CTC and its partners are active in
 Tourism Snapshot A focus on the markets that the CTC and its partners are active in www.canada.travel/corporate February 2011 Volume 7, Issue 2 Key highlights In the first two months of 2011 overnight
SURVEY OUTGOING TOURISTS
 SURVEY OF OUTGOING TOURISTS 2006 SURVEY OF OUTGOING TOURISTS 2006 MINISTRY OF TOURISM, LEISURE & EXTERNAL COMMUNICATIONS REPUBLIC OF MAURITIUS FOREWORD The 2006 Survey of Outgoing Tourists was the eleventh
Outlook for air travel markets
 Outlook for air travel markets June 2016 Brian Pearce Chief Economist International Air Transport Association Extended period of strong air travel market growth 30% 25% 20% 15% 10% 5% 0% -5% -10% -15%
2008 Lodging Industry Profile. All figures are for year-end Figures for 2008 will be available in fall 2009.
 2008 Lodging Industry Profile All figures are for year-end 2007. Figures for 2008 will be available in fall 2009. 2007 At-a-Glance Statistical Figures 48,062 properties* 4,476,191 guestrooms $139.4 billion
International Visitors to New England. DNE Summit 2016 Newport, RI
 International Visitors to New England DNE Summit 2016 Newport, RI 1 Travel Market Insights Inc. The right data good relevant KPI s Not everything that can be counted counts, and not everything that counts
22 PEW RESEARCH CENTER. Topline Results. Pew Research Center Spring 2014 survey October 16, 2014 Release
 22 Topline Results Pew Research Center Spring 2014 survey October 16, 2014 Release Methodological notes: Survey results are based on national samples. For further details on sample designs, see Survey
INTERNATIONAL REGISTRY IN ORGAN DONATION and TRANSPLANTATION
 INTERNATIONAL REGISTRY IN ORGAN DONATION and TRANSPLANTATION www.irodat.org Final Numbers 2016 December 2017 Dear colleagues On behalf of all IRODaT staff, we are glad to present the 2016 final numbers
COUNTRY & TERRITORY PROFILES A Summary of Oil Spill Response Arrangements & Resources Worldwide
 3. COUNTRY & TERRITORY PROFILES (including date of update) A Albania August 2010 Antigua January 2009 Algeria May 2011 Argentina December 2015 Angola May 2009 Aruba April 2008 Anguilla November 2005 Australia
2017 VISITOR STATISTICS WASHINGTON, DC
 2017 VISITOR STATISTICS WASHINGTON, DC TOTAL VISITATION TO WASHINGTON, DC WASHINGTON, DC (DISTRICT OF COLUMBIA) VISITORS (IN MILLIONS) 20 15 10 5 Overseas Domestic 14.9 1.0 13.9 15.9 1.1 16.6 16.3 1.4
% change vs. Dec ALL VISITS (000) 2,410 12% 7,550 5% 31,148 1% Spend ( million) 1,490 15% 4,370-1% 18,710 4%
 2,410 12% 7,550 5% 31,148 1% Spend ( million) 1,490 15% 4,370-1% 18,710 4%") HEADLINES FULL YEAR 2012 (PROVISIONAL) 1 Overall visits 31.148 million visits making 2012 the best year for inbound tourism since 2008 but not a record. 1% increase in visits on 2011 (30.798 visits) slightly
HEADLINES FULL YEAR 2012 (PROVISIONAL) 1 Overall visits 31.148 million visits making 2012 the best year for inbound tourism since 2008 but not a record. 1% increase in visits on 2011 (30.798 visits) slightly
Copyrights Statistics Botswana 2016
 STATISTICS BOTSWANA TOURISM STATISTICS ANNUAL REPORT 2014 Copyrights Statistics Botswana 2016 Statistics Botswana. Private Bag 0024 Botswana Tel: (267) 367 1300. Fax: (267) 395 2201.Email: info@statsbots.org.bw
Tourism Snapshot A focus on the markets in which the CTC and its partners are active
 Tourism Snapshot A focus on the markets in which the CTC and its partners are active www.canada.travel/corporate January 214 Volume 1, Issue 1 Key highlights Total arrivals from CTC s international markets
Tourism Snapshot. A focus on the markets in which the CTC and its partners are active. October 2012 Volume 8, Issue 10.
 Tourism Snapshot Niagara Helicopters Tour A focus on the markets in which the CTC and its partners are active www.canada.travel/corporate October 2012 Volume 8, Issue 10 Total arrivals from CTC s international
Exports of Canadian Grain and Wheat Flour
 Canadian Grain Commission Commission canadienne des grain APRIL CROP YEAR - Exports of Canadian Grain and Wheat Flour 2005- - date Tonnes (millions) 14.0 12.0 10.0 8.0 6.0 4.0 2.0 0.0 5.0 4.5 4.0 3.5 3.0
Summer Work Travel Season Program Dates by Country
 The program dates are windows of opportunity for program participation. Within this timeframe, students are still subject to their university's official academic break schedule. Even though the window
International Visitation to the Northern Territory. Year ending December 2017
 International Visitation to the Northern Territory Year ending December 2017 The following is a summary of information relevant to the Northern Territory (NT) tourism industry including visitation results
Colombia: An Upcoming Emerging Market for International Investors April 2012
 Colombia: An Upcoming Emerging Market for International Investors April 2012 Proexport is the organization within the Colombian Government responsible for the promotion of International Tourism, Foreign
REPUBLIC OF KOREA. Table 1. FDI flows in the host economy, by geographical origin. (Millions of US dollars)
") Table 1. FDI flows in the host economy, by geographical origin World 4 130 3 395 4 383 8 980 7 050 4 950 2 629 8 409 7 501 8 117 10 247 11 117 Developed economies 3 123 2 385 2 949 7 185 5 743 3 423-275
Table 1. FDI flows in the host economy, by geographical origin World 4 130 3 395 4 383 8 980 7 050 4 950 2 629 8 409 7 501 8 117 10 247 11 117 Developed economies 3 123 2 385 2 949 7 185 5 743 3 423-275
2015 SAN DIEGO VISITOR PROFILE
 2015 SAN DIEGO VISITOR PROFILE (UPDATED SEPTEMBER 2016) SAN DIEGO VISITOR PROFILE 6 THE SAN DIEGO VISITOR INDUSTRY In San Diego, the visitor industry is the second largest traded economy behind the research
International Visitation to the Northern Territory. Year ending September 2017
 International Visitation to the Northern Territory Year ending September 2017 The following is a summary of information relevant to the Northern Territory (NT) tourism industry including visitation results
Western Cape Destination Performance Report: April-June 2016
 Number of arrivals (millions) Western Cape Destination Performance Report: April-June 2016 Global Tourism Performance According to the United Nations World Tourism Organisation, international tourist arrivals
The Nordic Countries in an International Comparison. Helga Kristjánsdóttir 20. apríl 2012
 The Nordic Countries in an International Comparison Helga Kristjánsdóttir 20. apríl 2012 15 Figure 1. World Bank, GDP growth (annual %) 10 5 0 1961 1963 1965 1967 1969 1971 1973 1975 1977 1979 1981 1983
(A) Comparative Summary of Canadian Grain Exports (A) Comparative Summary of Canadian Grain Exports
 Comparative Summary of Canadian Grain Exports (A) Comparative Summary of Canadian Grain Exports") (A) Comparative Summary of Canadian Grain Exports 3 Wheat Amber Durum Oat Barley Rye Flax Canola Soybeans Peas Corn Lentil Total, 2013 947.0 318.7 52.9 103.3 3.3 29.2 685.5 8.3 323.2 18.9 8.3 2,498.5 February,
(A) Comparative Summary of Canadian Grain Exports 3 Wheat Amber Durum Oat Barley Rye Flax Canola Soybeans Peas Corn Lentil Total, 2013 947.0 318.7 52.9 103.3 3.3 29.2 685.5 8.3 323.2 18.9 8.3 2,498.5 February,
Tourism Snapshot A focus on the markets that the CTC and its partners are active in
 Tourism Snapshot A focus on the markets that the CTC and its partners are active in Newfoundland and Labrador www.canada.travel/corporate October 2011 Volume 7, Issue 10 Key highlights In October 2011,
Accounting Basis by Country
 Accounting Basis by Country Egypt Africa Northern Africa Morocco Africa Northern Africa Sudan Africa Northern Africa Western Sahara Africa Northern Africa Angola Africa Sub-Saharan Africa Benin Africa
Summer Work Travel Season Program Dates by Country
 The program dates are windows of opportunity for program participation. Within this timeframe, students are still subject to their university's official academic break schedule. Even though the window
INTERNATIONAL TRAVEL AND TOURISM
 INTERNATIONAL TRAVEL AND TOURISM YEAR 2014 1. INTRODUCTION This issue of the Economic and Social Indicators presents data on International Travel and Tourism for the year 2014. A brief on the compilation
GODINA XI SARAJEVO, BROJ 2 TOURISM STATISTICS. Tourism in BIH, February 2017
 number of nights GODINA XI SARAJEVO, 06.04.2017. BROJ 2 TOURISM STATISTICS Tourism in BIH, February 2017 In February 2017 tourists realised 56,042 tourist arrivals in Bosnia and Hercegovina which represent
Financial Reporting Standards Adoption by Country
 Financial Reporting Standards Adoption by Country Egypt Africa Northern Africa Morocco Africa Northern Africa Sudan Africa Northern Africa Western Sahara Africa Northern Africa Angola Africa Sub-Saharan
Global Travel Trends 2005
 Preliminary World Travel Monitor Results from IPK international for the ITB Berlin Message, 03/10/06 Global Travel Trends 2005 Based on the new data from the 2005 World Travel Monitor, and as it does every
CROATIA. Table 1. FDI flows in the host economy, by geographical origin. (Millions of US dollars)
") Table 1. FDI flows in the host economy, by geographical origin World 1 307 1 153 2 107 1 210 1 844 3 228 4 928 5 941 3 566 515 1 511 1 370 Developed economies 1 207 1 113 1 719 1 190 1 885 3 093 4 775
Table 1. FDI flows in the host economy, by geographical origin World 1 307 1 153 2 107 1 210 1 844 3 228 4 928 5 941 3 566 515 1 511 1 370 Developed economies 1 207 1 113 1 719 1 190 1 885 3 093 4 775
The World Pasta Industry in 2011
 The World Pasta Industry in 2011 Survey The World Pasta Industry in 2011 25 October 2012 1 Like every year, we have completed our Annual Survey on the World Pasta Industry. We would like to thank all the
Broadband as an opportunity for Development
 Broadband as an opportunity for Development December 2013 Antonio García Zaballos http://www.iadb.org The Inter-American Development Bank Discussion Papers and Presentations are documents prepared by both
Performance Derby: MSCI Share Price Indexes
 Performance Derby: MSCI Share Price Indexes January 5, 2018 Dr. Ed Yardeni 516-972-7683 eyardeni@yardeni.com Joe Abbott 732-497-5306 jabbott@yardeni.com Please visit our sites at blog.yardeni.com thinking
The Economic Impact of Travel in Minnesota Analysis
 The Economic Impact of Travel in Minnesota 2013 Analysis Overview 2013 Highlights Traveler Spending Traveler spending of $10.3 billion generated $17.6 billion in total business sales in 2013 as travel
Exports of Canadian Grain and Wheat Flour
 Canadian Grain Commission Commission canadienne des grain SEPTEMBER CROP YEAR -2010 Exports of Canadian Grain and Wheat Flour - -2010 date Tonnes (millions) 4.0 2.0 3.5 3.0 1.5 2.5 2.0 1.0 1.5 1.0 0.5
An overview of Tallinn tourism trends
 An overview of Tallinn tourism trends August 2015 The data is collected from Statistics Estonia, Tallinn Airport and Port of Tallinn. In August 2015, 179,338 stayed overnight in Tallinn s accommodation
Membership & Voting Strength - 1 October September 2020
 ship & Voting Strength - 1 October 2016-30 September 2020 Assessment Period - 1 October 2012-30 September 2016 Junior Team Championships Junior - Championships Junior - Championships Junior - Africa 1