International Visitors to New England. DNE Summit 2016 Newport, RI
|
|
|
- Cody Stephens
- 6 years ago
- Views:
Transcription


1 International Visitors to New England DNE Summit 2016 Newport, RI 1

2 Travel Market Insights Inc. The right data good relevant KPI s Not everything that can be counted counts, and not everything that counts can be measured - Albert Einstein Strategic Market Analysis - Identify opportunity - Understand Competitive Position - Analyze Strengths & Weaknesses - Strategic Recommendations for Growth Annual Annual Biannual Biannual Biannual Annual Country specific Country specific Country specific Consumer (Visitor) Trade Passenger Annual Visitor Analysis: Custom Strategic Support U.S. Inbound Travel Monitor: Projected visits and competitive situation Travel Trade Barometer: Product demand, bookings, projected bookings 2

3 International Visitors to New England 3


4 World Tourism Arrivals & Receipts Arrivals B Receipts $1.25 T Source: U.N. World Tourism Organization, April
5 WHY TOURISM MATTERS 9% GDP (direct, indirect, and induced) 1/11 JOBS (direct, indirect, and induced) induced) US$ 1.5 TRILLION IN EXPORTS 6% OF WORLDS EXPORTS 30% OF SERVICES EXPORTS 1.8 Billion International Tourists Forecast for 2030 Source: UNWTO Tourism Highlights, 2015 Edition 5


6 The Rise of the Global Middle Class Linda Yue, Chief business correspondent BBC June
 increased 51% since 2009 (P) Preliminary, subject to")

7 Resilient Growth International Arrivals increased 36% from 2009 to 2014 Visitor Spending (exports) increased 51% since 2009 (P) Preliminary, subject to revisions. Sources: Department of Commerce, National Travel and Tourism Office; Bureau of Economic Analysis; Statistics Canada; Banco de Mexico. Map Design by Jeff Quire 7


8 International Travel Share of Total U.S. Travel Bureau of Economic Analysis demand components 18% of all Travel Spend is International Note: Subject to revisions. Sources: Department of Commerce, National Travel and Tourism Office; Bureau of Economic Analysis; Statistics Canada; Banco de Mexico. 8
9 Improving Shoulder Season Overseas Visitors to USA ,887,934 8,898,287 10,134,942 8,497,853 1ST QUARTER 2ND QUARTER 3RD QUARTER 4TH QUARTER Brazilian Travel to USA , , , ,538 1ST QUARTER 2ND QUARTER 3RD QUARTER 4TH QUARTER Discover New England September 2015 Discover New England 21st Annual Tourism Summit April

10 2014 New England Total Overnight Visits = 5.04 Million Canada = 61% Overseas = 38% Mexico = 1% Note: Canadian visits are cumulative which includes multiple visits by one traveler to more than one state. Sources: Travel Market Insights, DNE custom SIAT data; NTTO; Statistics Canada. 10

11 2014 New England Visitor Nights Average Nights Spent In New England: Overseas = 12.7 Canada = 3.6 Overseas visitors spent 3.5 times longer in New England than Canadian visitors in Sources: Travel Market Insights; NTTO; Statistics Canada. 11
12 2014 New England Total Spend by Overnight Visitors 2014 New England Spend by Overnight Visitors Canada Visitor Spend $1,203,415,400 Overseas Visitor Spend $1,857,704,500 Overseas visitors spend more than 1.5 times more than Canadian visitors in Sources: Travel Market Insights; DNE custom SIAT data, NTTO; Statistics Canada. 12


13 Annual Report Initiated in 2012 Focused on New England In-depth Metrics by Top Countries 13

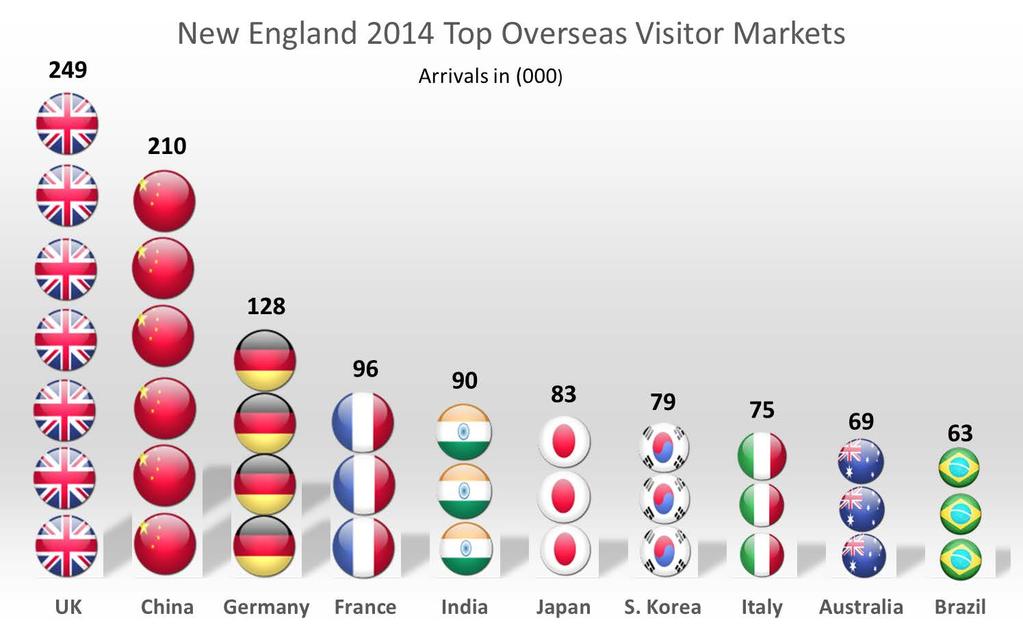
14 Record Overseas Visitor Arrivals Up 48% Since
15 15

16 PORT OF ENTRY OF OVERSEAS VISITORS OVERSEAS VISITORS TO NEW ENGLAND 2014 Boston, MA 31.5 New York, NY 28.9 Newark, NJ 7.8 Miami, FL Los Angeles, CA Chicago, IL Washington, DC San Francisco, CA Detroit, MI Percent Source: Travel Market Insights, Survey of International Air Travelers to the United States

17 Converting Passengers to Visitors 90% of 2014 passengers officially entering Boston Logan International Airport visited New England. Growth in air routes into Boston Logan International Airport equates to more visitors throughout New England. 17
18 Boston Int l Routes Added & Retained Since 2006 BOS Int'l Routes Added & Retained Since International Routes 1.1 Million Non-U.S. Citizen Passenger Arrivals in Non-U.S. Citizen Passenger Arrivals increased 9% New routes being added in 2016 BOS Route Start 1 Cologne Jun'16 2 Dusseldorf May'16 3 Manchester May'16 4 Oslo May'16 5 Copenhagen Mar'16 6 London-Gatwick Mar'16 7 Doha Mar'16 8 Fort de France Dec'15 9 Pointe a Pitre Dec'15 10 Barbados Nov'15 11 Hong Kong May'15 12 Mexico City Jun'15 13 Tel Aviv Jun'15 14 Shanghai Jun'15 15 Port au Prince Jun' Dubai Istanbul Mar'14 May'14 18 Beijing Jun' Liberia, CR Puerto Plata Nov'14 Nov'14 21 St Lucia Nov'14 22 Panama City, Panama Jul'13 23 Tokyo Apr'12 24 Grand Cayman Nov'12 25 Santiago, DR Jun'11 26 St. Maarten Feb'09 27 Toronto-City Ctr Sep' Dublin Madrid Mar'07 May'07 30 Punta Cana Jan'06 31 Lisbon Jun'06 32 Terceira Jun'06 18


19 Counting Visitors To, Within, & Throughout the USA Understanding NE competitive position 19

20 NUMBER OF STATES VISITED OVERSEAS VISITORS TO NEW ENGLAND / U.S Percent of visitors visiting only ONE STATE: Ave. Number of States Visited U.S. Visitors = 73% New England Visitors = 31% U.S. Visitors New England Visitors Source: Travel Market Insights, Survey of International Air Travelers to the United States

21 Percent MAIN PURPOSE OF U.S. TRIP OVERSEAS VISITORS TO NEW ENGLAND / U.S Leisure Visitor Potential U.S. Visitors 40.0 New England Visitors Vacation Friend/Relative Business Convention Study Other Source: Travel Market Insights, Survey of International Air Travelers to the United States
22 Information Sources TRAVEL INFORMATION SOURCES* OVERSEAS VISITORS TO NEW ENGLAND / U.S Airline Online Travel Agency Personal Recommendation Travel Agency Office Corporate Travel Department Travel Guide New England Visitors U.S. Visitors Nat'l/State/City Travel Ofc Tour Operator/Travel Club Other Percent Source: Travel Market Insights, Survey of International Air Travelers to the United States * = multiple response

23 Cumulative Comparative Ranking - CCR 23


24 Product Demand Assessment Index Index Rank for Country to NE vs. Country to USA UK to New England Index Rank Snow Sports 1 Historical Locations 2 Small Towns/Countryside 3 Art Galleries/Museums 4 Camping/Hiking 5 Guided Tour(s) 6 Experience Fine Dining 7 Cultural/Ethnic Heritage Sights 8 Environmental/Eco. Excursions 9 National Parks/Monuments 10 Sporting Event 11 Sightseeing 12 Shopping 13 Water Sports 14 Golfing/Tennis 15 Concert/Play/Musical 16 Amusement/Theme Parks 17 Hunting/Fishing 18 Other 19 Nightclubbing/Dancing 20 American Indian Communities 21 Casino/Gamble 22 Index under
25 Reaching 100 Million by 2021 (P) Preliminary, subject to revisions. Sources: Department of Commerce, National Travel and Tourism Office; Bureau of Economic Analysis; Statistics Canada; Banco de Mexico. Map Design by Jeff Quire Alaska, Hawaii, Guam and other U.S. Territories not shown. 25
26 26

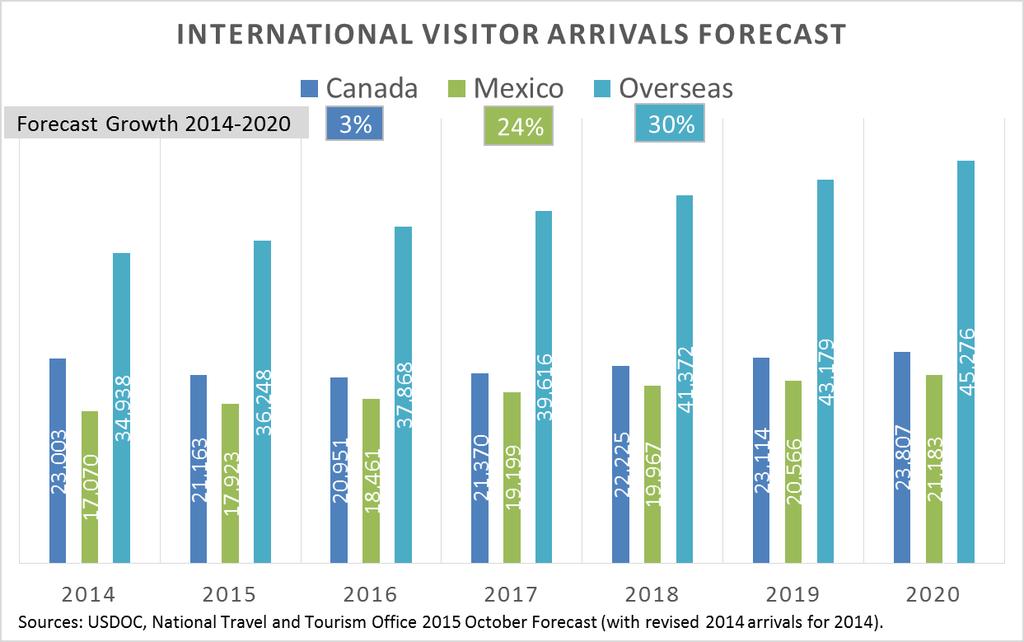
27 Percent change Forecast, subject to revisions. Sources: U.S. Department of Commerce, National Travel and Tourism Office; Bureau of Economic Analysis; Statistics Canada; Banco de Mexico Fall 2015 Forecast. 27

28 Arrivals in (000) Forecast, subject to revisions. Sources: U.S. Department of Commerce, National Travel and Tourism Office; Bureau of Economic Analysis; Statistics Canada; Banco de Mexico Fall 2015 Forecast. 28


29 Summary Opportunity Growth 100 Million Visitors by 2021 Both Traditional and Emerging Markets are key. Overseas Visitors to NE Travel Regionally! Stay longer, increase room nights and RevPar, offer off-season growth and diversity, need to focus on leisure. Growth in Air Routes at Boston Logan International and potentially other New England airports = ACCESS to the global visitor opportunity. Partnerships! Discover New England, Brand USA, Massport, Boston CVB, and others: Retail, University/Education, and Medical industries offer unprecedented marketing leverage and means to grow. 29
30 Thank You! Scott Johnson, Travel Market Insights Inc. 30
Massport. Airline Route Development at Boston Logan
 Massport Airline Route Development at Boston Logan Presentation to MLA: July 13, 2017 Airline Route Development is a Core Element of Massport s Mission Enhance the economic growth in Massachusetts and
CHARACTERISTICS OF TRAVELERS FROM CHINA TO CALIFORNIA
 CHARACTERISTICS OF TRAVELERS FROM CHINA TO CALIFORNIA - 2015 In 2015 visitation to California rose to a record high of approximately 1,162,000, making California s largest overseas market.* Collectively,
TOP INTERNATIONAL MARKETS FOR NATIVE AMERICAN TOURISM
 TOP INTERNATIONAL MARKETS FOR NATIVE AMERICAN TOURISM Ron Erdmann National Travel & Tourism Office Industry & Analysis, International Trade Administration September 12, 2017 National Travel & Tourism Office
BRAZIL INTERNATIONAL INBOUND TRAVEL MARKET PROFILE (2011) Copyright 2012 by the U.S. Travel Association. All Rights Reserved.
 Copyright 2012 by the U.S. Travel Association. All Rights Reserved.") BRAZIL INTERNATIONAL INBOUND TRAVEL MARKET PROFILE (211) Copyright 212 by the U.S. Travel Association. All Rights Reserved. EXECUTIVE SUMMARY With a population of nearly 2 million and a GDP exceeding $2
BRAZIL INTERNATIONAL INBOUND TRAVEL MARKET PROFILE (211) Copyright 212 by the U.S. Travel Association. All Rights Reserved. EXECUTIVE SUMMARY With a population of nearly 2 million and a GDP exceeding $2
CHARACTERISTICS OF TRAVELERS FROM AUSTRALIA TO CALIFORNIA 2013
 CHARACTERISTICS OF TRAVELERS FROM AUSTRALIA TO CALIFORNIA 2013 In 2013, was California s third largest overseas market to California with approximately 553,000 visitors to California. It was surpassed
CHARACTERISTICS OF TRAVELERS FROM THE UNITED KINGDOM TO CALIFORNIA
 CHARACTERISTICS OF TRAVELERS FROM THE UNITED KINGDOM TO CALIFORNIA - 2015 The UK was California s second largest overseas market with approximately 705,000 visitors to California in 2015, up from 686,000
CHARACTERISTICS OF TRAVELERS FROM SOUTH AMERICA TO CALIFORNIA 2015
 CHARACTERISTICS OF TRAVELERS FROM SOUTH AMERICA TO CALIFORNIA 2015 The South n region is a large and growing overseas market with approximately 492,000 combined visitors to California in 2015. Collectively
U.S. Travel and Tourism Report
 2014/TWG44/010 Agenda Item: 18 U.S. Travel and Tourism Report Purpose: Information Submitted by: United States 44 th Tourism Working Group Meeting Cusco, Peru 9-10 April 2014 U.S. Travel and Tourism Report
CHARACTERISTICS OF TRAVELERS FROM SOUTH AMERICA TO CALIFORNIA 2014
 CHARACTERISTICS OF TRAVELERS FROM SOUTH AMERICA TO CALIFORNIA 2014 South was one of California s large overseas markets with approximately 467,000 visitors to California in 2014. Collectively visitors
2016 VISITOR STATISTICS WASHINGTON, DC
 2016 VISITOR STATISTICS WASHINGTON, DC TOTAL VISITATION TO WASHINGTON, DC WASHINGTON, DC (DISTRICT OF COLUMBIA) VISITORS (IN MILLIONS) 20 15 10 Overseas Domestic 15.1 14.9 1.0 1.0 14.1 13.9 18.3 19.0 17.8
January Air Traffic Statistics. Prepared by the Office of Marketing & Consumer Strategy
 January 218 Air Traffic Statistics Prepared by the Office of Marketing & Consumer Strategy This report includes only data submitted by airlines as of the date of publication: March 21, 218. Reports are
CHARACTERISTICS OF TRAVELERS FROM MEXICO (Air) TO CALIFORNIA
 TO CALIFORNIA") CHARACTERISTICS OF TRAVELERS FROM MEXICO (Air) TO CALIFORNIA - 2013 Air travelers from Mexico represent one of the largest international markets for California with approximately 515,000 visitors to the
CHARACTERISTICS OF TRAVELERS FROM MEXICO (Air) TO CALIFORNIA - 2013 Air travelers from Mexico represent one of the largest international markets for California with approximately 515,000 visitors to the
September Air Traffic Statistics. Prepared by the Office of Marketing & Consumer Strategy
 September 217 Air Traffic Statistics Prepared by the Office of Marketing & Consumer Strategy This report includes only data submitted by airlines as of the date of publication: November 15, 217. Reports
Overseas Visitation Estimates for U.S. States, Cities, and Census Regions: 2015
 U.S. Department of Commerce International Trade Administration National Travel and Tourism Office Overseas Estimates for U.S. States, Cities, and Census Regions: Overseas to U.S. States, Cities, and Census
THE GROWTH OF THE HOSPITALITY INDUSTRY IN DUBAI
 THE GROWTH OF THE HOSPITALITY INDUSTRY IN DUBAI THE DEFINITION OF TOURISM Tourism is travel for recreational, leisure or business purposes. The World Tourism Organization defines tourists as people "traveling
December Air Traffic Statistics. Prepared by the Office of Marketing & Consumer Strategy
 December 217 Air Traffic Statistics Prepared by the Office of Marketing & Consumer Strategy 1 This report includes only data submitted by airlines as of the date of publication: February 2, 217. Reports
The European Hotel Market
 The European Hotel Market Boutique and Lifestyle Hotel Summit 2017 Sophie Colvin Business Development scolvin@str.com 2016 STR, Inc. All Rights Reserved. Any reprint, use or republication of all or a part
FLYING TIME* AIR- LINE SAINT LUCIA. Saint Lucia Saturday May 5 / 18 to Oct 27 / 18 5 ARUBA
 Flying at a glance Sun destinations 018 FROM TORONTO ANTIGUA AIR- LINE FROM TORONTO (cont.) SAINT LUCIA AIR- LINE Antigua Saturday May 5 / 18 to Oct 7 / 18 4.5 Saint Lucia Saturday May 5 / 18 to Oct 7
2014 Tourism Statistics Region 8
 2014 Tourism Statistics Region 8 Tourism Research Unit Fall 2016 Economic Indicators Source: Oxford Economics; Ministry of Tourism, Culture and Sport 2 2014 Notable Events February 7 23 The XXII Olympic
Finding Rationality in an Irrational World: The Economics of Successful Hotel Negotiations
 Finding Rationality in an Irrational World: The Economics of Successful Hotel Negotiations Isaac Collazo, Vice President, Performance Strategy & Planning, InterContinental Hotels Group (IHG) Maria Lowry,
Tourism Snapshot A focus on the markets in which the CTC and its partners are active
 Tourism Snapshot A focus on the markets in which the CTC and its partners are active www.canada.travel/corporate January 214 Volume 1, Issue 1 Key highlights Total arrivals from CTC s international markets
Overseas and Mexican Visitors To California
 Overseas and Mexican Visitors To California 2013 A joint marketing venture of Visit California and the California Business, Transportation and Housing Agency, Division of Tourism October 2014 CIC Research,
Overseas and Mexican Visitors To California
 Overseas and Mexican Visitors To California 2014 A joint marketing venture of Visit California and the California Business, Transportation and Housing Agency, Division of Tourism November 2015 CIC Research,
November Air Traffic Statistics. Prepared by the Office of Corporate Risk and Strategy
 November 214 Air Traffic Statistics Prepared by the Office of Corporate Risk and Strategy Air Traffic Statistics Table of Contents Summary Air Traffic Summary... 1 SH&E Air Traffic Schedule Activity...
Tourism Snapshot. June 2015 Volume 11, Issue 6. A focus on the markets in which Destination Canada (DC) and its partners are active.
 and its partners are active.") Tourism Snapshot Tourism PEI / Paul Baglole A focus on the markets in which Destination Canada (DC) and its partners are active. www.destinationcanada.com June Volume 11, Issue 6 Key highlights Over the
Tourism Snapshot Tourism PEI / Paul Baglole A focus on the markets in which Destination Canada (DC) and its partners are active. www.destinationcanada.com June Volume 11, Issue 6 Key highlights Over the
2014 Tourism Statistics Region 12
 2014 Tourism Statistics Region 12 Tourism Research Unit Fall 2016 Economic Indicators Source: Oxford Economics; Ontario Ministry of Tourism, Culture and Sport 2 2014 Notable Events February 7 23 The XXII
Tourism Snapshot A focus on the markets in which the CTC and its partners are active
 Tourism Snapshot A focus on the markets in which the CTC and its partners are active www.canada.travel/corporate June Volume 1, Issue 6 Key highlights CTC s overseas markets leaped 1% over the same month
June Air Traffic Statistics. Prepared by the Office of Corporate Risk and Strategy
 June 214 Air Traffic Statistics Prepared by the Office of Corporate Risk and Strategy Air Traffic Statistics Table of Contents Summary Air Traffic Summary... 1 SH&E Air Traffic Schedule Activity... 3 Passenger
air traffic statistics
 September 213 air traffic statistics Prepared by the Office of Finance Department of Internal Controls, Compliance and Financial Strategy Commercial Total Int'l Dom Passengers % Change Air Traffic Summary
Tourism Snapshot. A focus on the markets in which the CTC and its partners are active. February 2015 Volume 11, Issue 2.
 Tourism Snapshot Tourism Whistler/Mike Crane A focus on the markets in which the CTC and its partners are active www.canada.travel/corporate February Volume 11, Issue 2 Key highlights The strong beginning
China Fact Sheet Targets (Rev. Aug 2013)
") China Overview Hawai i Tourism China will be represented by Travel Link Marketing (TLM) beginning January. TLM was established in 2005 with its offices in Beijing, Shanghai, Guangzhou and Chengdu. We look
China Overview Hawai i Tourism China will be represented by Travel Link Marketing (TLM) beginning January. TLM was established in 2005 with its offices in Beijing, Shanghai, Guangzhou and Chengdu. We look
BUSINESS BAROMETER December 2018
 Credit: Chris Orange BUSINESS BAROMETER December Credit: Nigel Moore 1 Contents Summary of findings 3 Annual monthly performance: visitor attractions..4 Visit Herts Team update 5 National context.8 Visitor
KEFLAVÍK AIRPORT FROM A STROLL THROUGH CENTRAL PARK TO A SEAT ON THE LONDON EYE FACTS AND FIGURES 2017
 N 51 30 15.5052 W 0 4 34.2336 FROM A STROLL THROUGH CENTRAL PARK Wake up in New York and drink your morning coffee at the park before you get to work. TO A SEAT ON THE LONDON EYE Enjoy in the evening a
Jan-18. Dec-17. Travel is expected to grow over the coming 6 months; at a slower rate
 Analysis provided by TRAVEL TRENDS INDEX DECEMBER 2018 CTI reading of 51.8 in December 2018 indicates that travel to or within the U.S. grew 3.6% in December 2018 compared to December 2017. LTI predicts
TravelClick: Business Intelligence Lodging Outlook. Sara Duggan. Regional Vice President, Business Intelligence TravelClick 03/23/18
 TravelClick: Business Intelligence 2018 Lodging Outlook Sara Duggan Regional Vice President, Business Intelligence TravelClick 03/23/18 25,000+ Partners 25 283 Million $49 Billion 365 North America Markets
Oct-17 Nov-17. Travel is expected to grow over the coming 6 months; at a slower rate
 Analysis provided by TRAVEL TRENDS INDEX OCTOBER 2018 CTI reading of 51.6 in October 2018 indicates that travel to or within the U.S. grew 3.2% in October 2018 compared to October 2017. LTI predicts travel
August Air Traffic Statistics. Prepared by the Office of Marketing & Consumer Strategy
 August 218 Air Traffic Statistics Prepared by the Office of Marketing & Consumer Strategy This report includes only data submitted by airlines as of the date of publication: October 17, 218. Reports are
Impact of Advance Purchase and Length-of-Stay on Average Ticket Prices in Top Business Destinations
 Impact of Advance Purchase and Length-of-Stay on Average Ticket Prices in Top Business Destinations Research Summary Average ticket prices continue to trend downward in 2016, but since 2014 there have
International Convention Badges
 Images may not be the actual size. (Reduced the image sizes to save white space in the catalog) Images provided by Lion Verle Malik Created 07/24/2015. 1923 1924 1925 7th Annual Convention June 26-29,
Oct-17 Nov-17. Sep-17. Travel is expected to grow over the coming 6 months; at a slightly faster rate
 Analysis provided by TRAVEL TRENDS INDEX SEPTEMBER 2018 CTI reading of.8 in September 2018 indicates that travel to or within the U.S. grew 1.6% in September 2018 compared to September 2017. LTI predicts
Tourism Snapshot A focus on the markets in which the CTC and its partners are active
 Tourism Snapshot A focus on the markets in which the CTC and its partners are active www.canada.travel/corporate May Volume 1, Issue 5 Key highlights Total arrivals from CTC s international markets improved
49 May-17. Jun-17. Travel is expected to grow over the coming 6 months; at a slower rate
 Analysis provided by TRAVEL TRENDS INDEX MAY 2018 CTI reading of 51.7 in May 2018 shows that travel to or within the U.S. grew 3.4% in May 2018 compared to May 2017. LTI predicts moderating travel growth
Washington, DC 2013 Visitor Statistics
 Washington, DC 2013 Visitor Statistics Washington, DC 2013 Visitor Statistics TOTAL VISITATION TO WASHINGTON, DC In Millions 20 18 16 14 15.8 15.4 1.0 0.8 14.8 15.1 14.9 1.0 1.0 1.0 15.9 1.1 16.6 1.4 16.3
April 2012 Visitor Profile
 RESEARCH DATA SERVICES, INC. 777 SOUTH HARBOUR ISLAND BOULEVARD SUITE 260 TAMPA, FLORIDA 33602 TEL (813) 254-2975 FAX (813) 223-2986 Naples, Marco Island, Everglades Convention and Visitors Bureau April
Tourism Statistics RTO 11
 Tourism Statistics RTO 11 Tourism Research Unit Spring 2012 1 1 Tourism 2 2 Tourism Indicators 2011* Visits increased by 1.3% to 104.4 million. Visits from and overseas countries increased, while visits
August air traffic statistics. Prepared by the Office of Corporate Risk and Strategy
 August 214 air traffic statistics Prepared by the Office of Corporate Risk and Strategy Metropolitan Washington Airports Authority Air Traffic Statistics Table of Contents Summary Air Traffic Summary...
July air traffic statistics. Prepared by the Office of Corporate Risk and Strategy
 July 214 air traffic statistics Prepared by the Office of Corporate Risk and Strategy Air Traffic Statistics Table of Contents Summary Air Traffic Summary... 1 SH&E Air Traffic Schedule Activity... 3 Passenger
Naples, Marco Island, Everglades Convention and Visitors Bureau April 2014 Visitor Profile
 RESEARCH DATA SERVICES, INC. 777 SOUTH HARBOUR ISLAND BOULEVARD SUITE 260 TAMPA, FLORIDA 33602 TEL (813) 254-2975 FAX (813) 223-2986 Naples, Marco Island, Everglades Convention and Visitors Bureau April
International Visitation to the Northern Territory. Year ending March 2017
 International Visitation to the Northern Territory Year ending March 217 The following is a summary of information relevant to the Northern Territory tourism industry including visitation results from
MARKET INSIGHTS UPDATE North America
 SPOTLIGHT ON: THE SHOULDER TRAVEL SEASON PG2 A monthly update including relevant information on travel industry trends, consumer and meetings market research, competitive intelligence, and Hawai i s performance
Tourism Statistics Region 1
 Tourism Statistics Region 1 Tourism Research Unit Winter 2011 1 Summary In 2008, there were 101.0 million visits in and visitors spent $17.6 billion residents account for the majority of visits and spending
CHARACTERISTICS OF TRAVELERS FROM AUSTRALIA TO CALIFORNIA 2015
 CHARACTERISTICS OF TRAVELERS FROM AUSTRALIA TO CALIFORNIA 2015 In 2015, was California s third largest overseas market to California with approximately 610,000 visitors to California. It was surpassed
Naples, Marco Island, Everglades Convention and Visitors Bureau September 2013 Visitor Profile
 RESEARCH DATA SERVICES, INC. 777 SOUTH HARBOUR ISLAND BOULEVARD SUITE 260 TAMPA, FLORIDA 33602 TEL (813) 254-2975 FAX (813) 223-2986 Naples, Marco Island, Everglades Convention and Visitors Bureau September
January 2018 Air Traffic Activity Summary
 January 2018 Air Traffic Activity Summary Jan-2018 Jan-2017 CY-2018 CY-2017 Passengers 528,947 505,421 4.7% 528,947 505,421 4.7% Passengers 537,332 515,787 4.2% 537,332 515,787 4.2% Passengers 1,066,279
Tourism Statistics RTO 1
 Tourism Statistics RTO 1 Tourism Research Unit Spring 2012 1 1 Ontario Tourism 2 2 Ontario Tourism Indicators 2011* Visits increased by 1.3% to 104.4 million. Visits from Ontario and overseas countries
September Air Traffic Statistics. Prepared by the Office of Marketing & Consumer Strategy
 September 2018 Air Traffic Statistics Prepared by the Office of Marketing & Consumer Strategy This report includes only data submitted by airlines as of the date of publication: November 14, 2017. Reports
ITINERARIES
 ALASKA SAN FRANCISCO DEPARTURES 8-Day Alaska Norwegian Sun May 8, 2016 14-Day Ultimate Alaska Norwegian Sun May 15, 2017 SEATTLE DEPARTURES 7-Day Alaska Glacier Bay Norwegian Pearl May 15 Sep 18, 2016
air traffic statistics
 October 213 air traffic statistics Prepared by the Office of Finance Department of Internal Controls, Compliance and Financial Strategy Metropolitan Washington Airports Authority Air Traffic Statistics
PEI Tourism Performance
 PEI Tourism Performance Brian Dunn Manager - Evaluation, Measurements & Business Intelligence Department of Economic Development and Tourism November 25, 2016 Presentation Outline 1. Global Performance
Travelling to Liverpool
 Travelling to Liverpool 1 2 International Airports within 45 minutes of Liverpool City Centre 226 Destinations Domestic Non EU EU 25 50 100 150 250 27.4 million passengers per year = 4 million 77 airlines
Tourism Snapshot A focus on the markets in which the CTC and its partners are active
 Tourism Snapshot A focus on the markets in which the CTC and its partners are active www.canada.travel/corporate April Volume 1, Issue 4 Key highlights Total arrivals from CTC s international markets improved
February Air Traffic Statistics. Prepared by the Office of Corporate Risk and Strategy
 February 215 Air Traffic Statistics Prepared by the Office of Corporate Risk and Strategy Commercial Total Dom Int'l Passengers % Change Air Traffic Summary February 215 Passenger Activity (in Millions)
air traffic statistics
 December 213 air traffic statistics Prepared by the Office of Finance Department of Internal Controls, Compliance and Financial Strategy Commercial Total Dom Int'l Passengers % Change Air Traffic Summary
Global Airline Trends and Impacts International Aviation Issues Seminar
 Global Airline Trends and Impacts International Aviation Issues Seminar December 2017, Washington D.C. Oliver Lamb Managing Director 1 Around the world in 45 minutes Financial Performance Canada Mexico
March 2011 Visitor Profile
 RESEARCH DATA SERVICES, INC. 777 SOUTH HARBOUR ISLAND BOULEVARD SUITE 260 TAMPA, FLORIDA 33602 TEL (813) 254-2975 FAX (813) 254-2986 Naples, Marco Island, Everglades Convention and Visitors Bureau March
Fort Lauderdale August 8, 2017
 Fort Lauderdale August 8, 2017 8/10/2017 TAP Software Analytics Division Brian Finucane TAP Reports Jeff Eastman TAP Hotel Reports Jeanne Eastman TAP Data Source Jeff Eastman Cloud Database Numerous Data
Ontario Sport Tourism Statistics 2014
 Ontario Sport Tourism Statistics 2014 Tourism Research Unit Winter 2017 This report summarizes key characteristics of visitors and visitor spending of trips in Ontario which included: Attend a sports event
February Air Traffic Statistics. Prepared by the Office of Marketing & Consumer Strategy
 February 218 Air Traffic Statistics Prepared by the Office of Marketing & Consumer Strategy 1 This report includes only data submitted by airlines as of the date of publication: April 18, 218. Reports
The Economic Impact of Travel in Kansas. Tourism Satellite Account Calendar Year 2013
 The Economic Impact of Travel in Kansas Tourism Satellite Account Calendar Year 2013 Who we are Tourism Economics Union of industry expertise and economic disciplines Real world insights based on quantitative
The Housing Market and the Macroeconomy
 The Housing Market and the Macroeconomy New England Mortgage Bankers Association October 2, 2009 1 The World is in a Deep Recession In the U.S. EMPLOYMENT: Job losses in August, 2009: -216,000 Job losses
Measures & Projections October 31, GoToBermuda.com
 Measures & Projections October 31, 2015 GoToBermuda.com October Total Vacation Visitor Arrivals Vacation Arrivals Oct-14 Oct-15 2015 Air Vacation 9,203 10,344 1,141 12.40 126,842 127,044 202 0.16 Cruise
July 2012 Passenger and Cargo Traffic Statistics Reno-Tahoe International Airport
 July 2012 Passenger and Cargo Traffic Statistics Reno-Tahoe International Airport August 31, 2012 U.S. DOMESTIC INDUSTRY OVERVIEW FOR JULY 2012 All RNO Carriers Systemwide year over year comparison Average
Tourism Snapshot. A focus on the markets in which the CTC and its partners are active. January 2013 Volume 9, Issue 1.
 Tourism Snapshot Nathan Phillips Square Skating Rink at City Hall Francisco Pardo A focus on the markets in which the CTC and its partners are active www.canada.travel/corporate January 2013 Volume 9,
Discover New England Summit 2016 China Briefing April 4, 2016
 Discover New England Summit 2016 China Briefing April 4, 2016 Michael Middleton Commercial Service Officer Guangzhou, China Let us help you export. The U.S. Commercial Service Your global business partner.
THE MOST INCLUSIVE LUXURY EXPERIENCE TRAVEL LEADERS NETWORK EXCLUSIVE AMENITY CALENDAR AUGUST 2018 JUNE 2020
 THE MOST INCLUSIVE LUXURY EXPERIENCE TRAVEL LEADERS NETWORK CALENDAR AUGUST 20 JUNE 2020 S U P P L I E R PA RT N E R luxury it s all included Our fleet of intimately spacious, all-suite ships are the pinnacles
Tourism Snapshot A Monthly Monitor of the Performance of Canada s Tourism Industry
 Tourism Snapshot A Monthly Monitor of the Performance of Canada s Tourism Industry December 2015 Volume 11, Issue 12 www.destinationcanada.com Tourism Snapshot December 2015 1 2 Tourism Snapshot December
International Visitation to the Northern Territory. Year ending June 2017
 International Visitation to the Northern Territory Year ending June 217 The following is a summary of information relevant to the Northern Territory tourism industry including visitation results from Tourism
September 2016 Visitor Profile
 RESEARCH DATA SERVICES, INC. 777 SOUTH HARBOUR ISLAND BOULEVARD SUITE 26 TAMPA, FLORIDA 3362 TEL (813) 254-2975 FAX (813) 223-2986 Visit St. Petersburg/Clearwater September 216 Visitor Profile Prepared
Naples, Marco Island, Everglades Convention and Visitors Bureau February 2013 Visitor Profile
 RESEARCH DATA SERVICES, INC. 777 SOUTH HARBOUR ISLAND BOULEVARD SUITE 260 TAMPA, FLORIDA 33602 TEL (813) 254-2975 FAX (813) 223-2986 Naples, Marco Island, Everglades Convention and Visitors Bureau February
Houston Economic Update. Presented by Patrick Jankowski Vice President, Research Greater Houston Partnership
 Houston Economic Update Presented by Patrick Jankowski Vice President, Research Greater Houston Partnership Houston Astros - Percent Regular Season Games Won Help from the bullpen this year Help from the
Naples, Marco Island, Everglades Convention and Visitors Bureau March 2013 Visitor Profile
 RESEARCH DATA SERVICES, INC. 777 SOUTH HARBOUR ISLAND BOULEVARD SUITE 260 TAMPA, FLORIDA 33602 TEL (813) 254-2975 FAX (813) 223-2986 Naples, Marco Island, Everglades Convention and Visitors Bureau March
March 2012 Visitor Profile
 RESEARCH DATA SERVICES, INC. 777 SOUTH HARBOUR ISLAND BOULEVARD SUITE 260 TAMPA, FLORIDA 33602 TEL (813) 254-2975 FAX (813) 223-2986 Naples, Marco Island, Everglades Convention and Visitors Bureau March
CARIBBEAN TOURISM ORGANIZATION LATEST STATISTICS December 4, 2014
 CARIBBEAN TOURISM ORGANIZATION LATEST STATISTICS 2014 December 4, 2014 FINAL Destination Table 1: Tourist (Stop-over) Arrivals in 2014 Period Tourist Arrivals % Change Overall Winter# Summer# Anguilla
September Air Traffic Statistics. Prepared by the Office of Corporate Risk and Strategy
 September 214 Air Traffic Statistics Prepared by the Office of Corporate Risk and Strategy Air Traffic Summary September 214 Commercial Total Dom Int'l Passengers % Change Passenger Activity (in Millions)
HelmsBr Meeting I ndustry T rends 2011 September 10, 2010
 HelmsBriscoe Meeting Industry Trends 2011 September 10, 2010 Agenda HelmsBriscoe Overview Market Conditions Key Meeting Industry Trends Q&A HB By the Numbers The largest meetings procurement firm in the
International Visitation to the Northern Territory. Year ending December 2017
 International Visitation to the Northern Territory Year ending December 2017 The following is a summary of information relevant to the Northern Territory (NT) tourism industry including visitation results
AirportInfo. ACI-NA 2011 Traffic Report
 AirportInfo ACI-NA 2011 Traffic Report July 2012 2011 ACI World Airport Traffic Summary North America 2011 % Change 2010 Worldwide 2011 % Change 2010 Total Passengers 1.5B Up 1.8% 5.1B Up 5.2% Total International
St. Petersburg/Clearwater Area Convention and Visitors Bureau. September 2006 Visitor Profile
 RESEARCH DATA SERVICES, INC. 405 NORTH REO STREET SUITE 100 TAMPA, FLORIDA 33609 TEL (813) 254-2975 FAX (813) 254-2986 St. Petersburg/Clearwater Area Convention and Visitors Bureau September 2006 Visitor
Regional Spread of Inbound Tourism. VisitBritain Research, August 2018
 Regional Spread of Inbound Tourism VisitBritain Research, August 218 1 Contents Introduction Summary Key metrics by UK area Analysis by UK area Summary of growth by UK area Scotland Wales North East North
Preliminary World Airport Traffic 2009
 Preliminary World Airport Traffic 2009 Passenger traffic down by 2.7%; cargo down by 8.2 % Geneva, 17 March 2010 ACI reports preliminary results of a 2.7 decline in global passenger traffic for 2009, reflecting
October Air Traffic Statistics. Prepared by the Office of Corporate Risk and Strategy
 October 214 Air Traffic Statistics Prepared by the Office of Corporate Risk and Strategy Metropolitan Washington Airports Authority Air Traffic Statistics Table of Contents Summary Air Traffic Summary...
Mitchel Allen, VP, Business Development March 16, 2017
 Mitchel Allen, VP, Business Development March 16, 2017 1 2 THE GREATER PHOENIX ECONOMIC COUNCIL GREATER PHOENIX About the Greater Phoenix Economic Council (GPEC) 3 Our mission is to attract and grow quality
DOWNTOWN, CHARLOTTE AMALIE
 TOTAL VISITOR ARRIVALS TO THE USVI : DECEMBER YEAR TO DATE DECEMBER TOTAL VISITOR ARRIVALS 2,85, 2,8, 2,814,257 2,75, 2,7, 2,65, 2,6, 2,642,118 2,71,542 2,648,5 2,55, 212 213 214 215 Visitor arrivals ended
ACI 2008 WORLDWIDE AIRPORT TRAFFIC STATISTICS
 WORLD AIRPORT RANKING BY TOTAL PASSENGERS TOTAL PASSENGERS 1 ATLANTA GA ATL 90 039 280 0.7 2 CHICAGO IL ORD 69 353 876 ( 9.0) 3 LONDON LHR 67 056 379 ( 1.5) 4 TOKYO HND 66 754 829 ( 0.2) 5 PARIS CDG 60
Athens International Airport. The 2007 market performance
 Athens International Airport The 2007 market performance Great overall performance 70 Airlines 15 New Aer Lingus Air Baltic Air China Carpatair Centralwings Clickair Continental Airlines Finnair Ilyich-Avia
TripAdvisor Workshop Christchurch 7 June 2016
 TripAdvisor Workshop Christchurch 7 June 2016 TripAdvisor: The World s Largest Travel Site 1 M I L L I O N Reviews & Opinions 3402005 MILLION 2000 Unique visitors a month M I L L I O N 350 r e vie w s
Naples, Marco Island, Everglades Convention and Visitors Bureau November 2012 Visitor Profile
 RESEARCH DATA SERVICES, INC. 777 SOUTH HARBOUR ISLAND BOULEVARD SUITE 260 TAMPA, FLORIDA 33602 TEL (813) 254-2975 FAX (813) 223-2986 Naples, Marco Island, Everglades Convention and Visitors Bureau November
Monthly Hotel Establishment Report. July and YTD July, 2017
 Monthly Hotel Establishment Report July and YTD July, 2017 30 August, 2017 Dear Hotel Partner, It gives me great pleasure to share with you highlights of July s Hotel Establishments Performance Report
ST. EUSTATIUS. Sea Arrivals II ( Summer ( Winter Yacht Arrivals I 12, % 32.5%
 ST. EUSTATIUS Visitor Arrival Summary Tourist Arrivals (excluding Antilleans) to St. Eustatius increased by 2.5 percent to reach a total of 12.0 thousand in 2009. Holland continues to be the most important
Fall 2015 Brand & Advertising Tracking Study Report Ontario Market
 1 Fall 20 Brand & Advertising Tracking Study Report Ontario Market STUDY BACKGROUND & METHODOLOGY Methodology & Sample Profile Methodology: Online survey Eligibility: Residents of Ontario Overnight Pleasure