Meta-analysis: basic principles and methods
|
|
|
- Dulcie Fields
- 5 years ago
- Views:
Transcription

1 Meta-analysis: basic principles and methods Bianca L De Stavola and Tim Collier LSHTM bianca.destavola@lshtm.ac.uk & tim.collier@lshtm.ac.uk 27 th November, 2012 Bianca L De Stavola and Tim Collier LSHTM /Meta-analysis: basic principles and methods 1/20
2 Contents 1 Introduction 2 Pooling effects 3 Fixed effect meta-analysis 4 Random effects meta-analysis 5 How to do it in Stata 6 Risk of Bias 7 Conclusions 8 References Bianca L De Stavola and Tim Collier LSHTM /Meta-analysis: basic principles and methods 2/20
3 Systematic reviews It all starts here... Briefly, from Alma s lecture: Define question, population, outcome, exposure, study design(s) Define search strategy Perform search Extract data (Alternatively: contact authors and collate individual data) Display and summarize findings: meta-analysis Bianca L De Stavola and Tim Collier LSHTM /Meta-analysis: basic principles and methods 3/20
4 Systematic reviews It all starts here... Briefly, from Alma s lecture: Define question, population, outcome, exposure, study design(s) Define search strategy Perform search Extract data (Alternatively: contact authors and collate individual data) Display and summarize findings: meta-analysis Bianca L De Stavola and Tim Collier LSHTM /Meta-analysis: basic principles and methods 3/20
5 Meta-analysis Meta-analysis is a two-stage approach: 1 study specific estimates of effect, ˆβ s, and precision, ŝe( ˆβ s ), No. Study ˆβ s ŝe( ˆβ s ) 1 MRC NSHD (UK) HBCS I (Helsinki) PSWG (Gothenburg) S examination of heterogeneity 2 Overall summary Bianca L De Stavola and Tim Collier LSHTM /Meta-analysis: basic principles and methods 4/20
6 Meta-analysis Meta-analysis is a two-stage approach: 1 study specific estimates of effect, ˆβ s, and precision, ŝe( ˆβ s ), No. Study ˆβ s ŝe( ˆβ s ) 1 MRC NSHD (UK) HBCS I (Helsinki) PSWG (Gothenburg) S 2 examination of heterogeneity 3 Overall summary Bianca L De Stavola and Tim Collier LSHTM /Meta-analysis: basic principles and methods 5/20
7 An example Birth weight and breast cancer incidence Forest plot of rate relative risks (ES) and 95% confidence intervals Study ID ES (95% CI) MRC NSHD (UK) 2000 HBCS I (Helsinki) 2001 PSWG (Gothenburg) 2001 CSHRR (Copenhagen) 2003 UBCoS Multigen (Uppsala) 2003 SOUHCB(Trondheim) 2005 NCI DES (US) 2006 Aberdeen Children of the 1950s (Aberdeen) UP EPIC (Norfolk) UP HBCS II (Helsinki) UP HBCS III (Helsinki) UP SYFBC (Sweden) UP UKWCS (UK) 2007 MDC Study (Malmo) 2004 SPNFBC (Uppsala-Orebro) 1997 NYSEOBC (New York) 2000 TBPCCS (Trondheim-Bergen) 2002 DPCCS (Jutland) 2003 Seattle BCYW (Washington) 1996 Seattle BCMW (Washington) 1996 SBCS (Shanghai) 2002 CmsBCS (US) 2002 CBCS (North Carolina) 2004 CARE (US) UP 1.10 (0.88, 1.37) 1.11 (0.95, 1.29) 1.22 (0.93, 1.62) 1.02 (0.98, 1.05) 1.02 (0.93, 1.13) 1.07 (0.95, 1.19) 0.97 (0.83, 1.14) 1.03 (0.80, 1.33) 0.92 (0.84, 1.01) 1.04 (0.90, 1.22) 1.06 (0.85, 1.31) 1.35 (1.01, 1.81) 1.01 (0.94, 1.08) 1.14 (0.91, 1.42) 1.03 (0.96, 1.11) 1.13 (0.79, 1.62) 1.12 (1.00, 1.26) 1.05 (0.97, 1.13) 1.01 (0.92, 1.11) 0.90 (0.80, 1.00) 0.93 (0.79, 1.08) 1.01 (0.97, 1.05) 0.89 (0.72, 1.10) 0.98 (0.94, 1.02) Box represents precision Sorted by publication year Bianca L De Stavola and Tim Collier LSHTM /Meta-analysis: basic principles and methods 6/20
8 An example Birth weight and breast cancer incidence Forest plot of rate relative risks (ES) and 95% confidence intervals Study ID ES (95% CI) MRC NSHD (UK) 2000 HBCS I (Helsinki) 2001 PSWG (Gothenburg) 2001 CSHRR (Copenhagen) 2003 UBCoS Multigen (Uppsala) 2003 SOUHCB(Trondheim) 2005 NCI DES (US) 2006 Aberdeen Children of the 1950s (Aberdeen) UP EPIC (Norfolk) UP HBCS II (Helsinki) UP HBCS III (Helsinki) UP SYFBC (Sweden) UP UKWCS (UK) 2007 MDC Study (Malmo) 2004 SPNFBC (Uppsala-Orebro) 1997 NYSEOBC (New York) 2000 TBPCCS (Trondheim-Bergen) (0.88, 1.37) 1.11 (0.95, 1.29) 1.22 (0.93, 1.62) 1.02 (0.98, 1.05) 1.02 (0.93, 1.13) 1.07 (0.95, 1.19) 0.97 (0.83, 1.14) 1.03 (0.80, 1.33) 0.92 (0.84, 1.01) 1.04 (0.90, 1.22) 1.06 (0.85, 1.31) 1.35 (1.01, 1.81) 1.01 (0.94, 1.08) 1.14 (0.91, 1.42) 1.03 (0.96, 1.11) 1.13 (0.79, 1.62) 1.12 (1.00, 1.26) DPCCS (Jutland) (0.97, 1.13) Seattle BCYW (Washington) 1996 Seattle BCMW (Washington) 1996 SBCS (Shanghai) 2002 CmsBCS (US) 2002 CBCS (North Carolina) 2004 CARE (US) UP 1.01 (0.92, 1.11) Is it appropriate to summarize this into just one value? Are the effect consistent across studies? 0.90 (0.80, 1.00) 0.93 (0.79, 1.08) 1.01 (0.97, 1.05) 0.89 (0.72, 1.10) 0.98 (0.94, 1.02) Box represents precision Sorted by publication year Bianca L De Stavola and Tim Collier LSHTM /Meta-analysis: basic principles and methods 6/20
9 Assessing heterogeneity 1 Cochran s Q statistic: Q = w s ( ˆβ s β) 2 where w s = 1/ŝe( ˆβ s ), and ˆβ is a weighted mean of the ˆβ s. Used to test whether all studies are evaluating the same effect, but has low power 2 Higgins and Thompson s I 2 : I 2 = (Q df )/Q 100 the proportion of total variability explained by heterogeneity Values < 25% re thought to be low... Bianca L De Stavola and Tim Collier LSHTM /Meta-analysis: basic principles and methods 7/20
10 Assessing heterogeneity 1 Cochran s Q statistic: Q = w s ( ˆβ s β) 2 where w s = 1/ŝe( ˆβ s ), and ˆβ is a weighted mean of the ˆβ s. Used to test whether all studies are evaluating the same effect, but has low power 2 Higgins and Thompson s I 2 : I 2 = (Q df )/Q 100 the proportion of total variability explained by heterogeneity In the example: Q = 28.99(df=23) p=0.18, I 2 =20.7% Values < 25% re thought to be low... Bianca L De Stavola and Tim Collier LSHTM /Meta-analysis: basic principles and methods 7/20
11 Pooling effects Two main ways to summarize (or pool) the separate study effects: Fixed effects model Assume each study measures the same effect: ˆβ s = β + e s where β: true common effect; e s : sampling error with variance σ 2 e Bianca L De Stavola and Tim Collier LSHTM /Meta-analysis: basic principles and methods 8/20
12 Pooling effects Two main ways to summarize (or pool) the separate study effects: Fixed effects model Assume each study measures the same effect: ˆβ s = β + e s where β: true common effect; e s : sampling error with variance σ 2 e Random effects model Assume the true effects in each study differs according to some distribution: ˆβ s = β + u s + ɛ s u s : rv with mean 0 and variance τ 2 ; β s = β + u s ; ɛ s : within study random error with variance σ 2 ɛ Bianca L De Stavola and Tim Collier LSHTM /Meta-analysis: basic principles and methods 8/20
13 What the models imply Log(relative risk) Study Bianca L De Stavola and Tim Collier LSHTM /Meta-analysis: basic principles and methods 9/20
14 What the models imply Log(relative risk) The difference between β s and β could be treated as due to random fluctuation or partly systematic (but random) Study Bianca L De Stavola and Tim Collier LSHTM /Meta-analysis: basic principles and methods 9/20
15 Estimation by fixed effect meta-analysis Estimation via weighted average of the separate estimated study effects: β FE = s w s ˆβ s With a choice of weights: s w s a) inverse of the variance of the study effect estimate: w s = 1 se( ˆβ s ) b) Mantel-Haenszel weights (for ORs) c) Peto s weights (for ORs) 2 Bianca L De Stavola and Tim Collier LSHTM /Meta-analysis: basic principles and methods 10/20
16 Estimation by random effects meta-analysis Estimation via weighted average of the separate estimated study effects: β RE == s w s ˆβ s where weights are: w s = 1 se( ˆβ s ) 2 s w s and τ 2 is estimated from the Q statistic + ˆτ 2 (DerSimonian and Laird method) Bianca L De Stavola and Tim Collier LSHTM /Meta-analysis: basic principles and methods 11/20
17 The example revisited Fixed effect meta-analysis Study ID ES (95% CI) % Weight MRC NSHD (UK) 2000 HBCS I (Helsinki) 2001 PSWG (Gothenburg) 2001 CSHRR (Copenhagen) 2003 UBCoS Multigen (Uppsala) 2003 SOUHCB(Trondheim) 2005 NCI DES (US) 2006 Aberdeen Children of the 1950s (Aberdeen) UP EPIC (Norfolk) UP HBCS II (Helsinki) UP HBCS III (Helsinki) UP SYFBC (Sweden) UP UKWCS (UK) 2007 MDC Study (Malmo) 2004 SPNFBC (Uppsala-Orebro) 1997 NYSEOBC (New York) 2000 TBPCCS (Trondheim-Bergen) 2002 DPCCS (Jutland) 2003 Seattle BCYW (Washington) 1996 Seattle BCMW (Washington) 1996 SBCS (Shanghai) 2002 CmsBCS (US) 2002 CBCS (North Carolina) 2004 CARE (US) UP Overall (I-squared = 20.7%, p = 0.181) 1.10 (0.88, 1.37) 1.11 (0.95, 1.29) 1.22 (0.93, 1.62) 1.02 (0.98, 1.05) 1.02 (0.93, 1.13) 1.07 (0.95, 1.19) 0.97 (0.83, 1.14) 1.03 (0.80, 1.33) 0.92 (0.84, 1.01) 1.04 (0.90, 1.22) 1.06 (0.85, 1.31) 1.35 (1.01, 1.81) 1.01 (0.94, 1.08) 1.14 (0.91, 1.42) 1.03 (0.96, 1.11) 1.13 (0.79, 1.62) 1.12 (1.00, 1.26) 1.05 (0.97, 1.13) 1.01 (0.92, 1.11) 0.90 (0.80, 1.00) 0.93 (0.79, 1.08) 1.01 (0.97, 1.05) 0.89 (0.72, 1.10) 0.98 (0.94, 1.02) 1.01 (0.99, 1.03) Bianca L De Stavola and Tim Collier LSHTM /Meta-analysis: basic principles and methods 12/20
18 The example revisited Random effect meta-analysis Study ID ES (95% CI) % Weight MRC NSHD (UK) 2000 HBCS I (Helsinki) 2001 PSWG (Gothenburg) 2001 CSHRR (Copenhagen) 2003 UBCoS Multigen (Uppsala) 2003 SOUHCB(Trondheim) 2005 NCI DES (US) 2006 Aberdeen Children of the 1950s (Aberdeen) UP EPIC (Norfolk) UP HBCS II (Helsinki) UP HBCS III (Helsinki) UP SYFBC (Sweden) UP UKWCS (UK) 2007 MDC Study (Malmo) 2004 SPNFBC (Uppsala-Orebro) 1997 NYSEOBC (New York) 2000 TBPCCS (Trondheim-Bergen) 2002 DPCCS (Jutland) 2003 Seattle BCYW (Washington) 1996 Seattle BCMW (Washington) 1996 SBCS (Shanghai) 2002 CmsBCS (US) 2002 CBCS (North Carolina) 2004 CARE (US) UP Overall (I-squared = 20.7%, p = 0.181) 1.10 (0.88, 1.37) 1.11 (0.95, 1.29) 1.22 (0.93, 1.62) 1.02 (0.98, 1.05) 1.02 (0.93, 1.13) 1.07 (0.95, 1.19) 0.97 (0.83, 1.14) 1.03 (0.80, 1.33) 0.92 (0.84, 1.01) 1.04 (0.90, 1.22) 1.06 (0.85, 1.31) 1.35 (1.01, 1.81) 1.01 (0.94, 1.08) 1.14 (0.91, 1.42) 1.03 (0.96, 1.11) 1.13 (0.79, 1.62) 1.12 (1.00, 1.26) 1.05 (0.97, 1.13) 1.01 (0.92, 1.11) 0.90 (0.80, 1.00) 0.93 (0.79, 1.08) 1.01 (0.97, 1.05) 0.89 (0.72, 1.10) 0.98 (0.94, 1.02) 1.01 (0.99, 1.03) NOTE: Weights are from random effects analysis Bianca L De Stavola and Tim Collier LSHTM /Meta-analysis: basic principles and methods 13/20
19 The example revisited Random effect meta-analysis Study ID ES (95% CI) % Weight MRC NSHD (UK) 2000 HBCS I (Helsinki) 2001 PSWG (Gothenburg) 2001 CSHRR (Copenhagen) 2003 UBCoS Multigen (Uppsala) 2003 SOUHCB(Trondheim) 2005 NCI DES (US) 2006 Aberdeen Children of the 1950s (Aberdeen) UP EPIC (Norfolk) UP HBCS II (Helsinki) UP HBCS III (Helsinki) UP SYFBC (Sweden) UP UKWCS (UK) 2007 MDC Study (Malmo) 2004 SPNFBC (Uppsala-Orebro) 1997 NYSEOBC (New York) 2000 TBPCCS (Trondheim-Bergen) 2002 DPCCS (Jutland) 2003 Seattle BCYW (Washington) 1996 Seattle BCMW (Washington) 1996 SBCS (Shanghai) (0.88, 1.37) 1.11 (0.95, 1.29) 1.22 (0.93, 1.62) 1.02 (0.98, 1.05) 1.02 (0.93, 1.13) 1.07 (0.95, 1.19) 0.97 (0.83, 1.14) 1.03 (0.80, 1.33) 0.92 (0.84, 1.01) 1.04 (0.90, 1.22) 1.06 (0.85, 1.31) 1.35 (1.01, 1.81) 1.01 (0.94, 1.08) 1.14 (0.91, 1.42) 1.03 (0.96, 1.11) 1.13 (0.79, 1.62) 1.12 (1.00, 1.26) 1.05 (0.97, 1.13) 1.01 (0.92, 1.11) 0.90 (0.80, 1.00) 0.93 (0.79, 1.08) CmsBCS (US) (0.97, 1.05) CBCS (North Carolina) 2004 CARE (US) UP RE model gives greater weights to smaller studies Overall (I-squared = 20.7%, p = 0.181) 0.89 (0.72, 1.10) 0.98 (0.94, 1.02) 1.01 (0.99, 1.03) NOTE: Weights are from random effects analysis Bianca L De Stavola and Tim Collier LSHTM /Meta-analysis: basic principles and methods 13/20
20 How to do it in Stata Bianca L De Stavola and Tim Collier LSHTM /Meta-analysis: basic principles and methods 14/20
21 Risk of Bias Summary estimate may be affected by bias because: 1 varying quality of the data: outcome (e.g. via incomplete follow-up) exposure (e.g. varying definitions) 2 publication bias: studies with significant effects are more likely to be published non-english language papers may not be fully represented 3 unmeasured confounding: relevant for meta-analysis of observational studies... Bianca L De Stavola and Tim Collier LSHTM /Meta-analysis: basic principles and methods 15/20
22 1 - Quality of the data Stratifying by source of exposure data Study ID ES (95% CI) % Weight Birth record MRC NSHD (UK) 2000 HBCS I (Helsinki) 2001 PSWG (Gothenburg) 2001 UBCoS Multigen (Uppsala) 2003 SOUHCB(Trondheim) 2005 NCI DES (US) 2006 Aberdeen Children of the 1950s (Aberdeen) UP HBCS II (Helsinki) UP HBCS III (Helsinki) UP SYFBC (Sweden) UP MDC Study (Malmo) 2004 SPNFBC (Uppsala-Orebro) 1997 NYSEOBC (New York) 2000 TBPCCS (Trondheim-Bergen) 2002 DPCCS (Jutland) 2003 CBCS (North Carolina) 2004 Subtotal (I-squared = 0.0%, p = 0.809). Parental recall in childhood CSHRR (Copenhagen) 2003 Subtotal (I-squared =.%, p =.). Adult report EPIC (Norfolk) UP UKWCS (UK) 2007 Seattle BCYW (Washington) 1996 Seattle BCMW (Washington) 1996 SBCS (Shanghai) 2002 CmsBCS (US) 2002 CARE (US) UP Subtotal (I-squared = 22.0%, p = 0.262). NOTE: Weights are from random effects analysis 1.10 (0.88, 1.37) 1.11 (0.95, 1.29) 1.22 (0.93, 1.62) 1.02 (0.93, 1.13) 1.07 (0.95, 1.19) 0.97 (0.83, 1.14) 1.03 (0.80, 1.33) 1.04 (0.90, 1.22) 1.06 (0.85, 1.31) 1.35 (1.01, 1.81) 1.14 (0.91, 1.42) 1.03 (0.96, 1.11) 1.13 (0.79, 1.62) 1.12 (1.00, 1.26) 1.05 (0.97, 1.13) 0.89 (0.72, 1.10) 1.05 (1.02, 1.09) 1.02 (0.98, 1.05) 1.02 (0.98, 1.05) 0.92 (0.84, 1.01) 1.01 (0.94, 1.08) 1.01 (0.92, 1.11) 0.90 (0.80, 1.00) 0.93 (0.79, 1.08) 1.01 (0.97, 1.05) 0.98 (0.94, 1.02) 0.98 (0.95, 1.01) Bianca L De Stavola and Tim Collier LSHTM /Meta-analysis: basic principles and methods 16/20
23 1 - Quality of the data Stratifying by source of exposure data Study ID ES (95% CI) % Weight Birth record MRC NSHD (UK) (0.88, 1.37) HBCS I (Helsinki) (0.95, 1.29) PSWG (Gothenburg) (0.93, 1.62) UBCoS Multigen (Uppsala) (0.93, 1.13) SOUHCB(Trondheim) (0.95, 1.19) NCI DES (US) (0.83, 1.14) Aberdeen Children of the 1950s (Aberdeen) UP 1.03 (0.80, 1.33) HBCS II (Helsinki) UP 1.04 (0.90, 1.22) HBCS III (Helsinki) UP 1.06 (0.85, 1.31) SYFBC (Sweden) UP 1.35 (1.01, 1.81) MDC Study (Malmo) (0.91, 1.42) SPNFBC (Uppsala-Orebro) (0.96, 1.11) NYSEOBC (New York) (0.79, 1.62) TBPCCS (Trondheim-Bergen) (1.00, 1.26) DPCCS (Jutland) (0.97, 1.13) CBCS (North Carolina) (0.72, 1.10) Subtotal (I-squared = 0.0%, p = 0.809) 1.05 (1.02, 1.09). Parental recall in childhood CSHRR (Copenhagen) (0.98, 1.05) Subtotal (I-squared =.%, p =.) 1.02 (0.98, 1.05). Adult report EPIC (Norfolk) UP 0.92 (0.84, 1.01) UKWCS (UK) (0.94, 1.08) Seattle BCYW (Washington) (0.92, 1.11) Seattle BCMW (Washington) (0.80, 1.00) SBCS (Shanghai) (0.79, 1.08) CmsBCS (US) 2002 CARE (US) UP Greater homogeneity within first sub-group ( Birth records ) but not the last ( self-report ) Subtotal (I-squared = 22.0%, p = 0.262). NOTE: Weights are from random effects analysis 1.01 (0.97, 1.05) 0.98 (0.94, 1.02) 0.98 (0.95, 1.01) Bianca L De Stavola and Tim Collier LSHTM /Meta-analysis: basic principles and methods 16/20
24 2 - Publication bias Funnel plots Studies with low precision will show a wide variation in effects while studies with high precision will show much less variation, Funnel plot with pseudo 95% confidence limits.15.2 s.e. of lnor lnor Bianca L De Stavola and Tim Collier LSHTM /Meta-analysis: basic principles and methods 17/20
25 Meta-regression Combining results from multiple studies with regression, accounting for differences in precision: Log(relative risk) birth record parental self Source of information Bianca L De Stavola and Tim Collier LSHTM /Meta-analysis: basic principles and methods 18/20
26 Fixed or random effects? We should remember that this is a model fitting exercise The pooled summary represents: 1 Fixed effect model: the common effect shared by all studies, 2 Random effects model: is the average of the study specific effects. In general random effects pooled estimates are more appropriate If little variation across studies the choice is not crucial In most settings, investigation of sources of heterogeneity should be the focus Bianca L De Stavola and Tim Collier LSHTM /Meta-analysis: basic principles and methods 19/20
27 References 1 Egger M, Davey Smith G, Altman DG. Systematic Reviews in Health Care: Meta-Analysis in Context. BMJ Books: London, DerSimonian R, Laird N. Meta-analysis in clinical trials. Controlled Clinical Trials 1986; 7: Higgins JP et al. Measuring inconsistency in meta-analysis. BMJ 2003; 327: Sutton AJ, Higgins JP. Recent developments in meta-analysis. Stat Med. 2008, 27: Sutton AJ, Abrams KR, Jones DR, Sheldon TA, Song F. Methods for Meta-Analysis in Medical Research. Wiley: London, Thompson SG, Sharp SJ. Explaining heterogeneity in meta-analysis: a comparison of methods. Statistics in Medicine 1999; 18: Bianca L De Stavola and Tim Collier LSHTM /Meta-analysis: basic principles and methods 20/20
28 Meta Analysis in Stata Tim Collier Medical Statistics Department LSHTM
29 Outline Getting started in Stata FE & RE models with data in different formats using metan (GUI & syntax) Forest plots Investigating small study effects using metafunnel and metabias Investigating heterogeneity with meta regression using metareg

30 Getting Started

31 Getting Started
32 Getting Started

33 Getting Started
34 Getting Started Install commands from Boston College SSC Takes just a few seconds Repeat for metareg, metafunnel, metabias, etc.
35 The Data

36 The Data counts (2x2 tables) pe_int = number with PE in intervention group nope_int = number without PE in intervention group pe_con = number with PE in control group nope_con = number without PE in control group

37 The Data effect & CI

38 The Data estimate & SE

39 Graphical User Interface: db metan
 Yes No Int. a b Con.")
40 db metan count data (2x2 tables) Yes No Int. a b Con. c d
41
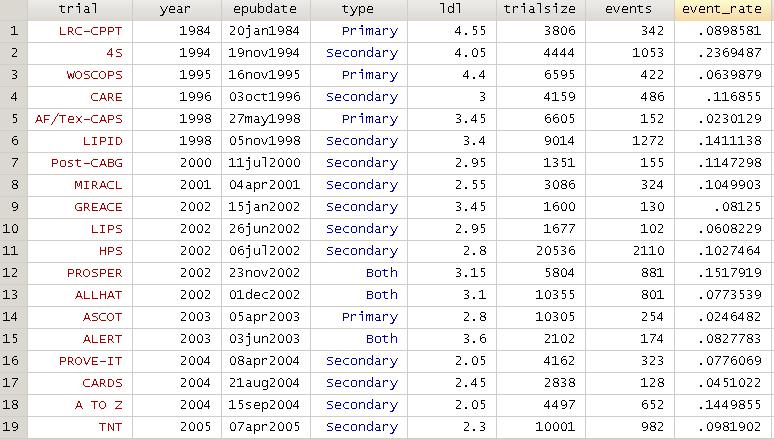
42 Study ID RR (95% CI) % Weight LRC-CPPT 4S WOSCOPS CARE AF/Tex-CAPS LIPID Post-CABG MIRACL GREACE LIPS HPS PROSPER ALLHAT ASCOT ALERT PROVE-IT CARDS A TO Z TNT Overall (I-squared = 52.4%, p = 0.004) 0.83 (0.67, 1.01) 0.69 (0.62, 0.77) 0.70 (0.58, 0.84) 0.77 (0.65, 0.91) 0.60 (0.43, 0.83) 0.78 (0.70, 0.86) 0.80 (0.59, 1.08) 0.92 (0.75, 1.13) 0.46 (0.32, 0.66) 0.69 (0.47, 1.01) 0.74 (0.68, 0.80) 0.87 (0.77, 0.98) 0.91 (0.79, 1.03) 0.65 (0.50, 0.83) 0.67 (0.50, 0.90) 0.87 (0.71, 1.08) 0.65 (0.46, 0.92) 0.89 (0.77, 1.02) 0.79 (0.70, 0.89) 0.78 (0.75, 0.80)

43 random effects count data
44
 Heterogeneity chi squared 37.83 (18df) p = 0.004 I squared = 52.")
45 fixed v random Fixed (M H pooled RR) % CI(0.748, 0.804) Random (D L pooled RR) % CI(0.728, 0.818) Heterogeneity chi squared (18df) p = I squared = 52.4%
46 Demo of Stata Syntax
Bird Strike Damage Rates for Selected Commercial Jet Aircraft Todd Curtis, The AirSafe.com Foundation
 Bird Strike Rates for Selected Commercial Jet Aircraft http://www.airsafe.org/birds/birdstrikerates.pdf Bird Strike Damage Rates for Selected Commercial Jet Aircraft Todd Curtis, The AirSafe.com Foundation
Kristina Ricks ISYS 520 VBA Project Write-up Around the World
 VBA Project Write-up Around the World Initial Problem Online resources are very valuable when searching for the cheapest flights to any particular location. Sites such as Travelocity.com, Expedia.com,
Thanksgiving Holiday Period Traffic Fatality Estimate, 2017
 Thanksgiving Holiday Period Traffic Fatality Estimate, 2017 Prepared by Research and Statistics Department National Safety Council November 13, 2017 Holiday period definition Thanksgiving is observed on
GEOGRAPHY OF GLACIERS 2
 GEOGRAPHY OF GLACIERS 2 Roger Braithwaite School of Environment and Development 1.069 Arthur Lewis Building University of Manchester, UK Tel: UK+161 275 3653 r.braithwaite@man.ac.uk 09/08/2012 Geography
Visitor Use Computer Simulation Modeling to Address Transportation Planning and User Capacity Management in Yosemite Valley, Yosemite National Park
 Visitor Use Computer Simulation Modeling to Address Transportation Planning and User Capacity Management in Yosemite Valley, Yosemite National Park Final Report Steve Lawson Brett Kiser Karen Hockett Nathan
Validation of Runway Capacity Models
 Validation of Runway Capacity Models Amy Kim & Mark Hansen UC Berkeley ATM Seminar 2009 July 1, 2009 1 Presentation Outline Introduction Purpose Description of Models Data Methodology Conclusions & Future
Is Occupation as Air Transport Pilot a Stroke Risk?
 Dr Kevin Tan Is Occupation as Air Transport Pilot a Stroke Risk? A Case-Control Study Why this question? Why? Shift & Night Work Sleep Restriction Air Transport Pilot Occupation? Ischaemic Stroke 4% increased
Quantitative Analysis of the Adapted Physical Education Employment Market in Higher Education
 Quantitative Analysis of the Adapted Physical Education Employment Market in Higher Education by Jiabei Zhang, Western Michigan University Abstract The purpose of this study was to analyze the employment
Directional Price Discrimination. in the U.S. Airline Industry
 Evidence of in the U.S. Airline Industry University of California, Irvine aluttman@uci.edu June 21st, 2017 Summary First paper to explore possible determinants that may factor into an airline s decision
Methodology and coverage of the survey. Background
 Methodology and coverage of the survey Background The International Passenger Survey (IPS) is a large multi-purpose survey that collects information from passengers as they enter or leave the United Kingdom.
Cross-sectional time-series analysis of airspace capacity in Europe
 Cross-sectional time-series analysis of airspace capacity in Europe Dr. A. Majumdar Dr. W.Y. Ochieng Gerard McAuley (EUROCONTROL) Jean Michel Lenzi (EUROCONTROL) Catalin Lepadatu (EUROCONTROL) 1 Introduction
Airspace Complexity Measurement: An Air Traffic Control Simulation Analysis
 Airspace Complexity Measurement: An Air Traffic Control Simulation Analysis Parimal Kopardekar NASA Ames Research Center Albert Schwartz, Sherri Magyarits, and Jessica Rhodes FAA William J. Hughes Technical
NAPA VALLEY VISITOR INDUSTRY 2014 Economic Impact Report
 NAPA VALLEY VISITOR INDUSTRY 2014 Economic Impact Report Research prepared for Visit Napa Valley by Destination Analysts, Inc. Table of Contents SECTION 1 Introduction 2 SECTION 2 Executive Summary 5 SECTION
NAPA VALLEY VISITOR INDUSTRY 2012 Economic Impact Report
 Join Visit Napa Valley NAPA VALLEY VISITOR INDUSTRY 2012 Economic Impact Report Research prepared for Visit Napa Valley by Destination Analysts, Inc. Table of Contents SECTION 1 Introduction 2 SECTION
Measuring Productivity for Car Booking Solutions
 Measuring Productivity for Car Booking Solutions Value Creation Study Rebecca Bartlett 20th January 2014 Table of Contents Executive Summary Introduction Method Productivity Analysis Scenario 1 Scenario
Risk Assessment in Winter Backcountry Travel
 Wilderness and Environmental Medicine, 20, 269 274 (2009) ORIGINAL RESEARCH Risk Assessment in Winter Backcountry Travel Natalie A. Silverton, MD; Scott E. McIntosh, MD; Han S. Kim, PhD, MSPH From the
Demand, Load and Spill Analysis Dr. Peter Belobaba
 Demand, Load and Spill Analysis Dr. Peter Belobaba Istanbul Technical University Air Transportation Management M.Sc. Program Network, Fleet and Schedule Strategic Planning Module 13 : 12 March 2014 Lecture
Designing computer based training programs. Sam Chan Research Scientist. Posit Science Corporation, San Francisco, CA.
 Designing computer based training programs Sam Chan Research Scientist. Posit Science Corporation, San Francisco, CA. Outline UFOV is important Building InSight Validating exercises Making engaging Allstate/Posit
JULIAN DEAN, PETER IVANOV, SEAN COLLINS AND MARIA GARCIA MIRANDA
 NPL REPORT IR 32 Environmental Radioactivity Proficiency Test Exercise 2013 JULIAN DEAN, PETER IVANOV, SEAN COLLINS AND MARIA GARCIA MIRANDA JULY 2014 Environmental Radioactivity Proficiency Test Exercise
FIXED-SITE AMUSEMENT RIDE INJURY SURVEY, 2015 UPDATE. Prepared for International Association of Amusement Parks and Attractions Alexandria, VA
 FIXED-SITE AMUSEMENT RIDE INJURY SURVEY, 2015 UPDATE Prepared for International Association of Amusement Parks and Attractions Alexandria, VA by National Safety Council Research and Statistical Services
NAPA VALLEY VISITOR INDUSTRY 2016 Economic Impact Report
 NAPA VALLEY VISITOR INDUSTRY 2016 Economic Impact Report Research prepared for Visit Napa Valley by Destination Analysts, Inc. Table of Contents S E C T I O N 1 Introduction 2 S E C T I O N 2 Executive
2015 Travel Survey. for the States of Guernsey Commerce & Employment Department RESEARCH REPORT ON Q1 2015
 215 Travel Survey for the States of Guernsey Commerce & Employment Department RESEARCH REPORT ON Q1 215 April 28 th 215 Table of Contents Page No. Summary of Results 1 Survey Results 2 Breakdown of departing
UK household giving new results on regional trends
 CGAP Briefing Note 6 UK household giving new results on regional trends 01 08 July 10 Tom McKenzie and Cathy Pharoah In a climate of growing political emphasis on charitable activity at local levels, this
Commissioned by: Economic Impact of Tourism. Stevenage Results. Produced by: Destination Research
 Commissioned by: Produced by: Destination Research www.destinationresearch.co.uk December 2016 Contents Page Introduction and Contextual Analysis 3 Headline Figures 5 Volume of Tourism 7 Staying Visitors
Economic Impact of Tourism. Hertfordshire Results. Commissioned by: Visit Herts. Produced by:
 Commissioned by: Visit Herts Produced by: Destination Research www.destinationresearch.co.uk December 2016 Contents Page Introduction and Contextual Analysis 3 Headline Figures 5 Volume of Tourism 7 Staying
Foodborne Diseases Active Surveillance Network (FoodNet)
") Foodborne Diseases Active Surveillance Network (FoodNet) Elaine Scallan, PhD Foodborne Diseases Active Surveillance Network (FoodNet) Foodborne and Diarrheal Disease Branch Centers for Disease Control
Foodborne Diseases Active Surveillance Network (FoodNet) Elaine Scallan, PhD Foodborne Diseases Active Surveillance Network (FoodNet) Foodborne and Diarrheal Disease Branch Centers for Disease Control
Unit 6: Probability Plotting
 Unit 6: Probability Plotting Ramón V. León Notes largely based on Statistical Methods for Reliability Data by W.Q. Meeker and L. A. Escobar, Wiley, 1998 and on their class notes. 9/12/2004 Stat 567: Unit
Testing whether eco certifications sell tourism services
 University of Wollongong Research Online Faculty of Business - Papers Faculty of Business 2014 Testing whether eco certifications sell tourism services Logi Karlsson University of Wollongong, lk976@uowmail.edu.au
A Primer on Fatigue Damage Spectrum for Accelerated and Reliability Testing
 A Primer on Fatigue Damage Spectrum for Accelerated and Reliability Testing John VanBaren Vibration Research Corporation vrsales@vibrationresearch.com www.ieee-astr.org ASTR 2016, Sep 28-30, Pensacola
SURVEY OF U3A MEMBERS (PART 1)
") SURVEY OF U3A MEMBERS (PART 1) Introduction To provide a satisfactory service to its member U3As, The Third Age Trust recognised that it needs to be aware of the diversity of individual U3A members and
SURVEY OF U3A MEMBERS (PART 1) Introduction To provide a satisfactory service to its member U3As, The Third Age Trust recognised that it needs to be aware of the diversity of individual U3A members and
A stated preference survey for airport choice modeling.
 XI Riunione Scientifica Annuale -!Società Italiana di Economia dei Trasporti e della Logistica Trasporti, logistica e reti di imprese: competitività del sistema e ricadute sui territori locali, Trieste,
Market power and its determinants of the Chinese airline industry
 Market power and its determinants of the Chinese airline industry Qiong Zhang, Hangjun Yang, Qiang Wang University of International Business and Economics Anming Zhang University of British Columbia 4
Name: Date: Period: Samples and Populations Investigation 1.1: Comparing Wait Times
 Name: Date: Period: Samples and Populations Investigation 1.1: Comparing Wait Times In your lifetime, you spend a lot of time waiting. Sometimes it feels like you could stand in line forever. For example,
LATENCY OF TOURISM PERMITS IN THE GREAT BARRIER REEF MARINE PARK AUDIT FOR THE YEAR 2000
 LATENCY OF TOURISM PERMITS IN THE GREAT BARRIER REEF MARINE PARK AUDIT FOR THE YEAR 2 Tourism and Recreation Group December 2 DISCLAIMER The information provided in this Audit is for information and discussion
Produced by: Destination Research Sergi Jarques, Director
 Produced by: Destination Research Sergi Jarques, Director Economic Impact of Tourism Oxfordshire - 2015 Economic Impact of Tourism Headline Figures Oxfordshire - 2015 Total number of trips (day & staying)
HOW TO IMPROVE HIGH-FREQUENCY BUS SERVICE RELIABILITY THROUGH SCHEDULING
 HOW TO IMPROVE HIGH-FREQUENCY BUS SERVICE RELIABILITY THROUGH SCHEDULING Ms. Grace Fattouche Abstract This paper outlines a scheduling process for improving high-frequency bus service reliability based
The Economic Contributions of Agritourism in New Jersey
 The Economic Contributions of Agritourism in New Jersey Bulletin E333 Cooperative Extension Brian J. Schilling, Extension Specialist in Agricultural Policy Kevin P. Sullivan, Institutional Research Analyst
1 Replication of Gerardi and Shapiro (2009)
") Appendix: "Incumbent Response to Entry by Low-Cost Carriers in the U.S. Airline Industry" Kerry M. Tan 1 Replication of Gerardi and Shapiro (2009) Gerardi and Shapiro (2009) use a two-way fixed effects
Appendix: "Incumbent Response to Entry by Low-Cost Carriers in the U.S. Airline Industry" Kerry M. Tan 1 Replication of Gerardi and Shapiro (2009) Gerardi and Shapiro (2009) use a two-way fixed effects
FIXED-SITE AMUSEMENT RIDE INJURY SURVEY FOR NORTH AMERICA, 2016 UPDATE
 FIXED-SITE AMUSEMENT RIDE INJURY SURVEY FOR NORTH AMERICA, 2016 UPDATE Prepared for International Association of Amusement Parks and Attractions Alexandria, VA by National Safety Council Research and Statistical
An Assessment on the Cost Structure of the UK Airport Industry: Ownership Outcomes and Long Run Cost Economies
 An Assessment on the Cost Structure of the UK Airport Industry: Ownership Outcomes and Long Run Cost Economies Anna Bottasso & Maurizio Conti Università di Genova Milano- IEFE-Bocconi 19 March 2010 Plan
Baseline results of the 5 th Wild Dog & 3 rd Cheetah Photographic Census of Greater Kruger National Park
 Baseline results of the 5 th Wild Dog & 3 rd Cheetah Photographic Census of Greater Kruger National Park H. T. Davies-Mostert 1, M. Burger 1, M.G.L. Mills 2, M. Somers 3, M. Hofmeyr 4 & S. Ferreira 5 1
Predicting a Dramatic Contraction in the 10-Year Passenger Demand
 Predicting a Dramatic Contraction in the 10-Year Passenger Demand Daniel Y. Suh Megan S. Ryerson University of Pennsylvania 6/29/2018 8 th International Conference on Research in Air Transportation Outline
Hickerson, B., & Henderson, K. A. (2010, May/June). Children s summer camp-based physical activity. Camping Magazine, 83(3),
. Children s summer camp-based physical activity. Camping Magazine, 83(3),") Children s Summer Camp-Based Physical Activity By: Benjamin Hickerson and Karla Henderson. Hickerson, B., & Henderson, K. A. (2010, May/June). Children s summer camp-based physical activity. Camping Magazine,
Children s Summer Camp-Based Physical Activity By: Benjamin Hickerson and Karla Henderson. Hickerson, B., & Henderson, K. A. (2010, May/June). Children s summer camp-based physical activity. Camping Magazine,
REPORT 2014/065 INTERNAL AUDIT DIVISION. Audit of air operations in the United. Nations Assistance Mission in Afghanistan
 INTERNAL AUDIT DIVISION REPORT 2014/065 Audit of air operations in the United Nations Assistance Mission in Afghanistan Overall results relating to the effective management of air operations in the United
Measures of Urban Trail Use in Minneapolis
 Measures of Urban Trail Use in Minneapolis Midtown Greenway @ Hennepin Ave Midtown Greenway @ Cedar Ave Midtown Greenway @ West River Pkwy Lake Calhoun Pkwy trail Why Measure Trail Use? Document use of
Quantile Regression Based Estimation of Statistical Contingency Fuel. Lei Kang, Mark Hansen June 29, 2017
 Quantile Regression Based Estimation of Statistical Contingency Fuel Lei Kang, Mark Hansen June 29, 2017 Agenda Background Industry practice Data Methodology Benefit assessment Conclusion 2 Agenda Background
Somchanok Tiabtiamrat* and Supachok Wiriyacosol ABSTRACT
 Kasetsart J. (Nat. Sci.) 45 : 967-976 (2011) Risk Formulation of Hull Loss Accidents in Narrow-Body Commercial Jet Aircraft (Boeing 737, Airbus A320, McDonnell Douglas MD82, Tupolev TU134 and TU154 and
An Econometric Study of Flight Delay Causes at O Hare International Airport Nathan Daniel Boettcher, Dr. Don Thompson*
 An Econometric Study of Flight Delay Causes at O Hare International Airport Nathan Daniel Boettcher, Dr. Don Thompson* Abstract This study examined the relationship between sources of delay and the level
Analysis of Runway Incursion Data
 https://ntrs.nasa.gov/search.jsp?r=20150018913 2019-02-23T03:50:31+00:00Z Analysis of Runway Incursion Data Lawrence L. Green NASA Langley Research Center, Hampton, Virginia, 23681 A statistical analysis
Transport Performance and the Data Clubs Approach. Richard Anderson ESRC International Public Service Rankings 13 th December 2005
 Transport Performance and the Data Clubs Approach Richard Anderson ESRC International Public Service Rankings 13 th December 2005 Presentation structure Introduction and history of pubic transport benchmarking
Demand Shifting across Flights and Airports in a Spatial Competition Model
 Demand Shifting across Flights and Airports in a Spatial Competition Model Diego Escobari Sang-Yeob Lee November, 2010 Outline Introduction 1 Introduction Motivation Contribution and Intuition 2 3 4 SAR
Produced by: Destination Research Sergi Jarques, Director
 Produced by: Destination Research Sergi Jarques, Director Economic Impact of Tourism Epping Forest - 2014 Economic Impact of Tourism Headline Figures Epping Forest - 2014 Total number of trips (day & staying)
Conceptual Design of a National Database of Air Passenger Survey Data
 NATIONAL CENTER OF EXCELLENCE FOR AVIATION OPERATIONS RESEARCH University of California at Berkeley Development of a National Database of Air Passenger Survey Data Conceptual Design of a National Database
The Seychelles National Meteorological Services. Mahé Seychelles
 Report for the fishermen Finding the best days to process sea-cucumber in the Seychelles during the months of March, April and May. The Seychelles National Meteorological Services Mahé Seychelles By: Hyacinth
Paper presented to the 40 th European Congress of the Regional Science Association International, Barcelona, Spain, 30 August 2 September, 2000.
 Airline Strategies for Aircraft Size and Airline Frequency with changing Demand and Competition: A Two-Stage Least Squares Analysis for long haul traffic on the North Atlantic. D.E.Pitfield and R.E.Caves
An Exploration of LCC Competition in U.S. and Europe XINLONG TAN
 An Exploration of LCC Competition in U.S. and Europe CLIFFORD WINSTON JIA YAN XINLONG TAN BROOKINGS INSTITUTION WSU WSU Motivation Consolidation of airlines could lead to higher fares and service cuts.
Analysis of Air Transportation Systems. Airport Capacity
 Analysis of Air Transportation Systems Airport Capacity Dr. Antonio A. Trani Associate Professor of Civil and Environmental Engineering Virginia Polytechnic Institute and State University Fall 2002 Virginia
The Effectiveness of JetBlue if Allowed to Manage More of its Resources
 McNair Scholars Research Journal Volume 2 Article 4 2015 The Effectiveness of JetBlue if Allowed to Manage More of its Resources Jerre F. Johnson Embry Riddle Aeronautical University, johnsff9@my.erau.edu
IPSOS / REUTERS POLL DATA Prepared by Ipsos Public Affairs
 Ipsos Poll Conducted for Reuters Airlines Poll 6.30.2017 These are findings from an Ipsos poll conducted June 22-29, 2017 on behalf Thomson Reuters. For the survey, a sample of roughly 2,316 adults age
DRONE SIGHTINGS ANALYSIS AND RECOMMENDATIONS
 DRONE SIGHTINGS ANALYSIS AND RECOMMENDATIONS UNMANNED AIRCRAFT SAFETY TEAM DRONE SIGHTINGS WORKING GROUP DECEMBER 12, 2017 1 UNMANNED AIRCRAFT SAFETY TEAM DRONE SIGHTINGS WORKING GROUP EXECUTIVE SUMMARY
Revisiting the Relationship between Competition and Price Discrimination
 Revisiting the Relationship between Competition and Price Discrimination Ambarish Chandra a,b Mara Lederman a June 7, 2017 a : University of Toronto, Rotman School of Management b : University of Toronto
PREFERENCES FOR NIGERIAN DOMESTIC PASSENGER AIRLINE INDUSTRY: A CONJOINT ANALYSIS
 PREFERENCES FOR NIGERIAN DOMESTIC PASSENGER AIRLINE INDUSTRY: A CONJOINT ANALYSIS Ayantoyinbo, Benedict Boye Faculty of Management Sciences, Department of Transport Management Ladoke Akintola University
Water Quality Trends for Conscience Bay
 Water Quality Trends for Conscience Bay 2018 This report summarizes water quality data for fecal coliform and total coliform in Conscience Bay for the years 1998-2018. Prepared by: Brian M. McCaffrey Stormwater
Revalidation: Recommendations from the Task and Finish Group
 Council meeting 12 January 2012 01.12/C/03 Public business Revalidation: Recommendations from the Task and Finish Group Purpose This paper provides a report on the work of the Revalidation Task and Finish
Multiple comparison of green express aviation network path optimization research
 Multiple comparison of green express aviation network path optimization research XIANGCHAO LIU CHANGSONG MA HUA HE LI LUO Tian Fu College of Southwestern University of Finance and Economics IFSPA2012 HongKong
Discriminate Analysis of Synthetic Vision System Equivalent Safety Metric 4 (SVS-ESM-4)
") Discriminate Analysis of Synthetic Vision System Equivalent Safety Metric 4 (SVS-ESM-4) Cicely J. Daye Morgan State University Louis Glaab Aviation Safety and Security, SVS GA Discriminate Analysis of
Discriminate Analysis of Synthetic Vision System Equivalent Safety Metric 4 (SVS-ESM-4) Cicely J. Daye Morgan State University Louis Glaab Aviation Safety and Security, SVS GA Discriminate Analysis of
Statistical Evaluation of Seasonal Effects to Income, Sales and Work- Ocupation of Farmers, the Apples Case in Prizren and Korça Regions
 Abstract Statistical Evaluation of Seasonal Effects to Income, Sales and Work- Ocupation of Farmers, the Apples Case in Prizren and Korça Regions PhD. Eriona Deda Faculty of Economics and Agribusiness,
Technical Documentation Wind Turbine Generator Systems with LNTE 50 Hz and 60 Hz
 PLEASANT RIDGE EXHIBIT 15 Technical Documentation Wind Turbine Generator Systems 1.7-103 with LNTE 50 Hz and 60 Hz Noise-Reduced Operation according to IEC Incl. Octave Band Spectra Incl. 1/3 rd Octave
FIXED-SITE AMUSEMENT RIDE INJURY SURVEY, 2005 UPDATE. Prepared for International Association of Amusement Parks and Attractions Alexandria, Virginia
 FIXED-SITE AMUSEMENT RIDE INJURY SURVEY, 2005 UPDATE Prepared for International Association of Amusement Parks and Attractions Alexandria, Virginia by National Safety Council Research and Statistical Services
Sharpe Performance by Australian Property
 Pacific Rim Property Society Conference Sydney 2009 Sharpe Performance by Australian Property Presented by: Stephen Lee CASS Business School City University, London, England David M. Higgins School of
The Traffic Management Act (TMA) 2004 and roadworks; and lane rental under the New Roads and Streetworks Act (1991) in England
 2004 and roadworks; and lane rental under the New Roads and Streetworks Act (1991) in England") The Traffic Management Act (TMA) 2004 and roadworks; and lane rental under the New Roads and Streetworks Act (1991) in England Introduction and purpose of note In view of the review of SRWC functions,
The Traffic Management Act (TMA) 2004 and roadworks; and lane rental under the New Roads and Streetworks Act (1991) in England Introduction and purpose of note In view of the review of SRWC functions,
Fewer air traffic delays in the summer of 2001
 June 21, 22 Fewer air traffic delays in the summer of 21 by Ken Lamon The MITRE Corporation Center for Advanced Aviation System Development T he FAA worries a lot about summer. Not only is summer the time
International Passenger Survey (IPS) Methodology. May 2017
 Methodology. May 2017") International Passenger Survey (IPS) Methodology May 2017 1 Contents Introduction IPS and VisitBritain Key concepts and definitions Sampling approach Collection of IPS data Producing national estimates
International Passenger Survey (IPS) Methodology May 2017 1 Contents Introduction IPS and VisitBritain Key concepts and definitions Sampling approach Collection of IPS data Producing national estimates
STANDARDS MAP Basic Programs 1 and 2 English Language Arts Content Standards Grade Five
 : Pearson Program Title: Pearson California and Pearson California Components: : Teacher s Edition (TE), Student Edition (SE), Practice Book (PB); : Teacher s Edition (TE), Student Edition (SE), Transparencies
2013 Travel Survey. for the States of Guernsey Commerce & Employment Department RESEARCH REPORT ON Q1 2013
 213 Travel Survey for the States of Guernsey Commerce & Employment Department RESEARCH REPORT ON Q1 213 May 21st 213 Table of Contents Page No. Summary of Results 1 Survey Results 2 Breakdown of departing
An Analytical Approach to the BFS vs. DFS Algorithm Selection Problem 1
 An Analytical Approach to the BFS vs. DFS Algorithm Selection Problem 1 Tom Everitt Marcus Hutter Australian National University September 3, 2015 Everitt, T. and Hutter, M. (2015a). Analytical Results
Specialty Cruises. 100% Tally and Strip Cruises
 Specialty Cruises 100% Tally and Strip Cruises Cumulative Tally Tree Category Cruises Stratified Cruises Tree or Log Average Cruises Multiple Cruisers on the same Stand Site Index Cruises Reproduction
Corporate Productivity Case Study
 BOMBARDIER BUSINESS AIRCRAFT Corporate Productivity Case Study April 2009 Marketing Executive Summary» In today's environment it is critical to have the right tools to demonstrate the contribution of business
Water Quality Trends for Patchogue Bay
 Water Quality Trends for Patchogue Bay 2018 This report summarizes water quality data for fecal coliform and total coliform in Patchogue Bay for the years 2003-2017. Prepared by: Brian M. McCaffrey Stormwater
EUROPEANS EXPERIENCE WITH USING SHIPS AND PERCEPTIONS OF MARITIME SAFETY
 Special Eurobarometer 422b EUROPEANS EXPERIENCE WITH USING SHIPS AND PERCEPTIONS OF MARITIME SAFETY SUMMARY Fieldwork: October 2014 Publication: March 2015 This survey has been requested by the European
ST 507 Practice Exam 1
 ST 07 Practice Exam 1 1) To satisfy a Congessional mandate, the Federal Aviation Administration (FAA) monitors airlines for safety and customer service. For each domestic flight, the airline must report
Time-Space Analysis Airport Runway Capacity. Dr. Antonio A. Trani. Fall 2017
 Time-Space Analysis Airport Runway Capacity Dr. Antonio A. Trani CEE 3604 Introduction to Transportation Engineering Fall 2017 Virginia Tech (A.A. Trani) Why Time Space Diagrams? To estimate the following:
Potential of CO 2 retrieval from IASI
 Potential of CO 2 retrieval from IASI L. Chaumat, O. Lezeaux, P. Prunet, B. Tournier F.-R. Cayla (SISCLE), C. Camy-Peyret (LPMAA) and T. Phulpin (CNES) Study supported by CNES ITSC-XVI: Angra dos Reis,
Solid waste generation and disposal by Hotels in Coimbatore City
 Solid waste generation and disposal by Hotels in Coimbatore City Donald M. Ephraim Research Scholar, Bharathiyar University, Coimbatore, India S. Boopathi Reader, Bharathiyar University, Coimbatore, India
Estimates of the Economic Importance of Tourism
 Estimates of the Economic Importance of Tourism 2008-2013 Coverage: UK Date: 03 December 2014 Geographical Area: UK Theme: People and Places Theme: Economy Theme: Travel and Transport Key Points This article
Produced by: Destination Research Sergi Jarques, Director
 Produced by: Destination Research Sergi Jarques, Director Economic Impact of Tourism Norfolk - 2017 Contents Page Summary Results 2 Contextual analysis 4 Volume of Tourism 7 Staying Visitors - Accommodation
HEATHROW COMMUNITY NOISE FORUM. Sunninghill flight path analysis report February 2016
 HEATHROW COMMUNITY NOISE FORUM Sunninghill flight path analysis report February 2016 1 Contents 1. Executive summary 2. Introduction 3. Evolution of traffic from 2005 to 2015 4. Easterly departures 5.
Commissioned by: Visit Kent. Economic Impact of Tourism. Canterbury Results. Produced by: Destination Research
 Commissioned by: Visit Kent Produced by: Destination Research www.destinationresearch.co.uk November 2016 Contents Page Introduction and Contextual Analysis 3 Headline Figures 6 Volume of Tourism 8 Staying
A Statistical Method for Eliminating False Counts Due to Debris, Using Automated Visual Inspection for Probe Marks
 A Statistical Method for Eliminating False Counts Due to Debris, Using Automated Visual Inspection for Probe Marks SWTW 2003 Max Guest & Mike Clay August Technology, Plano, TX Probe Debris & Challenges
Produced by: Destination Research Sergi Jarques, Director
 Produced by: Destination Research Sergi Jarques, Director Economic Impact of Tourism North Norfolk District - 2016 Contents Page Summary Results 2 Contextual analysis 4 Volume of Tourism 7 Staying Visitors
Produced by: Destination Research Sergi Jarques, Director
 Produced by: Destination Research Sergi Jarques, Director Economic Impact of Tourism Norfolk - 2016 Contents Page Summary Results 2 Contextual analysis 4 Volume of Tourism 7 Staying Visitors - Accommodation
ANALYSIS OF THE CONTRIUBTION OF FLIGHTPLAN ROUTE SELECTION ON ENROUTE DELAYS USING RAMS
 ANALYSIS OF THE CONTRIUBTION OF FLIGHTPLAN ROUTE SELECTION ON ENROUTE DELAYS USING RAMS Akshay Belle, Lance Sherry, Ph.D, Center for Air Transportation Systems Research, Fairfax, VA Abstract The absence
MECHANICAL HARVESTING SYSTEM AND CMNP EFFECTS ON DEBRIS ACCUMULATION IN LOADS OF CITRUS FRUIT
 MECHANICAL HARVESTING SYSTEM AND CMNP EFFECTS ON DEBRIS ACCUMULATION IN LOADS OF CITRUS FRUIT RESEARCH REPORT FOR FLORIDA CITRUS HARVESTING RESEARCH ADVISORY COUNCIL FROM TIMOTHY M. SPANN, PH.D. UNIVERSITY
oneworld alliance: The Commission s investigation under Article 101 TFEU
 oneworld alliance: The Commission s investigation under Article 101 TFEU ACE Conference, Norwich Benoit Durand Benoit.Durand@rbbecon.com com 24 November, 2010 The Commission s approach in oneworld The
Pre-9/11 and Post-9/11 Customer Service Outcomes at U.S. Airports for International Travelers to the U.S.
 Pre-9/11 and Post-9/11 Customer Service Outcomes at U.S. Airports for International Travelers to the U.S. Bryan W. Roberts Private Sector Office Department of Homeland Security November 2006 The views
Figure 1.1 St. John s Location. 2.0 Overview/Structure
 St. John s Region 1.0 Introduction Newfoundland and Labrador s most dominant service centre, St. John s (population = 100,645) is also the province s capital and largest community (Government of Newfoundland
Analysis of Transit Fare Evasion in the Rose Quarter
 Analysis of Transit Fare Evasion in the Rose Quarter Shimon A. Israel James G. Strathman February 2002 Center for Urban Studies College of Urban and Public Affairs Portland State University Portland, OR
Notes largely based on Statistical Methods for Reliability Data by W.Q. Meeker and L. A. Escobar, Wiley, 1998 and on their class notes.
 Unit 3: Nonparametric Estimation Notes largely based on Statistical Methods for Reliability Data by W.Q. Meeker and L. A. Escobar, Wiley, 1998 and on their class notes. Ramón V. León 9/3/2009 Stat 567:
Royal Parks Stakeholder Research Programme 2014
 1 Royal Parks Stakeholder Research Programme 2014 Park profile: Greenwich Park (Waves 1-3) January 2015 Technical note 2 This slide deck presents findings from three waves of survey research conducted
Making the most of school-level per-student spending data
 InterstateFinancial Making the most of school-level per-student spending data Interstate Financial (IFR) was created by states, for states, to meet the financial data reporting requirement under ESSA and