EVALUATION OF TRANSIT SIGNAL PRIORITY EFFECTIVENESS USING AUTOMATIC VEHICLE LOCATION DATA
|
|
|
- Karin Harrington
- 5 years ago
- Views:
Transcription
1 EVALUATION OF TRANSIT SIGNAL PRIORITY EFFECTIVENESS USING AUTOMATIC VEHICLE LOCATION DATA A Thesis Presented to The Academic Faculty by Carl Andrew Sundstrom In Partial Fulfillment of the Requirements for the Degree Masters of Science in the School of Civil Engineering Georgia Institute of Technology May 28
2 EVALUATION OF TRANSIT SIGNAL PRIORITY EFFECTIVENESS USING AUTOMATIC VEHICLE LOCATION DATA Approved by: Dr. Michael Meyer, Advisor School of Civil Engineering Georgia Institute of Technology Dr. Laurie Garrow School of Civil Engineering Georgia Institute of Technology Dr. Michael Hunter School of Civil Engineering Georgia Institute of Technology Date Approved: March 3, 28
3 ACKNOWLEDGMENTS I owe gratitude to a great number of people who, without their gracious help, this thesis would not have been written. First, I would like to express my sincere appreciate to Dr. Michael D. Meyer for all of his help and guidance throughout my time at Georgia Tech. I would also like to express my thanks to the rest of my thesis committee, Dr. Laurie Garrow and Dr. Michael Hunter, for their help in the analysis and review of this project. Sincere thanks are also necessary to everyone in Portland who took the time to help me this research. In particular, thanks to Mr. Peter Koonce for his help and direction in narrowing this topic and setting up the data collection efforts. The staff at Kittelson and Associates, not limited to but including, Wayne Kittelson, Lee Rodegerdts, and Paul Ryus for their tremendous help and resources. I am also deeply grateful for the staff at the Portland Office of Transportation and TriMet, including Bill Kloos, David Crout, and Paul Zebell, for their help in this project. Finally, I would like to express thanks to my parents, Mr. Robert Sundstrom and Mrs. Chary Sundstrom, for their love and support throughout the years and Ms. Kristen Pleil for the support, inspiration, and friendship that she has provided. iii
4 TABLE OF CONTENTS ACKNOWLEDGMENTS... III LIST OF TABLES... VI LIST OF FIGURES...VII SUMMARY... XI CHAPTER 1 INTRODUCTION...1 Page 1.1 STUDY OVERVIEW LITERATURE REVIEW FIELD DATA COLLECTION AND PROCESSING ANALYSIS AND FINDINGS CONCLUSIONS APPENDICES...4 CHAPTER 2 LITERATURE REVIEW PORTLAND, OREGON TSP EVALUATIONS Portland Signal Priority: TEA-21 Technical Report (23) Byrne et al. (25) Kimpel et al. (25) OTHER TSP RESEARCH Liao and Davis (27) Ngan, Sayed, and Abdelfatah (24) Muthuswamy, McShane, and Daniel (26) Sacramento: Watt Avenue Transit Priority Evaluation (26) Virginia Tech Transit Signal Priority Evaluation (26) B-Line Bus Rapid Transit Evaluation Study (23) Garrow and Machemehl (1997) LITERATURE REVIEW SUMMARY...18 CHAPTER 3 FIELD DATA COLLECTION AND PROCESSING STUDY CORRIDOR Corridor Conditions FIELD DATA COLLECTION Automatic Vehicle Location System Conditional Priority System FIELD DATA PROCESSING AND QUALITY CONTROL Data Processing Quality Control...27 CHAPTER 4 ANALYSIS AND FINDINGS TRAVEL TIME Northbound Travel Times Southbound Travel Times SCHEDULE ADHERENCE Northbound Schedule Adherence Southbound Schedule Adherence SUMMARY OF ANALYSIS AND FINDINGS...5 iv
5 CHAPTER 5 CONCLUSIONS BUS STOP PLACEMENT TRAFFIC SIGNAL TIMING AND CROSS-STREET TRAFFIC CONSIDERATIONS LIMITATIONS OF THIS RESEARCH FUTURE RESEARCH RECOMMENDATIONS...58 APPENDIX A...59 APPENDIX B...83 REFERENCES...17 v
6 LIST OF TABLES TABLE 2.1 BUS TRAVEL TIME SUMMARY (ALL TRIPS)...6 TABLE 2.2 BUS TRAVEL TIME SUMMARY (LATE TRIPS ONLY)...6 TABLE 2.3 TRAVEL TIMES PER BUS SIMULATION RESULTS...8 TABLE 2.4 SIMULATION RESULTS FOR DELAY PER BUS...9 TABLE 2.5 TRAVEL TIMES FOR TSP AND NON-TSP BUSES, ALL SEGMENTS...15 TABLE 2.6 DETAILED TRAVEL TIME RESULTS [...16 TABLE 2.7 TRAVEL TIME STATISTICS, AIRPORT STATION WEST HASTINGS STREET...16 TABLE 2.8 SCHEDULE ADHERENCE STATISTICS DOWNTOWN VANCOUVER SECTION...17 TABLE 2.9 NEGATIVE IMPACTS ACCRUING ON CROSS-STREETS DUE TO SIGNAL PRIORITY (ASSUMED BUS HEADWAY = 1 MINUTES)...18 TABLE 3.1 TRAVEL TIME OUTLIER DETERMINATION...28 TABLE 3.2 STATISTICAL COMPARISON OF TRAVEL TIME DATA SET WITH AND WITHOUT OUTLIERS...28 TABLE 3.3 STATISTICAL COMPARISON OF SCHEDULE ADHERENCE DATA SET WITH AND WITHOUT OUTLIERS...28 TABLE 4.1TRAVEL TIME COMPARISON: NORTHBOUND...3 TABLE 4.2 TRAVEL TIME COMPARISON: SOUTHBOUND...34 TABLE 4.3 INCREASE IN LATE ARRIVAL COMPARISON: NORTHBOUND...39 TABLE 4.5 INCREASE IN LATE ARRIVAL COMPARISON: SOUTHBOUND...44 TABLE 5.1 BUS STOP POSITIONS NORTHBOUND...52 TABLE 5.2 BUS STOP POSITIONS SOUTHBOUND...53 TABLE 5.3 TRAFFIC SIGNAL TIMING CONSIDERATIONS FOR SIGNAL PRIORITY...57 vi
7 LIST OF FIGURES FIGURE 2.1 RUN TIME DISTRIBUTION PM PEAK TRIPS...7 FIGURE 2.2 AM AND PM PEAK BUS SPEED AND TRAVEL TIME...11 FIGURE 2.3 IMPACT ON BUS TRAVEL TIME...12 FIGURE 2.4 BUS STOP LOCATION IMPACT ON AVERAGE BUS DELAY (WITH TSP)...13 FIGURE 2.5 NEARSIDE BUS STOP IMPACT ON TSP EFFECTIVENESS...13 FIGURE 3.1 STUDY CORRIDOR MAP...2 FIGURE 3.2 NE 82 ND AVENUE IN PORTLAND, OREGON...21 FIGURE 3.3 DECISION FRAMEWORK FOR EMITTER ACTIVATION...24 FIGURE 3.4 DECISION FRAMEWORK FOR TSP STRATEGY TO EMPLOY...25 FIGURE 3.5 GENERAL SIGNAL PRIORTY CONCEPT...26 FIGURE 4.1 COMPARISON OF AVERAGE VEHICLE TRAVEL TIMES NORTHBOUND: TOTAL STUDY PERIOD...31 FIGURE 4.2 COMPARISON OF AVERAGE VEHICLE TRAVEL TIMES NORTHBOUND: WEEKDAY, AM PEAK PERIOD 31 FIGURE 4.3 COMPARISON OF AVERAGE VEHICLE TRAVEL TIMES NORTHBOUND: WEEKDAY, PM PEAK PERIOD.32 FIGURE 4.4 COMPARISON OF AVERAGE VEHICLE TRAVEL TIMES NORTHBOUND: WEEKDAY, NON-PEAK PERIOD...32 FIGURE 4.5 COMPARISON OF AVERAGE VEHICLE TRAVEL TIMES NORTHBOUND: WEEKEND...33 FIGURE 4.6 COMPARISON OF AVERAGE VEHICLE TRAVEL TIMES SOUTHBOUND: TOTAL STUDY PERIOD...35 FIGURE 4.7 COMPARISON OF AVERAGE VEHICLE TRAVEL TIMES SOUTHBOUND: WEEKDAY, AM PEAK PERIOD.35 FIGURE 4.8 COMPARISON OF AVERAGE VEHICLE TRAVEL TIMES SOUTHBOUND: WEEKDAY, PM PEAK PERIOD..36 FIGURE 4.9 COMPARISON OF AVERAGE VEHICLE TRAVEL TIMES SOUTHBOUND: WEEKDAY, NON-PEAK PERIOD36 FIGURE 4.1 COMPARISON OF AVERAGE VEHICLE TRAVEL TIMES SOUTHBOUND: WEEKEND...37 FIGURE 4.11 COMPARISON OF INCREASE IN LATE ARRIVAL TO SCHEDULE THROUGH CORRIDOR NORTHBOUND: TOTAL STUDY PERIOD...41 FIGURE 4.12COMPARISON OF INCREASE IN LATE ARRIVAL TO SCHEDULE THROUGH CORRIDOR NORTHBOUND: WEEKDAY, AM PEAK PERIOD...42 FIGURE 4.13 COMPARISON OF INCREASE IN LATE ARRIVAL TO SCHEDULE THROUGH CORRIDOR NORTHBOUND: WEEKDAY, PM PEAK PERIOD...42 FIGURE 4.14 COMPARISON OF INCREASE IN LATE ARRIVAL TO SCHEDULE THROUGH CORRIDOR NORTHBOUND: WEEKDAY, NON-PEAK PERIOD...43 FIGURE 4.15 COMPARISON OF INCREASE IN LATE ARRIVAL TO SCHEDULE THROUGH CORRIDOR NORTHBOUND: WEEKEND...43 FIGURE 4.16 COMPARISON OF INCREASE IN LATE ARRIVAL TO SCHEDULE THROUGH CORRIDOR SOUTHBOUND: TOTAL STUDY PERIOD...47 FIGURE 4.17 COMPARISON OF INCREASE IN LATE ARRIVAL TO SCHEDULE THROUGH CORRIDOR SOUTHBOUND: WEEKDAY, AM PEAK PERIOD...48 FIGURE 4.18 COMPARISON OF INCREASE IN LATE ARRIVAL TO SCHEDULE THROUGH CORRIDOR SOUTHBOUND: WEEKDAY, PM PEAK PERIOD...48 FIGURE 4.19 COMPARISON OF INCREASE IN LATE ARRIVAL TO SCHEDULE THROUGH CORRIDOR SOUTHBOUND: WEEKDAY, NON-PEAK PERIOD...49 FIGURE 4.2 COMPARISON OF INCREASE IN LATE ARRIVAL TO SCHEDULE THROUGH CORRIDOR SOUTHBOUND: WEEKEND...49 FIGURE 5.1 PERCENTAGE OF BUS STOPS THAT ARE LOCATED NEARSIDE OF A SIGNALIZED INTERSECTION...53 FIGURE 5.2 BUS STOP PERCENTAGE - NORTHBOUND...54 FIGURE 5.3 BUS STOP PERCENTAGE - SOUTHBOUND...55 FIGURE A.1 NORTHBOUND VEHICLE TRAVEL TIMES, AM PEAK PERIOD, TSP OFF...59 FIGURE A.2 NORTHBOUND VEHICLE TRAVEL TIMES, WEEKDAY AM PEAK PERIOD, TSP OFF...59 FIGURE A.3 NORTHBOUND VEHICLE TRAVEL TIMES, WEEKEND AM PEAK PERIOD, TSP OFF...6 FIGURE A.4 NORTHBOUND VEHICLE TRAVEL TIMES, NON-PEAK PERIOD, TSP OFF...6 FIGURE A.5 NORTHBOUND VEHICLE TRAVEL TIMES, WEEKDAY NON-PEAK PERIOD, TSP OFF...61 FIGURE A.6 NORTHBOUND VEHICLE TRAVEL TIMES, WEEKEND NON-PEAK PERIOD, TSP OFF...61 vii
8 FIGURE A.7 NORTHBOUND VEHICLE TRAVEL TIMES, PM PEAK PERIOD, TSP OFF...62 FIGURE A.8 NORTHBOUND VEHICLE TRAVEL TIMES, WEEKDAY PM PEAK PERIOD, TSP OFF...62 FIGURE A.9 NORTHBOUND VEHICLE TRAVEL TIMES, WEEKEND PM PEAK PERIOD, TSP OFF...63 FIGURE A.1 NORTHBOUND VEHICLE TRAVEL TIMES, TOTAL STUDY PERIOD, TSP OFF...63 FIGURE A.11 NORTHBOUND VEHICLE TRAVEL TIMES, WEEKDAY TOTAL STUDY PERIOD, TSP OFF...64 FIGURE A.12 NORTHBOUND VEHICLE TRAVEL TIMES, WEEKEND TOTAL STUDY PERIOD, TSP OFF...64 FIGURE A.13 SOUTHBOUND VEHICLE TRAVEL TIMES, AM PEAK PERIOD, TSP OFF...65 FIGURE A.14 SOUTHBOUND VEHICLE TRAVEL TIMES, WEEKDAY AM PEAK PERIOD, TSP OFF...65 FIGURE A.15 SOUTHBOUND VEHICLE TRAVEL TIMES, WEEKEND AM PEAK PERIOD, TSP OFF...66 FIGURE A.16 SOUTHBOUND VEHICLE TRAVEL TIMES, NON-PEAK PERIOD, TSP OFF...66 FIGURE A.17 SOUTHBOUND VEHICLE TRAVEL TIMES, WEEKDAY NON-PEAK PERIOD, TSP OFF...67 FIGURE A.18 SOUTHBOUND VEHICLE TRAVEL TIMES, WEEKEND NON-PEAK PERIOD, TSP OFF...67 FIGURE A.19 SOUTHBOUND VEHICLE TRAVEL TIMES, PM PEAK PERIOD, TSP OFF...68 FIGURE A.2 SOUTHBOUND VEHICLE TRAVEL TIMES, WEEKDAY PM PEAK PERIOD, TSP OFF...68 FIGURE A.21 SOUTHBOUND VEHICLE TRAVEL TIMES, WEEKEND PM PEAK PERIOD, TSP OFF...69 FIGURE A.22 SOUTHBOUND VEHICLE TRAVEL TIMES, TOTAL STUDY PERIOD, TSP OFF...69 FIGURE A.23 SOUTHBOUND VEHICLE TRAVEL TIMES, WEEKDAY TOTAL STUDY PERIOD, TSP OFF...7 FIGURE A.24 SOUTHBOUND VEHICLE TRAVEL TIMES, WEEKEND TOTAL STUDY PERIOD, TSP OFF...7 FIGURE A.25 NORTHBOUND VEHICLE TRAVEL TIMES, AM PEAK PERIOD, TSP ON...71 FIGURE A.26 NORTHBOUND VEHICLE TRAVEL TIMES, WEEKDAY AM PEAK PERIOD, TSP ON...71 FIGURE A.27 NORTHBOUND VEHICLE TRAVEL TIMES, WEEKEND AM PEAK PERIOD, TSP ON...72 FIGURE A.28 NORTHBOUND VEHICLE TRAVEL TIMES, NON-PEAK PERIOD, TSP ON...72 FIGURE A.29 NORTHBOUND VEHICLE TRAVEL TIMES, WEEKDAY NON-PEAK PERIOD, TSP ON...73 FIGURE A.3 NORTHBOUND VEHICLE TRAVEL TIMES, WEEKEND NON-PEAK PERIOD, TSP ON...73 FIGURE A.31 NORTHBOUND VEHICLE TRAVEL TIMES, PM PEAK PERIOD, TSP ON...74 FIGURE A.32 NORTHBOUND VEHICLE TRAVEL TIMES, WEEKDAY PM PEAK PERIOD, TSP ON...74 FIGURE A.33 NORTHBOUND VEHICLE TRAVEL TIMES, WEEKEND PM PEAK PERIOD, TSP ON...75 FIGURE A.34 NORTHBOUND VEHICLE TRAVEL TIMES, TOTAL STUDY PERIOD, TSP ON...75 FIGURE A.35 NORTHBOUND VEHICLE TRAVEL TIMES, WEEKDAY TOTAL STUDY PERIOD, TSP ON...76 FIGURE A.36 SOUTHBOUND VEHICLE TRAVEL TIMES, AM PEAK PERIOD, TSP ON...76 FIGURE A.37 SOUTHBOUND VEHICLE TRAVEL TIMES, WEEKDAY AM PEAK PERIOD, TSP ON...77 FIGURE A.38 SOUTHBOUND VEHICLE TRAVEL TIMES, WEEKEND AM PEAK PERIOD, TSP ON...77 FIGURE A.39 SOUTHBOUND VEHICLE TRAVEL TIMES, NON-PEAK PERIOD, TSP ON...78 FIGURE A.4 SOUTHBOUND VEHICLE TRAVEL TIMES, WEEKDAY NON-PEAK PERIOD, TSP ON...78 FIGURE A.41 SOUTHBOUND VEHICLE TRAVEL TIMES, WEEKEND NON-PEAK PERIOD, TSP ON...79 FIGURE A.42 SOUTHBOUND VEHICLE TRAVEL TIMES, PM PEAK PERIOD, TSP ON...79 FIGURE A.43 SOUTHBOUND VEHICLE TRAVEL TIMES, WEEKDAY PM PEAK PERIOD, TSP ON...8 FIGURE A.44 SOUTHBOUND VEHICLE TRAVEL TIMES, WEEKEND PM PEAK PERIOD, TSP ON...8 FIGURE A.45 SOUTHBOUND VEHICLE TRAVEL TIMES, TOTAL STUDY PERIOD, TSP ON...81 FIGURE A.46 SOUTHBOUND VEHICLE TRAVEL TIMES, WEEKDAY TOTAL STUDY PERIOD, TSP ON...81 FIGURE A.47 SOUTHBOUND VEHICLE TRAVEL TIMES, WEEKEND TOTAL STUDY PERIOD, TSP ON...82 FIGURE B.1 INCREASE IN LATE ARRIVAL TO SCHEDULE THROUGH CORRIDOR NORTHBOUND: AM PEAK PERIOD, TSP OFF...83 FIGURE B.2 INCREASE IN LATE ARRIVAL TO SCHEDULE THROUGH CORRIDOR NORTHBOUND: NON-PEAK PERIOD, TSP OFF...83 FIGURE B.3 INCREASE IN LATE ARRIVAL TO SCHEDULE THROUGH CORRIDOR NORTHBOUND: PM PEAK PERIOD, TSP OFF...84 FIGURE B.4 INCREASE IN LATE ARRIVAL TO SCHEDULE THROUGH CORRIDOR NORTHBOUND: WEEKDAY, TSP OFF...84 FIGURE B.5 INCREASE IN LATE ARRIVAL TO SCHEDULE THROUGH CORRIDOR NORTHBOUND: WEEKDAY, AM PEAK PERIOD, TSP OFF...85 FIGURE B.6 INCREASE IN LATE ARRIVAL TO SCHEDULE THROUGH CORRIDOR NORTHBOUND: WEEKDAY, NON- PEAK PERIOD, TSP OFF...85 FIGURE B.7 INCREASE IN LATE ARRIVAL TO SCHEDULE THROUGH CORRIDOR NORTHBOUND: WEEKDAY, PM PEAK PERIOD, TSP OFF...86 viii
9 FIGURE B.8 INCREASE IN LATE ARRIVAL TO SCHEDULE THROUGH CORRIDOR NORTHBOUND: WEEKEND, TSP OFF...86 FIGURE B.9 INCREASE IN LATE ARRIVAL TO SCHEDULE THROUGH CORRIDOR NORTHBOUND: WEEKEND, AM PEAK PERIOD, TSP OFF...87 FIGURE B.1 INCREASE IN LATE ARRIVAL TO SCHEDULE THROUGH CORRIDOR NORTHBOUND: WEEKEND, NON- PEAK PERIOD, TSP OFF...87 FIGURE B.11 INCREASE IN LATE ARRIVAL TO SCHEDULE THROUGH CORRIDOR NORTHBOUND: WEEKEND, PM PEAK PERIOD, TSP OFF...88 FIGURE B.12 INCREASE IN LATE ARRIVAL TO SCHEDULE THROUGH CORRIDOR NORTHBOUND: TOTAL STUDY PERIOD, TSP OFF...88 FIGURE B.13 INCREASE IN LATE ARRIVAL TO SCHEDULE THROUGH CORRIDOR NORTHBOUND: TOTAL STUDY PERIOD, AM PEAK PERIOD, TSP OFF...89 FIGURE B.14 INCREASE IN LATE ARRIVAL TO SCHEDULE THROUGH CORRIDOR NORTHBOUND: TOTAL STUDY PERIOD, NON-PERIOD, TSP OFF...89 FIGURE B.15 INCREASE IN LATE ARRIVAL TO SCHEDULE THROUGH CORRIDOR NORTHBOUND: TOTAL STUDY PERIOD, PM PEAK PERIOD, TSP OFF...9 FIGURE B.16 INCREASE IN LATE ARRIVAL TO SCHEDULE THROUGH CORRIDOR SOUTHBOUND: WEEKDAY, TSP OFF...9 FIGURE B.17 INCREASE IN LATE ARRIVAL TO SCHEDULE THROUGH CORRIDOR SOUTHBOUND: WEEKDAY, AM PEAK PERIOD, TSP OFF...91 FIGURE B.18 INCREASE IN LATE ARRIVAL TO SCHEDULE THROUGH CORRIDOR SOUTHBOUND: WEEKDAY, NON- PEAK PERIOD, TSP OFF...91 FIGURE B.19 INCREASE IN LATE ARRIVAL TO SCHEDULE THROUGH CORRIDOR SOUTHBOUND: WEEKDAY, PM PEAK PERIOD, TSP OFF...92 FIGURE B.2 INCREASE IN LATE ARRIVAL TO SCHEDULE THROUGH CORRIDOR SOUTHBOUND: WEEKEND, TSP OFF...92 FIGURE B.21 INCREASE IN LATE ARRIVAL TO SCHEDULE THROUGH CORRIDOR SOUTHBOUND: WEEKEND, AM PEAK PERIOD, TSP OFF...93 FIGURE B.22 INCREASE IN LATE ARRIVAL TO SCHEDULE THROUGH CORRIDOR SOUTHBOUND: WEEKEND, NON- PEAK PERIOD, TSP OFF...93 FIGURE B.23 INCREASE IN LATE ARRIVAL TO SCHEDULE THROUGH CORRIDOR SOUTHBOUND: WEEKEND, PM PEAK PERIOD, TSP OFF...94 FIGURE B.24 INCREASE IN LATE ARRIVAL TO SCHEDULE THROUGH CORRIDOR SOUTHBOUND: TOTAL STUDY PERIOD, TSP OFF...94 FIGURE B.25 INCREASE IN LATE ARRIVAL TO SCHEDULE THROUGH CORRIDOR SOUTHBOUND: TOTAL STUDY PERIOD, AM PEAK PERIOD, TSP OFF...95 FIGURE B.26 INCREASE IN LATE ARRIVAL TO SCHEDULE THROUGH CORRIDOR SOUTHBOUND: TOTAL STUDY PERIOD, NON-PEAK PERIOD, TSP OFF...95 FIGURE B.27 INCREASE IN LATE ARRIVAL TO SCHEDULE THROUGH CORRIDOR SOUTHBOUND: TOTAL STUDY PERIOD, PM PEAK PERIOD, TSP OFF...96 FIGURE B.28 INCREASE IN LATE ARRIVAL TO SCHEDULE THROUGH CORRIDOR NORTHBOUND: WEEKDAY TSP ON...96 FIGURE B.29 INCREASE IN LATE ARRIVAL TO SCHEDULE THROUGH CORRIDOR NORTHBOUND: WEEKDAY, AM PEAK PERIOD, TSP ON...97 FIGURE B.3 INCREASE IN LATE ARRIVAL TO SCHEDULE THROUGH CORRIDOR NORTHBOUND: WEEKDAY, NON- PEAK PERIOD, TSP ON...97 FIGURE B.31 INCREASE IN LATE ARRIVAL TO SCHEDULE THROUGH CORRIDOR NORTHBOUND: WEEKDAY, PM PEAK PERIOD, TSP ON...98 FIGURE B.32 INCREASE IN LATE ARRIVAL TO SCHEDULE THROUGH CORRIDOR NORTHBOUND: WEEKEND, TSP ON...98 FIGURE B.33 INCREASE IN LATE ARRIVAL TO SCHEDULE THROUGH CORRIDOR NORTHBOUND: WEEKEND, AM PEAK PERIOD, TSP ON...99 FIGURE B.34 INCREASE IN LATE ARRIVAL TO SCHEDULE THROUGH CORRIDOR NORTHBOUND: WEEKEND, NON- PEAK PERIOD, TSP ON...99 FIGURE B.35 INCREASE IN LATE ARRIVAL TO SCHEDULE THROUGH CORRIDOR NORTHBOUND: WEEKEND, PM PEAK PERIOD, TSP ON...1 ix
10 FIGURE B.36 INCREASE IN LATE ARRIVAL TO SCHEDULE THROUGH CORRIDOR SOUTHBOUND: TOTAL STUDY PERIOD, TSP ON...1 FIGURE B.37 INCREASE IN LATE ARRIVAL TO SCHEDULE THROUGH CORRIDOR SOUTHBOUND: TOTAL STUDY PERIOD, AM PEAK PERIOD, TSP ON...11 FIGURE B.38 INCREASE IN LATE ARRIVAL TO SCHEDULE THROUGH CORRIDOR SOUTHBOUND: TOTAL STUDY PERIOD, NON-PEAK PERIOD, TSP ON...11 FIGURE B.39 INCREASE IN LATE ARRIVAL TO SCHEDULE THROUGH CORRIDOR SOUTHBOUND: TOTAL STUDY PERIOD, PM PEAK PERIOD, TSP ON...12 FIGURE B.4 INCREASE IN LATE ARRIVAL TO SCHEDULE THROUGH CORRIDOR SOUTHBOUND: WEEKDAY, TSP ON...12 FIGURE B.41 INCREASE IN LATE ARRIVAL TO SCHEDULE THROUGH CORRIDOR SOUTHBOUND: WEEKDAY, AM PEAK PERIOD, TSP ON...13 FIGURE B.42 INCREASE IN LATE ARRIVAL TO SCHEDULE THROUGH CORRIDOR SOUTHBOUND: WEEKDAY, NON- PEAK PERIOD, TSP ON...13 FIGURE B.43 INCREASE IN LATE ARRIVAL TO SCHEDULE THROUGH CORRIDOR SOUTHBOUND: WEEKDAY, PM PEAK PERIOD, TSP ON...14 FIGURE B.44 INCREASE IN LATE ARRIVAL TO SCHEDULE THROUGH CORRIDOR SOUTHBOUND: WEEKEND, TSP ON...14 FIGURE B.45 INCREASE IN LATE ARRIVAL TO SCHEDULE THROUGH CORRIDOR SOUTHBOUND: WEEKEND, AM PEAK PERIOD, TSP ON...15 FIGURE B.46 INCREASE IN LATE ARRIVAL TO SCHEDULE THROUGH CORRIDOR SOUTHBOUND: WEEKEND, NON- PEAK PERIOD, TSP ON...15 FIGURE B.47 INCREASE IN LATE ARRIVAL TO SCHEDULE THROUGH CORRIDOR SOUTHBOUND: WEEKEND, PM PEAK PERIOD, TSP ON...16 x
11 SUMMARY Transit Signal Priority (TSP) is an operational strategy that can speed the movement of in-service transit vehicles (typically bus, light rail, or streetcar) through traffic signals. By reducing control delay at signalized intersections, TSP can improve schedule adherence and travel time efficiency while minimizing impacts to normal traffic operations. These benefits improve the quality of service thereby making it more attractive to choice riders. A TSP system can also allow for fewer buses on the same due to travel time reductions and increased reliability, thus reducing transit operating costs. Much of the previous research on TSP has focused on signal control strategies and bus stop placement with little of it analyzing the effectiveness of the system using actual data. This study aims to evaluate the effectiveness of the system using a bus route corridor in Portland, Oregon through real-time Automatic Vehicle Locator data. Key measures that TSP is promoted to improve are evaluated, including travel time, schedule adherence and variability. The TSP system on data was collected for two weeks and is compared to an adjacent two weeks of bus data with the TSP system turned off such that there is no skewing of data due to changes in traffic volumes or transit ridership. This research has shown, that on certain corridors there may be little to no benefit towards TSP implementation and may possibly provide some disbenefit. The direct comparison for TSP on and off scenarios completed for this research yielded no significant differences in reduction in travel time or schedule adherence performance. An additional interesting result was that the standard deviation of the results did not have any specific tendencies with the TSP on or off. Based on these findings, recommendations are made to increase the effectiveness of the system. xi
12 CHAPTER 1 INTRODUCTION Transit Signal Priority (TSP) is an operational strategy that can speed the movement of in-service transit vehicles (typically bus, light rail, or streetcar) through traffic signals. It is a tool being used extensively in other parts of the world to make transit service more reliable, faster, and more cost effective. [1] By reducing control delay at signalized intersections, TSP can improve schedule adherence and travel time efficiency. Another benefit is that TSP enhances transit performance while minimizing impacts to normal traffic operations, including cross-traffic and pedestrians, due to the priority interaction with signal timing plans [2]. Secondary benefits from TSP include that the improved reliability and reduced travel time from TSP implementation increases the quality of service thereby making it competitive with the automobile and more attractive to choice riders. Another benefit is that fewer buses are necessary on the same routes after TSP implementation due to travel time reductions and increased reliability, thus reducing transit operating costs. [3]. TSP is made up of four components. A detection system (1) delivers vehicle data including location, arrival time, and approach. This system is commonly Global Positioning System (GPS) based but can also be roadside detectors. The detection system then requests priority from the traffic control system through communicating with a priority request generator (2). Priority control strategies (3) are then used to process requests and decide how to grant priority. Finally, there is TSP system management software (4) that manages the system, collects data, and generates reports. [1] 1
13 1.1 Study Overview There has been a great deal of research in several areas of TSP. Much of this research has been focused on signal control strategies and bus stop placement with little of it analyzing the effectiveness of the system using actual data. This study aims to evaluate the effectiveness of the system using a portion of the route 72 TriMet bus running down 82 nd Avenue in Portland, Oregon. Previous studies on TSP in Portland, Oregon have been performed when the threshold for activating signal priority was 9 seconds late, that has since been reduced to 3 seconds. The data is collected using a GPS based Automatic Vehicle Locator (AVL) system that is equipped on each bus transmitting real time data to a central control center. This AVL system allows Tri-met staff to actively manage the buses and provide passenger information at key stops throughout the Portland-metropolitan area while also archiving data. [4] This study evaluates the key measures that TSP is promoted to improve. These measures include travel time, schedule adherence, and variability. The TSP system on data was collected for two weeks and is compared to an adjacent two weeks of bus data with the TSP system turned off such that there is no skewing of data due to changes in traffic volumes or transit ridership. 2
14 1.2 Literature Review The literature review in Chapter 2 of this report is divided into two sections. The first section discusses previous evaluations and studies of Portland s TSP system. The second section presents studies focusing primarily on bus stop placement and travel speed and schedule adherence evaluations as well as other studies that pertain to this research such as traffic volumes and TSP interaction. 1.3 Field Data Collection and Processing Chapter 3 focuses on the processes and methodology used for collecting data for this project. It is divided into sections providing detail on the study corridor, field data collection methods, and field data processing and quality control. The Field Data Collection section is divided into information on the Automatic Vehicle Locator system and the Conditional Priority System. 1.4 Analysis and Findings Chapter 4 of the report focuses on the analysis and conclusions drawn from the collected field data on 82 nd Avenue. The data from the TSP on and off scenarios are analyzed to determine whether there is any difference in overall corridor average travel speeds for with TSP on. Then, this chapter explores the effect of TSP on the schedule adherence. 3
15 1.5 Conclusions Chapter 5 of this thesis presents conclusions from the analysis and findings. It also presents recommendations towards improving TSP performance on this study corridor. Finally, this chapter discusses limitations of the research and provides future research recommendations. 1.6 Appendices The appendices include additional travel time and schedule adherence figures that are not included in the body of this report. Appendix A includes individual travel time data and Appendix B contains individual schedule adherence charts. 4
16 CHAPTER 2 LITERATURE REVIEW The following chapter contains information gathered from the existing literature concerning bus transit signal priority. This literature review is divided into sections containing Portland, Oregon studies and other studies focusing particularly on bus stop placement and travel speed and schedule adherence evaluations as well as other studies that pertain to this research such as traffic volumes and TSP interaction. 2.1 Portland, Oregon TSP Evaluations Several studies have evaluated Portland s conditional transit signal priority implementation and are presented in this section. These studies take advantage of the Automatic Vehicle Location (AVL) system on the busses to obtain real-time data. At the time of each of these evaluations, the threshold for activating signal priority was 9 seconds late, which has since been reduced to 3 seconds. Included below are summaries of the major Portland TSP Studies Portland Signal Priority: TEA-21 Technical Report (23) The City of Portland, TriMet, the Oregon Department of Transportation, and a consultant team led by Kittelson & Associates, Inc performed a summary and evaluation of Portland s TSP system in 22. [5] This summary outlines the data collection and evaluation 5
17 of Portland s TSP system for the TEA-21 Signal Priority Project. Bus performance was evaluated for travel time, travel time variability, and on-time performance based on AVL data. Data was collected for eight weeks, four weeks before the TSP and then four weeks with TSP turned on. Table 2.1 summarizes the travel time analysis and provides a coefficient of variability as a percentage of travel time. The outbound, PM period shows a significant improvement in travel time. Table 2.1 Bus Travel Time Summary (All Trips) [5] TSP On TSP Off Differences average average average travel time variability travel time variability travel time variability Direction peak (min) (%) (min) (%) (min) (%) Outbound AM Outbound PM Inbound AM Inbound PM The data was then evaluated using only buses that entered the corridor over 9 seconds late, which is late enough to be granted priority throughout their trip, and accounted for approximately 4% of the trips studied. This data is presented in Table 2.2. Table 2.2 Bus Travel Time Summary (Late Trips Only) [5] TSP On TSP Off Differences average average average travel time variability travel time variability travel time variability Direction peak (min) (%) (min) (%) (min) (%) Outbound AM Outbound PM Inbound AM Inbound PM
18 This analysis shows a travel time reduction of 2.1 to 3.2 minutes with TSP turned on, amounting to 8 11% of the total travel time in the PM peak hour. The reduced variability with TSP on, as shown in Table 22, results in improved on-time performance and reliability. The travel time distribution is presented in Figure 2.1. After Before Figure 2.1 Run Time Distribution PM Peak Trips [5] The results of this study show that the AVL system in Portland can reduce travel time and improve schedule reliability by working in conjunction with signal priority Byrne et al. (25) This study [4] focused on one intersection in Portland using hardware-in-the-loop simulation to study the effects of signal priority on transit performance. The study focused 7
19 specifically on bus stop placement to address whether a green extension plan should be used if there is passenger activity at a nearside stop. Four scenarios, nearside stops without TSP, nearside stops with TSP, farside stops without TSP, and farside stops with TSP, were studied and also broken down further into green extension or red truncation plans. These scenarios were evaluated using actual field conditions and a combination of simulation software (VISSIM) and a field signal controller at an actual intersection in Portland. The results of the travel time analysis are provided in Table 2.3. These results demonstrate that TSP provides a travel time benefit to farside stops with TSP, but may reduce performance for nearside stops. Table 2.4 summarizes the researchers findings on delay. The bus stop placement without TSP yields similar results for average delay and standard deviation. The authors hypothesize that this similar control delay may be related to an adjacent queue preventing vehicle re-entry into the traffic stream. These results also indicate that TSP provides a benefit to farside stops but has the potential to negatively affect bus delay at nearside stops. Furthermore, a comparison of the standard deviation is useful in evaluating travel time variability. As seen in Table 2.4, that authors note that implementation of TSP at farside bus stops considerably reduces standard deviation and thus reduces that potential for buses to fall behind schedule. Overall, this research has demonstrated a 33% reduction in signal delay when TSP is used at farside stops and an increase in delay at nearside stops. Average Bus Travel Time (Sec.) Table 2.3 Travel Times per Bus Simulation Results [4] NearSide without TSP FarSide without TSP NearSide with TSP FarSide with TSP
20 Table 2.4 Simulation Results for Delay per Bus [4] NearSide FarSide w/o TSP w/ TSP Overall Delay w/o TSP w/ TSP Overall Delay Bus Delay (s) Savings (s) Delay (s) Savings (s) Average (NB/SB) Standard Deviation Kimpel et al. (25) A study [6] conducted by researchers at Portland State University evaluated the impacts of TSP on running time variability using AVL data. The data was collected on six TriMet bus routes in with no TSP and after TSP implementation. During these data collection periods, the threshold for activating signal priority was 9 seconds late and has since been reduced to 3 seconds. The overall results showed a negligible decrease from 33.2 to 33.1 minutes of mean actual running time following TSP implementation. Though two, outbound, PM routes showed substantial reductions in running time. For running time variation, 11 of the 24 analysis segments showed a statistically significant difference; four showing a decrease and seven experiencing an increase following TSP implementation. These mixed results in bus performance did not find any across-theboard benefits following TSP implementation. However, this study did not isolate the effect of traffic and ridership growth from year to year. Changes in peak periods, net increases in ridership, and changes in running time variability on other routes were not addressed. 9
21 2.2 Other TSP Research This section focuses on non-portland TSP research. The focus of many of these studies is on bus stop placement and travel speed and schedule adherence evaluations. Other studies that pertain to this research such as traffic volumes and TSP interaction are also highlighted Liao and Davis (27) This paper [7] studied adaptive signal priority for a bus route in Minneapolis through micro-simulation. As presented in Figure 2.2, their results indicate that a 12-15% reduction in bus travel time during the AM peak period and a 4-11% reduction in travel time during the PM peak periods are achievable through signal priority. The authors believe that lower reduction in travel time during the PM peak period is due to the bus stop locations. Their study corridor consisted mainly of nearside bus stops that were blocked by longer queues in the PM peak period. The intersection queues also caused the bus to wait longer to find an acceptable gap in order to rejoin the traffic. The priority request was beneficial however, in that it helped clear the queue to provide service and reduce the bus clearance time. 1
![Figure 2.2 AM and PM Peak Bus Speed and Travel Time [7] 2.2.2 Ngan, Sayed, and Abdelfatah (24) This research [8] studied signal priority on the 98 B-line bus route in Vancouver, BC using VISSIM micro-simulation software.](/docs-images/84/89301886/images/22-0.jpg "The researchers found that TSP is most effective under moderate-to-heavy traffic conditions.")
22 Figure 2.2 AM and PM Peak Bus Speed and Travel Time [7] Ngan, Sayed, and Abdelfatah (24) This research [8] studied signal priority on the 98 B-line bus route in Vancouver, BC using VISSIM micro-simulation software. The researchers found that TSP is most effective under moderate-to-heavy traffic conditions. Bus performance with TSP, as measured by travel time, decreases as traffic volumes, thus encountering lower traffic delay. This is demonstrated in Figure
23 Figure 2.3 Impact on Bus Travel Time [8] The study also found an impact from bus stop location on bus performance. As illustrated in Figure 2.4, a nearside bus stop causes higher delay to the study corridor buses than far side bus stops. This is due to a significant portion of the green extension is wasted during passenger loading and unloading. The authors note that it is possible to address some of the nearside ineffectiveness through using delay times if dwell time at a bus stop is consistent or placing the call immediately downstream of the stop. 12
24 Figure 2.4 Bus Stop Location Impact on Average Bus Delay (with TSP) [8] FIGURE 2.5 shows the percentage increase in bus delay on the study corridor when moving bus stops from the farside to the nearside of an intersection. Figure 2.5 Nearside Bus Stop Impact on TSP Effectiveness [8] Finally, the authors also noted that removing signal coordination from a corridor increases the entire corridor delay, attributed to an increase in the main street delay. Only minimal improvements were found on the cross streets when removing coordination since green time for the cross streets is maintained when there is no TSP call. 13
25 2.2.3 Muthuswamy, McShane, and Daniel (26) This study [3] used simulation to study TSP on a study corridor in Newark, NJ. IT found that the benefits of TSP are not uniform along a corridor and that at cross streets with heavy traffic volumes, TSP should be restricted or suppressed to avoid excessive delays at these cross streets Sacramento: Watt Avenue Transit Priority Evaluation (26) This study [9] evaluated Watt Avenue in Sacramento, CA using AVL data. Data was collected for one week in April 24 for the three peak periods of traffic flow: AM, midday, and PM. For comparison data some buses were outfitted TSP transponders while others did not. As shown in Table 2.5, this study found that the buses with TSP experienced between 14 and 71 seconds of travel time savings compared to the non-tsp buses traveling over the same segment, a travel time decrease of 4%. These savings are relatively small however, as the route travel time is approximately 4 minutes. Travel time reliability was increased in two out of the six time periods when compared to non-tsp buses. 14

26 Table 2.5 Travel Times for TSP and Non-TSP Buses, All Segments [9] Virginia Tech Transit Signal Priority Evaluation (26) This report [1] studied a corridor in the Northern Virginia area to evaluate the benefits of basic green-extension TSP using field-collected GPS data. Results showed overall travel time improvements of 3% to 6% and presented in table 2.6. The study also found that the TSP strategies reduced transit-vehicle intersection delay by as much as 23%. In addition, the field study found that TSP benefits were maximized under moderate to low levels of congestion. Bus stop location was also studied in simulation and found that nearside bus stops resulted in increased system-wide delays of 2.85% over non-tsp operations, while mid-block and far-side bus stops resulted in network-wide savings of 1.62%. 15
![Table 2.6 Detailed Travel Time Results [1] 2.2.6 98 B-Line Bus Rapid Transit Evaluation Study (23) This evaluation [11] studied the 98 B-Line, an approximately 8 mile bus corridor from the Airport to Downtown Vancouver, BC.](/docs-images/84/89301886/images/27-1.jpg "Data was collected from buses with AVL systems and an active TSP system and compared to recent, manually collected data prior to TSP implementation.")
27 Table 2.6 Detailed Travel Time Results [1] B-Line Bus Rapid Transit Evaluation Study (23) This evaluation [11] studied the 98 B-Line, an approximately 8 mile bus corridor from the Airport to Downtown Vancouver, BC. Data was collected from buses with AVL systems and an active TSP system and compared to recent, manually collected data prior to TSP implementation. The results found only small differences in bus travel time in the before and after data as presented in Table 2.7. However, the results suggest that the TSP system has made travel times less variable, as measured by the standard deviation, by 4 5%. Table 2.7 Travel Time Statistics, Airport Station West Hastings Street [11] 16

28 Schedule adherence data with and without TSP was compared to determine the impact of TSP on service reliability. In the Downtown Vancouver section, the variability of schedule adherence has decreased with TSP throughout the day in the southbound direction and during the mid-day in the northbound direction, demonstrating the improved performance from TSP on this corridor. The schedule adherence results are presented in Table 2.8. Table 2.8 Schedule Adherence Statistics Downtown Vancouver Section [11] Garrow and Machemehl (1997) This study [12] investigated TSP using CORSIM micro-simulation to study the effect of TSP on the surrounding traffic environment. They found that signal priority is often justified during non-peak periods but that there are severe negative impacts on the crossstreet traffic during peak periods--specifically, if the cross-street saturation level is above 1. with a 1-second green extension or above.9 with a 2-second green extension. Therefore, the authors suggest that TSP is only justified during peak periods when the level of transit 17
29 usage is high. The results are shown in Table 2.9. This is relevant to the 82 nd Avenue study corridor as it has several intersections with high-volume east-west arterials connecting to Downtown Portland. Table 2.9 Negative Impacts Accruing on Cross-Streets Due to Signal Priority (Assumed Bus Headway = 1 minutes) [12] Cross Street Saturation Green Extension = 1 sec. Green Extension = 2 sec. Saturation Level =.8 Minimal Moderate Saturation Level =.9 Moderate Significant Saturation Level = 1. Significant Significant 2.3 Literature Review Summary This chapter identified several studies relating to the effectiveness of transit signal priority. This review of the relevant research focused on travel speed and schedule adherence as measures of effectiveness of these systems. The results of this review found mixed results on the benefits of TSP investment. The Vancouver studies and Minneapolis study are among cities that have found a great benefit in travel time and, more importantly, schedule reliability. Portland studies have found mixed results with signal priority, however no evaluation of the system has been performed since the signal priority threshold has been reduced to 3 seconds. Other cities, such as Sacramento, have not found as a great a benefit after TSP implementation. One reason for this reduced performance can be linked to bus stop placement; the literature overwhelmingly supports farside bus stop placement over nearside placement. This is due to several reasons, most importantly that uneven dwell times at stops as well as queues not allowing buses back into the traffic stream. Finally, the Garrow and Muthuswamy studies both found great disbenefits of TSP at intersections with high volume roadways. 18
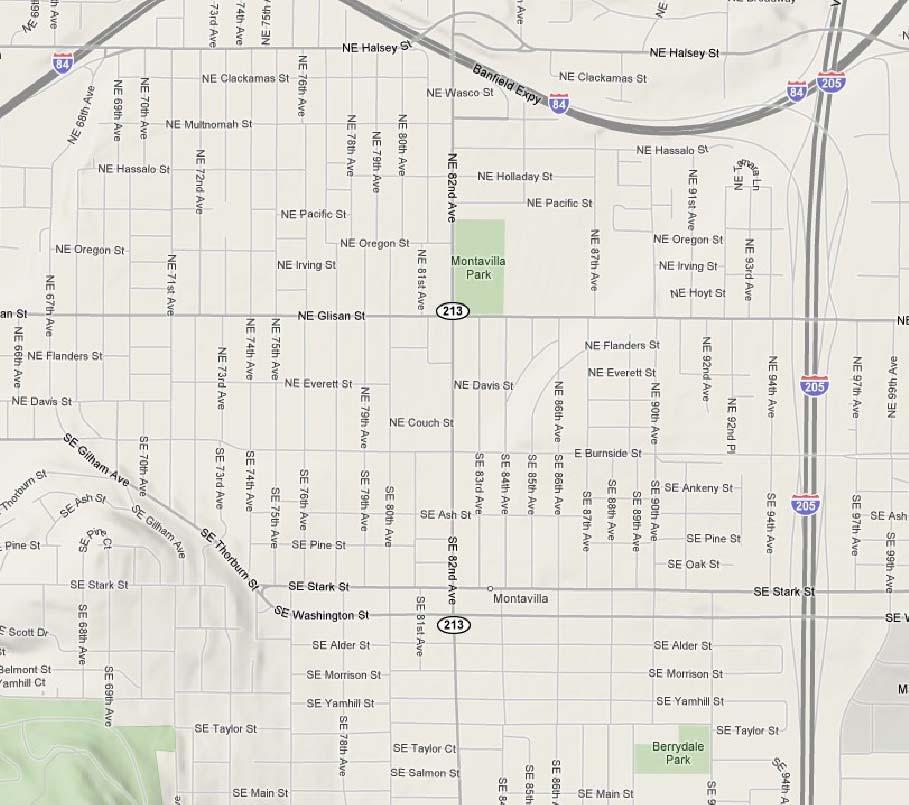
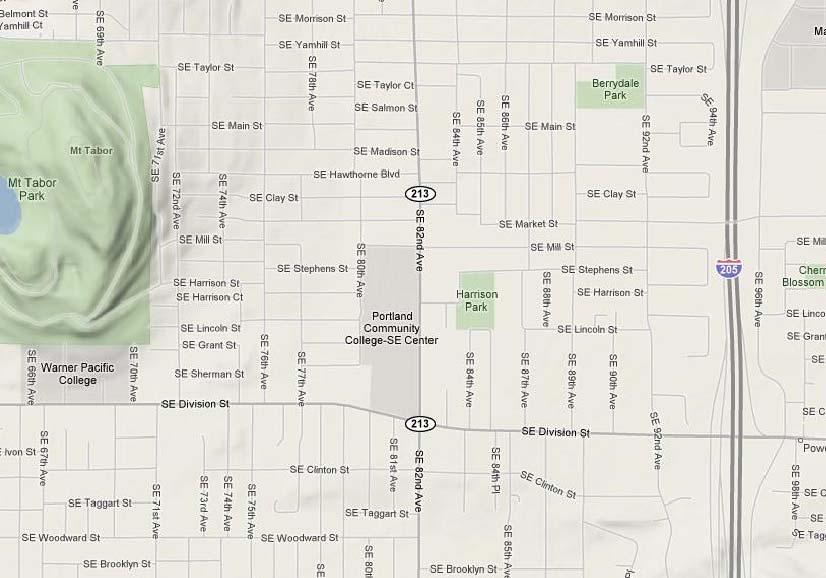
30 CHAPTER 3 FIELD DATA COLLECTION AND PROCESSING The data collection portion of this evaluation took place on a two mile corridor of the Number 72 bus route traveling along NE/SE 82nd Avenue in Portland, Oregon. The data collection occurred over two, two-week periods in July and August, 27 during which there were no significant events or holidays. This chapter will focus on the processes and methodology used for collecting data for this project. It is divided into sections covering the Study Corridor, Field Data Collection, Field Data Processing and Quality Control. The Field Data Collection section is divided into information on the Automatic Vehicle Locator system and the Conditional Priority System. 3.1 Study Corridor The study corridor of NE/SE 82 nd Avenue, also designated as State Highway 213, was chosen due to the high bus ridership and its function as a major north/south arterial. Bus route 72 has the highest bus ridership in TriMet s system [13] and 82 nd Avenue has an AADT of approximately 29, in 27. [14] Therefore, this corridor provides a characteristic representation of TriMet s bus routes within the City of Portland. As demonstrated in Figure 3.1, the 2 mile corridor length includes 16 northbound and 16 southbound bus stops and 9 signalized intersections. The corridor is bound to the north by NE Hassolo Street, just south of a transfer station with TriMet s Blue and Red MAX light rail lines, and to the south by SE Woodward Street. 19
31

32 3.1.1 Corridor Conditions This corridor is a major arterial serving several developing neighborhoods and business districts. The roadway section is 6 feet wide curb to curb consisting of two travel lanes in each direction and a continuous center turn lane. Narrow sidewalks exist on both sides that are typically six feet wide and impeded with signs and utility poles. The speed limit is posted at 35 miles-per-hour. Generally, the development patterns along this corridor are auto-centric with large set-backs and non-shared driveways. Figure 3.2 NE 82 nd Avenue in Portland, Oregon [photo: Jonathan Maus, BikePortland.org] This route has a large pedestrian population due to many senior housing facilities and a large lower income population, contributing to a very high public transit use. The corridor is also a location for many destinations as well as transfer points to all east-west bus lines running downtown. [13] 21
33 3.2 Field Data Collection The field data was recorded during two, two-week time periods, one with the TSP on and the other with the TSP turned off. These periods were July 22 August 4, 27 and August 12 August 25, 27, for the TSP on and off, respectively. The data collection periods each began on a Saturday and ended on a Sunday and had no scheduled significant events or holidays. Real time data of the buses as they moved through the corridor was collected through Global Positioning System (GPS) enabled busses that monitored the vehicle location and transmitted this information wirelessly to the transit control center Automatic Vehicle Location System TriMet implements TSP through the transit system s automatic vehicle location (AVL) system. This AVL system, installed on all buses in the fleet, monitors and controls bus operations through on-board GPS receivers and is connected to a Bus Dispatch System (BDS). The BDS is connected to an on-board computer containing the bus s route and schedule information allowing to bus to determine schedule status on a real-time basis. With this system, the buses send time-stamped vehicle location coordinates in real time to the transit control center. This data is archived and also enhances the transit quality of service by providing riders accurate information about bus arrival times at stops. Travel time and average travel speed between stops as well as the vehicle s schedule status (whether it is late, on time, or early) according to that vehicle s schedule can also be calculated from the timestamped location information from the buses. Data on dwell time, which doors opened, and the number of passengers entering and exiting the buses are also collected and transmitted with the location information. [4] 22
34 3.2.2 Conditional Priority System The AVL system permits smart buses that are able to selectively request signal priority. TriMet has implemented TSP using conditional priority that is dependent on the status of the bus with respect to its schedule and if certain other criteria are met. These criteria include the following and are summarized in Figure 3.3: The bus is within the City of Portland. Signals outside of the City boundary are not connected to the system. The bus is in route and in service. The bus is ready to proceed along the route. This is determined by whether the doors are open or closed. The bus is 3 seconds or more behind schedule. 23
35 Is the bus in service within the City of Portland? No Yes Is the bus on its proper route? No Yes Are the bus doors closed? No Yes Is the emitter already on? Yes No Is the bus ahead of schedule? (i.e. on time) Is the bus more than 3 seconds behind schedule? Yes No Yes No Activate the Emitter Emitter off Figure 3.3 Decision Framework for Emitter Activation [4] 24
36 If these conditions are all satisfied, the bus will activate the Opticon infrared emitter to request priority. The City of Portland uses Wapiti Microsystems Software as their traffic signal software which provides a range of priority options. Priority can include red truncation, green extension, or a combination of the two. Figure 3.4 shows the priority strategy decision framework as implemented by the controller software. Is a call received by the traffic signal? Green status of signal for the bus? Yes No Green Extension* Red Truncation * Green extension may include combination of red truncation for the next cycle Figure 3.4 Decision Framework for TSP Strategy to Employ [4] The particular priority strategy is determined by when in the signal cycle the priority request is received. Priority is implemented while keeping the corridor in coordination by adjusting forceoffs and modifying coordination timing plans. [4] Figure 3.5 presents a graphical representation of the general signal priority concept. 25
![Figure 3.5 General Signal Priorty Concept [15] 3.3 Field Data Processing and Quality Control 3.3.1 Data Processing The raw data was received as two separate data sets, one for TSP on period and one for the TSP off period.](/docs-images/84/89301886/images/37-0.jpg "Each data set has over 43, separate entries associated with a specific segment and time.")
37 Figure 3.5 General Signal Priorty Concept [15] 3.3 Field Data Processing and Quality Control Data Processing The raw data was received as two separate data sets, one for TSP on period and one for the TSP off period. Each data set has over 43, separate entries associated with a specific segment and time. These entries contain 45 attributes including time, date, direction, location, schedule, passenger load, dwell time, door openings, peak periods, trip number, and 26
38 speed information. This information was brought into Microsoft Access and Excel 23 for analysis. Queries in Access grouped information for specific time periods by both the northbound and southbound directions. These time periods include the AM peak, PM peak, non-peak, and full day for weekdays, weekends, and the entire study period. Using this query feature in Access, the grouped data was further analyzed for corridor travel time and schedule adherence. The query results were then exported into Excel for statistical analysis Quality Control Quality Control of the data performed on the data sets for the total time periods by direction and TSP status. Travel time data was sorted in Excel by average vehicle speed and each value was associated with a percentile and Z-value of the data set. The speeds were then examined and any average travel speed greater than 4 mph was removed. Where the TSP was turned off, these values all had a Z-value greater than 3. and accordingly, all the data points greater than 3. for the slow travel speeds were also removed. The data for the TSP on scenarios had no Z-values greater than 3., but the high travel speeds accounted for approximately.5% of the data set. Therefore, approximately.5% was taken out of the slow travel speeds as well. These outliers are attributed to GPS malfunction and as Table 3.1 shows, the amount of outliers removed accounted for no more than 1.1% of any data set. The columns labeled border values are the nearest outlier values to the kept data points and the max value is the highest or lowest outlier value. Table 3.2 shows the change in standard deviation with little change in the mean. 27
39 Table 3.1 Travel Time Outlier Determination Border Value Max Value Direction TSP Speed (mph) Z-Value Percentile Speed (mph) NB OFF % % 3.7 Total Percentile.7% SB OFF % % 3.5 Total Percentile 1.1% NB ON % % 1.2 Total Percentile.9% SB ON % % 1.1 Total Percentile 1.% Table 3.2 Statistical Comparison of Travel Time Data Set With and Without Outliers Direction TSP Std. Dev. NB OFF With Outliers Outliers Removed SB OFF With Outliers Outliers Removed NB ON With Outliers Outliers Removed SB ON With Outliers Outliers Removed These outliers found in the travel time scenarios were associated and removed from the schedule adherence data sets as well. As outlined in Table 3.3, the removal of the outliers had little effect on mean. Table 3.3 Statistical comparison of schedule adherence data set with and without outliers Direction TSP Std. Dev. NB OFF With Outliers Outliers Removed SB OFF With Outliers Outliers Removed NB ON With Outliers Outliers Removed SB ON With Outliers Outliers Removed
40 CHAPTER 4 ANALYSIS AND FINDINGS This chapter discusses the analysis of the collected field data on 82 nd Avenue. As detailed in Chapter 3, the dataset contains over 43, data points for route segments for each the TSP on and TSP off scenarios. First, the data were analyzed to determine whether there is any difference in overall corridor average travel speeds for the with TSP on. Then, this chapter explores the effect of TSP on the schedule adherence. 4.1 Travel Time It is expected that signal priority will yield lower average travel times for buses along a route than conventional signal systems. Average bus travel time through the study corridor in both the northbound and southbound directions is calculated for the total study period as well as by service day and time of day from the AVL data. Two descriptive statistics, the mean and standard deviation, are examined to determine bus performance. The mean of a lower travel time indicates a higher average travel speed. Lower standard deviation is an indication of service reliability as the buses travel, and thus arrive, at a more consistent rate Northbound Travel Times The means and standard deviations for selected time periods are shown and compared between the two TSP scenarios in Table 4.1. Significance in the difference of means was determined through a two-tailed t-test with a 95% confidence interval. 29
41 Table 4.1Travel Time Comparison: Northbound TSP OFF ON SIGNIFICANT? Total Study Period Weekday AM Peak Weekday PM Peak Weekday Non-Peak Weekend (s) NO Std Dev (s) NO Std Dev (s) NO Std Dev (s) NO Std Dev (s) NO Std Dev As presented in Table ##, while the results show a lower travel time with the TSP turned off for each time period, none of these differences were significant. This is an unexpected result, as signal priority is designed to speed the movement of transit vehicles through the corridor. In addition, the TSP appears to have an adverse effect on reliability as the standard deviations are lower with the TSP turned off during the total and peak travel periods. The following Figures highlight the travel time differences with the TSP turned on and off with the full range of observations during the principal time periods. These observations have been organized by travel time to ease in direct comparison. 3
Authors. Courtney Slavin Graduate Research Assistant Civil and Environmental Engineering Portland State University
 An Evaluation of the Impacts of an Adaptive Coordinated Traffic Signal System on Transit Performance: a case study on Powell Boulevard (Portland, Oregon) Authors Courtney Slavin Graduate Research Assistant
KING STREET TRANSIT PILOT
 KING STREET TRANSIT PILOT Update toronto.ca/kingstreetpilot #kingstreetpilot HIGHLIGHTS TRANSIT RIDERSHIP TRANSIT CAPACITY To respond to this growth in ridership, the TTC has increased the capacity of
HOW TO IMPROVE HIGH-FREQUENCY BUS SERVICE RELIABILITY THROUGH SCHEDULING
 HOW TO IMPROVE HIGH-FREQUENCY BUS SERVICE RELIABILITY THROUGH SCHEDULING Ms. Grace Fattouche Abstract This paper outlines a scheduling process for improving high-frequency bus service reliability based
5.1 Traffic and Transportation
 5.1 When it opens in 2009, the Bellevue Nickel Improvement Project will increase the number of vehicles able to travel through the study area, improve travel speeds, and improve safety by reducing the
A. CONCLUSIONS OF THE FGEIS
 Chapter 11: Traffic and Parking A. CONCLUSIONS OF THE FGEIS The FGEIS found that the Approved Plan will generate a substantial volume of vehicular and pedestrian activity, including an estimated 1,300
MEMORANDUM. Lynn Hayes LSA Associates, Inc.
 MEMORANDUM To: Lynn Hayes LSA Associates, Inc. Date: May 5, 217 From: Zawwar Saiyed, P.E., Senior Transportation Engineer Justin Tucker, Transportation Engineer I Linscott, Law & Greenspan, Engineers LLG
rtc transit Before and After Studies for RTC Transit Boulder highway UPWP TASK Before Conditions
 rtc transit Before and After Studies for RTC Transit UPWP TASK 3403-11-14 Before Conditions Report Boulder highway June 2011 Before and After Studies for RTC Transit BOULDER HIGHWAY BEFORE STUDY UPWP Task
Lake Erie Commerce Center Traffic Analysis
 LOCATION: East of NYS Route 5 at Bayview Road Town of Hamburg Erie County, New York PREPARED BY: Wendel Companies 140 John James Audubon Parkway Suite 200 Amherst, New York 14228 January 2012 i ii Table
Interstate 90 and Mercer Island Mobility Study APRIL Commissioned by. Prepared by
 Interstate 90 and Mercer Island Mobility Study APRIL 2017 Commissioned by Prepared by Interstate 90 and Mercer Island Mobility Study Commissioned by: Sound Transit Prepared by: April 2017 Contents Section
Bus Corridor Service Options
 Bus Corridor Service Options Outline Corridor Objectives and Strategies Express Local Limited Stop Overlay on Local Service 1 Deadhead 1 Stacey Schwarcz, "Service Design for Heavy Demand Corridors: Limited-Stop
Corridor Analysis. Corridor Objectives and Strategies Express Local Limited Stop Overlay on Local Service 1 Deadhead
 Corridor Analysis Outline Corridor Objectives and Strategies Express Local Limited Stop Overlay on Local Service 1 Deadhead 1 Stacey Schwarcz, "Service Design for Heavy Demand Corridors: Limited-Stop Bus
PREFACE. Service frequency; Hours of service; Service coverage; Passenger loading; Reliability, and Transit vs. auto travel time.
 PREFACE The Florida Department of Transportation (FDOT) has embarked upon a statewide evaluation of transit system performance. The outcome of this evaluation is a benchmark of transit performance that
APPENDIX H MILESTONE 2 TRAFFIC OPERATIONS ANALYSIS OF THE AT-GRADE CROSSINGS
 Draft Environmental Impact Statement/Environment Impact Report Appendix H Milestone 2 Traffic Operations Analysis of the At-Grade Crossings APPENDIX H MILESTONE 2 TRAFFIC OPERATIONS ANALYSIS OF THE AT-GRADE
TABLE OF CONTENTS. Coral Springs Charter High School and Middle School Job No Page 2
 Job No. 15-019 Page 2 TABLE OF CONTENTS 1.0 INTRODUCTION... 4 2.0 EXISTING CONDITIONS... 5 3.0 TRAFFIC GENERATION... 7 4.0 TRIP DISTRIBUTION... 8 5.0 FUTURE CONDITIONS... 8 6.0 SITE ACCESS...13 7.0 CONCLUSION...13
Table of Contents. List of Tables
 Table of Contents 1. Introduction... 1 2. Service Recommendations... 1 A. Extend Service on Fort Belvoir to New Post Exchange/Commissary Complex... 1 B. Improve Service Frequencies on Sunday from Current
BOSTON REGION METROPOLITAN PLANNING ORGANIZATION
 PLANNING ORGANIZATIO BOSTON REGION MPO NMETROPOLITAN BOSTON REGION METROPOLITAN PLANNING ORGANIZATION Stephanie Pollack, MassDOT Secretary and CEO and MPO Chair Karl H. Quackenbush, Executive Director,
8 CROSS-BOUNDARY AGREEMENT WITH BRAMPTON TRANSIT
 8 CROSS-BOUNDARY AGREEMENT WITH BRAMPTON TRANSIT The Transportation Services Committee recommends the adoption of the recommendations contained in the following report dated May 27, 2010, from the Commissioner
KING STREET TRANSIT PILOT
 KING STREET TRANSIT PILOT Update toronto.ca/kingstreetpilot #kingstreetpilot UPDATE Average streetcar travel times in continued to show similar trends as first observed in November. The most significant
Mercer SCOOT Adaptive Signal Control. Karl Typolt, Transpo Group PSRC RTOC July 6th, 2017
 Mercer SCOOT Adaptive Signal Control Karl Typolt, Transpo Group PSRC RTOC July 6th, 2017 Our mission, vision, and core values Mission: deliver a high-quality transportation system for Seattle Vision: connected
FINAL TERMINAL TRAFFIC MONITORING STUDY
 FINAL TERMINAL 91 216 TRAFFIC MONITORING STUDY Prepared for: Port of Seattle February 15, 217 Prepared by: 12131 113 th Avenue NE, Suite 23 Kirkland, WA 9834-712 Phone: 425-821-3665 www.transpogroup.com
THE EFFECT OF FARE POLICIES ON DWELL TIME: A CASE STUDY FOR THE PITTSBURGH REGION
 Egge, Qian 1 THE EFFECT OF FARE POLICIES ON DWELL TIME: A CASE STUDY FOR THE PITTSBURGH REGION Mark Egge Graduate student researcher School of Information Systems and Management Heinz College Carnegie
Washington St. & Ash Coulee Dr./43 rd Ave Intersection Study
 430 IACC Building Fargo, ND 58105 Tel 701-231-8058 Fax 701-231-1945 www.ugpti.org www.atacenter.org Washington St. & Ash Coulee Dr./43 rd Ave Intersection Study Final Report April 2007 Prepared for: City
Mount Pleasant (42, 43) and Connecticut Avenue (L1, L2) Lines Service Evaluation Study Open House Welcome! wmata.com/bus
 and Connecticut Avenue (L1, L2) Lines Service Evaluation Study Open House Welcome! wmata.com/bus") Mount Pleasant (42, 43) and Connecticut Avenue (L1, L2) Lines Service Evaluation Study Open House Welcome! Study Overview and Timeline Phase 1: Collect and Analyze Data Project Kickoff, September 2017
Mount Pleasant (42, 43) and Connecticut Avenue (L1, L2) Lines Service Evaluation Study Open House Welcome! Study Overview and Timeline Phase 1: Collect and Analyze Data Project Kickoff, September 2017
Construction Staging Adelaide Street West
 REPORT FOR ACTION Construction Staging Adelaide Street West Date: October 6, 2016 To: Toronto and East York Community Council From: Acting Director, Transportation Services, Toronto and East York District
Request to Improve Transit along the Dufferin Street Corridor
 For Action Request to Improve Transit along the Dufferin Street Corridor Date: July 10, 2018 To: TTC Board From: Chief Customer Officer Summary The 29 Dufferin bus route is one of the top five busiest
Statistical Study of the Impact of. Adaptive Traffic Signal Control. Traffic and Transit Performance
 Statistical Study of the Impact of Adaptive Traffic Signal Control on Traffic and Transit Performance Courtney Slavin, Wei Feng, Miguel Figliozzi, and Peter Koonce The Sydney Coordinated Adaptive Traffic
Research Report Agreement T4118, Task 24 HOV Action Plan HOV ACTION PLAN
 Research Report Agreement T4118, Task 24 HOV Action Plan HOV ACTION PLAN by John M. Ishimaru Senior Research Engineer Duane Wright Systems Analyst Programmer Mark E. Hallenbeck Director Jaime Kang Research
Memorandum. Fund Allocation Fund Programming Policy/Legislation Plan/Study Capital Project Oversight/Delivery Budget/Finance Contract/Agreement Other:
 Memorandum Date: March 23, 2018 To: Transportation Authority Board From: Eric Cordoba Deputy Director Capital Projects Subject: 4/10/18 Board Meeting: San Francisco Freeway Corridor Management Study Update
3. Proposed Midwest Regional Rail System
 3. Proposed Midwest Regional Rail System 3.1 Introduction The proposed Midwest Regional Rail System (MWRRS) will operate in nine states, encompass approximately 3,000 route miles and operate on eight corridors.
Word Count: 3,565 Number of Tables: 4 Number of Figures: 6 Number of Photographs: 0. Word Limit: 7,500 Tables/Figures Word Count = 2,250
 Katherine F. Turnbull, Ken Buckeye, Nick Thompson 1 Corresponding Author Katherine F. Turnbull Executive Associate Director Texas Transportation Institute Texas A&M University System 3135 TAMU College
This report recommends two new TTC transit services in southwest Toronto.
 Report for Action New TTC Services - Southwest Toronto Date: March 20, 2018 To: TTC Board From: Chief Customer Officer Summary This report recommends two new TTC transit services in southwest Toronto.
Development of SH119 BRT Route Pattern Alternatives for Tier 2 - Service Level and BRT Route Pattern Alternatives
 Development of SH119 BRT Route Pattern Alternatives for Tier 2 - Service Level and BRT Route Pattern Alternatives June 1, 2018 Development of SH119 BRT Route Pattern Alternatives for Tier 2 - Service Level
TRANSPORTATION ELEMENT
 Transportation TRANSPORTATION ELEMENT Data, Inventory, and Analysis Prepared by Contents 1.0 INTRODUCTION... 1 2.0 EXISTING CONDITIONS... 1 2.1 Roadways... 1 2.1.1 Jurisdiction... 1 2.1.2 Functional Classification...
Appendix B Ultimate Airport Capacity and Delay Simulation Modeling Analysis
 Appendix B ULTIMATE AIRPORT CAPACITY & DELAY SIMULATION MODELING ANALYSIS B TABLE OF CONTENTS EXHIBITS TABLES B.1 Introduction... 1 B.2 Simulation Modeling Assumption and Methodology... 4 B.2.1 Runway
NORTH FRASER PERIMETER ROAD WEST CORRIDOR DEFINITION STUDY
 NORTH FRASER PERIMETER ROAD WEST CORRIDOR DEFINITION STUDY MAY 2011 SW1132SWD NORTH FRASER PERIMETER ROAD WEST CORRIDOR DEFINITION STUDY TABLE OF CONTENTS 1.0 INTRODUCTION... 1 2.0 CURRENT TRAVEL PATTERNS
CHAPTER 5 SIMULATION MODEL TO DETERMINE FREQUENCY OF A SINGLE BUS ROUTE WITH SINGLE AND MULTIPLE HEADWAYS
 91 CHAPTER 5 SIMULATION MODEL TO DETERMINE FREQUENCY OF A SINGLE BUS ROUTE WITH SINGLE AND MULTIPLE HEADWAYS 5.1 INTRODUCTION In chapter 4, from the evaluation of routes and the sensitive analysis, it
Treasure Island Supplemental Information Report Addendum
 1 1 1 1 0 1 0 1 0 1 Treasure Island Supplemental Information Report Addendum Introduction Purpose The purpose of this Supplemental Information Report (SIR) Addendum is to determine if the current land
KING STREET PILOT STUDY PUBLIC MEETING
 KING STREET PILOT STUDY PUBLIC MEETING 2017.02.13 PUBLIC WORK with GEHL STUDIO / NEW YORK SWERHUN ASSOCIATES SAM SCHWARTZ CONSULTING LLC STARTING POINTS 17 1 - TRANSIT FIRST! Transit service is beyond
USING SCOOT MULTI-NODES TO REDUCE PEDESTRIAN DELAY AT DUAL CROSSINGS IN BRISTOL
 USING SCOOT MULTI-NODES TO REDUCE PEDESTRIAN DELAY AT DUAL CROSSINGS IN BRISTOL Jackie Davies, Senior Technical Officer (UTC), Bristol City Council Traffic Signals Synopsis Bristol City Council has received
MEMORANDUM. Open Section Background. I-66 Open Section Study Area. VDOT Northern Virginia District. I-66 Project Team. Date: November 5, 2015
 MEMORANDUM To: VDOT Northern Virginia District From: I-66 Project Team Date: November 5, 2015 Subject: Open Section Background The purpose of this technical memorandum is to provide narrative and technical
DISTRICT EXPRESS LANES ANNUAL REPORT FISCAL YEAR 2017 JULY 1, 2016 JUNE 30, FloridaExpressLanes.com
 DISTRICT EXPRESS LANES ANNUAL REPORT FISCAL YEAR 2017 JULY 1, 2016 JUNE 30, 2017 FloridaExpressLanes.com This page intentionally left blank. TABLE OF CONTENTS List of Figures... ii List of Tables.... ii
SAMTRANS TITLE VI STANDARDS AND POLICIES
 SAMTRANS TITLE VI STANDARDS AND POLICIES Adopted March 13, 2013 Federal Title VI requirements of the Civil Rights Act of 1964 were recently updated by the Federal Transit Administration (FTA) and now require
Project Evaluation Report
 Project Evaluation Report Prepared for: Georgia Regional Transportation Authority Prepared by: TransCore 192 Technology Parkway, Suite 500 Norcross, Georgia 30092-2907 June 30, 2010 TABLE OF CONTENTS EXECUTIVE
Planning. Proposed Development at the Southeast Corner of Lakeshore Road West and Brookfield Road Intersection FINAL.
 Project No. 121-22908 N o v e m b e r 2 0 1 2 Traffic Impact Study Transportation Planning th GENIVAR Inc., 600 Cochrane Drive, 5 Floor, Markham, Ontario L3R 5K3 Telephone: 905.475.7270 Fax: 905.475.5994
DAILY TRIPS (LOOP) Monday-Friday 6:55 AM to 6:20 PM 60/60/ 11 Saturday 7:55 AM to 5:55 PM 60/ 10 Sunday
 Monday-Friday 6:55 AM to 6:20 PM 60/60/ 11 Saturday 7:55 AM to 5:55 PM 60/ 10 Sunday") ROUTE 81 BARRE HOSPITAL HILL ROUTE OVERVIEW Route 81 is a Rural Local route that operates between Downtown Barre and the Berlin Shaw s. The route travels outbound from downtown Barre along Airport Road
ROUTE 81 BARRE HOSPITAL HILL ROUTE OVERVIEW Route 81 is a Rural Local route that operates between Downtown Barre and the Berlin Shaw s. The route travels outbound from downtown Barre along Airport Road
Pedestrian Safety Review Spadina Avenue
 STAFF REPORT ACTION REQUIRED Pedestrian Safety Review Spadina Avenue Date: October 13, 2015 To: Toronto and East York Community Council From: Director, Transportation Services, Toronto and East York District
10.0 Recommendations Methodology Assumptions
 10.0 Recommendations To accommodate the projected growth of the I-526 corridor, this report has summarized potential improvement strategies that were separated into four categories, TDM, Modal, Traffic
2017/2018 Q3 Performance Measures Report. Revised March 22, 2018 Average Daily Boardings Comparison Chart, Page 11 Q3 Boardings figures revised
 2017/2018 Q3 Performance Measures Report Revised March 22, 2018 Average Daily Boardings Comparison Chart, Page 11 Q3 Boardings figures revised Contents Ridership & Revenue... 1 Historical Revenue & Ridership...
U.Md. Zahir, H. Matsui & M. Fujita Department of Civil Engineering Nagoya Institute of Technology,
 Investigate the effects of bus and passenger arrival patterns and service frequency on passenger waiting time and transit performance of Dhaka metropolitan area. U.Md. Zahir, H. Matsui & M. Fujita Department
Transportation Improvement District (TID) Exercise New Castle County Unified Development Code
 Exercise New Castle County Unified Development Code") Transportation Improvement District (TID) Exercise New Castle County Unified Development Code Churchmans Crossing TID How should New Castle County deploy Transportation Improvement Districts (TIDs)? Site
Transportation Improvement District (TID) Exercise New Castle County Unified Development Code Churchmans Crossing TID How should New Castle County deploy Transportation Improvement Districts (TIDs)? Site
Manual vs. Automatic Operation and Operational Restrictions
 Customer Services, Operations, and Safety Committee Board Information Item IV-B March 11, 2010 Manual vs. Automatic Operation and Operational Restrictions Page 81 of 91 Washington Metropolitan Area Transit
According to FAA Advisory Circular 150/5060-5, Airport Capacity and Delay, the elements that affect airfield capacity include:
 4.1 INTRODUCTION The previous chapters have described the existing facilities and provided planning guidelines as well as a forecast of demand for aviation activity at North Perry Airport. The demand/capacity
TransAction Overview. Introduction. Vision. NVTA Jurisdictions
 Introduction Vision NVTA Jurisdictions In the 21 st century, Northern Virginia will develop and sustain a multimodal transportation system that enhances quality of life and supports economic growth. Investments
CONGESTION MONITORING THE NEW ZEALAND EXPERIENCE. By Mike Curran, Manager Strategic Policy, Transit New Zealand
 CONGESTION MONITORING THE NEW ZEALAND EXPERIENCE 26 th Australasian Transport Research Forum Wellington New Zealand 1-3 October 2003 By, Manager Strategic Policy, Transit New Zealand Abstract New Zealand
7272 WISCONSIN AVENUE LOCAL AREA TRANSPORTATION REVIEW
 7272 LOCAL AREA TRANSPORTATION REVIEW AND TRANSPORTATION POLICY AREA REVIEW MONTGOMERY COUNTY, MARYLAND Submitted on behalf of Carr Properties Prepared by: Wells + Associates, Inc. Submission: July 1,
METROBUS SERVICE GUIDELINES
 METROBUS SERVICE GUIDELINES In the late 1990's when stabilization of bus service was accomplished between WMATA and the local jurisdictional bus systems, the need for service planning processes and procedures
ITS. Intermountain Transportation Solutions Traffic Studies Transportation Analysis Signal Design Site Planning. January 9, 2013
 ITS Intermountain Transportation Solutions Traffic Studies Transportation Analysis Signal Design Site Planning Raymond Wright, P.E. City of Spokane Transportation Department 11707 East Sprague Avenue,
Att. A, AI 46, 11/9/17
 Total s San Diego Metropolitan Transit System POLICY 42 PERFORMANCE MONITORING REPORT Page 1 of 6 Date: 11/8/17 OBJECTIVE Develop a Customer-Focused and Competitive System The following measures of productivity
Draft Concept Alternatives Analysis for the Inaugural Airport Program September 2005
 Section 10 Preferred Inaugural Airport Concept 10.0 Introduction The Preferred Inaugural Airport Concept for SSA was developed by adding the preferred support/ancillary facilities selected in Section 9
Southern Oregon Transportation Engineering, LLC
 Southern Oregon Transportation Engineering, LLC 112 Monterey Drive - Medford, Or. 97504 Office 541.608.9923 Cell 541.941.4148 Email: Kwkp1@Q.com August 12, 2013 Mike Faught, Public Works Department City
15. Supplementary Notes Supported by a grant from the Office of the Governor of the State of Texas, Energy Office
 1. Report No. SWUTC/95/465020-1 Technical Report Documentation Page 2. Government Accession No. 3. Recipient s Catalog No. 4. Title and Subtitle Quantifying the Benefits of High-Occupancy Vehicle Facilities
HOV LANE PERFORMANCE MONITORING: 2000 REPORT EXECUTIVE SUMMARY
 Final Report Research Project Agreement No. T1803, Task 4 HOV Monitoring V HOV LANE PERFORMANCE MONITORING: 2000 REPORT EXECUTIVE SUMMARY by Jennifer Nee TRAC Research Engineer John Ishimaru TRAC Senior
Limited bus stop service: An evaluation of an implementation strategy
 Limited bus stop service: An evaluation of an implementation strategy Ahmed M. El-Geneidy (corresponding author) Assistant Professor School of Urban Planning McGill University Suite 400, 815 Sherbrooke
Appendix 4.1 J. May 17, 2010 Memorandum from CTPS to the Inter Agency Coordinating Group
 Appendix 4.1 J May 17, 2010 Memorandum from CTPS to the Inter Agency Coordinating Group CTPS CENTRAL TRANSPORTATION PLANNING STAFF Staff to the Boston Region Metropolitan Planning Organization MEMORANDUM
PORTS TORONTO Billy Bishop Toronto City Airport Summary of 2015 Traffic and Passenger Surveys
 PORTS TORONTO Billy Bishop Toronto City Airport Summary of 2015 Traffic and Passenger Surveys 1 Summary of 2015 BBTCA Traffic and Passenger Surveys Surveys of traffic volumes and pedestrian activity were
Date: 11/6/15. Total Passengers
 Total San Diego Metropolitan Transit System POLICY 42 PERFORMANCE MONITORING REPORT Page 1 of 6 OBJECTIVE Develop a Customer-Focused and Competitive System The following measures of productivity and service
Watts St westbound thru
 Executive Summary At the request of the Hudson Square Business Improvement District, Sam Schwartz Engineering, DPC (Sam Schwartz) has completed a technical analysis of various congestion pricing and/or
Section 106 Update Memo #1 Attachment D. Traffic Diversion & APE Expansion Methodology & Maps
 Section 106 Update Memo #1 Attachment D Traffic Diversion & APE Expansion Methodology & Maps I-65/I-70 North Split Interchange Reconstruction Project (Des. Nos. 1592385 & 1600808) Traffic Diversion and
Analysis of Transit Fare Evasion in the Rose Quarter
 Analysis of Transit Fare Evasion in the Rose Quarter Shimon A. Israel James G. Strathman February 2002 Center for Urban Studies College of Urban and Public Affairs Portland State University Portland, OR
SAN LUIS OBISPO TRANSIT + SAN LUIS OBISPO RTA JOINT SHORT RANGE TRANSIT PLANS: SERVICE STRATEGIES. Presented by: Gordon Shaw, PE, AICP; Principal
 SAN LUIS OBISPO TRANSIT + SAN LUIS OBISPO RTA JOINT SHORT RANGE TRANSIT PLANS: SERVICE STRATEGIES Presented by: Gordon Shaw, PE, AICP; Principal Project Status Review of existing services and setting complete
Limited-stop bus service: An evaluation of an implementation strategy
 Limited-stop bus service: An evaluation of an implementation strategy Ahmed M. El-Geneidy (corresponding author) Assistant Professor School of Urban Planning McGill University Suite 400, 815 Sherbrooke
EXISTING CONDITIONS A. INTRODUCTION. Route 107 Corridor Study Report
 II. EXISTING CONDITIONS A. INTRODUCTION The Route 107 study area extends from the south at Chestnut Street in Lynn approximately 3.7 miles to the north to Boston Street in Salem. The study area has three
London Borough of Barnet Traffic & Development Design Team
 London Borough of Barnet Traffic & Development Design Team AERODROME ROAD PEDESTRIAN FACILITY AND BUS STOP INTRODUCTION FEASIBILITY REPORT Job Number: 60668 Doc Ref: S106/12-13/60668 Author: Manoj Kalair
Arlington County Board Meeting Project Briefing. October 20, 2015
 Arlington County Board Meeting Project Briefing October 20, 2015 Project Map 2 Project Context Only Interstate in the Country limited to HOV only traffic during rush hours Stoplight at the end of I-66
MEMORANDUM. for HOV Monitoring on I-93 North and the Southeast Expressway, Boston Region MPO, November, 2011.
 MEMORANDUM Date: January 12, 2012 To: Congestion Management Process Files From: Seth Asante, Ryan Hicks, and Efi Pagitsas MPO Staff Re: Historical Trends: Travel Times and Vehicle Occupancy Levels for
PURPOSE AND NEED (CONCURRENCE POINT 1) NEW CANADA ROAD PROJECT FROM STATE ROUTE 1 (U.S. HIGHWAY 70) TO U.S. INTERSTATE 40
 NEW CANADA ROAD PROJECT FROM STATE ROUTE 1 (U.S. HIGHWAY 70) TO U.S. INTERSTATE 40") PURPOSE AND NEED (CONCURRENCE POINT 1) NEW CANADA ROAD PROJECT FROM STATE ROUTE 1 (U.S. HIGHWAY 70) TO U.S. INTERSTATE 40 Project Description The primary purpose of this project is to improve the major
PURPOSE AND NEED (CONCURRENCE POINT 1) NEW CANADA ROAD PROJECT FROM STATE ROUTE 1 (U.S. HIGHWAY 70) TO U.S. INTERSTATE 40 Project Description The primary purpose of this project is to improve the major
DRAFT Service Implementation Plan
 2017 Service Implementation Plan October 2016 SECTION NAME 2017 Service Implementation Plan October 2016 2017 SERVICE IMPLEMENTATION PLAN TABLE OF CONTENTS Table of Contents... I List of Tables... III
Measuring Bus Service Reliability: An Example of Bus Rapid Transit in Changzhou
 Measuring Bus Service Reliability: An Example of Bus Rapid Transit in Changzhou Yueying Huo, Southeast University/Inner Mongolia University Jinhua Zhao, Massachusetts Institute of Technology Wenquan Li,
American Airlines Next Top Model
 Page 1 of 12 American Airlines Next Top Model Introduction Airlines employ several distinct strategies for the boarding and deboarding of airplanes in an attempt to minimize the time each plane spends
Memorandum. Roger Millar, Secretary of Transportation. Date: April 5, Interstate 90 Operations and Mercer Island Mobility
 Memorandum To: From: The Honorable Dow Constantine, King County Executive; The Honorable Ed Murray, City of Seattle Mayor; The Honorable Bruce Bassett, City of Mercer Island Mayor; The Honorable John Stokes,
B. Congestion Trends. Congestion Trends
 B. Congestion Trends Congestion Trends There are two types of congestion that impact mobility: recurring and non-recurring congestion. Recurring congestion is related to segments of roadway that are over
APPENDIX B COMMUTER BUS FAREBOX POLICY PEER REVIEW
 APPENDIX B COMMUTER BUS FAREBOX POLICY PEER REVIEW APPENDIX B COMMUTER BUS FAREBOX POLICY PEER REVIEW The following pages are excerpts from a DRAFT-version Fare Analysis report conducted by Nelson\Nygaard
Madison Metro Transit System
 Madison Metro Transit System 1101 East Washington Avenue Madison, Wisconsin, 53703 Administrative Office: 608 266 4904 Fax: 608 267 8778 TO: FROM: SUBJECT: Plan Commission Timothy Sobota, Transit Planner,
ROUTE 103. Morrisville Shopping Shuttle ROUTE OVERVIEW
 ROUTE 103 Morrisville Shopping Shuttle ROUTE OVERVIEW Route 103 is a Shuttle route that operates between Stowe and Morrisville. The route travels primarily along VT Route 100 and provides service to Stowe
Assessment of Travel Trends
 I - 2 0 E A S T T R A N S I T I N I T I A T I V E Assessment of Travel Trends Prepared for: Metropolitan Atlanta Rapid Transit Authority Prepared by: AECOM/JJG Joint Venture Atlanta, GA October 2011 General
DEMOGRAPHICS AND EXISTING SERVICE
 EXECUTIVE SUMMARY The Central Corridor light-rail transit (LRT) project will open in 2014 and operate between downtown Minneapolis and downtown St. Paul, serving the University of Minnesota and University
MARSHALL Subdivision. Township of Springwater, County of Simcoe. Traffic Brief for: Ontario Inc. Type of Document: Final Report
 MARSHALL Subdivision Township of Springwater, County of Simcoe Traffic Brief for: 489469 Ontario Inc. Type of Document: Final Report Project Number: JDE 1521 Date Submitted: October 19 th, 2016 10 / 19
Evaluating Lodging Opportunities
 Evaluating Lodging Opportunities This section explores market opportunities for new lodging accommodations in the downtown area. It will help you understand travel and visitation trends, existing competition,
DOGWOOD AT VILLA AVENUE PROJECT
 TRANSPORTATION IMPACT ANALYSIS DOGWOOD AT VILLA AVENUE PROJECT El Centro, California September 4, 2018 LLG Ref. 3-17-2782 TABLE OF CONTENTS SECTION PAGE Appendices... ii List of Figures... i List of Tables...
ROUTE EBA EAST BUSWAY ALL STOPS ROUTE EBS EAST BUSWAY SHORT
 ROUTE EBA EAST BUSWAY ALL STOPS ROUTE EBS EAST BUSWAY SHORT The EBA East Busway All Stops and EBS East Busway Short routes provide the core Martin Luther King Jr. East Busway services. Route EBA operates
Northeast Stoney Trail In Calgary, Alberta
 aci Acoustical Consultants Inc. 5031 210 Street Edmonton, Alberta, Canada T6M 0A8 Phone: (780) 414-6373, Fax: (780) 414-6376 www.aciacoustical.com Environmental Noise Computer Modelling For Northeast Stoney
CENTRAL OREGON REGIONAL TRANSIT MASTER PLAN
 Central Oregon Regional Transit Master Plan Volume II: Surveys and Market Research CENTRAL OREGON REGIONAL TRANSIT MASTER PLAN Volume IV: Service Plan Appendices A-B July 213 Nelson\Nygaard Consulting
Title VI Service Equity Analysis
 Pierce Transit Title VI Service Equity Analysis Pursuant to FTA Circular 4702.1B NE Tacoma Service May 2016 Pierce Transit Transit Development Dept. PIERCE TRANSIT TITLE VI SERVICE EQUITY ANALYSIS TABLE
The impact of scheduling on service reliability: trip-time determination and holding points in long-headway services
 Public Transp (2012) 4:39 56 DOI 10.1007/s12469-012-0054-4 ORIGINAL PAPER The impact of scheduling on service reliability: trip-time determination and holding points in long-headway services N. van Oort
Potomac River Commuter Ferry Feasibility Study & RPE Results
 1.1 Introduction The Prince William County Department of Transportation conducted a route proving exercise (RPE) and feasibility study of a proposed commuter ferry service on the Potomac River between
November 11, 2009 BY . Planning and Growth Management Department 110 Laurier Avenue West, 4 th Floor Ottawa, Ontario K1P 1J1. Dear Mr.
 November 11, 2009 Planning and Growth Management Department 110 Laurier Avenue West, 4 th Floor Ottawa, Ontario K1P 1J1 BY E-MAIL Attention: Mr. Don Herweyer Dear Mr. Herweyer: Reference: Abbott-Fernbank
McLean Citizens Association Transportation Committee Project Briefing
 McLean Citizens Association Transportation Committee Project Briefing November 10, 2015 Project Map 2 Project Context Only Interstate in the Country limited to HOV only traffic during rush hours Stoplight
Workshop on Advances in Public Transport Control and Operations, Stockholm, June 2017
 ADAPT-IT Analysis and Development of Attractive Public Transport through Information Technology Real-time Holding Control Strategies for Single and Multiple Public Transport Lines G. Laskaris, PhD Candidate,
Appendix H: North Corridor Alternatives Through Western University - July 2017
 Appendix H: North Corridor Alternatives Through Western University - July 2017 1 Overview The North corridor to Masonville Place from Downtown was examined with respect to three possible routings: 1. Utilizing
2015 Independence Day Travel Overview U.S. Intercity Bus Industry
 2015 Independence Day Travel Overview U.S. Intercity Bus Industry Chaddick Institute for Metropolitan Development, DePaul University June 25, 2015 This Intercity Bus Briefing summarizes the Chaddick Institute