Royal Aeronautics Society. Vaughn Cordle, CFA
|
|
|
- Logan Dennis
- 5 years ago
- Views:
Transcription


1 Royal Aeronautics Society Vaughn Cordle, CFA Thursday, 13 May 2010


2 Fear AND Loathing In the Airline Sector- The lost decade 2
3 Incompetent management? Powerful unions that take more than their fair share? Government policies exclusive focus on consumer prices? Excess seat capacity production by the airlines? Internet transparency in pricing? Too many airlines destructive price competition? Best answer at the end of the presentation 3

4 $70 billion in inflation-adj. losses over the last decade, $63 billion in the domestic market Weak and overleveraged balance sheets Large increases in costs are on the way Optimal time to maximize share price Labor issues can be worked out Weakest airlines must merge to survive CO had to merge with UA to prevent the a UA merger with US. 4
5 Available Seat Miles (ASMs) (scheduled for the week of May 10, 2010) Relative (millions) to UA/CO 1 United/Continental 5, % 2 Delta 4,445 87% 3 American 3,243 63% 4 Lufthansa* 3,215 63% 5 United pre-merger 3,018 59% 6 Air France/KLM 2,864 56% 7 British Airways/Iberia 2,688 53% 8 Continental pre-merger 2,097 41% 9 Emirates 2,067 40% 10 Southwest 1,991 39% 11 US Airways 1,713 33% 12 Air China* 1,958 38% 13 Qantas* 1,635 32% 14 China Southern 1,316 26% 15 Cathay Pacific 1,313 26% 16 Singapore Airlines 1,284 25% 17 Ryanair 1,275 25% 18 China Eastern* 1,237 24% 19 Air Canada 1,161 23% 20 Japan Airlines* 1,130 22% 2 American/US Airways 4,956 97% Source: AirlineForecasts & OAG 5
6 6
7 7
8 Since the early 90s HHI fell significantly to a nadir low 3 quarters (1Q07) before the credit bubble popped and one of the worst recessions on record. Easy to see why the losses were so massive for the industry during the down turn. Real average fares in the domestic-only market were 38% lower than in the early 90s, when market concentration was at a peak Anything below.2 is considered perfect competition, above.6 is considered monopoly concentration 8
9 9
10 Regression Statistics Multiple R 0.77 R Square 0.59 Adjusted R 0.58 Standard Er Observation 75 Domesitc Q09 FARE PAX FARE 1 PAX
11 pasng rev price Predicted Actual per enpland elasticity Enplaned Enplaned Stage passenger demand Passengers Passengers Length (millions (millions Pax shr Domestic $ % 1,062 Atlantic $ % 4,335 Pacific $ % 4,942 Latin $ % 1,291 System $ % 1,132 11
12 12
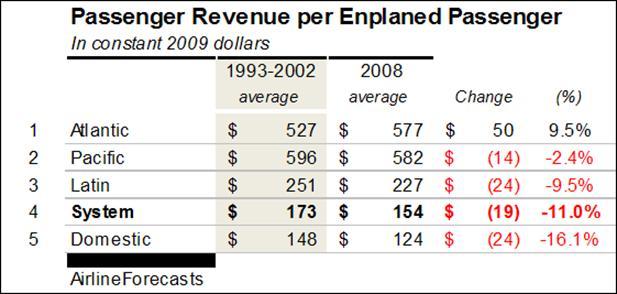
13 Passenger Yields (pax rev / RPMs) In cents and constant 3Q09 dollars Average Average Relative Year-over year % chg. 91-' * 04-'09 Change 03-'09 07-'08 08-'09 07-'09 1 Atlantic % -3% 6% -18% -17% 2 Pacific % 7% 10% -16% -12% 3 Latin % -18% 3% -16% -13% System % -15% 1% -14% -13% 4 Domestic % -17% -1% -13% -12% *2009: Three quarter avg. through 3Q09 Source: DOT Form 41 & AIrlineForecasts 13
14 U.S Passenger Airline Revenue in $millons % chng Total Revenue 145, , % Passenger Revenue 111,002 91, % Misc fees/charges/other 27,069 23, % Baggage Fees 1,146 2, % Freight 3,601 2, % Cancellation Fees 1,654 2, % Charter Pasn'gr + Prop % Mail % Percentage of total revenue Passenger Revenue 76.2% 74.1% Misc fees/charges/other 18.6% 19.0% Baggage Fees 0.8% 2.2% Freight 2.5% 2.0% Cancellation Fees 1.1% 1.9% Charter Pasn'gr + Prop 0.5% 0.5% Mail 0.3% 0.3% AirlineForecasts & DOT Form 41 14
15 Capacity Growth (ASMs) Average Yr-over-yr change Average Relative 91-' * 04-'09 Change 1 Pacific -1.5% -7.6% 12.1% 11.6% 1.0% 0.5% -0.7% -7.0% 3.4% Atlantic 3.4% -5.9% 10.8% 6.4% 7.7% 9.8% 9.9% -3.6% 7.3% Latin 6.5% 0.9% 14.3% 11.0% 6.7% 4.1% 0.7% -1.1% 6.3% -0.2 System 2.0% 0.5% 9.4% 3.2% 0.3% 3.1% -1.5% -6.8% 1.6% Domestic 2.1% 2.3% 8.6% 1.4% -1.4% 2.2% -3.8% -8.0% 0.2% -1.9 *2009: Three quarter avg. through 3Q09 Source: DOT Form 41 & AIrlineForecasts 15
16 Net Income Margins per Passenger Average Average Relative 91-' * 04-'09 Change 1 Atlantic -2.8% -0.3% 0% -21% 27% 11% -19% -6% -1.2% Latin 1.6% 4.3% 2% -12% 15% 10% -5% 2% 1.8% Pacific -3.4% -16.5% -5% -66% 53% 10% -24% -5% -6.1% -2.7 System -1.3% -2.4% -9% -24% 14% 4% -17% -3% -6.0% Domestic -1.3% -2.3% -12% -22% 9% 2% -18% -3% -7.4% -6.1 *Three quarters to 3Q09 AIrlineForecasts 16
17 Capital Sturcture Deficit Tangible Market Book Intangible Tangible Total Book equity Equity Equity assets Equity Assets to Assets 1 Allegiant 1, % 2 Southwest 9,574 5,220 5,537 14,530 38% 3 Jeblue 1,667 1,510 1,534 6,513 24% 4 AirTran ,286 21% 5 Alaska 1, ,016 18% 6 Continental 2, (277) 13,318-2% 7 US Airways 1,100 (447) 616 (1,063) 7,808-14% 8 American 2,311 (3,892) 981 (4,873) 25,525-19% 9 Delta 9, ,794 (9,722) 44,339-22% 10 United 3,265 (2,887) 2,863 (5,750) 19,952-29% Top 10 33,816 1,625 15,028 (12,950) 139,786-9% AMR/US 12,070 (3,820) 10,775 (14,595) 33,333-44% UAL/CAL 6,101 (2,390) 3,637 (6,027) 33,270-18% AirlineForecasts 17
18 Book Equity Deficit Tangible Equity Equity % of total % of total ($ millions) Deficit Deficit Assets Revenue 1 Allegiant (167) (167) -33% -25% 2 Southwest (1,588) (1,588) -11% -13% 3 Jeblue % 3% 4 AirTran % 3% 5 Alaska % 13% 6 Continental 2,833 3,607 27% 25% 7 US Airways 2,399 3,015 39% 25% 8 American 10,273 11,254 44% 50% 9 United 7,875 10,738 54% 55% 10 Delta 11,013 20,807 47% 66% Top 10 Airlines 33,321 48,349 35% 40% United + Continental 10,708 14,345 43% 43% American + US Airways 12,672 14,269 43% 42% AirlineForecasts 18
19 19
20 2010 Revenue & Earnings Estimates Revenue Net Profit Margins ($millions) ($millions) 1 Allegiant $ 681 $ % 2 Alaska 3, % 3 Southwest 11, % 4 Delta 31,571 1, % 5 Hawaii 1, % 6 United 19, % 7 Continental 14, % 8 Airtran 2, % 9 JetBlue 3, % 10 US Airways 11, % 11 American 22, % Major Airlines $ 123,427 $ 3, % 1 Skywest 2, % 2 Pinnacle % 3 Republic 2, % United/Continental 33,584 1, % American/US Airways 34, % AirlineForecasts 20
21 2011 Revenue & Earnings Estimates Revenue Net Profit Margins ($millions) ($millions) 1 Allegiant $ 817 $ % 2 Alaska 3, % 3 Southwest 12, % 4 Delta 33,427 1, % 5 United 20, % 6 Hawaii 1, % 7 JetBlue 4, % 8 Airtran 2, % 9 Continental 15, % 10 US Airways 12, % 11 American $ 23,723 $ % Major Airlines $ 131,030 $ 4, % United/Continental 35,533 1, % American/US Airways 36, % AirlineForecasts 21
22 Enterprise Value and CashFlow CA/UAUA AMR/LCC $ millions DAL CAL + UAUA Combined AMR + LCC Combined JBLU LUV ALK Market Cap 9,900 2,870 3,320 6,190 2,340 1,120 3,460 1,690 9,570 1,590 Total Debt 16,916 6,191 9,304 15,495 10,916 4,606 15,522 3,119 3,475 1,476 MRQ Rent Annualized MRQ Rent Capitalized at 7.0x 3,136 6,412 2,268 8,680 3,612 4,788 8, , Cash (including restricted cash) 5,369 3,153 3,599 6,752 5,006 1,532 6,538 1,072 2,773 1,171 Enterprise Value 24,583 12,320 11,293 23,613 11,862 8,982 20,844 4,605 11,588 2,620 Rent capitalization multiple: 7.0x EBITDA Estimates as of 5/12/10: EV / EBITDAR ,180 1,210 2,422 3,632 1, , , ,886 1,464 2,602 4,065 1,978 1,103 3, , x 5.7x 4.1x 4.8x 5.7x 5.3x 5.5x 6.2x 6.4x 3.7x x 5.0x 3.8x 4.3x 4.7x 4.8x 4.7x 5.5x 5.8x 3.6x AirlineForecasts 22
23 Oberstar will hold hearings and has tasked the GAO to study the merger 14 high concentration city pairs DOJ makes decisions based on concentration of specific markets, not system-wide. DOT provides analysis and input DOT decides international issues and grants ATI for JVs Market Share at Top Hubs (based on Scheduled Seats) Market Continental United Combined Cleveland 64.70% 5.00% 69.80% Houston* 66.10% 1.60% 67.70% Guam 50.30% 0.00% 50.30% Denver 1.70% 42.30% 44.00% San Francisco 3.30% 40.70% 44.00% Chicago* 1.30% 36.10% 37.50% Washington D.C.* 2.60% 25.80% 28.40% New York* 23.10% 3.20% 26.30% Los Angeles 3.60% 17.20% 20.80% Tokyo (Narita) 1.80% 5.10% 6.90% *Includes multiple airports Source: OAG Schedules 23
24 Not all of the cost and revenue synergies will fall to the bottom line. Stated differently, shareholders will only capture perhaps 1/2 of the $ billion we are estimating as the base-case cost/revenue synergies UAL/CAL merger. Even at 1/2, the leverage to the bottom line is significant, which is why market values will increase significantly Timing is very good for a merger in the airline industry. Why? The window to create the most value is open, but it will start closing as labor pressures for higher wages ($3.3 6 billion) and higher airport PFC fees ($2 billion higher) and security costs ($2.7 billion by 2014) kick in. Also, higher fuel costs have become a catalyst, encouraging CEOs/CFOs to move towards protecting and enhancing shareholder value. Fuel costs in 2010 will be around $6.4 billion higher than 2009's $80 base case this year and $84 in
25 A merger will be good for the airlines, labor and shareholders. Moreover, it can benefit the consumer as the industry moves towards a more viable structure that can afford to properly invest and provide the required level of service. In the decade ending in 2009, the U.S. airline industry lost over $70 billion in 2009 dollars. Hence the need for greater concentration i.e., fewer airlines and pricing power, which does not exist in the domestic market. Herfindahl (HHI) concentration analysis : In the domestic-only segment, the value is around.14 and would increase to.18 after UAL merges CAL. Anything under.2 is considered close to "perfect competition" and results in destructive price competition where consumers capture the bulk of the value produced by the industry. However, with the joint ventures and more concentrated alliances, and the merger, pricing power will result, at least for a period of time. 25
26 DOT Airline Advisor Commission objectives: Safety: gotta say this and more money is typically the only way to improve safety. World-class aviation workforce: skill set or in terms of wages/benefits? Balancing competitiveness and viability: without mergers, the networks are not viable and will continue a slow liquidation. Securing funding: charge the airlines or taxpayers, with airlines likely paying for technology that helps the airlines. Addressing environmental challenges and solutions - carbon taxes are coming and airline passengers will have to pay their fair share. 26
27 The simple equation: World class workforce + balance between competitiveness and viability + carbon taxes + funding for ATC and aircraft technology = higher government taxes/fees, security costs, airport charges, ADS-B technology costs, and labor costs for the airlines. These higher costs must be viewed within the context of a $1.4 to $2 trillion budget deficit and Obama's need to reduce government spending in later years. Solution: Allow consolidations and mergers which will allow the industry to pass the increased costs on to consumers of the air transportation system. 27
28 Incompetent management? Powerful unions that take more than their fair share? Government policies exclusive focus on consumer prices? Excess seat capacity production by the airlines Internet transparency in pricing? Too many airlines destructive price competition Best answers in red 28
Management Presentation. May 2013
 Management Presentation May 2013 Forward looking statements This presentation as well as oral statements made by officers or directors of Allegiant Travel Company, its advisors and affiliates (collectively
Management Presentation. November 2011
 Management Presentation November 2011 Forward looking statements This presentation as well as oral statements made by officers or directors of Allegiant Travel Company, its advisors and affiliates (collectively
Airline Industry Overview For the Regional Airline Association. December 8, 2010
 Airline Industry Overview For the Regional Airline Association December 8, 2010 Agenda The Airline Industry at Yearend 2010 Financial Recovery Return to Growth Consolidation Alliances Regional Service
Airline Mergers and Consumers. Before the US DOT Advisory Committee for Aviation Consumer Protection
 Airline and Consumers Before the US DOT Advisory Committee for Aviation Consumer Protection Daniel M. Kasper October 29th, 2014 Presentation Overview 1. Key drivers of airline consolidation a) Relentless
STAYING TRUE. BofAML Global Transportation Conference. May
 STAYING TRUE BofAML Global Transportation Conference May 19 2011 FORWARD-LOOKING STATEMENT Certain information in this presentation and statements made during this presentation, including any question
Management Presentation. August 2012
 Management Presentation August 2012 Forward looking statements This presentation as well as oral statements made by officers or directors of Allegiant Travel Company, its advisors and affiliates (collectively
Management Presentation. September 2011
 Management Presentation September 2011 Forward looking statements This presentation as well as oral statements made by officers or directors of Allegiant Travel Company, its advisors and affiliates (collectively
New Market Structure Realities
 New Market Structure Realities July 2003 Prepared by: Jon F. Ash, Managing Director 1800 K Street, NW Suite 1104 Washington, DC, 20006 www.ga2online.com The airline industry during the past two years has
Management Presentation. May 2012
 Management Presentation May 2012 Forward looking statements This presentation as well as oral statements made by officers or directors of Allegiant Travel Company, its advisors and affiliates (collectively
Introduction: Airline Industry Overview Dr. Peter Belobaba Presented by: Alex Heiter & Ali Hajiyev
 Introduction: Airline Industry Overview Dr. Peter Belobaba Presented by: Alex Heiter & Ali Hajiyev Istanbul Technical University Air Transportation Management M.Sc. Program Network, Fleet and Schedule
Antitrust Review of Mergers and Alliances
 Antitrust Review of Mergers and Alliances Istanbul Technical University Air Transportation Management, M.Sc. Program Aviation Economics and Financial Analysis Module 13 Outline A. Competitive Effects B.
Airline Performance and Capacity Strategies Dr. Peter Belobaba
 Airline Performance and Capacity Strategies Dr. Peter Belobaba Istanbul Technical University Air Transportation Management M.Sc. Program Network, Fleet and Schedule Strategic Planning Module 18 : 13 March
Management Presentation. March 2016
 Management Presentation March 2016 Forward looking statements This presentation as well as oral statements made by officers or directors of Allegiant Travel Company, its advisors and affiliates (collectively
Global Transportation Conference. New York June 18, 2008
 Global Transportation Conference New York June 18, 2008 1 It s Different Up Here Diversified network New revenue model Canada a growth market New efficient fleet New onboard product Well hedged fuel Strong
2017 Marketing and Communications Conference. November 6, 2017
 2017 Marketing and Communications Conference November 6, 2017 1 2 Introduction Carrie Kenrick State of the Industry Industry Consolidation Financial Trends Ancillary Product / Customer Segmentation Fleet
AIR CANADA REPORTS 2010 THIRD QUARTER RESULTS; Operating Income improved $259 million or 381 per cent from previous year s quarter
 AIR CANADA REPORTS 2010 THIRD QUARTER RESULTS; Operating Income improved $259 million or 381 per cent from previous year s quarter MONTRÉAL, November 4, 2010 Air Canada today reported operating income
Management Presentation. September 2015
 Management Presentation September 2015 Forward looking statements This presentation as well as oral statements made by officers or directors of Allegiant Travel Company, its advisors and affiliates (collectively
Management Presentation. November 2013
 Management Presentation November 2013 Forward looking statements This presentation as well as oral statements made by officers or directors of Allegiant Travel Company, its advisors and affiliates (collectively
J.P. Morgan Aviation, Transportation and Industrials Conference
 J.P. Morgan Aviation, Transportation and Industrials Conference March 3, 08 Scott Kirby President Safe Harbor Statement Certain statements included in this presentation are forward-looking and thus reflect
Spirit Overview & 2016 Priorities
 March 2016 Disclaimer Statements in this release and certain oral statements made from time to time by representatives of the Company contain various forward-looking statements within the meaning of Section
Outlook for Air Travel
 University of Massachusetts Amherst ScholarWorks@UMass Amherst Tourism Travel and Research Association: Advancing Tourism Research Globally 2014 Marketing Outlook Forum - Outlook for 2015 Outlook for Air
Bank of America Merrill Lynch Global Transportation Conference. June 16, 2010
 Bank of America Merrill Lynch Global Transportation Conference June 16, 2010 FORWARD-LOOKING STATEMENT Certain information in this presentation and statements made during this presentation, including any
Boeing versus Airbus: Who has the Correct View of Future Aviation Markets?
 Boeing versus Airbus: Who has the Correct View of Future Aviation Markets? David Gillen YVR Professor & Director, Sauder School of Business-UBC Seminar Chartered Institute of Logistics and December 5,
Evaluating the Impact of Airline Mergers on Communities
 June 2008 Evaluating the Impact of Airline Mergers on Communities ACI-NA Marketing and Communications Conference Presented by: Robert A. Hazel www.oliverwyman.com Outline Fuel Crisis Impacts on Air Service
Delta Air Lines Reports June 2009 Quarter Financial Results
 CONTACT: Investor Relations 404-715-2170 Corporate Communications 404-715-2554 Delta Air Lines Reports June 2009 Quarter Financial Results ATLANTA, July 22, 2009 Delta Air Lines (NYSE:DAL) today reported
J.P. Morgan 2019 Global Emerging Markets Corporate Conference. Miami, February 2019
 J.P. Morgan 2019 Global Emerging Markets Corporate Conference Miami, February 2019 This presentation may include forward-looking comments regarding the Company s business outlook and anticipated financial
2010 ANNUAL GENERAL MEETING. May 4, 2010
 2010 ANNUAL GENERAL MEETING May 4, 2010 FORWARD-LOOKING STATEMENT Certain information in this presentation and statements made during this presentation, including any question and answer session, may contain
SHORT BUY. Price:$6.04 Target: $4.20. Price: $5.68 Target: $8.00.
 BUY SHORT Price: $5.68 Target: $8.00 Price:$6.04 Target: $4.20 valuehuntr@gmail.com Overview Highest ranked carrier in performance and quality Best safety record (never had a fatal accident in 80 years
Southwest Airlines (LUV) Analyst: Rebekah Zsiga Fall Recommendation: BUY Target Price until (12/31/2016): $62
 Analyst: Rebekah Zsiga Fall Recommendation: BUY Target Price until (12/31/2016): $62") Recommendation: BUY Target Price until (12/31/2016): $62 1. Reasons for the Recommendation After detailed analysis of Southwest Airlines Company I recommend that we move to buy further shares of stock
Recommendation: BUY Target Price until (12/31/2016): $62 1. Reasons for the Recommendation After detailed analysis of Southwest Airlines Company I recommend that we move to buy further shares of stock
Investor Presentation
 Investor Presentation Safe harbor This presentation contains forward-looking statements within the meaning of Section 27A of the Securities Act of 1933, as amended, and Section 21E of the Securities Exchange
Cowen Securities 6 th Annual Global Transportation Conference June 11, 2013
 Cowen Securities 6 th Annual Global Transportation Conference June 11, 2013 This presentation and the discussion today will include forward-looking statements regarding the performance of Alaska Air Group
Cleveland Hopkins International Airport Preliminary Merger Analysis
 City of Cleveland Frank G. Jackson, Mayor Operational Issues Cleveland Hopkins International Airport Preliminary Merger Analysis As of today, Continental and United have not even admitted that they are
CONTACT: Investor Relations Corporate Communications
 NEWS RELEASE CONTACT: Investor Relations Corporate Communications 435.634.3200 435.634.3553 Investor.relations@skywest.com corporate.communications@skywest.com SkyWest, Inc. Announces Second Quarter 2016
Information meeting. Jean-Cyril Spinetta Chairman and CEO
 Information meeting Jean-Cyril Spinetta Chairman and CEO Forward-looking statements The information herein contains forward-looking statements about Air France-KLM and its business. These forward-looking
United Continental Holdings, Inc (NYSE: UAL) ONE YEAR PRICE RANGE : $ LAST PRICE: $ ANALYST RATING: Sell
 ONE YEAR PRICE RANGE : $ LAST PRICE: $ ANALYST RATING: Sell") United Continental Holdings, Inc (NYSE: UAL) ONE YEAR PRICE RANGE : $61.91 68.76 LAST PRICE: $68.39 ANALYST RATING: Sell VALUATION DATE: August 3, 2017 NEXT EARNINGS DATE: October 17, 2017 Investment Thesis:
United Continental Holdings, Inc (NYSE: UAL) ONE YEAR PRICE RANGE : $61.91 68.76 LAST PRICE: $68.39 ANALYST RATING: Sell VALUATION DATE: August 3, 2017 NEXT EARNINGS DATE: October 17, 2017 Investment Thesis:
MIT ICAT. Price Competition in the Top US Domestic Markets: Revenues and Yield Premium. Nikolas Pyrgiotis Dr P. Belobaba
 Price Competition in the Top US Domestic Markets: Revenues and Yield Premium Nikolas Pyrgiotis Dr P. Belobaba Objectives Perform an analysis of US Domestic markets from years 2000 to 2006 in order to:
AMR CORPORATION REPORTS THIRD QUARTER 2011 RESULTS. Net Loss of $162 Million; Operating Earnings of $39 Million
 CONTACT: Sean Collins Corporate Communications Fort Worth, Texas 817-967-1577 mediarelations@aa.com FOR RELEASE: Wednesday, REPORTS THIRD QUARTER 2011 RESULTS Net Loss of $162 Million; Operating Earnings
Spirit Airlines Maxim Group Growth Conference March 26, 2012
 Spirit Airlines Maxim Group Growth Conference March 26, 2012 Disclaimer This presentation includes forward-looking statements. We have based these forward-looking statements largely on our current expectations
PRESS RELEASE Financial Results. Rising passenger traffic at 12.5m Exceeding 1bn in consolidated revenue
 PRESS RELEASE 2016 Financial Results Rising passenger traffic at 12.5m Exceeding 1bn in consolidated revenue Kifissia, 23 March 2017 AEGEAN reports full year 2016 results with consolidated revenue at 1,020m,
Management Presentation. November 2018
 Management Presentation November 2018 Forward looking statements This presentation as well as oral statements made by officers or directors of Allegiant Travel Company, its advisors and affiliates (collectively
ANA HOLDINGS Financial Results for the Three Months Ended June 30, 2018
 ANA HOLDINGS NEWS ANA HOLDINGS Financial Results for the Three Months Ended June 30, 2018 TOKYO, July 31, 2018 ANA HOLDINGS INC. (hereinafter ANA HD ) today reports its financial results for the three
December 2011 Passenger and Cargo Traffic Statistics Reno-Tahoe International Airport
 December 2011 Passenger and Cargo Traffic Statistics Reno-Tahoe International Airport January 27, 2012 U.S. DOMESTIC INDUSTRY OVERVIEW FOR DECEMBER 2011 All RNO Carriers Systemwide year over year comparison
Air China Limited Interim Results. August Under IFRS
 Air China Limited 21 Interim Results Under IFRS August 21 1 Agenda 21 Interim Results Overview Business Overview Financial Overview Outlook 2 2 2 21 Interim Results 3 21 Interim Results Overview 4 4 4
Management Presentation. June 2011
 Management Presentation June 2011 Forward looking statements This presentation as well as oral statements made by officers or directors of Allegiant Travel Company, its advisors and affiliates (collectively
May 2011 Passenger and Cargo Traffic Statistics Reno-Tahoe International Airport
 May 2011 Passenger and Cargo Traffic Statistics Reno-Tahoe International Airport July 5, 2011 U.S. DOMESTIC INDUSTRY OVERVIEW FOR MAY 2011 All RNO Carriers Systemwide year over year comparison Average
Copa Holdings Reports Net Income of $49.9 million and EPS of $1.18 for the Second Quarter of 2018
 Copa Holdings Reports Net Income of $49.9 million and EPS of $1.18 for the Second Quarter of 2018 Panama City, Panama --- Aug 8, 2018. Copa Holdings, S.A. (NYSE: CPA), today announced financial results
US Airways Group, Inc.
 US Airways Group, Inc. Calyon Securities Airline Conference December 7, 2006 Forward-Looking Statements Certain of the statements contained herein should be considered forward-looking statements within
STAYING TRUE. Scotia Capital Transportation & Aerospace Conference. November 15, 2011
 STAYING TRUE Scotia Capital Transportation & Aerospace Conference November 15, 2011 FORWARD-LOOKING STATEMENT Certain information in this presentation and statements made during this presentation, including
UBS Transport Conference September 15 th Jean-Cyril Spinetta
 UBS Transport Conference September 15 th 2008 Jean-Cyril Spinetta Air France-KLM key operating data Fiscal year 2007-08 The number one airline worldwide in terms of revenues* and number one in Europe in
Copa Holdings Reports Net Income of US$51.9 Million for the Fourth Quarter of 2008 and US$152.2 Million for Full Year 2008
 Copa Holdings Reports Net Income of US$51.9 Million for the Fourth Quarter of 2008 and US$152.2 Million for Full Year 2008 Panama City, Panama --- February 19, 2009. Copa Holdings, S.A. (NYSE: CPA), parent
AIR CANADA REPORTS THIRD QUARTER RESULTS
 AIR CANADA REPORTS THIRD QUARTER RESULTS THIRD QUARTER OVERVIEW Operating income of $112 million compared to operating income of $351 million in the third quarter of 2007. Fuel expense increased 49 per
Statistical Report Calendar Year 2013
 Statistical Report Year 213 Houston Airports P.O. Box 616 Houston, TX 7725-16 Request for User Input The intent of the monthly and annual statistical reports is to provide data that is both relevant and
ANA Fact Book All Nippon Airways Co., Ltd. Contents
 All Nippon Airways Co., Ltd. Contents 2 Domestic Passenger Market 4 International Passenger Market 5 Cargo Market 6 Haneda and Narita Airports 7 Global Alliance Statistics 8 Aircraft Specifications 9 Consolidated
2016 Annual Shareholders Meeting
 2016 Annual Shareholders Meeting Safe harbor This presentation contains forward-looking statements within the meaning of Section 27A of the Securities Act of 1933, as amended, and Section 21E of the Securities
MONTHLY AIRPORT TRAFFIC REPORT September 2016
 MONTHLY AIRPORT TRAFFIC REPORT AIRCRAFT OPERATIONS 2016 2015 Change Domestic Air Carrier 59,030 59,038-0.01% Air Taxi 7,779 7,201 8.03% General Aviation 704 571 23.29% Military 21 12 75.00% Subtotal 67,534
CONTACT: Investor Relations Corporate Communications
 NEWS RELEASE CONTACT: Investor Relations Corporate Communications 435.634.3200 435.634.3553 Investor.relations@skywest.com corporate.communications@skywest.com SkyWest, Inc. Announces Second Quarter 2017
MONTHLY AIRPORT TRAFFIC REPORT April 2017
 MONTHLY AIRPORT TRAFFIC REPORT AIRCRAFT OPERATIONS 2017 2016 Change Domestic Air Carrier 56,570 60,697-6.80% Air Taxi 7,771 7,806-0.45% General Aviation 833 699 19.17% Military 23 14 64.29% Subtotal 65,197
Copa Holdings Reports Net Income of $57.7 million and EPS of $1.36 for the Third Quarter of 2018
 Copa Holdings Reports Net Income of $57.7 million and EPS of $1.36 for the Third Quarter of 2018 November 14, 2018 PANAMA CITY, Nov. 14, 2018 /PRNewswire/ -- Copa Holdings, S.A. (NYSE: CPA), today announced
ACI-NA 19th ANNUAL CONFERENCE EXHIBITION
 ACI-NA 19th ANNUAL CONFERENCE EXHIBITION Air Service Reality Check Ed Faberman Air Carrier Association of America September 28, 2010 GOOD TO BE IN PITTSBURGH!!! 2 Airline Industry Challenges Future of
Southwest Airlines Co.: LUV
 Southwest Airlines Co.: LUV October 5th, 2017 Colin Warner Performance Analyst Emily Rees Special Events Coordinator Kate Linn Private Equity Analyst Jack Thompson Latin American Economist Table of Contents
JOINT STATEMENT OF GLENN F. TILTON, CHAIRMAN, PRESIDENT AND CEO, UAL CORP. AND JEFFERY SMISEK, CHAIRMAN, PRESIDENT AND CEO, CONTINENTAL AIRLINES, INC.
 JOINT STATEMENT OF GLENN F. TILTON, CHAIRMAN, PRESIDENT AND CEO, UAL CORP. AND JEFFERY SMISEK, CHAIRMAN, PRESIDENT AND CEO, CONTINENTAL AIRLINES, INC. BEFORE THE UNITED STATES HOUSE OF REPRESENTATIVES
External factors that influence the airline industry
 Overview: External factors that influence the airline industry By Teresa Cederholm S ep 03, 2014. 07:03 PM Must-know: External factors that influence the airline industry External factors that influence
FORWARD-LOOKING STATEMENT
 CIBC 9th Annual Eastern Institutional Investor Conference September 23, 21 FORWARDLOOKING STATEMENT Certain information in this presentation and statements made during this presentation, including any
MONTHLY AIRPORT TRAFFIC REPORT September 2018
 MONTHLY AIRPORT TRAFFIC REPORT AIRCRAFT OPERATIONS 2018 2017 Change Domestic Air Carrier 58,763 55,902 5.12% Air Taxi 6,537 6,689-2.27% General Aviation 605 658-8.05% Military 14 17-17.65% Subtotal 65,919
AMR CORPORATION REPORTS SECOND QUARTER 2012 RESULTS
 CONTACT: Sean Collins Media Relations Fort Worth, Texas 817-967-1577 mediarelations@aa.com FOR RELEASE: Wednesday, REPORTS SECOND QUARTER 2012 RESULTS $6.5 Billion in Quarterly Revenue, Highest in Company
MONTHLY AIRPORT TRAFFIC REPORT December 2018
 MONTHLY AIRPORT TRAFFIC REPORT AIRCRAFT OPERATIONS 2018 2017 Change Domestic Air Carrier 58,905 55,828 5.51% Air Taxi 6,948 6,810 2.03% General Aviation 499 565-11.68% Military 24 25-4.00% Subtotal 66,376
Passenger: 17.2 Million (+3.9% yoy) OTP: 85.8% SLF: 73.3% Subsidiaries Operating Revenues US$415.2 Million Cargo Carried 219.4K ton (+10.
 OTP: 85.8% SLF: 73.3% Subsidiaries Operating Revenues US$415.2 Million Cargo Carried 219.4K ton (+10.") Value* 14.78 3.36 4.97 Volume** 32.85 9.59 13.43 Last Price 423 342 348 Market Cap.*** 8.74 8.85 9.01 Note: * Average Value in Billion Rupiah ** Average Volume in Million *** Market Capitalization in Trillion
Value* 14.78 3.36 4.97 Volume** 32.85 9.59 13.43 Last Price 423 342 348 Market Cap.*** 8.74 8.85 9.01 Note: * Average Value in Billion Rupiah ** Average Volume in Million *** Market Capitalization in Trillion
Advisory Committee For Aviation Consumer Protection Washington, DC
 The Impact Of Airline Mergers And Consolidation On Consumers And The Aviation Industry Advisory Committee For Aviation Consumer Protection Washington, DC October 29, 2014 Deborah McElroy Executive Vice
PRESS RELEASE. First Half 2017 Financial Results Higher Load Factors and traffic lead to a significant rebound in second quarter profitability
 PRESS RELEASE First Half 2017 Financial Results Higher Load Factors and traffic lead to a significant rebound in second quarter profitability Kifissia, 12 September 2017 AEGEAN announces first half 2017
Oil Prices and the Looming U.S. Aviation Industry Catastrophe:
 Oil Prices and the Looming U.S. Aviation Industry Catastrophe: Published by Business Travel Coalition and AirlineForecasts, LLC June 13, 2008 A Hole Kevin In The Mitchell Transport (BTC) Grid 610.341.1850
The Airline Analyst Financial Ratings Webinar Presentation 18 th January Michael Duff, Managing Director, The Airline Analyst
 Webinar Presentation 18 th January 2013 Michael Duff, Managing Director, The Airline Analyst April 2011 Outline The Airline Analyst TAA Financial Ratings Overview of Results Methodology Review of Some
MONTHLY AIRPORT TRAFFIC REPORT. April 2014
 MONTHLY AIRPORT TRAFFIC REPORT AIRCRAFT OPERATIONS 2014 2013 Change Domestic Air Carrier 55,529 55,119 0.74% Air Taxi 11,149 15,077-26.05% General Aviation 639 723-11.62% Military 13 14-7.14% Subtotal
MONTHLY AIRPORT TRAFFIC REPORT December 2017
 MONTHLY AIRPORT TRAFFIC REPORT AIRCRAFT OPERATIONS 2017 2016 Change Domestic Air Carrier 55,828 57,943-3.65% Air Taxi 6,810 7,642-10.89% General Aviation 565 569-0.70% Military 25 32-21.88% Subtotal 63,228
MONTHLY AIRPORT TRAFFIC REPORT August 2018
 MONTHLY AIRPORT TRAFFIC REPORT AIRCRAFT OPERATIONS 2018 2017 Change Domestic Air Carrier 65,465 63,201 3.58% Air Taxi 7,607 7,533 0.98% General Aviation 594 609-2.46% Military 15 3 400.00% Subtotal 73,681
Aviation Suppliers Association Pioneering the Future of the Supply Chain. June 17, 2014
 Aviation Suppliers Association Pioneering the Future of the Supply Chain June 17, 2014 The Supply Base and Prospects (In Action) Agenda I. Introduction to RJET II. Our industry The Regional Space III.
QANTAS HALF YEAR 2015 FINANCIAL RESULTS 1
 QANTAS HALF YEAR 2015 FINANCIAL RESULTS 1 Key points: Underlying Profit Before Tax: $367 million Statutory Profit After Tax: $206 million Transformation benefits: $374 million Comparable unit cost reduction:
Copa Holdings Reports Earnings of US$30.3 Million and EPS of US$0.70 for 3Q08
 Copa Holdings Reports Earnings of US$30.3 Million and EPS of US$0.70 for 3Q08 Panama City, Panama --- November 13, 2008. Copa Holdings, S.A. (NYSE: CPA), parent company of Copa Airlines and Aero Republica,
MONTHLY AIRPORT TRAFFIC REPORT May 2015
 MONTHLY AIRPORT TRAFFIC REPORT AIRCRAFT OPERATIONS 2015 2014 Change Domestic Air Carrier 60,427 57,339 5.39% Air Taxi 7,825 10,967-28.65% General Aviation 547 635-13.86% Military 135 27 400.00% Subtotal
The wide spread of financial performance
 The wide spread of financial performance WFS Summit 13 th September 2015 Brian Pearce, Chief Economist www.iata.org/economics To represent, lead and serve the airline industry % revenues US$ billion 2015
Copa Holdings Reports Fourth Quarter and Full Year 2007 Results
 Copa Holdings Reports Fourth Quarter and Full Year 2007 Results Panama City, Panama --- February 21, 2008. Copa Holdings, S.A. (NYSE: CPA), parent company of Copa Airlines and Aero Republica, today announced
AIR CANADA REPORTS IMPROVED FOURTH QUARTER 2006 AND FULL YEAR 2006 RESULTS
 AIR CANADA REPORTS IMPROVED FOURTH QUARTER 2006 AND FULL YEAR 2006 RESULTS In accordance with Canadian GAAP Accounting Guideline No. 15 Air Canada is required to consolidate the financial statements of
Cowen 11 th Annual Global Transportation Conference
 Cowen 11 th Annual Global Transportation Conference September 5, 2018 Disclaimer This presentation contains forward-looking statements within the meaning of Section 27A of the Securities Act of 1933, as
Financial Review. Changing the Game
 Financial Review Changing the Game 1 $7,238 +8.1% Revenue (1) $ Millions $7,824 $10,095 30-Sep-05 30-Sep-06 12 Months Ended Sept. 9 months ended 30, 2006 2 8.1% revenue growth achieved with only 3.8% ASM
Antitrust Law and Airline Mergers and Acquisitions
 Antitrust Law and Airline Mergers and Acquisitions Module 22 Istanbul Technical University Air Transportation Management, M.Sc. Program Air Law, Regulation and Compliance Management 12 February 2015 Kate
WEAK FOURTH QUARTER CAPS FULL-YEAR PROFIT AT $1.06 BILLION
 WEAK FOURTH QUARTER CAPS FULL-YEAR PROFIT AT $1.06 BILLION GROUP FINANCIAL PERFORMANCE Financial Year 2008-09 The Group earned a net profit attributable to equity holders of $1,062 million for the financial
Q Finnair s growth continued Pekka Vähähyyppä
 2018 Finnair s growth continued 25.10.2018 Pekka Vähähyyppä 1 We continued to develop our services and network New route to Los Angeles in 2019, two daily flights to Hong Kong New digital service for exploring
Copa Holdings Reports Record Earnings of US$41.8 Million for 4Q06 and US$134.2 Million for Full Year 2006
 Copa Holdings Reports Record Earnings of US$41.8 Million for 4Q06 and US$134.2 Million for Full Year 2006 Panama City, Panama --- March 7, 2007. Copa Holdings, S.A. (NYSE: CPA), parent company of Copa
The US Airline Industry & Herbert Stein s Law
 The US Airline Industry & Herbert Stein s Law William S. Swelbar MIT International Center for Air Transportation 36 th Annual FAA Aviation Forecast Conference February 16, 2011 www.swelblog.com HERBERT
A4A Spring 2016 Air Travel Forecast and Operational and Financial Review of 2015
 A4A Spring 2016 Air Travel Forecast and Operational and Financial Review of 2015 John P. Heimlich, Vice President & Chief Economist A4A Media Briefing March 9, 2016 2000 2001 2002 2003 2004 2005 2006 2007
UAL Corporation Reports Second Quarter 2010 Results. $430 Million 2Q Net Profit Excluding Charges, Largest Since 1999
 News Release Worldwide Press Office: media.relations@united.com UAL Corporation Reports Second Quarter 2010 Results $430 Million 2Q Net Profit Excluding Charges, Largest Since 1999 $273 Million 2Q10 GAAP
MONTHLY AIRPORT TRAFFIC REPORT June 2017
 MONTHLY AIRPORT TRAFFIC REPORT AIRCRAFT OPERATIONS 2017 2016 Change Domestic Air Carrier 61,445 62,662-1.94% Air Taxi 8,267 7,656 7.98% General Aviation 644 685-5.99% Military 8 18-55.56% Subtotal 70,364
THE FUNDAMENTALS OF ROUTE DEVELOPMENT UNDERSTANDING AIRLINES MODULE 3
 THE FUNDAMENTALS OF ROUTE DEVELOPMENT UNDERSTANDING AIRLINES AIRLINE ISSUES Low margins Fuel price uncertainty Vulnerability to economic downturn Unpredictable one-time events High profits of airports
airline economic analysis
 February 2012 airline economic analysis By: Bob Hazel Tom Stalnaker Aaron Taylor Table of Contents Summary 1 Carriers Included and Methodology 3 Cost 4 1. System CASM Increase 4 2. Domestic CASM Increase
MONTHLY AIRPORT TRAFFIC REPORT July 2017
 MONTHLY AIRPORT TRAFFIC REPORT AIRCRAFT OPERATIONS 2017 2016 Change Domestic Air Carrier 63,535 63,680-0.23% Air Taxi 7,291 7,548-3.40% General Aviation 630 717-12.13% Military 15 11 36.36% Subtotal 71,471
Copa Holdings Reports Net Income of $136.5 million and EPS of $3.22 for the First Quarter of 2018
 Copa Holdings Reports Net Income of $136.5 million and EPS of $3.22 for the First Quarter of 2018 May 9, 2018 PANAMA CITY, May 9, 2018 /PRNewswire/ -- Copa Holdings, S.A. (NYSE: CPA), today announced financial
Southwest Airlines Co. (NYSE: LUV) ONE YEAR PRICE RANGE : $ $73.62 LAST PRICE: $ ANALYST RATING: Long. VALUATION DATE: July 13, 2017
 ONE YEAR PRICE RANGE : $ $73.62 LAST PRICE: $ ANALYST RATING: Long. VALUATION DATE: July 13, 2017") Southwest Airlines Co. (NYSE: LUV) ONE YEAR PRICE RANGE : $69.66 - $73.62 LAST PRICE: $62.08 ANALYST RATING: Long VALUATION DATE: July 13, 2017 NEXT EARNINGS DATE: July 27, 2017 Investment Thesis: Dominant
Southwest Airlines Co. (NYSE: LUV) ONE YEAR PRICE RANGE : $69.66 - $73.62 LAST PRICE: $62.08 ANALYST RATING: Long VALUATION DATE: July 13, 2017 NEXT EARNINGS DATE: July 27, 2017 Investment Thesis: Dominant
Adjusted net income of $115 million versus an adjusted net loss of $7 million in the second quarter of 2012, an improvement of $122 million
 Air Canada Reports Record Second Quarter 2013 Results Highest Adjusted Net Income, Operating Income and EBITDAR Results for Second Quarter in Air Canada s History Adjusted net income of $115 million versus
FULL YEAR OPERATING PROFIT RISES TO $259 MILLION 25 CENTS SPECIAL DIVIDEND PROPOSED OUTLOOK REMAINS CHALLENGING
 8 May 2014 Page 1 of 5 No. 02/14 8 May 2014 FULL YEAR OPERATING PROFIT RISES TO $259 MILLION 25 CENTS SPECIAL DIVIDEND PROPOSED OUTLOOK REMAINS CHALLENGING GROUP FINANCIAL PERFORMANCE Financial Year 2013-14
Finnair Group Interim Report 1 January 30 June 2008
 Finnair Group Interim Report 1 January 30 June 2008 1 08/08/2008 Presentation name / Author Airline industry at a historical turning point Fuel price has a stranglehold on the business Average ticket prices
MONTHLY AIRPORT TRAFFIC REPORT February 2014
 MONTHLY AIRPORT TRAFFIC REPORT AIRCRAFT OPERATIONS 2014 2013 Change Domestic Air Carrier 44,741 48,627-7.99% Air Taxi 11,144 13,003-14.30% General Aviation 569 543 4.79% Military 17 15 13.33% Subtotal