STAYING TRUE. Scotia Capital Transportation & Aerospace Conference. November 15, 2011
|
|
|
- Arleen Gray
- 5 years ago
- Views:
Transcription
1 STAYING TRUE Scotia Capital Transportation & Aerospace Conference November 15, 2011
2 FORWARD-LOOKING STATEMENT Certain information in this presentation and statements made during this presentation, including any question and answer session, may contain forward-looking statements, including but not limited to, those regarding projected economic indicators, future expansion plans for WestJet and WestJet Vacations Inc. (WVI), capacity growth, fleet expansion, potential interline and code-share agreements, ASM, RASM, CASM and future revenue and profits, implementation of the new reservation system, the reward program and co-branded credit card, cost-saving initiatives, addition of new destinations, market-share and business travel expansion, hedging activities and ancillary revenue expansion. Certain material factors and assumptions were applied in formulating these forward-looking statements. These forward-looking statements are subject to, and may be affected by, numerous risks and uncertainties which may cause WestJet s actual results to differ materially from a conclusion, forecast or projection expressed in or implied by such statements. Factors that could cause or contribute to these differences include, but are not limited to: changes in government policy, exchange rates, interest rates, disruption of supplies, volatility of fuel prices, terrorism, general economic conditions, the competitive environment and other factors described in WestJet s public reports and filings which are available under WestJet s profile on SEDAR ( Forward-looking statements are subject to change and WestJet does not undertake to update or revise any forward-looking information as a result of any new information, future events or otherwise, except as required by applicable law. November
3 WESTJET S STRATEGY WORKING SINCE DAY ONE WestJet Vacations People and Culture Single fleet type Rewards program Revenue and Growth Costs and Margins Cost efficiency Business traveller Guest Experience and Performance Risk management 3
4 GROWTH AND STRONG FINANCIAL PERFORMANCE CONTINUES
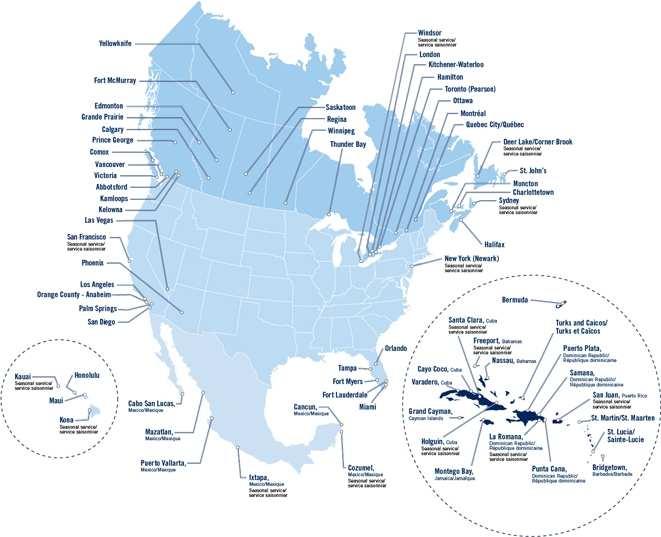
5 GROWING DESTINATIONS WestJet Destinations Served* 80 Domestic Transborder Mexico Caribbean *Destinations Served at Year-End 5
6 6
7 WESTJET A GROWTH STORY Revenue (millions of dollars) Available Seat Miles (millions) 3,500 25,000 3,000 20,000 2,500 2,000 15,000 1,500 10,000 1, ,000 0 '01 '02 '03 '04 '05 '06 '07 '08 '09 '10 '11* 0 '01 '02 '03 '04 '05 '06 '07 '08 '09 '10 * 2011 analyst consensus based on reports as of November 10,
8 TRACK RECORD OF PROFITABILITY SINCE INCEPTION Net Earnings (millions of dollars) '96 '97 '98 '99 '00 '01 '02 '03 '04 '05 '06 '07 '08 '09 '10 8 Note: figures reported in Canadian GAAP with restatements
9 OUR GROWTH CONTINUES % 70% 60% 50% 40% 30% 20% 10% 0% Q Q Q Q Q Q Q Q Miles (billions) Q Load Factor % ASMs RPMs Load Factor %
10 PRICING POWER 100% 20 Load Factor % 90% 80% 70% 60% Yield (cents) 50% 10 Q Q Q Q Q Q Q Q Q Q Q Q Q Load Factor % Yield (cents) 10 Yield for 2008 & 2009 based on CGAAP, while 2010 & 2011 based on IFRS. Difference between CGAAP and IFRS not expected to be material as difference in 2010 is only cents.
11 MEASURED GROWTH WITH FLEXIBLE FLEET PLAN Cumulative Lease Extension Options 11
12 COST EFFICIENCY REMOVING COSTS WHERE POSSIBLE 85.00% 80.00% 75.00% 70.00% 65.00% 60.00% S outhwe st W e stjet* US Airway s A m erica n J etb lue A ir Cana da* A lask a De lta Un ited Cost efficiencies have led to low break-even load factor Cost efficiencies are driven by: - High utilization of aircraft - High employee productivity - Single-fleet efficiencies - Self service - Ownership culture - Disciplined focus on expenditures 2010 Load Factor 2010 Break-even Load Factor 12 * WJ & AC restated to IFRS. Under CGAAP WJ 72.3% and AC 78.6% Source: Internal estimates, company reports
13 COSTS REMAIN UNDER CONTROL 16 cents per ASM * YTD Q3 2011* CASM (ex fuel) Fuel Op. Margin *IFRS basis Excludes reservation system impairment of $31.9 million in 2007
14 OPERATING HIGHLIGHTS 9 MONTHS ENDED SEPT 30 Year-todate 2011 Year-todate 2010* Change Net earnings (millions) $113.1 $ % Diluted earnings per share $0.80 $ % Total revenues (millions) $2,290.0 $1, % RASM (revenue per available seat mile) (cents) CASM (cost per available seat mile) (cents) % % Fuel costs per litre (dollars) $0.88 $ % CASM, excluding fuel and employee profit share (cents) (0.1%) Operating Cash Flow (millions) $447.5 $ % *Financial information has been restated in accordance with IFRS. 14
15 YTD Q ADJUSTED EBT MARGIN WESTJET RANKS 3rd BEHIND LEADING NORTH AMERICAN PEERS 15% 10% 7.1 % Adjusted EBT Margin 5% 0% -5% -10% Alaska Allegiant WestJet United Southwest JetBlue Delta US Airways Air Canada American 15 YTD Q adjusted EBT Margin per reported results (adjusted for special items and non-op mark-to-market hedge gains/losses)
16 16 YTD Q RASM YOY CHANGE WESTJET ACHIEVING STRONG RASM GROWTH 20% 15% 10% 9.5% 5% 0% RASM change YoY Allegiant JetBlue WestJet United Delta US Airways American Southwest Alaska Air Canada
17 BUILDING ON OUR CAPABILITIES

18 WESTJET VACATIONS LEVERAGING OUR STRENGTHS IN A NEW MARKETPLACE One of the fastest growing vacation operators in Canada Large market opportunity available to capture Integrated approach with WestJet taps multiple demand streams Competitive advantage with flexible product combinations and scheduled service to all destinations allowing more booking options 18


19 AIRLINE PARTNERSHIPS Strategically selecting carriers in each major world region Seamless access to more destinations International travel options for the business traveller Innovative approach to code-share Selective approach keeps costs in line

20 REWARDS PROGRAM CREATING FURTHER LOYALTY Frequent Guest Program Appeals to high frequency traveller and also mass market: Simple and transparent Aims to capture additional highyielding guests Start earning WestJet dollars with first flight flown or vacation package taken Credit card Appeals to the mass market: Simple and transparent Fully accretive to WestJet Strong partnership with RBC for awareness Two types of cards; different earning power 20
21 ENHANCED EASTERN TRIANGLE SCHEDULE IMPROVED VALUE FOR BUSINESS TRAVELERS Expanded schedule Toronto to Montreal Montreal to Toronto Toronto to Ottawa Ottawa to Toronto Summer 2011 Summer 2011 Depart Arrive Depart Arrive Summer 2011 Summer 2011 Depart Arrive Depart Arrive


22 WE HAVE THE FINANCIAL STRENGTH TO PUT OUR STRATEGY INTO ACTION
23 CAPITAL STRUCTURE At September 30, 2011: - Cash of C$1,320 million - Cash to TTM of revenues ratio of 44% - Working Capital ratio of 1.49x - Adjusted debt to equity ratio of 1.56x - Adjusted net debt to EBITDAR of 1.31x $ millions times Initiated a quarterly dividend ($0.05 per share) * Q3 2011* Normal Course Issuer Bid - Purchase on open market and cancel - TSX approved 7,264,820 share bid or ~ 5% - Completed on August 9, 2011 for total price of $106 million or $14.57 per share Cash Adj. net Debt/EBITDAR Adj. Debt/Equity *2010 and 2011 presented under IFRS. Note: All figures are full-year figures based on trailing twelve months. Debt ratios include aircraft operating leases. 23
24 RELATIVE LIQUIDITY & LEVERAGE RATIOS - SEPTEMBER 30, % 44% 40% Liquidity Cash / LTM Revenue 30% 20% 10% 0% WestJet Allegiant Alaska JetBlue Southwest United American Air Canada US Airways Delta 8 Leverage Adj. Net Debt / EBITDAR Allegiant Alaska WestJet Southwest United Air Canada Delta JetBlue US Airways American
25 25 WJA TRADING IN LINE WITH THE S&P/TSX 20% 10% 0% -10% -20% -30% -40% WJA S&P XAL 4-Jan-11 4-Feb-11 4-Mar-11 4-Apr-11 4-May-11 4-Jun-11 4-Jul-11 4-Aug-11 4-Sep-11 4-Oct-11 4-Nov-11 WJA S&P/TSX XAL
26 GUIDANCE Q4/11 FY 2011 FY 2012 RASM Comparable growth to Q3/11 Maintenance CASM Up 3-5% CASM (ex fuel & profit share) Fuel cost per litre $ $0.93 (based on $124USD jet/barrel and 1.02 FX) Up ~ 1% Flat to up 1% Tax Rate 29% - 30% 28% - 30% Capital Expenditures $95 -$105M $165-$175M System capacity Up 5-6% Up ~ 8% Up 4-5% Domestic capacity Up 2-3% Up ~2% Up 0.5 1% 26

27 WHY INVEST IN WESTJET Earnings margins are consistently among the top tier in the industry Proven track record of profitable growth Well-positioned, low-cost and efficient carrier Award winning culture and highly engaged workforce Strong brand in the market place and expanding airline partnerships Attractive combination of planned growth and a strong balance sheet 27
 539-7594 E: hharley@westjet.com W: www.")
28 For further information: Hugh Harley Director, Investor Relations P: (403) E: W:
STAYING TRUE. BofAML Global Transportation Conference. May
 STAYING TRUE BofAML Global Transportation Conference May 19 2011 FORWARD-LOOKING STATEMENT Certain information in this presentation and statements made during this presentation, including any question
Bank of America Merrill Lynch Global Transportation Conference. June 16, 2010
 Bank of America Merrill Lynch Global Transportation Conference June 16, 2010 FORWARD-LOOKING STATEMENT Certain information in this presentation and statements made during this presentation, including any
2010 ANNUAL GENERAL MEETING. May 4, 2010
 2010 ANNUAL GENERAL MEETING May 4, 2010 FORWARD-LOOKING STATEMENT Certain information in this presentation and statements made during this presentation, including any question and answer session, may contain
Corporate presentation CIBC Whistler Institutional Investor Conference January 21, 2010
 Corporate presentation CIBC Whistler Institutional Investor Conference January 21, 2010 Forwardlooking statement Certain information in this presentation and statements made during this presentation, including
FORWARD-LOOKING STATEMENT
 CIBC 9th Annual Eastern Institutional Investor Conference September 23, 21 FORWARDLOOKING STATEMENT Certain information in this presentation and statements made during this presentation, including any
Corporate Presentation National Bank Transportation and Logistics Conference March 24, 2010
 Corporate Presentation National Bank Transportation and Logistics Conference March 24, 2010 Forwardlooking statement Certain information in this presentation and statements made during this presentation,
EXPANDING OUR REACH. BAML Global Transportation Conference. May 18, 2012
 EXPANDING OUR REACH BAML - 2012 Global Transportation Conference May 18, 2012 FORWARD-LOOKING STATEMENT Certain information in this presentation and statements made during this presentation, including
EXPANDING OUR REACH DAHLMAN ROSE & CO, GLOBAL TRANSPORTATION CONFERENCE
 EXPANDING OUR REACH DAHLMAN ROSE & CO, GLOBAL TRANSPORTATION CONFERENCE September 5, 2012 FORWARD-LOOKING STATEMENT Certain information in this presentation and statements made during this presentation,
BUILDING MOMENTUM. J.P. Morgan Aviation, Transportation & Defense Conference. March 4, 2013
 BUILDING MOMENTUM J.P. Morgan Aviation, Transportation & Defense Conference March 4, 2013 FORWARD-LOOKING STATEMENT Certain information in this presentation and statements made during this presentation,
CAUTION REGARDING FORWARD-LOOKING INFORMATION
 May 16, 2013 CAUTION REGARDING FORWARD-LOOKING INFORMATION Certain statements set forth in this presentation and statements made during this presentation, including, without limitation, information respecting
Management Presentation. November 2018
 Management Presentation November 2018 Forward looking statements This presentation as well as oral statements made by officers or directors of Allegiant Travel Company, its advisors and affiliates (collectively
Management Presentation. March 2016
 Management Presentation March 2016 Forward looking statements This presentation as well as oral statements made by officers or directors of Allegiant Travel Company, its advisors and affiliates (collectively
Management Presentation. November 2011
 Management Presentation November 2011 Forward looking statements This presentation as well as oral statements made by officers or directors of Allegiant Travel Company, its advisors and affiliates (collectively
Management Presentation. September 2015
 Management Presentation September 2015 Forward looking statements This presentation as well as oral statements made by officers or directors of Allegiant Travel Company, its advisors and affiliates (collectively
Scotiabank Transportation & Aerospace Conference. November 19, 2013
 Scotiabank Transportation & Aerospace Conference November 19, 2013 CAUTION REGARDING FORWARD-LOOKING INFORMATION Certain statements set forth in this presentation and statements made during this presentation,
Management Presentation. September 2011
 Management Presentation September 2011 Forward looking statements This presentation as well as oral statements made by officers or directors of Allegiant Travel Company, its advisors and affiliates (collectively
Scotia Capital Transportation & Aerospace Conference. June 5, 2007
 Scotia Capital Transportation & Aerospace Conference June 5, 2007 1 2 Changing the Game Changing the Game Canada s #1 domestic, trans-border and international airline Strong brand recognition Innovative
AIR CANADA REPORTS 2010 THIRD QUARTER RESULTS; Operating Income improved $259 million or 381 per cent from previous year s quarter
 AIR CANADA REPORTS 2010 THIRD QUARTER RESULTS; Operating Income improved $259 million or 381 per cent from previous year s quarter MONTRÉAL, November 4, 2010 Air Canada today reported operating income
Montie Brewer, President and CEO Joshua Koshy, Executive VP and CFO UBS Transport Conference
 Montie Brewer, President and CEO Joshua Koshy, Executive VP and CFO UBS Transport Conference 1 London, England September 17, 2007 Agenda Strongly positioned international airline Investment proposition
Joshua Koshy, Executive Vice President & CFO. Changing the Game
 Joshua Koshy, Executive Vice President & CFO Changing the Game Changing the Game Canada s #1 domestic, trans-border and international airline Strong brand recognition Innovative revenue model driving customer
AIR CANADA REPORTS FULL YEAR AND FOURTH QUARTER 2010 RESULTS
 AIR CANADA REPORTS FULL YEAR AND FOURTH QUARTER 2010 RESULTS Record annual EBITDAR of $1.386 billion, 104 per cent improvement Operating income improvement of $677 million Employees to receive special
Management Presentation. May 2013
 Management Presentation May 2013 Forward looking statements This presentation as well as oral statements made by officers or directors of Allegiant Travel Company, its advisors and affiliates (collectively
WestJet announces 18th consecutive quarter of profitability Airline reports third quarter net earnings of $31.4 million
 FOR IMMEDIATE RELEASE WestJet announces 18th consecutive quarter of profitability Airline reports third quarter net earnings of $31.4 million CALGARY, ALBERTA. November 4, 2009. WestJet (TSX:WJA) today
Financial Review. Changing the Game
 Financial Review Changing the Game 1 $7,238 +8.1% Revenue (1) $ Millions $7,824 $10,095 30-Sep-05 30-Sep-06 12 Months Ended Sept. 9 months ended 30, 2006 2 8.1% revenue growth achieved with only 3.8% ASM
Transportation and Logistics Conference. Toronto March 18, 2008
 Transportation and Logistics Conference Toronto March 18, 2008 1 Our Investment Proposition Innovative revenue strategy that produces results Major cost reductions Strong financial performance Aggressive
Jumpstart 2017 Lukas Johnson SVP, Commercial. June 2017
 Jumpstart 2017 Lukas Johnson SVP, Commercial June 2017 Forward looking statements This presentation as well as oral statements made by officers or directors of Allegiant Travel Company, its advisors and
Management Presentation. August 2012
 Management Presentation August 2012 Forward looking statements This presentation as well as oral statements made by officers or directors of Allegiant Travel Company, its advisors and affiliates (collectively
Management Presentation. November 2013
 Management Presentation November 2013 Forward looking statements This presentation as well as oral statements made by officers or directors of Allegiant Travel Company, its advisors and affiliates (collectively
Copa Holdings Reports Net Income of $49.9 million and EPS of $1.18 for the Second Quarter of 2018
 Copa Holdings Reports Net Income of $49.9 million and EPS of $1.18 for the Second Quarter of 2018 Panama City, Panama --- Aug 8, 2018. Copa Holdings, S.A. (NYSE: CPA), today announced financial results
J.P. Morgan Global High Yield & Leveraged Finance Conference Miami, FL
 J.P. Morgan Global High Yield & Leveraged Finance Conference Miami, FL February 28, 2011 Caution Regarding Forward-looking Information Air Canada s public communications may include forward-looking statements
Adjusted net income of $115 million versus an adjusted net loss of $7 million in the second quarter of 2012, an improvement of $122 million
 Air Canada Reports Record Second Quarter 2013 Results Highest Adjusted Net Income, Operating Income and EBITDAR Results for Second Quarter in Air Canada s History Adjusted net income of $115 million versus
AIR CANADA REPORTS THIRD QUARTER RESULTS
 AIR CANADA REPORTS THIRD QUARTER RESULTS THIRD QUARTER OVERVIEW Operating income of $112 million compared to operating income of $351 million in the third quarter of 2007. Fuel expense increased 49 per
Air Canada. Transportation & Aerospace Conference presents at the. Toronto November 20, 2012
 Air Canada presents at the Transportation & Aerospace Conference 2012 Toronto November 20, 2012 1 2 Caution Regarding Forward-looking Information Air Canada s public communications may include forward-looking
Transportation & Aerospace Conference
 Presents at Transportation & Aerospace Conference Toronto November 15, 2011 2 Caution Regarding Forward-looking Information Air Canada s public communications may include forward-looking statements within
2007/08 Full Year Results Investor Briefing
 2007/08 Full Year Results Investor Briefing Highlights of Result Profit before tax up 46% to $1,408 million Up 36% on the reported result Margin improvement $3 billion of Sustainable Future Benefits achieved
OPERATING AND FINANCIAL HIGHLIGHTS. Subsequent Events
 Copa Holdings Reports Net Income of $103.8 million and EPS of $2.45 for the Third Quarter of 2017 Excluding special items, adjusted net income came in at $100.8 million, or EPS of $2.38 per share Panama
AIR CANADA REPORTS 2010 FIRST QUARTER RESULTS Operating loss narrows; revenue and traffic growth reflect strengthening economy
 AIR CANADA REPORTS 2010 FIRST QUARTER RESULTS Operating loss narrows; revenue and traffic growth reflect strengthening economy MONTRÉAL, May 6, 2010 Air Canada today reported a reduced operating loss of
Air Canada reported an operating income of $63 million in the second quarter of 2012, a decline of $10 million from the second quarter of 2011.
 Air Canada Reports Second Quarter 2012 Results Second Quarter 2012 EBITDAR of $314 million Cash and short-term investments of $2.383 billion at June 30, 2012 MONTRÉAL, August 8, 2012 Air Canada recorded
Presents at the. September 21, 2011
 Presents at the September 21, 2011 Caution Regarding Forward-looking Information Air Canada s public communications may include forward-looking statements within the meaning of applicable securities laws.
Copa Holdings Reports Net Income of $136.5 million and EPS of $3.22 for the First Quarter of 2018
 Copa Holdings Reports Net Income of $136.5 million and EPS of $3.22 for the First Quarter of 2018 May 9, 2018 PANAMA CITY, May 9, 2018 /PRNewswire/ -- Copa Holdings, S.A. (NYSE: CPA), today announced financial
OPERATING AND FINANCIAL HIGHLIGHTS
 Copa Holdings Reports Financial Results for the Fourth Quarter of 2018 Excluding special items, adjusted net profit came in at $44.0 million, or Adjusted EPS of $1.04 Panama City, Panama --- February 13,
AIR CANADA REPORTS FIRST QUARTER RESULTS
 AIR CANADA REPORTS FIRST QUARTER RESULTS As a result of the deconsolidation of Jazz effective May 24, 2007, Air Canada s consolidated results for the first quarter of 2008 are not directly comparable to
Management Presentation. May 2012
 Management Presentation May 2012 Forward looking statements This presentation as well as oral statements made by officers or directors of Allegiant Travel Company, its advisors and affiliates (collectively
INVESTOR PRESENTATION. Imperial Capital Global Opportunities Conference September 2015
 INVESTOR PRESENTATION Imperial Capital Global Opportunities Conference September 2015 Forward-looking Statements This presentation contains forward-looking statements within the meaning of the Private
Copa Holdings Reports Net Income of $57.7 million and EPS of $1.36 for the Third Quarter of 2018
 Copa Holdings Reports Net Income of $57.7 million and EPS of $1.36 for the Third Quarter of 2018 November 14, 2018 PANAMA CITY, Nov. 14, 2018 /PRNewswire/ -- Copa Holdings, S.A. (NYSE: CPA), today announced
Global Transportation Conference. New York June 18, 2008
 Global Transportation Conference New York June 18, 2008 1 It s Different Up Here Diversified network New revenue model Canada a growth market New efficient fleet New onboard product Well hedged fuel Strong
Results 2Q17. August 9, 2017
 Results 2Q17 August 9, 2017 2Q17 Highlights Indicators 2Q17 Var. x 2Q16 ASK (BN) 10.4-3.0% Traffic (000) 7,261-1.3% RPK (BN) 8.1 +0.5% Load Factor 77.9% +2.7 p.p. Yield (R$ cents) 23.2 +4.8% Pax Revenue
J.P. Morgan Aviation, Transportation and Industrials Conference
 J.P. Morgan Aviation, Transportation and Industrials Conference March 3, 08 Scott Kirby President Safe Harbor Statement Certain statements included in this presentation are forward-looking and thus reflect
OPERATING AND FINANCIAL HIGHLIGHTS
 Copa Holdings Reports Net Income of US$32.0 Million and EPS of US$0.72 for the Second Quarter of 2012 Excluding special items, adjusted net income came in at $58.6 million, or EPS of $1.32 per share Panama
2014 RBC CAPITAL MARKETS' CANADIAN AIRLINE AND AEROSPACE INVESTOR DAY
 at 2014 RBC CAPITAL MARKETS' CANADIAN AIRLINE AND AEROSPACE INVESTOR DAY Presentation by Michael Rousseau Executive Vice President & Chief Financial Officer Toronto October 9, 2014 CAUTION REGARDING FORWARD-LOOKING
Transportation and Aerospace Conference 2014
 presents at Transportation and Aerospace Conference 2014 Toronto November 13, 2014 CAUTION REGARDING FORWARD-LOOKING INFORMATION Air Canada s public communications may include forward-looking statements
OPERATING AND FINANCIAL HIGHLIGHTS SUBSEQUENT EVENTS
 Copa Holdings Reports Financial Results for the Third Quarter of 2016 Excluding special items, adjusted net income came in at $55.3 million, or adjusted EPS of $1.30 per share Panama City, Panama --- November
OPERATING AND FINANCIAL HIGHLIGHTS
 Copa Holdings Reports Net Income of US$18.6 Million and EPS of US$0.42 for the Second Quarter of 2010 Excluding special items, adjusted net income came in at $26.3 million, or $0.60 per share Panama City,
Copa Holdings Reports Net Income of US$113.9 Million for the Fourth Quarter of 2013
 Copa Holdings Reports Net Income of US$113.9 Million for the Fourth Quarter of 2013 Panama City, Panama --- February 12, 2014. Copa Holdings, S.A. (NYSE: CPA), today announced financial results for the
INSTITUTIONAL INVESTOR CONFERENCE
 Michael Rousseau Executive Vice President & Chief Financial Officer presents at the INSTITUTIONAL INVESTOR CONFERENCE Toronto January 15, 2015 CAUTION REGARDING FORWARD-LOOKING INFORMATION Air Canada
Air Canada Reports Third Quarter 2015 Results
 Air Canada Reports Third Quarter 2015 Results EBITDAR margin expands by 7.0 percentage points to 26.7 per cent Operating income of $815 million, an improvement of $289 million or approximately 55 per cent
INVESTOR PRESENTATION. May 2015
 INVESTOR PRESENTATION May 2015 Forward-looking Statements This presentation contains forward-looking statements within the meaning of the Private Securities Litigation Reform Act of 1995 that reflect the
AIR CANADA REPORTS SECOND QUARTER RESULTS
 AIR CANADA REPORTS SECOND QUARTER RESULTS SECOND QUARTER OVERVIEW Passenger revenue increased 5 per cent to $2.5 billion, due to growth in traffic and yield. Excluding fuel expense, unit cost declined
Copa Holdings Reports Record Earnings of US$41.8 Million for 4Q06 and US$134.2 Million for Full Year 2006
 Copa Holdings Reports Record Earnings of US$41.8 Million for 4Q06 and US$134.2 Million for Full Year 2006 Panama City, Panama --- March 7, 2007. Copa Holdings, S.A. (NYSE: CPA), parent company of Copa
Air Canada's Executive Vice President & CFO Michael Rousseau, presents at. Transportation & Logistics Conference
 Air Canada's Executive Vice President & CFO Michael Rousseau, presents at Transportation & Logistics Conference Toronto March 24, 2010 1 Agenda Air Canada leading carrier in all markets Managing through
Bank of America Merrill Lynch 2018 Emerging Markets Corporate Credit Conference. Miami, May 2018
 Bank of America Merrill Lynch 2018 Emerging Markets Corporate Credit Conference Miami, May 2018 This presentation may include forward-looking comments regarding the Company s business outlook and anticipated
OPERATING AND FINANCIAL HIGHLIGHTS. Subsequent Events
 Copa Holdings Reports Financial Results for the First Quarter of 2016 Excluding special items, adjusted net income came in at US$69.9 million, or EPS of US$1.66 per share Panama City, Panama --- May 5,
Presents at the Global Transportation Conference. Boston. May 15, 2013
 Presents at the Boston May 15, 2013 2013 Global Transportation Conference Caution Regarding Forward-looking Information Air Canada s public communications may include forward-looking statements within
Montreal September 24, 2008
 1 Montreal September 24, 2008 Air Canada Diversified network Proven revenue model Canada a stronger market New efficient fleet New onboard product Well hedged fuel Strong financial performance 2 Diversified
Air Canada Reports Second Quarter 2018 Results
 \ Air Canada Reports Second Quarter 2018 Results Second quarter EBITDAR of $646 million and operating income of $226 million Record second quarter operating revenues of $4.333 billion Record unrestricted
Conference Call 1Q14 Results. Investor Relations May 15, 2014
 Conference Call Results Investor Relations May 15, 2014 1 Highlights 2 Highlights Net revenues of R$2.5 billion in the quarter, an increase of 20% or R$411 million quarter-over-quarter; EBIT totaled R$144
OPERATING AND FINANCIAL HIGHLIGHTS. Subsequent Events
 Copa Holdings Reports Net Income of US$113.1 Million and EPS of US$2.57 for the First Quarter of 2015 Excluding special items, adjusted net income came in at US$106.0 million, or EPS of US$2.41 per share
American Airlines Group Inc.
 American Airlines Group Inc. Bank of America Merrill Lynch 2018 Transportation Conference Derek Kerr Chief Financial Officer Cautionary Statement Regarding Forward-Looking Statements and Information This
CREDIT SUISSE GLOBAL INDUSTRIALS CONFERENCE DECEMBER 4, 2014
 CREDIT SUISSE GLOBAL INDUSTRIALS CONFERENCE DECEMBER 4, 2014 1 1 SAFE HARBOR This presentation contains statements of a forward-looking nature which represent our management's beliefs and assumptions concerning
Volaris Reports Strong First Quarter 2015: 32% Adjusted EBITDAR Margin, 9% Operating Margin
 Volaris Reports Strong First Quarter 2015: 32% Adjusted EBITDAR Margin, 9% Operating Margin Mexico City, Mexico, April 22, 2015 Volaris* (NYSE: VLRS and BMV: VOLAR), the ultra-low-cost airline serving
Air Canada Reports 2016 Annual Results
 Air Canada Reports 2016 Annual Results Record annual EBITDAR (1) (excluding special items) of $2.768 billion Annual operating income of $1.345 billion Net income of $876 million and Adjusted net income
OPERATING AND FINANCIAL HIGHLIGHTS
 Copa Holdings Reports Financial Results for the Fourth Quarter of 2015 Excluding special items, adjusted net income came in at $31.7 million, or EPS of $0.73 per share Panama City, Panama --- February
Cowen Securities 6 th Annual Global Transportation Conference June 11, 2013
 Cowen Securities 6 th Annual Global Transportation Conference June 11, 2013 This presentation and the discussion today will include forward-looking statements regarding the performance of Alaska Air Group
1Q 2017 Earnings Call. April 18, 2017
 1Q 2017 Earnings Call April 18, 2017 Safe Harbor Statement Certain statements included in this presentation are forward-looking and thus reflect our current expectations and beliefs with respect to certain
Copa Holdings Reports Fourth Quarter and Full Year 2007 Results
 Copa Holdings Reports Fourth Quarter and Full Year 2007 Results Panama City, Panama --- February 21, 2008. Copa Holdings, S.A. (NYSE: CPA), parent company of Copa Airlines and Aero Republica, today announced
Second Quarter Management s Discussion and Analysis of Results of Operations and Financial Condition
 Second Quarter 2018 Management s Discussion and Analysis of Results of Operations and Financial Condition July 27, 2018 TABLE OF CONTENTS 1. Highlights... 1 2. Introduction and Key Assumptions... 3 3.
OPERATING AND FINANCIAL HIGHLIGHTS SUBSEQUENT EVENTS
 Copa Holdings Reports Net Income of US$6.2 Million and EPS of US$0.14 for the Third Quarter of 2015 Excluding special items, adjusted net income came in at $37.4 million, or EPS of $0.85 per share Panama
Investor Update April 23, 2009
 JetBlue Airways Investor Relations (718) 709-2202 ir@jetblue.com Investor Update April 23, 2009 This investor update provides our investor guidance for the second quarter ending June 30, 2009 and full
SAS Group Q Teleconference
 SAS Group Q4 2012 Teleconference December 12, 2012 1 Break-even result in 2012 despite 1.6 bn SEK higher fuel cost 23 MSEK EBT (before non-recurring items) despite 1.6 bn SEK higher fuel cost Positive
Spirit Overview & 2016 Priorities
 March 2016 Disclaimer Statements in this release and certain oral statements made from time to time by representatives of the Company contain various forward-looking statements within the meaning of Section
IAG results presentation. Quarter One th May 2018
 IAG results presentation Quarter One 2018 4 th May 2018 Highlights Willie Walsh, Chief Executive Officer Highlights Another strong quarter performance with an operating profit of 280m (5.6% margin, +2.3pts)
Gerry Laderman SVP Finance, Procurement and Treasurer
 Gerry Laderman SVP Finance, Procurement and Treasurer Safe Harbor Statement Certain statements included in this release are forward-looking and thus reflect our current expectations and beliefs with respect
2017 Marketing and Communications Conference. November 6, 2017
 2017 Marketing and Communications Conference November 6, 2017 1 2 Introduction Carrie Kenrick State of the Industry Industry Consolidation Financial Trends Ancillary Product / Customer Segmentation Fleet
10TH ANNUAL WOLFE RESEARCH GLOBAL TRANSPORTATION CONFERENCE MAY 23, 2017
 1 10TH ANNUAL WOLFE RESEARCH GLOBAL TRANSPORTATION CONFERENCE MAY 23, 2017 SAFE HARBOR This presentation contains forward-looking statements within the meaning of the Private Securities Litigation Reform
Q3 FY18 Business Highlights
 Q3 FY18 RESULTS Q3 FY18 Business Highlights 1 2 3 4 5 6 7 Record passengers 7.1m, record revenues 423m Investing in growth 24% passenger growth in Q3 Disciplined cost management flat ex-fuel CASK Largest
Michael Rousseau Executive Vice President & Chief Financial Officer
 at Presentation by Michael Rousseau Executive Vice President & Chief Financial Officer Montreal September 18, 2014 CAUTION REGARDING FORWARD-LOOKING INFORMATION Air Canada s public communications may
UBS 14 th Global Emerging Markets Conference. New York, November 2016
 UBS 14 th Global Emerging Markets Conference New York, November 2016 This presentation may include forward-looking comments regarding the Company s business outlook and anticipated financial and operating
Air Canada Reports Record Full Year 2013 Results
 Air Canada Reports Record Full Year 2013 Results Adjusted net income of $340 million, an increase of $285 million from 2012 Annual EBITDAR of $1.433 billion (excluding the impact of benefit plan amendments),
Air Canada Reports 2017 Annual Results
 Air Canada Reports 2017 Annual Results Operating income of $1.364 billion and record EBITDAR of $2.921 billion Record operating revenues of $16.252 billion Leverage ratio of 2.1 and unrestricted liquidity
44th Consecutive Profitable Quarter Fourth Quarter Fully Diluted Earnings per Share of $0.94 Full Year Fully Diluted Earnings per Share of $4.
 Allegiant Travel Company Fourth Quarter and Full Year 2013 Financial Results January 29, 2014 1:00 PM PT 44th Consecutive Profitable Quarter Fourth Quarter Fully Diluted Earnings per Share of $0.94 Full
1Q 2017 EARNINGS PRESENTATION APRIL 25, 2017
 1 1Q 2017 EARNINGS PRESENTATION APRIL 25, 2017 SAFE HARBOR This presentation contains forward-looking statements within the meaning of the Private Securities Litigation Reform Act of 1995, Section 27A
Santander 22 nd Annual Latin American Conference. Cancun, January 2018
 Santander 22 nd Annual Latin American Conference Cancun, January 2018 This presentation may include forward-looking comments regarding the Company s business outlook and anticipated financial and operating
Air Canada Reports First Quarter 2018 Results
 \ Air Canada Reports First Quarter 2018 Results First quarter EBITDAR of $397 million and operating loss of $14 million Record first quarter operating revenues of $4.071 billion Record unrestricted liquidity
Analysts and Investors conference call. Q results. 15 May 2013
 Analysts and Investors conference call Q1 2013 results 15 May 2013 Management summary Key messages of Q1 2013 +6% +9% +3.3%p. Q1 2013 operational KPIs are in line with 109.7 116.2 6.5 7.1 82.3 85.6 expectations,
Second Quarter Management s Discussion and Analysis of Results of Operations and Financial Condition
 Second Quarter 2017 Management s Discussion and Analysis of Results of Operations and Financial Condition August 1, 2017 TABLE OF CONTENTS 1. Highlights... 3 2. Introduction and Key Assumptions... 5 3.
JetBlue Airways Corporation
 March 16, 2015 JetBlue Airways Corporation Current Recommendation Prior Recommendation Neutral Date of Last Change 03/16/2015 Current Price (03/13/15) $18.12 Target Price $22.00 OUTPERFORM SUMMARY (JBLU-NASDAQ)
3Q 2017 EARNINGS PRESENTATION OCTOBER 24, 2017
 1 3Q 2017 EARNINGS PRESENTATION OCTOBER 24, 2017 SAFE HARBOR This presentation contains forward-looking statements within the meaning of the Private Securities Litigation Reform Act of 1995, Section 27A
2018 Annual Meeting of Stockholders
 2018 Annual Meeting of Stockholders Playing the Long Game June 13, 2018 Doug Parker Chairman and Chief Executive Officer American Airlines Group Inc. Cautionary Statement Regarding Forward-Looking Statements
Copa Holdings Reports Net Income of US$51.9 Million for the Fourth Quarter of 2008 and US$152.2 Million for Full Year 2008
 Copa Holdings Reports Net Income of US$51.9 Million for the Fourth Quarter of 2008 and US$152.2 Million for Full Year 2008 Panama City, Panama --- February 19, 2009. Copa Holdings, S.A. (NYSE: CPA), parent
AIR NEW ZEALAND ANNUAL RESULTS ANNUAL RESULTS
 AIR NEW ZEALAND ANNUAL RESULTS 2008 1 HIGHLIGHTS Record operating revenue, up 9% Normalised earnings* $197m Net cash position of $1.3bn Launched direct service to Vancouver and Beijing Award winning product