Census 2002 OF WOOD BUFFALO
|
|
|
- Aubrey Copeland
- 6 years ago
- Views:
Transcription


1 Census 2002 THE REGIONAL MUNICIPALITY OF WOOD BUFFALO
2

3 Census 2002 The Regional Municipality of Wood Buffalo* 2002 Census was conducted from May 7 to June 30.** The information gathered from the enumeration was used to develop this report and compares 2002 data with information gathered in This Municipal Census was undertaken two years after the 2000 Census as the population of the Regional Municipality of Wood Buffalo continues to increase. The Regional Municipality of Wood Buffalo is located in northeastern Alberta. It was established on April 1, 1995 when the City of Fort McMurray and Improvement District No. 143 amalgamated to form the largest regional municipality in North America with an area of 68,454 square kilometers. Fort McMurray is at the center of this dynamic Regional Municipality. It is the largest community within the Municipality. Other communities within the Municipality include Anzac, Conklin, Draper, Fort Chipewyan, Fort Fitzgerald, Fort MacKay, Gregoire Lake Estates, Janvier, Mariana Lake, and Saprae Creek Estates (see map on page 7). These communities offer unique lifestyles. The information in this report is presented under five general headings: Section 1: Population Section 2: Housing Section 3: Employment Section 4: Transportation Section 5: Recreational Vehicles Note: Average percentages presented in the Tables in the Population and the Housing Sections are based on overall totals and not on the average of the areas in the Tables. Anyone requiring additional information is invited to contact the Planning and Development Department, Regional Municipality of Wood Buffalo at , or * When the name Wood Buffalo appears in this document it refers to the entire Regional Municipality including all population centers. * * Enumeration, data analyses, and report preparation were conducted by the Institute for Business and Professional Development at Keyano College. Wood Buffalo Census


4 2 Wood Buffalo Census 2002
5 Table of Contents Section 1: Population Page Population in the Regional Municipality of Wood Buffalo by Area.. 6 Population Distribution in the Regional Municipality of Wood Buffalo Population in Fort McMurray by Area. 8 Population Distribution in Fort McMurray... 9 Population Analysis by Sex and Area in the Regional Municipality of Wood Buffalo.. 10 Population Analysis by Sex and Area in Fort McMurray 11 Percentage of Residents by Age Group in the Regional Municipality of Wood Buffalo Percentage of Residents by Sex and Age Group in the Regional Municipality of Wood Buffalo.. 13 Total Population by Sex and Age Group in the Regional Municipality of Wood Buffalo.. 14 Length of Time Residents have Lived in the Regional Municipality of Wood Buffalo.. 15 Education Levels of Residents in the Regional Municipality of Wood Buffalo.. 16 Education Levels of Male and Female Residents in the Regional Municipality of Wood Buffalo 17 Percentage of Residents who Attended an Educational Institution During the 2001/2002 School Year.. 18 Migration Patterns of Residents in the Regional Municipality of Wood Buffalo Section 2: Housing Total Number of Housing Units in the Regional Municipality of Wood Buffalo Percentage of Dwelling Type in the Regional Municipality of Wood Buffalo Percentage of Dwelling Type in Fort McMurray Average Number of Persons by Dwelling Type in the Regional Municipality of Wood Buffalo. 24 Average Number of Persons by Dwelling Type in Fort McMurray Percent Tenancy Distribution in the Regional Municipality of Wood Buffalo Percent Tenancy Distribution in Fort McMurray. 27 Section 3: Employment Employment Trends in the Regional Municipality of Wood Buffalo Type of Employment and Employment Locations in the Regional Municipality of Wood Buffalo.. 30 Section 4: Transportation Percentage of Residences that have 0 to 10 Vehicles and the Total Number of Vehicles in the Regional Municipality of Wood Buffalo. 32 Percentage and Number of Fort McMurray and Regional Hamlet Residents Indicating a Need for the Use of a Bus for People with Disabilities. 33 Section 5: Recreational Vehicles Number of Recreational Vehicles in the Regional Municipality of Wood Buffalo.. 35 Wood Buffalo Census
6 4 Wood Buffalo Census 2002

7 SECTION 1 POPULATION Wood Buffalo Census

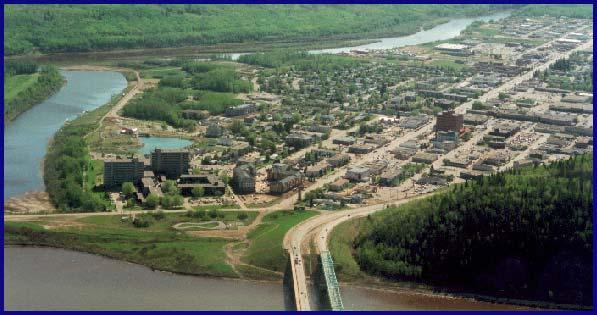
8 Population in the Regional Municipality of Wood Buffalo by Area Area Anzac Conklin Draper Fort Chipewyan 1,036 1,012 Fort Fitzgerald* 30 Fort MacKay Fort McMurray 42,156 47,240 Gregoire Lake Estates Hinterland* 122 Janvier Mariana Lake Saprae Creek Work Camps** 5,903 8,063 Total 51,406 58,317 The Regional Municipality of Wood Buffalo, situated in north eastern Alberta, encompasses Fort McMurray and a number of smaller communities stretching from Fort Chipewyan in the north to Mariana Lake in the south. The majority of the population resides in Fort McMurray situated at the confluence of the Athabasca and Clearwater Rivers (see map page 7). * Fort Fitzgerald was not enumerated in the 2000 Census and the Hinterland population was included in the enumeration of the regional communities for the 2002 Census. ** Work Camps house oil sands workers, etc. in the rural areas of Wood Buffalo. 6 Wood Buffalo Census 2002

9 Population Distribution in the Regional Municipality of Wood Buffalo Work camps population = 8,063. Wood Buffalo Census

10 Population in Fort McMurray by Area Area Abasand 4,649 4,061 Beacon Hill 2,336 2,480 Gregoire 3,188 3,856 Lower Townsite 9,561 11,831 Thickwood 15,995 17,015 Timberlea 5,748 7,336 Waterways Total 42,156 47,240 Since the previous Census in 2000, Fort McMurray has seen a large population growth in areas experiencing new development. These areas include Gregoire, the Lower Townsite, Thickwood, and Timberlea (see map page 9). 8 Wood Buffalo Census 2002

11 Population Distribution in Fort McMurray Wood Buffalo Census

12 Population Analysis by Sex and Area in the Regional Municipality of Wood Buffalo There is a greater percentage of males (53.7%) than females (46.3%) in the Regional Municipality of Wood Buffalo. An analysis of the gender reveals that there is a greater percentage of males than females in all regions with the exception of Fort Chipewyan. Area* Male % Female % Anzac Fort Chipewyan Fort MaKay Fort McMurray Gregoire Lake Janvier Saprae Creek Average * Gender data were not available for Conklin, Draper, Fort Fitzgerald, and Mariana Lake. 10 Wood Buffalo Census 2002

13 Population Analysis by Sex and Area in Fort McMurray Area Male % Female % Abasand Beacon Hill Gregoire Lower Townsite Thickwood Timberlea Waterways Average Wood Buffalo Census

14 Percentage of Residents by Age Group in the Regional Municipality of Wood Buffalo Age Group Total Wood Buffalo Census 2002
15 Percentage of Residents by Sex and Age in the Regional Municipality of Wood Buffalo Percentage of Total Wood Buffalo Population for Male and Female Residents by Age % Total Population Age Categories (Years) Male Female Age Male Female Wood Buffalo Census
16 Total Population by Sex and Age Group in the Regional Municipality of Wood Buffalo Age Group Male Female Total 0-4 1,776 1,800 3, ,966 1,948 3, ,211 2,088 4, ,239 1,929 4, ,274 1,978 4, ,404 1,947 4, ,336 2,103 4, ,392 2,121 4, ,747 2,378 5, ,636 1,956 4, ,107 1,375 3, , , Subtotal 27,135 23,119 50,254 Work Camps* 8,063 Total Population 58,317 * Gender data is not available for the Work Camps. The average age of residents in the Regional Municipality of Wood Buffalo is 29.9 years, up from 29.2 years in The average age for males, 30.5 years, is higher than females, 29.1 years. 14 Wood Buffalo Census 2002

17 Length of Time Residents have Lived in the Regional Municipality of Wood Buffalo Length of Time in Wood Buffalo Length of Time in Wood Buffalo 20+ Years 11 to 20 Years 6 to 10 Years 3 to 5 Years 1 to 2 Years 7 to 12 Months 0 to 6 Months % Residents Wood Buffalo Census

18 Education Levels of Residents in the Regional Municipality of Wood Buffalo Highest Level of Education Post-graduate Degree 1.85 University Degree 9.05 Some University 3.68 College Certificate / Diploma Some College 5.56 Apprentice / Journeyman 9.54 High School Diploma Some High School K % Residents 16 Wood Buffalo Census 2002
19 Education Levels of Male and Female Residents in the Regional Municipality of Wood Buffalo Highest Level of Education by Sex Post-graduate Degree University Degree Some University College Certificate / Diploma Some College Apprentice / Journeyman High School Diploma Some High School K % Residents Male Female Wood Buffalo Census
20 Percentage of Residents who Attended an Educational Institution During the 2001/2002 School Year Percentage of Residents Who Did and Who Did Not Attend an Educational Instituion During the 2001/2002 School Year Full Time Part Time Did Not Attend Percentage of Residents Who Attended an Educational Institution During the 2001/2002 School Year % Residents Male Female Full Time Part Time 18 Wood Buffalo Census 2002
21 Migration Patterns of Residents in the Regional Municipality of Wood Buffalo Migration Patterns of Wood Buffalo Residents (Where Moved From In Last 12 Months) % Residents Fort McMurray* 0.38 Other RMWB Other Alberta Other Canada 0.42 Other Country * This data indicates the percentage of residents who moved within Fort McMurray. The percentage of Wood Buffalo residents who indicated they expect to leave the region in the next 12 months was 6.5% (3233 residents). However, 67% of residents who indicated they expect to retire within the next 12 months plan to remain in Wood Buffalo (378 residents). Wood Buffalo Census

22 SECTION 2 HOUSING 20 Wood Buffalo Census 2002

23 Total Number of Housing Units in the Regional Municipality of Wood Buffalo Fort McMurray Wood Buffalo Dwelling Type Detached Single Family 5,905 6,895 6,758 7,545 Duplex Townhouse 1,412 1,504 1,418 1,508 Apartment 3,219 3,679 3,238 3,679 Mobile Home 1,627 2,157 1,830 2,283 Other Totals 13,321 15,032 14,475 15,863* * No housing data was available for Conklin, Draper, Fort Fitzgerald, and Mariana Lake. The Regional Municipality of Wood Buffalo has seen housing starts increase. The primary area of growth in the Region is in Fort McMurray. A variety of housing types are being developed to meet the demands of the expanding oil sands industry. Wood Buffalo Census

24 Percentage of Dwelling Type in the Regional Municipality of Wood Buffalo Area Single Family Semi- Detached Townhouse Apartment Mobile Home Other Total Anzac Fort Chipewyan Fort MacKay Fort McMurray Gregoire Lake Estates Janvier Saprae Creek Average Wood Buffalo Census 2002

25 Percentage of Dwelling Type in Fort McMurray Area Single Family Semi- Detached Townhouse Apartment Mobile Home Other Total Abasand Beacon Hill Gregoire Lower Townsite Thickwood Timberlea Waterways Average Wood Buffalo Census

26 Average Number of Persons per Dwelling Type in the Regional Municipality of Wood Buffalo Area* Single Family Semi- Detached Townhouse Apartment Mobile Home Other Anzac Fort Chipewyan Fort MacKay Fort McMurray Gregoire Lake Estates Janvier Saprae Creek Average * Rural areas have a smaller variety of dwelling types (see page 22). 24 Wood Buffalo Census 2002

27 Average Number of Persons per Dwelling Type in Fort McMurray Single Family Semi- Detached Townhouse Mobile Home Area Apartment Other Abasand Beacon Hill Gregoire Lower Townsite Thickwood Timberlea Waterways Average Wood Buffalo Census

28 Percent Tenancy Distribution in the Regional Municipality of Wood Buffalo Area Own Lease to Purchase Rent/Lease Anzac Fort Chipewyan Fort MacKay Fort McMurray Gregoire Lake Estates Janvier Saprae Creek Average * * The average ownership of dwellings in Wood Buffalo has increased from 63.7% in Wood Buffalo Census 2002

29 Percent Tenancy Distribution in Fort McMurray Area* Own Lease to Purchase Rent/Lease Abasand Beacon Hill Gregoire Lower Townsite Thickwood Timberlea Waterways Average * * The average ownership of dwellings in Fort McMurray has increased from 62.7% in Wood Buffalo Census

30 Section 3 Employment 28 Wood Buffalo Census 2002
31 Employment Trends in the Regional Municipality of Wood Buffalo Employment Status Full Time Part Time Retired Seeking Work Maternity Leave Disability Leave Homemaker Not Seeking Work Under 14 Years Refused to Answer Don't Know % Residents The Regional Municipality of Wood Buffalo s labour force has a consistent high rate of participation. The Region is experiencing significant new growth in the Oil Sands industry. As a percentage of the total population, the workforce has increased to 69.8% in 2002, up from 62.7% in Of those employed, only 4.2% indicated they were working at more than one job. However, 10.0% of the employed residents refused to answer this question. Wood Buffalo Census
32 Type of Employment and Employment Locations in the Regional Municipality of Wood Buffalo Of those residents who indicated they were employed, 24.1% were employed by an Oil Sands / Oil / Gas Company, 18.8% by a contractor for Oil Sands / Oil / Gas Company, 43.2% by some other type of employer. However, 13.8% either refused to answer or indicated they did not know. Area % Abasand Beacon Hill Gregoire / MacKenzie 2, Lower Townsite 7, Thickwood 2, Timberlea Waterways Anzac Reserves in Anzac Conklin Draper Fort Chipewyan Reserves in Fort Chipewyan Fort MacKay Reserves in Fort MacKay Gregoire Lake Estates Janvier Reserves in Janvier Saprae Creek Airport Work Camp Other RMWB Area 22, Other Alberta Other Canada Other Country Refused to Answer 3, Don t Know 1, Total 40, The primary source of employment in The Regional Municipality of Wood Buffalo is related to the Oil Sands industry which employs 62.6% of the Region s workforce. The Lower Townsite in Fort McMurray is the second largest source of employment with 17.9% of the Region s workforce. 31.6% of the Region s work force works within Fort McMurray, while 57.2% work in the rural regions of Wood Buffalo. 0.7% indicated they work outside of The Regional Municipality of Wood Buffalo. 10.5% refused to answer or did not know. 30 Wood Buffalo Census 2002

33 Section 4 Transportation Wood Buffalo Census
34 Percentage of Residences that have 0 to 10 Vehicles and the Total Number of Vehicles in the Regional Municipality of Wood Buffalo % Residences Percentage of Residences by Number of Vehicles per Residence Number of Vehicles Fort McMurray residents reported that they operated 27,989 vehicles (cars, trucks, vans, motorcycles, etc.). Residents from the regional hamlets reported that they operated 1,549 vehicles. The total number of vehicles operated in the Regional Municipality of Wood Buffalo is 29,538. Residents in Wood Buffalo operate, on average, 1.9 vehicles per residence. 32 Wood Buffalo Census 2002

35 Percentage and Number of Fort McMurray and Regional Hamlet Residents Indicating a Need for the Use of a Bus for People with Disabilities Fort McMurray Percent Total Abasand Beacon Hill Gregoire Lower Townsite Thickwood Timberlea Waterways Total Regional Hamlets Percent Total Anzac Fort Chipewyan Fort MacKay Gregoire Lake Estates Janvier Saprae Creek Total Wood Buffalo Census

36 Section 5 Recreational Vehicles 34 Wood Buffalo Census 2002
 263 15 278 Snowmobile 2,936 162 3,098 All Terrain Vehicle (quads, trikes, etc.")
37 Number of Recreational Vehicles in the Regional Municipality of Wood Buffalo Recreational Vehicle Fort McMurray Hamlets Total Power Boat 1, ,628 Canoe Personal Watercraft (seadoos, etc.) Snowmobile 2, ,098 All Terrain Vehicle (quads, trikes, etc.) 2, ,140 Dirt Bike RV / Camper 2, ,117 Total 11, ,720 Wood Buffalo Census

38 36 Wood Buffalo Census 2002
WOOD BUFFALO REGIONAL MAP
 REGIONAL DATA WOOD BUFFALO REGIONAL MAP TOTAL: 66,361 KM 2 Regional Communities: 1. Fort Fitzgerald 2. Fort Chipewyan 3. Fort McKay 4. Fort McMurray 5. Draper 6. Saprae Creek Estates 7. Gregoire Lake
Wood Buffalo Where We Are Today
 Slave River Fort Fitzgerald Peace River Fort Chipewyan Lake Athabasca Winter Road SASKATCHEWAN Fort MacKay Fort McMurray Draper Athabasca River Gregoire Lake Estates Saprae Creek Anzac Clearwater River
 www.woodbuffalo.ab.ca 2011 Table of contents DISCLAIMER 4 A UNIQUE REGION IN EVERY WAY 6 LOCATION, ACCESS AND SIZE 9 OIL SANDS PROJECTS 10 ECONOMIC IMPACTS OF ALBERTA S OIL SANDS 14 AN OPEN AND CONNECTED
DEVELOPMENT PROFILES
 DEVELOPMENT PROFILES 1-855-923-2338 Fort McMurray Generalized Land Development Concept 881 63 Parsons Creek Stone Creek Commercial The Commons at Eagle Ridge Timberlea West Growth MacDonald Island Snye
Secondary and Emergency Access Roads
 Secondary and Emergency Access Roads October 26, 2016 Presenters: Mazhar Hajhossein, Manager Transportation & Infrastructure Planning Dawny George, Director Engineering Department Introduction On June
Demographic Profile 2013 census
 Demographic Profile 2013 census This profile provides basic population and demographic information on the residents of the Hauraki District. Population and demographic information is important for targeting
COUNCIL REPORT Meeting Date: December 10, 2013
 Subject: Highway 63/881 Corridor Area Structure Plan Amendment Bylaw No. 13/037 APPROVALS: Felice Mazzoni, Director Henry Hunter, Executive Director Glen Laubenstein, Chief Administrative Officer COUNCIL
Fort McMurray International Airport
 FINAL REPORT Fort McMurray International Airport Economic Impacts Associated with Current Air Services PREPARED FOR Fort McMurray Airport Authority (FMAA) PREPARED BY InterVISTAS Consulting Inc. 29 September
REGIONAL MUNICIPALITY OF WOOD BUFFALO S HERITAGE
 FORT MCMURRAY : 1910-1920 The northwest end of Franklin Avenue by the current intersection of Hardin and Morrison Streets. Credit: McDonald Family Collection, FMHS. REGIONAL MUNICIPALITY OF WOOD BUFFALO
Devonport-Takapuna Local Board Profile
 Devonport-Takapuna Local Board Profile - Initial results from the Census February 2014 Social and Economic Research Team Research, Investigations and Monitoring Unit Auckland Council Map of Devonport-Takapuna
Dear Investor, Jim Smith Warden. Connie Nolan Chief Administrative Officer
 It s all here Dear Investor, We offer a dedicated in-house team from our Economic Development, Planning, Infrastructure/Engineering and Finance departments to work with your team from land purchase, through
BYLAW NO. 99/ Bylaw Officer means any Police Officer, Bylaw Officer or Special Constable for the Regional Municipality of Wood Buffalo.
 BYLAW NO. 99/028 BEING A BYLAW OF THE REGIONAL MUNICIPALITY OF WOOD BUFFALO TO PROVIDE FOR THE REGULATION OF PARK AND RECREATION AREAS WITHIN THE FORT MCMURRAY URBAN SERVICE AREA - WARD 1 WHEREAS, by virtue
Figure 1.1 St. John s Location. 2.0 Overview/Structure
 St. John s Region 1.0 Introduction Newfoundland and Labrador s most dominant service centre, St. John s (population = 100,645) is also the province s capital and largest community (Government of Newfoundland
Zimbabwe. Provincial Report Manicaland
 Zimbabwe Provincial Report Manicaland ZIMBABWE POPULATION CENSUS 2012 Population Census Office P.O. Box CY342 Causeway Harare Tel: 04-793971-2 04-794756 E-mail: census2012@zimstat.ac.zw Census Results
Natural regions of Alberta
 Natural regions of Alberta Alberta is a big province. It has 6 natural regions. Can you find the regions on the map? Use the legend. Canadian Shield region W This map shows northeastern Alberta. Can you
Q1 Does your household have access to a car or other vehicle that is running, licensed, and insured?
 The Transportation Needs Survey for Community Residents was undertaken by the SEDA COG Metropolitan Planning Organization (MPO) which encompasses eight Central Pennsylvania counties: Clinton, Columbia,
WARD 3 NEWS SAPRAE CREEK & DRAPER ROAD AUGUST 2012
 WARD 3 NEWS SAPRAE CREEK & DRAPER ROAD AUGUST 2012 DAY Anzac~Conklin~Fort Chipewyan~Fort Fitzgerald~Fort MacKay~Gregoire Lake Estates~Janvier~Mariana Lake~Saprae Creek Estates 9909 Franklin Avenue, Fort
Juneau Household Waterfront Opinion Survey
 Juneau Household Waterfront Opinion Survey Prepared for: City and Borough of Juneau Prepared by: April 13, 2004 TABLE OF CONTENTS Executive Summary...1 Introduction and Methodology...6 Survey Results...7
URBAN DYNAMICS WESTERN CAPE 67
 URBAN DYNAMICS WESTERN CAPE 67 5. SOCIO-ECONOMIC CONTEXT 5.1 Demographic Profile 5.1.1 Introduction The demographic information contained in the synopsis is derived from the supposedly inaccurate 2001
NUNAVIK'S LABOUR MARKET AND EDUCATIONAL ATTAINMENT PARADOX
 NUNAVIK'S LABOUR MARKET AND EDUCATIONAL ATTAINMENT PARADOX Andrew Sharpe and Jasmin Thomas Presentation prepared for Mapping the Road Together to Sustainable Employment; Celebrating 25 Years. Katittavik
Contents Manningham at a Glance... 6 Location and Area... 6 Manningham Activity Centres... 6 Manningham Suburbs... 6 Population... 8 Forecast... 9 For
 Contents Manningham at a Glance... 6 Location and Area... 6 Manningham Activity Centres... 6 Manningham Suburbs... 6 Population... 8 Forecast... 9 Forecast 2011 2036... 9 Population Forecast... 9 Gross
ISRAEL- COUNTRY FACTS
 ISRAEL- COUNTRY FACTS ISRAEL-NEIGHBOURING COUNTRIES AND POLITICAL MAP Area: 22,072 sq. km Land area: 21,643 sq. km. Fast Facts Area of lakes: 429 sq. km. (Sea of Galilee 164 sq. km., the Dead Sea - 265
Nevada s Tourism, Gaming, and Entertainment Sector
 Nevada s Tourism, Gaming, and Entertainment Sector Emsi Q4 2018 Data Set www.economicmodeling.com 1 Industry Summary for Tourism, Gaming, and Entertainment 428,652 12.5% $38,553 Jobs (2018) % Change (2010-2018)
Newbury Population ,071 1,941 3,719 4,038 5,337 5,611 5,805
 CHAPTER 3 DEMOGRAPHICS Demographic Profile Population Demographic information can provide essential insights into the composition of a community. As a result, it is a basic element of land use planning
600 Aviation Avenue & 100 Agnew Drive Brandon Manitoba ~ 5 Acres Land For Sale SUBJECT PROPERTIES
 600 Aviation Avenue & 100 Agnew Drive Brandon Manitoba ~ 5 Acres Land For Sale SUBJECT PROPERTIES Dan Fontaine Business Development Specialist 204.729.2133 or 1.866.729.2132 d.fontaine@brandon.ca EconomicDevelopmentBrandon.com
North Lanarkshire. Skills Assessment January SDS-1163-Jan16
 North Lanarkshire Skills Assessment January 2016 SDS-1163-Jan16 Acknowledgement The Regional Skills Assessment Steering Group (Skills Development Scotland, Scottish Enterprise, the Scottish Funding Council
The Yorke & Mid North (State Govt) Region. Workforce Wizard Region Report
 Region. Workforce Wizard Region Report") The Yorke & Mid North (State Govt) Region Workforce Wizard Region Report Table of Contents Executive Summary 3 Population and Social Characteristics 4 Current Population 4 Age Groups 4 Key Populations
The Yorke & Mid North (State Govt) Region Workforce Wizard Region Report Table of Contents Executive Summary 3 Population and Social Characteristics 4 Current Population 4 Age Groups 4 Key Populations
DUNOON PROFILE May 2014
 www.hie.co.uk DUNOON PROFILE May 2014 DUNOON PROFILE INTRODUCTION The Dunoon profile uses 2011 Census data and other available data sources to present an up-to-date analysis of its population and labour
East Lothian. Skills Assessment January SDS-1154-Jan16
 East Lothian Skills Assessment January 2016 SDS-1154-Jan16 Acknowledgement The Regional Skills Assessment Steering Group (Skills Development Scotland, Scottish Enterprise, the Scottish Funding Council
Puerto Ricans in Connecticut, the United States, and Puerto Rico, 2014
 Issued April 2016 Centro DS2016US-8 Puerto Ricans in Connecticut, the United States, and Puerto Rico, 2014 In 2014, Connecticut was the 6th state with most Puerto Ricans (301,182) in the United States.
Youth Retention: July Value of post secondary education in regional settings. Prepared for Luminosity Youth Summit.
 Youth Retention: Value of post secondary education in regional settings Prepared for Luminosity Youth Summit July 2013 Prepared by MID NORTH COAST NSW Table of contents Table of contents... 2 Introduction...
Limestone Road Industrial Area Brandon Manitoba ~141 Acres Rail Accessible, Ready for Development
 Limestone Road Industrial Area Brandon Manitoba ~141 Acres Rail Accessible, Ready for Development Dan Fontaine Business Development Specialist 204.729.2133 or 1.866.729.2132 D.Fontaine@brandon.ca EconomicDevelopmentBrandon.com
Puerto Ricans in Massachusetts, the United States, and Puerto Rico, 2014
 Issued April 2016 Centro DS2016US-07 Puerto Ricans in Massachusetts, the United States, and Puerto Rico, 2014 In 2014, Massachusetts was the fifth state with most Puerto Ricans in the United States. In
Puerto Ricans in Ohio, the United States, and Puerto Rico, 2014
 Issued April 2016 Centro DS2015US-12 Puerto Ricans in Ohio, the United States, and Puerto Rico, 2014 In 2014, Ohio had the tenth largest number of Puerto Ricans in the United States with 108,174 residents,
WESTERN RV GROUP OF COMPANIES A REWARDING CAREER IN THE RECREATIONAL VEHICLE INDUSTRY
 WESTERN RV GROUP OF COMPANIES A REWARDING CAREER IN THE RECREATIONAL VEHICLE INDUSTRY Why The RV Industry? Canadians spent $2.9 Billion at RV Dealers in 2011. More than 14% of Canadian families own a recreation
PORTREE PROFILE May 2014
 www.hie.co.uk PORTREE PROFILE May 2014 PORTREE PROFILE INTRODUCTION The Portree profile uses 2011 Census data and other available data sources to present an up-to-date analysis of its population and labour
SHETLAND AREA PROFILE
 www.hie.co.uk SHETLAND AREA PROFILE May 2014 SHETLAND AREA PROFILE INTRODUCTION The Shetland area profile uses 2011 Census data and other available data sources to present an up-to-date analysis of its
AVSP 7 Summer Section 7: Visitor Profile - Demographics and Spending
 AVSP 7 Summer 2016 Section 7: Visitor Profile - Demographics and Spending Demographics Origin Visitors were asked what state, country, or province they were visiting from. The chart below shows results
Introduction. Significance of domestic travel. How many domestic trips do Georgians take? 2,933 2,951
 Introduction Figure 1: Domestic visits 2017-2018 (in thousands) This report presents the basic trends in domestic travel by Georgian residents for the period of first quarter of 2018. Figures include the
SYNOPSIS OF INFORMATION FROM CENSUS BLOCKS AND COMMUNITY QUESTIONNAIRE FOR TONOPAH, NEVADA
 TECHNICAL REPORT UCED 93-04 SYNOPSIS OF INFORMATION FROM CENSUS BLOCKS AND COMMUNITY QUESTIONNAIRE FOR TONOPAH, NEVADA UNIVERSITY OF NEVADA, RENO i Synopsis of Information from Census Blocks and Community
THANK YOU TO OUR SPONSOR
 THANK YOU TO OUR SPONSOR THANK YOU TO OUR HOST POPULATION POPULATION GROWTH St. Petersburg & Pinellas County Population Growth Rate 3.50% 3.00% 2.50% 2.00% 1.50% 1.00% 0.50% 0.00% -0.50% -1.00% -1.50%
What benefits do agritourists seek? Suzanne Ainley, Ph.D. Candidate and Bryan Smale, Ph.D. Department of Recreation and Leisure Studies University of
 What benefits do agritourists seek? Suzanne Ainley, Ph.D. Candidate and Bryan Smale, Ph.D. Department of Recreation and Leisure Studies University of Waterloo Waterloo, ON, Canada 2009 National Extension
DINGWALL PROFILE May 2014
 www.hie.co.uk DINGWALL PROFILE May 2014 DINGWALL PROFILE INTRODUCTION The Dingwall profile uses 2011 Census data and other available data sources to present an up-to-date analysis of its population and
NAURU BUREAU OF STATISTICS
 GOVERNMENT OF NAURU NAURU BUREAU OF STATISTICS PROVISIONAL VISITOR ARRIVALS 3RD QUARTER (JANUARY MARCH 2016) 1. TOTAL VISITOR ARRIVALS Provisional numbers show that visitor arrivals for 3 rd Quarter March
CAMPBELTOWN PROFILE May 2014
 www.hie.co.uk CAMPBELTOWN PROFILE May 2014 CAMPBELTOWN PROFILE INTRODUCTION The Campbeltown profile uses 2011 Census data and other available data sources to present an up-to-date analysis of its population
Puerto Ricans in Georgia, the United States, and Puerto Rico, 2014
 Issued September 2016 Centro DS2014GA-14 Puerto Ricans in Georgia, the United States, and Puerto Rico, 2014 In 2014, an estimated 89,462 Puerto Ricans lived in Georgia and accounted for 1.7 percent of
LITERACY IN NOVA SCOTIA Implications of Findings from IALSS 2003
 LITERACY IN NOVA SCOTIA Implications of Findings from IALSS 03 Presented by Satya Brink, Ph.D. Director, National Learning Policy Research Learning Policy Directorate, HRSDC January 06 1 Key Questions
Introduction. Significance of domestic travel. How many domestic trips do Georgians take? 3,230 3,145
 Introduction This report presents the basic trends in domestic travel by Georgian residents for the period of second quarter of 2017. Figures include the results of a household survey conducted by the
Visitor Profile - Central Island Region
 TOURISM LABOUR MARKET RESEARCH PROJECT 2003 The Project The Tourism Labour Market Research Project, was designed to study the tourism labour market throughout the Vancouver Island region. The Visitor Survey
Barbadians. imagine all the people. Barbadians in Boston
 Barbadians imagine all the people Barbadians in Boston imagine all the people is a series of publications produced by the Boston Redevelopment Authority for the Mayor s Office of Immigrant Advancement.
ECONOMIC PROFILE PARK CITY & SUMMIT COUNTY, UTAH
 ECONOMIC PROFILE PARK CITY & SUMMIT COUNTY, UTAH Prepared by the Park City Chamber of Commerce & Visitors Bureau PO Box 1630, Park City, UT 84060 1.800.453.1360 Economic Profile Packet Sections 1. Introduction
East Dunbartonshire Area Profile
 East Dunbartonshire Area Profile May 2015 Contents Executive Summary.. page 3 Introduction.. page 6 Population page 7 Age Structure. page 9 Population Estimates..page 11 Population Projections page 13
Puerto Ricans in Rhode Island, the United States, and Puerto Rico, 2013
 Issued September 2016 Centro DS2015US-07 Puerto Ricans in Rhode Island, the United States, and Puerto Rico, 2013 In 2013 an estimated 36,217 Puerto Ricans lived in Rhode Island and accounted for at least
Tourism Impacts and Second Home Development in Coastal Counties: A Sustainable Approach
 Tourism Impacts and Second Home Development in Coastal Counties: A Sustainable Approach Brunswick, Currituck and Pender Counties, North Carolina (Funded by North Carolina Sea Grant) Center for Sustainable
Real Estate Indicators Summary
 real estate 103 Real Estate Indicators Summary Housing Starts Date Value Change/Rate (%) Year-to-Date Year-Over-Year C hange October 2017 Geography 9,347 24.2% Calgary CMA Total Value of Building Permits
WARD 3 NEWS SAPRAE CREEK & DRAPER ROAD
 WARD 3 NEWS SAPRAE CREEK & DRAPER ROAD JANUARY 2012 Anzac~Conklin~Fort Chipewyan~Fort Fitzgerald~Fort MacKay~Gregoire Lake Estates~Janvier~Mariana Lake~Saprae Creek Estates 9909 Franklin Avenue, Fort McMurray,
JANVIER DENE WOOD BUFFALO CADET CORP
 DECEMBER 2015, Volume #6 Issue #12 JANVIER DENE WOOD BUFFALO CADET CORP On November 18th the Janvier Dene Wood Buffalo Cadet Corp program was re-launched in Janvier. With the assistance of the Community
DOREEN SUBURBPROFILE. Source: Resolution Research - The State of Victoria January 2015
 1 The City of Whittlesea is one of the fastest growing local government areas in Australia, with Doreen identified as one of the principal suburbs to cater for this growth. OVERVIEW Doreen is located approximately
5 Demography and Economy
 5 Demography and Economy Demography People have probably lived on Great Barrier Island (Aotea) since the 13 th century. There are few written observations about the number of Maori settled here but these
JATA Market Research Study Passenger Survey Results
 JATA Market Research Study Passenger Survey Results Prepared for the Jackson Area Transportation Authority (JATA) April, 2015 3131 South Dixie Hwy. Suite 545 Dayton, OH 45439 937.299.5007 www.rlsandassoc.com
Shantz Village. Development Summary November Steve Seiler, Senior Associate. Daniel Goldstrom, Partner
 A D U L T C O M M U N I T Y November 2017 45 Acre Mixed Use Development Staged Closing to 2021 35.55 Acres Net 10 Lots Zoned Fully Serviced Curb & Gutter 8.18 Acres 75 Adult Villas 7.87 Acres Supportive
Oregon 2009 Visitor Report June, 2010
 Oregon 2009 Visitor Report June, 200 Table of Contents Introduction...... 3 Methodology.. 4 U.S. Travel Market Size & Structure.. 5 Oregon s Travel Market Size & Structure...... Overnight Trip Detail............
OUTLOOK EAST LEPPINGTON
 OUTLOOK EAST LEPPINGTON A CONTEXT ON BUSINESS, CULTURE, LIFESTYLE AND RESIDENTIAL Located within the rapidly expanding South West Growth Centre of Sydney, the East Leppington Precinct is well positioned
MINING IN TASMANIA: DINOSAUR OR DELIVERER?
 MINING IN TASMANIA: DINOSAUR OR DELIVERER? PRESENTATION TO A FORUM HOSTED BY THE ACADEMY OF TECHNOLOGICAL SCIENCES AND ENGINEERING (ATSE) FOR NATIONAL SCIENCE WEEK RACV APARTMENT HOTEL, HOBART 3 RD AUGUST
RAY YENKANA Willowbrook Cr, Dawson Creek BC Canada $2,847,000
 1716 Willowbrook Cr, Dawson Creek BC Canada For SALE $2,847,000 This is a rare find, 32 townhomes in Dawson Creek, BC. Excellent investment in a single title multi family complex. Vendor has upgraded this
ARAGON BASIC DATA, 2018 Instituto Aragonés de Estadística
 22 ARAGON BASIC DATA, 218 Instituto és de Estadística POPULATION Population structure Population structure by age and sex, 217 Unit: persons. Both sexes Men Women % Both sexes Men Women % Total 1.38.75
POPULATION AND HOUSEHOLDS POPULATION HOUSEHOLDS HOUSING.
 POPULATION AND HOUSEHOLDS POPULATION HOUSEHOLDS HOUSING 22 ARAGON BASIC DATA, 217 Instituto és de Estadística POPULATION Population structure Population structure by age and sex, 216 Unit: persons. Both
CORNWALL VISITOR FREQUENCY SURVEY
 CORNWALL VISITOR FREQUENCY SURVEY Analysis and Report from PFA Research Ltd 2 nd December 2015 Authors: Robert Rush, Managing Director robert.rush@pfa-research.com Emma Lydon, Research & Marketing Consultant
2017 Citizen's Survey
 2017 Citizen's Survey Welcome to the 2017 City of Palm Coast Citizen's Survey It won t take much of your time to make a big difference! Please help us shape the future of Palm Coast and help make decisions
2010 El Paso Work Place Travel Survey Technical Summary
 2010 El Paso Work Place Travel Survey Technical Summary Prepared by the Texas A&M Transportation Institute June 2013 2010 El Paso Work Place Travel Survey TECHNICAL SUMMARY Texas Department of Transportation
Oregon 2011 Visitor Final Report
 Oregon 0 Visitor Final Report Table of Contents Introduction...... 3 Methodology.. U.S. Travel Market Size & Structure..... 5 Oregon Travel Market Size & Structure... Overnight Trip Detail............
Inverness, Culloden and Suburbs Settlement Economic Overview
 Strategic planning and research Economic information December 2007 Inverness, Culloden and Suburbs Settlement Economic Overview Summary Between 2001 and 2006, the population of Inverness, Culloden and
Let s Fly. Fort McMurray Airport Authority
 Let s Fly Fort McMurray Airport Authority The Largest Industrial Project in World History Canada s oil sands are found in three deposits the Athabasca, Peace River and Cold Lake deposits in Alberta and
CHRISTCHURCH, NEW ZEALAND CITY OF OPPORTUNITY
 CHRISTCHURCH, NEW ZEALAND CITY OF OPPORTUNITY 2ND LARGEST CITY IN NZ The largest city in the south island with a population of 375,000 COMPACT & ACCESSIBLE PARKS, SHOPPING PRECINCTS, WALKING AND BIKING
HOUSEHOLD TRAVEL SURVEY
 HOUSEHOLD TRAVEL SURVEY Household Travel Survey i TABLE OF CONTENTS Page 1.0 INTRODUCTION... 1 2.0 SUMMARY OF TRAVEL... 2 2.1 All-Day Travel Patterns... 2 2.1.1 Automobile Availability... 2 2.1.2 Trip
MARASCO PLAZA NORTH VERSAILLES
 MARASCO PLAZA NORTH VERSAILLES 600 EAST PITTSBURGH MCKEESPORT BLVD NORTH VERSAILLES, PA 15137 Andreas Kamouyerou Associate Advisor 412.535.8062 Andreas.Kamouyerou@svn.com Bryan J. McCann Advisor 412.535.8061
County of Dufferin Economic Development Strategy and Action Plan
 County of Dufferin Economic Development Strategy and Action Plan Strategic Plan Background Report Information for Those Involved in Stakeholder Consultations About the Dufferin County Economic Development
Industry and occupation of population in Montenegro
 MONTENEGRO STATISTICAL OFFICE R E L A S E 197 No Podgorica, 20 July 2012 Name the source when using the data Industry and occupation of population in Montenegro Census of Population, Households, and Dwellings
The Economic Base of Colfax County, NM. PREPARED BY: The Office of Policy Analysis at Arrowhead Center, New Mexico State University.
 The Economic Base of Colfax County, NM PREPARED BY: The Office of Policy Analysis at Arrowhead Center, New Mexico State University DATE: July 2016 The Economic Base of Colfax County, New Mexico Introduction
Commuting patterns in Wellington
 Commuting patterns in Wellington Highlights In 2006, 1 of 10 employed people in New Zealand worked in one of the four cities of the Wellington region (Porirua, Upper Hutt, Lower Hutt, and Wellington),
The Economic Impact of Tourism in Walworth County, Wisconsin. July 2013
 The Economic Impact of Tourism in Walworth County, Wisconsin July 2013 Key themes for 2012 The Walworth County, Wisconsin visitor economy continued its brisk growth in 2012. Visitor spending rose 11% after
East Dunbartonshire Area Profile
 East Dunbartonshire Area Profile May 2014 Contents Executive Summary.. page 3 Introduction.. page 6 Population page 7 Age Structure. page 9 Population Projections page 11 Life Expectancy page 12 Ethnicity.
CITY OF VIRGINIA BEACH
 DIRECTOR OF ECONOMIC DEVELOPMENT CITY OF VIRGINIA BEACH We are seeking an innovative executive to lead the City of Virginia Beach s economic development strategies into an exciting future of growth and
directory YMCA CHILD DEVELOPMENT PROGRAMS FAMILY & COMMUNITY SUPPORT SERVICES City Hall, 9909 Franklin Ave., Fort McMurray
 RMWB COMMUNITY SERVICES FAMILY & COMMUNITY SUPPORT SERVICES City Hall, 9909 Franklin Ave., Fort McMurray www.joinhands.ca Children & Youth Services 780.743.7917 Community Development 780.743.7948 Community
Employment characteristics of UK tourism industries in 2008
 Employment characteristics of UK tourism industries in 2008 Eddie Smith, Dominic Webber and Sean White Tourism Intelligence Unit, Office for National Statistics Summary This article uses an analysis of
Central Highlands Regional Population Forum
 Central Highlands Regional Population Forum, Emerald, 18 February 25 Central Highlands Regional Population Forum Presenters: Alison Taylor and Ross Barker Planning Information and Forecasting Unit Department
THE SENSIBLE ROCKY MOUNTAIN INVESTMENT CHOICE.
 THE SENSIBLE ROCKY MOUNTAIN INVESTMENT CHOICE 1 2 THE SENSIBLE ROCKY MOUNTAIN INVESTMENT CHOICE BIG MOUNTAINS. BIG BUSINESS. BIG OPPORTUNITY. Sparwood, BC is yours and mine. We may be known as that town
Table of Contents TABLE OF CONTENTS. HOW THIS BY-LAW WORKS... i PART 1 - ADMINISTRATION, INTERPRETATION, ENFORCEMENT, AND DEFINITIONS
 TABLE OF CONTENTS Page Number HOW THIS BY-LAW WORKS... i PART 1 - ADMINISTRATION, INTERPRETATION, ENFORCEMENT, AND DEFINITIONS 1.1 ADMINISTRATION, INTERPRETATION AND ENFORCEMENT... 1.1 ~ 1 to 6 1.1.1 Within
The ABC s of Nature- Based Tourism Fermata Inc. All Rights Reserved
 Louisiana Rural Sustainable Tourism Nature Development Tourism Strategies Conference OCTOBER 23, 2003 The ABC s of Nature- Based Tourism 2003 Fermata Inc. All Rights Reserved Mary Jeanne Packer Chief Operating
The Travel and Tourism Industry in Vermont. A Benchmark Study of the Economic Impact of Visitor Expenditures on the Vermont Economy 2005
 The Travel and Tourism Industry in Vermont A Benchmark Study of the Economic Impact of Visitor Expenditures on the Vermont Economy 2005 INTRODUCTION GENERAL November, 2006 This 2005 update of the original
Chapter 1: The Population of NHS Greater Glasgow and Clyde
 Population Estimate (thousands) Chapter 1: The Population of NHS Greater Glasgow and Clyde Population Trends and Projections National Records of Scotland estimated (NRS SAPE) 1 the 2013 NHS Greater Glasgow
This section of the Plan provides a general overview of the Smoky Mountain Region. It consists of the following four subsections:
 SECTION 3 COMMUNITY PROFILE This section of the Plan provides a general overview of the Smoky Mountain Region. It consists of the following four subsections: 3.1 Geography and the Environment 3.2 Population
Baggage Fees User Guide and Codebook. Angus Reid Institute
 Baggage Fees 2014 User Guide and Codebook Angus Reid Institute User Guide compiled by: Data Services, Academic Services Queen s University Library 2016 Table of Contents Introduction... 2 Metadata... 2
The Hume Workforce Development Committee
 The Hume Workforce Development Committee Hume Regional Development Australia Accommodation and Food Labour Market Snapshot Workforce Planning Australia March 2012 Workforce Planning Australia - www.workforceplanning.com.au
ANALYSIS OF THE KĀPITI COAST ECONOMY
 ANALYSIS OF THE KĀPITI COAST ECONOMY Final Report Evidence Base November 2017 CONTENTS Introduction 1 Kāpiti Coast region 2 Kāpiti Coast Economy 11 Kāpiti Coast sectors 28 kāpiti Coast Infrastructure
2009 Muskoka Airport Economic Impact Study
 2009 Muskoka Airport Economic Impact Study November 4, 2009 Prepared by The District of Muskoka Planning and Economic Development Department BACKGROUND The Muskoka Airport is situated at the north end
Population growth highlights and trends. the Wide Bay - Burnett Region 2005
 Population growth highlights and trends the Wide Bay - Burnett Region 2005 Minister s Message Welcome to the 2005 edition of Population growth highlights and trends, Wide Bay Burnett Region. This report
The Economic Impact of Tourism in North Carolina. Tourism Satellite Account Calendar Year 2013
 The Economic Impact of Tourism in North Carolina Tourism Satellite Account Calendar Year 2013 Key results 2 Total tourism demand tallied $26 billion in 2013, expanding 3.9%. This marks another new high
The Economic Impact of Tourism in Jacksonville, FL. June 2016
 The Economic Impact of Tourism in Jacksonville, FL June 2016 Highlights Visitor spending surpassed $2.0 billion in 2015, growing 4.4%. As this money flowed through Duval County, the $2.0 billion in visitor
Focus on the Future. Enabling Growth. Or Just Keeping Up
 Focus on the Future Enabling Growth. Or Just Keeping Up HOUSTON A MODERN/GLOBAL CITY HOUSTON What makes It Tick? Energy Value of US $ Trends in US Economy Medical Center International Trade Technology