Puerto Ricans in Massachusetts, the United States, and Puerto Rico, 2014
|
|
|
- Felicia Watkins
- 6 years ago
- Views:
Transcription
1 Issued April 2016 Centro DS2016US-07 Puerto Ricans in Massachusetts, the United States, and Puerto Rico, 2014 In 2014, Massachusetts was the fifth state with most Puerto Ricans in the United States. In 2014, the Puerto Rican population in Massachusetts was 4.6% of the state s total population. This represents an increase when compared to the years 2000 (3.1%) and 2010 (4.1%). Puerto Ricans were the largest national origin group among Latinos, accounting for 42% of Latinos in the state. Findings from an examination of recently released Census Bureau data for 2014 reveal that: The employment rate of Massachusetts Puerto Ricans was 48.5%, almost six percentage points below the stateside Puerto Rican rate of 54.4%. Puerto Ricans in Massachusetts had an unemployment rate of 16.5%, higher than the stateside Puerto Rican average of 11.6%, but below the 18.9% unemployment rate in Puerto Rico. Labor force participation among Massachusetts Puerto Ricans was 58.2%, below the stateside Puerto Rican average of 62.4%, and over fifteen percentage points more than the Puerto Rican labor force participation rate of 43.7%. The average earnings of full-time, year-round Massachusetts Puerto Ricans ($43,027 for men and $39,546 for women) were lower than for stateside Puerto Ricans ($50,756 for men and $42,263 for women). Earnings for Puerto Ricans in Massachusetts were higher than for those in Puerto Rico, where full-time, year-round men in 2014 earned $32,512 and women earned $29,166 on average. Puerto Ricans in Massachusetts possessed $4.1 billion in purchasing power, just under 5% of the total $97.2 billion stateside Puerto Rican purchasing power. From an economic perspective, stateside Puerto Ricans represented 72.3% of the $134.5 billion total purchasing power of the Puerto Rican community. The level of educational attainment for Puerto Ricans in Massachusetts was lower than for U.S Puerto Ricans as a whole, as well as those on the island. In Massachusetts, only 10.6% of Puerto Ricans 25 years and older had attained a bachelor s degree or higher, compared to 17.6% of all stateside Puerto Ricans and 24.1% of Puerto Ricans in Puerto Rico. These differences in educational attainment were also reflected in the disproportionate share of Puerto Ricans without high school diplomas, 36.6% in Massachusetts, more than ten percentage points over the overall stateside proportion of 22.6% and the proportion of 26% in Puerto Rico. Only 16% of male Puerto Ricans in Massachusetts worked in the higher-earning occupations in the management, business, science, and arts sector, compared to 23.4% and 23.9% among stateside Puerto Ricans and Puerto Ricans in Puerto Rico, respectively. Less than three in ten Puerto Rican women in Massachusetts (26.3%) worked in this higher paying sector, compared to four out of ten (39.7%) in Puerto Rico. Massachusetts Puerto Ricans have a younger age distribution when compared to all stateside Puerto Ricans, with a median age of 26.8 years compared to the 28.9 year median age of all Puerto Ricans in the U.S. The median age of those in Puerto Rico was 38.9 years. A higher proportion of Massachusetts Puerto Rican households were bilingual (72.8%) than among all Puerto Ricans in the U.S. (61.2%). One in four Puerto Ricans in Massachusetts (24.8%) reported speaking English less than very well, a proportion higher than among all stateside Puerto Ricans (17.3%).
2 The rate of poverty was notably higher among Puerto Ricans in Massachusetts with 38.3% of all Puerto Ricans in the state living in poverty compared to 26.2% among all stateside Puerto Ricans. Overall the poverty rate is much higher in Puerto Rico at 46.6%. The proportion of households receiving cash public assistance income was higher (11.1%) for Puerto Ricans in Massachusetts when compared to other stateside Puerto Ricans (6.9%) or Puerto Ricans in Puerto Rico (8.1%). More than half (55.1%) of Massachusetts Puerto Ricans reported participating in the Supplemental Nutrition Assistance Program (SNAP), compared to less than a third (31.5%) of all stateside Puerto Ricans and 39.7% of Puerto Ricans in Puerto Rico. Per capita income for Puerto Ricans in Massachusetts ($13,346) was 20% higher than Puerto Ricans in Puerto Rico ($10,960), but 28% below the average stateside Puerto Rican per capita income ($18,457). Generally, Puerto Ricans in Massachusetts earned more, experienced less poverty, and were younger than Puerto Ricans in Puerto Rico despite a lower average educational attainment. However, Puerto Ricans in Massachusetts earned less and experienced higher poverty rates when compared to all stateside Puerto Ricans. Massachusetts has one of the most diverse Latino populations in the country. The Latino population in Massachusetts grew from 6.8% of the state s total population in 2000 to 10.8% in Puerto Ricans constitute the largest national-origin Latino group (42.2% of total Latino population), fol- Graph 1.A: Latino Population, Massachusetts,2014 South American 10.6% Other 4% Mexican 5.4% Central American Dominican Republic 17.8% 18.3% 42.2% Puerto Rican Cuban 1.7% Table 1. Puerto Rican and Latino Population in Massachusetts Total 6,349, % 6,547, % 6,745, % Not Hispanic or Latino 5,920, % 5,919, % 6,015, % Hispanic or Latino 428, % 627, % 730, % Mexican 22, % 38, % 39, % Puerto Rican 199, % 266, % 308, % Cuban 8, % 11, % 12, % Dominican Republic 49, % 103, % 133, % Central American 38, % 96, % 130, % South American 28, % 54, % 77, % Other 82, % 57, % 29,261 4% Sources: U.S. Census Bureau, Census 2000 Summary File 1, 2010 Census. Summary File 1, and 2014 American Community Survey 1-Year Estimates 2

3 lowed by Dominicans (18.3%). Central Americans accounted for 17.8% of the Latino population. The Puerto Rican population in Massachusetts grew by more than 40%, while the Latino population in the state grew by 70% between 2000 and The median age of Puerto Ricans in Massachusetts for the year 2014 was 26.8 years, which was 2.1 years lower than the median age for stateside Puerto Ricans of 28.9 and 12.1 years lower than the 38.9 median age in Puerto Rico. These differences in the age structure were evident in the percent of the population older than 62 years of age: 7% of Puerto Ricans in Massachusetts, which was lower than among stateside Puerto Ricans (9.9%) in this age group. With 21% Graph 2.A: Puerto Rican Educational Attainment, 25 Years and Over Bachelor s degree or higher Some college or associate s degree High school graduate (includes equivalency) Less than high school diploma 10.4% 21.5% 31.5% 17.6% 30% 29.7% 24.1% 21.6% 28.2% 36.6% 22.6% 26% MASSACHUSETTS UNITED STATES PUERTO RICO Table 2. Age, Education, and Language Puerto Ricans 2014 Massachusetts United States Puerto Rico* TOTAL POPULATION 308,028 5,266,738 3,404,122 Median age (years) years and over 7% 9.9% 21% EDUCATIONAL ATTAINMENT Population 25 years and over Less than high school diploma 36.6% 22.6% 26% High school graduate (includes equivalency) 31.5% 29.7% 28.2% Some college or associate s degree 21.5% 30% 21.6% Bachelor s degree or higher 10.4% 17.6% 24.1% Male, bachelor s degree or higher 7.6% 15.6% 19.6% Female, bachelor s degree or higher 12.9% 19.5% 28.1% LANGUAGE SPOKEN AT HOME AND ABILITY TO SPEAK ENGLISH Population 5 years and over English only 27.2% 38.8% 5.3% Language other than English 72.8% 61.2% 94.7% Speak English less than very well 24.8% 17.3% 78.8% Source: U.S. Census Bureau, 2014 American Community Survey 1-Year Estimates * Puerto Ricans only 3
4 of the population 62 years of age or older, Puerto Rico had three times the percentage of its population aged 62 and older when compared to Puerto Ricans in Massachusetts. Puerto Ricans in Massachusetts had different English fluency indicators than stateside Puerto Ricans. In Massachusetts, 27.2% of the population reported speaking only English at home, compared to 38.8% of stateside Puerto Ricans. One in four Puerto Ricans (24.8%) in Massachusetts reported speaking English less than very well, more than the one in six average (17.3%) among stateside Puerto Ricans. Puerto Ricans in Massachusetts had a significantly lower level of educational attainment, indicated by the low proportion of Puerto Ricans over the age of 25 holding a bachelor s degree or higher, 10.4%. This proportion was less than half of that of Puerto Ricans in Puerto Rico holding bachelor s degrees or above (24.1%). Among stateside Puerto Ricans this figure was 17.6%. Another indicator of lower educational attainment among Massachusetts Puerto Ricans is the higher proportion of adults over age 25 without high school diplomas (36.6%) compared to the stateside average (22.6%) and island average (26%). The data by major occupational category indicated that the structure of Puerto Rican employment in Massachusetts differed from that of other stateside Puerto Ricans and those in Puerto Rico. In Massachusetts the proportion of Puerto Rican males (16%) and females (26.3%) working in management, business, science, and arts was lower than among all stateside Puerto Ricans (23.4% and 33.1%, respectively) and those in Puerto Rico (23.9% and 39.7%, respectively). Puerto Ricans in Massachusetts also showed Table 3. Employment and Occupations 4 Puerto Ricans 2014 Massachusetts United States Puerto Rico* EMPLOYMENT STATUS Population 16 years and over In labor force 58.2% 62.4% 43.7% Civilian labor force 58.1% 61.6% 43.7% Employed 48.5% 54.4% 35.4% Unemployed 16.5% 11.6% 18.9% Not in labor force 41.8% 37.6% 56.3% Armed Forces 0% 0.8% 0% OCCUPATION Civilian employed population 16 years and over Male 51,388 1,058, ,762 Management, business, science, and arts 16% 23.4% 23.9% Service occupations 29.8% 22.5% 23% Sales and office occupations 18.6% 19.6% 21.3% Construction and maintenance 9.5% 13.8% 18% Production, transportation, and moving 26.1% 20.7% 13.7% Female 52, , ,356 Management, business, science, and arts 26.3% 33.1% 39.7% Service occupations 34.7% 24.4% 16.6% Sales and office occupations 29.4% 35.7% 38.3% Construction and maintenance 0.4% 0.6% 0.6% Production, transportation, and moving 9.2% 6.2% 4.8% CLASS OF WORKER Civilian employed population 16 years and over Private wage and salary workers 85.1% 82% 69% Government workers 11.5% 14.8% 22.5% Self-employed workers in own not incorporated business 3.2% 3.1% 8.3% VETERAN STATUS Civilian population 18 years and over Civilian veteran 2.3% 6% 3.3% Source: U.S. Census Bureau, 2014 American Community Survey 1-Year Estimates * Puerto Ricans only
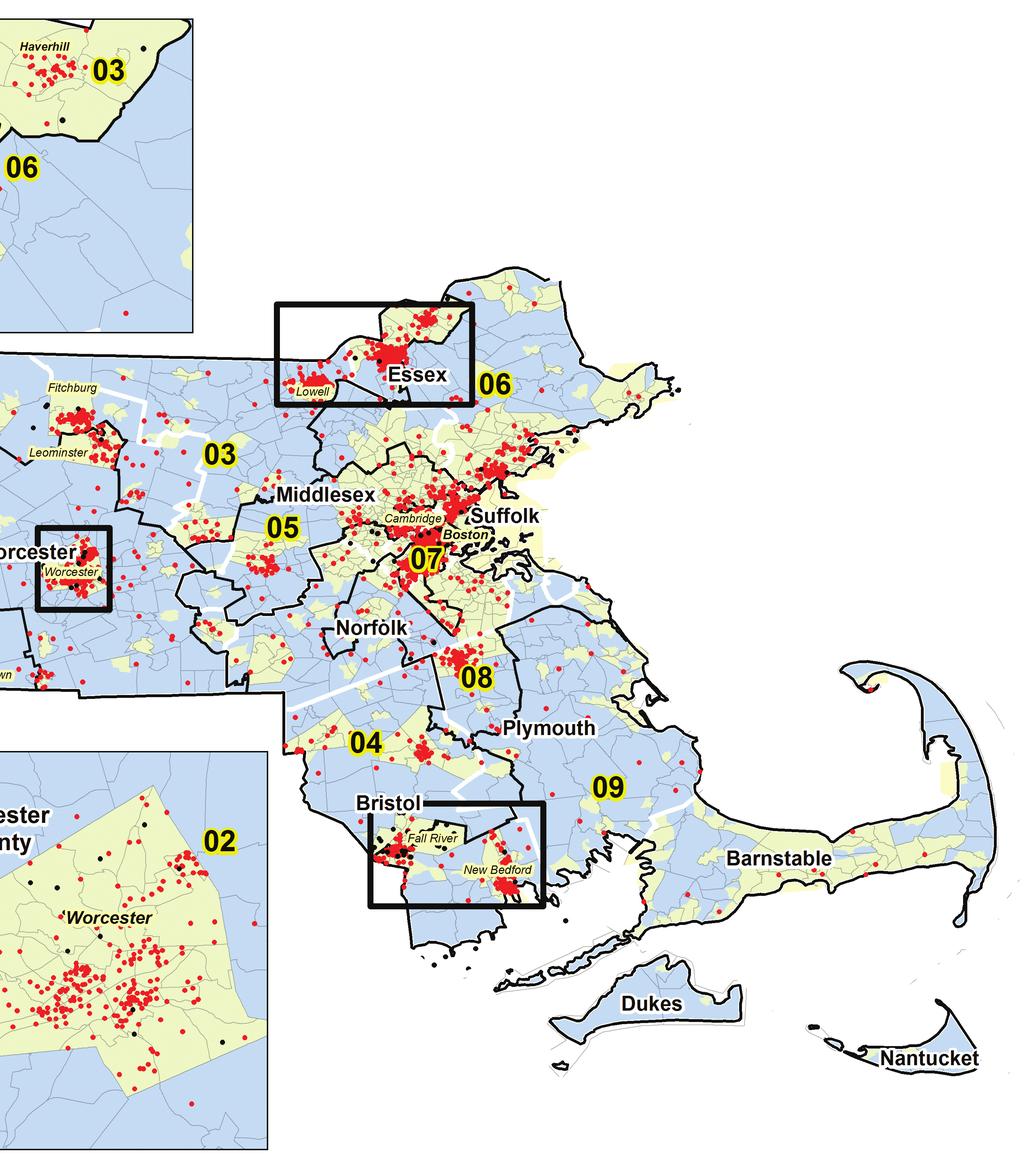
5 Puerto Rican Population by Counties in Massachusetts, 2014 Close to a third (30.6%) of all Massachusetts Puerto Ricans resided in Hampden County with high numbers in the cities of Springfield and Holyoke. Worcester County accounted for another 15.9% of Massachusetts Puerto Ricans, the majority of which were found in or near the city of Worcester. Suffolk and Essex Counties, both included in the Boston metropolitan area, accounted for a combined 25.7% of all Massachusetts Puerto Ricans. Puerto Ricans were proportionately underrepresented in all other counties including Middlesex County, which accounted for only 11.4% of Massachusetts Puerto Ricans compared to 23.1% of all Massachusetts residents. The sharpest difference between Puerto Ricans and other Latinos were in Hampden County where Puerto Ricans accounted for close to 90% of all Latinos in the county, and in Suffolk and Essex Counties which had higher proportions of non-puerto Rican Latinos. COUNTY Puerto Rican Population % Latino Population % Total Population % Hampden County 86, % 103, % 466,447 7% Worcester County 45, % 80, % 806, % Suffolk County 37, % 156, % 747, % Essex County 35, % 133, % 757, % Middlesex County 32, % 108,884 16% 1,539, % Bristol County 22, % 35, % 551, % Plymouth County 8, % 17, % 500, % Norfolk County 8, % 25, % 682, % Hampshire County 3, % 8, % 160, % Berkshire County 1, % 4, % 130,064 2% Barnstable County 1, % 5, % 215, % Franklin County 1, % 2, % 71, % Nantucket County 116 0% % 10, % Dukes County 12 0% 63 0% 16, % Total 284, % 681, % 6,657, % Sources: U.S. Census Bureau 2014 American Community Survey 5-Year Estimates Notes: Total counts for populations may differ depending on whether the estimates are derived from the five-year estimates or the one-year estimates of the American Community Survey. 5


6 PUERTO RICAN POPULATION BY COUNTIES IN MASSACHUSETTS, 2014 PUERTO RICAN POPULATION 1 dot = PUERTO RICAN ARRIVALS 1 dot = 100 BOUNDARIES County City/Towns Census Tracts CONGRESSIONAL DISTRICT Republican Democrat 6

7 7


8 PUERTO RICAN POPULATION BY COUNTIES IN MASSACHUSETTS, 2014 PUERTO RICAN POPULATION 1 dot = PUERTO RICAN ARRIVALS 1 dot = 100 BOUNDARIES County City/Towns Census Tracts CONGRESSIONAL DISTRICT Republican Democrat 8
9 a greater proportion in production, transportation, and material moving occupations (17.6%) than the stateside Puerto Rican average (13.7%) or that of Puerto Ricans in Puerto Rico (9.5%). The employment rate for Puerto Ricans in Massachusetts (48.5%) was lower than stateside Puerto Ricans overall (54.4%), as was their rate of labor force participation (58.2% and 62.4%, respectively). The employment rate of Massachusetts and stateside Puerto Ricans was between thirteen and nineteen percentage points higher than in Puerto Rico (35.4%). In 2014, the unemployment rate among Puerto Ricans in Massachusetts was 16.5%, more than two percentage points below Puerto Rico s unemployment rate of 18.9% and 4.9 percentage points above the stateside average of 11.6%. Average earnings of full-time, year-round Puerto Ricans in Massachusetts were $43,027 for men and $39,543 for women, lower than the stateside averages of $50,756 for men and $42,253 for women. Despite the average lower income when compared to all stateside Puerto Ricans, average earnings for Puerto Ricans in Massachusetts were higher than those in Puerto Rico, where men averaged $32,512 and women averaged $29,166 in earnings. The earnings gap between men and women was lower in Massachusetts and Puerto Rico, both less than $3,500, when compared to the stateside gender earnings gap among Puerto Ricans of about $8,500. Household and family incomes are important indicators of economic well-being. These indicators were lower for Puerto Ricans in Massachusetts than for stateside Puerto Ricans, and slightly higher than in the island. Median household Table 4. Income and Earnings 2014 Puerto Ricans Massachusetts United States Puerto Rico* INCOME IN THE PAST 12 MONTHS (IN 2013 INFLATION-ADJUSTED DOLLARS) Households 97,301 1,635,808 1,175,297 Median household income (dollars) $24,983 $39,322 $18,710 With earnings 68.3% 76.9% 54.7% Mean earnings (dollars) $48,194 $61,065 $36,407 With Social Security income 24.7% 24.1% 43.2% Mean Social Security income (dollars) $10,447 $13,727 $12,159 With Supplemental Security Income 25.9% 12.6% 0.4% Mean Supplemental Security Income (dollars) $9,010 $8,780 $10,025 With cash public assistance income 11% 6.9% 8.1% Mean cash public assistance income (dollars) $4,079 $3,441 $2,316 With retirement income 3.9% 10.1% 15.6% Mean retirement income (dollars) $18,728 $20,452 $15,387 With Food Stamp/SNAP benefits 55.1% 31.5% 39.7% Families 64,099 1,114, ,807 Median family income (dollars) $27,527 $44,499 $22,220 Married-couple family 37.5% 53.9% 56.1% Median income (dollars) $50,411 $67,129 $29,417 Male householder, no spouse present 11.2% 10.2% 9.5% Median income (dollars) $31,372 $37,513 $17,797 Female householder, no husband present 51.3% 35.9% 34.4% Median income (dollars) $20,697 $23,957 $13,554 Individuals 308,028 5,266,738 3,404,122 Per capita income (dollars) $13,346 $18,457 $10,960 Mean earnings (dollars) for full-time, year-round workers: Male $43,027 $50,756 $32,512 Female $39,543 $42,263 $29,166 Source: U.S. Census Bureau, 2014 American Community Survey 1-Year Estimates * Puerto Ricans only 9


10 income was $24,983 for Puerto Ricans in Massachusetts and $39,322 for other stateside Puerto Ricans, but lower for the island at $18,710. There were also differences in the per capita income. In 2014, per capita income for Puerto Ricans in Massachusetts was $13,346 and $18,457 for other stateside Puerto Ricans, but only $10,960 for the island. Puerto Ricans in Massachusetts, had $4.1 billion in purchasing power. From an economic perspective, stateside Puerto Ricans represented 72.3% of the $134.5 billion total purchasing power of the entire Puerto Rican population, whether in the United States or in Puerto Rico, in the year Purchasing power is defined simply as per capita income multiplied by the Puerto Rican population. Stateside Puerto Ricans had 2.6 times the total purchasing power of Puerto Ricans in Puerto Rico of $37.3 billion. A higher proportion of Puerto Rican families in Massachusetts fall under the poverty rate (34.2%) than among stateside Puerto Rican families overall (22.7%). Despite the higher rate of poverty in Massachusetts, it is still below the island Puerto Rican proportion of 42.8%. Although this hierarchy of poverty rates is observed in almost all subgroups the poverty rates among families with female householders and children are alarmingly high in Massachusetts at 55.4%, among stateside Puerto Ricans at 49.7%, and in Puerto Rico at 69.7%. These are inordinately high poverty rates by any measure or comparative context. In 2014, the proportion of households that received cash public assistance income was 11% for Puerto Ricans in Massachusetts, 6.9% for other stateside Puerto Ricans, and 8.1% in Puerto Rico. In other words, a higher percentage of Puerto Ricans families in Massachusetts received public assistance than in Puerto Rico. In addition, the average amount of money that the households received by public assistance were higher for Puerto Ricans in Massachusetts ($4,079) when compared to the amount received in Puerto Rico ($2,316). The propor- Graph 4.A: Mean Earnings for Full-Time, Year-Round Puerto Rican Workers $60,000 Male Female $45,000 $30,000 $15,000 0 MASSACHUSETTS UNITED STATES PUERTO RICO Graph 4.B: Puerto Rican Purchasing Power, in Billions, 2014 MASSACHUSETTS $4.1 PUERTO RICO $37.3 $93.1 OTHER UNITED STATES 10
11 tion of Puerto Rican households in Massachusetts receiving benefits through the Supplemental Nutrition Assistance Program (SNAP) was 55.1% in 2014, 23.6 percentage points higher than the 31.5% rate for Puerto Rican households in the U.S. as a whole and 15.4 percentage points higher than the 39.7% for Puerto Rico. The available data suggests that Puerto Ricans living in Massachusetts received in a higher proportion and higher amounts in welfare benefits than their counterparts in Puerto Rico, even though Puerto Ricans in Massachusetts exhibit lower poverty rates than in Puerto Rico. Graph 5.A: Poverty Rates Massachusetts United States Puerto Rico 34.2% 42.8% 40.8% 29.5% 53.9% 46.8% 42.4% 59.6% 55.4% 49.7% 69.7% 22.7% All families All families with related children under 18 years Female householder, no husband present Female householder with related children under 18 years Table 5. Poverty 2014 Puerto Ricans Massachusetts United States Puerto Rico* POVERTY RATES All families 34.2% 22.7% 42.8% With related children under 18 years 40.8% 29.5% 53.9% With related children under 5 years only 28.1% 24.6% 57.1% Married-couple family 18.5% 9.7% 30.9% With related children under 18 years 16.5% 11.3% 35.5% With related children under 5 years only 5.9% 5.9% 33.9% Female householder, no husband present, family 46.8% 42.4% 59.6% With related children under 18 years 55.4% 49.7% 69.7% With related children under 5 years only 47.8% 49.4% 75.7% All people 38.3% 26.2% 46.6% Under 18 years 46% 33.4% 58.7% Related children under 18 years 45.9% 33.1% 58.6% Related children under 5 years 50.2% 34.7% 62.8% Related children 5 to 17 years 44.2% 32.4% 57.3% 18 years and over 34.3% 22.8% 43.2% 18 to 64 years 33.3% 22.8% 43.8% 65 years and over 45.5% 22.4% 41% People in families 35% 23.6% 44.6% Unrelated individuals 15 years and over 52.2% 38.5% 58.6% Source: U.S. Census Bureau, 2014 American Community Survey 1-Year Estimates * Puerto Ricans only 11
12 Housing is a primary determinant of the cost of living. In general, the Northeast has a higher cost of home ownership than the South or other parts of the country. The median value of owner-occupied housing for Puerto Ricans in Massachusetts was $213,300, compared to $175,900 for other stateside Puerto Ricans, and $119,500 in Puerto Rico. The median monthly owner costs with a mortgage were $1,658 for Puerto Ricans in Massachusetts and $1,545 for other stateside Puerto Ricans. A comparable cost was $873 in Puerto Rico. These relative prices and ownership costs, along with income levels, were reflected in home ownership rates. Puerto Ricans in Massachusetts had lower rates of home ownership than Puerto Ricans in Puerto Rico or even among other stateside Puerto Ricans. Puerto Ricans in Massachusetts had a 17% rate of owner-occupied housing units, while the comparable rate for stateside Puerto Ricans was twice as high (36%). The home ownership rate in Puerto Rico was much higher, at 68.7%. Among Puerto Ricans in Massachusetts, housing costs were relatively higher than for other Puerto Ricans in the United States. Puerto Ricans in Massachusetts had higher median costs associated with home ownership ($1,658) than stateside Puerto Rican median homeownership costs ($1,545) and those in Puerto Rico ($873). Table 6. Housing and Health Insurance 2014 Puerto Ricans HOUSING Massachusetts United States Puerto Rico* Owner-occupied housing units 17% 36% 68.7% Monthly owner costs as a percentage of household income in the past 12 months Less than 30 percent 67.8% 62.8% 52.6% 30 percent or more 32.2% 37.2% 47.4% Owner-occupied housing units Median value (dollars) $213,300 $175,900 $119,500 Median selected monthly owner costs with a mortgage (dollars) HEALTH INSURANCE COVERAGE Civilian noninstitutionalized population $1,658 $1,545 $873 With private health insurance 33% 51.6% 38% With public coverage 68.1% 43.5% 62.9% No health insurance coverage 4.4% 11.5% 5.5% Source: U.S. Census Bureau, 2014 American Community Survey 1-Year Estimates * Puerto Ricans only The Center for Puerto Rican Studies (Centro) is the nation s leading university-based institution devoted to the interdisciplinary study of the Puerto Rican experience in the United States. Centro is dedicated to understanding, preserving, and sharing the Puerto Rican experience in the United States. The Centro Library and Archives is devoted to collecting, preserving, and providing access to resources documenting the history and culture of Puerto Ricans. The Centro Library and Archives was established in 1973 as a component of the Center for Puerto Rican Studies. The collections include books, current and historic newspapers and periodicals, audio, film and video, manuscripts, photographs, art prints, and recorded music. The Library and Archives provides services and programs to the scholarly community as well as the general public. Constituents are diverse and come from the United States and abroad. The Library and Archives facilitates access to information on its holdings through the City University s online public catalog or CUNY+. It also provides research and information assistance via phone and . Centro Library and Archives Silberman Building, 2180 Third Avenue at 119th Street, Room 121, New York, N.Y Library: Archives: centropr.hunter.cuny.edu Follow Hunter College, The City University of New York 695 Park Avenue, E1429, New York, N.Y Voic Fax: Center for Puerto Rican Studies Hunter College, CUNY 695 Park Avenue New York, NY , centropr.hunter.cuny.edu
Puerto Ricans in Ohio, the United States, and Puerto Rico, 2014
 Issued April 2016 Centro DS2015US-12 Puerto Ricans in Ohio, the United States, and Puerto Rico, 2014 In 2014, Ohio had the tenth largest number of Puerto Ricans in the United States with 108,174 residents,
Puerto Ricans in Connecticut, the United States, and Puerto Rico, 2014
 Issued April 2016 Centro DS2016US-8 Puerto Ricans in Connecticut, the United States, and Puerto Rico, 2014 In 2014, Connecticut was the 6th state with most Puerto Ricans (301,182) in the United States.
Puerto Ricans in Rhode Island, the United States, and Puerto Rico, 2013
 Issued September 2016 Centro DS2015US-07 Puerto Ricans in Rhode Island, the United States, and Puerto Rico, 2013 In 2013 an estimated 36,217 Puerto Ricans lived in Rhode Island and accounted for at least
Puerto Ricans in Georgia, the United States, and Puerto Rico, 2014
 Issued September 2016 Centro DS2014GA-14 Puerto Ricans in Georgia, the United States, and Puerto Rico, 2014 In 2014, an estimated 89,462 Puerto Ricans lived in Georgia and accounted for 1.7 percent of
Puerto Rican Entrepreneurship in the U.S.
 Puerto Rican Entrepreneurship in the U.S. Research Brief issued April 2017 By: Jennifer Hinojosa Centro RB2016-14 Puerto Rican entrepreneurs were the fastest growing business firms in the U.S. According
PROFILE OF THE PUERTO RICAN POPULATION IN UNITED STATES AND PUERTO RICO: 2008
 PROFILE OF THE PUERTO RICAN POPULATION IN UNITED STATES AND PUERTO RICO: 2008 Sonia G. Collazo, Camille L. Ryan, Kurt J. Bauman U.S. Census Bureau Housing and Household Economic Statistics Division This
part one: comparing puerto ricans
 part one: comparing puerto ricans snapshot: puerto ricans across major us metro areas This section uses data from the 2010 American Community Survey one-year estimates to examine the socioeconomic characteristics
T H E VILLAGE OF P h i l m o n t, N Y
 T H E VILLAGE OF P h i l m o n t, N Y Summit Reservoir Area Plan November 17, 2014 Executive Steering Committee Meeting 2 Agenda 1:00 1. Welcome 2. Housekeeping & updates i. Committee contact list review
Devonport-Takapuna Local Board Profile
 Devonport-Takapuna Local Board Profile - Initial results from the Census February 2014 Social and Economic Research Team Research, Investigations and Monitoring Unit Auckland Council Map of Devonport-Takapuna
Demographic Profile 2013 census
 Demographic Profile 2013 census This profile provides basic population and demographic information on the residents of the Hauraki District. Population and demographic information is important for targeting
Post-Hurricane Maria Exodus from Puerto Rico and School Enrollment in Florida
 Post-Hurricane Maria Exodus from Puerto Rico and School Enrollment in Florida Research Brief Issued December 2017 By: Edwin Meléndez, Jennifer Hinojosa, and Nashia Roman centro RB2017-02 Hurricane Maria
SYNOPSIS OF INFORMATION FROM CENSUS BLOCKS AND COMMUNITY QUESTIONNAIRE FOR TONOPAH, NEVADA
 TECHNICAL REPORT UCED 93-04 SYNOPSIS OF INFORMATION FROM CENSUS BLOCKS AND COMMUNITY QUESTIONNAIRE FOR TONOPAH, NEVADA UNIVERSITY OF NEVADA, RENO i Synopsis of Information from Census Blocks and Community
A COMPARISON OF THE MILWAUKEE METROPOLITAN AREA TO ITS PEERS
 KRY/WJS/EDL #222377 (PDF: #223479) 1/30/15 PRELIMINARY DRAFT Memorandum Report A COMPARISON OF THE MILWAUKEE METROPOLITAN AREA TO ITS PEERS EXECUTIVE SUMMARY This memorandum report provides a statistical
Regional Universities Network. Introduction. Regional Universities Network. Economic Impact of the Universities in the Regional Universities Network
 Regional Universities Network Economic Impact of the Universities in the Regional Universities Network Introduction The Regional Universities Network (RUN) is a network of six universities with headquarters
Philmont, New York Contents
 Philmont, New York Contents Philmont, New York... 1 Overview... 2 Surrounding Area... 3 Development of Philmont... 3 Transportation Access... 5 Topography... 5 Water Resources... 5 Demographics... 7 Population...
2016 ANNUAL REPORT. Report Data
 Massachuset ts Office of Travel & Tourism 2016 ANNUAL REPORT Published May 2017 Charlie Baker Governor Karyn Polito Lt. Governor Jay Ash Secretary Executive Office of Housing and Economic Development Report
Barbadians. imagine all the people. Barbadians in Boston
 Barbadians imagine all the people Barbadians in Boston imagine all the people is a series of publications produced by the Boston Redevelopment Authority for the Mayor s Office of Immigrant Advancement.
2017 ANNUAL REPORT. Report Data
 Massachuset ts Office of Travel & Tourism 2017 ANNUAL REPORT Published April 2018 Charlie Baker Governor Karyn Polito Lt. Governor Jay Ash Secretary Executive Office of Housing and Economic Development
October Dear Readers,
 aklitho JEDC.org 612 W. Willoughby Ave., Suite A Juneau, AK 99801 Phone 907 523 2300 October 2012 Dear Readers, The Juneau Economic Development Council (JEDC) is pleased to make our 2012 edition of local
The Economic Impact of Tourism on Calderdale Prepared by: Tourism South East Research Unit 40 Chamberlayne Road Eastleigh Hampshire SO50 5JH
 The Economic Impact of Tourism on Calderdale 2015 Prepared by: Tourism South East Research Unit 40 Chamberlayne Road Eastleigh Hampshire SO50 5JH CONTENTS 1. Summary of Results 1 2. Table of Results Table
North Lanarkshire. Skills Assessment January SDS-1163-Jan16
 North Lanarkshire Skills Assessment January 2016 SDS-1163-Jan16 Acknowledgement The Regional Skills Assessment Steering Group (Skills Development Scotland, Scottish Enterprise, the Scottish Funding Council
AVSP 7 Summer Section 7: Visitor Profile - Demographics and Spending
 AVSP 7 Summer 2016 Section 7: Visitor Profile - Demographics and Spending Demographics Origin Visitors were asked what state, country, or province they were visiting from. The chart below shows results
State of the Shared Vacation Ownership Industry. ARDA International Foundation (AIF)
") State of the Shared Vacation Ownership Industry ARDA International Foundation (AIF) This paper includes a high-level overview of the timeshare industry with a core focus on financial growth, owner demographics
State of the Shared Vacation Ownership Industry ARDA International Foundation (AIF) This paper includes a high-level overview of the timeshare industry with a core focus on financial growth, owner demographics
COMPARATIVE INDICATORS TO OTHER HAMPTON ROADS CITIES. David Bradley
 COMPARATIVE INDICATORS TO OTHER HAMPTON ROADS CITIES David Bradley July 14, 2017 EXPENDITURES BY CATEGORY - FY 2015-16 ALL FUNDS 100.0% 8.1% 4.1% 7.2% 9.2% 5.8% 8.6% 6.9% 80.0% 60.0% 45.0% 49.1% 36.1%
The Economic Impact of Tourism Brighton & Hove Prepared by: Tourism South East Research Unit 40 Chamberlayne Road Eastleigh Hampshire SO50 5JH
 The Economic Impact of Tourism Brighton & Hove 2013 Prepared by: Tourism South East Research Unit 40 Chamberlayne Road Eastleigh Hampshire SO50 5JH CONTENTS 1. Summary of Results 1 1.1 Introduction 1 1.2
Community Health Status Assessment
 Community Health Status Assessment Boone County, Missouri Prepared August 2013 by: Sarah Rainey, Epidemiology, Planning and Evaluation Supervisor Columbia/Boone County Department of Public Health and Human
A COMPARISON OF THE MILWAUKEE METROPOLITAN AREA TO ITS PEERS
 KRY/WJS/EDL #222377 v4 (PDF: #223479v2) 4/1/15 APPENDIX D REVISED DRAFT Memorandum Report A COMPARISON OF THE MILWAUKEE METROPOLITAN AREA TO ITS PEERS EXECUTIVE SUMMARY This report provides a statistical
The Economic Impact of Tourism on Scarborough District 2014
 The Economic Impact of Tourism on Scarborough District 2014 Prepared by: Tourism South East Research Unit 40 Chamberlayne Road Eastleigh Hampshire SO50 5JH CONTENTS 1. Summary of Results 1 2. Table of
The Economic Impact of Tourism New Forest Prepared by: Tourism South East Research Unit 40 Chamberlayne Road Eastleigh Hampshire SO50 5JH
 The Economic Impact of Tourism New Forest 2008 Prepared by: Tourism South East Research Unit 40 Chamberlayne Road Eastleigh Hampshire SO50 5JH CONTENTS Glossary of terms 1 1. Summary of Results 4 2. Table
The Economic Impact of Tourism Brighton & Hove Prepared by: Tourism South East Research Unit 40 Chamberlayne Road Eastleigh Hampshire SO50 5JH
 The Economic Impact of Tourism Brighton & Hove 2014 Prepared by: Tourism South East Research Unit 40 Chamberlayne Road Eastleigh Hampshire SO50 5JH CONTENTS 1. Summary of Results 1 1.1 Introduction 1 1.2
Chapter 1: The Population of NHS Greater Glasgow and Clyde
 Population Estimate (thousands) Chapter 1: The Population of NHS Greater Glasgow and Clyde Population Trends and Projections National Records of Scotland estimated (NRS SAPE) 1 the 2013 NHS Greater Glasgow
The Economic Impact of Tourism on Oxfordshire Estimates for 2013
 The Economic Impact of Tourism on Oxfordshire Estimates for 2013 County and District Results September 2014 Prepared by: Tourism South East Research Unit 40 Chamberlayne Road Eastleigh Hampshire SO50 5JH
TABLE OF CONTENTS PREFACE & CONTACTS DEMOGRAPHICS TRAVEL BEHAVIOR CHARACTERISTICS MODAL STATISTICS TOURISM TRANSPORTATION FINANCING
 TABLE OF CONTENTS PREFACE & CONTACTS DEMOGRAPHICS TRAVEL BEHAVIOR CHARACTERISTICS MODAL STATISTICS TOURISM TRANSPORTATION FINANCING TRANSPORTATION EDUCATION & RESEARCH DIRECTORY MISCELLANEOUS INDEX on
Newbury Population ,071 1,941 3,719 4,038 5,337 5,611 5,805
 CHAPTER 3 DEMOGRAPHICS Demographic Profile Population Demographic information can provide essential insights into the composition of a community. As a result, it is a basic element of land use planning
MEDIA LIFESTYLE MAGAZINE COMMUNITY ORIENTED
 MEDIA LIFESTYLE MAGAZINE COMMUNITY ORIENTED ABOUT US Live it up Doral is a printed and digital magazine that invites readers to enjoy the city of Doral. Its editorial line combines life style with community
Contents Manningham at a Glance... 6 Location and Area... 6 Manningham Activity Centres... 6 Manningham Suburbs... 6 Population... 8 Forecast... 9 For
 Contents Manningham at a Glance... 6 Location and Area... 6 Manningham Activity Centres... 6 Manningham Suburbs... 6 Population... 8 Forecast... 9 Forecast 2011 2036... 9 Population Forecast... 9 Gross
North Carolina (Statewide) 2016 Prosperity Zone Data Books
 2016 Prosperity Zone Data Books") North Carolina (Statewide) 2016 Prosperity Zone Data Books 2 North Carolina Prosperity Zones Western North Carolina Prosperity Zones Northwest Region Piedmont-Triad Region Western Region Southwest Region
North Carolina (Statewide) 2016 Prosperity Zone Data Books 2 North Carolina Prosperity Zones Western North Carolina Prosperity Zones Northwest Region Piedmont-Triad Region Western Region Southwest Region
The Economic Impact of Tourism on the District of Thanet 2011
 The Economic Impact of Tourism on the District of Thanet 2011 Prepared by: Tourism South East Research Unit 40 Chamberlayne Road Eastleigh Hampshire SO50 5JH CONTENTS 1. Summary of Results 1 2. Table of
Youth Retention: July Value of post secondary education in regional settings. Prepared for Luminosity Youth Summit.
 Youth Retention: Value of post secondary education in regional settings Prepared for Luminosity Youth Summit July 2013 Prepared by MID NORTH COAST NSW Table of contents Table of contents... 2 Introduction...
CITY OF COTATI: LOCAL ECONOMIC REPORT
 EDB Sonoma County Economic Development Board Cotati Chamber of Commerce economy 2010-11 CITY OF COTATI: LOCAL ECONOMIC REPORT E c o n o m i c D e v e l o p m e n t B o a r d 4 0 1 C o l l e g e Av e n
The Economic Impact of Tourism on Oxfordshire Estimates for 2014
 The Economic Impact of Tourism on Oxfordshire Estimates for 2014 County and District Results August 2015 Prepared by: Tourism South East Research Unit 40 Chamberlayne Road Eastleigh Hampshire SO50 5JH
The Economic Impact of Tourism Eastbourne Prepared by: Tourism South East Research Unit 40 Chamberlayne Road Eastleigh Hampshire SO50 5JH
 The Economic Impact of Tourism Eastbourne 2016 Prepared by: Tourism South East Research Unit 40 Chamberlayne Road Eastleigh Hampshire SO50 5JH CONTENTS Page 1. Summary of Results 1 1.1 Introduction 1 1.2
2013 IRVING HOTEL GUEST SURVEY Final Project Report
 2013 IRVING HOTEL GUEST SURVEY Final Project Report Research prepared for the Irving Convention & Visitors Bureau by Destination Analysts, Inc. Table of Contents SECTION 1 Introduction 2 SECTION 2 Executive
East Lothian. Skills Assessment January SDS-1154-Jan16
 East Lothian Skills Assessment January 2016 SDS-1154-Jan16 Acknowledgement The Regional Skills Assessment Steering Group (Skills Development Scotland, Scottish Enterprise, the Scottish Funding Council
Swaziland. HDI values and rank changes in the 2013 Human Development Report
 Human Development Report 2013 The Rise of the South: Human Progress in a Diverse World Explanatory note on 2013 HDR composite indices Swaziland HDI values and rank changes in the 2013 Human Development
Massachusetts. Massachusetts. Statewide Airport Economic Impact Study Update TECHNICAL REPORT
 Massachusetts Massachusetts Statewide Airport Economic Impact Study Update TECHNICAL REPORT MASSACHUSETTS STATEWIDE AIRPORT ECONOMIC IMPACT STUDY UPDATE DECEMBER 2014 Prepared for: Prepared by: MASSACHUSETTS
The Australian Defence Organisation and Tropical Australia: Its Socio-Economic Impact in Cairns, Darwin and Townsville
 The Australian Defence Organisation and Tropical Australia: Its Socio-Economic Impact in Cairns, Darwin and Townsville Dr Riccardo Welters School of Business, James Cook University Published by The Cairns
Inverness, Culloden and Suburbs Settlement Economic Overview
 Strategic planning and research Economic information December 2007 Inverness, Culloden and Suburbs Settlement Economic Overview Summary Between 2001 and 2006, the population of Inverness, Culloden and
CHAPTER 3: COMMUNITY PROFILE
 CHAPTER 3: COMMUNITY PROFILE Chapter 3 includes the following information: 1. Community Context 2. The Land 3. The People Who Live Here 4. The Housing Landscape 5. The Economy 6. Past and Future Growth
Institute for Public Policy and Economic Analysis
 Institute for Public Policy and Economic Analysis Die Cut Die Cut Die Cut Die Cut The Institute for Public Policy and Economic Analysis at Eastern Washington University will convey university expertise
2015 IRVING HOTEL GUEST SURVEY Final Project Report
 2015 IRVING HOTEL GUEST SURVEY Final Project Report Research prepared for the Irving Convention & Visitors Bureau by Destination Analysts, Inc. Table of Contents S E C T I O N 1 Introduction 2 S E C T
The Economic Base of Colfax County, NM. PREPARED BY: The Office of Policy Analysis at Arrowhead Center, New Mexico State University.
 The Economic Base of Colfax County, NM PREPARED BY: The Office of Policy Analysis at Arrowhead Center, New Mexico State University DATE: July 2016 The Economic Base of Colfax County, New Mexico Introduction
East Dunbartonshire Area Profile
 East Dunbartonshire Area Profile May 2014 Contents Executive Summary.. page 3 Introduction.. page 6 Population page 7 Age Structure. page 9 Population Projections page 11 Life Expectancy page 12 Ethnicity.
IT S YOUR AREA. what s important? TYWYN AREA. WELL-BEING ASSESSMENT GWYNEDD AND MÔN Gwynedd and Môn Public Services Board
 IT S YOUR AREA. what s important? TYWYN AREA WELL-BEING ASSESSMENT GWYNEDD AND MÔN Gwynedd and Môn Public Services Board 2016 well-being assessment Gwynedd WANT to HAVE YOUR SAY? and Môn The new act has
AVIATION. January Aviation INDUSTRY PROFILE. for Arapahoe & Douglas Counties Colorado WIOA Central Planning Region
 January 2017 Aviation INDUSTRY PROFILE for Arapahoe & Douglas Counties Colorado WIOA Central Planning Region Background The Metro Denver region ranks 14th among the nation s 0 largest metro areas for aviation
SHETLAND AREA PROFILE
 www.hie.co.uk SHETLAND AREA PROFILE May 2014 SHETLAND AREA PROFILE INTRODUCTION The Shetland area profile uses 2011 Census data and other available data sources to present an up-to-date analysis of its
Figure 1.1 St. John s Location. 2.0 Overview/Structure
 St. John s Region 1.0 Introduction Newfoundland and Labrador s most dominant service centre, St. John s (population = 100,645) is also the province s capital and largest community (Government of Newfoundland
LITERACY IN NOVA SCOTIA Implications of Findings from IALSS 2003
 LITERACY IN NOVA SCOTIA Implications of Findings from IALSS 03 Presented by Satya Brink, Ph.D. Director, National Learning Policy Research Learning Policy Directorate, HRSDC January 06 1 Key Questions
The 2001 Economic Impact of Connecticut s Travel and Tourism Industry
 The 2001 Economic Impact of Connecticut s Travel and Tourism Industry EXECUTIVE SUMMARY Fred V. Carstensen, Director Stan McMillen, Manager, Research Projects Murat Arik, Research Associate Hulya Varol,
Economic Impacts of Campgrounds in New York State
 Economic Impacts of Campgrounds in New York State June 2017 Report Submitted to: Executive Summary Executive Summary New York State is home to approximately 350 privately owned campgrounds with 30,000
Population and Labor Force Projections for New Jersey: 2014 to 2034
 Population and Labor Force Projections for New Jersey: 2014 to 2034 1 Millions 12 10 8 6 4 2 0 New Jersey s Population is Projected to Reach 9,733,400 by 2034 (2016=8,944,469) 244 Years Population Trend
Follow this and additional works at:
 Florida International University FIU Digital Commons Palm Beach County MPO Community Background Reports 1-1-2011 Town of Lake Park Follow this and additional works at: http://digitalcommons.fiu.edu/mpo_palmbeach
The Hotel Industry: The United States, Virginia And Hampton Roads
 The Hotel Industry: The United States, Virginia And Hampton Roads THE HOTEL INDUSTRY: THE UNITED STATES, VIRGINIA AND HAMPTON ROADS Do not forget to show hospitality to strangers. Hebrews 12:2 This chapter
Temecula Valley Travel Impacts p
 Temecula Valley Travel Impacts 2000-2017p photo courtesy of Temecula Valley Convention and Visitors Bureau May 2018 Prepared for the Temecula Valley Convention and Visitors Bureau Temecula, California
Intercity Bus and Passenger Rail Study
 Intercity Bus and Passenger Rail Study Prepared for the Michigan Department of Transportation University of Michigan, College of Architecture and Urban Planning Intercity Bus and Passenger Rail Study Prepared
2nd Quarter. AEDC is pleased to present the Anchorage Quarterly Economic Indicators Report for the second quarter of 2010.
 2010 AEDC is pleased to present the Anchorage Quarterly Economic Indicators Report for the second quarter of 2010. This report summarizes recently updated data from the Anchorage Economic Indicators Database,
NAPA VALLEY VISITOR INDUSTRY 2016 Economic Impact Report
 NAPA VALLEY VISITOR INDUSTRY 2016 Economic Impact Report Research prepared for Visit Napa Valley by Destination Analysts, Inc. Table of Contents S E C T I O N 1 Introduction 2 S E C T I O N 2 Executive
Living on the edge: The impact of travel costs on low paid workers living in outer London executive summary. living on the edge 1
 Living on the edge: The impact travel costs on low paid workers living in outer London executive summary living on the edge 1 introduction key findings London has a world-class public transport system
The Economic Impact of Tourism
 The Economic Impact of Tourism West Oxfordshire 2008 Revised Report with Event Footfall Prepared by Tourism South East Research Services February 2010 40 Chamberlayne Road Eastleigh Hampshire SO50 5JH
Produced by: Destination Research Sergi Jarques, Director
 Produced by: Destination Research Sergi Jarques, Director Economic Impact of Tourism Norfolk - 2017 Contents Page Summary Results 2 Contextual analysis 4 Volume of Tourism 7 Staying Visitors - Accommodation
EXECUTIVE SUMMARY. hospitality compensation as a share of total compensation at. Page 1
 EXECUTIVE SUMMARY Applied Analysis was retained by the Las Vegas Convention and Visitors Authority (the LVCVA ) to review and analyze the economic impacts associated with its various operations and southern
Demographic Rankings
 demographics 82 Demographic Rankings Second highest level of educational attainment of major Canadian cities Calgary ranked #3 in Top 10 Places to Raise Kids Calgary ranked #19 in Overall Ranking MoneySense
The Economic Impact of Tourism in Hillsborough County. July 2017
 The Economic Impact of Tourism in Hillsborough County July 2017 Table of contents 1) Key Findings for 2016 3 2) Local Tourism Trends 7 3) Trends in Visits and Spending 12 4) The Domestic Market 19 5) The
Produced by: Destination Research Sergi Jarques, Director
 Produced by: Destination Research Sergi Jarques, Director Economic Impact of Tourism North Norfolk District - 2016 Contents Page Summary Results 2 Contextual analysis 4 Volume of Tourism 7 Staying Visitors
Produced by: Destination Research Sergi Jarques, Director
 Produced by: Destination Research Sergi Jarques, Director Economic Impact of Tourism Norfolk - 2016 Contents Page Summary Results 2 Contextual analysis 4 Volume of Tourism 7 Staying Visitors - Accommodation
NAPA VALLEY VISITOR INDUSTRY 2012 Economic Impact Report
 Join Visit Napa Valley NAPA VALLEY VISITOR INDUSTRY 2012 Economic Impact Report Research prepared for Visit Napa Valley by Destination Analysts, Inc. Table of Contents SECTION 1 Introduction 2 SECTION
NAPA VALLEY VISITOR INDUSTRY 2014 Economic Impact Report
 NAPA VALLEY VISITOR INDUSTRY 2014 Economic Impact Report Research prepared for Visit Napa Valley by Destination Analysts, Inc. Table of Contents SECTION 1 Introduction 2 SECTION 2 Executive Summary 5 SECTION
The Economic Impact of Tourism in Jacksonville, FL. June 2016
 The Economic Impact of Tourism in Jacksonville, FL June 2016 Highlights Visitor spending surpassed $2.0 billion in 2015, growing 4.4%. As this money flowed through Duval County, the $2.0 billion in visitor
Novi Meadowbrook Shopping Center 10 Mile & Meadowbrook Rds. Novi, Michigan
 For Lease Novi Meadowbrook Shopping Center 10 Mile & Meadowbrook Rds. Space Size: 1,200 to 4,000 Sq. Ft. Outlot Available Building Size: 100,357 Sq. Ft. Neighborhood Strip Center Available: Immediately
HEALTH SECTOR ECONOMIC INDICATORS REPORT
 HEALTH SECTOR ECONOMIC INDICATORS REPORT For: Mid North Coast Local Health District Report prepared by: April 2013 Table of Contents Introduction 3 Executive Summary 4 Output 5 Value-Added 7 Workforce
The Economic Impact of Tourism West Oxfordshire Prepared by: Tourism South East Research Unit 40 Chamberlayne Road Eastleigh Hampshire SO50 5JH
 The Economic Impact of Tourism West Oxfordshire 2014 Prepared by: Tourism South East Research Unit 40 Chamberlayne Road Eastleigh Hampshire SO50 5JH CONTENTS 1. Summary of Results 1 1.1 Introduction 1
East Dunbartonshire Area Profile
 East Dunbartonshire Area Profile May 2015 Contents Executive Summary.. page 3 Introduction.. page 6 Population page 7 Age Structure. page 9 Population Estimates..page 11 Population Projections page 13
Population, Territory and Sustainable Development The Case of the Caribbean Sub Region
 Population, Territory and Sustainable Development The Case of the Caribbean Sub Region Author: Godfrey St. Bernard Sir Arthur Lewis Institute of Social and Economic Studies The University of the West Indies
ECONOMIC PROFILE PARK CITY & SUMMIT COUNTY, UTAH
 ECONOMIC PROFILE PARK CITY & SUMMIT COUNTY, UTAH Prepared by the Park City Chamber of Commerce & Visitors Bureau PO Box 1630, Park City, UT 84060 1.800.453.1360 Economic Profile Packet Sections 1. Introduction
The Economic and Fiscal Impacts of the Renovation, Expansion, and Annual Operation of the Balsams Grand Resort and Wilderness Ski Area
 The Economic and Fiscal Impacts of the Renovation, Expansion, and Annual Operation of the Balsams Grand Resort and Wilderness Ski Area Prepared by: February 2015 bgottlob@poleconresearch.com Table of Contents
Reference Number. Station
 Table A.7 Population and Number of Households within 800m Radius of Proposed s ALTERNATIVE 1 ALTERNATIVE 2 ALTERNATIVE 3 Reference Number Population Households Reference Number Population Households Population
Australian Casino Association ECONOMIC REPORT. Prepared for. Australian Casino Association. June Finance and Economics
 Australian Casino Association ECONOMIC REPORT Prepared for Australian Casino Association June 2004 Finance and Economics Contents Executive Summary--------------------------------------------------------------------------------------------
MONTEREY COUNTY TRAVEL IMPACTS P
 MONTEREY COUNTY TRAVEL IMPACTS 1992-2015P April 2016 Prepared for the Monterey County Convention and Visitors Bureau MONTEREY COUNTY TRAVEL IMPACTS, 1992-2015P Prepared for the Monterey County Convention
The Economic Impact of Tourism in Buncombe County, North Carolina
 The Economic Impact of Tourism in Buncombe County, North Carolina 2017 Analysis September 2018 Introduction and definitions This study measures the economic impact of tourism in Buncombe County, North
HIGH-END ECOTOURISM AS A SUSTAINABLE LAND USE OPTION IN RURAL AFRICA:
 HIGH-END ECOTOURISM AS A SUSTAINABLE LAND USE OPTION IN RURAL AFRICA: THE ROLE OF EMPLOYMENT IN POVERTY REDUCTION & SOCIAL WELFARE Sue Snyman, March 2011 sues@wilderness.co.za INTRODUCTION Rural Communities
Produced by: Destination Research Sergi Jarques, Director
 Produced by: Destination Research Sergi Jarques, Director Economic Impact of Tourism Oxfordshire - 2015 Economic Impact of Tourism Headline Figures Oxfordshire - 2015 Total number of trips (day & staying)
Economic Contribution of Tourism to NSW
 Economic Contribution of Tourism to NSW 2013-14 Tourism is a significant part of the NSW economy. In 2013-14, tourism contributed $34.9 billion (Tourism Consumption) to the NSW economy and employed 272,000
DUNOON PROFILE May 2014
 www.hie.co.uk DUNOON PROFILE May 2014 DUNOON PROFILE INTRODUCTION The Dunoon profile uses 2011 Census data and other available data sources to present an up-to-date analysis of its population and labour
ISRAEL- COUNTRY FACTS
 ISRAEL- COUNTRY FACTS ISRAEL-NEIGHBOURING COUNTRIES AND POLITICAL MAP Area: 22,072 sq. km Land area: 21,643 sq. km. Fast Facts Area of lakes: 429 sq. km. (Sea of Galilee 164 sq. km., the Dead Sea - 265
Economic Impact of Tourism. Norfolk
 Economic Impact of Tourism Norfolk - 2009 Produced by: East of England Tourism Dettingen House Dettingen Way, Bury St Edmunds Suffolk IP33 3TU Tel. 01284 727480 Contextual analysis Regional Economic Trends
The Economic Impact of Tourism West Oxfordshire Prepared by: Tourism South East Research Unit 40 Chamberlayne Road Eastleigh Hampshire SO50 5JH
 The Economic Impact of Tourism West Oxfordshire 2010 Prepared by: Tourism South East Research Unit 40 Chamberlayne Road Eastleigh Hampshire SO50 5JH CONTENTS Summary of Results 1 1.1 Introduction 1 1.2
The Yorke & Mid North (State Govt) Region. Workforce Wizard Region Report
 Region. Workforce Wizard Region Report") The Yorke & Mid North (State Govt) Region Workforce Wizard Region Report Table of Contents Executive Summary 3 Population and Social Characteristics 4 Current Population 4 Age Groups 4 Key Populations
The Yorke & Mid North (State Govt) Region Workforce Wizard Region Report Table of Contents Executive Summary 3 Population and Social Characteristics 4 Current Population 4 Age Groups 4 Key Populations
CAMPBELTOWN PROFILE May 2014
 www.hie.co.uk CAMPBELTOWN PROFILE May 2014 CAMPBELTOWN PROFILE INTRODUCTION The Campbeltown profile uses 2011 Census data and other available data sources to present an up-to-date analysis of its population
The Economic Impact of Children's Camps in Michigan
 Extension Bulletin E-1559, July 1981, File 36.42 The Economic Impact of Children's in Michigan Department of Park and Recreation Resources Michigan State University East Lansing, Michigan in cooperation
HART RESEARCH ASSOCIATES/PUBLIC OPINION STRATEGIES Study # page 1
 HART RESEARCH ASSOCIATES/PUBLIC OPINION STRATEGIES Study #18164 -- page 1 Interviews: 1100 Adults, including 495 respondents with a cell phone only and Date: March 10-14, 2018 14 respondents reached on