REAL-TIME DATA ANALYSIS FOR A LANDSCAPE OF POSSIBILITIES
|
|
|
- Emil Doyle
- 5 years ago
- Views:
Transcription


1 REAL-TIME DATA ANALYSIS
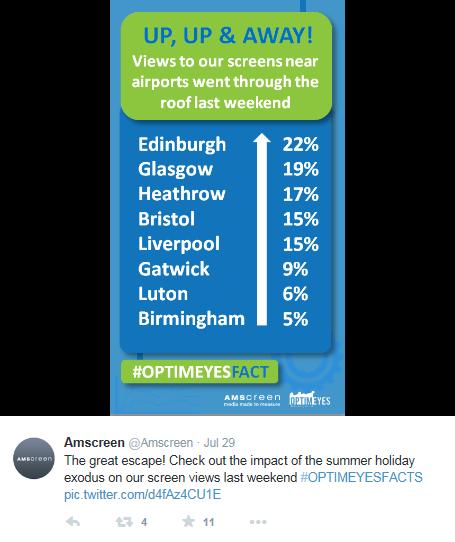
2 HIGHLIGHTING IMPACT IN THE DATA

 to drive the value of OOH")

3 DATA EVALUATION TO LOOK FOR AND TO QUANTIFY UPLIFTS IN AUDIENCE Opportunity to use this real time digital data (OptimEyes) to drive the value of OOH In-depth analysis around events, dates and times of day (Amscreen shared 2014 data (April-August)
4 AMSCREEN DATA TALON ANALYSIS OF EYE CONTACT DATA (REAL IMPACTS AND A SURROGATE FOR FOOTFALL) Measuring activity and active behaviour Day of week Time of day Bank Holidays Seasonal Holidays Easter, Summer Local events
5 Index DAY OF WEEK NOTABLE UPLIFT TOWARDS END OF WORKING WEEK Thursdays and Fridays show +6% and +14% uplift compared to the average daily interactions Monday Tuesday Wednesday Thursday Friday Saturday Sunday Source: all Amscreen Tesco stores, April-August 2014
6 Screen interactions TIME OF DAY LATE MORNING PEAK 11AM 1PM is when interactions peak; almost double the hourly average. Shows an active and mobile audience presence in middle of the day. Uplift vs the 9am- 6pm average is +10% (109 at 11am and 111 at 12 midday) AM: i132 vs. the allday average 12AM: i133 vs. the allday average
7 Screen interactions (m) AUDIENCE PROFILE DATA - TIME OF DAY PREDOMINANCE OF MALE AND YOUNGER AUDIENCES The number of screen interactions for men is almost twice that of women. Most screen interactions come from 35-64s, but 16-34s also strong and after 4pm that audience is largest Male Female

8 Index VALUE OF THE BANK HOLIDAY GETAWAY DAY Bank Holiday get-away days generate an overall increase in screen interactions of +19% vs the daily average 83% of screens showed an uplift in screen interactions during any Bank Holiday Easter Thursday 17 April Friday 02 May Bank Holiday Friday 23 Spring Bank Holiday Friday 22 Aug Bank Holiday

9 IDENTIFYING THE HIGHEST INDEXING BANK HOLIDAY LOCATIONS i 150+ i i Location of top performing sites around Bank Holiday getaway days - On key A road travel routes - In key travel destinations
10 Screen interactions (000) SEASONAL AUDIENCES EASTER GETAWAY Strong uplift around the Thursday/Good Friday getaway days 800, , , , , , , , , , , , , ,000 0 Thursday Apr 17 Good Friday Apr 18 Saturday Apr 19 Easter Sunday Apr 20 Easter Monday Apr 21 Daily average (Apr-Aug) Easter seasonal index=110; Thursday before Bank Holiday index=124
11 SEASONAL AUDIENCES SUMMER HOLIDAY PERIOD Viewing audiences are 6% higher during the school holidays. The first Friday of the school holidays sees a significant increase in screen viewers, with audiences increasing by 23% vs the rest of the year. ALL VIEWERS Benchmark 01 Apr 17 Jul & 1 st Sept 31 st Dec Summer 18Jul 31 Aug Screen interactions Screen interactions Summer Index Daily average 568, , Average Fri 645, , Average Sat 547, , First Friday 18 th Jul 568, , First Sat 19th Jul 568, ,
12 SEASONAL AUDIENCES SUMMER HOLIDAY PERIOD The increase in School holiday viewing audiences is most pronounced among viewers aged 15-34, whom demonstrate a +12% increase in daily viewing figures during this time and a +32% uplift on the Friday school getaway. ADULTS Benchmark 01 Apr 17 Jul & 1 st Sept 31 st Dec Screen interactions Summer 18Jul 31 Aug Screen interactions Summer Index Daily average 242, , Average Fri 273, , Average Sat 237, , First Friday 18 th Jul 242, , First Sat 19th Jul 242, ,


13 LOCAL NATIONAL EVENTS CLEAR UPLIFTS AROUND LOCAL AREA AND TRAFFIC ROUTES One offs Weekends Longer Average indexes Peak indexes 112, 112, , 140, 114 * Based on Year-round analysis of OptimEyes data by Talon

14 STORE LOCATION AND PERFORMANCE GLASTONBURY FESTIVAL, LATE JUNE POI Closest store Near stores Thursday Friday and Monday/Tuesday Significant uplift around whole period either side

15 STORE LOCATION AND PERFORMANCE GRAND NATIONAL AINTREE, APRIL POI Closest store Near stores Friday and Saturday uplift around course and on route in from north

16 STORE LOCATION AND PERFORMANCE LATITUDE, SUFFOLK POI Near stores Friday uplift on key routes and close to location


17 SUMMARY METRICS TO APPLY TO MOBILITY OF OOH AUDIENCES Fridays +14% 11pm Coffee time +31% Bank Holiday Getaway +19% Summer / Summer Hols Getaway +6% / 23% Festivals +12% Sport events +13%


18
Queenstown Airport International Passenger Profile Update
 Queenstown Airport International Passenger Profile Update 12 months to 31 January 2017 Published at 6 March 2017 This report, based on data from Statistics NZ, shows the profile of passengers on trans-tasman
January 2018 Air Traffic Activity Summary
 January 2018 Air Traffic Activity Summary Jan-2018 Jan-2017 CY-2018 CY-2017 Passengers 528,947 505,421 4.7% 528,947 505,421 4.7% Passengers 537,332 515,787 4.2% 537,332 515,787 4.2% Passengers 1,066,279
SYSTEM BRIEF DAILY SUMMARY
 SYSTEM BRIEF SUMMARY * ANNUAL (PEAK HOURS 7:00 AM TO 10:00 PM MON-SAT) MaxTemp NEL (MWH) Hr Ending Hr Ending LOAD ENERGY (MWH) INCREMENTAL COST DAY DATE Civic TOTAL MAXIMUM @Max MINIMUM @Min FACTOR ON
October 2013 Passenger and Cargo Traffic Statistics Reno-Tahoe International Airport
 October 2013 Passenger and Cargo Traffic Statistics Reno-Tahoe International Airport December 4, 2013 U.S. DOMESTIC INDUSTRY OVERVIEW FOR OCTOBER 2013 All RNO Carriers Systemwide year over year comparison
TRAVEL INSIGHTS AND OPPORTUNITIES IN OOH
 TRAVEL INSIGHTS AND OPPORTUNITIES IN OOH SEPTEMBER 2017 TOP OOH CATEGORIES 2016 ENTERTAINMENT & LEISURE DRINK TELECOMMS FOOD FINANCE 162m 92m 90m 75m 63m TRAVEL & TRANSPORT MOTORS COSMETICS & PERSONAL
Regional Spread of Inbound Tourism. VisitBritain Research, August 2018
 Regional Spread of Inbound Tourism VisitBritain Research, August 218 1 Contents Introduction Summary Key metrics by UK area Analysis by UK area Summary of growth by UK area Scotland Wales North East North
#1. Why is the City doing this project?
 Community Workshop #2 January 2016 #1. Why is the City doing this project? Broadway and Lincoln are in constant change Broadway and Lincoln are in constant change Broadway and Lincoln are in constant change
Report for Jan-Nov-2006 pdf. General Statistics
 Report for Jan-Nov-006 pdf Time range: /8/006 07:3:37 - /3/006 3:50:6 Generated on Mon Jan 0, 007-9:3:5 General Statistics Summary Summary Hits Total Hits 97,06 Average Hits per Day 89 Average Hits per
December 2013 Passenger and Cargo Traffic Statistics Reno-Tahoe International Airport
 December 2013 Passenger and Cargo Traffic Statistics Reno-Tahoe International Airport January 24, 2014 U.S. DOMESTIC INDUSTRY OVERVIEW FOR DECEMBER 2013 All RNO Carriers Domestic Systemwide year over year
Understanding Business Visits
 Understanding Business Visits Foresight issue 153 VisitBritain Research 1 Contents Introduction Summary and Highlights Business Visits in Context UK Business visits and spend Averages Duration of stay
JAPAC TRAVELLER REPORT. Transit/Carrier. Peak time for engagement. Top engaged audience. Repeat Travellers per month. Tokyo.
 Tokyo JAPAC TRAVELLER REPORT Delhi Mumbai Hong Kong Macau Manila Bangkok Kuala Lumpur Singapore Jakarta Sydney Melbourne Tokyo Hong Kong Delhi Mumbai Macau Bangkok Kuala Lumpur Singapore Jakarta Manila
Exploring travel in Suzanne Devai, Research Director
 Exploring travel in 2015 Suzanne Devai, Research Director How does an improving economic outlook impact on the travel sector? 2 Feb-08 May-08 Aug-08 Nov-08 Feb-09 May-09 Aug-09 Nov-09 Feb-10 May-10 Aug-10
Isles of Scilly Visitor Survey Final report. Produced for and on behalf of the Islands Partnership. May 2017
 Isles of Scilly Visitor Survey 2016 Final report Produced for and on behalf of the Islands Partnership by The South West Research Company Ltd. May 2017 Contents Page Summary 3 6 Introduction 7 10 Visitor
March 2014 Passenger and Cargo Traffic Statistics Reno-Tahoe International Airport
 March 2014 Passenger and Cargo Traffic Statistics Reno-Tahoe International Airport April 25, 2014 U.S. DOMESTIC INDUSTRY OVERVIEW FOR MARCH 2014 All RNO Carriers Domestic Systemwide year over year comparison
Appendix 15.2: Pasha Dere Beach Usage Survey
 Appendix 15.2: Pasha Dere Beach Usage Survey URS-EIA-REP-22375 Table of Contents 15.2 Pasha Dere Beach Usage Survey... 1 15.2.1 Introduction... 1 15.2.2 Beach Surveys... 1 15.2.2.1 Survey Dates, Times
Bristol destination report
 Bristol destination report 1 VisitEngland Destination tracker: Since April 2015, the national tourist boards of VisitEngland, VisitScotland and VisitWales have been tracking visitor perceptions of holiday
Passenger and Cargo Statistics Report
 Passenger and Cargo Statistics Report RenoTahoe International Airport April 2018 U.S. DOMESTIC INDUSTRY OVERVIEW FOR APRIL 2018 Systemwide RNO Carriers Domestic Flights year over year comparison Average
Passenger and Cargo Statistics Report
 Passenger and Cargo Statistics Report RenoTahoe International Airport May 2018 U.S. DOMESTIC INDUSTRY OVERVIEW FOR MAY 2018 Systemwide RNO Carriers Domestic Flights year over year comparison Average Load
November 2013 Passenger and Cargo Traffic Statistics Reno-Tahoe International Airport
 November 2013 Passenger and Cargo Traffic Statistics Reno-Tahoe International Airport December 26, 2013 U.S. DOMESTIC INDUSTRY OVERVIEW FOR NOVEMBER 2013 All RNO Carriers Domestic Systemwide year over
Passenger and Cargo Statistics Report
 Passenger and Cargo Statistics Report RenoTahoe International Airport January 2018 U.S. DOMESTIC INDUSTRY OVERVIEW FOR JANUARY 2018 Systemwide RNO Carriers Domestic Flights year over year comparison Average
TOURISM PERFORMANCE 2017
 4 th QUARTER TOURISM PERFORMANCE 2017 TOTAL STAYOVER ARRIVALS 105,658 TOTAL CRUISE ARRIVALS 224,212 TOTAL VISITOR NIGHTS AVERAGE HOTEL OCCUPANCY 935,402 71.7% ECONOMIC IMPACT $142.6 million HOW WAS OUR
Passenger and Cargo Statistics Report
 Passenger and Cargo Statistics Report RenoTahoe International Airport February 2018 U.S. DOMESTIC INDUSTRY OVERVIEW FOR FEBRUARY 2018 Systemwide RNO Carriers Domestic Flights year over year comparison
Coast to coast. STR Coastal Town Review Coastal Towns Market Review Report_JE.indd 3
 Coast to coast. STR Coastal Town Review 16 Coastal Towns Market Review Report_JE.indd 3 4//17 8:31:38 AM Table of Contents Introduction...3 United Kingdom...4 Blackpool...6 Bournemouth...8 Brighton...
Passenger and Cargo Statistics Report
 Passenger and Cargo Statistics Report RenoTahoe International Airport December 2015 U.S. DOMESTIC INDUSTRY OVERVIEW FOR DECEMBER 2015 All RNO Carriers Domestic Systemwide year over year comparison Average
Total trail movements for the period 1,569,597
 Queenstown Trail Visitation Executive Summary for Period - October 18, 2012 to January 31, 2015 trail movements for the period 1,569,597 352,718 trail journeys since opening Sunday is the busiest day of
Passenger and Cargo Statistics Report
 Passenger and Cargo Statistics Report RenoTahoe International Airport September 2017 U.S. DOMESTIC INDUSTRY OVERVIEW FOR SEPTEMBER 2017 Systemwide RNO Carriers Domestic Flights year over year comparison
January 2014 Passenger and Cargo Traffic Statistics Reno-Tahoe International Airport
 January 2014 Passenger and Cargo Traffic Statistics Reno-Tahoe International Airport March 12, 2014 U.S. DOMESTIC INDUSTRY OVERVIEW FOR DECEMBER 2013 All RNO Carriers Domestic Systemwide year over year
RIDERSHIP TRENDS. August 2018
 RIDERSHIP TRENDS August Prepared by the Division of Strategic Capital Planning October Table of Contents Executive Summary...1 Ridership...3 Estimated Passenger Trips by Line...3 Estimated Passenger Trips
U.S. DOMESTIC INDUSTRY OVERVIEW FOR MARCH
 Inter-Office Memo Reno-Tahoe Airport Authority Date: April 30, 2009 To: Statistics Recipients From: Krys T. Bart, A.A.E., President/CEO Subject: RENO-TAHOE INTERNATIONAL AIRPORT PASSENGER STATISTICS U.S.
Passenger and Cargo Statistics Report
 Passenger and Cargo Statistics Report RenoTahoe International Airport November 2017 U.S. DOMESTIC INDUSTRY OVERVIEW FOR NOVEMBER 2017 Systemwide RNO Carriers Domestic Flights year over year comparison
RIDERSHIP TRENDS. January 2018
 RIDERSHIP TRENDS January 2018 Prepared by the Division of Strategic Capital Planning March 2018 Table of Contents Executive Summary...1 Ridership...3 Estimated Passenger Trips by Line...3 Estimated Passenger
Visit Loudoun 2016 Lodging Market Research
 2016 Lodging Market Research Prepared for: Loudoun County Lodging Market Research & Analysis Study Conducted: November December 2016 Final Report Submitted: December 2016 2016 Lodging Market Analysis Summary
Passenger and Cargo Statistics Report
 Passenger and Cargo Statistics Report Reno-Tahoe International Airport December 2014 U.S. DOMESTIC INDUSTRY OVERVIEW FOR DECEMBER 2014 All RNO Carriers Domestic Systemwide year over year comparison Average
Monthly Hotel Establishment Report. July and YTD July, 2017
 Monthly Hotel Establishment Report July and YTD July, 2017 30 August, 2017 Dear Hotel Partner, It gives me great pleasure to share with you highlights of July s Hotel Establishments Performance Report
LAKESIDE BOAT LAUNCH INSPECTION DATA
 2012-2009 LAKESIDE BOAT LAUNCH INSPECTION DATA VILLAGE OF CAZENOVIA, NY - BOAT LAUNCH SUMMARY 2014 2013 2012 2011 2010 2009 Qty % of Total Qty % of Total Qty % of Total Qty % of Total Qty % of Total Qty
Domestic Tourism to South West Wales in 2006, 2007 and 2008 Factsheet
 Domestic Tourism to South West Wales in 2006, 2007 and 2008 Factsheet Introduction Published June 2009 This factsheet provides summary tables of key tourism figures to South West Wales in 2006, 2007 and
Work Shop Play Total OOH Locations No. of Locations Selected for Research Total SS Achieved*
 Contents : Research Background: Sample Size Achieved Work Shop Play Total OOH Locations 180 124 210 No. of Locations Selected for Research 51 37 87 Total SS Achieved* 3250 6264 5060 * Total Sample Size
Merchant Square Paddington: Brand Location Pack
 Merchant Square Paddington: Brand Location Pack Merchant Square is a premium development in the heart of London s West End. Merchant Square is home to a captive audience of 6,000 employees and 4,000 residents
Standard Rates Sundays to Thursdays: R1,745 per person per night sharing double R550 per person per night single supplement
 Standard Rates 2017 Sundays to Thursdays: R1,745 per person per night sharing double R550 per person per night single supplement Fridays, Saturdays and Public Holidays: R2,045 per person per night sharing
Passenger and Cargo Statistics Report
 Passenger and Cargo Statistics Report RenoTahoe International Airport September 2015 U.S. DOMESTIC INDUSTRY OVERVIEW FOR SEPTEMBER 2015 All RNO Carriers Domestic Systemwide year over year comparison Average
Brighton destination report
 Brighton destination report 1 VisitEngland Destination tracker: Since April 2015, the national tourist boards of VisitEngland, VisitScotland and VisitWales have been tracking visitor perceptions of holiday
Passenger and Cargo Statistics Report
 Passenger and Cargo Statistics Report RenoTahoe International Airport August 2015 U.S. DOMESTIC INDUSTRY OVERVIEW FOR AUGUST 2015 All RNO Carriers Domestic Systemwide year over year comparison Average
Tourism Statistics RTO 1
 Tourism Statistics RTO 1 Tourism Research Unit Spring 2012 1 1 Ontario Tourism 2 2 Ontario Tourism Indicators 2011* Visits increased by 1.3% to 104.4 million. Visits from Ontario and overseas countries
Passenger and Cargo Statistics Report
 Passenger and Cargo Statistics Report RenoTahoe International Airport September 2018 U.S. DOMESTIC INDUSTRY OVERVIEW FOR SEPTEMBER 2018 Systemwide RNO Carriers Domestic Flights year over year comparison
Passenger and Cargo Statistics Report
 Passenger and Cargo Statistics Report RenoTahoe International Airport July 2017 U.S. DOMESTIC INDUSTRY OVERVIEW FOR JULY 2017 Systemwide RNO Carriers Domestic Flights year over year comparison Average
Passenger and Cargo Statistics Report
 Passenger and Cargo Statistics Report RenoTahoe International Airport June 2017 U.S. DOMESTIC INDUSTRY OVERVIEW FOR JUNE 2017 All RNO Carriers Domestic Systemwide year over year comparison Average Load
COURSE DATES & PRICES 2019 NORTH AMERICA
 COURSE DATES & PRICES 2019 NORTH AMERICA SANTA MONICA SHORT TERM - CUT DURATION DAYS OF THE WEEK START DATES ABC CUT 1 5 DAYS MONDAY - FRIDAY Jan 7, 14 Feb 4, 18 Mar 4, 11 Apr 1, 15, 22 May 6, 20 Jun 3,
COURSE DATES & PRICES 2019 NORTH AMERICA
 COURSE DATES & PRICES 2019 NORTH AMERICA SANTA MONICA SHORT TERM - CUT DURATION DAYS OF THE WEEK START DATES ABC CUT 1 5 DAYS MONDAY - FRIDAY Jan 7, 14 Feb 4, 18 Mar 4, 11 Apr 1, 15, 22 May 6, 20 Jun 3,
Bath destination report
 Bath destination report 1 VisitEngland Destination tracker: Since April 2015, the national tourist boards of VisitEngland, VisitScotland and VisitWales have been tracking visitor perceptions of holiday
Blackpool destination report
 Blackpool destination report 1 VisitEngland Destination tracker: Since April 2015, the national tourist boards of VisitEngland, VisitScotland and VisitWales have been tracking visitor perceptions of holiday
Passenger and Cargo Statistics Report
 Passenger and Cargo Statistics Report RenoTahoe International Airport September 2016 U.S. DOMESTIC INDUSTRY OVERVIEW FOR SEPTEMBER 2016 All RNO Carriers Domestic Systemwide year over year comparison Average
Queenstown Airport International Passenger Profile Update
 Queenstown Airport International Passenger Profile Update 12 months to 31 y 1 tember This report, based on data from Statistics NZ, shows the profile of passengers arriving or departing on TransTasman
RECOMMENDED CITATION: Pew Research Center, July, 2015, Growing Public Support for U.S. Ties with Cuba - And an End to the Trade Embargo
 NUMBERS, FACTS AND TRENDS SHAPING THE WORLD FOR RELEASE JULY 21, 2015 FOR FURTHER INFORMATION ON THIS REPORT: Carroll Doherty, Director of Political Research Rachel Weisel, Communications Associate 202.419.4372
Carousel TV channel an efficient platform for brand promotion
 Carousel TV channel an efficient platform for brand promotion The leading Russian-language TV channel for kids «Carousel» channel is created by the decree of the President of the Russian Federation. The
Standard Rates Sundays to Thursdays: R1,495 per person per night sharing double R500 per person per night single supplement
 Standard Rates 2015 Sundays to Thursdays: R1,495 per person per night sharing double R500 per person per night single supplement Fridays, Saturdays and Public Holidays: R1,795 per person per night sharing
Tourism Statistics Parry Sound District
 Tourism Statistics Parry Sound District Tourism Research Unit Spring 2014 Note: due to changes in Statistics Canada s survey methodology, 2011 domestic data is not comparable to prior years 2 Ontario Tourism
RIDERSHIP TRENDS. October 2017
 RIDERSHIP TRENDS October 2017 Prepared by the Division of Strategic Capital Planning December 2017 Table of Contents Executive Summary...1 Ridership...3 Estimated Passenger Trips by Line...3 Estimated
NEW SOUTH WALES. Both METRIC and Feet and Inches TIMES: am/pm Sunrise/Sunset Moon Phases Moon Rise/Set DIARY NOTES.
 2016 2014 November 28, 2013 November 26, 2015 TO to January 4, 7, 2017 2015 Both METRIC and Feet and Inches TIMES: am/pm Sunrise/Sunset Moon Phases Moon Rise/Set DIARY NOTES NEW SOUTH WALES Public Works
August 2014 Passenger and Cargo Traffic Statistics Reno-Tahoe International Airport
 August 2014 Passenger and Cargo Traffic Statistics Reno-Tahoe International Airport October 8, 2014 U.S. DOMESTIC INDUSTRY OVERVIEW FOR AUGUST 2014 All RNO Carriers Domestic Systemwide year over year comparison
Isle of Wight destination report
 Isle of Wight destination report 1 VisitEngland Destination tracker: Since April 2015, the national tourist boards of VisitEngland, VisitScotland and VisitWales have been tracking visitor perceptions of
FERRY AVAILABILITY REVIEW APRIL OCTOBER 2014
 TITLE FERRY AVAILABILITY REVIEW APRIL OCTOBER 2014 A Report funded by HITRANS, Argyll & Bute Council, Comhairle Nan Eilean Siar, & Outer Hebrides Tourism Industry Association BY DONALD MACARTHUR & GRAHAM
Tourist motives and activities as drivers of tourist satisfaction among men and women
 Tourist motives and activities as drivers of tourist satisfaction among men and women Carl H. Marcussen, Centre for Regional and Tourism Research, Bornholm, Denmark, www.crt.dk Presented at the 24th Nordic
July 2012 Passenger and Cargo Traffic Statistics Reno-Tahoe International Airport
 July 2012 Passenger and Cargo Traffic Statistics Reno-Tahoe International Airport August 31, 2012 U.S. DOMESTIC INDUSTRY OVERVIEW FOR JULY 2012 All RNO Carriers Systemwide year over year comparison Average
Oasis Palm **** (Cancún)
") EMAIL season 02JAN17 21FEB17 CheckIn 3:00 PM CheckOut 12:00 AM MoSu 147,15 196,20 283,40 370,60 011,99 Inclusive 011,99 Inclusive halfboard fullboard MoSu All above mentioned rates must be markedup with
EMAIL season 02JAN17 21FEB17 CheckIn 3:00 PM CheckOut 12:00 AM MoSu 147,15 196,20 283,40 370,60 011,99 Inclusive 011,99 Inclusive halfboard fullboard MoSu All above mentioned rates must be markedup with
Airport Capacity, Airport Delay, and Airline Service Supply: The Case of DFW
 Airport Capacity, Airport Delay, and Airline Service Supply: The Case of DFW Faculty and Staff: D. Gillen, M. Hansen, A. Kanafani, J. Tsao Visiting Scholar: G. Nero and Students: S. A. Huang and W. Wei
Grand Oasis Palm **** (Cancún)
") EMAIL season 02JAN17 21FEB17 CheckIn 3:00 PM CheckOut 12:00 AM MoSu 168,95 239,80 348,80 011,99 Inclusive 011,99 Inclusive MoSu 176,58 255,06 371,69 011,99 Inclusive 011,99 Inclusive Continental halfboard
EMAIL season 02JAN17 21FEB17 CheckIn 3:00 PM CheckOut 12:00 AM MoSu 168,95 239,80 348,80 011,99 Inclusive 011,99 Inclusive MoSu 176,58 255,06 371,69 011,99 Inclusive 011,99 Inclusive Continental halfboard
St. Johns River Ferry Patron Survey May 16, 2012
 St. Johns River Ferry Patron Survey May 16, 2012 Committee Report Introduction Study Survey Survey Surveyor Summary Table of Contents Executive Summary... ES-1 Section 1 ONE... 1-1 Section 2 TWO Methodology...
Domestic VFR travel to NSW
 Domestic VFR travel to NSW Year ended December 2015 INTRODUCTION The and (VFR) market is of considerable importance to Australia and NSW. It is the second largest purpose of visit segment, after the Holiday
Day Date Month Event Class Time Race Team
 Day Date Month Event Class Time Race Team Sat 3rd Mar Cruisers Supper Sun 11th Mar Mothering Sunday Lunch Dorset Triangle - SB leg Sat 17th Mar Dinghy Dinner Sat 24th Mar Curry and Quiz Night Lift in Lift
Regional Spread of Inbound Tourism
 Regional Spread of Inbound Tourism Foresight issue 164 VisitBritain Research, January 2019 1 Contents Introduction Summary Key metrics by UK area Analysis by UK area Summary of growth by UK area Scotland
MONTHLY OPERATIONS REPORT DECEMBER 2015
 MONTHLY OPERATIONS REPORT DECEMBER 215 Table of Contents DECEMBER 215 Section Page December Highlights... 3 Strategic Goals Progress Update... 4 Ridership... 6 Revenue... 9 Expenses... 1 System Summary...
United States 70 % 16 % 10 % 5 % TRAVEL PROFILE: 1. Tourist Numbers & Revenue
 TRAVEL PROFILE: United States 1. Tourist Numbers & Revenue With strong cultural and ancestral links, the US is an important target market for Ireland. In 15 and 16 Ireland has experienced double digit
ATM Network Performance Report
 ATM Network Performance Report 2018. Page 1 of 16 Table of contents Summary... 3 Network Wide Performance... 4 Airborne delay... 4 Sydney... 6 Airborne delay... 6 Notable events... 6 Melbourne... 9 Airborne
Impact of Advance Purchase and Length-of-Stay on Average Ticket Prices in Top Business Destinations
 Impact of Advance Purchase and Length-of-Stay on Average Ticket Prices in Top Business Destinations Research Summary Average ticket prices continue to trend downward in 2016, but since 2014 there have
Updated 2 Bedroom Condo in Amazing Location
 Updated 2 Bedroom Condo in Amazing Location Summary 2 BR 2 Bath Condo - sleeps up to 6 Description 1633 Quicksilver - a SkyRun Keystone Property -- Hiking trails are located right outside your door --
2017/2018 Q3 Performance Measures Report. Revised March 22, 2018 Average Daily Boardings Comparison Chart, Page 11 Q3 Boardings figures revised
 2017/2018 Q3 Performance Measures Report Revised March 22, 2018 Average Daily Boardings Comparison Chart, Page 11 Q3 Boardings figures revised Contents Ridership & Revenue... 1 Historical Revenue & Ridership...
Metra Board of Directors. Board Meeting November 11, 2011
 Metra Board of Directors Board Meeting November 11, 2011 State of Metra Operations Metra Board of Directors November 11, 2011 Presented by George Hardwidge Deputy Executive Director Operations System On-Time
December 2012 Passenger and Cargo Traffic Statistics Reno-Tahoe International Airport
 December 2012 Passenger and Cargo Traffic Statistics Reno-Tahoe International Airport January 29, 2013 U.S. DOMESTIC INDUSTRY OVERVIEW FOR DECEMBER 2012 All RNO Carriers Systemwide year over year comparison
Passenger and Cargo Statistics Report
 Passenger and Cargo Statistics Report RenoTahoe International Airport July 2018 U.S. DOMESTIC INDUSTRY OVERVIEW FOR JULY 2018 Systemwide RNO Carriers Domestic Flights year over year comparison Average
Grand Oasis Cancún ***** (Cancún)
") EMAIL season 02JAN17 21FEB17 CheckIn 3:00 PM CheckOut 12:00 AM MoSu 174,40 250,70 365,15 011,99 Inclusive 011,99 Inclusive MoSu 182,03 265,96 388,04 011,99 Inclusive 011,99 Inclusive MoSu 189,66 281,22
EMAIL season 02JAN17 21FEB17 CheckIn 3:00 PM CheckOut 12:00 AM MoSu 174,40 250,70 365,15 011,99 Inclusive 011,99 Inclusive MoSu 182,03 265,96 388,04 011,99 Inclusive 011,99 Inclusive MoSu 189,66 281,22
FERRY AVAILABILITY REVIEW JUNE OCTOBER 2013
 TITLE OUTER HEBRIDES TOURISM INDUSTRY ASSOCIATION FERRY AVAILABILITY REVIEW JUNE OCTOBER 2013 Research and reporting carried out by the Outer Hebrides Tourism Industry Association, on behalf of HITRANS,
Passenger and Cargo Statistics Report
 Passenger and Cargo Statistics Report RenoTahoe International Airport June 2018 U.S. DOMESTIC INDUSTRY OVERVIEW FOR JUNE 2018 Systemwide RNO Carriers Domestic Flights year over year comparison Average
Tourism Statistics Region 1
 Tourism Statistics Region 1 Tourism Research Unit Winter 2011 1 Summary In 2008, there were 101.0 million visits in and visitors spent $17.6 billion residents account for the majority of visits and spending
Tourism Business Monitor Visitor Attractions Report. Wave 2 Post-Easter holidays
 Tourism Business Monitor 20 Visitor Attractions Report Wave 2 Post-Easter holidays Background, objectives and research method Tourism Business Monitor designed to measure, monitor and understand tourism
Cotswolds destination report
 Cotswolds destination report 1 VisitEngland Destination tracker: Since April 2015, the national tourist boards of VisitEngland, VisitScotland and VisitWales have been tracking visitor perceptions of holiday
SSAA (VIC) MILDURA BRANCH - SUNRAYSIA PISTOL CLUB SCHEDULE OF EVENTS Class 1 Class 2 Class 3 Class 4 Sat Sun Wed Air Rimfire Less than.
 MILDURA BRANCH - SUNRAYSIA PISTOL CLUB SCHEDULE OF EVENTS Class 1 Class 2 Class 3 Class 4 Sat Sun Wed Air Rimfire Less than.") Sunday 31 Dec - New Years Eve Monday 1 Jan - New Years Day 3-Jan 1 ISSF Air 15 Unlimited Rimfire 14 Unlimited Centrefire 56 Classic Pistol 6-Jan 1 ISSF Air 15 Unlimited Rimfire 14 Unlimited Centrefire
Sunday 31 Dec - New Years Eve Monday 1 Jan - New Years Day 3-Jan 1 ISSF Air 15 Unlimited Rimfire 14 Unlimited Centrefire 56 Classic Pistol 6-Jan 1 ISSF Air 15 Unlimited Rimfire 14 Unlimited Centrefire
Lord Howe Island Visitor Survey 2017
 INTRODUCTION Lord Howe Island Visitor Survey 2017 Lord Howe Island is one of Australia s premier holiday destinations, part of a World Heritage-listed island group that is known for its outstanding natural
2018 MEETING and EVENTS CALENDAR 2018 Version 4 DATE DAY TIME MEETING VENUE. 1st Monday NEW YEAR'S DAY HOLIDAY STATEWIDE
 MASTER BUILDERS ASSOCIATION OF TASMANIA INC. 2018 MEETING and EVENTS CALENDAR 2018 Version 4 DATE DAY TIME MEETING VENUE Jan-18 1st Monday NEW YEAR'S DAY HOLIDAY STATEWIDE 26th AUSTRALIA DAY - Holiday
RECOMMENDED CITATION: Pew Research Center, January, 2015, Most Support Stronger U.S. Ties With Cuba
 NUMBERS, FACTS AND TRENDS SHAPING THE WORLD FOR RELEASE JANUARY 16, 2015 FOR FURTHER INFORMATION ON THIS REPORT: Carroll Doherty, Director of Political Research Jocelyn Kiley, Associate Director, Research
Wiltshire destination report
 Wiltshire destination report 1 VisitEngland Destination tracker: Since April 2015, the national tourist boards of VisitEngland, VisitScotland and VisitWales have been tracking visitor perceptions of holiday
TOURISM PERFORMANCE 2017
 3 RD QUARTER TOURISM PERFORMANCE TOTAL STAYOVER ARRIVALS 91,732 TOTAL CRUISE ARRIVALS 99,919 TOTAL VISITOR NIGHTS AVERAGE HOTEL OCCUPANCY 862,376 76.3% ECONOMIC IMPACT $124.7 million HOW WAS OUR THIRD
2018 MEETING and EVENTS CALENDAR 2018 Version 6 DATE DAY TIME MEETING VENUE. 1st Monday NEW YEAR'S DAY HOLIDAY STATEWIDE
 MASTER BUILDERS ASSOCIATION OF TASMANIA INC. 2018 MEETING and EVENTS CALENDAR 2018 Version 6 DATE DAY TIME MEETING VENUE Jan-18 1st Monday NEW YEAR'S DAY HOLIDAY STATEWIDE 26th AUSTRALIA DAY - Holiday
Reno-Tahoe Airport Authority U.S. DOMESTIC INDUSTRY OVERVIEW FOR FEBRUARY
 Inter-Office Memo Reno-Tahoe Airport Authority Date: March 30, 2009 To: Statistics Recipients From: Krys T. Bart, A.A.E., President/CEO Subject: RENO-TAHOE INTERNATIONAL AIRPORT PASSENGER STATISTICS U.S.
QUICK GUIDE TO OWNERSHIP AT THE GRAND COLORADO ON PEAK 8
 QUICK GUIDE TO OWNERSHIP AT THE GRAND COLORADO ON PEAK 8 TABLE OF CONTENTS Grand Colorado on Peak 8 Calendar Wheel 4 Seasons of Ownership at the Grand Colorado on Peak 8 5 2016 2017 Calendar 6 7 2018 2019
With the completion of this project, we would like to follow-up on the projections as well as highlight a few other items:
 TO: FROM: Mayor and Council Interim City Manager Rebecca Underhill, Director of Finance DATE: February 28, 2014 SUBJECT: Water Meter Project Analysis On March 28, 2012, Acting City Manager Mike Loftin
Wed 7 Feb All day CNDBA State Fours - Entries close. Sun 11 Feb All day CNDBA Meeting. Wed 14 Feb All day CNDBA State Triples - Entries Close
 Bowls Calendar Administrator Calendars Bowler of the Year CNDBA Events Junior Events Presidents Days Public Holidays Social Bowls Tournaments Zone/State/District Events 1 Jan - 31 Dec 2018 January 2018
MONTHLY OPERATIONS REPORT SEPTEMBER 2015
 MONTHLY OPERATIONS REPORT SEPTEMBER 215 Table of Contents SEPTEMBER 215 Section Page September Highlights... 3 Strategic Goals Progress Update... 4 Ridership... 6 Revenue... 9 Expenses... 1 System Summary...
Heathrow Airwatch Quarterly Report
 Heathrow Airwatch Quarterly Report Quarterly report for July to September 18 Authors Hao Wu, Nick Rand, Brian Stacey Compilation date 07 November 18 Customer Heathrow Airport Limited Approved by Nick Rand
December 2011 Passenger and Cargo Traffic Statistics Reno-Tahoe International Airport
 December 2011 Passenger and Cargo Traffic Statistics Reno-Tahoe International Airport January 27, 2012 U.S. DOMESTIC INDUSTRY OVERVIEW FOR DECEMBER 2011 All RNO Carriers Systemwide year over year comparison
INFORMATION BULLETIN LEG 6-5KM. BLED (SLO) 9 th September 2018 Bled Lido. LEN Official Sponsors LOC Partners
 9 th September 2018 Bled Lido. LEN Official Sponsors LOC Partners") INFORMATION BULLETIN LEG 6-5KM BLED (SLO) 9 th September 2018 Bled Lido LEN Official Sponsors LOC Partners BLED - A JEWEL AMONG THE ALPS The eternal allure of Bled lies in its magical lake, a shimmering
INFORMATION BULLETIN LEG 6-5KM BLED (SLO) 9 th September 2018 Bled Lido LEN Official Sponsors LOC Partners BLED - A JEWEL AMONG THE ALPS The eternal allure of Bled lies in its magical lake, a shimmering