Investor Presentation
|
|
|
- Jasmin Terry
- 6 years ago
- Views:
Transcription
 CLAUDIO CHAMORRO (CFO) TEL: (562) 22990510 EMAIL: IR@PARAUCO.")
1 1 1 Investor Presentation Third Quarter 2017 CONTACTS SARAH INMON (HEAD OF INVESTOR RELATIONS) EDUARDO PEREZ MARCHANT (CORPORATE FINANCE MANAGER) CLAUDIO CHAMORRO (CFO) TEL: (562) IR@PARAUCO.COM
2 2 Important Disclaimer This document has been prepared by for the purpose of providing general information about the Company. The Company assumes no responsibility for, or makes any representation or warranty, express or implied, with respect to, the accuracy, adequacy or completeness of the information contained herein. The Company expressly disclaims any liability based on such information, errors therein or omissions therefrom. This presentation includes certain statements, estimates and forecasts provided by the Company with respect to it s anticipated future performance and involves significant elements or subjective judgment and analysis that may or may not prove to be accurate or correct. There can be no assurance that these statements, estimates and forecasts will be attained and actual outcomes and results may differ materially from what is estimated or forecast herein. The information contained herein has been prepared to assist interested parties in making their own evaluation of the company and does not purport to be all - inclusive or to contain all the information that a potential counterparty may desire. In all cases, interested parties should conduct their own independent investigation and analysis of the Company. Interested parties can only rely on the result of their own investigation and the representations and warranties made in any definitive agreement that may be executed.
3 3 INTRODUCTION OUR OPERATIONS INVESTMENT HIGHLIGHTS FUTURE DEVELOPMENTS
4 at a glance 4 is the third largest shopping center operator in Chile and Peru, and the fifth largest in Colombia. Indicator Country CHILE PERU COLOMBIA TOTAL GLA (m 2 ) 1 455, , , ,500 Owned GLA (m 2 ) 420, , , ,519 Revenues LTM 3Q17 (US$MM) # of operations SHAREHOLDER STRUCTURE (SEPTEMBER 2017) 6% Others 1% Local mutual funds 21% Foreign investment funds 22% Local brokers MARKET CAP 3 US$MM 2,421 26% Controlling Group 5% Said Yarur Family 3% Abumohor Family 16% Local pension funds DAILY TRADED VOLUME 9M17: US$MM 3.1 OPERATIONAL METRICS BY COUNTRY 14.4% Chile Peru Colombia 46.0% OPERATIONAL METRICS BY FORMAT 78.9% 10. 7% 39.6% TOTAL TOTAL GLA 1 REVENUES 988,500 M 2 2 US$MM % 4.0% 59.8% Regional Neighborhood Outlet Strip center 88.0% 5.0% TOTAL TOTAL GLA 1 REVENUES 988,500 M 2 2 US$MM % 11.6% 5.9% 1.1% Source:. (1) Does not include Marina Arauco nor Mall Center Curicó. (3) Source: Bloomberg (2) Revenues from October September Exchange Rate: US$=
5 In the last five years has doubled GLA, revenues and EBITDA 1982 Kennedy opens as first shopping center in Chile 1993 Arauco Maipu inaugurates in Santiago 5 GLA (1) M 2 559, , x 728, , , , LTM 3Q S.A. IPO 1997 Inauguration of Marina Arauco in Viña del Mar, Chile 2006 expands into Peru with the purchase of a 45% stake in MegaPlaza Norte in Lima 2008 acquires Arauco Estación in Santiago, Chile 2010 opens first mall in Colombia, Parque Arboleda in Pereira 2011 Capital increase for US$145 MM 2012 enters outlet format in Chile by acquiring Arauco Premium Outlet Buenaventura 2014 Capital increase for US$182 MM 2015 Purchase of minority shareholders in Colombia and Peru 2016 Capital increase for US$100 MM REVENUES (1) US$ MM x LTM 3Q17 Source:. Exchange Rate: US$= (1) Does not include Marina Arauco nor Mall Center Curicó EBITDA (1) US$ MM x LTM 3Q17 191
6 The spread over the cost of capital of our last projects is approximately 3% 6 9% 6% 3% Source: REAL CAP RATE (1) REAL WACC (2) SPREAD OVER REAL WACC (1) Real cap rate is the yield on cost rate averaged by amount invested and considers the following properties: Arauco Express Calama, Arauco Express Ciudad Empresarial I, Arauco Express Colón, Arauco Express Huechuraba, Arauco Express Irarrázaval, Arauco Express Las Brujas, Arauco Express Luis Pasteur, Arauco Express Manuel Montt, Arauco Express Palmares, Arauco Premium Outlet Buenaventura, Arauco Premium Outlet Curauma, Arauco Premium Outlet San Pedro, Arauco Premium Outlet Coqumbo, Arauco Quilicura, MegaPlaza Chimbote, MegaPlaza Express Villa El Salvador, MegaPlaza Express Chincha, InOutlet Faucett, Viamix Chorrillos, Viamix Las Malvinas, InOutlet Premium Lurín, MegaPlaza Cañete, MegaPlaza Express Barranca, MegaPlaza Pisco, El Quinde Cajamarca, El Quinde Ica, Plaza Jesús María, Parque Caracolí. (2) Weighted Average Cost of Capital
7 7 Return s value creation is proven by the fact that it has had one of the highest Return of the real estate sector in the last years TOTAL RETURN 1, LAST 5 YEARS ANNUALIZED, LOCAL CURRENCY TOTAL RETURN 1, LAST 10 YEARS ANNUALIZED, LOCAL CURRENCY 15% S&P % 10% Iguatemi 9% Unibail 8% Klepierre Hammerson 6% Multiplan Falabella 6% IPSA Source: Bloomberg (1) return includes dividends as of October 31, % 6% 5% Simon 4% Macerich 3% GGP 2% Fibra Uno -2% Intu -3% Aliansce -4% -5% -6% Cencosud BR Malls Taubman 21% Falabella 18% Simon 16% Taubman 15% Klepierre 13% Fibra Uno 12% Macerich 11% IPSA 10% Cencosud 9% Multiplan 8% Unibail 8% GGP 8% S&P 8% Iguatemi 7% BR Malls 7% Hammerson 5% Aliansce 4% Intu 0%

8 Revenue type and contract duration 8 FIXED VS VARIABLE RENTAL REVENUES AS OF SEPTEMBER 31, % Other Revenues 85% Rental Revenues CONTRACT LENGTH (BASED ON % OF REVENUES) 40% 100% 14% Variable Revenues 32% 14% 14% 86% Fixed Revenues Our rental revenues are derived primarily from fixed contracts and are protected against inflation 2 YEARS 2-3 YEARS 3-4 YEARS 4 YEARS TOTAL 40% of our contracts have a duration of more than 4 years and the average length is 6.0 years
9 Purpose, Mission and Corporate Values 9 CORPORATE PURPOSE OUR VALUES Our purpose is to create spaces that contribute to improving people s lives. MISSION Our mission is to be leaders in developing and operating real estate assets, through profitable and sustainable growth that generates value for our stakeholders PILLARS OF OUR CULTURE Happiness Excellence STRATEGIC OBJECTIVES Growth Profitability Sustainability Respect for people and the environment Choose the Right option, not the easiest one Create a work environment that inspires an exceptional Te a m Openness to change and innovation Make things happen
10 10 INTRODUCTION OUR OPERATIONS INVESTMENT HIGHLIGHTS FUTURE DEVELOPMENTS


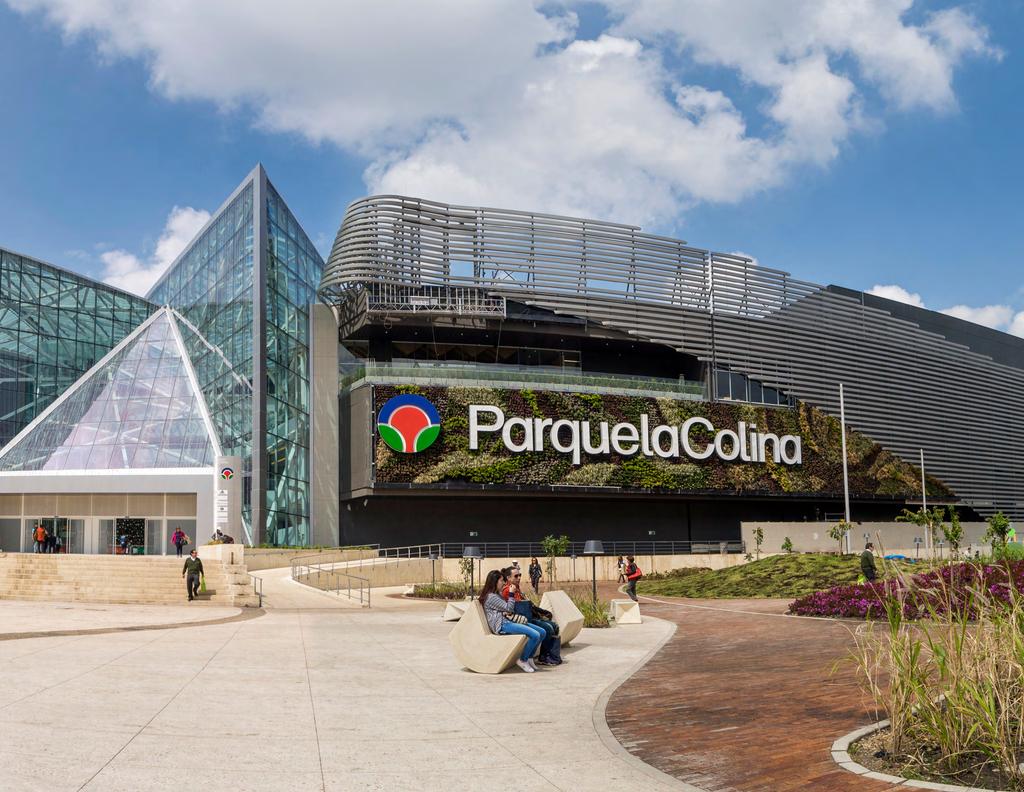
11 has iconic and dominant shopping centers in Chile, Peru and Colombia 11 has iconic shopping centers in all three countries PARQUE ARAUCO KENNEDY - CHILE ARAUCO MAIPÚ - CHILE LARCOMAR - PERÚ PARQUE LA COLINA- COLOMBIA MEGAPLAZA NORTE - PERÚ ARAUCO ESTACIÓN - CHILE
12 "Market Specialist" 12 is concentrated in Santiago and Lima, which makes the company a market specialist in these cities Lima Santiago INOUTLET FAUCETT LARCOMAR INOUTLET PREMIUM LURÍN MEGAPLAZA NORTE JESUS MARIA VILLA CHORRILLOS VILLA EL SALVADOR Lima 1 : 20% of NOI Lima Santiago ARAUCO QUILICURA ARAUCO MAIPÚ ARAUCO PREMIUM OUTLET BUENAVENTURA PARQUE ARAUCO KENNEDY ARAUCO ESTACIÓN Santiago 1 : 52% of NOI (1) Santiago represents 78% of the NOI of Chile, Lima represents 66% of the NOI of Peru, and Bogota represents 7% of the NOI of and 63% of the NOI of Colombia in the third quarter of 2017.
13 Chilean Portfolio Colombia 13 In Chile has 7 regional shopping centers, 4 outlets and 14 strip centers. The average age of the portfolio is 16 years. Perú Chile GLA (m 2 ) % Ownership Owned GLA (m 2 ) Occupancy Year of incorporation Kennedy 112, % 112, % 1982 Arauco Maipú 74, % 74, % 1993 Arauco Chillán 32, % 32, % 2007 Arauco Estación 66,500 83% 55, % 2008 Arauco San Antonio 28,500 70% 19, % 2009 Arauco Express 1 33,000 53% 17, % 2012 Arauco Premium Outlets 2 47, % 47, % 2012 Arauco Quilicura 32, % 32, % 2013 Arauco Coronel 30, % 30, % 2017 Chile 455,500 92% 420, % Chile Source: (1) Arauco Express has 14 Stripcenters in Chile: 11 strip centers in Santiago, 1 in Viña del Mar, 1 in Calama, and 1 in Antofagasta. (2) Arauco Premium Outlet has four outlets located in Santiago, Concepción, Coquimbo and Curauma.
14 Peruvian Portfolio Colombia In Peru in the company has 6 regional shopping centers and 9 neighborhood shopping centers, 2 outlets and 2 strip centers. The average age of the portfolio is 6 years. Perú Peru GLA (m 2 ) % Ownership Owned GLA (m 2 ) Occupancy Year of incorporation MegaPlaza Norte 111,500 50% 55, % 2006 MegaPlaza Express Villa Chorrillos 8,000 50% 4, % 2009 Larcomar 26, % 26, % 2010 Parque Lambramani 29, % 29, % 2010 MegaPlaza Chimbote 28,000 50% 14, % 2012 MegaPlaza Express Villa El Salvador 9,500 50% 4, % 2012 MegaPlaza Express Chincha 9,000 50% 4, % 2013 InOutlet and Viamix (2) 23, % 23, % 2013 MegaPlaza Cañete 16,500 50% 8, % 2013 MegaPlaza Express Barranca 10,000 50% 5, % 2013 MegaPlaza Pisco 14,500 50% 7, % 2015 El Quinde Cajamarca 31, % 31, % 2015 El Quinde Ica 36, % 36, % 2015 Plaza Jesús María 14, % 14, % 2016 MegaPlaza Jaén 14,500 50% 7, % 2016 MegaPlaza Huaral 9,000 50% 4, % 2017 Peru 391,000 71% 275, % Chile Source: (1) Only partner in peru is Grupo Wiese, which includes MegaPlaza formats (50%). (2) InOutlet and Viamix includes two premium outlets in Lima and two strip centers in Lima.
15 Colombian Portfolio Colombia has 3 regional shopping centers in Colombia and the average age of the portfolio is 3 years Perú Colombia GLA (m 2 ) % Ownership Owned GLA (m 2 ) Occupancy Year of incorporation Parque Arboleda 41,000 55% 22, % 2010 Parque Caracoli 38, % 38, % 2013 Parque La Colina 62, % 62, % 2016 Colombia 142,000 87% 123, % Chile Source:ParqueArauco
16 16 INTRODUCTION OUR OPERATIONS INVESTMENT HIGHLIGHTS FUTURE DEVELOPMENTS
17 Portfolio 6. Important growth opportunities Our operations 1. Consistent results in a challenging macroeconomic environment 17 has 3 regional shopping centers in Colombia and the average age of the portfolio is 3 years 5. Conservative debt structure and outstanding financial performance Investment Highlights 2. Stable and diversified revenues 4. Solid corporate governance and increased concern with sustainability 3. Strong commercial relationships with local and global businesses
18 Consistent results in a challenging macroeconomic environment 18 Positive but weaker macroeconomic outlook and attractive industry dynamics is positioned in countries with strong macroeconomic prospects GDP GROWTH RETAIL SALES GROWTH Chile Peru Colombia Chile Peru Colombia 2.3% 1.6% 1.7% 3.3% 3.9% 3.5% 3.1% 1.9% 2.3% 7.4% 6.0% 4.9% 8.2% 4.9% 7.6% 5.9% 7.1% 7.2% f f f POPULATION (MILLIONS) GDP PER CAPITA, PPP Chile Peru Colombia Chile Peru Colombia f f f Av. Latam: , , , f 12, , , f 13, , , f Av. Latam: 15,078 Source: GDP Growth, Population and GDP Per Capita: International Monetary Fund. Retail Sales: Euromonitor.
19 Consistent results in a challenging macroeconomic environment Results have been positive in all three countries 19 Chile GLA 1 Tenant Sales 1 Country Level Revenues 1 Country Level EBITDA 1,2 +8.3% +8.4% +8.3% +7.8% 420, ,500 1,542 1, LTM 3Q16 LTM 3Q17 LTM 3Q16 LTM 3Q17 LTM 3Q16 LTM 3Q17 LTM 3Q16 LTM 3Q % +5.4% +3.8% +9.7% Peru 374, , Colombia LTM 3Q16 LTM 3Q17 LTM 3Q16 LTM 3Q17 LTM 3Q16 LTM 3Q17 LTM 3Q16 LTM 3Q % +75.2% % % 79, , LTM 3Q16 LTM 3Q17 LTM 3Q16 LTM 3Q17 LTM 3Q16 LTM 3Q17 LTM 3Q16 LTM 3Q (1) In MMUSD using the following exchange rates: US$1= CLP , US$1= PEN 3.26, US$1= COP 2, (2) Including overhead expenses (Corporate headquarters, regional Services Center, Chile Division, Peru Division and Colombia Division)
20 Consistent results in a challenging macroeconomic environment Consistent Same Store Growth and a Healthy Occupancy Cost 20 CHILE SAME STORE SALES CHG. % CHILE SAME STORE RENT CHG. % CHILE OCCUPANCY COST % 10.7% 58% Others 42% Anchor Stores 3Q16 4Q16 1Q17 2Q17 3Q17 3Q16 4Q16 1Q17 2Q17 3Q17 3Q16 3Q17 PERU SAME STORE SALES 1 CHG. % PERU SAME STORE RENT 1 CHG. % PERU OCCUPANCY COST % 7.4% Q16 4Q16 1Q17 2Q17 3Q17 3Q16 4Q16 1Q17 2Q17 3Q17 3Q16 3Q17 COLOMBIA SAME STORE SALES 1 CHG. % COLOMBIA SAME STORE RENT 1 CHG. % COLOMBIA OCCUPANCY COST % 12.0% % Others 70% Others 59% Anchor Stores 30% Anchor Stores 3Q16 4Q16 1Q17 2Q17 3Q17 3Q16 4Q16 1Q17 2Q17 3Q17 3Q16 3Q17 1) Peru s Same Store Sales and Same Store Rent in 4Q16 do not include Larcomar due to contingencies.
21 Stable and diversified revenues diversifies its market risks at a country, format, and socio-economic level 21 COUNTRY LEVEL DIVERSIFICATION (%REVENUES) FORMAT LEVEL DIVERSIFICATION (% REVENUES) Chile Peru Colombia Regional Neighborhood Outlet Strip center 11.6% 28.6% 5.0% 5.9%1.1% 59.8% 88.0% SOCIO-ECONOMIC LEVEL DIVERSIFICATION (% REVENUES) 52 Medium to High Income: Includes ABC1 and C2 in Chile, A and B in Peru and 6, 5 and 4 in Colombia Medium Income: Includes C3 and D in Chile, C and D in Peru and 3 in Colombia Medium to Low Income: Includes E in Chile and Peru and 2 and 1 in Colombia


22 Stable and diversified revenues With a 39% market share in Chile, is the outlet market leader in the countries where we operate 22 Outlets currently in our portfolio ARAUCO PREMIUM OUTLET BUENAVENTURA, CHILE ARAUCO PREMIUM OUTLET CONCEPCIÓN, CHILE ARAUCO PREMIUM OUTLET CURAUMA, CHILE INOUTLET FAUCETT, PERÚ INOUTLET PREMIUM OUTLET LURIN, PERÚ Keys to the Premium Outlet Format >> 1 >> Location Located near main cities 2 >> Brands Premium name-brands 3 >> Discounts More than 30% discount ARAUCO PREMIUM OUTLET CURAUMA, CHILE


23 Strong commercial relationships with local and global brands Consolidated commercial relationships with well-known tenants 23 Malls Country GLA (m 2 ) Years as a client Anchor Stores >> CHILE PERU COLOMBIA CHILE PERU CHILE PERU CHILE PERU 96, ,548 48,050 33, Non Anchor Stores Source: >> 4 CHILE PERU 8, COLOMBIA CHILE 7, COLOMBIA CHILE 12 PERU 6,058 9 COLOMBIA CHILE 2, COLOMBIA
24 Strong commercial relationships with local and global brands is supporting the globalization of several brands entering the Andean region 24 NEW TENANTS PARQUE ARAUCO KENNEDY IN THE LAST 5 YEARS: NOMBRE GLA NOMBRE GLA FOREVER 21 1,639 ETIQUETA NEGRA 209 TOP SHOP 464 MICHAEL KORS 208 UNDER ARMOUR 445 RALPH LAUREN 207 LOUIS VUITTON 420 TORY BURCH 201 GUCCI 406 ERMENEGILDO ZEGNA 197 BANANA REPUBLIC 363 ENTEL 190 AMERICAN EAGLE 351 ARTE ISABEL ANINAT 161 AEROPOSTALE 342 VICTORIA S SECRET 129 DOLCE & GABBANA 316 ETAM 123 BURBERRY 276 MILK 117 EMPORIO ARMANI 247 CANELA HOME & DECOR 105 SALVATORE FERRAGAMO 241 METRO CUADRADO 114 TIFFANY & CO 219 JUSTICE 104 EL VOLCAN 218 BATH & BODY WORKS 103 BOLD 214 OCTOBER 102 OTHERS 3,020 TOTAL 14,956 INTERNATIONAL LOCAL >> 80% of new GLA leased in Parque Arauco Kennedy over the last 5 years has been leased to international brands. Many brands have opened their first store in Chile in Kennedy during the last five years including Tiffany & Co., Dolce & Gabbana, Forever 21, Bath & Body Works, Tory Burch, Victoria s Secret, Omega, Versace Collection, Vince Camuto, and BCBG. Source:


25 Solid corporate governance and increased concern with sustainability has received important recognitions from local and international organizations 25 Workplace Recognition Management Recognition was recognized by Great Place to Work in Chile and Peru in Investor Relations Recognition Best Capital Markets Strategy: Andes in Sustainability Recognition Best Investor Relations Department for Mid-Size companies according to Santander and Revista Capital in For the second year running, in 2017 Parque Arauco is part of the Dow Jones Emerging Market Sustainability Index. We are the first Latin American real estate company to be part of this prestigious index. Source:
 and residual consumption in Chile, Peru and Colombia. 2.")
26 Solid corporate governance and increased concern with sustainability In the last years we have continued advancing our sustainability strategy Highlights Environmental Management 1.We established the baseline for energy, water, greenhouse gases (GHG) and residual consumption in Chile, Peru and Colombia. 2.We developed an environmental management model, which will be implemented in We continued sustainably building projects in Colombia (Parque La Colina) and Peru (InOutlet Premium Lurin). 4.We began a study to identify and prioritize climate change risks in some of our assets and projects. Social Management 5.We worked on designing a community relationship strategy and policy applicable to all of operations. 6.We approved and implemented a corporate donation policy. 7.More than 20 foundations or social organization had access to free space in our assets. 8.Our intellectual disability intern program had more than 40 participants. 9.We supported more than 340 small entrepreneurs, with more than 20 local and emerging entrepreneur fairs. Corporate Governance 10. We evaluated our corporate governance practices with an expert consultant in this matter. 11. We redefined our values, purpose, mision and long term strategy. 12.We strengthened our risk management team, which performed an exhaustive examination of this matter. 13.We initiated a diagnostic with international experts in safety and security standards in our assets. 14.We continued being one of the best places to work, according to the ranking Great Place to Work. Other Highlights 15.We adhere to the United Nations Global Compact. 16. We are the first Latin American Real Estate Company to enter into the Dow Jones Sustainability Emerging Markets Index. Source:
27 Conservative debt structure and outstanding financial performance 's policy is to finance projects with 50% debt and 50% equity, and is comfortably within all its covenants 27 LIABILITIES EQUITY 0.78x 0.89x 0.81x 1.14x 1.18x 1.15x NET FINANCIAL DEBT EQUITY < 1.40x < 1.50x 0.43x 0.59x 0.47x 0.76x 0.72x x 0.78x Q Q17 EBITDAFINANCIAL EXPENSES 3.89x 3.42x 3.37x 3.33x 3.04x 3.18x > 2.50x NET FINANCIAL DEBTEBITDA 5.00x 4.25x 3.85x 5.87x 5.88x 5.72x Q Q17
28 Conservative debt structure and outstanding financial performance The Company has a conservative debt structure 28 IMPROVEMENT IN LOCAL DEBT RATING Fitch: AA- Feller: AA- ICR:AA- LIABILITY AMORTIZATION PROFILE AND DURATION 1 September 2014 (US$MM) Average Duration: 3.6 Years 267 BBB- BBB BBB+ A- A A+ AA- AA AA+ SUMMARY OF DEBT BY CURRENCY 54% UF SEPTEMBER % COP SUMMARY OF DEBT RATES 94% Fixed SEPTEMBER DEC % CLP SEPTEMBER % CLP 67% UF 12% PEN 16% PEN 11% USD 10% COP 6% Variable 93% Fixed SEPTEMBER DEC % Variable months months months months 7-12 months September 2017 (US$MM) Average Duration: 6.8 Years months months months months months 6-10 years years months months months months 6-10 years Source: (1) Does not include accrued interests and the exchange rate is at the close of September 30, years years years
29 Conservative debt structure and outstanding financial performance The cost of debt has decreased importantly in the past 5 years 29 Date: Base: 1.66% Spread: 1.74% Duration: 14.3 Date: Base: 1.62% Spread: 1.68% Duration: Date: Base: 1.46% Spread: 1.02% Duration: Generic long-term bond issued by in Chile The cost of debt of has decreased 160 points from 4.1% to 2.5% The spread five years ago had collateral agreements, while the current spread is unsecured with no collateral. Source: Risk America
30 30 Important growth opportunities has 0.9 million m 2 and a 2% market participation in Latin American and a 8% market participation in the Andean Region. Mexico GLA: 17.4 million m 2 38% of total Brazil GLA: 14.7 million de m 2 32% of total Latin America GLA: 45.4 million m 2 Indicator CHILE PERU COLOMBIA GLA (th) 3,600 2,700 4,900 GLA (th) Market Share 13% 14% 3% Rank #3 #3 #5 Andean Region GLA: 11.2 million m 2 25% of total Argentina Source: Prepared using information published by the International Council of Shopping Centers (ICSC)., Peruvian Shopping Center Council (ACCEP), Colombian Shopping Center Association (ACE) and analysis GLA: 2.1 million m 2 5% of total
31 Important growth opportunities participates in markets with a growing retail market 31 RETAIL SALES PER CAPITA AND GLA PER 1,000 INHABITANTS 1 2,500 16,000 GLA per 1,000 habitants 2,000 1,500 1, United States Canada Australia UK Chile Mexico Colombia Peru Brazil Argentina 12,000 8, Retail Sales Per Capita AT KEARNEY GRDI WINDOW OF OPPORTUNITY 2 OPENING PEAKING MATURING CLOSING Brazil Mexico Colombia Peru Chile GLA per 1,000 habitants Retail sales per capita RETAIL PRESENCE BY COUNTRY 3 (% OF GLOBAL BRANDS IN COUNTRY) 57.5% UK 51.5% United States 39.5% Mexico 21.0% Chile 20. 7% Brazil 11.7% 10.2% Argentina Venezuela 9.9% Peru Middle class is growing; consumers are willing to explores organized formats; government is relaxing restrictions Consumers seek organized formats and greater exposure to global brands; retail shopping districts are being developed; real estate is affordable and available Consumer spending has expanded significantly; desirable real estate is more difficult to secure; local competition has become more sofisticated Consumes are more used to modern retail; discretionary spending is higher; competition is fierce both from local and foreign retailers; real estate is expensive and not readily available (1) Source: International Council of Shopping Centers, World Bank, analysis (2) Source: AT Kearney Global Retail Development Index 2017 (3) Source: CBRE- How Global is the business of retail?. This report did not include Colombia.
32 Important growth opportunities 's growth has come from greenfield projects and M&A 32 43, , ,500 90,000 91, , , ,858 37,400 67% Greenfields 662,643 m 2 194,745 GLA in ,651 GLA in ,708 24, 595 GLA in 2008 GLA in 2009 GLA in 2010 GLA in 2011 GLA in 2012 GLA in 2013 GLA in 2014 GLA in 2015 New GLA in 2016 New GLA in % GLA 3Q2017 M&A 325,857 m 2 Greenfield M&A Source:
33 33 INTRODUCTION OUR OPERATIONS INVESTMENT HIGHLIGHTS FUTURE DEVELOPMENTS
34 Future Developments and onwards New Projects Type Country Format Estimated Opening Date GLA m 2 % ownership Owned GLA m 2 Investment Local Currency Parque Angamos Development Chile Neighborhood 2H18 11,000 55% 6, , Arauco Express Coquimbo Development Chile Strip Center 2H18 3,000 53% 1, ,000 6 MegaPlaza Villa El Salvador II Development Peru Neighborhood 4Q17 11,000 50% 5,500 36, Varios Proyectos SCP Development Peru Neighborhood 2H18 19, % 19, , Viamix Colonial Development Peru Strip Center 4Q17 3, % 3,000 25,000 8 Arauco Premium Outlet Bogotá Development Colombia Outlet 4Q17 13, % 13,000 78, Subtotal 60,500 48, Investment USDMM Expansions Type Country Format Estimated Opening Date GLA m 2 % ownership Owned GLA m 2 Investment Local Currency Kennedy Expansion 3 Expansion Chile Regional Hotel 2H21 11, % 11,000 5,355, Bazar Gourmet- Kennedy Expansion Chile Regional 2H18 NA 100% NA 120,000 5 El Quinde Cajamarca Expansion Expansion Peru Regional 1H18 2, % 2,500 40, Subtotal 13,500 13, Investment USDMM Projects Incorporated in 2017 Type Country Format Estimated Opening Date GLA m 2 % ownership Owned GLA m 2 Investment Local Currency Arauco Coronel Adquisition Chile Regional 1Q17 30, % 30,000 1,520, MegaPlaza Express Huaral Development Peru Neighborhood 1Q17 9,000 50% 4,500 46, Parque Lambramani Renovation Renovation Peru Regional 3Q17 NA 100% NA 23,500 7 Hotel Bucaramanga Expansion Colombia Hotel 3Q17 NA 100% NA 19,500 7 Subtotal 39,000 34, Investment USDMM New Landbank 9 113,000 96, Remaining to Invest 282 1) Projects in Chile in UF, in Peru in ThPEN and in Colombia in MCOP 2) Exchange rate as of September 30, 2017: 26,656 CLPUF, 637.9CLPUSD, 2,935.9 COPUSD, 3.26 PENUSD. 2) In addition to the 11,000 m 2, this expansion includes a 401 room Hilton by Hilton Hotel and the largest hotel convention center in Santiago.


35 35 Parque La Colina was inaugurated in December 2016 OPENING DATE: The shopping center opened on December 6, COMMERCIALIZATION STATE: 90.1% of the GLA is open. The restauarant boulevard called Social opened in September, BRANDS:


36 36 We announced a new expansion of Parque Arauco Kennedy HOTEL OPERATOR: PROJECT DETAILS: Investment: 5,355,000 UF 5-star hotel: Hilton by Hilton Rooms: 401 Convention center: 3,000 m 2 Parking spots: 700 Additional GLA: 11,000 m 2 - The project will have the first five star Hilton Hotel in Chile, a convention center, as well as the incorporation of new stores and more parking. - The five star Hilton hotel will have 401 rooms, two restaurants, three bars, two pools, a gym and an executive lounge. It will have the largest hotel convention center in the country, with the possibility of hosting over 2,800 people. - The expansion will include a new flagship Falabella store with almost 25,000 m 2 of GLA. This store will occupy the first four floors of the expansion.
37 37 Landbank Name m 2 % Ownership Cost (local currency) Cost (USD MM) Quilicura 25, % 78,000 3 Buenaventura 115, % 455, Chicureo 47, % 206,000 9 Los Andes 39, % 117,000 5 Others in Chile 57,162 99% 470, Chile 285,380 98% 1,336, Parque El Golf - San Isidro 16,350 68% 127, Chimbote 42, % 18,000 6 Talara 30, % 9,400 3 Ica 12, % 13,500 4 Chiclayo 6, % 6,300 2 Pomalca Chiclayo 45, % 6,565 2 Lambayeque- MegaPlaza 25,260 50% 18,900 6 San Juan de Lurigancho- MegaPlaza 80,000 50% 10,415 3 Others MegaPlaza 106,157 50% 85, Peru 365,393 70% 296, Neiva 49, % 18,000 6 Valledupar 46, % 30, Barranquilla 56, % 76, Colombia 151, % 124, ,476 86% 189 1) Landbank in Chile in UF, in Peru in ThPEN and in Colombia in MCOP 2) Exchange rate as of September 30, 2017: 26,656 CLPUF, CLPUSD, 2,935.9 COPUSD, 3.26 PENUSD.
38 38 Glossary»Adjusted FFO Margin - AFFO revenues»affo -Adjusted Funds From Operations: Net Profit - Depreciation & Amortization - Other Incomeexpenses - Share of Profit (Loss) of Associates Accounted - Foreign Exchange Differences - Income (Loss) for indexed assets and liabilities - Gains (losses) from the difference between the previous book value and the fair value of financial assets - Deferred tax+ Associates accounted Adjusted FFO»Controlling Adjusted FFO -AFFO attributable to the shareholders of the company»controlling FFO -FFO attributable to the shareholders of the company»ebitda - Earnings Before Income Tax Depreciation and Amortization: Revenues + Cost of Sales + Administration Expenses - Depreciation and Amortization EBITDA margin -EBITDA divided by revenues»eps -Earnings Per Share: Net income attributable to the equity holders of the companyweighted average number of shares outstanding»ffo -Funds From Operations: Net Profit - Depreciation & Amortization - Share of Profit (Loss) of Associates Accounted + Associates Accounted FFO»GLA -Gross Leasable Area. Equivalent to the sum of all the areas available for lease»greenfield Projects - Organic development of new shopping centers»landbank -Land held by the company for future development»ltm -Refers to information from the last twelve months»monthly Revenuesm 2 -Monthly revenues divided by the occupied GLA for the period»monthly Salesm 2 -Monthly tenant sales divided by the occupied GLA for the period»neighborhood Mall -A shopping mall with a GLA between 6,000 and 20,000 m 2» Net income margin -Net profit revenues»noi -Net Operating Income: Revenues + Cost of Sales + Administration Expenses - Depreciation & Amortization + Associates accounted NOI»Occupancy -GLA paying rent divided by total GLA»Occupancy cost -Minimum rent, plus variable rent, plus common expenses, plus a promotion fund that the tenants pay divided by the sales of the tenant.»owned GLA - GLA weighted by s interest in the mall»pipeline -Greenfield and expansion projects under development»premium Outlet - Shopping center located outside of the city offering name brand clothing and goods for a reduced price»regional Mall - A shopping mall with a GLA over 20,000 m 2.»SSR -Same Store Rent: Percentage change in rent collected from tenants that paid rent in both of the periods compared»sss -Same Store Sales: Percentage change in sales from tenants that reported sales in both of the periods compared»strip Center -A shopping center with a GLA less than 6,000 m 2 Tenant Sales Tenant sales of the consolidated assets»uf -Unidad de Fomento: A chilean currency unit indexed according to inflation on a daily basis.
39
Investor Presentation
 1 Investor Presentation Fourth Quarter 2017 CONTACTS SARAH INMON (HEAD OF INVESTOR RELATIONS) FRANCISCO MOYANO (CORPORATE FINANCE MANAGER) CLAUDIO CHAMORRO (CFO) TEL: (562) 22990510 EMAIL: IR@PARAUCO.COM
[First Quarter 2018] INVESTOR PRESENTATION CONTACTS
![[First Quarter 2018] INVESTOR PRESENTATION CONTACTS](/thumbs/82/84951186.jpg "[First Quarter 2018] INVESTOR PRESENTATION CONTACTS") 1 INVESTOR PRESENTATION [] CONTACTS Sarah Inmon (Head of Investor Relations) Francisco Moyano (Corporate Finance Manager) Claudio Chamorro (CFO) Tel: (562) 22990510 Email: ir@parauco.com «4 17 IMPORTANT
1 INVESTOR PRESENTATION [] CONTACTS Sarah Inmon (Head of Investor Relations) Francisco Moyano (Corporate Finance Manager) Claudio Chamorro (CFO) Tel: (562) 22990510 Email: ir@parauco.com «4 17 IMPORTANT
[Fourth Quarter 2018]
![[Fourth Quarter 2018]](/thumbs/94/120362367.jpg "[Fourth Quarter 2018]") INVESTOR PRESENTATION [] CONTACTS Tori Creighton (Head of Investor Relations) Francisco Moyano (Corporate Finance Manager) Claudio Chamorro (CFO) Tel: (562) 22990510 Email: ir@parauco.com IMPORTANT DISCLAIMER
INVESTOR PRESENTATION [] CONTACTS Tori Creighton (Head of Investor Relations) Francisco Moyano (Corporate Finance Manager) Claudio Chamorro (CFO) Tel: (562) 22990510 Email: ir@parauco.com IMPORTANT DISCLAIMER
INVESTOR PRESENTATION
 INVESTOR PRESENTATION MARCH 214 1 DISCLAIMER THIS DOCUMENT HAS BEEN PREPARED BY PARQUE ARAUCO FOR THE PURPOSE OF PROVIDING GENERAL INFORMATION ABOUT THE COMPANY. The Company assumes no responsibility for,
INVESTOR PRESENTATION SEPTEMBER 2015
 INVESTOR PRESENTATION SEPTEMBER 2015 DISCLAIMER THIS DOCUMENT HAS BEEN PREPARED BY PARQUE ARAUCO FOR THE PURPOSE OF PROVIDING GENERAL INFORMATION ABOUT THE COMPANY. The Company assumes no responsibility
Parque Arauco Day Colombia. October 2017
 Parque Arauco Day Colombia October 2017 2 Agenda Parque Arauco Corporate Overview Parque Arauco Colombia Overview Industry Managing Parque La Colina Organizational Improvements Mixed Use Rationale for
Investment Highlights
 Third Quarter 2014 Investment Highlights 1 Mexican airport portfolio positioned to take full advantage of global growth. 2 Diversified business model contributing to earnings resilience. 3 Well-defined
2016 port Parque Arauco
 Arauco 1Parque / 2 Contents 03 / 29/ [ Time to Recap the Year] [ Our Corporate Governance] 07 / 36 / [ Time to Get to Know Our Company ] [ More About Us ] 13 / [ Our Culture ] 72 / [ Financial Statements
Investment Highlights
 Second Quarter 2014 Investment Highlights 1 Mexican airport portfolio positioned to take full advantage of global growth. 2 Diversified business model contributing to earnings resilience. 3 Well-defined
ANNUAL REPORT Parque Arauco S.A. Diseño: Impresión:
 ANNUAL REPORT Parque Arauco 2015 Parque Arauco for everyone Parque Arauco is for everyone. Each corner is designed so that you, your family and friends have a good time together. We have conceptualized
Bank of America Merrill Lynch Emerging Markets Corporate Conference. Miami, June 2016
 Bank of America Merrill Lynch Emerging Markets Corporate Conference Miami, June 2016 This presentation may include forward-looking comments regarding the Company s business outlook and anticipated financial
Santander 22 nd Annual Latin American Conference. Cancun, January 2018
 Santander 22 nd Annual Latin American Conference Cancun, January 2018 This presentation may include forward-looking comments regarding the Company s business outlook and anticipated financial and operating
Copa Holdings Reports Net Income of $49.9 million and EPS of $1.18 for the Second Quarter of 2018
 Copa Holdings Reports Net Income of $49.9 million and EPS of $1.18 for the Second Quarter of 2018 Panama City, Panama --- Aug 8, 2018. Copa Holdings, S.A. (NYSE: CPA), today announced financial results
Copa Holdings Reports Record Earnings of US$41.8 Million for 4Q06 and US$134.2 Million for Full Year 2006
 Copa Holdings Reports Record Earnings of US$41.8 Million for 4Q06 and US$134.2 Million for Full Year 2006 Panama City, Panama --- March 7, 2007. Copa Holdings, S.A. (NYSE: CPA), parent company of Copa
OPERATING AND FINANCIAL HIGHLIGHTS
 Copa Holdings Reports Net Income of US$18.6 Million and EPS of US$0.42 for the Second Quarter of 2010 Excluding special items, adjusted net income came in at $26.3 million, or $0.60 per share Panama City,
Santander 20 th Annual Latin America CEO Conference Cancun, January 2016
 Santander 20 th Annual Latin America CEO Conference Cancun, January 2016 This presentation may include forward-looking comments regarding the Company s business outlook and anticipated financial and operating
Third Quarter 2015 Results
 Third Quarter 2015 Results Investment Highlights Positioned to take full advantage of global growth Diversified business model Well-defined strategy to capitalize on favorable industry dynamic Successful
Parques Reunidos Corporate Presentation March 2016
 Parques Reunidos Corporate Presentation March 216 Disclaimer The information contained in this presentation (the Presentation ), including but not limited to forward-looking statements, is provided as
Results 1 st Quarter 2005
 Grupo Posadas, s, S.A. de C.V. & Subsidiaries April 28, 2005 Results 1 st Quarter 2005 Total revenues increase 13% in the quarter Higher demand in urban hotels Better results in coastal hotels 3 openings
UBS 14 th Global Emerging Markets Conference. New York, November 2016
 UBS 14 th Global Emerging Markets Conference New York, November 2016 This presentation may include forward-looking comments regarding the Company s business outlook and anticipated financial and operating
Copa Holdings Reports Fourth Quarter and Full Year 2007 Results
 Copa Holdings Reports Fourth Quarter and Full Year 2007 Results Panama City, Panama --- February 21, 2008. Copa Holdings, S.A. (NYSE: CPA), parent company of Copa Airlines and Aero Republica, today announced
OPERATING AND FINANCIAL HIGHLIGHTS
 Copa Holdings Reports Financial Results for the Fourth Quarter of 2018 Excluding special items, adjusted net profit came in at $44.0 million, or Adjusted EPS of $1.04 Panama City, Panama --- February 13,
OPERATING AND FINANCIAL HIGHLIGHTS SUBSEQUENT EVENTS
 Copa Holdings Reports Net Income of US$6.2 Million and EPS of US$0.14 for the Third Quarter of 2015 Excluding special items, adjusted net income came in at $37.4 million, or EPS of $0.85 per share Panama
Bank of America Merrill Lynch 2018 Emerging Markets Corporate Credit Conference. Miami, May 2018
 Bank of America Merrill Lynch 2018 Emerging Markets Corporate Credit Conference Miami, May 2018 This presentation may include forward-looking comments regarding the Company s business outlook and anticipated
OPERATING AND FINANCIAL HIGHLIGHTS. Subsequent Events
 Copa Holdings Reports Net Income of $103.8 million and EPS of $2.45 for the Third Quarter of 2017 Excluding special items, adjusted net income came in at $100.8 million, or EPS of $2.38 per share Panama
OPERATING AND FINANCIAL HIGHLIGHTS. Subsequent Events
 Copa Holdings Reports Financial Results for the First Quarter of 2016 Excluding special items, adjusted net income came in at US$69.9 million, or EPS of US$1.66 per share Panama City, Panama --- May 5,
Copa Holdings Reports Net Income of US$51.9 Million for the Fourth Quarter of 2008 and US$152.2 Million for Full Year 2008
 Copa Holdings Reports Net Income of US$51.9 Million for the Fourth Quarter of 2008 and US$152.2 Million for Full Year 2008 Panama City, Panama --- February 19, 2009. Copa Holdings, S.A. (NYSE: CPA), parent
OPERATING AND FINANCIAL HIGHLIGHTS. Subsequent Events
 Copa Holdings Reports Net Income of US$113.1 Million and EPS of US$2.57 for the First Quarter of 2015 Excluding special items, adjusted net income came in at US$106.0 million, or EPS of US$2.41 per share
OPERATING AND FINANCIAL HIGHLIGHTS
 Copa Holdings Reports Financial Results for the Fourth Quarter of 2015 Excluding special items, adjusted net income came in at $31.7 million, or EPS of $0.73 per share Panama City, Panama --- February
Copa Holdings Reports Earnings of US$30.3 Million and EPS of US$0.70 for 3Q08
 Copa Holdings Reports Earnings of US$30.3 Million and EPS of US$0.70 for 3Q08 Panama City, Panama --- November 13, 2008. Copa Holdings, S.A. (NYSE: CPA), parent company of Copa Airlines and Aero Republica,
Copa Holdings Reports Net Income of US$113.9 Million for the Fourth Quarter of 2013
 Copa Holdings Reports Net Income of US$113.9 Million for the Fourth Quarter of 2013 Panama City, Panama --- February 12, 2014. Copa Holdings, S.A. (NYSE: CPA), today announced financial results for the
J.P. Morgan 9 th Annual Global Emerging Markets Corporate Conference. Miami, February 2018
 J.P. Morgan 9 th Annual Global Emerging Markets Corporate Conference Miami, February 2018 This presentation may include forward-looking comments regarding the Company s business outlook and anticipated
Forward-Looking Statements Statements in this presentation that are not historical facts are "forward-looking" statements and "safe harbor
 2017 Annual Meeting of Shareholders Presentation May 2017 Forward-Looking Statements Statements in this presentation that are not historical facts are "forward-looking" statements and "safe harbor statements"
Results 3 rd Quarter 2003
 Grupo Posadas, s, S.A. de C.V. & Subsidiaries October 28 th, 2003 Results 3 rd Quarter 2003 Total revenue and EBITDA increased by 10 and 12 % respectively Coastal hotels continue to improve, rates on urban
CLSA Asia Investor Forum. January, 2008
 CLSA Asia Investor Forum January, 2008 Forward Looking Statements This presentation contains forward-looking statements regarding operating trends, future results of operations and the completion of new
Copa Holdings Reports Net Income of $136.5 million and EPS of $3.22 for the First Quarter of 2018
 Copa Holdings Reports Net Income of $136.5 million and EPS of $3.22 for the First Quarter of 2018 May 9, 2018 PANAMA CITY, May 9, 2018 /PRNewswire/ -- Copa Holdings, S.A. (NYSE: CPA), today announced financial
OPERATING AND FINANCIAL HIGHLIGHTS
 Copa Holdings Reports Net Income of US$32.0 Million and EPS of US$0.72 for the Second Quarter of 2012 Excluding special items, adjusted net income came in at $58.6 million, or EPS of $1.32 per share Panama
Deutsche Bank 16 th Annual Global Emerging Markets. New York, September 2017
 Deutsche Bank 16 th Annual Global Emerging Markets New York, September 2017 This presentation may include forward-looking comments regarding the Company s business outlook and anticipated financial and
OPERATING AND FINANCIAL HIGHLIGHTS SUBSEQUENT EVENTS
 Copa Holdings Reports Financial Results for the Third Quarter of 2016 Excluding special items, adjusted net income came in at $55.3 million, or adjusted EPS of $1.30 per share Panama City, Panama --- November
Oxley Delivers Stellar Growth of 58% in PATMI to. S$130.9 million for HY2017
 For immediate release Oxley Delivers Stellar Growth of 58% in PATMI to S$130.9 million for HY2017 - Half-year revenue increased by 19% year-on-year to S$732.2 million - Gross profit margin increased from
4Q15 and 2015 Results Presentation. March 30, 2016
 4Q15 and 2015 Results Presentation March 30, 2016 Highlights Paulo Kakinoff CEO Highlights Macro Environment Even more adverse environment for the Brazilian economy, with a GDP drop of 3.8% in 2015 Devaluation
MARRIOTT INTERNATIONAL, INC. PRESS RELEASE SCHEDULES QUARTER 4, 2016 TABLE OF CONTENTS
 PRESS RELEASE SCHEDULES QUARTER 4, 06 TABLE OF CONTENTS Consolidated Statements of Income - As Reported A- Consolidated Statements of Income - Fourth Quarter Adjusted 06 Compared to Combined 05 A-3 Consolidated
Parques Reunidos Expands to Australia with the Acquisition of Wet n Wild Sydney July 2018
 Parques Reunidos Expands to Australia with the Acquisition of Wet n Wild Sydney July 2018 Disclaimer This document does not constitute or form part of any purchase, sales or exchange offer, nor is it an
LAN AIRLINES REPORTS NET INCOME OF US$88.3 MILLION FOR THE FIRST QUARTER OF 2010
 FOR IMMEDIATE RELEASE LAN AIRLINES REPORTS NET INCOME OF US$88.3 MILLION FOR THE FIRST QUARTER OF 2010 Santiago, Chile, April 27, 2010 LAN Airlines S.A. (NYSE: LFL), one of Latin America s leading passenger
FOURTH QUARTER RESULTS 2017
 FOURTH QUARTER RESULTS 2017 KEY RESULTS In the 4Q17 Interjet total revenues added $5,824.8 million pesos that represented an increase of 10.8% over the revenue generated in the 4Q16. In the 4Q17, operating
SIAM FUTURE DEVELOPMENT PUBLIC CO., LTD. Corporate Presentation Q4-15
 SIAM FUTURE DEVELOPMENT PUBLIC CO., LTD. Corporate Presentation Q4-15 Overview Financial Summary Project Update 2 Overview Founded: 1994 Staff: 80 Centers: 22 Vision Unlike other developers, we create
Results 2Q17. August 9, 2017
 Results 2Q17 August 9, 2017 2Q17 Highlights Indicators 2Q17 Var. x 2Q16 ASK (BN) 10.4-3.0% Traffic (000) 7,261-1.3% RPK (BN) 8.1 +0.5% Load Factor 77.9% +2.7 p.p. Yield (R$ cents) 23.2 +4.8% Pax Revenue
Copa Holdings Reports Net Income of $57.7 million and EPS of $1.36 for the Third Quarter of 2018
 Copa Holdings Reports Net Income of $57.7 million and EPS of $1.36 for the Third Quarter of 2018 November 14, 2018 PANAMA CITY, Nov. 14, 2018 /PRNewswire/ -- Copa Holdings, S.A. (NYSE: CPA), today announced
Executive Directors Review
 Financial Summary Turnover for the year ended 31 December 2011 amounted to HK$571.4 million ( 47.6 million) (2010: HK$706.8 million ( 58.7 million)). The turnover was principally attributable to the recognition
Cairo, May 21, TMG Holding reports EGP BN consolidated revenue, EGP 161 MN consolidated net profit
 First Quarter ending Earning Release Cairo, May 21, - reports EGP 1.139 BN consolidated revenue, EGP 161 MN consolidated net profit after minority and EGP 2.2 BN of new sales value for the first quarter
MIRAMAR, Fla., April 29, 2015 (GLOBE NEWSWIRE) -- Spirit Airlines, Inc. (Nasdaq:SAVE) today reported first quarter 2015 financial results.
 -- Spirit Airlines, Inc. (Nasdaq:SAVE) today reported first quarter 2015 financial results.") April 29, 2015 Spirit Airlines Announces First Quarter 2015 Results; Adjusted Net Income Increases 87.1 Percent to $70.7 Million and Pre-Tax Margin Increases 900 Basis Points to 22.7 Percent MIRAMAR, Fla.,
April 29, 2015 Spirit Airlines Announces First Quarter 2015 Results; Adjusted Net Income Increases 87.1 Percent to $70.7 Million and Pre-Tax Margin Increases 900 Basis Points to 22.7 Percent MIRAMAR, Fla.,
UBS Latin American New Opportunities Conference. June 11 th -12 th, 2007
 UBS Latin American New Opportunities Conference June 11 th -12 th, 2007 Company Overview OMA operates a diversified portfolio of 13 airports distributed throughout Northern and Central Mexico and is diversified
Corporate Presentation April 2018
 Corporate Presentation April 2018 1 Grupo Hotelero Santa Fe Ticker: HOTEL (BMV) Financial Highlights (LTM March 31, 2018 ) Revenue: Ps. 1,769 million (US 96 million) EBITDA: Ps. 603 million (US 33 million)
RESULTS RELEASE 20 August GENTING HONG KONG GROUP ANNOUNCES FIRST HALF RESULTS FOR 2015 Highlights
 RESULTS RELEASE 20 August 2015 FOR IMMEDIATE RELEASE INTERNATIONAL GENTING HONG KONG GROUP ANNOUNCES FIRST HALF RESULTS FOR 2015 Highlights The commentary below is prepared based on a comparison of the
Corporate Presentation April 2018
 Corporate Presentation April 2018 1 Grupo Hotelero Santa Fe Ticker: HOTEL (BMV) Financial Highlights (LTM June 30, 2018 ) Revenue: Ps. 1,873 million (US 94 million) EBITDA: Ps. 627 million (US 32 million)
QUARTERLY UPDATE 31 MARCH 2017
 AUSTRALIAN PROPERTY OPPORTUNITIES FUND QUARTERLY UPDATE 31 MARCH 2017 The Australian Property Opportunities Fund (APOF I or the Fund) is pleased to provide this update for the March quarter 2017 (Q1 2017)
Corporate Presentation February 2018 NOMBRE DE LA PRESENTACIÓN
 Corporate Presentation February 2018 NOMBRE DE LA PRESENTACIÓN 1 1 Grupo Hotelero Santa Fe Ticker: HOTEL (BMV) 2017 Financial Highlights Revenue: Ps. 1,582 million (US 80 million) EBITDA: Ps. 528 million
Endesa Chile 1Q14 Results
 Endesa Chile 1Q14 Results May 06 th 2014 Highlights 43% decrease in Net Income attributable to Endesa Chile s shareholders, mainly explained by a higher procurement and services cost and a greater negative
Cairo, November 15, 2016 TMG holding reports EGP 3.9 BN consolidated revenues, EGP 616 MN consolidated net profit
 Nine Months and Third Quarter ending September 30, Earning Release Cairo, November 15, TMG holding reports EGP 3.9 BN consolidated revenues, EGP 616 MN consolidated net profit after minority and EGP 5.5
THIRD QUARTER RESULTS 2018
 THIRD QUARTER RESULTS 2018 KEY RESULTS In the 3Q18 Interjet total revenues added $ 6,244.8 million pesos that represented an increase of 7.0% over the revenue generated in the 3Q17. In the 3Q18, operating
Cebu Air, Inc. 2Q2014 Results of Operation
 Cebu Air, Inc. 2Q2014 Results of Operation 1 Disclaimer This information provided in this presentation is provided only for your reference. Such information has not been independently verified and, as
KERRIE MATHER MANAGING DIRECTOR AND CHIEF EXECUTIVE OFFICER. Macquarie Conference 4 MAY 2016
 KERRIE MATHER MANAGING DIRECTOR AND CHIEF EXECUTIVE OFFICER Macquarie Conference 4 MAY 2016 Disclaimer General securities warning This presentation has been prepared by Sydney Airport Limited (ACN 165
FIRST QUARTER RESULTS 2016
 FIRST QUARTER RESULTS 2016 KEY RESULTS In 1Q16 Interjet total revenues added $3,850.8 million pesos that represented an increase of 21.9% over the income generated in the 1Q15. In 1Q16 total passengers
Management Presentation. March 2016
 Management Presentation March 2016 Forward looking statements This presentation as well as oral statements made by officers or directors of Allegiant Travel Company, its advisors and affiliates (collectively
Analyst and Investor Conference Call Q Ulrik Svensson, CFO and Member of the Executive Board
 Analyst and Investor Conference Call Q2 2017 Ulrik Svensson, CFO and Member of the Executive Board Frankfurt, 2 August 2017 Disclaimer The information herein is based on publicly available information.
MGM Resorts International Reports Second Quarter Financial Results
 NEWS RELEASE MGM Resorts International Reports Second Quarter Financial Results 8/5/2014 Consolidated Adjusted EBITDA Increased 8%, Led By 10% Growth In Wholly Owned Domestic Resorts MGM China Declares
Results 2 nd Quarter 2004
 Grupo Posadas, s, S.A. de C.V. & Subsidiaries July 28 th, 2004 Results 2 nd Quarter 2004 Cosolidated revenues increased 11% EBITDA increased 15% Recovery on REVPAR 3 new openings in the 2Q04, which sum
Adjusted net income of $115 million versus an adjusted net loss of $7 million in the second quarter of 2012, an improvement of $122 million
 Air Canada Reports Record Second Quarter 2013 Results Highest Adjusted Net Income, Operating Income and EBITDAR Results for Second Quarter in Air Canada s History Adjusted net income of $115 million versus
TUI GROUP INVESTOR PRESENTATION
 TUI GROUP INVESTOR PRESENTATION German Investment Conference UniCredit / Kepler Munich, 26-27 September 2012 Future-related statements This presentation contains a number of statements related to the future
THIRD QUARTER RESULTS 2017
 THIRD QUARTER RESULTS 2017 KEY RESULTS In the 3Q17 Interjet total revenues added $5,835.1 million pesos that represented an increase of 22.0% over the revenue generated in the 3Q16. In the 3Q17, operating
Conference Call 1Q14 Results. Investor Relations May 15, 2014
 Conference Call Results Investor Relations May 15, 2014 1 Highlights 2 Highlights Net revenues of R$2.5 billion in the quarter, an increase of 20% or R$411 million quarter-over-quarter; EBIT totaled R$144
Fourth Quarter 2015 Financial Results
 Fourth Quarter 2015 Financial Results AerCap Holdings N.V. February 23, 2016 Disclaimer Incl. Forward Looking Statements & Safe Harbor This presentation contains certain statements, estimates and forecasts
FIRST QUARTER RESULTS 2017
 FIRST QUARTER RESULTS 2017 KEY RESULTS In the 1Q17 Interjet total revenues added $4,421.5 million pesos that represented an increase of 14.8% over the income generated in the 1Q16. In the 1Q17, operating
Half Year F1 Results. November 4, 2015
 Half Year F1 Results November 4, 2015 F17 Q1 Results 20 JULY 2016 Q1 BUSINESS HIGHLIGHTS Passenger growth of 18% to 5.8m pax on 17% seat growth Record underlying profit of 38.6m (+14%) despite Easter effect
Results 1 st Quarter 2004
 Grupo Posadas, s, S.A. de C.V. & Subsidiaries April 30 th, 2004 Results 1 st Quarter 2004 Consolidated revenue decreased 1.3%. Revenew and Conectum progress is on track in order to improve the profitability
Volaris Reports Strong First Quarter 2015: 32% Adjusted EBITDAR Margin, 9% Operating Margin
 Volaris Reports Strong First Quarter 2015: 32% Adjusted EBITDAR Margin, 9% Operating Margin Mexico City, Mexico, April 22, 2015 Volaris* (NYSE: VLRS and BMV: VOLAR), the ultra-low-cost airline serving
PRESS RELEASE Financial Results. Rising passenger traffic at 12.5m Exceeding 1bn in consolidated revenue
 PRESS RELEASE 2016 Financial Results Rising passenger traffic at 12.5m Exceeding 1bn in consolidated revenue Kifissia, 23 March 2017 AEGEAN reports full year 2016 results with consolidated revenue at 1,020m,
Full go towards year end
 Beni Stabili: 9-month 2017 rents Full go towards year end Milan: October 24 th, 2017 Growth in operating metrics 1.5% L-f-L rental growth excl. TI assets 95.5% financial occupancy 93.1% excluding TI portfolio
BTG Pactual VI Latin American CEO Conference 2015 New York, October 2015
 BTG Pactual VI Latin American CEO Conference 2015 New York, October 2015 This presentation may include forward-looking comments regarding the Company s business outlook and anticipated financial and operating
PAN PACIFIC HOTELS GROUP LIMITED 2010 FULL YEAR RESULTS BRIEFING 22 FEB 2011
 PAN PACIFIC HOTELS GROUP LIMITED 2010 FULL YEAR RESULTS BRIEFING 22 FEB 2011 2010 RESULTS OVERVIEW STRATEGIC & OPERATIONS HIGHLIGHTS NEO SOON HUP CHIEF FINANCIAL OFFICER 2 CONTENTS Focus and Highlights
Corporate Presentation February 2019
 Corporate Presentation February 2019 1 Grupo Hotelero Santa Fe Ticker: HOTEL (BMV) Financial Highlights (LTM Dec 31, 2018 ) Revenue: Ps. 2,064 million (US 105 million) EBITDA: Ps. 676 million (US 34 million)
Enjoy S.A. June 2014 Santiago - Chile
 1 Enjoy S.A. June 2014 Santiago - Chile Agenda 2 Key Highlights Company Overview Our Properties Gaming Non Gaming Conrad Financial Overview Key Credit Highlights 3 1. Leading Gaming & Entertainment Company
Capital Increase. Santiago, October Arranger and Placement Agent
 Capital Increase Santiago, October 2010 Arranger and Placement Agent Antofagasta Coquimbo Santiago Viña del Mar Colchagua Pucón Puerto Varas Mendoza Contents Investment considerations Enjoy Santiago Financials
LATAM AIRLINES GROUP RECORDS A 50.1% INCREASE IN OPERATING INCOME AND A US$93.9 MILLION NET PROFIT IN THE FIRST QUARTER OF 2018
 LATAM AIRLINES GROUP RECORDS A 50.1% INCREASE IN OPERATING INCOME AND A US$93.9 MILLION NET PROFIT IN THE FIRST QUARTER OF 2018 Santiago, Chile, May 8, 2018 LATAM Airlines Group S.A. (NYSE: LTM; IPSA:
J.P. Morgan 2019 Global Emerging Markets Corporate Conference. Miami, February 2019
 J.P. Morgan 2019 Global Emerging Markets Corporate Conference Miami, February 2019 This presentation may include forward-looking comments regarding the Company s business outlook and anticipated financial
LATAM AIRLINES GROUP REPORTS CONSOLIDATED OPERATING INCOME OF US$175.0 MILLION FOR THIRD QUARTER 2018
 LATAM AIRLINES GROUP REPORTS CONSOLIDATED OPERATING INCOME OF US$175.0 MILLION FOR THIRD QUARTER 2018 Santiago, Chile, November 20, 2018 LATAM Airlines Group S.A. (NYSE: LTM; IPSA: LTM), the leading airline
LATAM AIRLINES GROUP REPORTS OPERATING INCOME OF US$267 MILLION FOR FOURTH QUARTER 2014 AND US$513 FOR FULL YEAR 2014
 LATAM AIRLINES GROUP REPORTS OPERATING INCOME OF US$267 MILLION FOR FOURTH QUARTER 2014 AND US$513 FOR FULL YEAR 2014 Santiago, Chile, March 17, 2015 (NYSE: LFL; IPSA: LAN; BOVESPA: LATM33), the leading
A leading European hotel property company
 CORPORATE PRESENTATION A leading European hotel property company DNB Nordic Real Estate & Construction Conference 20 September, 2018 Ticker: PNDXB SS Market cap: MSEK 27,555 Listed: Nasdaq Stockholm Anders
Press release February 21, 2014
 Press release February 21, 2014 2013 earnings Recurrent ent net income per share up +1.2%, with NAV per share growth of +1.7% Significant improvement in the financial occupancy rate and rental margin Recurrent
2017 results: REVENUE up to million (+1.6%), NET PROFIT FOR THE PERIOD 1 shows significant increase to million (+12.
, NET PROFIT FOR THE PERIOD 1 shows significant increase to million (+12.") Business Results in 2017: Significant Rise in Profits of the Flughafen Wien Group Management Board Announces Substantial Upward Revision of Earnings Guidance and Traffic Figures for 2018 2017 results:
Business Results in 2017: Significant Rise in Profits of the Flughafen Wien Group Management Board Announces Substantial Upward Revision of Earnings Guidance and Traffic Figures for 2018 2017 results:
Why Colombia Investment Environment & Business Opportunities
 Why Colombia Investment Environment & Business Opportunities Tobias Meurer Mai 2017 Table of Content 1. Recent Macroeconomic Developments 2. Investment Environment 3. Export Platform 4. Wood processing
SIAM FUTURE DEVELOPMENT PUBLIC CO., LTD. Corporate Presentation 2016
 SIAM FUTURE DEVELOPMENT PUBLIC CO., LTD. Corporate Presentation 2016 Overview Financial Summary Project Update 2 Overview Founded: 1994 Staff: 78 Centers: 22 Vision Unlike other developers, we create a
May El Dorado International Airport. Aeropuerto Internacional El El Dorado
 May 2018 El Dorado International Airport. Aeropuerto Internacional El El Dorado ABOUT ODINSA We are a Colombian concession company that belongs to Grupo Argos, dedicated to the structuring, promotion,
2Q Earnings Results Presentation
 2Q Earnings Results Presentation SAFE HARBOR The present document consolidates information from Avianca Holdings S.A. and its subsidiaries, including unaudited financial figures, operational managerial
Crown Resorts Limited
 Crown Resorts Limited 2015 Full Year Results Presentation 13 August 2015 1 Crown Resorts Limited Results Overview Crown Resorts Limited (Crown) performance: Overall, the results for Crown s portfolio of
Latin America Airfinance Conference
 13 th Annual Latin America Airfinance Conference 14-15 September 2017 Belmond Copacabana Palace, Rio de Janeiro, Brazil Andres Del Valle Senior Vice President Corporate Finance LATAM Airlines Group From
Siam Future Development PLC
 Siam Future Development PLC 1 Content Company & Business Overview Project Operations & Development Financial Summary 2 Company & Business Overview 3 Company Overview 1994: Founded by two former Siam Cement
Fourth Quarter and Full Year 2011 Results Presentation. February 1, 2012
 Fourth Quarter and Full Year 2011 Results Presentation February 1, 2012 This presentation may include forward-looking comments regarding the Company s business outlook and anticipated financial and operating
Summary of Results for the First Three Quarters FY2015/3
 Summary of Results for the First Three Quarters FY2015/3 February 10, 2015 Tokyu Corporation (9005) http://www.tokyu.co.jp/ Contents Ⅰ.Executive Summary 2 Ⅱ.Conditions in Each Business 5 Ⅲ.Details of Financial
Second quarter 2013 Results Presentation. August, 2013
 Second quarter 2013 Results Presentation August, 2013 This presentation may include forward-looking comments regarding the Company s business outlook and anticipated financial and operating results. These