Market Outlook Considerations Week Beginning September 11, 2017
|
|
|
- Matilda Bennett
- 6 years ago
- Views:
Transcription
1 Market Outlook Considerations Week Beginning September 11, 2017 DISCLAIMER-FOR-EDUCATIONAL-PURPOSES-ONLY Bobby Coats, Ph.D. Professor Economics Department of Agricultural Economics and Agribusiness University of Arkansas System Division of Agriculture Cooperative Extension Service 1

2 Continued Next Slide

3 Continued Next Slide

4 Continued Next Slide

5
6 Commodity ETFs, Percent Change by 1 Week, 1 Month, 3 Months, 6 Month, & 1 Year Sorted by One Week Percent Change ETF Commodity One Week One Month Three Month Six Month One Year Symbol % Change % Change % Change % Change % Change Commodity ETFs Charts BAL Cotton Bloomberg Subindex SGG Sugar Bloomberg Subindex COW Livestock Bloomberg Subindex BNO Oil Brent Fund SLV Silver Trust DBP Precious Metals Fund GLD Gold Trust JO Coffee Bloomberg Subindex DBA Agriculture Fund SOYB Soybeans Fund GSP GSCI Commodity Total Return DBE Energy Fund USO Oil Fund 3 Month Fund JJG Grains Bloomberg Subindex CORN Corn Fund LIT Lithium USL Oil Fund 12 Month Fund PPLT Physical Platinum Shares DBC Commodity Tracking Fund LD Lead Bloomberg SubIndex WEAT Wheat Fund DJP Commodity Bloomberg Index NIB Cocoa Bloomberg Subindex JJU Aluminum Bloomberg SubIndex JJC Copper Bloomberg SubIndex DBB Base Metals Fund GAZ Natural Gas PALL Physical Palladium Shares UNG Natural Gas Fund UGA Gasoline Fund JJN Nickel Bloomberg SubIndex
7 Commodity ETFs, Percent Change by 1 Week, 1 Month, 3 Months, 6 Month, & 1 Year Sorted by 1 Month Percent Change ETF Commodity One Week One Month Three Month Six Month One Year Symbol % Change % Change % Change % Change % Change Commodity ETFs Charts SLV Silver Trust UGA Gasoline Fund JJN Nickel Bloomberg SubIndex DBP Precious Metals Fund GLD Gold Trust LIT Lithium BAL Cotton Bloomberg Subindex JJU Aluminum Bloomberg SubIndex PALL Physical Palladium Shares BNO Oil Brent Fund PPLT Physical Platinum Shares DBB Base Metals Fund JJC Copper Bloomberg SubIndex SGG Sugar Bloomberg Subindex DBE Energy Fund UNG Natural Gas Fund DBC Commodity Tracking Fund GSP GSCI Commodity Total Return DJP Commodity Bloomberg Index LD Lead Bloomberg SubIndex USL Oil Fund 12 Month Fund GAZ Natural Gas SOYB Soybeans Fund USO Oil Fund 3 Month Fund DBA Agriculture Fund NIB Cocoa Bloomberg Subindex COW Livestock Bloomberg Subindex CORN Corn Fund JJG Grains Bloomberg Subindex WEAT Wheat Fund JO Coffee Bloomberg Subindex
8 Commodity ETFs, Percent Change by 1 Week, 1 Month, 3 Months, 6 Month, & 1 Year Sorted by 3 Month Percent Change ETF Commodity One Week One Month Three Month Six Month One Year Symbol % Change % Change % Change % Change % Change Commodity ETFs Charts JJN Nickel Bloomberg SubIndex UGA Gasoline Fund JJC Copper Bloomberg SubIndex DBB Base Metals Fund LIT Lithium BNO Oil Brent Fund JJU Aluminum Bloomberg SubIndex PALL Physical Palladium Shares DBE Energy Fund PPLT Physical Platinum Shares GSP GSCI Commodity Total Return DBC Commodity Tracking Fund GLD Gold Trust DBP Precious Metals Fund USL Oil Fund 12 Month Fund DJP Commodity Bloomberg Index LD Lead Bloomberg SubIndex SLV Silver Trust USO Oil Fund 3 Month Fund BAL Cotton Bloomberg Subindex SOYB Soybeans Fund JO Coffee Bloomberg Subindex NIB Cocoa Bloomberg Subindex SGG Sugar Bloomberg Subindex UNG Natural Gas Fund DBA Agriculture Fund WEAT Wheat Fund JJG Grains Bloomberg Subindex CORN Corn Fund COW Livestock Bloomberg Subindex GAZ Natural Gas
9 Commodity ETFs, Percent Change by 1 Week, 1 Month, 3 Months, 6 Month, & 1 Year Sorted by 6 Month Percent Change ETF Commodity One Week One Month Three Month Six Month One Year Symbol % Change % Change % Change % Change % Change Commodity ETFs Charts LIT Lithium PALL Physical Palladium Shares JJC Copper Bloomberg SubIndex JJN Nickel Bloomberg SubIndex DBB Base Metals Fund GLD Gold Trust JJU Aluminum Bloomberg SubIndex DBP Precious Metals Fund UGA Gasoline Fund PPLT Physical Platinum Shares SLV Silver Trust COW Livestock Bloomberg Subindex DBC Commodity Tracking Fund DJP Commodity Bloomberg Index DBE Energy Fund NIB Cocoa Bloomberg Subindex BNO Oil Brent Fund LD Lead Bloomberg SubIndex GSP GSCI Commodity Total Return BAL Cotton Bloomberg Subindex SOYB Soybeans Fund DBA Agriculture Fund USL Oil Fund 12 Month Fund UNG Natural Gas Fund USO Oil Fund 3 Month Fund CORN Corn Fund WEAT Wheat Fund JJG Grains Bloomberg Subindex JO Coffee Bloomberg Subindex SGG Sugar Bloomberg Subindex GAZ Natural Gas
10 Commodity ETFs, Percent Change by 1 Week, 1 Month, 3 Months, 6 Month, & 1 Year Sorted by 1 Year Percent Change ETF Commodity One Week One Month Three Month Six Month One Year Symbol % Change % Change % Change % Change % Change Commodity ETFs Charts JJC Copper Bloomberg SubIndex LIT Lithium PALL Physical Palladium Shares DBB Base Metals Fund JJU Aluminum Bloomberg SubIndex LD Lead Bloomberg SubIndex UGA Gasoline Fund JJN Nickel Bloomberg SubIndex COW Livestock Bloomberg Subindex BAL Cotton Bloomberg Subindex DBC Commodity Tracking Fund DBE Energy Fund GLD Gold Trust DJP Commodity Bloomberg Index GSP GSCI Commodity Total Return BNO Oil Brent Fund DBP Precious Metals Fund SOYB Soybeans Fund CORN Corn Fund USL Oil Fund 12 Month Fund PPLT Physical Platinum Shares DBA Agriculture Fund SLV Silver Trust JJG Grains Bloomberg Subindex WEAT Wheat Fund USO Oil Fund 3 Month Fund UNG Natural Gas Fund JO Coffee Bloomberg Subindex SGG Sugar Bloomberg Subindex NIB Cocoa Bloomberg Subindex GAZ Natural Gas

11 Continued Next Slide

12 Continued Next Slide

13 Continued Next Slide

14 - Sectors Continued Next Slide

15 Commodity ETFs Continued Next Slide


16 Commodity ETFs Continued Next Slide

17 Commodity ETFs Continued Next Slide
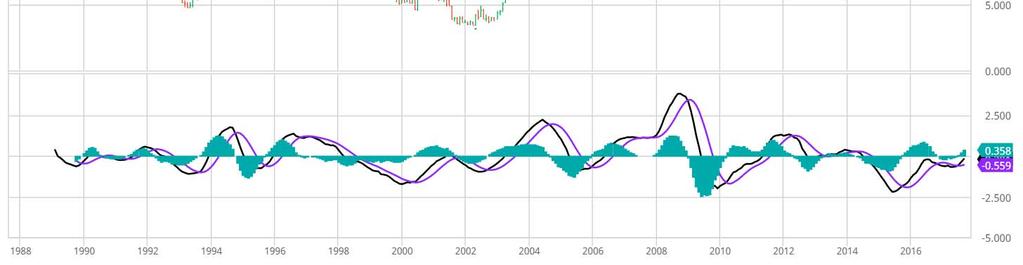
18 $UST10Y 10 Year US Treasury Yield Weekly, Daily and Monthly Charts This Week Primary Consideration: Yield Sideways to Down: We enter the week with the 10 Year US Treasury Yield slightly bullish with a potentially lower yield Bond yields need to hold at 1.95 or serious consideration must be given to ominous building economic problems What could continue to move the yield lower? Demand, Economic Weakness, Event Risk Concerns, or Other Market Concerns/Factors could take the yield lower If the yield moved above 2.75 then some consideration would need to be given to a change in trend Big Picture: This is a market that likely moves sideways for a few years and even revisits the previous low or lower


19 Chart 1. $UST10Y 10 Year US Treasury Yield, Weekly Chart, 2014 September 8, 2017


20 Chart 2. $UST10Y 10 Year US Treasury Yield, Daily Chart, August 2016 September 8, 2017 Bond yields need to hold at 1.95


21 Chart 3. $UST10Y 10 Year US Treasury Yield, Daily Chart, 2004 September 8, 2017
22 US Dollar Index Weekly, Daily and Monthly Charts This Week Primary Considerations: Bearish Possible corrective activity likely, the door is now open for a decline to 87 or lower Given global macro considerations coupled with no significant global anomaly event moving forward this index may have some serious weakness Unless Middle East, North Korean, European, Venezuelan or other anomaly events start to dominate market participant decisions, then we are still in search of a low for the dollar Big Picture: The dollar has a bullish bias given global economic, social, political and military challenges, but present macro factors favor more dollar weakness than strength Longer Term there is no question the dollar is bullish, but that scenario continues to be pushed forward


23 Chart 4. U.S. Dollar Index, Weekly Chart, 2014 September 8, 2017


24 Chart 5. US Dollar Index, Daily Chart, Feb September 8, 2017


25 Chart 6. US Dollar Index, Monthly Chart, 1997 September 8, 2017
26 Select Currency Charts Monthly Charts


27 141 Chart 7. EURO Monthly Chart, 1997 September 8, 2017 Possible consolidation period, but trend remains up Next significant test 123.7


28 Chart 8. Australian Dollar Monthly Chart, 1997 September 8, 2017 Anticipating global growth gives this index a bullish bias Momentum slowly building


29 Chart 9. Canadian Dollar Monthly Chart 1997 September 8, 2017 Bullish bias


30 Chart 10. Japanese Yen Monthly Chart 1997 September 8, 2017 Presently more bullish than bearish Larger trend remains down, but increasingly unlikely near term


31 Chart 11. British Pound, Monthly Chart 1997 September 8, 2017 Near term slow building momentum Dominate trend remains down
32 Select Equity and Transportation Charts Monthly Charts


33 Chart 12. Dow Jones, Monthly Chart, 1997 September 8, 2017 A cautionary time period with momentum waning Allow price action to provide guidance Primary trend remains up


34 Chart 13. Dow Transports Monthly Chart, 1997 September 8, 2017 A cautionary time period Near term slightly bearish bias, additional corrective weakness likely Allow price action to provide guidance


35 Chart 14. S&P 500 Large Caps Monthly Chart, 1997 September 8, 2017 A cautionary time period with momentum waning Allow price action to provide guidance


36 Chart 15. Nasdaq Composite, Monthly Chart, 1997 September 8, 2017 Near term remain cautious of this index with momentum slowing Allow price action to provide guidance
37 Select Global Equity Charts


38 Chart 16. World less U.S. & Canada Weekly Chart, 2001 September 8, 2017 A cautionary time period with momentum ever so slowly declining Allow price action to provide guidance


39 Chart 17. Emerging Markets, Monthly Chart, 1997 September 8, 2017 A cautionary time period Allow price action to provide guidance


40 Chart 18. Australia Monthly Chart, 1997 September 8, 2017 Cautionary period momentum uncertain Watch Chinese growth


41 Chart 19. Brazil Monthly Chart 2000 September 8, 2017 Regaining momentum? Caution is advised due to political and economic uncertainty


42 Chart 20. Canada Monthly Chart 1997 September 8, 2017 Momentum uncertain Technology price strength needs to continue overriding commodity price uncertainties


43 Chart 21. China Monthly Chart, 2004 September 8, 2017 Momentum waning, but near term be extremely cautious given Chinese response unknowns to unfolding economic and geopolitical events


44 Chart 22. Mexico Monthly Chart 1997 September 8, 2017 Consolidation or correction likely


45 Chart 23. Japan, Monthly Chart 1997 September 8, 2017 Momentum slowing? Allow price action to provide guidance


46 Chart 24. Russia Monthly Chart 2005 September 8, 2017 Global economic, social and political events and military friction have been weighing heavy on this market Upside momentum potential remains a concern without sustained energy price strength


47 Chart 25. India Monthly Chart 2005 September 8, 2017 Interesting juncture
48 CRB Commodity Index Weekly, Daily and Monthly Charts This Week Primary consideration: The question in search of an answer: What is the near term impact of Government and Central Bank intervention globally, the North Korean threat, and Harvey and Irma s impact on economic activity? Do not rule out a revisit to previous index lows during this period of global consolidation and uncertainty. That said, this index is building a base to move higher Caution is advised since global economic, social, political and military uncertainties remain problematic Between Fed off again and on again accommodation and/or misdirectional verbal guidance, building uncertainties surrounding fiscal, trade and regulatory policy stimulative activities, the $CRB Commodity Index: a key economic indicator, has struggled Bigger Picture: Though dangerously spastic, global macro and growth forces in general remain supportive of the commodity sector For the CRB Commodity Index to breakout will likely be a function of oil price leadership and/or broad commodity support, a reasonably stable to weaker dollar and belief and confidence in global fiscal, monetary, trade and regulatory policy leadership


49 Chart 26. $CRB Reuters/Jefferies CRB Index, Weekly Chart, 2014 September 8, 2017


50 Chart 27. $CRB Reuters/Jefferies CRB Index, Daily Chart, November 2016 September 8, 2017


51 Chart 28. $CRB Reuters/Jefferies CRB Index, Monthly Chart, 2007 September 8, 2017
52 $WTIC Light Crude Oil Weekly, Daily and Monthly Charts This Week Primary Consideration: Sideways choppy price action with this week s prices more bearish than bullish. The $45 to $50 trading range may give way to an upside potential of $55 plus A complex, volatile and an uncertain market that deserves a great deal of respect in a world with building economic, social, political and homeland security uncertainties North Korea, market structure, geopolitical considerations and building possibilities of a Venezuelan civil war are just some of the supportive factors Saudi Arabia, Russia, OPEC, other oil producers, and others have a major role in limiting 2017 price downside As always, remain focused on the bigger Geopolitical Picture and Building Homeland Security Friction


53 Chart 29. $WTIC, Weekly Chart, 2014 September 8, 2017


54 Chart 30. $WTIC, Daily Chart, Nov 2016 September 8, 2017


55 Chart 31. $WTIC, Monthly Chart, 2007 September 8, 2017
56 Soybeans Weekly, Daily and Monthly Charts This Week Primary Consideration: Assume bearish until price action proves otherwise, a stronger final bottom likely needs to form, but additional price strength implies a likely price bottom in place Given complex global macro challenges assume until price action proves otherwise that the bottoming process has not yet completed, and a retest of the $9.00 area or potentially lower into the $8.35 area is still a possibility Simply stated watch the price action to define soybean price dynamics


57 Chart 32. Soybeans, Weekly Chart, 2014 September 8, 2017


58 Chart 33. Soybeans, Daily Chart, Nov 2016 September 8, 2017


59 Chart 34. Soybeans, Monthly Chart, 2001 September 8, 2017
60 Corn Weekly, Daily and Monthly Charts Near Term Primary consideration: Assume bearish until price action becomes more supportive of a bullish case and give consideration to prices moving to their previous 2016 lows of $3.15 or below
61 194


62 Chart 35. Corn, Weekly Chart, 2014 September 8, 2017


63 Chart 36. Corn, Daily Chart, November 2016 September 8, 2017


64 Chart 37. Corn, Monthly Chart, 2001 September 8, 2017
65 Rice Quarterly and Daily Charts Near Term Primary consideration: Bullish bias remains, but keep peripheral vision on potential near term uncertain global economic crosscurrents related to currencies, bonds, equities and commodities as they go through a rebalancing process

66 Rough Rice, 30 year 204


67 Chart 38. Rough Rice Weekly Chart, 5 year


68 Chart 39. Rough Rice Daily Chart, 1 year
69 Cotton Weekly, Daily and Monthly Charts Near Term Primary Consideration: Bullish bias with a price consideration of 91-cents


70 Chart 40. Cotton, Weekly Chart, 2014 September 8, 2017


71 Chart 41. Cotton, Daily Chart, September 2016 September 8, 2017


72 Chart 42. Cotton, Monthly Chart, 1997 September 8, 2017
73 Wheat Weekly, Daily and Monthly Charts Near Term Primary consideration: Presently strong resistance headwinds remain in force, wheat seasonality favorable, but global economic forces problematic near term; therefore give consideration to prices returning to their 2016 low of $3.90 or lower


74 Chart 43. Wheat, Weekly Chart, 2014 September 8, 2017


75 Chart 44. Wheat, Daily Chart, Nov 2016 September 8, 2017


76 Chart 45. Wheat, Monthly Chart, 2001 September 8, 2017
77 S&P Sectors
78 - Sectors


79 Chart 46. Financial Sector, Weekly Chart February 2014 September 8, 2017


80 Chart 47. Health Care Sector, Weekly Chart February 2014 September 8, 2017


81 Chart 48. Technology Sector, Weekly Chart February 2014 September 8, 2017


82 Chart 49. Industrial Sector, Weekly Chart February 2014 September 8, 2017


83 Chart 50. Materials Sector, Weekly Chart February 2014 September 8, 2017


84 Chart 51. Energy Sector, Weekly Chart February 2014 September 8, 2017

85 Chart 52. Utilities Sector, Weekly Chart February 2014 September 8, 2017


86 Chart 53. Consumer Staples Sector Weekly Chart February 2014 September 8, 2017


87 Chart 54. Consumer Discretionary Sector Weekly Chart February 2014 September 8, 2017
88 Commodity ETFs
89 Commodity ETFs
90 Commodity ETFs

91 Commodity ETFs


92 Chart 55. Cotton, Weekly Chart, 2014 September 8,
93 Chart 56. Brent Oil, Weekly Chart, 2014 September 8,

94 Chart 57. Corn, Weekly Chart, 2014 September 8,


95 Chart 58. Livestock, Weekly Chart, 2014 September 8,


96 Chart 59. Agriculture, Weekly Chart, 2014 September 8,


97 Chart 60. Base Metals, Weekly Chart, 2014 September 8,

98 Chart 61. Commodity Index, Weekly Chart, 2014 September 8,

99 Chart 62. Energy, Weekly Chart, 2014 September 8,


100 Chart 63. Precious Metals, Weekly Chart, 2014 September 8,


101 Chart 64. Commodity Index, Weekly Chart, 2014 September 8,


102 Chart 65. Natural Gas, Weekly Chart, 2014 September 8,

103 Chart 66. Gold, Weekly Chart, 2014 September 8,

104 Chart 67. Goldman Sachs Total Return Commodity Index, Weekly Chart, 2014 September 8,

105 Chart 68. Copper Subindex, Weekly Chart, 2014 September 8,

106 Chart 69. Grains, Weekly Chart, 2014 September 8,


107 Chart 70. Nickel, Weekly Chart, 2014 September 8,


108 Chart 71. Aluminum, Weekly Chart, 2014 September 8,


109 Chart 72. Coffee, Weekly Chart, 2014 September 8,


110 Chart 73. Lead, Weekly Chart, 2014 September 8,


111 Chart 74. Lithium, Weekly Chart, 2014 September 8,


112 Chart 75. Cocoa, Weekly Chart, 2014 September 8,


113 Chart 76. Palladium, Weekly Chart, 2014 September 8,


114 Chart 77. Platinum, Weekly Chart, 2014 September 8,


115 Chart 78. Sugar, Weekly Chart, 2014 September 8,


116 Chart 79. Silver, Weekly Chart, 2014 September 8,

117 Chart 80. Soybeans, Weekly Chart, 2014 September 8,

118 Chart 81. Gasoline, Weekly Chart, 2014 September 8,

119 Chart 82. Natural Gas, Weekly Chart, 2014 September 8,


120 Chart 83. US 12 Month Oil Fund, Weekly Chart, 2014 September 8,

121 Chart 84. US Oil Fund, Weekly Chart, 2014 September 8,


122 Chart 85. Wheat, Weekly Chart, 2014 September 8, 2017
123 End
Market Price Considerations Week Beginning June 5, 2017
 Market Price Considerations Week Beginning June 5, 2017 DISCLAIMER-FOR-EDUCATIONAL-PURPOSES-ONLY Bobby Coats, Ph.D. Professor Economics Department of Agricultural Economics and Agribusiness Division of
Market Price Considerations Week Beginning May 1, 2017
 Market Price Considerations Week Beginning May 1, 2017 DISCLAIMER-FOR-EDUCATIONAL-PURPOSES-ONLY 1 Bobby Coats, Ph.D. Professor Economics Department of Agricultural Economics and Agribusiness Division of
Outlook for (some) Emerging Economies
 Emerging Economies") Outlook for (some) Emerging Economies Sebastián Claro Deputy Governor Central Bank of Chile 11th Asia Copper Conference, Shanghai, November 18, 215 Central Bank of Chile, November 215 1 The last 1 years
Outlook for (some) Emerging Economies Sebastián Claro Deputy Governor Central Bank of Chile 11th Asia Copper Conference, Shanghai, November 18, 215 Central Bank of Chile, November 215 1 The last 1 years
AOC 2017AOC 2017AOC. Robert Johansson Chief Economist US Department of Agriculture Beijing, China (April 2017)
") http://wcfcourier.com/article_db152199-d2de-5455-ac-b643ba6a1c8f.html U.S. AGRICULTURAL OUTLOOK 17 AND LONGER-TERM PROJECTIONS AOC 17AOC 17AOC AOC 17AOC 17AOC Robert Johansson AOC 17AOC 17AOC Chief Economist
http://wcfcourier.com/article_db152199-d2de-5455-ac-b643ba6a1c8f.html U.S. AGRICULTURAL OUTLOOK 17 AND LONGER-TERM PROJECTIONS AOC 17AOC 17AOC AOC 17AOC 17AOC Robert Johansson AOC 17AOC 17AOC Chief Economist
Domestic, U.S. and Overseas Travel to Canada
 Domestic, U.S. and Overseas Travel to Canada Short-Term Markets Outlook Second Quarter 2007 / Executive Summary Prepared for: The Canadian Tourism Commission (CTC) By: February 2007 www.canada.travel Background
Global Economic Outlook
 Global Economic Outlook Brian Pearce Chief Economist Embargoed until 10:30AM CET 1 Million barrels a day US$ per barrel Are the markets signalling recession ahead? 60 55 Business confidence (left scale)
Quarterly Aviation Industry Performance
 Quarterly Aviation Industry Performance ALAFCO Aviation Lease and Finance Company K.S.C.P. Quarterly Aviation Industry Performance 3Q17 (Updated November 17) Prepared by: Strategic Planning department
Tourism Snapshot A focus on the markets in which the CTC and its partners are active
 Tourism Snapshot A focus on the markets in which the CTC and its partners are active www.canada.travel/corporate January 214 Volume 1, Issue 1 Key highlights Total arrivals from CTC s international markets
Airline Current Business Environment Alex Heiter
 Airline Current Business Environment Alex Heiter Istanbul Technical University Air Transportation Management M.Sc. Program Network, Fleet and Schedule Strategic Planning Module 2: 28 March 2016 The underlying
Quarterly Aviation Industry Performance
 Quarterly Aviation Industry Performance ALAFCO Aviation Lease and Finance Company K.S.C.P. Quarterly Aviation Industry Performance (March - June 17) Prepared by: Strategic Planning department 1 Quarterly
Textile Per Capita Consumption
 January 2018 Textile Per Capita Consumption 2005-2022 Part 2: Upper middle income countries - - CHF500.- Table of Contents Preface... 4 Sources... 5 Definitions... 6 Charts... 7 Executive Summary... 10
Paraguay. International Trade Report January-May 2015
 Paraguay International Trade Report January-May 2015 MH / SSEE / DI / DECI MAY 2015 INDEX EXPORTS Graph 1: Evolution of Exports (January to May 2011-2015) Graph 2: Exports by major trade blocs and countries
Tourism Snapshot A Monthly Monitor of the Performance of Canada s Tourism Industry
 Tourism Snapshot A Monthly Monitor of the Performance of Canada s Tourism Industry December 2015 Volume 11, Issue 12 www.destinationcanada.com Tourism Snapshot December 2015 1 2 Tourism Snapshot December
PREMIUM TRAFFIC MONITOR SEPTEMBER 2013 KEY POINTS
 Premium Pax, Million Economy Pax, Million PREMIUM TRAFFIC MONITOR SEPTEMBER 13 KEY POINTS Growth in premium air travel moderated in September, after a strong rise in August. International premium passenger
AIR PASSENGER MARKET ANALYSIS
 AIR PASSENGER MARKET ANALYSIS OCTOBER 2014 KEY POINTS Air travel volumes were up 5.7% in October year-on-year, slightly stronger than the September rise of 5.2%, and a continuation of the positive growth
AIR TRANSPORT MARKET ANALYSIS MAY 2011
 AIR TRANSPORT MARKET ANALYSIS MAY 2011 KEY POINTS May saw a renewed expansion in both air travel and freight, after a soft patch during the previous three months. Air travel volumes were 6.8% higher than
Week Ending: Apr. 5, 2018
 Week Ending: Apr. 5, 2018 Market Page 1. Thurs. Close Last Thurs. Close Weekly Change Week's High Week's Low Life of Contract High Life of Contract Low NEW YORK COTTON FUTURES (Cents/Lb.) May-18 82.57
PREMIUM TRAFFIC MONITOR DECEMBER 2014 KEY POINTS
 PREMIUM TRAFFIC MONITOR DECEMBER 2014 KEY POINTS International air travel recorded another moderate rise to end 2014, up 3.6% in December compared to a year ago. The annual expansion was in line with the
Index of business confidence. Monthly FTK (Billions) Apr 2014 vs. Apr 2013 YTD 2014 vs. YTD 2013 Apr 2014 vs. Mar 2014
 Apr 2014 vs. Apr 2013 YTD 2014 vs. YTD 2013 Apr 2014 vs. Mar 2014") AIR PASSENGER MARKET ANALYSIS APRIL 2014 KEY POINTS Growth in air travel picked-up in April, rising 7.5% compared to a year ago. This is an acceleration on March, when revenue passenger kilometers increased
AIR PASSENGER MARKET ANALYSIS APRIL 2014 KEY POINTS Growth in air travel picked-up in April, rising 7.5% compared to a year ago. This is an acceleration on March, when revenue passenger kilometers increased
AIR PASSENGER MARKET ANALYSIS
 Monthly RPK (Billions) Monthly FTK (Billions) Index of business confidence % change over year AIR PASSENGER MARKET ANALYSIS JANUARY 2014 KEY POINTS Air travel markets commenced 2014 with a strong increase
PREMIUM TRAFFIC MONITOR JULY 2014 KEY POINTS
 PREMIUM TRAFFIC MONITOR JULY 2014 KEY POINTS Growth in international air passengers was weak for a second consecutive month with a 2.6% increase in July compared to a year ago premium seat numbers rose
Week Ending: Jan. 25, 2018
 Week Ending: Jan. 25, 2018 Market Page 1. Thurs. Close Last Thurs. Close Weekly Change Week's High Week's Low Life of Contract High Life of Contract Low NEW YORK COTTON FUTURES (Cents/Lb.) March-18 81.88
AIR PASSENGER MARKET ANALYSIS SEPTEMBER 2015 KEY POINTS
 AIR PASSENGER MARKET ANALYSIS SEPTEMBER 2015 KEY POINTS Global air travel rose 7.3% in September compared to a year ago. The mid-year data showed some distortion from holiday impacts, but the last couple
Tourism Snapshot A Monthly Monitor of the Performance of Canada s Tourism Sector
 Tourism Snapshot A Monthly Monitor of the Performance of Canada s Tourism Sector December Volume 14, Issue 12 www.destinationcanada.com Tourism Snapshot December 1 Newfoundland and Labrador Tourism KEY
Week Ending: Oct. 26, 2017
 Week Ending: Oct. 26, 2017 Market Page 1. Thurs. Close Last Thurs. Close Weekly Change Week's High Week's Low Life of Contract High Life of Contract Low NEW YORK COTTON FUTURES (Cents/Lb.) December-17
Week Ending: May. 3, 2018
 Week Ending: May. 3, 2018 Market Page 1. Thurs. Close Last Thurs. Close Weekly Change Week's High Week's Low Life of Contract High Life of Contract Low NEW YORK COTTON FUTURES (Cents/Lb.) July-18 84.50
Global economy and aviation do we have room to grow?
 Global economy and aviation do we have room to grow? 18 January 2017 Brian Pearce Chief Economist, IATA Airline Industry Economics Advisory Workshop 2016 1 Room to grow? Looking through the cycle Potential
Aviation Performance in NSW
 Aviation Performance in NSW 2015-16 November 2016 This report by Tourism Futures International for Destination New South Wales reviews the operating environment and aviation performance of Sydney and NSW
Week Ending: Nov. 15, 2018
 Week Ending: Nov. 15, 2018 Market Page 1. Thurs. Close Last Thurs. Close Weekly Change Week's High Week's Low Life of Contract High Life of Contract Low NEW YORK COTTON FUTURES (Cents/Lb.) December-18
Tourism Snapshot. June 2015 Volume 11, Issue 6. A focus on the markets in which Destination Canada (DC) and its partners are active.
 and its partners are active.") Tourism Snapshot Tourism PEI / Paul Baglole A focus on the markets in which Destination Canada (DC) and its partners are active. www.destinationcanada.com June Volume 11, Issue 6 Key highlights Over the
Tourism Snapshot Tourism PEI / Paul Baglole A focus on the markets in which Destination Canada (DC) and its partners are active. www.destinationcanada.com June Volume 11, Issue 6 Key highlights Over the
2019 Airline Economics Growth Frontiers Dublin. Steven F. Udvar-Házy Executive Chairman
 2019 Airline Economics Growth Frontiers Dublin Steven F. Udvar-Házy Executive Chairman January 21, 2019 Forward Looking Statements Statements in this presentation that are not historical facts are hereby
Week Ending: Mar. 28, 2019
 Week Ending: Mar. 28, 2019 Market Page 1. Thurs. Close Last Thurs. Close Weekly Change Week's High Week's Low Life of Contract High Life of Contract Low NEW YORK COTTON FUTURES (Cents/Lb.) May-19 75.87
Jan-18. Dec-17. Travel is expected to grow over the coming 6 months; at a slower rate
 Analysis provided by TRAVEL TRENDS INDEX DECEMBER 2018 CTI reading of 51.8 in December 2018 indicates that travel to or within the U.S. grew 3.6% in December 2018 compared to December 2017. LTI predicts
Tourism Snapshot. A focus on the markets in which the CTC and its partners are active. February 2015 Volume 11, Issue 2.
 Tourism Snapshot Tourism Whistler/Mike Crane A focus on the markets in which the CTC and its partners are active www.canada.travel/corporate February Volume 11, Issue 2 Key highlights The strong beginning
Tourism Snapshot A Monthly Monitor of the Performance of Canada s Tourism Industry
 Tourism Snapshot A Monthly Monitor of the Performance of Canada s Tourism Industry January 2017 Volume 13, Issue 1 Edmonton Tourism www.destinationcanada.com Tourism Snapshot January 2017 1 KEY HIGHLIGHTS
AIR PASSENGER MARKET ANALYSIS JANUARY 2015 KEY POINTS
 AIR PASSENGER MARKET ANALYSIS JANUARY 2015 KEY POINTS Global air travel was up 4.6% in January compared to a year ago, a slower start to the year when compared to the strong 5.8% expansion in 2014 overall.
Oct-17 Nov-17. Travel is expected to grow over the coming 6 months; at a slower rate
 Analysis provided by TRAVEL TRENDS INDEX OCTOBER 2018 CTI reading of 51.6 in October 2018 indicates that travel to or within the U.S. grew 3.2% in October 2018 compared to October 2017. LTI predicts travel
AIR PASSENGER MARKET ANALYSIS JUNE 2015 KEY POINTS
 AIR PASSENGER MARKET ANALYSIS JUNE 2015 KEY POINTS Global air travel rose 5.7% in June compared to a year ago, a slowdown on the strong May increase of 6.9%. The deceleration is due to slower growth in
Results of Tourism Activity Mexico, March 2017
 Results of Tourism Activity Mexico, March Undersecretariat of Planning and Tourism Policy Available in http://www.datatur.sectur.gob.mx/sitepages/versionesrat.aspx DIRECTORy ENRIQUE DE LA MADRID CORDERO
Week Ending: Oct. 4, 2018
 Week Ending: Oct. 4, 2018 Market Page 1. Thurs. Close Last Thurs. Close Weekly Change Week's High Week's Low Life of Contract High Life of Contract Low NEW YORK COTTON FUTURES (Cents/Lb.) December-18 76.00
Week Ending: Sep. 13, 2018
 Week Ending: Sep. 13, 2018 Market Page 1. Thurs. Close Last Thurs. Close Weekly Change Week's High Week's Low Life of Contract High Life of Contract Low NEW YORK COTTON FUTURES (Cents/Lb.) October-18 81.62
Week Ending: Sep. 20, 2018
 Week Ending: Sep. 20, 2018 Market Page 1. Thurs. Close Last Thurs. Close Weekly Change Week's High Week's Low Life of Contract High Life of Contract Low NEW YORK COTTON FUTURES (Cents/Lb.) October-18 79.07
Tourism Snapshot. A focus on the markets that the CTC and its partners are active in. July 2011 Volume 7, Issue 7.
 Tourism Snapshot Echo Valley Ranch and Spa, British Columbia A focus on the markets that the CTC and its partners are active in www.canada.travel/corporate July 2011 Volume 7, Issue 7 Key highlights In
Week Ending: Sep. 27, 2018
 Week Ending: Sep. 27, 2018 Market Page 1. Thurs. Close Last Thurs. Close Weekly Change Week's High Week's Low Life of Contract High Life of Contract Low NEW YORK COTTON FUTURES (Cents/Lb.) October-18 78.12
Tourism and hotel market outlook
 Tourism and hotel market outlook Edition 1, 2019 About the tourism and hotel market outlook This executive summary presents a snapshot of the Deloitte Access Economics Tourism and Hotel Market Outlook.
Week Ending: Dec. 6, 2018
 Week Ending: Dec. 6, 2018 Market Page 1. Thurs. Close Last Thurs. Close Weekly Change Week's High Week's Low Life of Contract High Life of Contract Low NEW YORK COTTON FUTURES (Cents/Lb.) March-19 79.08
Week Ending: Jan. 24, 2019
 Week Ending: Jan. 24, 2019 Market Page 1. Thurs. Close Last Thurs. Close Weekly Change Week's High Week's Low Life of Contract High Life of Contract Low NEW YORK COTTON FUTURES (Cents/Lb.) March-19 73.14
Week Ending: Dec. 13, 2018
 Week Ending: Dec. 13, 2018 Market Page 1. Thurs. Close Last Thurs. Close Weekly Change Week's High Week's Low Life of Contract High Life of Contract Low NEW YORK COTTON FUTURES (Cents/Lb.) March-19 79.41
Index of business confidence. Monthly FTK (Billions) Aug 2013 vs. Aug 2012 YTD 2013 vs. YTD 2012 Aug 2013 vs. Jul 2013
 Aug 2013 vs. Aug 2012 YTD 2013 vs. YTD 2012 Aug 2013 vs. Jul 2013") AIR PASSENGER MARKET ANALYSIS AUGUST 2013 KEY POINTS Air travel markets expanded strongly in August. Global revenue passenger kilometers were up 6.8% compared to a year ago, an improvement on July growth
AIR PASSENGER MARKET ANALYSIS AUGUST 2013 KEY POINTS Air travel markets expanded strongly in August. Global revenue passenger kilometers were up 6.8% compared to a year ago, an improvement on July growth
Outlook for air travel markets
 Outlook for air travel markets June 2016 Brian Pearce Chief Economist International Air Transport Association Extended period of strong air travel market growth 30% 25% 20% 15% 10% 5% 0% -5% -10% -15%
NBAA 2014 Business Aviation Market Update. October 2014
 NBAA 2014 Business Aviation Market Update October 2014 1 Jefferies Global Industrials Conference - August 14, 2014 Forward Looking Statements This report contains forward-looking statements within the
PREMIUM TRAFFIC MONITOR JANUARY 2013 KEY POINTS
 Premium Pax, Million Economy Pax, Million PREMIUM TRAFFIC MONITOR JANUARY 213 KEY POINTS Growth in premium travel slowed in January. The number of passengers traveling in premium seats on international
Goldman Sachs Non-Deal Road Show. Boston, Massachusetts
 Goldman Sachs Non-Deal Road Show Boston, Massachusetts April 12, 2017 Forward Looking Statement Warning This presentation contains forward-looking statements about the business, financial condition and
Regional Director Latin America and Caribbean
 U.S. GRAINS COUNCIL Around the world; Around the clock Kurt Shultz Regional Director Latin America and Caribbean Leveraged Funding Non-Cash $7.8 Million Member Cash $5.2 Million FAS Funds $14.8 Million
Tourism Snapshot A focus on the markets that the CTC and its partners are active in
 Tourism Snapshot A focus on the markets that the CTC and its partners are active in Nahanni National Park, NWT www.canada.travel/corporate February 2012 Volume 8, Issue 2 Key highlights Following through
Airlines across the world connected a record number of cities this year, with more than 20,000 city pair connections*
 1 Airlines across the world connected a record number of cities this year, with more than 20,000 city pair connections*. This is a 1,351 increase over 2016 and a doubling of service since 1996, when there
I The shipping market contents ISL
 Comment - Charts and Tables concerning The Shipping Market World Merchant Fleet Tanker Market Bulk Carrier Market Tab. 1 Additions/Reductions by Ship Types 2014-2016 and up to June 2017... III Tab. 2 Size
Sydney North Shore. Information evening 14 August Regina Meani Your Technical Analyst
 1 CFTe, MSTA, AMT Sydney North Shore Information evening 14 August 2013 2 3 Disclaimer The information presented is general and not prepared for your specific investment objectives, financial situation
AIR PASSENGER MARKET ANALYSIS
 Monthly RPK (Billions) Monthly FTK (Billions) Index of business confidence % change over year AIR PASSENGER MARKET ANALYSIS NOVEMBER 2013 KEY POINTS Air travel markets increased at a solid rate in November,
GBTA BTI Outlook and Economic Forecast for Business Travel in Asia Pacific, Thailand and around the World
 GBTA BTI Outlook and Economic Forecast for Business Travel in Asia Pacific, Thailand and around the World Research Sponsored by: Welf J Ebeling Vice President, Operations - Asia Pacific Global Business
AIR PASSENGER MARKET ANALYSIS MAY 2015 KEY POINTS
 AIR PASSENGER MARKET ANALYSIS MAY 2015 KEY POINTS Global air travel rose by a strong 6.9% in May compared to a year ago. This was an acceleration on April year-overyear growth of 5.7%. Air travel was strong
Commercial Exchange Rate
 Commercial Exchange Rate Real (R$) / US dollar (US$), daily report R$ / US$ 4.5 4 3.5 3 2.5 2 1.5 1 25 26 27 28 29 2 211 212 213 214 215 216 Source: Central Bank of Brazil (Banco Central do Brasil, Sistema
North Atlantic Performance Trends
 North Atlantic Performance Trends Presented To: ICAO NAT EFFG 29 Toronto, Canada By: David Chin, Thea Graham, and Tony Choi FAA - Air Traffic Organization Date: September 2, 2015 Key NAT Performance Trends
Week Ending: Mar. 14, 2019
 Week Ending: Mar. 14, 2019 Market Page 1. Thurs. Close Last Thurs. Close Weekly Change Week's High Week's Low Life of Contract High Life of Contract Low NEW YORK COTTON FUTURES (Cents/Lb.) May-19 74.30
49 May-17. Jun-17. Travel is expected to grow over the coming 6 months; at a slower rate
 Analysis provided by TRAVEL TRENDS INDEX MAY 2018 CTI reading of 51.7 in May 2018 shows that travel to or within the U.S. grew 3.4% in May 2018 compared to May 2017. LTI predicts moderating travel growth
1.0 Introduction Zambia s Major Trading Partners Zambia s Major Export Markets... 4
 Bank of Zambia CONTENTS 1.0 Introduction... 3 2.0 Zambia s Major Trading Partners... 3 3.0 Zambia s Major Export Markets... 4 4.0 Major Source Countries Of Zambia s Imports... 5 5.0 Direction Of Trade
Emini S&P 500 Continuous Weekly Chart
 Today's price action in the equity indices forebodes ill winds for the US economy moving ahead. We had a complete technical breakdown with the market closing below the previous year's lows which technically
Results of Tourism Activity Mexico, April 2017
 Results of Tourism Activity Mexico, April Undersecretariat of Planning and Tourism Policy Available in http://www.datatur.sectur.gob.mx/sitepages/versionesrat.aspx DIRECTORy ENRIQUE DE LA MADRID CORDERO
Financial Position (consolidated)
") May 14 th, 2015 Disclaimer This presentation is for informational purposes only, contains preliminary financial and other information about Korean Air Lines Co., Ltd. and is subject to updating, revision,
May 14 th, 2015 Disclaimer This presentation is for informational purposes only, contains preliminary financial and other information about Korean Air Lines Co., Ltd. and is subject to updating, revision,
Tourism Snapshot A focus on the markets that the CTC and its partners are active in
 Tourism Snapshot A focus on the markets that the CTC and its partners are active in Newfoundland and Labrador www.canada.travel/corporate October 2011 Volume 7, Issue 10 Key highlights In October 2011,
PREMIUM TRAFFIC MONITOR FEBRUARY 2015 KEY POINTS
 PREMIUM TRAFFIC MONITOR FEBRUARY 2015 KEY POINTS Passenger travel on international markets rose 4.6% in February compared to a year ago, up on the 3.7% result in January; Economy class travel drove the
Monthly Fuel Price Report May June 2018
 Cost in cents per litre Monthly Fuel Price Report May 218 6 June 218 The RACQ monthly fuel price report presents a summary of the fuel price trends in Queensland for May 218. Key points The average price
South Australian Tourism Industry Council SA Tourism Barometer March Quarter 2015
 South Australian Tourism Industry Council SA Tourism Barometer March Quarter 2015 Headline: Events Season Provides a Lift In the March quarter 2015 survey the business activity index increased by 6% -
Domestic, U.S. and Overseas Travel to Canada
 Domestic, U.S. and Overseas Travel to Canada Short-Term Markets Outlook First Quarter 2007 Prepared for: The Canadian Tourism Commission (CTC) By: November 2006 WHAT'S INSIDE This report provides a short-term
Index of business confidence. Monthly FTK (Billions) June 2012 vs. June 2011 YTD 2012 vs. YTD 2011 RPK ASK PLF FTK AFTK FLF RPK ASK PLF FTK AFTK FLF
 June 2012 vs. June 2011 YTD 2012 vs. YTD 2011 RPK ASK PLF FTK AFTK FLF RPK ASK PLF FTK AFTK FLF") Monthly RPK (Billions) Monthly FTK (Billions) Index of business confidence % change over year AIR TRANSPORT MARKET ANALYSIS JUNE 2012 KEY POINTS Air travel markets expanded in June, but the trend in passenger
Monthly RPK (Billions) Monthly FTK (Billions) Index of business confidence % change over year AIR TRANSPORT MARKET ANALYSIS JUNE 2012 KEY POINTS Air travel markets expanded in June, but the trend in passenger
Tourism Snapshot A focus on the markets in which the CTC and its partners are active
 Tourism Snapshot A focus on the markets in which the CTC and its partners are active www.canada.travel/corporate April Volume 1, Issue 4 Key highlights Total arrivals from CTC s international markets improved
AIR PASSENGER MARKET ANALYSIS MARCH 2015 KEY POINTS
 AIR PASSENGER MARKET ANALYSIS MARCH 2015 KEY POINTS Global air travel rose by a strong 7.4% in March compared to a year ago, an improvement on the February result of 6.4%. The acceleration in the year-on-year
Caribbean: Outlook and Challenges
 Caribbean: Outlook and Challenges Nicole Laframboise International Monetary Fund Views expressed are those of the speaker alone and should not be reported as representing the official position of the International
Yukon Tourism Indicators Year-End Report Yukon Tourism Indicators Year-End Report 2015
 Yukon Tourism Indicators Overview The Yukon Tourism Indicators is published by the Department of Tourism and Culture as a companion to the monthly Yukon Tourism Visitation Report. This document is intended
AIR TRANSPORT MARKET ANALYSIS JULY 2011
 AIR TRANSPORT MARKET ANALYSIS JULY 2011 KEY POINTS Despite an increasingly gloomy economic outlook, air travel continued to expand at a pace close to trend in July, to a level 5.9% higher than a year earlier.
Tourism Snapshot A Monthly Monitor of the Performance of Canada s Tourism Industry
 Tourism Snapshot A Monthly Monitor of the Performance of Canada s Tourism Industry February 2017 Volume 13, Issue 2 www.destinationcanada.com Tourism Snapshot February 2017 1 KEY HIGHLIGHTS Canada welcomed
PREMIUM TRAFFIC MONITOR AUGUST 2015 KEY POINTS
 PREMIUM TRAFFIC MONITOR AUGUST 2015 KEY POINTS Passenger travel on international markets was up 5.4% in August year-on-year, reflecting strong growth on the Within Europe travel market. Both travel classes
Tourism Snapshot A focus on the markets that the CTC and its partners are active in
 Tourism Snapshot A focus on the markets that the CTC and its partners are active in www.canada.travel/corporate February 2011 Volume 7, Issue 2 Key highlights In the first two months of 2011 overnight
NSW BUSINESS CONDITIONS DECEMBER Quarterly snapshot of NSW economy informed by the businesses of NSW
 NSW BUSINESS CONDITIONS DECEMBER 218 Quarterly snapshot of NSW economy informed by the businesses of NSW NSW THIS QUARTER The NSW Business Chamber s Business Conditions Survey points to tougher trading
Tourism Snapshot A focus on the markets that the CTC and its partners are active in Ontario June 2011 Volume 7, Issue 6
 Tourism Snapshot Ontario A focus on the markets that the CTC and its partners are active in www.canada.travel/corporate June 2011 Volume 7, Issue 6 Key highlights In June 2011, overnight travel to Canada
Tourism Snapshot. A focus on the markets in which the CTC and its partners are active. October 2012 Volume 8, Issue 10.
 Tourism Snapshot Niagara Helicopters Tour A focus on the markets in which the CTC and its partners are active www.canada.travel/corporate October 2012 Volume 8, Issue 10 Total arrivals from CTC s international
Tourism Snapshot A Monthly Monitor of the Performance of Canada s Tourism Industry
 Tourism Snapshot A Monthly Monitor of the Performance of Canada s Tourism Industry February Volume 14, Issue 1 www.destinationcanada.com Tourism Snapshot February 1 KEY HIGHLIGHTS After a slow start in
Premier Vision. October 2017
 Premier Vision October 2017 Contents Tax Free Trends Summary 03 Tax Free Sales Trends 05 Tax Free Sales by Destination and Source 07 Top 5 Visitor Nations per Destination Country 09 Currency Trends 11
Index of business confidence. Monthly FTK (Billions) Sep 2013 vs. Sep 2012 YTD 2013 vs. YTD 2012 Sep 2013 vs. Aug 2013
 Sep 2013 vs. Sep 2012 YTD 2013 vs. YTD 2012 Sep 2013 vs. Aug 2013") AIR PASSENGER MARKET ANALYSIS SEPTEMBER 2013 KEY POINTS Air travel markets expanded at a solid rate in September. Global revenue passenger kilometers were up 5.5% compared to a year ago. This is a slight
AIR PASSENGER MARKET ANALYSIS SEPTEMBER 2013 KEY POINTS Air travel markets expanded at a solid rate in September. Global revenue passenger kilometers were up 5.5% compared to a year ago. This is a slight
Economic climate in Latin America improved slightly, despite worsening in Brazil
 August 13 th APRIL/2015 Ifo/FGV Economic Climate Index for Latin America 71 74 JULY/2015 Economic climate in Latin America improved slightly, despite worsening in Brazil The Ifo/FGV Economic Climate Index
PREMIUM TRAFFIC MONITOR OCTOBER 2015 KEY POINTS
 PREMIUM TRAFFIC MONITOR OCTOBER 2015 KEY POINTS Passenger travel on international markets was up 4.5% in October year-on-year, overall. For economy class travel, passenger numbers were up 4.6% but that
Forward-looking Statements
 March 23, 2011 Forward-looking Statements This presentation contains certain forward-looking statements with respect to the Corporation. These forward-looking statements, by their nature, necessarily involve
Economic and Tourism Industry Outlook February 2018
 Economic and Tourism Industry Outlook 2018 7 February 2018 1 Key Issues in Thai Economy Growth Projections for Thai Economy in 2017 and 2018 %YoY 3.9 4.0 4.0 3.2 3.0 2.0 1.0 0.0 2016 2017F 2018F Source:
Alberta Tourism Market Monitor
 Alberta Tourism Market Monitor New direct, daily flights between Mexico City and Calgary Mexican visitors will be able to enjoy all that Alberta has to offer in the near future, as Aeromexico begins direct,
Results of Tourism Activity Mexico, February 2017
 Results of Tourism Activity Mexico, February Undersecretariat of Planning and Tourism Policy Available in http://www.datatur.sectur.gob.mx/sitepages/versionesrat.aspx DIRECTORy ENRIQUE DE LA MADRID CORDERO
AIR PASSENGER MARKET ANALYSIS JULY 2015 KEY POINTS
 AIR PASSENGER MARKET ANALYSIS JULY 2015 KEY POINTS Global air travel rose 8.2% in July compared to a year ago, partly reflecting an upward bias due to the timing of Ramadan. But even after controlling
Fostering Sustainable, Innovative and Inclusive Growth
 216/ISOM/SYM/9 Session II Fostering Sustainable, Innovative and Inclusive Growth Submitted by: Policy Support Unit, APEC Secretariat Symposium on Priorities for APEC 217 Ha Noi, Viet Nam 8 December 216
Tourism snapshot Canadian Tourism Commission
 Canadian Tourism Commission Commission canadienne du tourisme Tourism snapshot www.canada.travel A focus on the markets that the CTC and its partners are active in Volume 5, Issue 04 Key highlights Following
Oct-17 Nov-17. Sep-17. Travel is expected to grow over the coming 6 months; at a slightly faster rate
 Analysis provided by TRAVEL TRENDS INDEX SEPTEMBER 2018 CTI reading of.8 in September 2018 indicates that travel to or within the U.S. grew 1.6% in September 2018 compared to September 2017. LTI predicts
International Travel Management Study 2018
 International Travel Management Study 2018 Part 1 Business Travel Outlook Expect more trips and higher spend. Executives are packing their suitcases and flying around the world to do business for their