FibraHotel Day December 3 rd,
|
|
|
- Walter Burke
- 5 years ago
- Views:
Transcription


1 FibraHotel Day 2015 December 3 rd,
2 2 Disclaimer This presentation has been prepared by FibraHotel (or the Trust ) for informational and discussion purposes. It does not constitute or form part of any offer or invitation to sell or issue, or any solicitation of any offer to purchase or subscribe for, any Certificados Bursátiles Fiduciarios Inmobiliarios (or the CBFI ) in the Trust, nor shall any part of it nor the fact of its dissemination form part of or be relied on in connection with any contract or investment decision relating thereto. Any such offering may be made only by an offering memorandum and the information contained herein will be superseded in its entirety by such offering memorandum in final form. This presentation does not contain all the information you should consider before investing in CBFIs of the Trust and no representation or warranty, express or implied, is made by any party as to the accuracy, fairness, completeness or materiality of the information furnished in this presentation, which remains subject to verification, completion and change without notice. Investors should review the offering memorandum (including the information therein as to risks) prior to making an investment decision and should rely only on the information contained in the offering memorandum. The Trust has not authorized anyone to provide you with information different from that contained in the offering memorandum. The securities mentioned in this document have not been registered under the U.S. Securities Act of 1933, as amended (the Securities Act ), and may not be offered or sold in the United States absent registration or exemption from registration under the Securities Act. The information in this presentation includes forwardlooking statements which are based on current expectations, beliefs, and predictions about future events. These forward looking statements are subject to known and unknown risks, uncertainties and assumptions about the Trust, its prospects and the economic environment in which it operates that may prove to be incorrect. Accordingly, the events described in such forward-looking statements may not occur and the Trust s objectives may not be realized. By attending this presentation you agree to be bound by the foregoing limitations and not to distribute, disclose or provide any information discussed today to any other person.


3 3 FibraHotel s 3rd Investor Day Agenda Start Finish Speaker Title Topic 09:00 09:25 Simon Galante FIHO - CEO Introduction FibraHotel strategy and 2016 Path 09:25 09:55 Richard Katzman HVS - Managing Director Lodging situation and Mexico outlook 09:55 10:20 Eduardo Lopez Guillermo Bravo 10:20 10:40 Victor de Anda 10:40 10:50 BREAK FIHO - General Director FIHO - Head of Development Aset Architecture and design Founder 2015 Portfolio Openings Overview of hotel design 10:50 11:10 Eduardo Lopez Guillermo Bravo FIHO - General Director FIHO - Head of Development Pipeline and cash deployment 11:10 11:20 Alberto Galante FIHO - Co-chairman Balance sheet and capital allocation 11:20 11:55 Edouard Boudrant Jose Luis Jacome FIHO - CFO FIHO - Director of Operations Financial and operating results Market trends and expectations 11:55 12:00 Simon Galante FIHO - CEO Closing remarks
4 4 FibraHotel day 2015 objectives 1 Continue leading investor communication, transparency and corporate governance 2 Overview of business plan execution in FibraHotel s strategy and growth pipeline 4 Review of financial results
5 2015 business plan execution 1 Will reach 69 operating hotels with 2015 portfolio In 2015, developed/acquired 13 hotels with 1,833 rooms and almost Ps. 2.7bn invested Focus now turns to ramp-up of the 2015 development portfolio Portfolio enhancement including five new full-service hotels and landmark assets in Monterrey, Guadalajara and Queretaro Funded pipeline continues to build. Ability to develop hotels a year 11 hotels with ~1,450 rooms to open in 2016/17 Including six hotels with GICSA FIHO would reach 86 hotels with 11,886 rooms Fully funded pipeline; With 80 hotels, FIHO would have ~Ps. 1.7bn of net debt Property asset management to maximize cash flows Four hotels with >500 rooms renovated in 2015; >Ps. 225mm in capex invested One hotel rebranding and one hotel conversion Strong operating results with 7.4% RevPAR growth (3Q 2015 LTM) Strong organic growth across the board; >3x Mexico GDP growth and >2x inflation Operating margin improvement of 112bps with 46% flow-through Invested all cash on the balance sheet. First credit line draw-downs in Q Note: (i) 2015 portfolio includes: Fairfield Inn & Suites Saltillo and Villahermosa; One Perisur; Fiesta Inn Lofts and Courtyard by Marriott Cd. del Carmen; Fiesta Inn Villahermosa Cencali; Fairfield Juriquilla; One Durango; Fiesta Americana Pabellon M; AC by Marriott Guadalajara and Queretaro; FAG Monterrey Trebol; Live Aqua Monterrey Trebol 5
6 6 The most attractive hotel portfolio in Mexico Business hotel portfolio tracking the Mexican economy Including six hotels with GICSA FIHO would reach 86 hotels with 11,886 rooms


7 7 Open architecture with access to the best brands Broad range of alternatives across categories, brands and operators
8 A continuously improving, diversified portfolio Room breakdown based on FibraHotel s current portfolio of 80 hotels with 11,006 rooms Rooms by segment Rooms by Operator Rooms un operation/development Added five new fullservice hotels in key markets (two luxury) Increased exposure to extended stay segment Posadas continues to be main partner with 60 hotels Reached 12 hotels with Marriott International 69 hotels with 9,557 rooms operating (including 2015 development portfolio) 11 hotels with 1,449 rooms under development Increased exposure to full-service hotels and landmark assets At IPO FIHO had 2 operators, 3 brands, 1 full service hotel and no extended stay hotels Notes: Company estimates 8


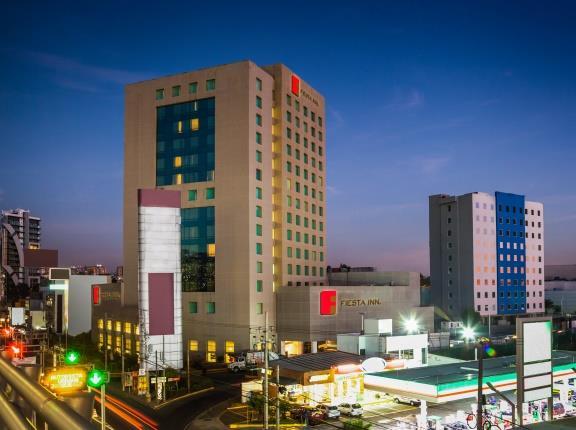
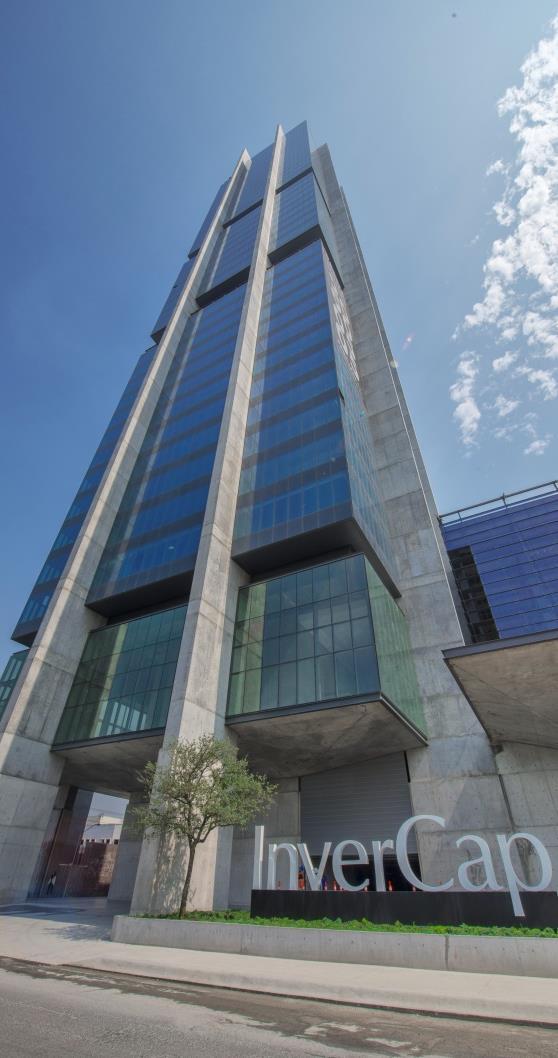
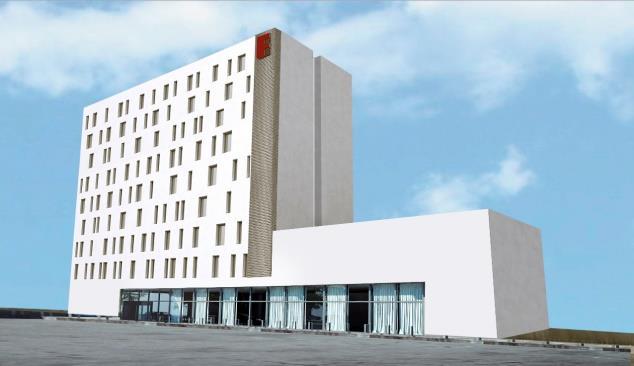
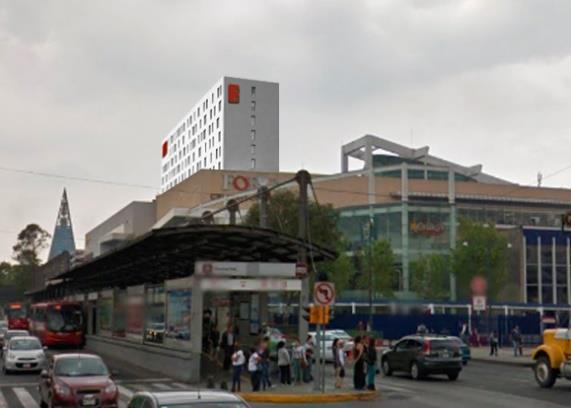
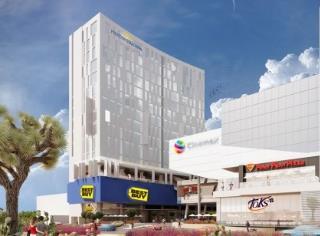
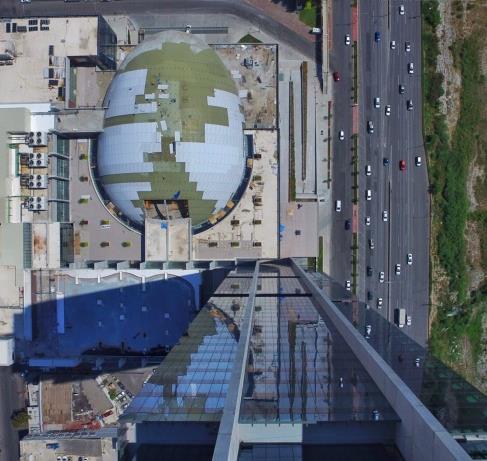
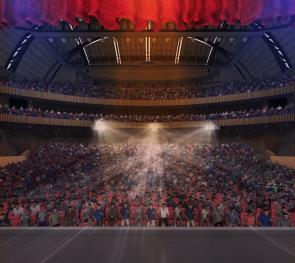
9 Landmark properties in portfolio 9
10 1Q 13 2Q 13 3Q 13 4Q 13 1Q 14 2Q 14 3Q 14 4Q 14 1Q 15 2Q 15 3Q 15 1Q 13 2Q 13 3Q 13 4Q 13 1Q 14 2Q 14 3Q 14 4Q 14 1Q 15 2Q 15 3Q 15 1Q 13 2Q 13 3Q 13 4Q 13 1Q 14 2Q 14 3Q 14 4Q 14 1Q 15 2Q 15 3Q 15 1Q 13 2Q 13 3Q 13 4Q 13 1Q 14 2Q 14 3Q 14 4Q 14 1Q 15 2Q 15 3Q 15 Growth story in an attractive segment Rooms in operation RevPAR of stabilized properties +84% 25% CAGR +16% 6% CAGR 4,397 4,798 5,547 5,547 6,115 6,664 6,944 7,656 7,777 7,921 8, Revenues (Ps. $ million) NOI (Ps. $ million) +184% +145% 46% CAGR % CAGR Notes: Company financials 10
11 FibraHotel s price is correct? Annualized dividend yield Q % 8.0% 6.3% 6.4% 6.7% 5.3% 5.5% 5.6% 5.7% 0% HCity FUNO FINN Danhos FIHO FSHOP Terra Prologis MQ FIHO PF 1 Considerations: - FIHO is currently in investment phase, and thus its dividend yield is not normalized - For comparison purposes, need to analyze the company by separating the development portfolio - Even in this scenario, the analysis does not take into account further upside such as: i. Organic growth (7.4% RevPAR growth y-o-y) ii. Attractive returns from developments iii. Use additional debt to lever up the balance sheet and invest in accretive projects Note: Illustrative calculation estimations: FIHO PF assumes that the ~2.5bn in cash and development properties at Q3 15 is used to repurchase shares at current price (~165mm shares). For FIHO, PF yield based on Q3 distribution net of interest income, annualized (Ps. 24.4mm for Q3) divided by adjusted market capitalization after share repurchase (Ps. 5.0bn including 329mm shares with economic rights) Notes: Illustrative example only. Prices as of December 1,
12 FibraHotel s price is correct? Real estate valuation Price per key Price per square meter FIHO - Q Total Operating # of hotels # of rooms 11,006 8,210 # of shares with econ. rights (mm) Considerations of per key values: - FIHO portfolio cost of Ps. 0.9mm (US$54k) - Avg. market transactions: Ps. 1.4mm (US$85k) - Cost to develop Ps. mm: (i) select service ~1.0, (ii) limited service ~0.75, (iii) full service ~1.5 Ps. US$ Cash on hand Dividend payable for results in Q3 (106.0) (6.4) Net cash Cash invested in development 1, Pro-forma cash (op.) properties 2, Calculations Ps. Hotels US$ Rooms 8,210 8,210 Market Cap 7, Pro-forma cash for operating hotels (2,493.0) (151.1) Enterprise Value 4, Ps. / key US$ / key EV per operating hotel key 604, ,655.7 Discount to FIHO historical cost (32.5%) Operating hotels FIHO including 2015 portfolio # of hotels 69 # of rooms 9,557 Real Estate constructed (m2/ft2) 570,000 6,135,423 # of shares with econ. rights (mm) Considerations of construction costs: - FIHO 2015 portfolio cost per m2 Ps. 27,539 (excluding Trebol and Pabellon M: Ps. 21,480) Ps. US$ Cash on hand Dividend payable Q3 (106.0) (6.4) Remaining Investment to develop (1,183.2) (71.7) PF debt w / 69 open hotels (440.2) (26.7) Calculations FIHO including 2015 portfolio Ps. / m2 US$ / ft2 Hotels Rooms 9,557 9,557 Real Estate constructed (m2/ft2) 570,000 6,135,423 Market Cap 7, Pro-forma cash for operating hotels Enterprise Value 7, Ps. US$ EV per m2 constructed 13, EV per ft2 constructed 1, Discount to 2015 Development Portfolio cost (49.7%) Notes: Illustrative example only. Company estimates. 12
13 What changed? A better company at half the price Even with real assets, a better environment and more rooms in operation, the stock price decreased in 2015 FIHO stock price (US$) Rooms in operation $ ,000 $2.25 9,000 $2.00 8,000 7,000 $1.75 6,000 $1.50 5,000 $1.25 4,000 $1.00 3,000 2,000 $0.75 1,000 $ / / / / / / / / / / / / /2015 Evolution of FibraHotel since the IPO Hotels are are real hard assets and have appreciated in in market value 2.5x larger portfolio: Added hotels and >6,500 rooms (39 in in operation) Diversified by portfolio: adding Added international international brands brands, landmark landmark full-service assets in hotels gateway cities and exposure to full-service hotels Announced pipeline. Clear use of cash with proven development know-how Announced pipeline clear use of cash Lodging sector outperforming: Best KPIs in years across the board Lodging sector outperforming: Best KPIs in years across the board Built asset management team and optimized hotel level results Mexico economic prospects improved (structural reforms, attractive Mexico industrial, economic automotive prospects and manufacturing improved (structural investment reforms, prospects) FDI, etc.) >Ps. >Ps. 1,100mm returned to to shareholders (>Ps. (>Ps. $2.3 $2.3 per per CBFI) CBFI) Notes: Prices as of December 1, 2015 Considerations since IPO: Increased Interest rate uncertainty Capital deployment has been more focused on development than acquisitions (and slower) Peso depreciation More Fibras in the market 13
14 14 FibraHotel business plan What is next? Growth story intact with a clear pipeline that continues to build Continue leveraging development expertise to grow in mixed use projects at right cost Announced 10 hotels for 2016/2017 with additional projects coming Looking for acquisition opportunities. Continues to be a sellers market Strong performance of stabilized portfolio. Bullish for 2016 Strong fundamentals for organic growth in FDI and manufacturing continue to supporting record KPI levels in the portfolio Focus on ramp-up of 2015 portfolio Strong balance sheet provides capital allocation alternatives Fully funded for announced portfolio, maintaining a conservative LTV of ~20% Alternatives to create shareholder value such as a CBFI buy-back Exploring alternatives to fund developments without impacting dividend Leading management team and sponsor aligned with investors Transparency and corporate governance are key components of our strategy Best-in-class team to manage existing hotel portfolio and execute growth Sponsor aligned with investors and with a strong position in the company FIHO is the leading company in the attractive business hotel segment with landmark assets


15 2015 portfolio 15


16 2015 portfolio overview Geographic location Room breakdown by: Segment Region By investment, almost 70% represents full-service hotels Right cost Price per Key Developed nine brands (six not fully developed in Mexico) Category Ps. mm US$ k Full Service Select Service Limited Service Total Notes: Estimated investment and cost per key for developments. Assumes FX of 16.5 Ps per USD 16

 Brand/Operator - Aqua / Posadas Fiesta Americana")


 Brand/Operator Fiesta Americana / Posadas AC by")


 Brand/Operator - Courtyard / Marriott Fiesta Inn")

 Brand/Operator Fiesta Inn Lofts / Posadas")

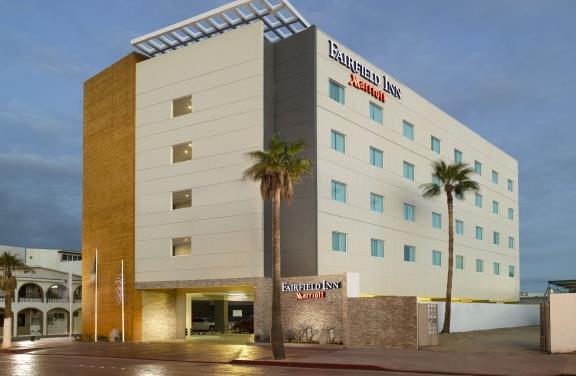
 Brand/Operator - Fairfield / Marriott Fairfield")
 Type - 134 limited-service rooms Inv.")

 Brand/Operator - Fairfield / Marriott One")


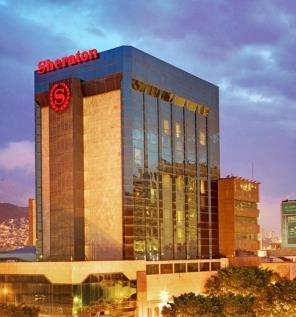
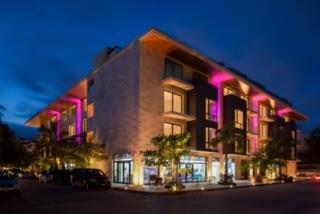
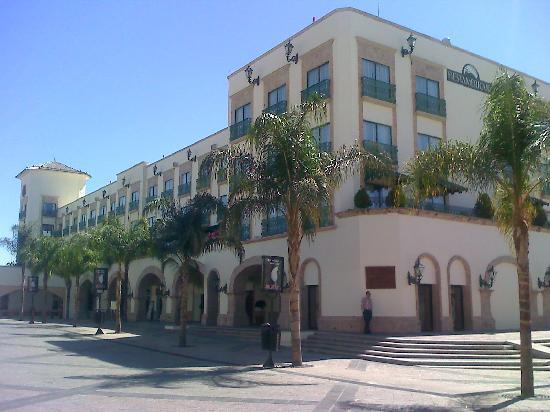
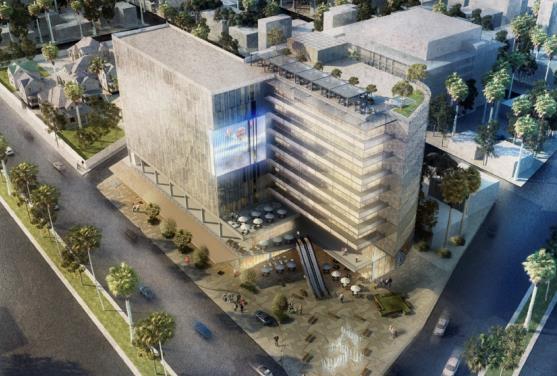
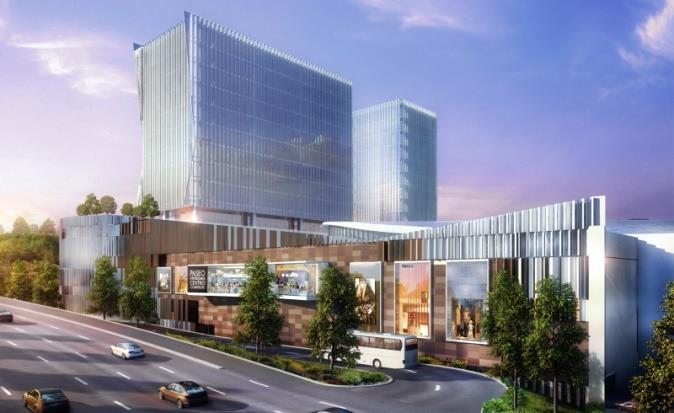
17 2015 portfolio overview (cont d) Live Aqua Monterrey Location - Monterrey Type - 74 luxury rooms Inv. 250mm Per key US$205k (Ps. 3.4mm) Brand/Operator - Aqua / Posadas Fiesta Americana Grand Monterrey Location - Monterrey Type full-service rooms Inv. 460mm Per key US$155k (Ps. 2.5mm) Brand/Operator - FAG / Posadas Fiesta Americana Monterrey Pabellon M Location - Monterrey Type full-service rooms Inv. 425mm Per key US$145k (Ps. 2.4mm) Brand/Operator Fiesta Americana / Posadas AC by Marriott Antea Queretaro Location - Queretaro Type full-service rooms Inv. 212mm Per key US$73k (Ps. 1.2mm) Brand/Operator - AC / Marriott AC by Marriott Torre Americas 1500 Guadalajara Location - Guadalajara Type full-service rooms Inv. 246mm Per key US$80k (Ps. 1.3mm) Brand/Operator - AC / Marriott Courtyard Ciudad del Carmen Location Ciudad del Carmen Type select-service rooms Inv. 135mm Per key US$60k (Ps. 1mm) Brand/Operator - Courtyard / Marriott Fiesta Inn Lofts Ciudad del Carmen Location - Ciudad del Carmen Type extended-stay rooms Inv. 120mm Per key US$60k (Ps. 1mm) Brand/Operator Fiesta Inn Lofts / Posadas Fairfield Inn & Suites Saltillo Location - Saltillo Type limited-service rooms Inv. 112mm Per key US$50k (Ps. 0.8mm) Brand/Operator - Fairfield / Marriott Fairfield Inn & Suites Juriquilla Location Juriquilla (Queretaro) Type limited-service rooms Inv. 110mm Per key US$50k (Ps. 0.8mm) Brand/Operator - Fairfield / Marriott Fairfield Inn & Suites Villahermosa Location - Villahermosa Type limited-service rooms Inv. 110mm Per key US$50k (Ps. 0.8mm) Brand/Operator - Fairfield / Marriott One Perisur Location Mexico City Type limited-service rooms Inv. 120mm Per key US$50k (Ps. 0.8mm) Brand/Operator - One / Posadas One Durango Location - Durango Type limited-service rooms Inv. 72.5mm Per key US$35k (Ps. 0.6mm) Brand/Operator - One / Posadas Notes: Estimated investment and cost per key for developments. Assumes FX of 16.5 Ps per USD 17
18 Continue with bolt-on acquisitions at right cost FibraHotel acquisitions Initial portfolio Acquisition date Category Investment Price / key Price / key # rooms (Ps. mm) (Ps. 000 s) (US$000 s) 1 IPO Portfolio FibraHotel Dec 2012 / Feb , , FIHO acquisitions in , Fiesta Americana Aguascalientes 15/01/2014 full-service , Fiesta Inn Xalapa 27/03/2014 select-service , One Xalapa 27/03/2014 limited-service Fiesta Inn Cd Obregon 07/04/2014 select-service , Fussion 5 Leon (Gamma) 16/05/2014 select-service Gamma Valle Grande Cd Obregon 30/05/2014 select-service Fairfield Inn Los Cabos 20/06/2014 limited-service Fiesta Inn San Luis Oriente 21/07/2014 select-service Gamma Lausana Tijuana 24/07/2014 select-service Microtel Saltillo (to be repositioned) 25/09/2014 limited-service Sheraton Ambassador Monterrey 17/11/2014 full-service Lat 20 by Live Aqua Playa del Carmen 19/11/2014 Luxury , Fiesta Inn y One Cuernavaca 15/12/2014 select & limited service Fiesta Inn Villahermosa Cencali 01/12/2015 select-service , Fiesta Americana Monterrey Pabellon M 02/12/2015 full-service , FibraHotel total portfolio $7, ,596 $951.1 $57.6 Overview by segment FibraHotel 4 Price / key (Ps. 000 s) Price / key (US$ 000) Limited service Select service Full service 1, Overall 1, Market announced acquisition transactions since Acquisitions since 2013 Acquisition date Category Investment Price / key Price / key # rooms (Ps. mm) (Ps. 000 s) (US$000 s) 1 Hilton Centro Historico Jun 2013 full-service 1, , Marriott Puebla Jul 2013 full-service , Mexico Plaza Portfolio (4 hotels) 2014 limited-service Camino Real Guanajuato Aug 2013 full-service , Holiday Inn Coyoacan Dec 2013 full-service , Melia Reforma Ciudad de Mexico Dec 2013 full-service , Aloft Guadalajara Jan 2014 select-service , Holida Inn Tampico Altamira Mar 2014 select-service , Microtel portfolio (6 hotels) Sep 2014 limited-service Crown Plaza Monterrey Airport Sep 2014 full-service , Mexico Plaza Guadalajara Sep 2014 limited-service , Krystal Urbano Cancun Nov 2014 full-service , Maria Barbara Satelite Apr 2015 select-service , Holiday Inn Reynosa June 2015 full-service , Hampton Inn Hermosillo June 2015 select-service , Staybridge Suites Guadalajara July 2015 extended stay , Aryba Guadalajara July 2015 select-service Courtyard Chihuahua November 2015 select-service , Hampton Inn Chihuahua November 2015 select-service , City Express and City Junior Chihuahua November 2015 limited-service Market transaction average $6, ,815 $1,395.2 $84.6 Market Price / key (Ps. 000 s) Price / key (US$ 000) Limited service Select service 1, Full service 1, Overall 1, Notes: (i) Assumes FX of 16.5 Ps. per USD; (ii) Fiesta Inn Villahermosa Cencali includes land for an additional hotel; (iii) Estimated investment based on public disclosure; (iv) Includes 2015 portfolio of developments 18

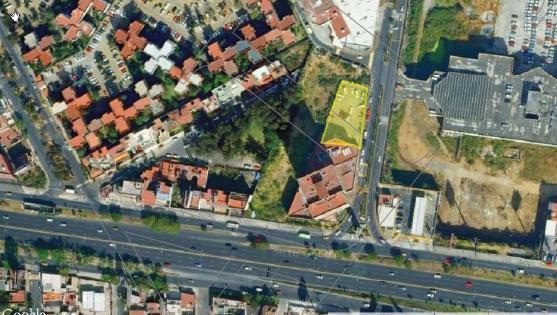
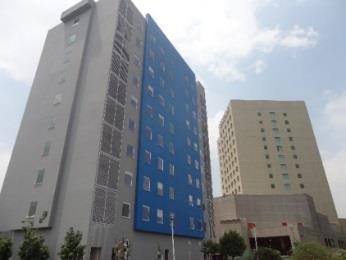
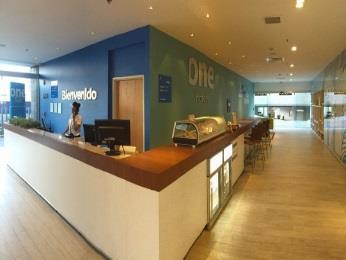


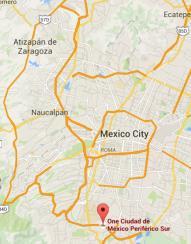
19 19 Development of One Perisur hotel - case study One Perisur General information One Periferico Sur Ciudad de Mexico 144 limited service rooms operated by Grupo Posadas Opened in July 2015 Located in Mexico City (Center region) Location Mexico City, on Periferico Sur In a hotel complex with the Fiesta Inn Perisur hotel


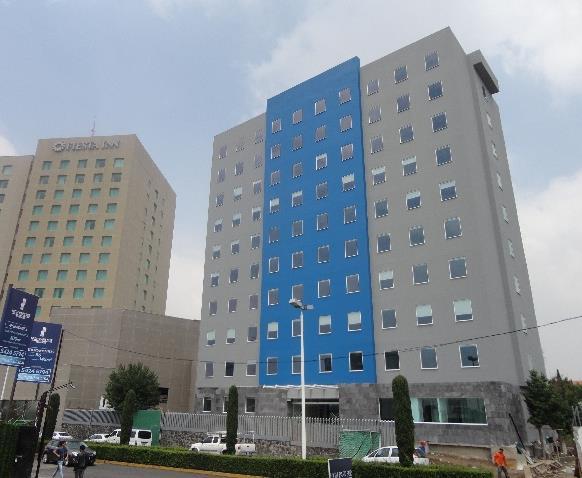
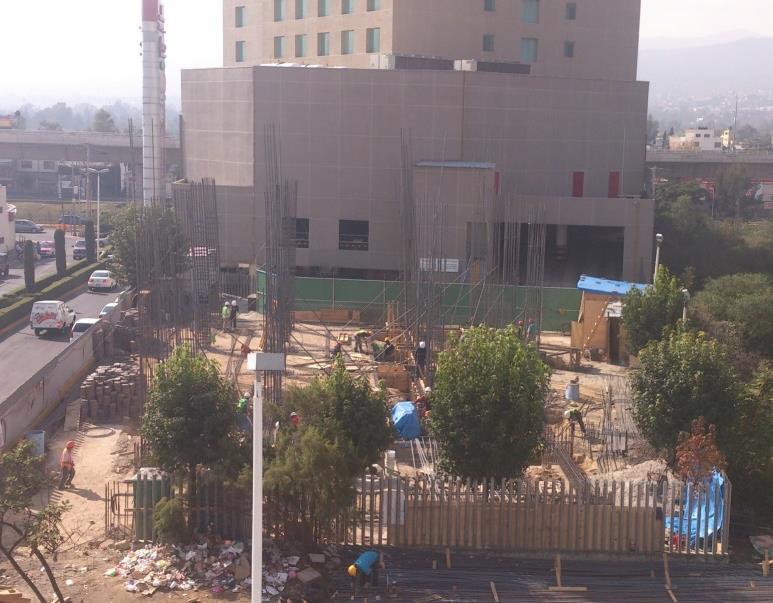
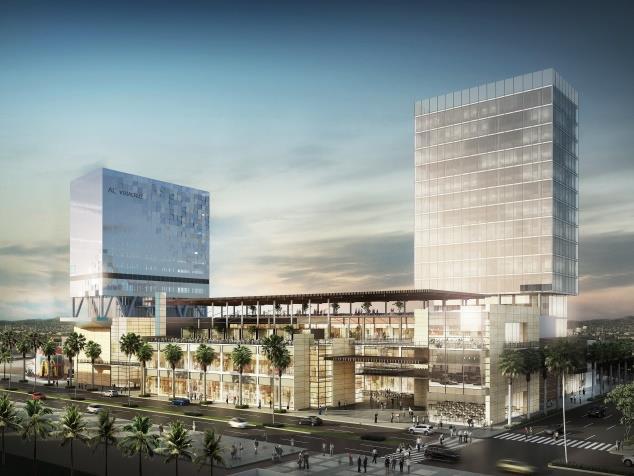
20 20 Overview of the One Perisur construction November 2014 January 2015 March 2015 May 2015
21 portfolio main focus is now ramp-up Occupancy rate 54% 46% 48% 44% 29% 35% 40% 40% 42% 32% 34% 14% m1 m2 m3 m4 m5 m6 m7 m8 m9 m10 m11 m12 ADR $803 $756 $777 $795 $806 $785 $754 $776 $830 $810 $790 $784 Exercise based on a sample of 5 greenfield hotels: One Tapatío, One Cuernavaca, One Monclova, Real Inn Morelia, Camino Real Suites Puebla Occupancy during ramp-up: Phase 1: During the First 6-month period. Consists of positioning the new hotel in the market Result: 32% occupancy rate (accumulated) Phase 2: During the second 6-month period, the hotel is consolidated in the market Result: 46% occupancy rate (accumulated) Phase 3: From the 12 th month and until the 24/36 th month, the hotel is stabilized with penetration above 100% (occupancy rate similar to the stabilized portfolio) Result: 60% to 65% occupancy rate on a yearly basis m1 m2 m3 m4 m5 m6 m7 m8 m9 m10 m11 m12 RevPAR $445 $218 $268 $253 $277 $313 $360 $360 $379 $300 $328 $110 m1 m2 m3 m4 m5 m6 m7 m8 m9 m10 m11 m12 ADR: ADR is fairly stable during the first year of the hotel Additional increase in rates comes from revenue management once the hotel is stabilized RevPAR growth: Increase in RevPAR during ramp-up and first 12 months is mainly driven by the occupancy increase Further growth to come from above average market penetration


 Brand/Operator Courtyard / Marriott Courtyard Via Vallejo Mexico City (2016) Location Mexico City Type")
 Location Mexico City Type - 12")


 Brand/Operator TBD Fairfield Inn & Suites Nogales (2016) Location Nogales Type - 134 limited-service")
 Brand/Operator - Fairfield / Marriott Limited service Cuautitlan, Mexico City (2016) Location Mexico")
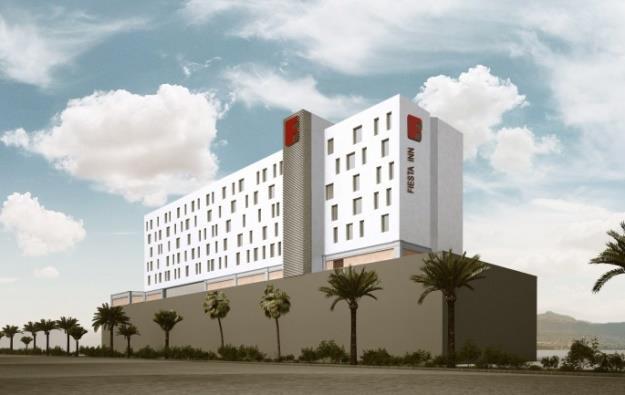
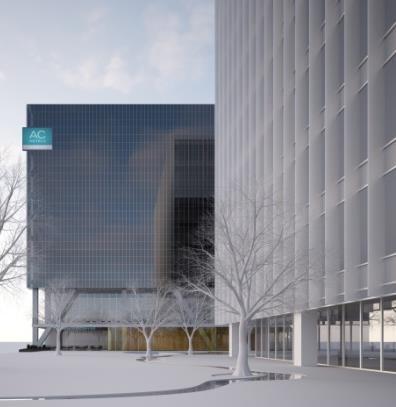
22 Announced pipeline of 2016/2017 projects Fiesta Inn Los Mochis (2016) Location Los Mochis (Sinaloa) Type select-service rooms Inv mm Cost per key Ps. 900k Brand/Operator Fiesta Inn / Posadas Courtyard Toreo (2016) Location Mexico City (Toreo) Type select-service rooms Inv. 165mm Per key US$77k (Ps. 1.3mm) Brand/Operator Courtyard / Marriott Courtyard Via Vallejo Mexico City (2016) Location Mexico City Type select-service rooms Inv. 160mm Per key US$80k (Ps. 1.3mm) Brand/Operator Courtyard / Marriott Fairfield Inn & Suites Via Vallejo Mexico (2016) Location Mexico City Type limited-service rooms Inv. 130mm Per key US$63k (Ps. 1.0mm) Brand/Operator Fairfield Inn & Suites / Marriott Fiesta Inn Lofts Monterrey La Fe (2016) Location Monterrey Type - 48 extended stay rooms Inv. 48mm Per key US$61k (Ps. 1.0mm) Brand/Operator Fiesta Inn Lofts / Posadas Select Service Veracruz (2016) Location - Veracruz Type select-service rooms Inv. 188mm Per key US$69k (Ps. 1.1mm) Brand/Operator TBD Fairfield Inn & Suites Nogales (2016) Location Nogales Type limited-service rooms Inv. 120mm Per key US$54k (Ps. 0.9mm) Brand/Operator - Fairfield / Marriott Limited service Cuautitlan, Mexico City (2016) Location Mexico City Type limited-service rooms Inv. 125mm Per key US$66k (Ps. 1.1mm) Brand/Operator - TBD Fiesta Inn Viaducto - Via 515 (2017) Location Mexico City Type select-service rooms Inv. 210mm Per key US$71k (Ps. 1.2mm) Brand/Operator Fiesta Inn / Posadas Fiesta Inn Lofts Viaducto Via 515 (2017) Location Mexico City Type extended stay rooms Inv. 125mm Per key US$71k (Ps. 1.2mm) Brand/Operator Fiesta Inn Lofts / Posadas Fiesta Inn Villahermosa (2017) Location Villahermosa, Tabasco Type select-service rooms Inv. 220mm Per key US$67k (Ps. 1.1mm) Brand/Operator Fiesta Inn / Posadas Notes: Estimated investment and cost per key for developments. Assumes FX of 16.5 Ps per USD 22


23 Current 2016/2017 portfolio overview Geographic location Room breakdown by: Segment Region Right cost Potential brands Price per Key Category Ps. mm US$ k Extended stay Select Service Limited Service Total Notes: Estimated investment and cost per key for developments. Assumes FX of 16.5 Ps per USD 23


24 Additional pipeline alternatives 24
25 Overview of FibraHotel s portfolio FibraHotel portfolio Hotel Name Rooms Opening Investment (Ps. mm) Under Total By Q Pending Constr. Q1 Q2 Q3 Q4 Q1 Q2 Q3 Q4 56 Current portfolio 7, (214.3) 7,674 7,674 7,674 7,674 7,674 7,674 7,674 7,674 7, Portfolio 1 Fairfield Inn & Suites Saltillo 139 March One Perisur 144 June (65.6) Fiesta Inn Lofts Cd del Carmen 120 Sep Courtyard by Marriott Cd. del Carmen 133 Nov Fairfield Villahermosa 134 Dec (11.0) Fiesta Inn Villahermosa Cencali 159 Nov (295.0) Fairfield Juriquilla 134 Dec (1.2) One Durango 126 Dec (41.9) Fiesta Americana Pabellon M 177 Q (386.0) AC by Marriott Guadalajara 188 Q (33.7) AC by Marriott Queretaro 175 Q (65.6) FAG Monterrey Trebol 180 Q (174.9) 13 Live Aqua Monterrey Trebol 74 Q Sub-total 1,883 2,668 1,593 (1,074.9) ,089 1,883 1,883 1,883 1,883 1, FibraHotel Portfolio 9,557 (440.2) 7,813 7,957 8,077 8,763 9,557 9,557 9,557 9,557 9, /2017 Portfolio 1 Fiesta Inn Lofts Monterrey 48 Q (47.5) Fiesta Inn Los Mochis 125 Q (93.8) Fairfield Inn & Suites Vallejo 125 Q (194.2) 4 Courtyard Vallejo 121 Q Fairfield Nogales 134 Q (109.8) Fairfield Cuautitlan 115 Q (110.0) Select Service Veracruz 165 Q (155.6) Courtyard Toreo 130 Q (44.6) Fiesta Inn Via (285.0) 10 Fiesta Inn Lofts Via Fiesta Inn Cencali (220.0) Sub-total 1,449 1, (1,260.6) , FibraHotel Portfolio 11,006 (1,700.8) 7,813 7,957 8,077 8,763 9,557 9,605 10,225 10,520 11,006 6 GICSA 880 (900.0) FibraHotel Portfolio 11,886 (2,600.8) 7,813 7,957 8,077 8,763 9,557 9,605 10,225 10,800 11,886 Notes: Estimated investment and cost per key for developments 25


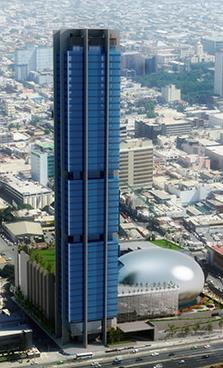
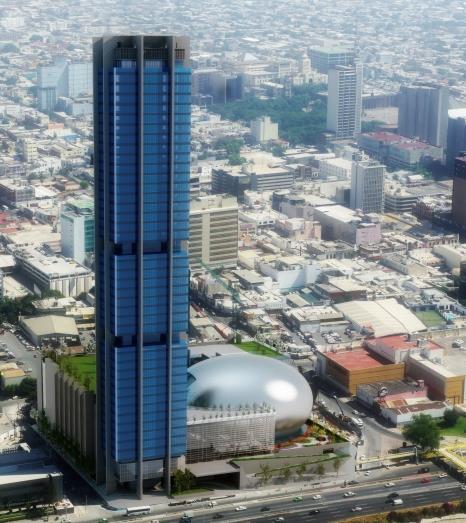
26 Pabellon M case study 26


27 Pabellon M case study Investment criteria Strategic location Downtown Monterrey, inside Pabellon M complex Adequate price and return Leading penetration driven from strong project demand including 30k of offices, conference center for ~3,800 people, auditorium for 4,500 people, and 22k of retail Price per key US$145k High quality and unique assets Landmark hotel in the largest project and 50 level tower in Monterrey, by Agustin Landa New Fiesta Americana hotel design Portfolio diversification Adds exposure to Monterrey and full-service category Pictures of Pabellon M Hotel overview and strategic rationale 177-room full-service hotel located in business downtown district in Monterrey, Nuevo Leon Fiesta Americana hotel operated by Grupo Posadas Leading market penetration from a combination of project specific and market wide demand Budget of Ps. $425mm (US$145k per key) Acquired the structure finished from Pabellon M. Interiors and FF&E executed by FibraHotel through subcontractors Opening Q1 2016, just months after acquiring Hotel location Office Hotel Note: Company estimates 27


 Mexico City International")
28 Fiesta Inn & Lofts Via 515 case study Investment criteria Strategic location Mexico City on Viaducto, one of the main highways Inside mixed-use project Via 515 Adequate price and return Two hotels with 278 rooms and conference center Price per key <US$75,000 High quality and unique assets Inside mixed use project with 35k of office GLA, 15k of retail GLA and the two hotels Portfolio diversification Expand presence in Mexico City. New location in the east part of the city Continue expanding extended stay segment Renders of Via 515 Hotel overview and strategic rationale 178-room select-service Fiesta Inn hotel and 108-room extended stay Fiesta Inn Lofts hotel Fiesta Inn and Fiesta Inn Lofts hotels operated by Grupo Posadas, looking to leverage local distribution Over 500m2 of meeting space Budget of Ps. $335mm (US$73k per key) Acquired the core and shell of the structure finished from project developer. Interiors and FF&E executed by FibraHotel through subcontractors Estimated for year end 2017 Hotel location in Mexico City ) Mexico City International airport 2) Autódromo Hermanos Rodríguez 3) Palacio de los Deportes 4) México-Puebla highway and Ignacio Zaragoza industrial zone Via 515 project with Fiesta Inn and Fiesta Inn Lofts hotels Note: Company estimates 28


. Full project investment estimated at Ps.")
29 Villahermosa Cencali case study Investment criteria Strategic location Tabasco 2000 area in Villahermosa On 19,200m2 of land. FIHO to develop a new hotel Adequate price and return Strong performance of Posadas hotels in the city Price per key combined of ~US$90k High quality and unique assets In the main business district, and on the Laguna de las Ilusiones Premium land plot to develop Portfolio diversification Operating hotel converted to Fiesta Inn Exposure to the Gulf region and the oil industry Pictures of the Cencali Villahermosa hotel Hotel overview and strategic rationale 339 room hotel complex. Initially a 159-room select-service Fiesta Inn hotel. Additional 200 rooms to be developed Convert an independent hotel to Fiesta Inn First Posadas hotel in Villahermosa (Fiesta Inn had leading penetration in the market in the past) Investment in first phase of Ps. $295mm (US$112k per key including land plot). Full project investment estimated at Ps. 515mm (US$87k per key) Develop a conference center of 1,300m2 New hotel tower expected for 2017 Hotel location Note: Company estimates 29
30 Devel. Opera. Financing in place to continue growth 13 hotels 1,883 rooms 11 hotels 1,449 rooms 6 hotels 880 rooms 69 hotels 9,557 rooms 86 hotels 11,886 rooms 56 hotels 7,674 rooms Current Operating portfolio Portfolio = FibraHotel Operating portfolio by YE /2017 development portfolio + GICSA = Portafolio pro-forma 56 hotels 7,674 rooms 5 hotels 695 rooms 69 hotels 9,557 rooms 69 hotels 9,557 rooms 8 hotels 1,188 rooms 11 hotels 1,449 6 hotels hotels 2,329 rooms PF cash of + Ps. 650mm Remaining Investment of (-) Ps. 1,100mm PF debt of Ps. (440mm) Remaining Investment of (-) Ps. 1,260mm Remaining Investment of (-) Ps. 900mm PF debt of ~Ps. (2,600mm) Note: Company estimates 30


31 FibraHotel FibraHotel Service providers Advisor Administrator 31 Strong management team and growth structure Roberto Galante Alberto Galante Simón Galante Eduardo Lopez Chief executive Officer Finance Operations Development Legal Edouard Boudrant Chief Financial Officer José Luis Jacome Chief Operation Officer Guillermo Bravo Head of Dev. / IR Lorena Garcia Head Legal Counsel Team of 7 persons Controllers Treasurer Fixed Assets Administrative Team of 5 persons Operations Maintenance Capex Team of 2 persons Development managers Team of 3 persons Legal counsels


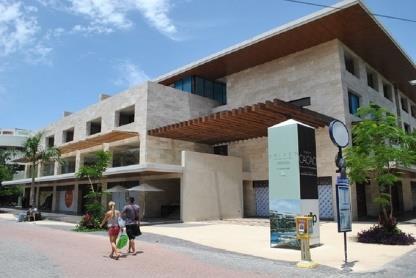


32 Cacao Playa del Carmen Rebranding case study 32
33 33 KPIs continue to be solid 2007 / 2015 Quarterly KPIs of 47 stabilized hotels 1, ADR RevPAR Occupancy 80% 70% 60% 50% 40% 30% 20% 10% 0% 3Q 2015: a 66.2%, occupancy rate, a Ps. 917 ADR, a Ps. 607 RevPAR Occupancy rate: +209bps vs. 3Q 2014 (64.1%) ADR: +3.6% vs. 3Q 2014 (Ps. 885) RevPAR: +7.0% vs. 3Q 2014 (Ps. 567) 3Q 2015 LTM: a 64.2% occupancy rate, a Ps. 925 ADR, a Ps. 594 RevPAR Occupancy Rate: +259bps vs. 3Q 2014 LTM (61.6%) ADR: +3.0% vs. 3Q 2014 LTM (Ps. 898) RevPAR: +7.4% vs. 3Q 2014 LTM (Ps. 553)
34 34 with positive growth across all regions and segments KPI breakdown per region 47 stabilized hotel portfolio % of 3Q 2014 LTM 3Q 2015 LTM Change y-o-y rooms Occupancy ADR RevPAR Occupancy ADR RevPAR Occupancy ADR RevPAR By region Northwest 23% 59.2% $897 $ % $911 $ % 1.5% 10.1% Northeast 13% 57.5% $790 $ % $845 $ % 6.9% 19.3% Central and South 54% 64.3% $934 $ % $966 $ % 3.5% 4.0% West 9% 57.9% $822 $ % $831 $ % 1.1% 7.8% Stabilized Portfolio (47H) 100% 61.6% $898 $ % $925 $ % 3.0% 7.4% By segment Limited-Service 22% 58.6% $702 $ % $730 $ % 4.0% 9.4% Select-Service 69% 63.2% $934 $ % $953 $ % 2.0% 6.0% Full-Service 8% 56.3% $1,097 $ % $1,203 $ % 9.6% 15.3% Stabilized Portfolio (47H) 100% 61.6% $898 $ % $925 $ % 3.0% 7.4% Results driven by (i) market dynamics (ii) penetration by the brands and operators; and (iii) asset management by FibraHotel Occupancy, ADR and RevPAR y-o-y growth is positive across all regions and categories All regions are above 60% occupancy (most near 65%) The northeast, led by Monterrey, continues to outperform in growth with almost 20% increase in RevPAR On a per segment basis, full service hotels are coming off a lower base and continue to have more room to grow in the near term Occupancy 3Q 2015 # of stabilized hotels with occupancy of: >65% 50%>65% <50% 40% 9% 51%
35 Key financial indicators 3Q LTM 3Q 2014 LTM 3Q 2015 LTM Var. 47 stabilized properties Occupancy 61.4% 64.2% +259bps ADR RevPAR Ps. 898 Ps. 925 Ps. 553 Ps % +7.4% Total Portfolio Total Revenues Ps. 1,394mm Ps. 1,901mm NOI Ps. 458mm Ps. 608mm +36.4% +32.6% EBITDA Margin Per room Ps. 327m 23.5% Ps. 47,092 Ps. 468mm 24.6% Ps. 57, % +115bps +23.0% AFFO Ps. 415mm Ps. 428mm +2.7% Note: Financial information as reported, as of Q
36 Stabilized properties vs. ramp-up properties # of Rooms 3Q 2015 # of Hotels 3Q , % 20% 1, Stab. Ramp-up Stab. Ramp-up During the 2015 January to September period, FibraHotel s managed hotels generated: Ps. 1,392 million of total revenues 89% for stabilized hotels 11% for ramp-up hotels Ps. 419 million of lodging contribution (margin: 30.1%) 91% for stabilized hotels (margin: 30.7%) 9% for ramp-up hotels (margin: 25.3%) Jan-Sep 2015 Financial performance Portfolio Data in thousand of Ps. Total Stabilized Ramp-up # of hotels # of rooms 7,474 6,298 1,176 Revenues 1,392,248 1,243, ,858 Lodging contribution 418, ,236 37,698 Margin 30.1% 30.7% 25.3% Lodging Contribution / room $ 56,021 $ 60,533 $ 32, % Lodging contribution per room of stabilized hotels is almost twice the lodging contribution per room of ramp-up hotels Ps. 60,533 vs. Ps. 32,056 The stabilization of the 11 ramp-up hotels should: Increase lodging contribution: Increase in RevPAR should lead to better results on a same store basis Increase in margins Increase in revenues from RevPAR growth supports margin growth driven from efficiencies of scale and operating leverage at the hotel level Note: Calculations only include managed hotels (e.g. excludes leased hotels). Data from January-September 2015 for illustrative purposes only 36
37 Operating leverage leading to better margins January to September KPIs January to September Financial performance 61.4% 64.7% ,027 1, % 31.7% M M M M 2015 Occupancy: +329bps ADR: +1.7% RevPAR: +7.1% Revenues: +8.2% Lodging contribution: +12.2% Margin: +112bps Same store comparable margin for 9mo 2014 vs. 9mo 2015: 12.2% Lodging Contribution increase 112bps margin expansion Flow Though of 46% e.g. Ps. $100 of additional revenues generates Ps. $46 of additional Lodging Contribution Note: 2014 financial information as reported,, 2015 data presented on a comparable basis (e.g. the same # of hotels is used for each quarter, and thus exclude acquired or recently opened hotels) 37


 +34% 85.5 63.")
38 Successful hotels renovations During 2014 and 2015, FibraHotel made 5 renovations: Fiesta Inn Naucalpan, Camino Real Puebla, Fiesta Inn Culiacan, Fiesta Inn Saltillo, Fiesta Inn Tlalnepantla Each hotel is evaluated for a possible renovation due to the returns on the invested capital coupled with the positioning of the hotel in the market. Benefits include Renew the property competitively in the market and with customers Update to new standards Cost efficiencies (LED, maintenance, etc.) On average, the investment made for full renovation is Ps. 25/30mm Results of renovated properties between 2014 and 2016E 1 Increase in occupancy rate of 302bps Increase in ADR of 18% Increase in RevPAR of 24% Increase in Lodging Contribution of 34% A 307bps margin improvement Revenue Per Available Room +24% $771 $ Lodging Contribution (Ps. mm) +34% Note: (i) In the beginning of 2014 none of the hotels was renovated, and by the beginning of 2016 all hotels are remodeled 38
39 AFFO growth notwithstanding cash deployment headwinds AFFO 9M 2014 (Jan-Sep) Cash position in billion of pesos: AFFO 9M 2015 (Jan-Sep) (72) (22) Hotels NOI: +31.2% (leases excluded) AFFO 2014 Interest income Other M&A Stabilized Ramp-up AFFO 2015 Strong increase in hotels cash flow generation, partially offset by strong cash deployment effort leading to decrease in interest income Note: Other includes increase in CAPEX reserve (-), increase in corporate expenses (-) and increase in lease NOI (+) 39
40 Strong balance sheet provides alternatives Debt overview As of Sept. 30 th, 2015, zero debt and Ps. 675mm of cash available (Ps. 849mm including VAT) Two available credit lines with two banks Ps. 1,000mm each Structure overview: Tranche A: revolving / Tranche B: term loan up to 12 years Spread: les than 200bps over TIIE 100% peso funding and repayment 100% floating rate (hedge to be contracted) Mortgage backed with hotels First drawdown in November 2015 Benchmarking of FIBRAs LTV as of 3Q % 40% 30% 20% 10% 0% MQ Terra FUNO SHOP FINN Danhos FIHO Illustrative maturity schedule with Ps. 2bn (Ps. mm) % 35% 31% 26% 20% 0% 0% Liquidity overview CL 2 CL 1 Cash ~Ps. 2,850 $1,000 $1,000 $850 Liquidity Pro Forma LTV of 17% with Ps. $2,000mm of debt ~Ps. 2.6bn in liquidity w/ working capital Note: Company estimates. FINN is pro-forma for Ps. 1.9bn bond in October as illustrative 40

41 Milllion of Pesos 41 Cash deployed with leverage < 20% LTV 14,000 Cash positive Debt 12,000 Credit Lines 10,000 Excess cash 8,000 6,000 4,000 2,000-2Q Q Q Q Q Q Q Q Q Q Q Q Q Q Q 2016 Available Cash + VAT Debt Hotels in Operation Development Portfolio
 FibraHotel ( FibraHotel ), the first real estate investment trust specialized in business-class hotels in Mexico, announces its financial results and distribution corresponding to the fourth quarter of
Total revenues for the quarter were Ps. $635 million. Lodging contribution 2 for the quarter was Ps. $201 million.
 FibraHotel ( FibraHotel ), the first real estate investment trust specialized in business-class hotels in Mexico, announces its financial results and distribution corresponding to the second quarter of
During the fourth quarter, FibraHotel announced the developments of the Live Aqua San Miguel de Allende and Fiesta Americana Tlalnepantla hotels.
 FibraHotel ( FibraHotel ), the first real estate investment trust specialized in business-class hotels in Mexico, announces its financial results and distribution corresponding to the fourth quarter of
During the quarter, FibraHotel announced the development of the One Durango hotel, adding 126 rooms in development.
 FibraHotel ( FibraHotel ), the first real estate investment trust specialized in business-class hotels in Mexico, announces its financial results and distribution corresponding to the second quarter of
FibraHotel Investor Presentation
 FibraHotel Investor Presentation March 2017 @FibraHotel 2 Disclaimer This presentation has been prepared by FibraHotel (or the Trust ) for informational and discussion purposes. It does not constitute
FibraHotel Day November 20,
 FibraHotel Day 2014 November 20, 2014 @FibraHotel Disclaimer This presentation has been prepared by FibraHotel (or the Trust ) for informational and discussion purposes. It does not constitute or form
 FibraHotel ( FibraHotel ), the first real estate investment trust specialized in hotels in Mexico, announces its financial results and distribution corresponding to the second quarter of 2018. Mexico City,
 FibraHotel ( FibraHotel ), the first real estate investment trust specialized in hotels in Mexico, announces its financial results and distribution corresponding to the first quarter of 2018. Mexico City,
 FibraHotel ( FibraHotel ), the first real estate investment trust specialized in hotels in Mexico, announces its financial results and distribution corresponding to the third quarter of 2018. Mexico City,
4 th and 7 th, 2014, respectively. 2
 FibraHotel ( FibraHotel ), the first real estate investment trust specialized in business-class hotels in Mexico, announces its financial results and distribution corresponding to the first quarter of
FibraHotel ended the quarter with 37 hotels and 5,132 rooms, with 34 hotels in operation (4,798 rooms) and 3 hotels under development (334 rooms).
 and 3 hotels under development (334 rooms).") FibraHotel ( FibraHotel ), the first real estate investment trust specialized in urban business-class hotels in Mexico, announces its financial results and distribution corresponding to the second quarter
FibraHotel ( FibraHotel ), the first real estate investment trust specialized in urban business-class hotels in Mexico, announces its financial results and distribution corresponding to the second quarter
Toluca Tollocan and development of One Toluca Tollocan) representing 401 rooms.
 representing 401 rooms.") FibraHotel ( FibraHotel ), the first real estate investment trust specialized in urban business-class hotels in Mexico, announces (i) the execution and approval of agreements for the acquisition of 15
FibraHotel ( FibraHotel ), the first real estate investment trust specialized in urban business-class hotels in Mexico, announces (i) the execution and approval of agreements for the acquisition of 15
FibraHotel will pay a distribution of Ps. $99 million, equivalent to cents (Ps. $0.2003) per CBFI 4.
 per CBFI 4.") FibraHotel ( FibraHotel ), the first real estate investment trust specialized in business-class hotels in Mexico, announces its financial results and distribution corresponding to the first quarter of
FibraHotel ( FibraHotel ), the first real estate investment trust specialized in business-class hotels in Mexico, announces its financial results and distribution corresponding to the first quarter of
Corporate Presentation April 2018
 Corporate Presentation April 2018 1 Grupo Hotelero Santa Fe Ticker: HOTEL (BMV) Financial Highlights (LTM March 31, 2018 ) Revenue: Ps. 1,769 million (US 96 million) EBITDA: Ps. 603 million (US 33 million)
Corporate Presentation April 2018
 Corporate Presentation April 2018 1 Grupo Hotelero Santa Fe Ticker: HOTEL (BMV) Financial Highlights (LTM June 30, 2018 ) Revenue: Ps. 1,873 million (US 94 million) EBITDA: Ps. 627 million (US 32 million)
Corporate Presentation February 2018 NOMBRE DE LA PRESENTACIÓN
 Corporate Presentation February 2018 NOMBRE DE LA PRESENTACIÓN 1 1 Grupo Hotelero Santa Fe Ticker: HOTEL (BMV) 2017 Financial Highlights Revenue: Ps. 1,582 million (US 80 million) EBITDA: Ps. 528 million
UBS Latin American New Opportunities Conference. June 11 th -12 th, 2007
 UBS Latin American New Opportunities Conference June 11 th -12 th, 2007 Company Overview OMA operates a diversified portfolio of 13 airports distributed throughout Northern and Central Mexico and is diversified
Mexico at a Glance. Toronto, December 2013
 Mexico at a Glance Toronto, December 2013 1990 1991 1992 1993 1994 1995 1996 1997 1998 1999 Billion Dollars 1990 s the land of opportunity but not for the faint of heart NAFTA Dynamic growth in the industrial
Third Quarter 2015 Results
 Third Quarter 2015 Results Investment Highlights Positioned to take full advantage of global growth Diversified business model Well-defined strategy to capitalize on favorable industry dynamic Successful
Corporate Presentation February 2019
 Corporate Presentation February 2019 1 Grupo Hotelero Santa Fe Ticker: HOTEL (BMV) Financial Highlights (LTM Dec 31, 2018 ) Revenue: Ps. 2,064 million (US 105 million) EBITDA: Ps. 676 million (US 34 million)
Investment Highlights
 Third Quarter 2014 Investment Highlights 1 Mexican airport portfolio positioned to take full advantage of global growth. 2 Diversified business model contributing to earnings resilience. 3 Well-defined
Investment Highlights
 Second Quarter 2014 Investment Highlights 1 Mexican airport portfolio positioned to take full advantage of global growth. 2 Diversified business model contributing to earnings resilience. 3 Well-defined
Grupo Hotelero Santa Fe Reports Increase of 36% in Total Revenue and 46% EBITDA for 1Q16
 Grupo Hotelero Santa Fe Reports Increase of 36% in Total Revenue and 46% EBITDA for 1Q16 Mexico City, April 21, 2016 Grupo Hotelero Santa Fe S.A.B. de C.V. (BMV: HOTEL) ( HOTEL or the Company ), announced
Results 3 rd Quarter 2003
 Grupo Posadas, s, S.A. de C.V. & Subsidiaries October 28 th, 2003 Results 3 rd Quarter 2003 Total revenue and EBITDA increased by 10 and 12 % respectively Coastal hotels continue to improve, rates on urban
@ F i b r a H o t e l 2013
 @ F i b r a H o t e l Annual Report 2 0 1 3 2013 Highlights Portfolio occupancy rate Revenue Per Available Room increase66 % 5.6 % 20 hotels acquired 2,924 million of Pesos invested in hotels 4,878 million
HOTEL reports 49% and 50% increases in Total Revenues and EBITDA respectively for 1Q18
 HOTEL reports 49% and 50% increases in Total Revenues and EBITDA respectively for 1Q18 Mexico City, April 19 th, 2018 Grupo Hotelero Santa Fe S.A.B. de C.V. (BMV: HOTEL) ( HOTEL or the Company ), announced
Santander Conference Acapulco. January 2007
 Santander Conference Acapulco January 2007 Post-IPO Shareholder Ownership IPO on November 29, 2006; 47% free float Aeroinvest* 74.5% 25.5% SETA Public Float B Shares (Mexico) 50% ADSs 50% 36.0%* 16.7%
Playa Hotel & Resorts. Presenters: Bruce Wardinski, Chairman and Chief Executive Officer Ryan Hymel, Chief Financial Officer
 Playa Hotel & Resorts Presenters: Bruce Wardinski, Chairman and Chief Executive Officer Ryan Hymel, Chief Financial Officer This document contains information confidential and proprietary to Playa Hotels
Grupo Sanborns S.A.B. de C.V. Earnings Report 3Q 2014
 Grupo Sanborns S.A.B. de C.V. Earnings Report 3Q 2014 Mexico City, October 23, 2014 Grupo Sanborns, S.A.B. de C.V. (BMV: GSANBOR OTC: GSAOY) announced today its results for the third quarter of 2014. HIGHLIGHTS
Results 1 st Quarter 2005
 Grupo Posadas, s, S.A. de C.V. & Subsidiaries April 28, 2005 Results 1 st Quarter 2005 Total revenues increase 13% in the quarter Higher demand in urban hotels Better results in coastal hotels 3 openings
Results 2 nd Quarter 2004
 Grupo Posadas, s, S.A. de C.V. & Subsidiaries July 28 th, 2004 Results 2 nd Quarter 2004 Cosolidated revenues increased 11% EBITDA increased 15% Recovery on REVPAR 3 new openings in the 2Q04, which sum
Regional Economic Report July- September 2014
 Regional Economic Report July- September 2014 December 11, 2014 Outline I. Introduction II. Results July September 2014 A. Economic Activity B. Inflation C. Economic Outlook III. Final Remarks Introduction
HOTEL reports double-digit growth in both Total Revenues and EBITDA for 3Q17
 HOTEL reports double-digit growth in both Total Revenues and EBITDA for 3Q17 Mexico City, October 25, 2017 Grupo Hotelero Santa Fe S.A.B. de C.V. (BMV: HOTEL) ( HOTEL or the Company ), announced its consolidated
Grupo Sanborns S.A.B. de C.V. Earnings Report 2Q 2018
 Grupo Sanborns S.A.B. de C.V. Earnings Report 2Q 2018 Mexico City, July 25, 2018 Grupo Sanborns, S.A.B. de C.V. (BMV: GSANBOR OTC: GSAOY) announced today its results for the second quarter of 2018. HIGHLIGHTS
INVESTOR PRESENTATION THIRD QUARTER 2017 RESULTS
 INVESTOR PRESENTATION THIRD QUARTER 2017 RESULTS This presentation may contain forward-looking information and statements. Forward-looking statements are statements that are not historical facts. These
Grupo Hotelero Santa Fe Reports 24% Increase in Total Revenue and 28% in EBITDA for 2Q16
 Grupo Hotelero Santa Fe Reports 24% Increase in Total Revenue and 28% in EBITDA for 2Q16 Mexico City, July 21, 2016 Grupo Hotelero Santa Fe S.A.B. de C.V. (BMV: HOTEL) ( HOTEL or the Company ), announced
First Quarter 2016 Results
 First Quarter 2016 Results This presentation may contain forward-looking information and statements. Forward-looking statements are statements that are not historical facts. These statements are only predictions
Grupo Aeroportuario del Centro Norte SAB de CV SECOND QUARTER 2018 RESULTS
 Grupo Aeroportuario del Centro Norte SAB de CV SECOND QUARTER 2018 RESULTS This presentation may contain forward-looking information and statements. Forward-looking statements are statements that are not
HOTEL reports 24% and 19% growth in Total Revenues and EBITDA respectively for 3Q18
 Mexico City, October 25 th, 2018 Grupo Hotelero Santa Fe S.A.B. de C.V. (BMV: HOTEL) ( HOTEL or the Company ), announced its consolidated results for the third quarter ( 3Q18 ) ended September 30 th, 2018.
MARRIOTT INTERNATIONAL 2017 SECURITY ANALYST MEETING. March 21, 2017
 MARRIOTT INTERNATIONAL 2017 SECURITY ANALYST MEETING March 21, 2017 FORWARD LOOKING STATEMENTS, NON GAAP FINANCIAL MEASURES, AND INFORMATION FOR 2016 AND 2015 This material contains forward looking statements
SGCIB Premium Review 2018
 SGCIB Premium Review 2018 29 November 2018 Christian Labeyrie Executive Vice-President and CFO Disclaimer This presentation may contain forward-looking objectives and statements about VINCI s financial
FIRST QUARTER
 FIRST QUARTER 2007 1 WELCOME TO REZIDOR one of the fastest growing hotel companies in the world 300 250 200 150 100 FAST TRACK GROWTH FRESH & DYNAMIC MULTI-BRAND PORTFOLIO BRAND SEGMENT HOTELS ROOMS Upscale
Forward-Looking Statements
 LOGOf 1 Forward-Looking Statements Statements in this presentation that are not reported financial results or other historical information are forward-looking statements within the meaning of the Private
Fourth Quarter and Full Year 2009
 Investor and analyst meeting: Fourth Quarter and Full Year 29 25 th February 21 2 The views expressed here contain some information derived from publicly available sources that have not been independently
Results 1 st Quarter 2004
 Grupo Posadas, s, S.A. de C.V. & Subsidiaries April 30 th, 2004 Results 1 st Quarter 2004 Consolidated revenue decreased 1.3%. Revenew and Conectum progress is on track in order to improve the profitability
2007/08 Full Year Results Investor Briefing
 2007/08 Full Year Results Investor Briefing Highlights of Result Profit before tax up 46% to $1,408 million Up 36% on the reported result Margin improvement $3 billion of Sustainable Future Benefits achieved
Driving global growth
 Holiday Inn, Manhattan Financial District Driving global growth Paul Edgecliffe Johnson Group CFO IHG has a consistently executed, winning strategy for high quality growth Value creation: superior shareholder
INVESTOR PRESENTATION SECOND QUARTER 2017 RESULTS
 INVESTOR PRESENTATION SECOND QUARTER 2017 RESULTS This presentation may contain forward-looking information and statements. Forward-looking statements are statements that are not historical facts. These
Management Presentation. March 2016
 Management Presentation March 2016 Forward looking statements This presentation as well as oral statements made by officers or directors of Allegiant Travel Company, its advisors and affiliates (collectively
SET Opportunity Day #3/2011
 SET Opportunity Day #3/2011 2Q11 & 1H11 Performance & Outlook 18 August 2011 The views expressed here contain some information derived from publicly available sources that have not been independently verified.
Operative & Financial Results: FIESTA INN HOTELES BUSINESS CLASS
 Operative & Fincial Results: F o u r t h Q u a r t e r 2 0 1 4 FIESTA INN HOTELES BUSINESS CLASS Grupo Posadas, S.A.B. de C.V. & Subsidiaries Mexico City, February 26, 2015 Information presented with respect
Operative & Financial Results:
 Operative & Financial Results: F i r s t Q u a r t e r 2 0 1 4 Grupo Posadas, S.A.B. de C.V. & Subsidiaries Mexico City April 29, 2014 Information presented with respect to the same quarter of last year
MGM Resorts International Reports Second Quarter Financial Results
 NEWS RELEASE MGM Resorts International Reports Second Quarter Financial Results 8/5/2014 Consolidated Adjusted EBITDA Increased 8%, Led By 10% Growth In Wholly Owned Domestic Resorts MGM China Declares
Forward-Looking Statements Statements in this presentation that are not historical facts are "forward-looking" statements and "safe harbor
 2017 Annual Meeting of Shareholders Presentation May 2017 Forward-Looking Statements Statements in this presentation that are not historical facts are "forward-looking" statements and "safe harbor statements"
Investor Presentation
 Investor Presentation ICR XChange January 17, 2008 Forward-Looking Statements Some of the statements in this presentation constitute forward-looking statements. Forward-looking statements relate to expectations,
Preliminary Figures FY 2016
 February 14, 2017 Preliminary Figures FY 2016 Capital Markets Day 2017 Tom Blades (CEO) Disclaimer This presentation has been produced for support of oral information purposes only and contains forwardlooking
Results 2Q17. August 9, 2017
 Results 2Q17 August 9, 2017 2Q17 Highlights Indicators 2Q17 Var. x 2Q16 ASK (BN) 10.4-3.0% Traffic (000) 7,261-1.3% RPK (BN) 8.1 +0.5% Load Factor 77.9% +2.7 p.p. Yield (R$ cents) 23.2 +4.8% Pax Revenue
Great Portland Estates Trading Update Strong Operational Performance
 Press Release 6 July 2017 Great Portland Estates Trading Update Strong Operational Performance Great Portland Estates plc ( GPE ) today publishes its trading update for the quarter to 30 June 2017. Continued
INVESTOR PRESENTATION FOURTH QUARTER 2017 RESULTS
 INVESTOR PRESENTATION FOURTH QUARTER 2017 RESULTS This presentation may contain forward-looking information and statements. Forward-looking statements are statements that are not historical facts. These
Operational and Financial Results:
 Operatiol and Fincial Results: T h i r d Q u a r t e r 2 0 1 2 Grupo Posadas, S.A.B. de C.V. & Subsidiaries Mexico City, October 26, 2012 Information presented with respect to the same quarter of last
GAMING INVESTMENT FORUM AT G2E. September 26, 2016
 GAMING INVESTMENT FORUM AT G2E September 26, 2016 Dan D Arrigo EVP & Chief Financial Officer MGM Resorts International MGM RESORTS INTERNATIONAL Strong Domestic Operating Results Las Vegas Trends Maximizing
Operative & Financial Results:
 Operative & Fincial Results: S e c o n d Q u a r t e r 2 0 1 4 Grupo Posadas, S.A.B. de C.V. & Subsidiaries Mexico City, July 28, 2014 Information presented with respect to the same quarter of last year
Management Presentation. May 2013
 Management Presentation May 2013 Forward looking statements This presentation as well as oral statements made by officers or directors of Allegiant Travel Company, its advisors and affiliates (collectively
China Lodging Group (HTHT.US) Investor Presentation March 2016
 Investor Presentation March 2016") China Lodging Group (HTHT.US) Investor Presentation March 2016 Agenda Our Vision Who We Are Company Highlights Strategic Focus Operational and Financial Review Q & A 1 Our Vision We will build a world-class,
China Lodging Group (HTHT.US) Investor Presentation March 2016 Agenda Our Vision Who We Are Company Highlights Strategic Focus Operational and Financial Review Q & A 1 Our Vision We will build a world-class,
HOTEL reports 28% and 21% growth in Total Revenues and EBITDA respectively for 2Q18
 Mexico City, July 19 th, 2018 Grupo Hotelero Santa Fe S.A.B. de C.V. (BMV: HOTEL) ( HOTEL or the Company ), announced its consolidated results for the second quarter ( 2Q18 ) ended June 30 th, 2018. Figures
MARRIOTT INTERNATIONAL, INC. PRESS RELEASE SCHEDULES QUARTER 4, 2016 TABLE OF CONTENTS
 PRESS RELEASE SCHEDULES QUARTER 4, 06 TABLE OF CONTENTS Consolidated Statements of Income - As Reported A- Consolidated Statements of Income - Fourth Quarter Adjusted 06 Compared to Combined 05 A-3 Consolidated
Fibra Uno Announces rental revenues of Ps million in 2Q12
 Fibra Uno Announces rental revenues of Ps. 364.8 million in 2Q12 Mexico City, Mexico, July 23, 2012 Deutsche Bank México, S.A., Institución de Banca Múltiple, División Fiduciaria F/1401 ( Fibra Uno or
ERW. 022/ ACC003/ th February Subject: Management's Discussion and Analysis period ending 31 st December 2012
 ERW. 022/ ACC003/56 26 th February 2013 Subject: Management's Discussion and Analysis period ending 31 st December 2012 Attention: The President, The Stock Exchange of Thailand Dear Sir, The Erawan Group
SERVICIOS CORPORATIVOS JAVER, S.A.B. DE C.V.
 BOLSA MEXICANA DE VALORES, S.A.B. DE C.V., INFORMA: CLAVE DE COTIZACIÓN RAZÓN SOCIAL LUGAR JAVER SERVICIOS CORPORATIVOS JAVER, S.A.B. DE C.V. Monterrey, Nuevo León ASUNTO JAVER REPORTS ITS RESULTS FOR
Quarterly Meeting# 4/2018
 Quarterly Meeting# 4/2018 3Q18 & 9M18 Performance & Outlook 14 November 2018 1 2016 ERAWAN. All rights reserved. The views expressed here contain some information derived from publicly available sources
CLSA Asia Investor Forum. January, 2008
 CLSA Asia Investor Forum January, 2008 Forward Looking Statements This presentation contains forward-looking statements regarding operating trends, future results of operations and the completion of new
Regional Economic Report April June 2012
 Regional Economic Report April June 2012 September 13, 2012 Outline I. Introduction II. Results April - June 2012 A. Economic Activity B. Inflation C. Economic Outlook III. Final Considerations Introduction
Aloft - Element. By Marriott & starwood Hotel. SeaWorld Orlando, Florida
 Aloft - Element By Marriott & starwood Hotel SeaWorld Orlando, Florida CONFIDENTIALITY AND DISCLAIMER The potential investments identified herein, if available, would be available only to an accredited
Marriott International Reports Third Quarter 2016 Results
 November 7, 2016 Marriott International Reports Third 2016 Results BETHESDA, Md., Nov. 7, 2016 /PRNewswire/ -- HIGHLIGHTS Marriott International's acquisition of Starwood Hotels & Resorts Worldwide closed
Quarterly Meeting# 1/2018
 Quarterly Meeting# 1/2018 4Q17 & FY17 Performance & Outlook 2 March 2018 1 2016 ERAWAN. All rights reserved. The views expressed here contain some information derived from publicly available sources that
MGM GROWTH PROPERTIES LLC Second Quarter 2016 Earnings Presentation
 MGM GROWTH PROPERTIES LLC Second Quarter 06 Earnings Presentation August 4, 06 Forward-Looking Statements Statements in this presentation that are not historical facts are "forward-looking" statements
HOTEL INDUSTRY OVERVIEW. Texas
 HOTEL INDUSTRY OVERVIEW Texas DEMAND GROWTH STRONG BALANCED OCC & ADR GROWTH % Change Room Supply* 149M 1.3% Room Demand* 92M 5.6% Occupancy 61.6% 4.3% A.D.R. $90 4.4% RevPAR $55 8.9% Room Revenue* $8.3B
Grupo Posadas, S.A.B. de C.V. & Subsidiaries Mexico City, October 23, 2014
 Operative & Fincial Results: Third Quarter 2014 Grupo Posadas, S.A.B. de C.V. & Subsidiaries Mexico City, October 23, 2014 Information presented with respect to the same quarter of last year under IFRS
Air China Limited Annual Results. March Under IFRS
 Air China Limited 21 Annual Results Under IFRS March 211 Agenda Part 1 Highlights Part 2 Business Overview Part 3 Financial Overview Part 4 Outlook 2 Part 1 Highlights Steady Economic Growth; Asia Pacific
Grupo Hotelero Santa Fe Reports Increase of 37% in Total Revenue and 49% EBITDA for 3Q15
 Grupo Hotelero Santa Fe Reports Increase of 37% in Total Revenue and 49% EBITDA for 3Q15 Mexico City, October 22, 2015 Grupo Hotelero Santa Fe S.A.B. de C.V. (BMV: HOTEL) ( HOTEL or the Company ), announced
Cebu Air, Inc. 4 th Quarter and Full Year 2017 Results of Operations. cebupacificair.com
 Cebu Air, Inc. 4 th Quarter and Full Year 2017 Results of Operations cebupacificair.com Disclaimer The information provided in this presentation is provided only for your reference. Such information has
The Property Franchise Group
 The Property Franchise Group Capital Markets Event 22 October 2015 This afternoon s agenda 2 15:15 Welcome Richard Martin, Chairman 15:20 Introduction to MartinCo PLC Ian Wilson, Chief Executive Officer
INVESTOR PRESENTATION. Imperial Capital Global Opportunities Conference September 2015
 INVESTOR PRESENTATION Imperial Capital Global Opportunities Conference September 2015 Forward-looking Statements This presentation contains forward-looking statements within the meaning of the Private
Parques Reunidos Corporate Presentation March 2016
 Parques Reunidos Corporate Presentation March 216 Disclaimer The information contained in this presentation (the Presentation ), including but not limited to forward-looking statements, is provided as
GALAXY ENTERTAINMENT GROUP
 GALAXY ENTERTAINMENT GROUP RECORD HALF YEAR GROUP ADJUSTED EBITDA OF $5.8 BILLION, UP 23% YEAR-ON-YEAR NET PROFIT ATTRIBUTABLE TO SHAREHOLDERS GREW 35% TO $4.6 BILLION FURTHER STRENGTHENED LIQUID BALANCE
Talaat Moustafa Group Holding 1Q08 Results Earnings Release
 Talaat Moustafa Group Holding Results Earnings Release Cairo, April 13 th 08 Talaat Moustafa Group Holding ( TMG Holding ) the leading Egyptian community real estate developer with over years of experience,
MARRIOTT INTERNATIONAL 2017 SECURITY ANALYST MEETING. March 21, 2017
 MARRIOTT INTERNATIONAL 2017 SECURITY ANALYST MEETING March 21, 2017 FORWARD LOOKING STATEMENTS, NON GAAP FINANCIAL MEASURES, AND INFORMATION FOR 2016 AND 2015 This material contains forward looking statements
Grupo Hotelero Santa Fe Reports Increase of 33% in Total Revenue and 51% EBITDA for 2015
 Grupo Hotelero Santa Fe Reports Increase of 33% in Total Revenue and 51% EBITDA for 2015 Mexico City, February 25, 2016 Grupo Hotelero Santa Fe S.A.B. de C.V. (BMV: HOTEL) ( HOTEL or the Company ), announced
Montie Brewer, President and CEO Joshua Koshy, Executive VP and CFO UBS Transport Conference
 Montie Brewer, President and CEO Joshua Koshy, Executive VP and CFO UBS Transport Conference 1 London, England September 17, 2007 Agenda Strongly positioned international airline Investment proposition
OPERATING AND FINANCIAL HIGHLIGHTS
 Copa Holdings Reports Financial Results for the Fourth Quarter of 2015 Excluding special items, adjusted net income came in at $31.7 million, or EPS of $0.73 per share Panama City, Panama --- February
Thank you for participating in the financial results for fiscal 2014.
 Thank you for participating in the financial results for fiscal 2014. ANA HOLDINGS strongly believes that safety is the most important principle of our air transportation business. The expansion of slots
Fourth Quarter 2015 Financial Results
 Fourth Quarter 2015 Financial Results AerCap Holdings N.V. February 23, 2016 Disclaimer Incl. Forward Looking Statements & Safe Harbor This presentation contains certain statements, estimates and forecasts
OPERATING AND FINANCIAL HIGHLIGHTS. Subsequent Events
 Copa Holdings Reports Financial Results for the First Quarter of 2016 Excluding special items, adjusted net income came in at US$69.9 million, or EPS of US$1.66 per share Panama City, Panama --- May 5,
WH Smith PLC Acquisition of InMotion providing access to the world s largest travel retail market 30 October 2018
 WH Smith PLC Acquisition of InMotion providing access to the world s largest travel retail market 30 October 2018 Transaction highlights WH Smith announces acquisition of InMotion for $198m ( 155 million)
Lodging Industry Overview. 14 December Bobby Bowers Smith Travel Research / STR Global
 Lodging Industry Overview 14 December 2011 Bobby Bowers Smith Travel Research / STR Global Global / U.S. Overview Key U.S. Markets Construction Pipeline Forecast Takeaways Today s Agenda RevPar Growth
Management Presentation. November 2011
 Management Presentation November 2011 Forward looking statements This presentation as well as oral statements made by officers or directors of Allegiant Travel Company, its advisors and affiliates (collectively
1Q Revenues Gross Profit. EBITDA Gross Margin 9. 0% 9.3% EBITDA Margin. Mexico City, HIGHLIGHTS. to the 1Q % and. each.
 Grupo Sanborns S.A.B. de C.V. Earnings Report 1Q 2017 Mexico City, April 27 2017 Grupo Sanborns, S.A.B. de C.V. (BMV: GSANBOR OTC: GSAOY) announced today its results for the first quarterr of 2017. HIGHLIGHTS
Management Presentation. August 2012
 Management Presentation August 2012 Forward looking statements This presentation as well as oral statements made by officers or directors of Allegiant Travel Company, its advisors and affiliates (collectively
Management Presentation. November 2018
 Management Presentation November 2018 Forward looking statements This presentation as well as oral statements made by officers or directors of Allegiant Travel Company, its advisors and affiliates (collectively
OPERATING AND FINANCIAL HIGHLIGHTS SUBSEQUENT EVENTS
 Copa Holdings Reports Financial Results for the Third Quarter of 2016 Excluding special items, adjusted net income came in at $55.3 million, or adjusted EPS of $1.30 per share Panama City, Panama --- November