HMI Inc. COMPREHENSIVE MARKET STUDY REPORT MARSHFIELD, WISCONSIN NOVEMBER, Prepared Exclusively For: City of Marshfield, Wisconsin.
|
|
|
- Loreen Thornton
- 5 years ago
- Views:
Transcription

1 HMI Inc. COMPREHENSIVE MARKET STUDY REPORT MARSHFIELD, WISCONSIN NOVEMBER, 2014 Management Research Marketing Gregory R. Hanis, ISHC President Member of Prepared Exclusively For: City of Marshfield, Wisconsin Prepared By: Hospitality Marketers International, Inc. Professionally Serving the United States & Canada for Over 32 Years with Offices in Milwaukee, Wisconsin and Fort Myers, Florida Gregory R. Hanis, ISHC President Michael R. Hool, CPA, ISHC President, SHR An HMI Network Representative 5415 S. Majors Drive New Berlin, WI Majestic Avenue Fort Myers, FL Fax: Hotel Service Network
2 TABLE OF CONTENTS Marshfield, Wisconsin Introduction/Objective General Market Description -Geographic Location -General Market Characteristics -Exhibits Site Analysis General Site Overview -Land Preparation -Visibility -Accessibility -Support Services -Environmental Issues -Competitive Position Economic Overview General Demographic and Economic Characteristics -2-Mile Radius -5-Mile Radius -12-Mile Radius -Population and Number of Households Overall Observations -Household and Per Capita Income Overall Observations -Workforce Characteristics -Unemployment Rates -Labor Supply and Wages -Transportation -Highway Traffic -Air Service -Economic Conclusions 1
3 Lodging Demand Market Segmentation -Market Segmentation Profiles -Overall Market Characteristics -Social/Leisure Profiles -Corporate/Commercial Profiles -Other Lodging Demand Profiles -Seasonality of Lodging Demand -Lodging Demand Potential Index -Site Area 4 -Site Area 3 -Rate Sensitivity Factor Analysis -Feeder Markets -Unaccommodated Lodging Demand Lodging Supply Projected Occupancy and Average Daily Rate -Rate Positioning -Competitive Factor Analysis -Competitive Set Lodging Performance -Lodging Demand Growth -Lodging Supply Growth -Occupancy -Average Daily Room Rates -Revenue Per Available Room (RevPAR) Issues and Risks Competitive Pricing Pressures -Growth in Lodging Demand -Growth in Lodging Supply -Property Taxes -Political Climate -Environmental Concerns -Zoning and Architectural Concerns -Labor Market, Supply and Wages -Area of Franchise Protection 2
4 Conclusions Projected Property Performance 42 Rooms -Occupancy -Average Daily Room Rate -Projected Room Revenue -Property Recommendations -Property Type -Property Size -Property Amenities -Sleeping Room Configuration -Brand Affiliation -Rate Strategy -Opening Date 3
5 EXHIBITS EXHIBIT 1 - EXHIBIT 2 - EXHIBIT 3 - EXHIBIT 4 - EXHIBIT 5 - EXHIBIT 6 - Geographic Relationship of the Subject Market to the Central United States Geographic Relationship of the Subject Market to Greater Central Wisconsin Including the Neighboring States of Minnesota, Michigan, Illinois, Iowa and the Province of Ontario, Canada Geographic Relationship of the Subject Market Area to Greater Central Wisconsin and the Location of One Member of the Competitive Set of Hotels, as well as Other Lodging Demand Generators in the Market Area Location of the Members of the Primary Competitive Set of Hotels Location in Marshfield and their Geographic Relationship to the Medical Complex Location of the Four Subject Site Areas as well as the Location of Major Employers Located Right in Marshfield Claritas Economic Radii Analyzed in this Report 4
6
7 2
8 3
9 4
10 5
11 6
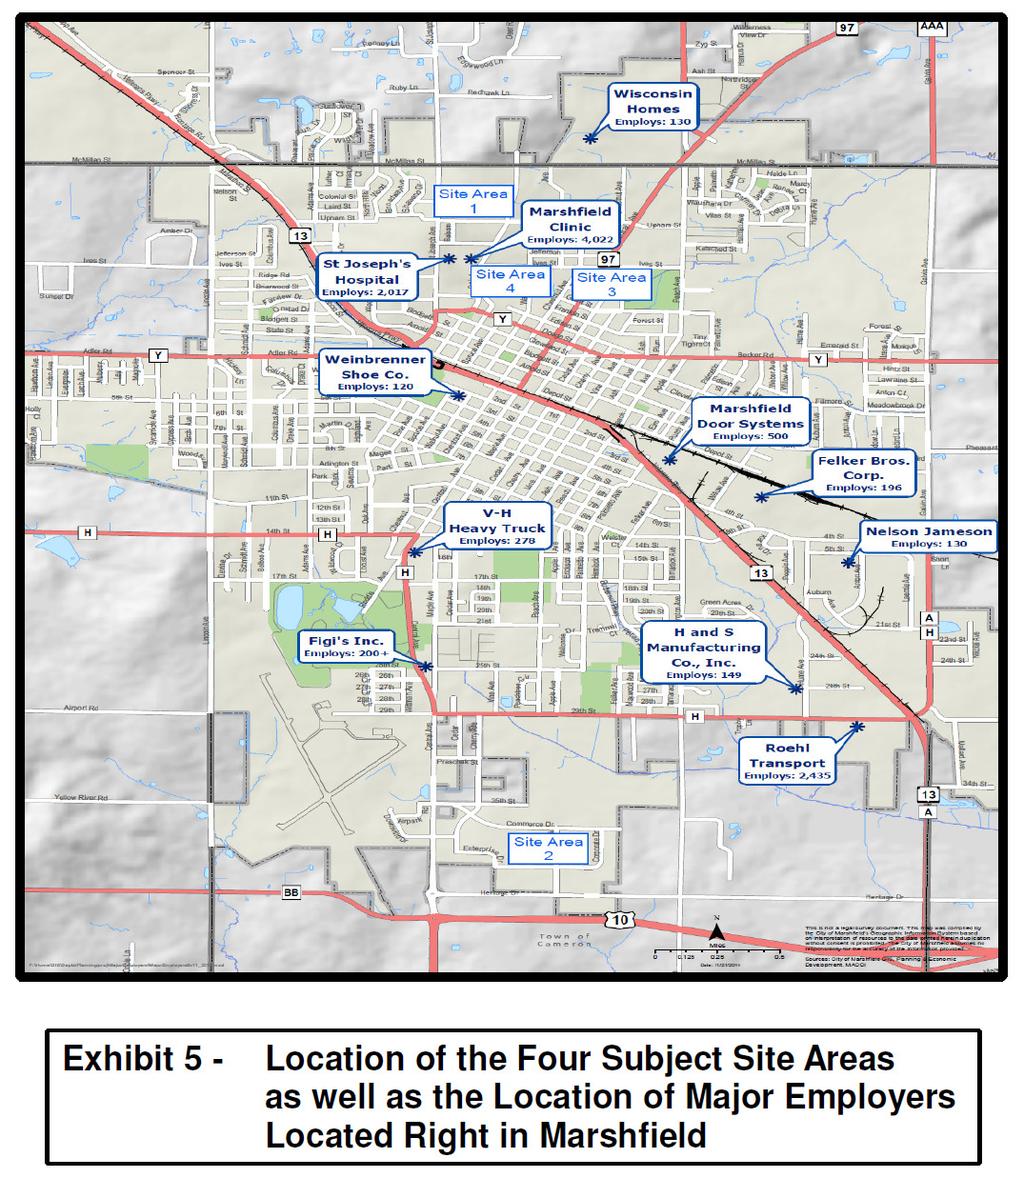
12 INTRODUCTION/OBJECTIVE Hospitality Marketers International, Inc., (HMI) has been engaged to provide this Comprehensive Hotel Market Study to determine the amount of support/demand there is in the greater Marshfield, Wisconsin market area for the development of a new limited-service style hotel. HMI has been engaged by Mr. Jason Angell, the Director of Planning & Economic Development for the City of Marshfield, to perform this market research. This report is the exclusive property of the City of Marshfield. Four general subject site areas for the proposed hotel were identified during the field research phase of this report. They will be reviewed on an individual site basis in the Site Analysis section of this report. Their locations are indicated in Exhibit 5 of this report. The research included in this report will support the Conclusions recommended regarding the style and size of the proposed hotel. This Comprehensive Market Study provides information concerning the greater Marshfield market, including potentially parts of Marathon and Wood Counties in Wisconsin, and the market factors that would affect the possible development of this proposed limited-service style hotel. The focus of this report is on the amount of support/demand for developing a limitedservice style hotel in the subject market. Discussions with Mr. Angell indicated that no specific brand, size or price category have been identified at this time. This report provides information regarding the subject market s ability to support a proposed limited-service style hotel as well as recommendations for its price category, franchise branding, and the suggested number of rooms. HMI conducted comprehensive field research to determine the relationship between the subject market and the proposed hotel s Lodging Supply competitors and Lodging Demand generators. Economic indicators were reviewed to determine the stability and future growth of the general subject market area. Multiple years of Occupancy, Average Daily Room Rate, and Sales Revenue projections for the proposed hotel were based upon a detailed review of the field research data. Facility recommendations as to product type, size, brand affiliation (if any), and amenities were based upon the Lodging Demand research for the proposed hotel. The research that was conducted included a macro- and micro-market analysis of the greater Marshfield market as well as potentially parts of Marathon and Wood Counties to determine the viability of this market to support the proposed hotel. If, at any time, there are questions regarding this research, or if this report needs to provide specific information regarding this hotel development, HMI will be available to address the required information. Mr. Jason Angell has engaged HMI to perform this Comprehensive Hotel Market Study. This report is the property of the City of Marshfield and any distribution, use or any other application of the Comprehensive Hotel Market Study must have its prior approval.
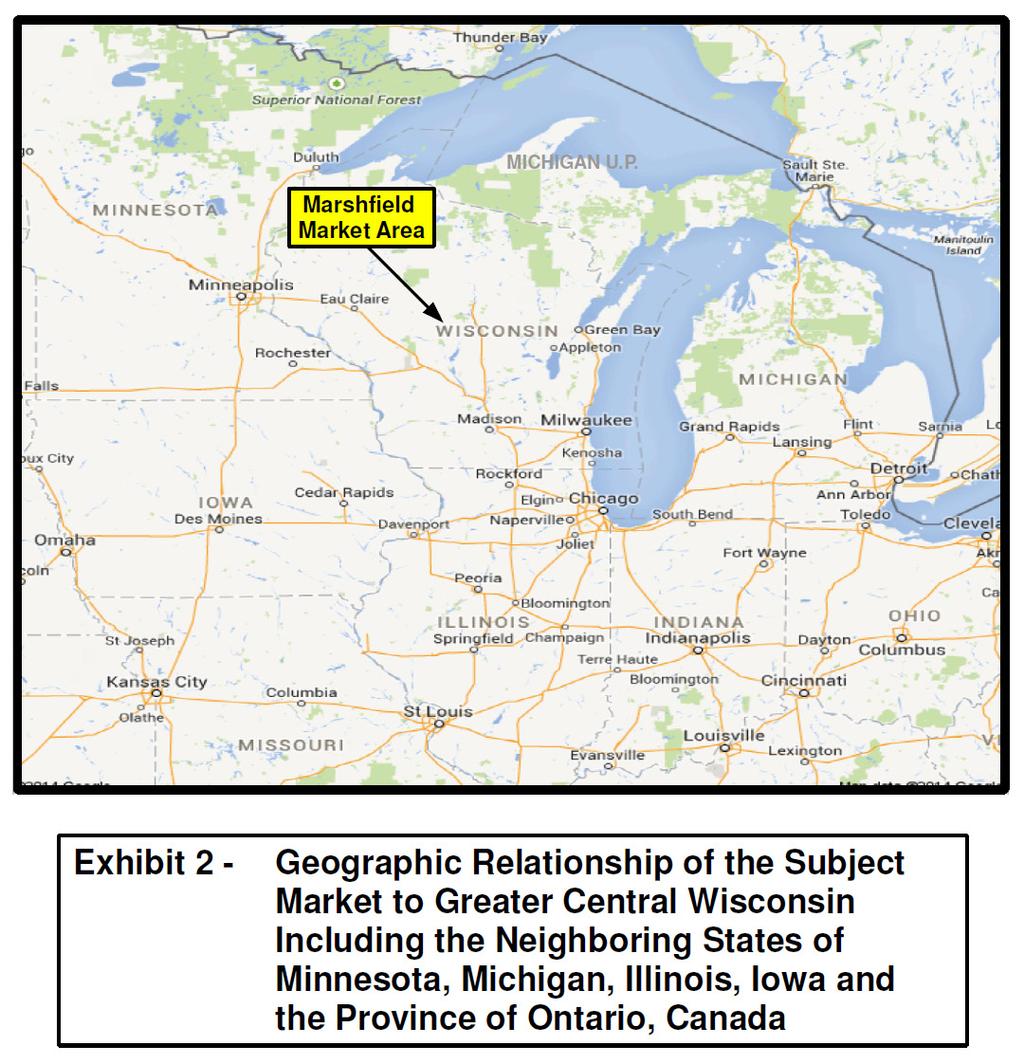
13 GENERAL MARKET DESCRIPTION The subject market being reviewed, to determine the level of support/demand for additional lodging supply, currently anticipated to be for a mid-scale to upper midscale, limited-service style hotel, is the greater Marshfield, Wisconsin market area. This is located in both Wood and Marathon Counties in central Wisconsin. Marshfield is primarily located in the northwest corner of Wood County right on the border with Marathon County, with a small portion of it situated in Marathon county. It is located approximately thirty-five miles northwest of Stevens Point and forty miles southwest of Wausau. Additional information describing this subject market area follows: GEOGRAPHIC LOCATION Marshfield is centrally situated in the State of Wisconsin. This is supported by Marshfield s location just seventeen miles north of Pittsville, Wisconsin where there is a plaque designating the center of the state. It is located approximately 190 miles northwest of Milwaukee, Wisconsin; approximately 125 miles west of Green Bay, Wisconsin and approximately 170 miles east of Minneapolis, Minnesota. See Exhibit 2 of this report for details. Marshfield is located at the intersection of WI Routes 13 & 97 with US Route 10. WI Routes 13 and 97 run north/south through the market area connecting to Bayfield to the north and Wisconsin Rapids and Wisconsin Dells to the South. US Route 10 traverses the market area east/west, connecting to I-39, Stevens Point and Appleton to the east and west to I-94 at Osseo and then on to St. Paul, Minnesota. See Exhibits 2 and 3 of this report for further details regarding the subject market s location. The closest airport with limited regularly scheduled passenger service is the Central Wisconsin Airport located in Mosinee, approximately thirty-two miles northeast of Marshfield. The next closest airports with a wider choice of scheduled passenger service are in Madison, approximately 140 miles south, and then either the Milwaukee or Minneapolis/St. Paul airports. Additional closer regional airports are located in Appleton and Green Bay. See Exhibit 2 and 3 of this report for further details regarding the subject market s location. 2
14 GENERAL MARKET CHARACTERISTICS Marshfield has received several accolades over the past few years including being ranked 14 th in America, 3 rd in the Midwest and 1 st in Wisconsin as best cities to live in. Marshfield was also ranked as the 8 th best Dream City in America. Bizjournals.com ranked Marshfield as Best Place to Live in Wisconsin and Eighth Best Place to Live in America. These accolades were earned based on factors including excellent health care, schools, supply of jobs, small town character, vitality and low cost of living. In the 2010 Census, the City of Marshfield had a reported population of 19,118, an increase of 1.70% from the 2000 Census number of 18,800. When comparing the 2014 projected population for a five-mile radius of downtown Marshfield including some farm land in both Wood and Marathon Counties to the 2000 population of 24,243 indicates a negligible decrease of (53) or (0.2%) over the fourteen year period. The 2010 Census reported that the population to be 94.8% Caucasian, 2.3% Asian, 0.7% African American and 2.2% Other. Discussions indicate that the population in Marshfield is aging. This was confirmed by 2010 Census data indicated 31.2% of the population in Marshfield was over 55 years, a 5.1% point increase or a 19.5% increase over the 2000 Census figure of 26.1% of the total population being over 55 years of age. Discussions with local officials indicated that the working population in the greater Marshfield market area are split between blue collar and white collar medical professionals, with this difference being greater within the city limits of Marshfield. This is evidenced by two of the major employers, both in healthcare, totaling 55.86% of the total employees of the top ten major employers. Also supporting this is that discussions indicated that the combined Marshfield Clinic and Ministry Saint Joseph s Hospital medical complex has regional, national and international notoriety for the quality and specialty of their healthcare expertise. 3
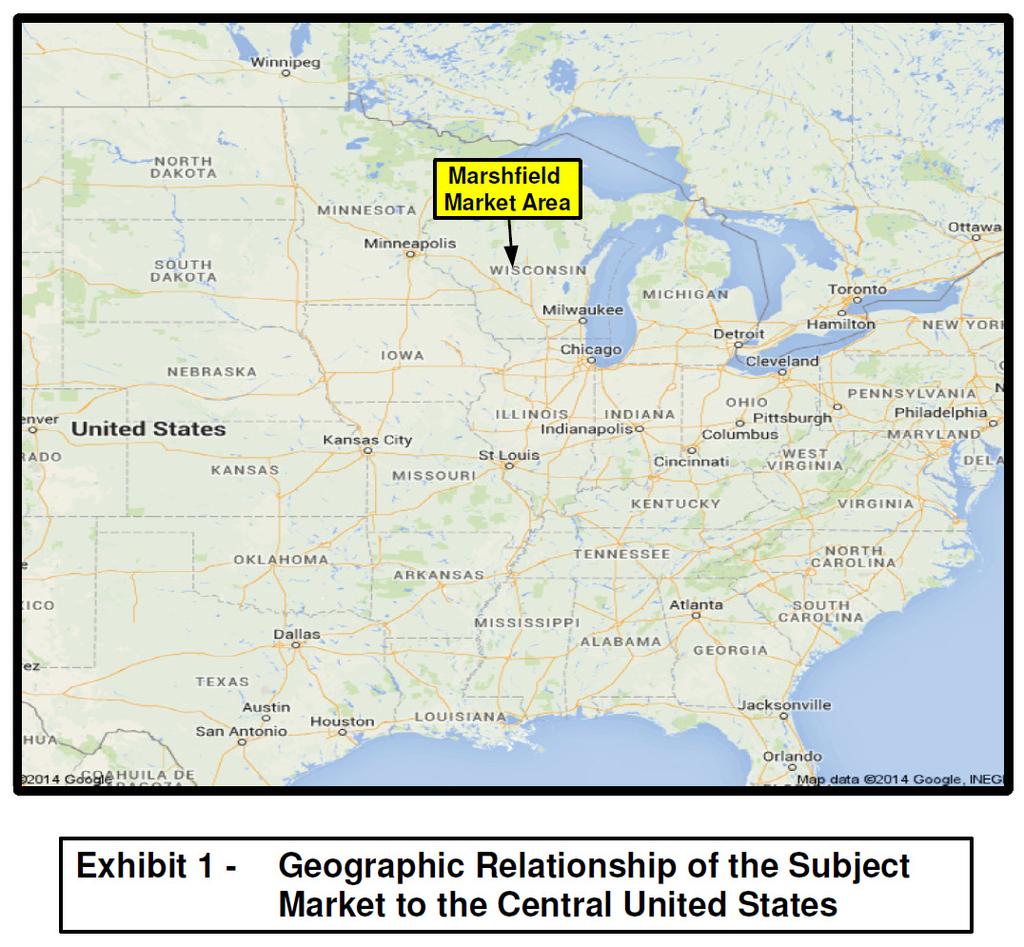
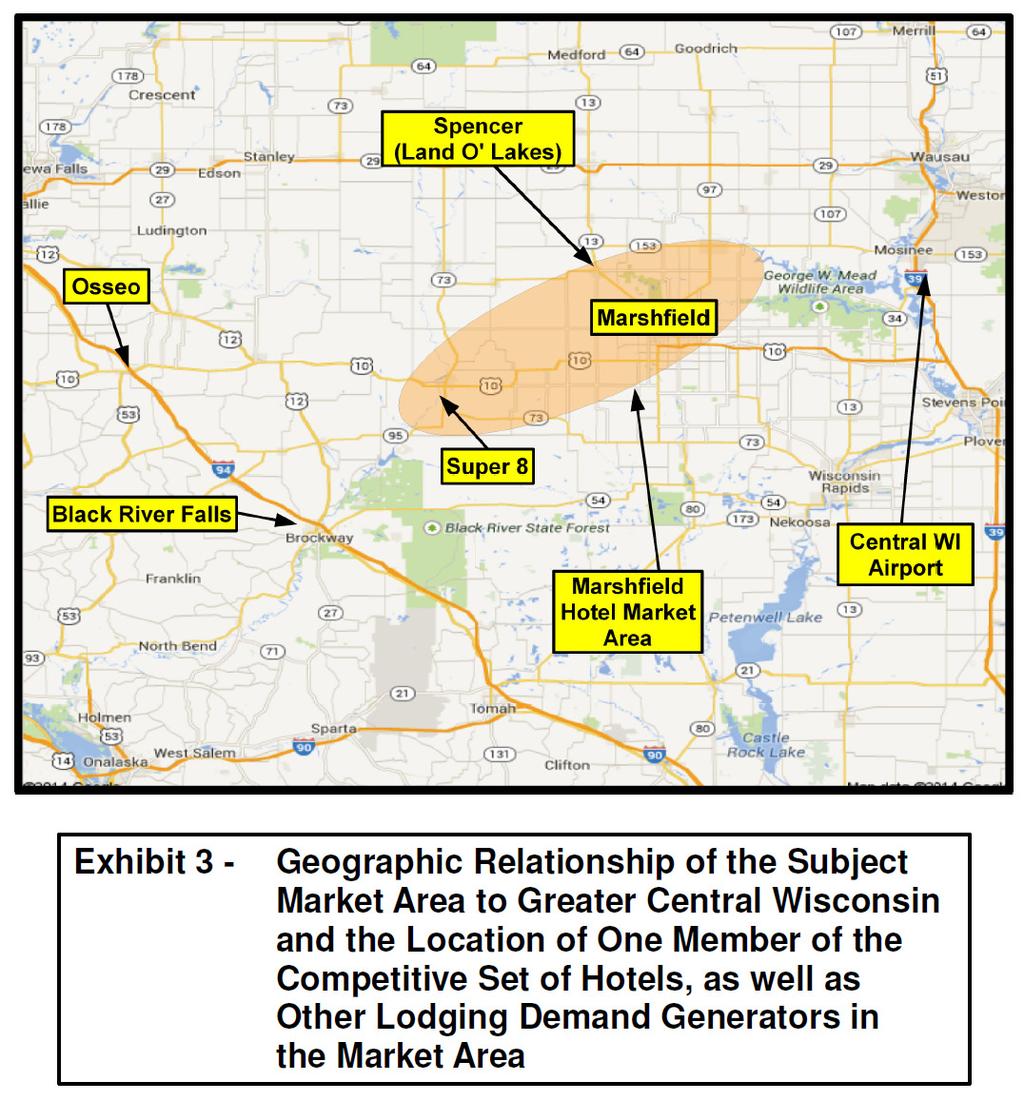
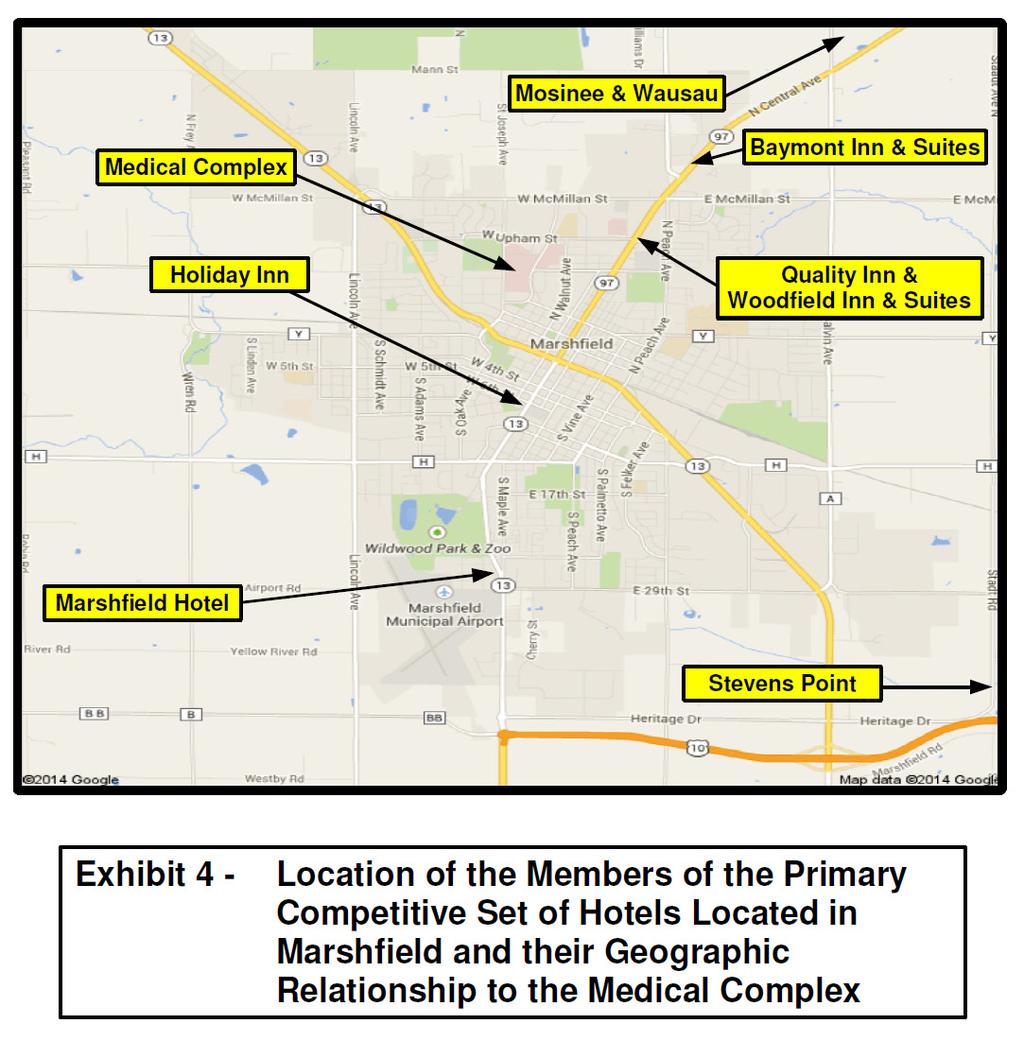
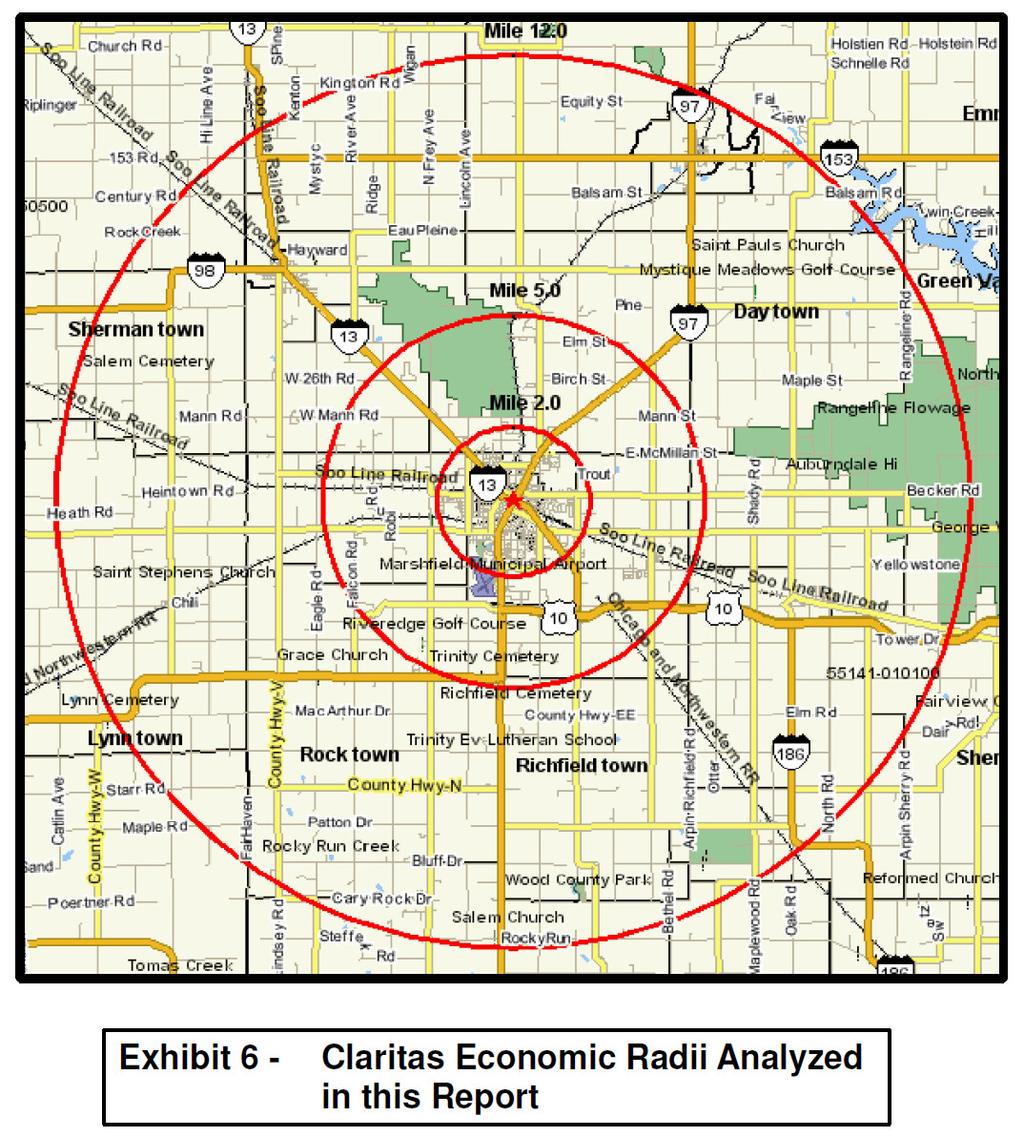
15 EXHIBITS The following exhibits describe the geographic location of the subject market and subject site. Exhibit 1 of this report shows the geographic relationship of the subject market to the central United States. Exhibit 2 of this report shows the geographic relationship of the subject market to greater central Wisconsin. Also included are the neighboring states of Minnesota, Michigan, Illinois, Iowa and the province of Ontario, Canada. Exhibit 3 of this report shows the geographic relationship of the Marshfield market area to central Wisconsin and the location of one member of the competitive set of hotels, as well as other Lodging Demand generators in this market area. Exhibit 4 of this report shows the location of the members of the Primary Competitive Set of Hotels located in Marshfield and their geographic relationship to the medical complex. Exhibit 5 of this report presents the location of the four subject site areas as well as the location of major employers located right in Marshfield. Exhibit 6 shows the Claritas economic radii analyzed in this report. 4
16 SITE ANALYSIS This section of the report highlights the geographic location of the four different site areas that were identified during the field research as being considered for a potential hotel development. They are as follows in so specific order of preference: Site Area 1 is located on the north side of Upham Street approximately across from the Marshfield Clinic Lot B. Site Area 2 is located on the south side of Marshfield between Old Highway 10 or Heritage Drive and the four-lane US Route 10 east of Central Avenue South. This area is located immediately south of the Mill Creek Business Park. Site Area 3 is located on the east side of Central Avenue north in the southeast quadrant of the intersection of Central Avenue North and Ives Street. Site Area 4 is comprised of two separate sites that are adjacent to each other. They are located along Ives Street on the north side and on the south side across from each other and both in close proximity to the Marshfield Clinic East Wing. See Exhibit 5 of this report for further details regarding the location of the subject site areas. GENERAL SITE OVERVIEW A general review of the four subject site areas revealed: Site Area 1: A physical inspection revealed approximately seven homes located on it right along the north side of Upham Street and then there is farm land behind the homes moving north away from Upham Street. Site Area 2: A physical inspection indicated that this area is vacant cleared land and basically flat. It is just south of the Mill Creek Business Park which discussions estimated to be 50% full. Site Area 3: A physical inspection revealed that the site is a vacant L shaped lot that previously had an apartment building located on it. It is situated between the existing Burger King on the corner of Ives Street and Central Avenue and an under-construction Dunkin Donuts. Site Area 4: A physical inspection indicated that this is the closest site area to the Marshfield Clinic. Also, it is located in a residential area with several homes located in it. Its proximity to the Marshfield Clinic East Wing would enable it to be connected via a skywalk. 5
17 LAND PREPARATION A review of the Land at the four subject site areas revealed: Site Area 1: The land in this site area includes significant sloping downward from west to east and north to south resulting in the need for grading to level at least a section of it. Also, if the hotel development is located right on Upham Street, this would result in the need to acquire/demolish some of the homes located along it. Site Area 2: The land in this site area is basically flat, requiring minimal grading. There did not appear to be any buildings located in this site area that would require removal. Site Area 3: : The land in this site area was basically flat close to Central Avenue, however, there is a significant downward sloping in the back half (east side) of the site area resulting in potential grading needs. There are trees and bushes in the back or eastern portion of this site that may require removal. There are power lines that run across the back half of the site that may need to be relocated or at least addressed depending on how a proposed hotel building would be situated. Also, it appears that there may have been a building, possibly an apartment building, removed from this site area. Site Area 4: There are multiple homes located here that will need to be removed. Depending on which side of Ives Street would be chosen here, the north side is relative flat with a slight downward slope from west to east while the south side of Ives has a significant drop off east of Pine Avenue. Also, there is an existing building in the area in the southeast quadrant of the intersection of Ives Street and Pine Avenue. Discussions with City of Marshfield officials indicated that all utilities, including municipal water, sewer, fire hydrants, storm sewers, sanitary sewers, gas, electric, telephone and Internet, are in place at all four of the subject site areas. This should be confirmed by the developer. 6
18 VISIBILITY A review of the Visibility of the four subject site areas revealed: Site Area 1: This site area will have no Visibility to travelers arriving from any of the main entrance routes, US 10 and WI 97, into the greater Marshfield market area until they have arrived at this location. This results in an overall Fair Visibility rating. It will be visible to certain portions of the overall medical complex. Site Area 2: This site area will have great Visibility to travelers arriving on US Route 10 from the west. Those travelers arriving to Marshfield from the east on US Route 10 and on other routes previously discussed will have no visibility to a hotel located in this site area until arriving in its immediate area. Those doing business in the adjacent Mill Creek Business Park will have great Visibility of a hotel located here. Overall, this site area has a Visibility rating of Very Good. Site Area 3: This site area will have excellent Visibility to travelers arriving from the north via WI Route 97 as well as to travelers on Central Avenue North, the primary four-lane retail artery in the Greater Marshfield market area. Travelers arriving on US 10 and WI 13 will have great Visibility once they turn north onto Central Avenue, approximately ten blocks south of this site area. Overall, this site area has a Visibility rating of Excellent. Site Area 4: This site area will have no Visibility to travelers arriving from any of the main entrance routes into the greater Marshfield market area until they have arrived at this location. However, visitors to the Marshfield Clinic and St. Joseph s Hospital medical complex will have great Visibility of it if they are on the southeast side of the complex. Travelers Central Avenue North may have some partial visibility of a proposed hotel located here depending on its precise location and design. A taller three- or four-story building would assist in enabling this to occur. Overall, this site area has a Visibility rating of Excellent. 7
19 ACCESSIBILITY A review of the Accessibility of the four subject site areas revealed: Site Area 1: Accessibility to this site area should be Good. It will be via Upham Street via Central Avenue North or WI Route 97, which then intersects with both US Route 10 and WI Route 13. Site Area 2: Accessibility to this site area should be Very Good. Those arriving via US Route 10, either from the east or the west, will have convenient access via the intersection of Central Avenue South with US Route 10 and via Old Highway 10. Site Area 3: Accessibility to this site area should be Excellent. Its location right on Central Avenue North, a four-lane commercial street with left turn lanes, will provide great access when arriving from any one of the major traffic routes previously discussed. Site Area 4: Accessibility to this site area should be Excellent. This site area is located right on Ives Street four blocks west of Central Avenue North. There are two potential sites within this site area and both should enable a convenient skywalk connection for a proposed hotel to the Marshfield Clinic East Wing building. This is the only site area that, from a practical standpoint, offers the ability to provide a skywalk connection between the medical complex and one of the proposed sites. SUPPORT SERVICES In the greater Marshfield market area, there is a variety of both retail and dining Support Services. They are primarily located along Central Avenue in the downtown area and along Central Avenue from 9 th Street and Central Avenue South to McMillan Street on Central Avenue North, a distance of approximately two miles. A review of these in relation to the four subject site areas revealed: Site Area 1: This site area is situated approximately six blocks or less than a mile west on Upham Street from the north end of this area on Central Avenue North, warranting a Good rating. Site Area 2: This site area is located on the south side of Marshfield, approximately two miles south of this area, warranting a Fair rating. Site Area 3: This site area is located right on Central Avenue North adjacent to a Burger King, McDonald s, Dunkin Donuts and the Marshfield Mall, warranting an Excellent rating. Site Area 4: This site area is just four blocks from the same location on North Central Avenue as Site Area 3, warranting a Very Good rating. 8
20 Additional retail and restaurants located along Central Avenue North include Target, Office Max, Pizza Hut, Festival Foods, Applebee s, Menards, Wal-Mart Super Center, Dunham s and a Sears Hometown Store. Recreational Support Services are numerous and will be discussed in detail later in this report, but briefly include trails for snowmobiling, hiking, biking and ATV s, golf and a zoo. Overall, when considering the greater overall Marshfield market area, the Support Services appear to be Very Good. ENVIRONMENTAL ISSUES Due to the existence of the homes or other buildings on Site Areas 1 and 4, which as previously discussed will need to be removed, as well as some areas being used as cultivated farm land (Site Area 2 and a portion of Site Area 1), there appear to be possible Environmental Issues at some of the subject sites. The removal of these structures and the environmental impact will need to be researched. Discussions with the city did not indicate that any site areas are considered to be in a flood zone. These environmental elements are not within the scope of this Comprehensive Hotel Market Study report. They are presented as an observation of the four subject site areas and should be verified by a developer as to their relevance at the specific subject site area. It is recommended that a developer have a professional, independent environmental review completed along with a soil integrity test and any other testing that may be required. COMPETITIVE POSITION A review of the Competitive Position of the four subject site areas revealed: Site Area 1: This site area was rated as Good due to a combination of its ratings in the prior categories when compared to the existing competitive hotels located in Marshfield on Central Avenue. Site Area 2: This site area was rated as Good due to a combination of its ratings in the prior categories when compared to the existing competitive hotels located in Marshfield on Central Avenue. 9
21 Site Area 3: This site area was rated as Very Good due to a combination of its ratings in the prior categories when compared to the existing competitive hotels located in Marshfield on Central Avenue and its location right on this same primary traffic route. Site Area 4: This site area was rated as Excellent due to a combination of its ratings in the prior categories when compared to the existing competitive hotels located in Marshfield on Central Avenue and it being the only site area that enables a skywalk connection to the medical complex. The following chart summarizes the subject site where the proposed mid-scale, limited-service hotel will be located. SUBJECT SITE EVALUATION RATING CATEGORY Site Area 1 Site Area 2 Site Area 3 Site Area 4 Visibility Fair Very Good Excellent Excellent Accessibility Good Very Good Excellent Excellent Land Prep Good Excellent Good Good Environmental Investigate Investigate Investigate Investigate Major Utilities Excellent Excellent Excellent Excellent Zoning Excellent Excellent Excellent Excellent Architectural Controls Excellent Excellent Excellent Excellent Area Support Services Good Fair Excellent Excellent Competitive Position Good Good Very Good Excellent Overall Good Good Very Good Very Good Source: HMI The above chart indicates Good and Very Good Overall ratings for the subject site areas. The Environmental sector is rated Investigate because it is beyond the scope of this report to evaluate the status of these issues. The Environmental sector includes water drainage/seepage, flood plain issues and any issues regarding the removal of the older existing buildings on the subject site. While discussions with city officials did not indicate any issues in these areas, a developer should confirm this. On a five-point scale, Site Area 1 earned a rating of 3.15, Site Area 2 earned a rating of 3.55 and both Site Areas 3 and 4 each earned ratings of Sections in the chart requiring further investigation by the developer are given a 2.5 out of 5 rating until additional specific information is known. More information regarding these areas could result in a potentially higher Overall rating. 10
22 ECONOMIC OVERVIEW This section of the report provides a composite analysis of the economic environment in which a proposed mid-priced, limited-service hotel would operate. It presents an overview of the economic stability of the subject market. This economic analysis does not conclusively determine how successful the proposed hotel will be in the greater Marshfield market area. However, it offers valuable insight into the economic stability and growth potential of the subject market. It will also directly affect the Conclusions formulated later in this report. The economic health of the subject market can be important to the success of the proposed hotel. PKF Hospitality estimates that 80% of a hotel s operating performance is strongly influenced by the local market conditions. (Hotel Management - July 15, PKF Budgeting for a Local Affair, So Understand Your Market article). Therefore, this section highlights several key components of the Marshfield market and the economic factors that drive this market. A proposed mid-priced, limited-service hotel will draw Lodging Demand primarily from the greater Marshfield area, including portions of surrounding Wood and Marathon Counties. This resulted in a review of certain data based on 2-, 5- and 12-mile radii as well as, in certain circumstances, all of Wood County. This section will assist in understanding the economic stability of this market. Historically, the economy in this subject market is very seasonal, with a greater amount of activity occurring during the summer months. There is evidence of limited diversification in the workforce in the City of Marshfield with one industry sector, Health & Social Assistance, comprising 44.7% of the workforce. However, five different industry sectors comprise 82.2% of the workforce. The workforce in the City of Marshfield decreased by (0.2%) from 2006 to 2011, while the workforce in the predominantly surrounding Wood County increased by 0.1% for the same period. The subject market s economy appears to be stable, recovering slowly from the US recession of with a slight improvement in unemployment through August, % compared to August, 2013 at 6.1%. The subject market s economic base reflects both positive and negative results. Data for the three previously discussed radii indicates that the City of Marshfield is apparently experiencing slight decreases in population, but annual increases in household size and per capita income. 11
23 The economic components found in the subject market are listed below. o o Corporate/Commercial and Social/Leisure Transportation in the subject market is sufficient: While one primary interstate highway, I-39, traverses the area north/south approximately twenty miles east of Marshfield as well as US Route 10 that traverses the market area east/west connecting to I-39 to the east and to I-94 a further distance to the west. Major industries include healthcare, transportation & warehousing, manufacturing and retail. Additionally, Marshfield is served by two major trucking firms. o o The subject market offers a number of outdoor activities including hunting, hiking, biking, snowmobiling and skiing. More of this economic impact will be described in the Lodging Demand section of this report along with details about these economic generators and additional Lodging Demand sources. o The Marshfield market area is seasonal with peak visitation in the summer when the weather is milder from vacationers/tourists as well as commercial/business visitors and patients and their families. These latter two market segments are available year-round. Also, there is some leisure business during the winter months due to the popularity of snowmobiling in the area. 12
24 GENERAL DEMOGRAPHIC and ECONOMIC CHARCTERISTICS The following charts highlight the General Demographics used to study the economic stability of the subject market. They include key Population demographics and Household Income characteristics of the subject market area. Radii of 2, 5 and 12 miles from the subject site were analyzed. The 2-mile radius provides information about the more immediate City of Marshfield area and the larger 5- and 12-mile radii include all of the greater Marshfield market area and then portions of Wood and Marathon Counties. This is the area that surrounds Marshfield without going into the nearby market areas of Wausau to the northeast, Wisconsin Rapids to the south and Stevens Point to the southeast. All three cities have a significant number of lodging facilities. See Exhibit 5 of this report for additional details regarding these radii. The information in the following charts was derived from the Nielsen/Claritas Household Trend 2014 Report. 2-Mile Radius The following chart lists the major economic demographics of the immediate market within a 2-mile radius of the downtown Marshfield. GENERAL MARKET DEMOGRAPHICS Marshfield, Wisconsin RADIUS: 2 Mile ANNUAL ANNUAL PERCENT PERCENT 2019 PERCENT PERCENT CENSUS ESTIMATE CHANGE CHANGE PROJECTION CHANGE CHANGE POPULATION 18,930 18, % 0.0% 18, % -0.1% HOUSEHOLDS 8,659 8, % 0.1% 8, % 0.2% AVERAGE HOUSEHOLD SIZE AVERAGE HOUSEHOLD INCOME $51,531 $57, % 0.8% $61, % 1.5% MEDIAN HOUSEHOLD INCOME $38,547 $42, % 0.7% $44, % 1.3% AVERAGE PER CAPITA INCOME $23,571 $26, % 1.0% $29, % 1.7% Source: Claritas The subject market in this 2-mile radius had a slight decrease in Population from 2000 to estimated This decrease was negligible when looking at it on an average annual rate of change basis. Population is expected to continue to decrease at (0.1%) per year through 2019, slightly greater from the historic annual rate of decrease, which may be representative of the aging population. 13
25 The number of Households increased from 2000 to the estimate in 2014 by an average annual growth rate of 0.1%. The rate of increase in the number of Households is projected to continue at a slightly improved rate over the historic annual rate through 2019 at an annual average rate of 0.2%. This is opposite the projected rate of decrease in population and may be supportive of the increase in the workforce discussed later in this report. This could indicate a younger, single population moving in that is increasing Households and is evidenced by smaller family size. The average Family Size is estimated at 2.16 people in 2014, down slightly from the 2000 Census at 2.19 people. This is projected to decrease slightly to 2.13 people in This decrease in family size could be an indication of an aging population in this market area or a younger population moving in. The Per Capita Income was estimated to have increased by an average annual rate of 1.0% from 2000 through This rate of growth is slightly higher than the growth rate for the 3.3% Average Household Income for the same period and slightly less than the growth rate of the Median Household Income for the same period at 4.5%. The estimated 2019 Per Capita Income is estimated to increase by an average annual rate of 3.7%. This compares to the estimated decreases of Average Household Income at (0.8%) and Median Household Income of (0.7%). The projected average annual future growth rates at 1.7%, 1.5% and 1.3%, respectively, are almost double the historic growth rates. 5-Mile Radius The following chart lists the major economic demographics of the subject market within a 5-mile radius, including all of Marshfield and a small portion of Wood and Marathon Counties surrounding Marshfield. GENERAL MARKET DEMOGRAPHICS Marshfield, Wisconsin RADIUS: 5 Miles ANNUAL ANNUAL PERCENT PERCENT 2019 PERCENT PERCENT CENSUS ESTIMATE CHANGE CHANGE PROJECTION CHANGE CHANGE POPULATION 24,243 24, % 0.0% 24, % 0.0% HOUSEHOLDS 10,676 10, % 0.1% 10, % 0.2% AVERAGE HOUSEHOLD SIZE AVERAGE HOUSEHOLD INCOME $53,834 $61, % 1.0% $66, % 1.6% MEDIAN HOUSEHOLD INCOME $40,995 $45, % 0.7% $48, % 1.4% AVERAGE PER CAPITA INCOME $23,707 $27, % 1.1% $29, % 1.8% Source: Claritas 14
26 The subject market in this 5-mile radius of downtown Marshfield has a very slight decrease in Population from 2000 to estimated 2014 that is similar to that seen in the 2-mile radius. Through 2019, population is projected to improve slightly from the historic trend as well as to the 2-mile radius trend at a very slight increase for the five-year period of 0.1%. The number of Households increased from 2000 to the estimate in 2014 by a negligible rate on an average annual rate basis, slightly greater than that in the 3-mile radius. The actual number of Households is projected to increase through 2019 at an annual average rate of 0.2% up slightly from the historic average annual growth rate. The average Family Size is estimated at 2.24 people in 2014, down slightly from the 2000 Census number of 2.27 people. The projected average Family Size is projected to continue this slight rate of decrease through 2019 to a projected size of 2.22 people. This decrease in family size could be an indication of an aging population in this market area or a younger population moving in. The Per Capita Income was estimated to have increased at an average annual rate of 1.1% from 2000 through This rate of growth is slightly higher than the 1.0% and 0.7% respective growth rates for the Average Household Income and Median Household Income for the same period. During the five-year period from , the Per Capita Income is estimated to increase at an average annual rate of 1.8%. This compares to the estimated rate of increase of Average Household Income of 1.6% and Median Household Income of 1.4%. These consistent projected increasing rates of growth in these areas are most likely reflective of evolving population in these areas of both an aging population combined with an influx of younger white collar medical professionals. 15
27 12-Mile Radius The following chart lists the major economic demographics of the subject City of Marshfield site including more of both Wood and Marathon Counties, which consists of more rural areas and smaller communities. GENERAL MARKET DEMOGRAPHICS Marshfield, Wisconsin RADIUS: 12 Miles ANNUAL ANNUAL PERCENT PERCENT 2019 PERCENT PERCENT CENSUS ESTIMATE CHANGE CHANGE PROJECTION CHANGE CHANGE POPULATION 40,142 40, % 0.0% 40, % 0.0% HOUSEHOLDS 16,641 16, % 0.1% 17, % 0.2% AVERAGE HOUSEHOLD SIZE AVERAGE HOUSEHOLD INCOME $52,206 $62, % 1.4% $66, % 1.5% MEDIAN HOUSEHOLD INCOME $41,731 $48, % 1.1% $51, % 1.2% AVERAGE PER CAPITA INCOME $21,642 $26, % 1.5% $28, % 1.7% Source: Claritas The subject market within this 12-mile radius of downtown Marshfield has a similar very slight decrease in Population from 2000 to estimated 2014 as in both the 2- and 5-mile radii. Through 2019, population is projected to improve slightly from the historic trend as well as to the 2-mile radius trend at a very slight increase for the five-year period of 0.2%. The number of Households increased from 2000 to the estimate in 2014 by a negligible rate on an average annual rate basis, similar to both the two and five mile radii. The actual number of Households is projected to increase through 2019 at an annual average rate of 0.2% up slightly from the historic average annual growth rate. The average Family Size is estimated at 2.38 people in 2014, down slightly from the 2000 Census number of 2.41 people. This trend in decreasing size is estimated to continue at a projected 2.36 people in The Per Capita Income was estimated to have increased at an average annual rate of 1.5% from 2000 through This rate of growth is similar to the growth rates of Average Household Income of 1.4% and Median Household Income of 21.1% for the same period. 16
28 During the five-year period from , the Per Capita Income is projected to increase at an average annual rate of 1.7%. This compares to the projected increase of Average Household Income or 1.5% and Median Household Income of 1.2%. The projected future increases in growth are slightly higher than the historic growth rates. Once again, the projected increasing rates of growth in these areas could be reflective of evolving population in these areas of both an aging population combined with an influx of younger white collar medical professionals. POPULATION AND NUMBER OF HOUSEHOLDS OVERALL OBSERVATIONS The Population of the entire subject market area, including all three radii, experienced a slight average annual decrease from 2000 to 2014 of up to (0.1%). From , projections for all three radii reflected a slight improvement with average annual rates ranging from (0.1%) to 0.0% or flat. Additionally, the Number of Households indicated a projected slight average annual increase of 0.2% during this same five-year period along with a projected slight decrease in the size of the Households in all three radii. This could be reflective of several factors including the reported increased median age of the population discussed earlier in this report (in the City of Marshfield the percent of the population over 55 years increased by 19.5% from 2000 to 2010 per the US Census) that would then potentially increase the number of empty nesters as well as the influx of younger medical professionals relocating into the area. HOUSEHOLD AND PER CAPITA INCOME OVERALL OBSERVATIONS The Average and Median Household Incomes and Per Capita Incomes were in a relatively narrow range of 0.7% to 1.5% for all three radii. These three income categories reflected a narrower range with an improvement at both the lower and top ends of the range over the historic patterns during the next five years through 2019, with projected average annual decreases ranging from (1.2%) to (1.8%). This may be reflective of the increased number of young professionals to the market area. 17
29 WORKFORCE CHARACTERISTICS Workforce Characteristic data was available for not only the City of Marshfield but also both Wood and Marathon Counties. However, since the Marshfield workforce comprises just 51.8% of the total reported workforce in Wood County and since the other primary population/employment area, Wisconsin Rapids, is thirty-three miles south, just the City of Marshfield data will be reviewed here. Also, while Marshfield sits right on the border of Marathon County with a small portion of the city located in Marathon County, most of the neighboring portions of Marathon County are rural in nature. Also, the significant amount of the workforce in Marathon County is located in the greater Wausau market area, well outside of the subject City of Marshfield market area, resulting in Marathon County data not being reviewed here. Data is provided in the following chart, highlighting the distribution of the labor force within the subject Marshfield market area. This will assist in analyzing the diversity of this market s employment base. The top three employment industries are highlighted in bold and yellow. The additional industries in bold blue make up the top five industries in this market area. The three industries showing the highest employment gains and losses from 2006 to 2011 are highlighted in bold blue and bold red in the far right column. EMPLOYMENT BY INDUSTRY City of Marshfield, Wisconsin NUMBER OF PERCENT OF NUMBER OF PERCENT OF PERSONS PERSONS PERSONS PERSONS PERCENT TYPE OF EMPLOYMENT EMPLOYED 2006 EMPLOYED 2006 EMPLOYED 2011 EMPLOYED 2011 CHANGE Agriculture, Forestry, Fishing & Hunting % % 53.8% Mining, Quarrying, & Oil and Gas Extraction 0 0.0% 0 0.0% 0.0% Utilities % % 10.4% Construction % % -11.3% Manufacturing 3, % 2, % -27.2% Wholesale Trade % % -14.4% Retail Trade 2, % 2, % 15.9% Transportation and Warehousing 2, % 2, % 15.0% Information % % 4.9% Finance and Insurance % % 23.1% Real Estate, Rental & Leasing % % -7.7% Services 13, % 13, % 1.6% - Professional, Scientific & Technical Services % % -13.2% - Management of Companies and Enterprises % % 0.0% - Administrative and Support and Waste Management and Remediation Services % % 58.6% - Educational Services % % 1.8% - Health and Social Assistance 10, % 10, % 1.8% - Arts, Entertainment & Recreation % % -30.4% - Accommodation & Food Services 1, % 1, % -12.3% - Other Services % % 13.9% - Public Administration % % 14.2% TOTAL 22, % 22, % -0.2% Source: U.S. Census 18
30 The top three industries in 2011 (Health & Social Assistance, Transportation & Warehousing and Retail Trade) generated 67.4% of the total employment base. In 2006, the same top three industries generated 63.5% of the employment base. Therefore, when comparing 2011 to 2006 for these three industries, there is a slight increase in the amount generated by them, reducing the diversity in the subject market. Ideally, the top three industries should represent less than 50% of the employment to show good diversity. In this market, the top three industries exceeded the 50% threshold in 2011 by 17.4% points or 34.8%. This indicates that the subject market has a definite reliance on these three industries to support its economy, especially the Healthcare sector. The subject market s top three employment industries in 2011 were Health & Social Assistance at 44.7%, Transportation & Warehousing at 11.7%, and Retail Trade at 11.0%. In 2006, the top three industries were the same: Health & Social Assistance at 43.8%, Transportation & Warehousing at 10.2%, and Retail Trade at 9.5%. This indicates a slight increase in the reliance on these same three industry sectors from 2006 to The fourth major industry in 2011 was Manufacturing in both 2011 at 10.1% and 2006 at 13.9%. Adding this industry sector to the top three industries results in the top four industries totaling 77.5% in 2011 and 77.4% in Typically a total of 60.0% or less indicates very good diversity in the workforce of a market area. Adding the fifth major industry, Accommodation & Food Services at 4.7% in 2011 and 5.3% in 2006 results in totals of the five major industry groups of 82.2% in 2011 and 82.7% in At 82.2% and 82.7% for the top five industry groups, they are well above the 65% - 70% range which indicates limited diversity in the market for industry and employment distribution. From 2006 to 2011, this market showed growth in eleven employment categories. These are highlighted in Blue. The leading industries gaining employment are in bold. There were seven industries that lost employment. These are highlighted in Red. Two industry sectors remained the same. Overall, the subject market has shown a decrease of (0.2%) or (0.04%) per year in employment from 2006 to It should be noted that 2006 to 2011 encompassed the recent national recession. The ability of this subject market to minimize its decrease in employment to such a low level during this time period is an indication of the modest strength in this market s economy. During this time, Unemployment Rates in Marshfield and Wood County ranged from 5.3% - 8.9%, slightly above the national average. This will be reviewed in greater detail in the following section. 19
31 The highest percentage of increase, at 58.6%, occurred in the Administrative and Support sector, the ninth smallest sector in Agriculture had the second largest increase at 53.8%. Then ten different sectors experienced increases over the fiveyear period ranging from 1.6% %. Six of these sectors experienced growth in the double-digit range. This level of increase in seven different industry sectors indicates that there is a level of growing/improving diversity in this market, despite the dominance of the one sector, Health & Social Assistance. The largest decrease occurred in the sector with the third fewest employees, Arts & Entertainment. UNEMPLOYMENT RATES Data was available for the City of Marshfield as well as both Wood and Marathon Counties. Therefore, the chart below presents a comparison of the Unemployment Rates for Marshfield, Wood and Marathon Counties and the State of Wisconsin: HISTORICAL UNEMPLOYMENT RATES STATE OF MARATHON WOOD CITY OF YEAR WISCONSIN COUNTY COUNTY MARSHFIELD 2014-YTD (April) 6.1% 5.9% 6.7% 5.8% 2013-YTD (April) 7.1% 7.2% 7.5% 6.1% % 6.7% 7.0% 6.9% % 7.2% 7.1% 7.2% % 7.6% 7.7% 7.8% % 9.0% 8.7% 8.7% % 8.9% 8.9% 8.8% % 4.5% 5.4% 5.4% % 4.3% 5.2% 5.2% % 4.3% 5.3% 5.3% % 4.2% 5.7% 5.7% % 4.4% 5.8% 5.8% Source: U.S. Bureau of Labor Statistics, city-data.com The 2013 year-end Unemployment Rate for the City of Marshfield was 6.9% while Wood and Marathon Counties achieved rates of 7.0% and 6.7%, respectively. Except for Marathon County, where the rate equaled the State of Wisconsin, the City of Marshfield and Wood County both achieved rates slightly above the State of Wisconsin. The 2014 year-to-date data covers the first four months of the year. As can be seen for the same period, in 2014 the City of Marshfield is 4.9% less than the same period in This would indicate that the projected 2014 year-end results could be as low as 6.6%, the lowest rate for the city since 2008 at the very beginning of the recent recession. The City of Marshfield and Wood County both appear to annually experience a slightly higher rate of unemployment than the state, most likely due to the seasonal nature of this market area. 20
32 Over the past ten years, Unemployment Rates have averaged 6.7% in the City of Marshfield and 6.6% in Wood County, slightly higher than the State of Wisconsin s ten-year average rate of 6.0%. All of these numbers are significantly higher than the US averages, especially in recent years. They are performing currently (and on average) above the maximized employment rate considered by economists to be between 4% and 5%. This indicates the probable availability of labor in the subject market area. LABOR SUPPLY and WAGES At this time, no Labor Supply problems were reported in any employment sector in the subject market. With Unemployment running above average, the labor supply should be adequate. This will include the Service sector and other related industries. Local officials did not note any wage pressures at this time. The current and historic Unemployment Rates in the subject market do not indicate any competitive wage pressure in the near future. While the relatively high, but improving, unemployment numbers denote the availability of labor, the seasonality of this market as reinforced by local officials could indicate some potential shortage of labor during the peak summer months of April - October. TRANSPORTATION The Transportation opportunities for this part of the central Wisconsin market area, while being somewhat limited, are adequate. Interstate 39 is located approximately twenty-six miles via four-lane divided US 10 east of Marshfield. It traverses the center of the state north/south from Beloit on the Illinois border north through Madison to Wausau. Additionally, Interstate 94 is located approximately fifty miles west of Marshfield via two-lane US 10. Marshfield also has convenient access via WI Route 13 north approximately twenty miles to four-lane WI Route 29, which connects from Eau Claire and I-94 east to Wausau and on to Green Bay. 21
33 Highway Traffic The following chart highlights traffic counts in the subject site area. See Exhibits 3 and 4 of this report for the proposed site s geographic relationship to these traffic arteries. TRAFFIC COUNTS Marshfield, Wisconsin LOCATION YEAR COUNT CHANGE On US Route 10 - East of WI Route * 8, % , % , On US Route 10 - West of Business * 6, % , % , On WI Route 13 - North of US Route * 11, % , % , Route 97 (N. Central Avenue) - North of E. Ives Street 2014* 16, % , % , South of E. Ives Street 2014* 15, % , % , * Denotes Preliminary AADT counts Source: WI Department of Transportation All of the area traffic counts in the previous chart are positive except for one, on US 10 west of WI 13. Discussions with local officials indicated that the spike in traffic volume on US 10 West of Business 13 could have been due to a bridge closure on a different route that redirected traffic to this area, causing the significant increase in The US Route 10 and WI Route 13 both represent traffic entering the Marshfield area from the east or Stevens Point and I-39. The Route 97 counts are in the market area around Site Area 3 discussed previously in this report and just blocks from Site Area 4. Route 97 is also part of the most direct route into Marshfield from the Central Wisconsin Airport located in Mosinee, approximately thirty miles northeast of Marshfield. 22
34 Air Service The closest airport with regularly scheduled passenger traffic to Marshfield is the Central Wisconsin Airport in Mosinee, approximately thirty miles northeast of Marshfield. Discussions with local officials indicated that this airport is the primary airport. Also, due to its proximity to several quality midscale to upper midscale hotels in Wausau, many visitors to Marshfield using this airport choose to stay in the hotels located in the Wausau area. The next closest airports with a greater selection of commercial air service are Madison and then Milwaukee or Minneapolis/St. Paul. ECONOMIC CONCLUSIONS The data for the City of Marshfield and parts of Wood and Marathon Counties indicated that the historic trend of slightly decreasing Population is projected to level off to a very slight increase in all three radii over the next five years. Household and per capita incomes reflected modest increases historically with similar to slightly improved increases projected for the same five-year period. The distribution of existing employment in the greater Marshfield area is dominated by Health & Social Services followed by Transportation & Warehousing, Retail Sales and Manufacturing. This indicates limited diversity in the workforce in the City of Marshfield with the top five industry sectors totaling 82.2% of the workforce. Labor Supply in the subject market was reported to be available with the modest levels of Unemployment in Marshfield at 6.9%, Wood County at 7.0% and Marathon County at 6.7% in
Business Growth (as of mid 2002)
") Page 1 of 6 Planning FHWA > HEP > Planning > Econ Dev < Previous Contents Next > Business Growth (as of mid 2002) Data from two business directories was used to analyze the change in the number of businesses
Page 1 of 6 Planning FHWA > HEP > Planning > Econ Dev < Previous Contents Next > Business Growth (as of mid 2002) Data from two business directories was used to analyze the change in the number of businesses
Figure 1.1 St. John s Location. 2.0 Overview/Structure
 St. John s Region 1.0 Introduction Newfoundland and Labrador s most dominant service centre, St. John s (population = 100,645) is also the province s capital and largest community (Government of Newfoundland
An outdoor waterpark is a facility offering three or more waterslides and other aquatic facilities.
 Methodology for Feasibility Studies for Waterparks By David J. Sangree, MAI, CPA, ISHC Before a developer or an organization considers constructing a new indoor or outdoor waterpark at a resort or standalone,
This section of the Plan provides a general overview of the Smoky Mountain Region. It consists of the following four subsections:
 SECTION 3 COMMUNITY PROFILE This section of the Plan provides a general overview of the Smoky Mountain Region. It consists of the following four subsections: 3.1 Geography and the Environment 3.2 Population
Evaluating Lodging Opportunities
 Evaluating Lodging Opportunities This section explores market opportunities for new lodging accommodations in the downtown area. It will help you understand travel and visitation trends, existing competition,
The Economic Impact of Tourism in North Carolina. Tourism Satellite Account Calendar Year 2013
 The Economic Impact of Tourism in North Carolina Tourism Satellite Account Calendar Year 2013 Key results 2 Total tourism demand tallied $26 billion in 2013, expanding 3.9%. This marks another new high
Contents Manningham at a Glance... 6 Location and Area... 6 Manningham Activity Centres... 6 Manningham Suburbs... 6 Population... 8 Forecast... 9 For
 Contents Manningham at a Glance... 6 Location and Area... 6 Manningham Activity Centres... 6 Manningham Suburbs... 6 Population... 8 Forecast... 9 Forecast 2011 2036... 9 Population Forecast... 9 Gross
ECONOMIC PROFILE PARK CITY & SUMMIT COUNTY, UTAH
 ECONOMIC PROFILE PARK CITY & SUMMIT COUNTY, UTAH Prepared by the Park City Chamber of Commerce & Visitors Bureau PO Box 1630, Park City, UT 84060 1.800.453.1360 Economic Profile Packet Sections 1. Introduction
Cedar Rapids Area Convention and Visitors Bureau Visitor Study
 Cedar Rapids Area Convention and Visitors Bureau Visitor Study 2003-2004 University of Northern Iowa Sustainable Tourism & The Environment Program www.uni.edu/step Project Directors: Sam Lankford, Ph.D.
Economic Impact of Tourism in Hillsborough County September 2016
 Economic Impact of Tourism in Hillsborough County - 2015 September 2016 Key findings for 2015 Almost 22 million people visited Hillsborough County in 2015. Visits to Hillsborough County increased 4.5%
The Economic Base of Colfax County, NM. PREPARED BY: The Office of Policy Analysis at Arrowhead Center, New Mexico State University.
 The Economic Base of Colfax County, NM PREPARED BY: The Office of Policy Analysis at Arrowhead Center, New Mexico State University DATE: July 2016 The Economic Base of Colfax County, New Mexico Introduction
Hazlet. 1. Overview of Hazlet and Its Waterfront. Hazlet Township. 1.1 Geographic Overview
 Hazlet 1. Overview of Hazlet and Its Waterfront 1.1 Geographic Overview Hazlet Township is located in Monmouth County. The Township has a land area of 5.6 square miles. Situated in the Bayshore region
Indoor Waterpark Resorts Expand Nationwide
 Indoor Waterpark Resorts Expand Nationwide by: David J. Sangree, MAI, CPA, ISHC The indoor waterpark resort concept is demonstrating its strength as a segment of the travel industry, expanding outside
Tourism Satellite Account Calendar Year 2010
 The Economic Impact of Tourism in Georgia Tourism Satellite Account Calendar Year 2010 Highlights The Georgia visitor economy rebounded in 2010, recovering 98% of the losses experienced during the recession
The Economic Impact of Tourism in Maryland. Tourism Satellite Account Calendar Year 2015
 The Economic Impact of Tourism in Maryland Tourism Satellite Account Calendar Year 2015 MD tourism economy reaches new peaks The Maryland visitor economy continued to grow in 2015; tourism industry sales
PRIME RETAIL LAND AVAILABLE
 RE COMMERCIAL LLC COMMERCIAL BROKERAGE SERVICES PRIME RETAIL LAND AVAILABLE NORTHEAST QUADRANT OF HIGHWAY 172 & COUNTY HIGHWAY GV GREEN BAY, WI WalMart Menards Festival Foods Stein s Gardens & Gifts Fleet
The Economic Impact of Tourism in Hillsborough County, June 2018
 The Economic Impact of Tourism in Hillsborough County, 2017 June 2018 Table of contents 1) Key Findings for 2017 3 2) Local Tourism Trends 7 3) Trends in Visits and Spending 12 4) The Domestic Market 19
The Economic Impact of Tourism in Buncombe County, North Carolina
 The Economic Impact of Tourism in Buncombe County, North Carolina 2017 Analysis September 2018 Introduction and definitions This study measures the economic impact of tourism in Buncombe County, North
The Economic Impact of Tourism in Maryland. Tourism Satellite Account Calendar Year 2016
 The Economic Impact of Tourism in Maryland Tourism Satellite Account Calendar Year 2016 County Results Washington County, Visitors Washington County Visitors (thousands) Year Overnight Day Total Growth
MEMORANDUM MARKET OVERVIEW. Matt Roberts, Director of Parks and Recreation City of Carpinteria. Kevin Engstrom James Rabe. Date: June 21, 2016
 MEMORANDUM ADVISORS IN: REAL ESTATE REDEVELOPMENT AFFORDABLE HOUSING ECONOMIC DEVELOPMENT SAN FRANCISCO A. JERRY KEYSER TIMOTHY C. KELLY KATE EARLE FUNK DEBBIE M. KERN REED T. KAWAHARA DAVID DOEZEMA LOS
The Economic Impact of Tourism in Jacksonville, FL. June 2016
 The Economic Impact of Tourism in Jacksonville, FL June 2016 Highlights Visitor spending surpassed $2.0 billion in 2015, growing 4.4%. As this money flowed through Duval County, the $2.0 billion in visitor
December 1, Tim Martin Executive Director Stephens County Development Authority 31 W. Doyle Street Toccoa, GA
 December 1, 2017 Tim Martin Executive Director Stephens County Development Authority 31 W. Doyle Street Toccoa, GA 30577 tim@scda.biz Dear Mr. Martin, We are pleased to present this summary letter report
Wright City Business Park
 Wright City Business Park 51.69 Acres SITE Wright City Business Park is a 51.69 acre site ideal for large distribution or manufacturing uses. Located approximately ¼ mile west of I-70 exit 199, Wright
How does my local economy function? What would the economic consequences of a project or action be?
 June 5th,2012 Client: City of Cortez Shane Hale Report Prepared for SBDC Ft. Lewis Report Prepared by Donna K. Graves Information Services Executive Summary - At the request of Joe Keck at the Small Business
North Carolina (Statewide) 2016 Prosperity Zone Data Books
 2016 Prosperity Zone Data Books") North Carolina (Statewide) 2016 Prosperity Zone Data Books 2 North Carolina Prosperity Zones Western North Carolina Prosperity Zones Northwest Region Piedmont-Triad Region Western Region Southwest Region
North Carolina (Statewide) 2016 Prosperity Zone Data Books 2 North Carolina Prosperity Zones Western North Carolina Prosperity Zones Northwest Region Piedmont-Triad Region Western Region Southwest Region
FOR sale INVESTMENT HIGHLIGHTS FREESTANDING PIZZA HUT INVESTMENT
 FOR sale 2,275 TOTAL SQUARE FEET INVESTMENT HIGHLIGHTS $955,500 Purchase Price 6% Cap Rate Primary Retail Destination of Richfield Absolute Net Lease Long Term Tenant FOR MORE INFORMATION CONTACT BRYCE
Puerto Rican Entrepreneurship in the U.S.
 Puerto Rican Entrepreneurship in the U.S. Research Brief issued April 2017 By: Jennifer Hinojosa Centro RB2016-14 Puerto Rican entrepreneurs were the fastest growing business firms in the U.S. According
The Economic Contributions of Agritourism in New Jersey
 The Economic Contributions of Agritourism in New Jersey Bulletin E333 Cooperative Extension Brian J. Schilling, Extension Specialist in Agricultural Policy Kevin P. Sullivan, Institutional Research Analyst
Downtown Boise Hotel Market Study
 Hotel Market Study Prepared for: The Boise Tri-Agency Group June 15, 2015 Photo Credit: Warren Lassen 1 Scope and Methodology In evaluating the Downtown Boise lodging market we: Reviewed, identified, and
Airport Planning Area
 PLANNING AREA POLICIES l AIRPORT Airport Planning Area LOCATION AND CONTEXT The Airport Planning Area ( Airport area ) is a key part of Boise s economy and transportation network; it features a multi-purpose
SYNOPSIS OF INFORMATION FROM CENSUS BLOCKS AND COMMUNITY QUESTIONNAIRE FOR TONOPAH, NEVADA
 TECHNICAL REPORT UCED 93-04 SYNOPSIS OF INFORMATION FROM CENSUS BLOCKS AND COMMUNITY QUESTIONNAIRE FOR TONOPAH, NEVADA UNIVERSITY OF NEVADA, RENO i Synopsis of Information from Census Blocks and Community
The Economic Impact of Tourism in North Carolina. Tourism Satellite Account Calendar Year 2015
 The Economic Impact of Tourism in North Carolina Tourism Satellite Account Calendar Year 2015 Key results 2 Total tourism demand tallied $28.3 billion in 2015, expanding 3.6%. This marks another new high
ECONOMIC PROFILE. Tourism
 ECONOMIC PROFILE Tourism Park City & Summit County Utah Prepared by Park City Chamber of Commerce Convention & Visitors Bureau P.O. Box 1630 ~ Park City, UT 84060-1630 800.453.1360 ~ 435.649.6100 ~ fax
The Economic Impact of Tourism in Hillsborough County. July 2017
 The Economic Impact of Tourism in Hillsborough County July 2017 Table of contents 1) Key Findings for 2016 3 2) Local Tourism Trends 7 3) Trends in Visits and Spending 12 4) The Domestic Market 19 5) The
The Economic Impact of Tourism on Galveston Island, Texas Analysis
 The Economic Impact of Tourism on Galveston Island, Texas 2012 Analysis Headline Results Headline results Tourism is a significant contributor to business sales, employment, and taxes on Galveston Island.
CHAPTER FIVE PROSPECTS FOR FUTURE ECONOMIC DEVELOPMENT
 CHAPTER FIVE PROSPECTS FOR FUTURE ECONOMIC DEVELOPMENT 5.1 GENERAL The recommended type and location of future land uses in Alpine should, in part, consider potential opportunities for future economic
Asheville Metro Economic Report nd Quarter
 Asheville Metro Economic Report 2017 2nd Quarter Johnson Price Sprinkle PA provides Asheville Metro Economic Report - 2017 Second Quarter. JPS is a sixty-year-old accounting firm serving Western North
EXECUTIVE SUMMARY. hospitality compensation as a share of total compensation at. Page 1
 EXECUTIVE SUMMARY Applied Analysis was retained by the Las Vegas Convention and Visitors Authority (the LVCVA ) to review and analyze the economic impacts associated with its various operations and southern
Newbury Population ,071 1,941 3,719 4,038 5,337 5,611 5,805
 CHAPTER 3 DEMOGRAPHICS Demographic Profile Population Demographic information can provide essential insights into the composition of a community. As a result, it is a basic element of land use planning
HEALTH SECTOR ECONOMIC INDICATORS REPORT
 HEALTH SECTOR ECONOMIC INDICATORS REPORT For: Mid North Coast Local Health District Report prepared by: April 2013 Table of Contents Introduction 3 Executive Summary 4 Output 5 Value-Added 7 Workforce
Five Thriving Minnesota Communities:
 Five Thriving Minnesota Communities: Brainerd Lakes Area Donna Koren, Senior Management Consultant James Jarvis, Senior Management Consultant 1 Brainerd Lakes Area 2 Industry Growth Central Region Crow
SLOW GROWTH OF SOUTHERN NEVADA ECONOMY
 NEVADA S ECONOMY A monthly report produced for Commerce Real Estate Solutions by Stephen P. A. Brown, PhD, Center for Business & Economic Research, University of Nevada, Las Vegas To receive an electronic
Economic Impact Study
 Nanaimo Airport YCD Economic Impact Study Final Report June 2007 Prepared by: Jocelyn Purcell, Executive Director Inside Canadian Airports 1070 Aubeneau Crescent West Vancouver, B.C. V7T 1T5 Phone: (604)
North Lanarkshire. Skills Assessment January SDS-1163-Jan16
 North Lanarkshire Skills Assessment January 2016 SDS-1163-Jan16 Acknowledgement The Regional Skills Assessment Steering Group (Skills Development Scotland, Scottish Enterprise, the Scottish Funding Council
Town of Oakfield Agricultural and Farmland Protection Plan
 SECTION III COMMUNITY OVERVIEW A. Regional Setting / Location The Town of Oakfield is located in the northwestern portion of Genesee County. Located west of New York's Finger Lakes, the Town is uniquely
The Economic Impact of Tourism on Galveston Island, Texas
 The Economic Impact of Tourism on Galveston Island, Texas 2017 Analysis Prepared for: Headline Results Headline results Tourism is an integral part of the Galveston Island economy and continues to be a
Moderator: Greg Guatto, President & CEO, Aspen Properties
 Session C2 2:10pm ONE SIZE DOES NOT FIT ALL: UNDERSTANDING THE FACTS & FALLACIES BETWEEN EDMONTON & CALGARY AND HOW THEY ARE PERFORMING IN TODAY S ECONOMY Moderator: Greg Guatto, President & CEO, Aspen
Table of Contents. Overview Objectives Key Issues Process...1-3
 Table of Contents Chapter One Introduction Overview...1-1 Objectives...1-1 Key Issues...1-2 Process...1-3 Chapter Two Inventory of Existing Conditions Airport Setting...2-1 Locale...2-1 Airport Surroundings...2-5
Airport Profile. St. Pete Clearwater International BY THE NUMBERS 818, ,754 $ Enplanements. Passengers. Average Fare. U.S.
 Airport Profile St. Pete Clearwater International St. Pete-Clearwater International Airport (PIE) is located in Pinellas County, Florida about nine miles north of downwn St. Petersburg, seven miles southeast
County of Dufferin Economic Development Strategy and Action Plan
 County of Dufferin Economic Development Strategy and Action Plan Strategic Plan Background Report Information for Those Involved in Stakeholder Consultations About the Dufferin County Economic Development
The Economic Impact of Travel in Minnesota Analysis
 The Economic Impact of Travel in Minnesota 2013 Analysis Overview 2013 Highlights Traveler Spending Traveler spending of $10.3 billion generated $17.6 billion in total business sales in 2013 as travel
 MN :
MN : Indoor Waterpark Resorts Continue Impressive Growth in 05
 Indoor Waterpark Resorts Continue Impressive Growth in 05 by: David J. Sangree, MAI, CPA, ISHC and Laurel A. Keller It s official. The indoor waterpark resort has established itself as a viable segment
Thessaloniki Chamber of Commerce & Industry TCCI BAROMETER. March Palmos Analysis. March 11
 Thessaloniki Chamber of Commerce & Industry TCCI BAROMETER March 2011 Palmos Analysis March 11 TCCI BAROMETER (Executive Summary) Thessaloniki Chamber of Commerce and Industry (TCCI), consistent to its
X. COMMUNITY ECONOMY
 X. COMMUNITY ECONOMY Issue Statement Economic considerations play an integral role in the development of every community. Park City s challenge is to remain competitive in the changing recreational market,
Economic Impact of Kalamazoo-Battle Creek International Airport
 Reports Upjohn Research home page 2008 Economic Impact of Kalamazoo-Battle Creek International Airport George A. Erickcek W.E. Upjohn Institute, erickcek@upjohn.org Brad R. Watts W.E. Upjohn Institute
Creativity, Class & Commerce. Give your business an edge. Downtown Waterfront, Duluth, Minn.
 Creativity, Class & Commerce Give your business an edge. Downtown Waterfront, Duluth, Minn. Creative energy, sophisticated class, and vibrant commercial activity make Duluth s Downtown Waterfront the perfect
Other Principle Arterials Minor Arterial Major Collector Minor Collector Local
 CHAPTER 10 TRANSPORTATION Introduction The system of public roads in East Pikeland Township is decidedly rural in character. Since the 1984, the road network has remained much the same, with the addition
THE 2006 ECONOMIC IMPACT OF TRAVEL & TOURISM IN INDIANA
 THE 2006 ECONOMIC IMPACT OF TRAVEL & TOURISM IN INDIANA A Comprehensive Analysis Prepared by: In Partnership with: PREPARED FOR: Carrie Lambert Marketing Director Indiana Office of Tourism Development
PARKING CAPACITY REQUIREMENTS
 PARKING CAPACITY REQUIREMENTS Presented to: Antaramian Development Corporation 365 5 th Avenue South Naples, Florida 34102 CONTENTS Page INTRODUCTION... 1 BACKGROUND... 2 EXISTING PARKING CONDITIONS...
The Economic Impact of Tourism in: Dane County & Madison, Wisconsin. April 2017
 The Economic Impact of Tourism in: Dane County & Madison, Wisconsin April 2017 Key themes for 2016 Visitor spending continued growing in Dane County, Wisconsin in 2016, growing 5.2% to surpass $1.2 billion.
2006 RENO-SPARKS VISITOR PROFILE STUDY
 2006 RENO-SPARKS VISITOR PROFILE STUDY PREPARED FOR RENO-SPARKS CONVENTION & VISITOR AUTHORITY Study Conducted and Reported by 475 Hill Street, Suite 2 Reno, Nevada 89501 (775) 323-7677 www.infosearchintl.com
PIZZA HUT & WINGSTREET
 PIZZA HUT & WINGSTREET NNN Investment 257 South Marschall Road Shakopee, Minnesota 55379 7486 La Jolla Boulevard, Suite 173 La Jolla, California 92037 EXECUTIVE SUMMARY PROPERTY Pizza Hut & WingStreet
The Economic Impact of Tourism in The Appalachian Region of Ohio. June 2014
 The Economic Impact of Tourism in The Appalachian Region of Ohio June 2014 Appalachia Region Tourism Summary Total Tourism Impact Appalachian Region Sales Wages Taxes Employment $4.9 billion $1.2 billion
The Economic Impact of Tourism in Walworth County, Wisconsin. July 2013
 The Economic Impact of Tourism in Walworth County, Wisconsin July 2013 Key themes for 2012 The Walworth County, Wisconsin visitor economy continued its brisk growth in 2012. Visitor spending rose 11% after
The Economic Impact of Tourism in The Appalachian Region of Ohio. June 2016
 The Economic Impact of Tourism in The Appalachian Region of Ohio June 2016 Appalachian Region tourism summary Total Tourism Impact Appalachian Region, Ohio Sales Wages Taxes Employment $5.3 billion $1.3
A COMPARISON OF THE MILWAUKEE METROPOLITAN AREA TO ITS PEERS
 KRY/WJS/EDL #222377 (PDF: #223479) 1/30/15 PRELIMINARY DRAFT Memorandum Report A COMPARISON OF THE MILWAUKEE METROPOLITAN AREA TO ITS PEERS EXECUTIVE SUMMARY This memorandum report provides a statistical
2nd Quarter. AEDC is pleased to present the Anchorage Quarterly Economic Indicators Report for the second quarter of 2010.
 2010 AEDC is pleased to present the Anchorage Quarterly Economic Indicators Report for the second quarter of 2010. This report summarizes recently updated data from the Anchorage Economic Indicators Database,
1
 213 Economic Outlook December 1, 212 Dr. Stephen P. A. Brown, Director Prepared by The Lee Lee Business School University of Nevada, Las Vegas University of Nevada, Las Vegas May 3, 212 December 1, 212
2008 DEKALB COUNTY TRANSPORTATION PLAN (UPDATE)
") 2008 DEKALB COUNTY TRANSPORTATION PLAN (UPDATE) TABLE OF CONTENTS Introduction 1 Transportation Planning Activities 2 Identification of Problem Areas and Recommended Solutions 7 DeKalb County Projects
2008 DEKALB COUNTY TRANSPORTATION PLAN (UPDATE) TABLE OF CONTENTS Introduction 1 Transportation Planning Activities 2 Identification of Problem Areas and Recommended Solutions 7 DeKalb County Projects
THE SENSIBLE ROCKY MOUNTAIN INVESTMENT CHOICE.
 THE SENSIBLE ROCKY MOUNTAIN INVESTMENT CHOICE 1 2 THE SENSIBLE ROCKY MOUNTAIN INVESTMENT CHOICE BIG MOUNTAINS. BIG BUSINESS. BIG OPPORTUNITY. Sparwood, BC is yours and mine. We may be known as that town
Key Stats. Of 11 peer cities assessed, Calgary has the second highest level of economic power comparing GDP per capita
 economy 20 Key Stats Of 11 peer cities assessed, Calgary has the second highest level of economic power comparing GDP per capita - Deloitte, Benchmarking Calgary s Competitiveness, 2015 Of 11 peer cities
ECONOMIC IMPACT STUDY OF CALIFORNIA AIRPORTS
 ECONOMIC IMPACT STUDY OF CALIFORNIA AIRPORTS MARCH 1, 2013 Prepared for California Airports Council Prepared by Applied Development Economics 100 Pringle Avenue, Suite 560 Walnut Creek, California 94596
The Travel & Tourism Industry in Vermont
 The Travel & Tourism Industry in Vermont A Benchmark Study of the Economic Impact of Visitor Expenditures on the Vermont Economy 2003 Prepared by: Introduction In 2003 Establishing clear and useful performance
VALUE OF TOURISM. Trends from
 VALUE OF TOURISM Trends from 2005-2015 March 2017 TABLE OF CONTENTS 1. Overview... 2 Key highlights in 2015... 2 2. Contributions to the economy... 4 TOURISM REVENUE... 5 Total revenue... 5 Tourism revenue
ASCOT SUBURB PROFILE
 ASCOT SUBURB PROFILE CONTENTS SUBURB HIGHLIGHTS 2 3 4 4 5 5 ASCOT & SURROUNDS LOCATION & LIFESTYLE DEMOGRAPHICS EMPLOYMENT FUTURE INFRASTRUCTURE WA MARKET TRENDS ACCESSIBILITY ENTERTAINMENT & RECREATION
Kern County: Last Redoubt of the California Dream?
 Kern County: Last Redoubt of the California Dream? Speech to Kern County EDC Economic Summit Bakersfield, CA March 15, 2017 By Joel Kotkin, Presidential Fellow in Urban Futures, Chapman University and
The Travel and Tourism Industry in Vermont. A Benchmark Study of the Economic Impact of Visitor Expenditures on the Vermont Economy 2005
 The Travel and Tourism Industry in Vermont A Benchmark Study of the Economic Impact of Visitor Expenditures on the Vermont Economy 2005 INTRODUCTION GENERAL November, 2006 This 2005 update of the original
Tourism in numbers
 Tourism in numbers 2013-2014 Glenda Varlack Introduction Tourism is a social, cultural and economic experience which involves the movement of people to countries or places outside their usual environment
RIVERSIDE PLAZA PROFESSIONAL OFFICE AT THE GATEWAY TO RIO RANCHO & ALBUQUERQUE
 PROFESSIONAL AT THE GATEWAY TO RIO RANCHO & ALBUQUERQUE AVAILABLE SUITES + + Suite 210 4,914± RSF + + Suite 225 1,100± RSF + + Suite 260 2,617± RSF LEASE RATE + + $16.50/RSF/YR Full Service PROPERTY FEATURES
TALE OF THREE CITIES. Tucson, Arizona
 TALE OF THREE CITIES The purpose of this report is to show the strengths and weaknesses of Tucson, Arizona and its sister cities, Albuquerque, New Mexico and El Paso, Texas. The three cities are sisters
Demographic Profile 2013 census
 Demographic Profile 2013 census This profile provides basic population and demographic information on the residents of the Hauraki District. Population and demographic information is important for targeting
RAY YENKANA Willowbrook Cr, Dawson Creek BC Canada $2,847,000
 1716 Willowbrook Cr, Dawson Creek BC Canada For SALE $2,847,000 This is a rare find, 32 townhomes in Dawson Creek, BC. Excellent investment in a single title multi family complex. Vendor has upgraded this
OMNI REAL ESTATE OFFERED FOR SALE PRIME LAND 5+/- ACRES ON PINE ISLAND ROAD IN CAPE CORAL, FL 33991
 OMNI REAL ESTATE OFFERED FOR SALE PRIME LAND 5+/- ACRES ON PINE ISLAND ROAD IN CAPE CORAL, FL 33991 Price: $1,190,000.00 Location: 3130 SW Pine Island Road, Cape Coral, FL 33991 Lee County Zoning: Corridor
Economic Impact of Tourism. Norfolk
 Economic Impact of Tourism Norfolk - 2009 Produced by: East of England Tourism Dettingen House Dettingen Way, Bury St Edmunds Suffolk IP33 3TU Tel. 01284 727480 Contextual analysis Regional Economic Trends
2. Recommendations 2.1 Board members are asked to: i. note the content of the May 2018 Renfrewshire Economic Profile.
 To: Leadership Board On: 20 June 2018 Report by: Director of Development and Housing Services Heading: Renfrewshire Economic Profile May 2018 1. Summary 1.1 This report is the second edition of a revised
PROJECTED UTILIZATION OF THE PROPOSED HOTEL
 PROJECTED UTILIZATION OF THE PROPOSED HOTEL The supply and demand analysis included general overviews of the Frostburg, Maryland market area, a detailed analysis of the properties projected to provide
Sales: (780)
") WHO IS ICEWERX Icewerx specializes in providing top notch digital billboard advertising space and superior client services. We use only the highest grade digital displays available with the truest color
WHO IS ICEWERX Icewerx specializes in providing top notch digital billboard advertising space and superior client services. We use only the highest grade digital displays available with the truest color
Economic Impact of Tourism in South Dakota, December 2017
 Economic Impact of Tourism in South Dakota, 2017 December 2017 1) Key findings 1) Growth continues in 2017 but pales against the event driven years of 2015 and 2016 in South Dakota Key facts about South
Do Scenic Amenities Foster Economic Growth in Rural Areas?
 Do Scenic Amenities Foster Economic Growth in Rural Areas? By Jason Henderson and Kendall McDaniel Rural areas in the Tenth District are experiencing a period of renewed economic growth in the 199s. After
Occupancy in North Carolina
 Smith Travel Research Year-End 2009 Lodging Report Year-end 2009 hotel/motel occupancy was down -9.0% statewide from 2008. This represents a decrease of -12.2% since 2005. o The US occupancy was down -8.6%
Prime Development Site 189 Danbury Rd., New Milford, CT
 Prime Development Site 189 Danbury Rd., New Milford, CT 107,000 SF Shopping Center Fully Approved Ready For Building Permit Asking Price: $4,800,000 ($362k/acre) FOR FURTHER INFORMATION CONTACT GARETT
2013 IRVING HOTEL GUEST SURVEY Final Project Report
 2013 IRVING HOTEL GUEST SURVEY Final Project Report Research prepared for the Irving Convention & Visitors Bureau by Destination Analysts, Inc. Table of Contents SECTION 1 Introduction 2 SECTION 2 Executive
HVS Market Pulse: Why Aren t Hotels Being Built in Ski Towns?
 HVS Market Pulse: Why Aren t Hotels Being Built in Ski Towns? January 23, 2017 By Brett E. Russell In ski resort towns across the U.S. and Canada, a large and growing number of people are hitting the slopes.
CHAPTER ONE LITERATURE REVIEW
 CHAPTER ONE LITERATURE REVIEW LITERATURE REVIEW This chapter summarizes the most recently published community impact studies and articles that relate to multiuse trails. The review focuses on publications
Business Register and Employment Survey 2016 Update Final March 2016
 Business Register and Employment Survey 2016 Update Final March 2016 Jamie.watson@coast2capital.org.uk EXECUTIVE SUMMARY The Business Register and Employment Survey (BRES) update has shown that the Coast
The Economic Contribution of Cruise Tourism to the Southeast Asia Region in Prepared for: CLIA SE Asia. September 2015
 BREA Business Research & Economic Advisors The Economic Contribution of Cruise Tourism to the Southeast Asia Region in 2014 Prepared for: CLIA SE Asia September 2015 Business Research & Economic Advisors
Fiji s Tourism Satellite Accounts
 Asia-Pacific Economic Statistics Week Bangkok 2 4 May 2016 Fiji s Tourism Satellite Accounts Mr. Bimlesh Krishna Divisional Manager Economic Statistics Fiji s Tourism Satellite Introduction The Tourism
ICEWERX CONSULTING INC. WHO IS ICEWERX
 ICEWERX CONSULTING INC. WHO IS ICEWERX Icewerx specializes in providing top notch digital billboard advertising space and superior client services. We use only the highest grade digital displays available
POPULATION INTRODUCTION
 POPULATION INTRODUCTION The socio-economic data available at the time of this writing is a conglomeration of data provided by the Kentucky State Data Center, OKI Regional Council of Governments, 2010 U.S.