Kern County: Last Redoubt of the California Dream?
|
|
|
- Annice Flynn
- 5 years ago
- Views:
Transcription
1 Kern County: Last Redoubt of the California Dream? Speech to Kern County EDC Economic Summit Bakersfield, CA March 15, 2017 By Joel Kotkin, Presidential Fellow in Urban Futures, Chapman University and Executive Director, Center for Opportunity Urbanism
2 Main Conclusions Kern s real economy provides positive outcome for middle and working class residents Lower housing prices could lure skilled workers and millennials from coast California policies at odds with Valley realities


3 In a post industrial age, does stuff still matter? it certainly does.
4 Economic Multiplier Effect Economic Activity Generated per Dollar of Sales, 2014 Manufacturing $1.40 Agriculture, forestry, fishing, and hunting $1.17 Transportation and warehousing $1.05 Information $0.86 Professional and business services $0.66 Retail trade $0.64 Wholesale trade $0.60 Finance, insurance, real estate, rental, and leasing $0.58 Source: U.S. Bureau of Econonmic Analysis Input Output Accounts
5 Global Market Opportunity for Ag exports $160 Value of Trade Billions U.S. Agricultural Trade, $140 Exports, $133 $120 Imports, $114 $100 $80 $60 $40 $20 $ Source: Compiled by USDA ERS usingg data from U.S. Department of Commerce, U.S. Census Bureau.

6 Global Energy Demand Chart global energy demand andaway

7 Where the shale is.
8 Millions 2.5 U.S. Employment in the Energy Cluster, ,250, EMSI Employment Data,
9 Energy Jobs Pay Well Management of Companies and Enterprises Energy: A High Value Sector Current Wages, Salaries, & Proprietor Earnings per Job, Select Supersectors, 2016 $115,813 Mining, Quarrying, and Oil and Gas Extraction Utilities Finance and Insurance Information Professional, Scientific, and Technical Services $103,120 $99,464 $97,525 $91,435 $82,734 Wholesale Trade Manufacturing $62,934 $71,649 Construction Average All Sectors Real Estate and Rental and Leasing Transportation and Warehousing Health Care and Social Assistance $49,934 $49,863 $49,675 $49,653 $46,048 Arts, Entertainment, and Recreation Retail Trade $33,122 $29,257 Accommodation and Food Services $19,134 Source: EMSI Employment Data,
10 Share of U.S. Exports by Type 60% 50% Manufactured Goods, 50% Share of Total Exports 40% 30% Services, 33% 20% 10% Agricultural, 6% 0% Energy Products, 6% Source: U.S. Census Foreign Trade Statistics
11 Productivity Gains Since % 60% Manufacturing, 59% 50% 40% 30% Business, 29% 20% 10% 0% U.S. Bureau of Labor Statistics Major Sector Productivity and Costs Program, Labor Productivity Index (output per hour)
12 High Value Regional Drivers Current Wages, Salaries, & Proprietor Earnings per Job, Select Supersectors, 2016 Management of Companies and Enterprises Mining, Quarrying, and Oil and Gas Extraction Utilities Finance and Insurance Information Professional, Scientific, and Technical Services Wholesale Trade Manufacturing $115,813 $103,120 $99,464 $97,525 $91,435 $82,734 $71,649 $62,934 Construction Average All Sectors Real Estate and Rental and Leasing Transportation and Warehousing Health Care and Social Assistance Arts, Entertainment, and Recreation Retail Trade Accommodation and Food Services $49,934 $49,863 $49,675 $49,653 $46,048 $33,122 $29,257 $19,134 Source: EMSI Employment Data,
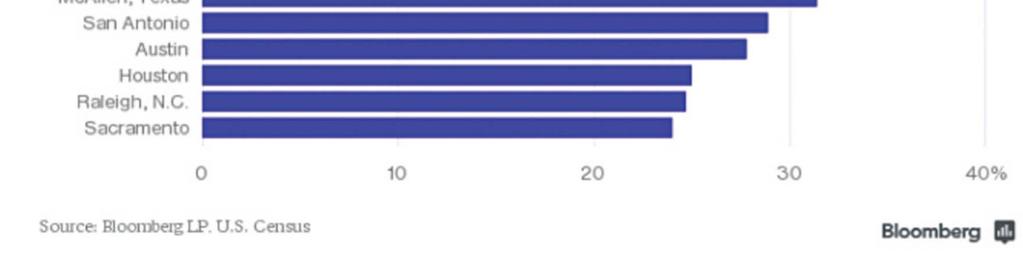
13 Total Job Growth, Austin Round Rock, TX 42% Riverside San Bernardino Ontario, CA Houston The Woodlands Sugar Land, TX San Antonio New Braunfels, TX Bakersfield, CA 32% 30% 29% 27% Dallas Fort Worth Arlington, TX 23% Visalia Porterville, CA San Luis Obispo Paso Robles Arroyo Grande, CA Fresno, CA 16% 16% 18% Los Angeles Long Beach Anaheim, CA 7% Albuquerque, NM 5% Source: EMSI Complete Employment,
14 Job Growth in Middle Class Occupations, Austin Round Rock, TX 37% Riverside San Bernardino Ontario, CA Houston The Woodlands Sugar Land, TX San Antonio New Braunfels, TX 25% 27% 26% Dallas Fort Worth Arlington, TX Bakersfield, CA Fresno, CA 17% 20% 20% Visalia Porterville, CA San Luis Obispo Paso Robles Arroyo Grande, CA 11% 10% Los Angeles Long Beach Anaheim, CA 4% Albuquerque, NM (1%) Source: EMSI Complete Employment, Middle class occupations are those paying % of the national median hourly wage.
15 Job Growth in STEM Occupations, Austin Round Rock, TX 33% San Antonio New Braunfels, TX San Luis Obispo Paso Robles Arroyo Grande, CA Houston The Woodlands Sugar Land, TX Riverside San Bernardino Ontario, CA Bakersfield, CA 29% 25% 24% 21% 21% Dallas Fort Worth Arlington, TX Fresno, CA 13% 16% Visalia Porterville, CA 2% Los Angeles Long Beach Anaheim, CA (2%) Albuquerque, NM (9%) Source: EMSI Complete Employment,
16 Housing Affordability: Price to Income Ratio 2016: HIGHER IS LESS AFFORDABLE San Jose, CA Los Angeles, CA San Francisco-Oakland, CA San Diego, CA Stockton, CA Riverside-San Bernardino, CA Sacramento, CA Modesto, CA Fresno, CA Austin, TX Bakersfield, CA San Antonio, TX Dallas-Fort Worth, TX Houston, TX United States Median house price divided by median household income Median Multiple Derived from Demographia International Housing Affordability Survey

17 Net Domestic Migration by Affordability STATES AND DC: ,000,000 3,498,000 3,000,000 2,000,000 Population Growth 1,000, ,000, ,000 Affordable Moderately Unaffordable Seriously Unaffordable Severely Unaffordable 2,000,000 1,971,000 1,865,000 3,000,000 Derived from Census Bureau data & City Sector Model 2015 Revision
18 MSA Growth: California : OVER 500,000 POPULATION Riverside-San Bernardino, CA Bakersfield, CA Stockton, CA Sacramento, CA Fresno, CA Modesto, CA San Diego, CA San Jose, CA San Francisco-Oakland, CA Los Angeles, CA California United States Derived from Census Bureau data 0% 10% 20% 30% 40% Population Change
19 2000 to 2015 Net Domestic Migration SELECTED METROPOLITAN AREAS Las Vegas, NV Phoenix, AZ San Antonio, TX Riverside San Bernardino, CA Dallas Fort Worth, TX Houston, TX Portland, OR WA Denver, CO Sacramento, CA Stockton, CA Bakersfield, CA Seattle, WA McAllen, TX Modesto, CA Fresno, CA San Diego, CA San Francisco Oakland, CA El Paso, TX Los Angeles, CA San Jose, CA 20% 10% 0% 10% 20% 30% Net Domestic Migration Compared to 2000 Population Derived from Census Bureau data
20 2010 to 2015 Net Domestic Migration SELECTED METROPOLITAN AREAS San Antonio, TX Denver, CO Houston, TX Phoenix, AZ Dallas Fort Worth, TX Portland, OR WA Las Vegas, NV Seattle, WA San Francisco Oakland, CA Sacramento, CA Riverside San Bernardino, CA Stockton, CA San Diego, CA Modesto, CA McAllen, TX San Jose, CA Bakersfield, CA Fresno, CA Los Angeles, CA El Paso, TX 4% 2% 0% 2% 4% 6% 8% Net Domestic Migration Compared to 2010 Population Derived from Census Bureau data
21 Net Domestic Migration by Age CALIFORNIA AND TEXAS: California is losing its next generation of wealth and leadership Net Domestic Migration 70,000 60,000 50,000 40,000 30,000 20,000 10, ,000 20,000 California Texas Derived from Internal Revenue Service data
22 Housing Preferences: Realtors Survey 2011 COMMUNITY PREFERENCE SURVEY Attached Single Family 7.0% Other 5.0% Multi Unit 8.0% Detached House 80.0%
23 Big City Millennial Life Style Choices COMPARED TO OLDER GENERATIONS Current Residence Ideal Place to Live Suburb Small City Country Big City Suburb Small City Country Millenials Older Generations 0% 10% 20% 30% 40% 50% Source: Frank N. Magid Associates
24 House Purchases: Under Age NATIONAL ASSOCIATION OF REALTORS Multi Unit Other Townhous 7% 4% e 8% From National Association of Realtors, 2015 Detached House 81%
25 An aging population also boosts the suburbs 30% % living in urban neighborhoods, by age group 25% % 15%
26 Projected national number of and population cohorts, 2014 to Source: Business Insider/Andy Kiersz, data from US Census Bureau

27
28 Population Change by Ethnicity: % BAKERSFIELD MSA (ONE-RACE DATA) 80% 60% 40% 20% 0% White-Non-Hispanic African American Asian Hispanic 20% Derived from Census Bureau data
29 500, ,000 Population by Ethnicity: BAKERSFIELD MSA (ONE-RACE DATA) 400, , , , , , ,000 50,000 0 White-Non- Derived from Census Hispanic Bureau data African American Asian Hispanic
30 Valude to Income Multipole Housing Affordability by Ethnicity US & CALIFORNIA 2015 United States California 0 All White-non- Hispanic African-American Asian Hispanic Derived from Census Bureau data & City Sector Model 2015 Revision

31 Grand Delusions won t save California: Business Needs to Change the Debate California State Development Priorities Green Jobs and forced density High Speed Rail and transit Social engineering away from families and middle class housing and jobs
32 Compared to Detached (5) Construction Cost by House Type SAN FRANCISCO BAY AREA Construction Cost/Square Foot Compared to Detached (5 per Acre) Derived from FBI Statistics: 2013, Major metropolitan areas (average). Figure 32
33 2.0 Change in Commute Shares: UNITED STATES Percentage Points Drive Alone Car Pool Transit Bicycle Walk Other Work at Home 3.5 Derived from Census Bureau data
34 30 CO2 Emissions per Capita: By Sector AUSTRALIA 5 LARGE CAPITAL URBAN AREAS Metric Tons Core Inner Ring Second Ring Outer Ring Housing Form in Australia and Its Impact on Greenhouse Gas Emissions Figure 34

35 People Leaving California Are Actually Increasing Net Carbon Dioxide Emissions
36 Key Solutions and Recommendations Reform California regulatory rules to be more business friendly and react quicker to competitive challenges Focus development on higher paid employment options, particularly for new generation Transportation solutions should be 21 st Century variety, not yet another failed attempt to recreate the 19 th Develop narrative that Kern represents a different kind of California, where the dream still exists is the cutting edge of the post suburbia emerging around the country Develop a marketing outreach to professionals and companies hiring them to position Kern as an attractive place to work and live
37 Questions and Comments
Poverty and Housing. UC Center Sacramento. October 24, Walter Schwarm Director, California State Data Center California Department of Finance
 Poverty and Housing UC Center Sacramento October 24, 218 Walter Schwarm Director, California State Data Center California Department of Finance Official Poverty Rate for California and the United States:
Houston Economic Update. Presented by Patrick Jankowski Vice President, Research Greater Houston Partnership
 Houston Economic Update Presented by Patrick Jankowski Vice President, Research Greater Houston Partnership Houston Astros - Percent Regular Season Games Won Help from the bullpen this year Help from the
The Economic Base of Colfax County, NM. PREPARED BY: The Office of Policy Analysis at Arrowhead Center, New Mexico State University.
 The Economic Base of Colfax County, NM PREPARED BY: The Office of Policy Analysis at Arrowhead Center, New Mexico State University DATE: July 2016 The Economic Base of Colfax County, New Mexico Introduction
ECONOMIC IMPACT STUDY OF CALIFORNIA AIRPORTS
 ECONOMIC IMPACT STUDY OF CALIFORNIA AIRPORTS MARCH 1, 2013 Prepared for California Airports Council Prepared by Applied Development Economics 100 Pringle Avenue, Suite 560 Walnut Creek, California 94596
Lower Income Journey to Work Market Share From American Community Survey
 Lower Income Journey to Work Market Share From American Community Survey 2006-2010 Table 1: Overall National Data Table 2: Car, Truck or Van Table 3: Transit Table 4: Metrics Table 1 Work Trip Market Share:
A COMPARISON OF THE MILWAUKEE METROPOLITAN AREA TO ITS PEERS
 KRY/WJS/EDL #222377 (PDF: #223479) 1/30/15 PRELIMINARY DRAFT Memorandum Report A COMPARISON OF THE MILWAUKEE METROPOLITAN AREA TO ITS PEERS EXECUTIVE SUMMARY This memorandum report provides a statistical
PUBLIC TRANSPORTATION INTRODUCTION
 PUBLIC TRANSPORTATION INTRODUCTION 1 OUTLINE Current Status and Recent Trends Significant Influences A Critical Assessment Arguments Supporting Public Transport Future Influences Ingredients for Future
Rank Place State Native Hawaiian and Pacific Islander population (alone or in combination
 TABLE 2a: 100 Largest Places Ranked by Number of s (race alone or in *) Living in Hard-to- Census Rank Place State (alone or in 1 Honolulu (CDP) HI 64,196 11,130 17.3 2 New York City NY 14,981 8,211 54.8
ATLANTA HOUSING MARKET Fourth Quarter 2017 Presentation for HBA Builder Developer Lender Council. Expanded. Unemployment Rate (U 6) Official
 Official") Eugene James Senior Regional Director 404-510-1080 ejames@metrostudy.com connect on LinkedIn Mike Overley Business Development Director 770-380-0827 moverley@metrostudy.com To volunteer call 404 408 0716
Eugene James Senior Regional Director 404-510-1080 ejames@metrostudy.com connect on LinkedIn Mike Overley Business Development Director 770-380-0827 moverley@metrostudy.com To volunteer call 404 408 0716
Get Smart Market Insights from Our Research Team Customer Conference
 Get Smart Market Insights from Our Research Team 217 Customer Conference Presenters Amanda Nunnink Amanda Nunnink Steve Steve Guggenmos Guggenmos Sara Steve Hoffman Griffin Steve Sara Griffin Hoffmann
Key Stats. Of 11 peer cities assessed, Calgary has the second highest level of economic power comparing GDP per capita
 economy 20 Key Stats Of 11 peer cities assessed, Calgary has the second highest level of economic power comparing GDP per capita - Deloitte, Benchmarking Calgary s Competitiveness, 2015 Of 11 peer cities
Location, Location, Location. 19 th Annual NIC Conference NIC MAP Data & Analysis Service
 Location, Location, Location 19 th Annual NIC Conference NIC MAP Data & Analysis Service The Great Occupancy Decline 94% Occupancy Trends Majority Nursing Seniors Housing 93% 92% 91% 92.8% 91.0% 90% 89%
METROPOLITAN STATISTICAL AREA
 Miami-Fort Lauderdale-West Palm Beach METROPOLITAN STATISTICAL AREA Broward County is part of the 8th largest metropolitan statistical area (MSA)() in the country with a population just over 6M in 2016.
Major US City Preparedness For an Oil Crisis Which Cities and Metro Areas are Best Prepared for $4 a Gallon Gas and Beyond?
 Major US City Preparedness For an Oil Crisis Which Cities and Metro Areas are Best Prepared for $4 a Gallon Gas and Beyond? March 4, 2008 By Warren Karlenzig President Common Current www.commoncurrent.com
Major Metropolitan Area Sales Tax Rates
 August 19, 2010 No. 239 FISCAL FACT Major Metropolitan Area Sales Tax Rates By Lawrence Summers Introduction General sales taxes levied by state, county and city governments in the United States vary greatly,
Monthly Employment Watch: Milwaukee and the Nation's Largest Cities
 Monthly Employment Watch: Milwaukee and the Nation's Largest Cities A monthly report on employment trends in the nation s largest cities Prepared by: The University of Wisconsin-Milwaukee Center for Economic
California: Housing Bellwether or Not?
 California: Housing Bellwether or Not? GSU Economic Forecasting Conference November 19, 2014 Robert A. Kleinhenz, Ph.D. Chief Economist,, LAEDC Outline Economic Comparisons: California Georgia Los Angeles
REGIONALLY FOCUSED. GLOBALLY COMPETITIVE.
 ABOUT EDC WHO WE ARE Mission: San Diego Regional Economic Development Corporation s mission is to maximize the region s economic prosperity and global competitiveness. Vision: The San Diego Region will
U.S. Metropolitan Area Exports, 2015
 U.S. Metropolitan Area Exports, 2015 Jeffrey Hall Office of Trade and Economic Analysis Industry and Analysis Department of Commerce International Trade Administration September 2016 U.S. Metro Exports:
ECON 166 Lecture 2. J. M. Pogodzinski
 ECON 166 Lecture 2 J. M. Pogodzinski Broad Themes in the Course Measurement Theory Policy 8/27/2014 J. M. Pogodzinski 2 Measurement What is urban? What is the record of urban growth? What is distinct about
Monthly Employment Watch: Milwaukee and the Nation's Largest Cities
 Monthly Employment Watch: Milwaukee and the Nation's Largest Cities A monthly report on employment trends in the nation s largest cities Prepared by: The University of Wisconsin-Milwaukee Center for Economic
EXECUTIVE SUMMARY. hospitality compensation as a share of total compensation at. Page 1
 EXECUTIVE SUMMARY Applied Analysis was retained by the Las Vegas Convention and Visitors Authority (the LVCVA ) to review and analyze the economic impacts associated with its various operations and southern
RANKING OF THE 100 MOST POPULOUS U.S. CITIES 12/7/ /31/2016
 OVERVIEW OF THE DATA The following information is based on incoming communication to the National Human Trafficking Hotline via phone, email, and online tip report from December 7, 2007 December 31, 2016
TDL IN MOHAVE COUNTY SUCCESS STORIES. Learn More: Mohave County
 TDL IN MOHAVE COUNTY With a strategic location within a one-day, round-trip drive of major metros like San Diego, Los Angeles and Phoenix, moving your transportation, distribution or logistics company
Park-Related Total* Expenditure per Resident, by City
 Park-Related Total* per Resident, by City FY 2008 City Population Total Park per Resident Washington, D.C. 591,833 $153,324,830 $259 Seattle 598,541 $150,672,543 $252 Scottsdale 235,371 $50,429,049 $214
The Economic Impact of Tourism on Galveston Island, Texas
 The Economic Impact of Tourism on Galveston Island, Texas 2017 Analysis Prepared for: Headline Results Headline results Tourism is an integral part of the Galveston Island economy and continues to be a
San Antonio Market Overview. 1 st 2 nd Quarter 2015
 San Antonio Market Overview 1 st 2 nd Quarter 2015 San Antonio, Texas Attributes of San Antonio Why San Antonio? The seventh most populated city in the United States of America and the second most populated
1
 213 Economic Outlook December 1, 212 Dr. Stephen P. A. Brown, Director Prepared by The Lee Lee Business School University of Nevada, Las Vegas University of Nevada, Las Vegas May 3, 212 December 1, 212
The Economic Impact of Travel in Minnesota Analysis
 The Economic Impact of Travel in Minnesota 2013 Analysis Overview 2013 Highlights Traveler Spending Traveler spending of $10.3 billion generated $17.6 billion in total business sales in 2013 as travel
Monthly Employment Watch: Milwaukee and the Nation's Largest Cities
 Monthly Employment Watch: Milwaukee and the Nation's Largest Cities A monthly report on employment trends in the nation s largest cities Prepared by: The University of Wisconsin-Milwaukee Center for Economic
Real Estate Development Law Update h. February 15 th, Jeff Meyers Principal Meyers LLC (949) x200
 x200") Allen Matkins Real Estate Development Law Update h February 15 th, 2012 Jeff Meyers Principal Meyers LLC (949) 640-0050 x200 JOB TRENDS Job Postings per Capita, 4Q11 Rank (Last Qtr Rank) Metropolitan Area
Allen Matkins Real Estate Development Law Update h February 15 th, 2012 Jeff Meyers Principal Meyers LLC (949) 640-0050 x200 JOB TRENDS Job Postings per Capita, 4Q11 Rank (Last Qtr Rank) Metropolitan Area
A COMPARISON OF THE MILWAUKEE METROPOLITAN AREA TO ITS PEERS
 KRY/WJS/EDL #222377 v4 (PDF: #223479v2) 4/1/15 APPENDIX D REVISED DRAFT Memorandum Report A COMPARISON OF THE MILWAUKEE METROPOLITAN AREA TO ITS PEERS EXECUTIVE SUMMARY This report provides a statistical
Economic Impact Analysis. Tourism on Tasmania s King Island
 Economic Impact Analysis Tourism on Tasmania s King Island i Economic Impact Analysis Tourism on Tasmania s King Island This project has been conducted by REMPLAN Project Team Matthew Nichol Principal
Census Affects Children in Poverty by Professors Donald Hernandez and Nancy Denton State University of New York, Albany
 Phone: (301) 457-9900 4700 Silver Hill Road, Suite 1250-3, Suitland, MD 20746 Fax: (301) 457-9901 Census Affects in Poverty by Professors Donald Hernandez and Nancy Denton State University of New York,
Monthly Employment Watch: Milwaukee and the Nation's Largest Cities
 Monthly Employment Watch: Milwaukee and the Nation's Largest Cities A monthly report on employment trends in the nation s largest cities Prepared by: The University of Wisconsin-Milwaukee Center for Economic
The Economic Impact of Tourism on Galveston Island, Texas Analysis
 The Economic Impact of Tourism on Galveston Island, Texas 2012 Analysis Headline Results Headline results Tourism is a significant contributor to business sales, employment, and taxes on Galveston Island.
Industrial Investment Property
 Industrial Investment Property Fully Leased NNN Investment 2945-2965 SOUTH ANG AVENUE - FRESNO, CALIFORNIA BUILDING FEATURES 24-27 CEILING HEIGHT 60 X 28 COLUMN SPACING CONCRETE TILT-UP CONSTRUCTION FULLY
Appendix 3 REMPLAN Economic Impact Modelling: New Energy Port Hedland Waste to Energy Project
 Public Environmental Review Boodarie Waste to Energy and Materials Recovery, Port Hedland Appendix 3 REMPLAN Economic Impact Modelling: New Energy Port Hedland Waste to Energy Project NEW ENERGY PORT HEDLAND
Monthly Employment Watch: Milwaukee and the Nation's Largest Cities
 Monthly Employment Watch: Milwaukee and the Nation's Largest Cities A monthly report on employment trends in the nation s largest cities Prepared by: The University of Wisconsin-Milwaukee Center for Economic
Fiji s Tourism Satellite Accounts
 Asia-Pacific Economic Statistics Week Bangkok 2 4 May 2016 Fiji s Tourism Satellite Accounts Mr. Bimlesh Krishna Divisional Manager Economic Statistics Fiji s Tourism Satellite Introduction The Tourism
Industrial Market Report
 CLIENT FOCUSED. RESULTS DRIVEN. Lubbock Industrial Map Statistics The Lubbock industrial market continues to expand Southwest with the majority of new construction being in this sector followed by the
HEALTH SECTOR ECONOMIC INDICATORS REPORT
 HEALTH SECTOR ECONOMIC INDICATORS REPORT For: Mid North Coast Local Health District Report prepared by: April 2013 Table of Contents Introduction 3 Executive Summary 4 Output 5 Value-Added 7 Workforce
The Housing Market and the Macroeconomy
 The Housing Market and the Macroeconomy New England Mortgage Bankers Association October 2, 2009 1 The World is in a Deep Recession In the U.S. EMPLOYMENT: Job losses in August, 2009: -216,000 Job losses
Focus on the Future. Enabling Growth. Or Just Keeping Up
 Focus on the Future Enabling Growth. Or Just Keeping Up HOUSTON A MODERN/GLOBAL CITY HOUSTON What makes It Tick? Energy Value of US $ Trends in US Economy Medical Center International Trade Technology
Monthly Employment Watch: Milwaukee and the Nation's Largest Cities
 Monthly Employment Watch: Milwaukee and the Nation's Largest Cities A monthly report on employment trends in the nation s largest cities Prepared by: The University of Wisconsin-Milwaukee Center for Economic
Figure 1.1 St. John s Location. 2.0 Overview/Structure
 St. John s Region 1.0 Introduction Newfoundland and Labrador s most dominant service centre, St. John s (population = 100,645) is also the province s capital and largest community (Government of Newfoundland
1Q 2014 Greater Atlanta HBA Builder Developer Lender Council meeting Information presented by. Atlanta Job Growth
 1Q 2014 Greater Atlanta HBA Builder Developer Lender Council meeting 5-21-2014 Information presented by Eugene James, Regional Director ejames@metrostudy.com 404-510-1080 connect on LinkedIn Atlanta Job
Who Sprawls the Most?
 SPRAWL AMERICAN STYLE Who Sprawls the Most? Jackie Cutsinger Research Assistant, Center for Urban Studies Wayne State University Measuring Sprawl in Major Metros Regionally stratified, nationally representative
Impact of Hurricane Irma on US Metropolitan Areas
 Impact of Hurricane Irma on US Metropolitan Areas Puerto Ricans in mainland Prepared for: Jorge Restrepo, CEO 2017 EurekaFacts LLC September 29, 2017 Climate refugees from Puerto Rico in US metropolitan
4/5/2016. P OLICOM Economic Analysis. Juab. Sanpete. Millard. Emery. Sevier. Piute. Wayne
 Where the Money Is Presented by In the Six County Region William H. Fruth POLICOM Corporation 274 SW Martin Downs Blvd. #279 Palm City, FL 34 772 781 5559 fruth@policom.com www.policom.com Primary or contributory
Oakland A s Gondola Economic Impact
 January 2019 Oakland A s Gondola Economic Impact KEY FINDING: The proposed gondola system, which will connect the A s planned stadium to downtown Oakland, will generate $685 million in total economic benefit
Access Across America: Transit 2014
 Access Across America: Transit 2014 Final Report CTS 14-11 Prepared by: Andrew Owen David Levinson Accessibility Observatory Department of Civil, Environmental, and Geo- Engineering University of Minnesota
District Match Data Availability
 District Match Data Availability National & State Data Location Available National Data Australia Parliament, Provincial and Territory Assemblies Canada Parliament, Provincial Legislative Assemblies New
The Economic Impact of Tourism in North Carolina. Tourism Satellite Account Calendar Year 2013
 The Economic Impact of Tourism in North Carolina Tourism Satellite Account Calendar Year 2013 Key results 2 Total tourism demand tallied $26 billion in 2013, expanding 3.9%. This marks another new high
8.7% 3.9% California. California MFG job growth continues to lag the country Percent change since Rest of United States. April Jan.
 MFG job growth continues to lag the country Percent change since Rest of United States 8.7% Jan 10: 10,211,600 Apr 17: 11,098,100 886,500 April 2017 3.9% Jan 10: 1,248,400 Apr 17: 1,297,900 49,500 Jan.
U.S. Regional Outlook
 U.S. Regional Outlook Presented by: Mark McMullen Director of Government Consulting FTA Revenue Estimating Conference September 18, 26 Widespread Pattern of Economic Expansion Based on employment and industrial
The FMR history file contains the following fields, all for 2-bedroom FMRs. It is in EXCEL format for easy use with database or spreadsheet programs.
 The FMR history file contains the following fields, all for 2-bedroom FMRs. It is in EXCEL format for easy use with database or spreadsheet programs. GENERAL NOTES 1. There are no Fiscal Year 1984 FMRs
The Economic Impact of Tourism in Jacksonville, FL. June 2016
 The Economic Impact of Tourism in Jacksonville, FL June 2016 Highlights Visitor spending surpassed $2.0 billion in 2015, growing 4.4%. As this money flowed through Duval County, the $2.0 billion in visitor
SUNPORT SOUTH BUSINESS PARK
 SUNPORT SOUTH BUSINESS PARK IS A NEW 330 ACRE DEVELOPMENT WITH RAIL, INTERSTATE AND AIRPORT ACCESS IN ALBUQUERQUE, NEW MEXICO. WHATEVER YOUR INDUSTRIAL NEED IS, SUNPORT SOUTH DELIVERS. COLLIERS INTERNATIONAL
High-Speed Rail: Realizing the Potential of Megaregion Economies
 High-Speed Rail: Realizing the Potential of Megaregion Economies Petra Todorovich Director, America 2050 Regional Plan Association May 4, 2010 Rayburn House Office Building 1 2 1 Where High-Speed Rail
Tri-Valley Residential Real Estate Market Update
 Tri-Valley Residential Real Estate Market Update Real Estate Market Drivers Unemployment US vs CA Jan. 2018: US 4.1% & Dec. 2017: CA 4.3% 14% CA US 12% 10% 8% 6% 4% 2% 0% SERIES: Unemployment Source: California
Nevada s Tourism, Gaming, and Entertainment Sector
 Nevada s Tourism, Gaming, and Entertainment Sector Emsi Q4 2018 Data Set www.economicmodeling.com 1 Industry Summary for Tourism, Gaming, and Entertainment 428,652 12.5% $38,553 Jobs (2018) % Change (2010-2018)
University of Denver
 Glenn R. Mueller, Ph.D. Professor University of Denver Franklin L. Burns School of Real Estate & Construction Management & Real Estate Investment Strategist glenn.mueller@du.edu Supply The new supply of
SERVING CALIFORNIA S COMMERCIAL AIRPORTS
 SERVING CALIFORNIA S COMMERCIAL AIRPORTS Annual Report 2011 Top Left: Santa Barbara Municipal Airport Top Right: Sacramento International Airport Right: John Wayne Airport, Orange County Introduction The
THE 2006 ECONOMIC IMPACT OF TRAVEL & TOURISM IN INDIANA
 THE 2006 ECONOMIC IMPACT OF TRAVEL & TOURISM IN INDIANA A Comprehensive Analysis Prepared by: In Partnership with: PREPARED FOR: Carrie Lambert Marketing Director Indiana Office of Tourism Development
Moderator: Greg Guatto, President & CEO, Aspen Properties
 Session C2 2:10pm ONE SIZE DOES NOT FIT ALL: UNDERSTANDING THE FACTS & FALLACIES BETWEEN EDMONTON & CALGARY AND HOW THEY ARE PERFORMING IN TODAY S ECONOMY Moderator: Greg Guatto, President & CEO, Aspen
California Travel Impacts p
 California Travel Impacts 1992-2014p April 2015 A Joint Marketing Venture of Visit California and the Governor s Office of Business Development (GO-Biz) PREPARED BY Dean Runyan Associates, Inc. 833 SW
The Recruiting Landscape of Fabulous Las Vegas. The most dynamic city in the World >> 0 >> 1 >> 2 >> 3 >> 4 >> QUICK FACT:
 The Recruiting Landscape of Fabulous Las Vegas The most dynamic city in the World QUICK FACT: Only 3.6% of residents are true Native Nevadans 1 The DNA of Las Vegas Las Vegas People Population Ethnicity
2nd Quarter. AEDC is pleased to present the Anchorage Quarterly Economic Indicators Report for the second quarter of 2010.
 2010 AEDC is pleased to present the Anchorage Quarterly Economic Indicators Report for the second quarter of 2010. This report summarizes recently updated data from the Anchorage Economic Indicators Database,
The Economic Impact of Travel in Kansas. Tourism Satellite Account Calendar Year 2013
 The Economic Impact of Travel in Kansas Tourism Satellite Account Calendar Year 2013 Who we are Tourism Economics Union of industry expertise and economic disciplines Real world insights based on quantitative
PREMIER PLAZA PHASE 1
 LEASING INFORMATION JEFFREY E. SMITH 956 221 0461 PREMIER PLAZA PHASE 1 LUXURY SHOPPING CENTER 25,000 SQ FT MCALLEN, TEXAS INTERSTATE HIGHWAY MCALLEN 69 MCALLEN INTERNATIONAL AIRPORT INTERSTATE HIGHWAY
Emerging Trends in Real Estate Sustaining Momentum but Taking Nothing for Granted
 Emerging Trends in Real Estate 2015 Sustaining Momentum but Taking Nothing for Granted PwC-ULI Outlook on trends 36th edition 368 interviews 1,055 survey responses 1,400+ participants, a record Who? District
Wyoming Travel Impacts
 Wyoming Travel Impacts 2000-2013 Wyoming Office of Tourism April 2014 Prepared for the Wyoming Office of Tourism Cheyenne, Wyoming The Economic Impact of Travel on Wyoming 2000-2013 Detailed State and
Paso Robles Parking Action Plan 1
 Paso Robles Parking Action Plan 1 Dixon Resources Unlimited Extensive parking and traffic management experience On and off-street programs: Technology/Operations Customer Service Collections/Maintenance
Peak to Trough Price Decline of less that 10% Peak to Trough Price Decline between 10% and 20%
 Peak to Trough Price Decline of less that 10% Minimal Price Decline Pop. Rank Market Peak to Trough % Decline Current Rebound% 4 Dallas-Fort Worth-Arlington, TX -4.68% 115.17% 35 Austin-Round Rock, TX
Zero Waste Strategies and Programs in the U.S. Ruth Abbe, President Zero Waste USA
 Zero Waste Strategies and Programs in the U.S. Ruth Abbe, President Zero Waste USA Formed in 1996 Campaign for Zero Waste Promote Jobs from Discards End Corporate Welfare for Wasting grrn.org 1996 2002
SLOW GROWTH OF SOUTHERN NEVADA ECONOMY
 NEVADA S ECONOMY A monthly report produced for Commerce Real Estate Solutions by Stephen P. A. Brown, PhD, Center for Business & Economic Research, University of Nevada, Las Vegas To receive an electronic
Overview of the Southern Nevada Convention and Meeting Segment
 Executive Summary Applied Analysis was retained by the Las Vegas Convention and Visitors Authority (the LVCVA ) to review and analyze the economic impacts associated with its various operations and southern
STUDY PROCESS. Study. PHASE I Research. PHASE II Develop & Analyze Options. PHASE III Recommendations. Regional Transit
 STUDY PROCESS PHASE I Research PHASE II Develop & Analyze Options PHASE III Recommendations February 2008 - July 2008 July 2008 - September 2008 September 2008 - December 2008 Analyze transit and projected
State of the Shared Vacation Ownership Industry. ARDA International Foundation (AIF)
") State of the Shared Vacation Ownership Industry ARDA International Foundation (AIF) This paper includes a high-level overview of the timeshare industry with a core focus on financial growth, owner demographics
State of the Shared Vacation Ownership Industry ARDA International Foundation (AIF) This paper includes a high-level overview of the timeshare industry with a core focus on financial growth, owner demographics
Higher Education in America s Metropolitan Areas A Statistical Profile
 Higher Education in America s Metropolitan Areas A Statistical Profile MSA Study No.2 Higher Education in America s Metropolitan Areas A Statistical Profile CONTENTS Why Metro Areas? 1 Executive Summary
The Economic Impact of Tourism in The Appalachian Region of Ohio. June 2016
 The Economic Impact of Tourism in The Appalachian Region of Ohio June 2016 Appalachian Region tourism summary Total Tourism Impact Appalachian Region, Ohio Sales Wages Taxes Employment $5.3 billion $1.3
Wyoming Travel Impacts
 Wyoming Travel Impacts 2000-2014 Wyoming Office of Tourism April 2015 Prepared for the Wyoming Office of Tourism Cheyenne, Wyoming The Economic Impact of Travel on Wyoming 2000-2014 Detailed State and
Population Estimates for U.S. Cities Report 1: Fastest Growing Cities Based on Numeric Increase,
 ulation s for U.S. Cities Report 1: Fastest Growing Cities Based on Numeric Increase, 2015-2015 1 Phoenix AZ 32,113 2.0 1,582,904 1,615,017 167,393 11.6 2 Los Angeles CA 27,173 0.7 3,949,149 3,976,322
The Role of U.S. Airports in the National Economy
 The Role of U.S. Airports in the National Economy Presented to TRB Session #506 Financing Airports January 9, 2018 By Steven Landau Economic Development Research Group ACRP 03-28, Report 132 Key Collaborators
ustravel.org/travelpromotion
 Agenda 1. Power of Travel Promotion Resources 2. New Tool: Travel Economic Impact Calculator 3. Accessing data through Interactive Travel Analytics 4. Unused Vacation Time Opportunity 5. Highlights from
ECONOMIC PROFILE. Tourism
 ECONOMIC PROFILE Tourism Park City & Summit County Utah Prepared by Park City Chamber of Commerce Convention & Visitors Bureau P.O. Box 1630 ~ Park City, UT 84060-1630 800.453.1360 ~ 435.649.6100 ~ fax
BLACK KNIGHT HPI REPORT
 CONTENTS 1 OVERVIEW 2 NATIONAL OVERVIEW 3 LARGEST STATES AND METROS 4 FEBRUARY S BIGGEST MOVERS 5 20 LARGEST STATES 6 40 LARGEST METROS 7 ADDITIONAL INFORMATION OVERVIEW Each month, the Data & Analytics
UNIVERSITY AVE SAN DIEGO, CA 92104
 3487-95 UNIVERSITY AVE SAN DIEGO, CA 92104 LISTED BY: Patsy Ma, MBA, CCIM, CRX, CLS President DRE# 00980137 patsyma@bpinternational.net Francisco Williams, CCIM Vice President Investment Sales DRE #01979442
The Economic Impact of Tourism in Hillsborough County. July 2017
 The Economic Impact of Tourism in Hillsborough County July 2017 Table of contents 1) Key Findings for 2016 3 2) Local Tourism Trends 7 3) Trends in Visits and Spending 12 4) The Domestic Market 19 5) The
Contents Manningham at a Glance... 6 Location and Area... 6 Manningham Activity Centres... 6 Manningham Suburbs... 6 Population... 8 Forecast... 9 For
 Contents Manningham at a Glance... 6 Location and Area... 6 Manningham Activity Centres... 6 Manningham Suburbs... 6 Population... 8 Forecast... 9 Forecast 2011 2036... 9 Population Forecast... 9 Gross
Dufferin County Housing Market Update Orangeville November 24, 2015
 Dufferin County Housing Market Update Orangeville November 24, 2015 Housing market intelligence you can count on Dufferin County Core Housing Need 25% 2006 2011 20% 19.8% 20.1% 18.1% 15% 15.2% 10% 10.5%
The Quality of Life Report
 The Quality of Life Report A Foundation for Policy Development Tulsa City Council / 2014-16 Term Tulsa Skyline - view from ONEOK field by Vladxp, Creative Commons (NC-ND 2011) I know not anything more
2016 Cruise Ship Passenger Survey & Economic Impact Study. Final Report of Findings. December 2016
 VISIT SANTA BARBARA 2016 Cruise Ship Passenger Survey & Economic Impact Study Final Report of Findings December 2016 Research prepared for Visit Santa Barbara by Destination Analysts, Inc. Research Overview
The Economic Impact of Tourism in The Appalachian Region of Ohio. June 2014
 The Economic Impact of Tourism in The Appalachian Region of Ohio June 2014 Appalachia Region Tourism Summary Total Tourism Impact Appalachian Region Sales Wages Taxes Employment $4.9 billion $1.2 billion
N Prime Retail Pads w/ Direct CA-99 & Betty Dr Access. Direct Access to Upgraded HWY 99 Off/On Ramps
 Prime Retail Pads w/ Direct CA-99 & Betty Dr Access Direct Access to Upgraded HWY 99 Off/On Ramps Optimal Visibility w/ Easy to - Over 70,000 Cars Per Day Unmatched Level of Consumer Traffic & High Volume
OB-GYN Workload & Potential Shortages: The Coming U.S. Women s Health Crisis
 OB-GYN Workload & Potential Shortages: The Coming U.S. Women s Health Crisis JULY 2017 Introduction Obstetricians and Gynecologists (OB-GYNs) are a critical part of the health care provider community.
San Francisco Travel Association Selling in a Seller s Market DMO Perspective. May 21, 2014
 San Francisco Travel Association Selling in a Seller s Market DMO Perspective May 21, 2014 Agenda Discussion Themes 1. Meetings Are Important 2. Market Meetings Pace 3. Occupancy & Rate 4. Booking Windows
Manawatu District Economic Profile
 Manawatu District Economic Profile Our community Population has grown by 1,000 residents since 2014 to reach 29,800. Population is 86.4% European, with Maori 14.3% of the population. This compares with
ISRAEL- COUNTRY FACTS
 ISRAEL- COUNTRY FACTS ISRAEL-NEIGHBOURING COUNTRIES AND POLITICAL MAP Area: 22,072 sq. km Land area: 21,643 sq. km. Fast Facts Area of lakes: 429 sq. km. (Sea of Galilee 164 sq. km., the Dead Sea - 265